Operator
Good day, and thank you for standing by. Welcome to Q2 2026 Valley National Bank Corp Earnings Conference Call. At this time, all participants are in a listen-only mode. After the speaker's presentation, there will be a question and answer session. To ask a question during the session, you'll need to press star 11 on your telephone. You will then hear an automated message advising your hand is raised. To withdraw your question, please press star 11 again. Please be advised that today's conference is being recorded. I would now like to turn the call over to Andrew Giannetti. Please go ahead.
Good morning, and welcome to Valley's second quarter 2026 earnings conference call. I am joined today by CEO Ira Robbins and CFO Travis Land. Our quarterly earnings release and supporting documents are available at valley.com. Reconciliations of any non-GAAP measures mentioned on the call can be found in today's earnings release and presentation. Please also note slide 2 of our earnings presentation, and remember that comments made today may include forward-looking statements about Valley National Bank Corp. and the banking industry, and actual results may differ from those statements. For more information on these forward-looking statements and associated risk factors, please refer to our SEC filings, including Forms 8K, 10Q, and 10K. With that, I'll turn the call over to Ira Robbins.
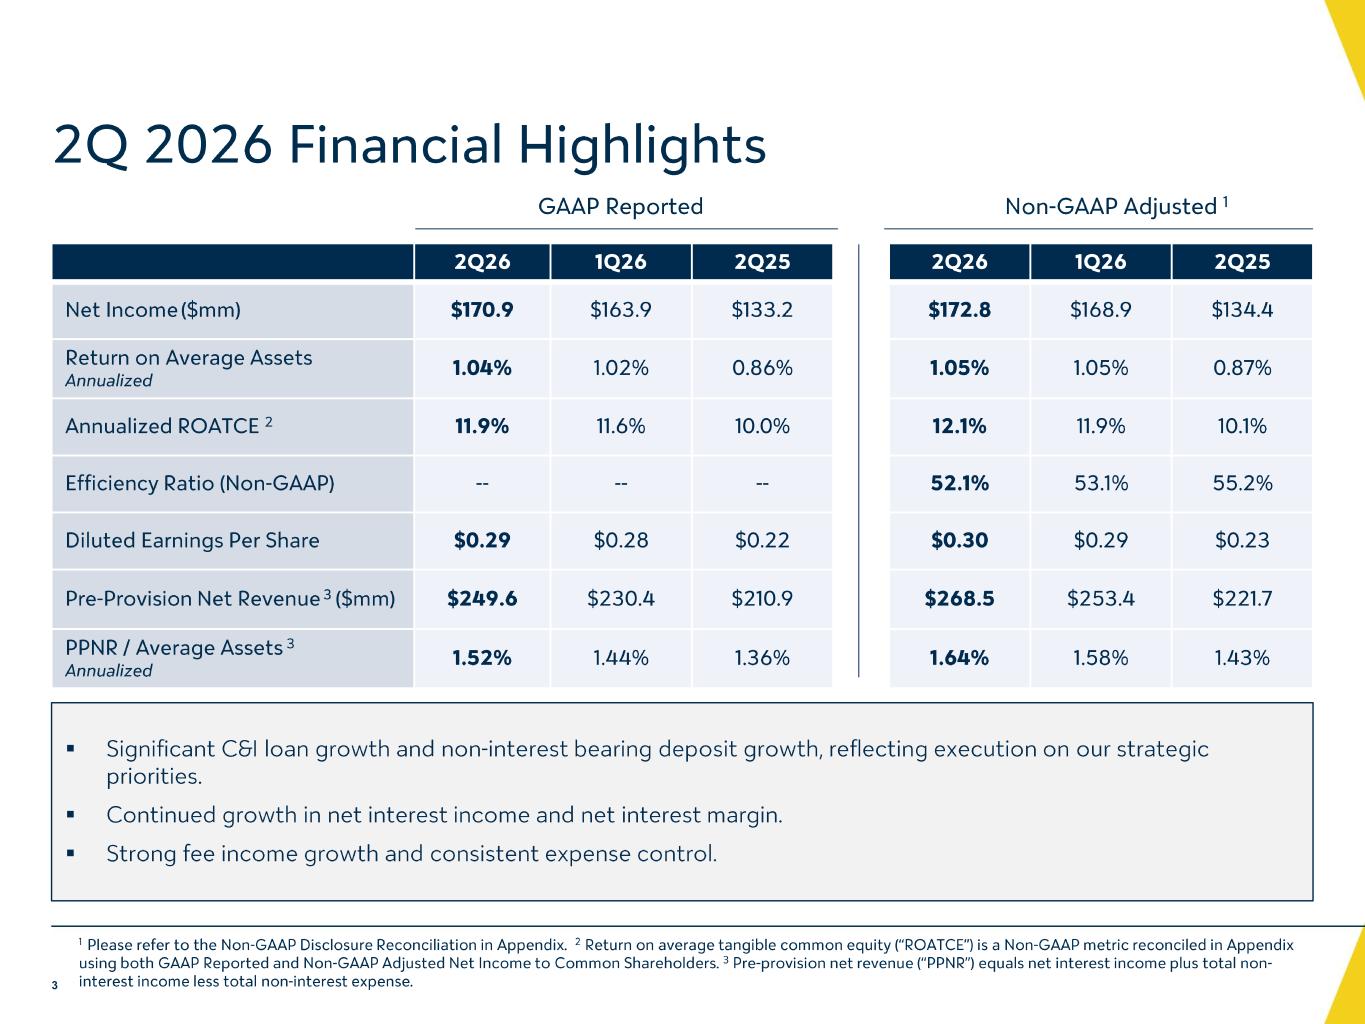
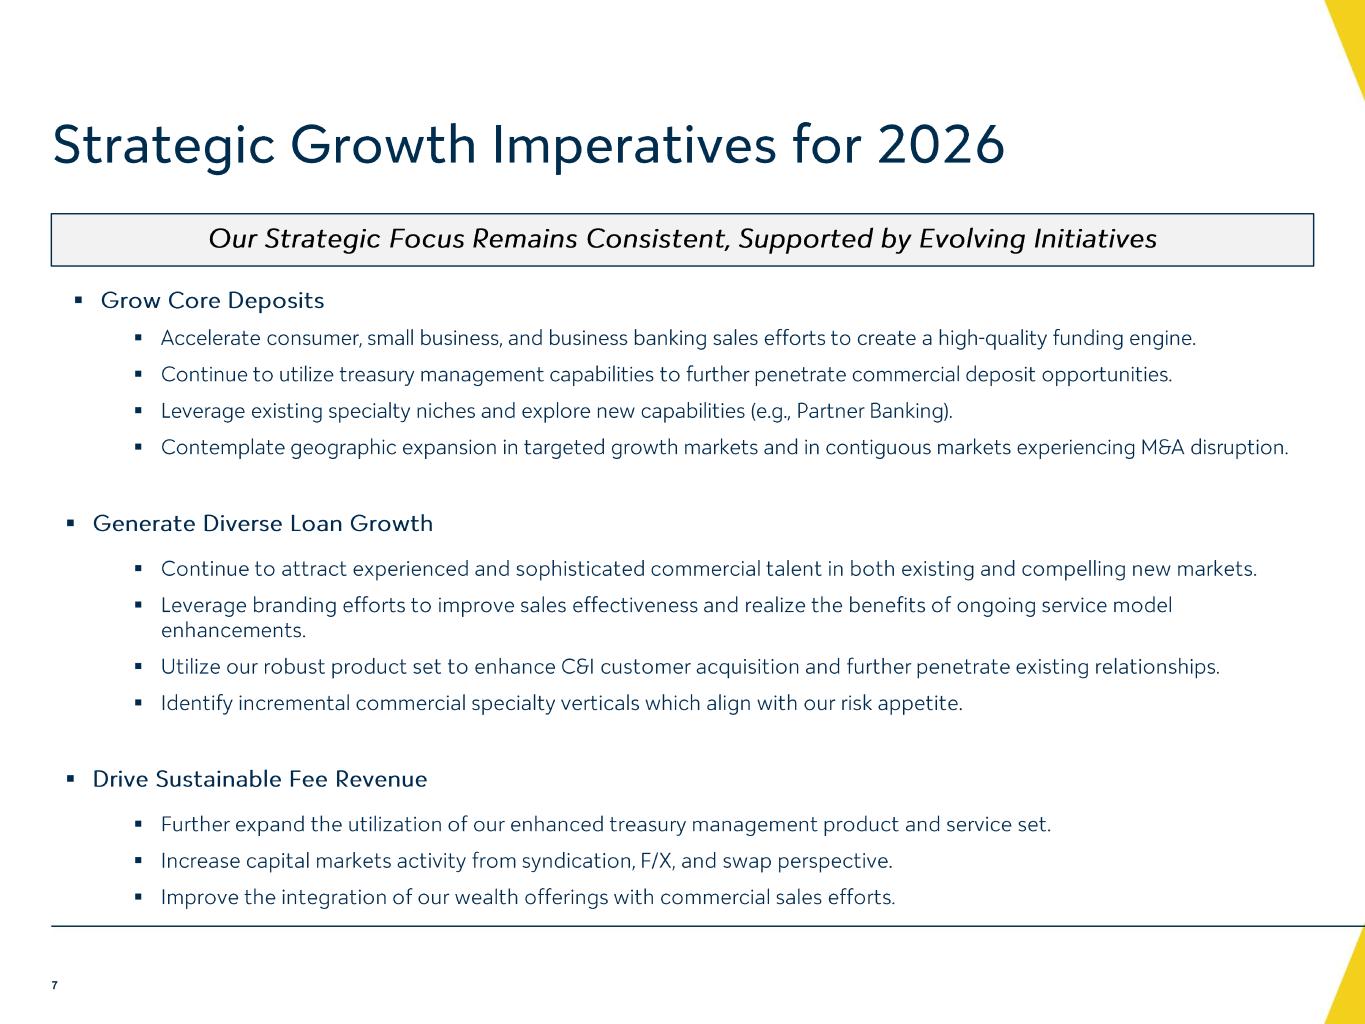
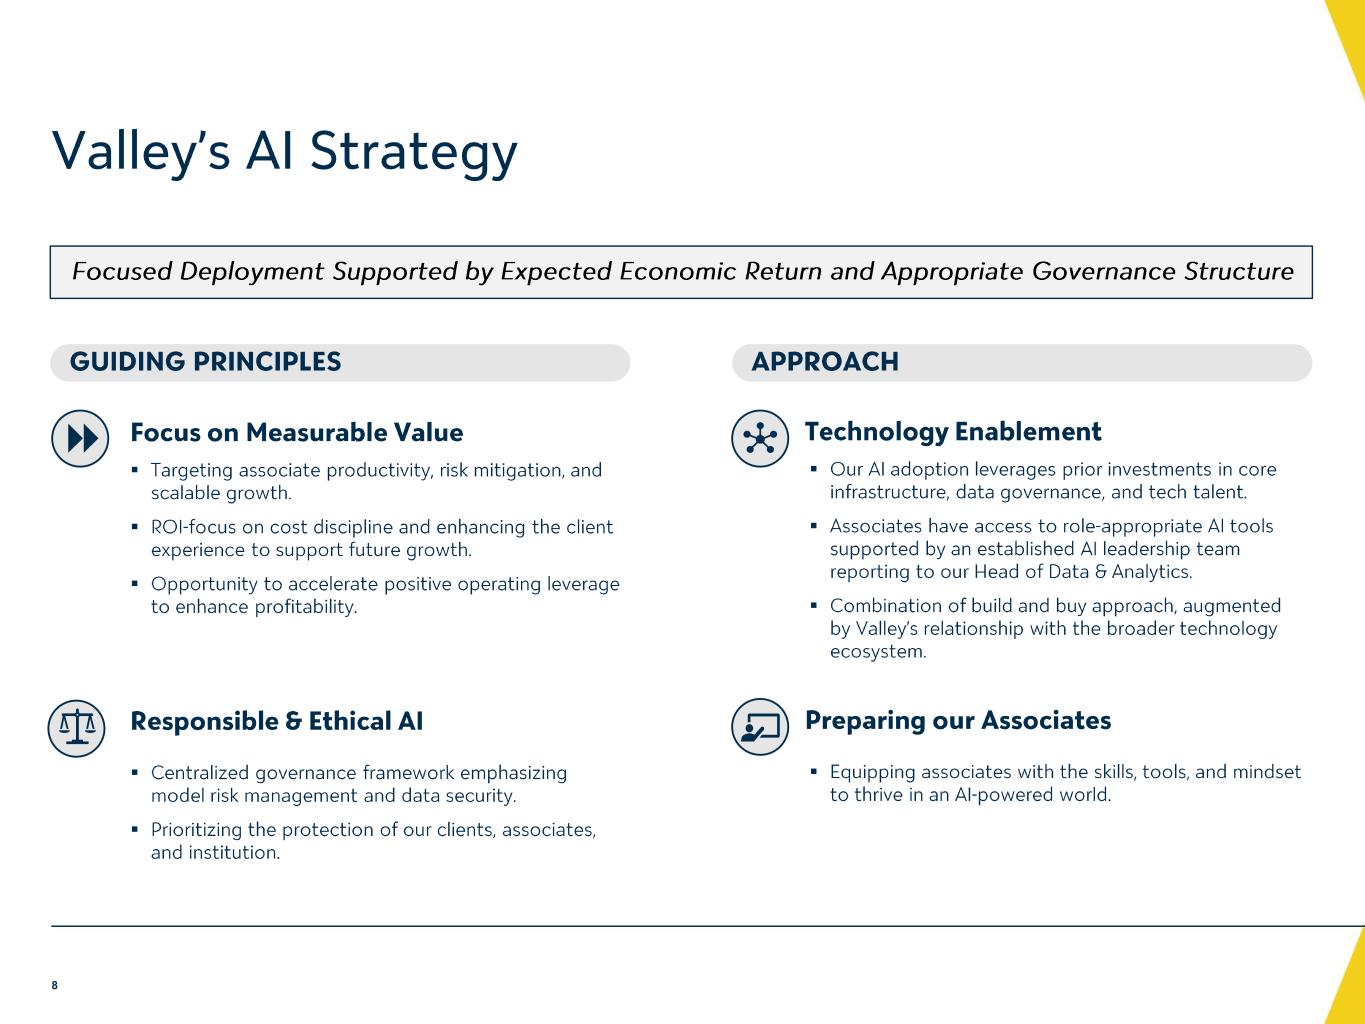
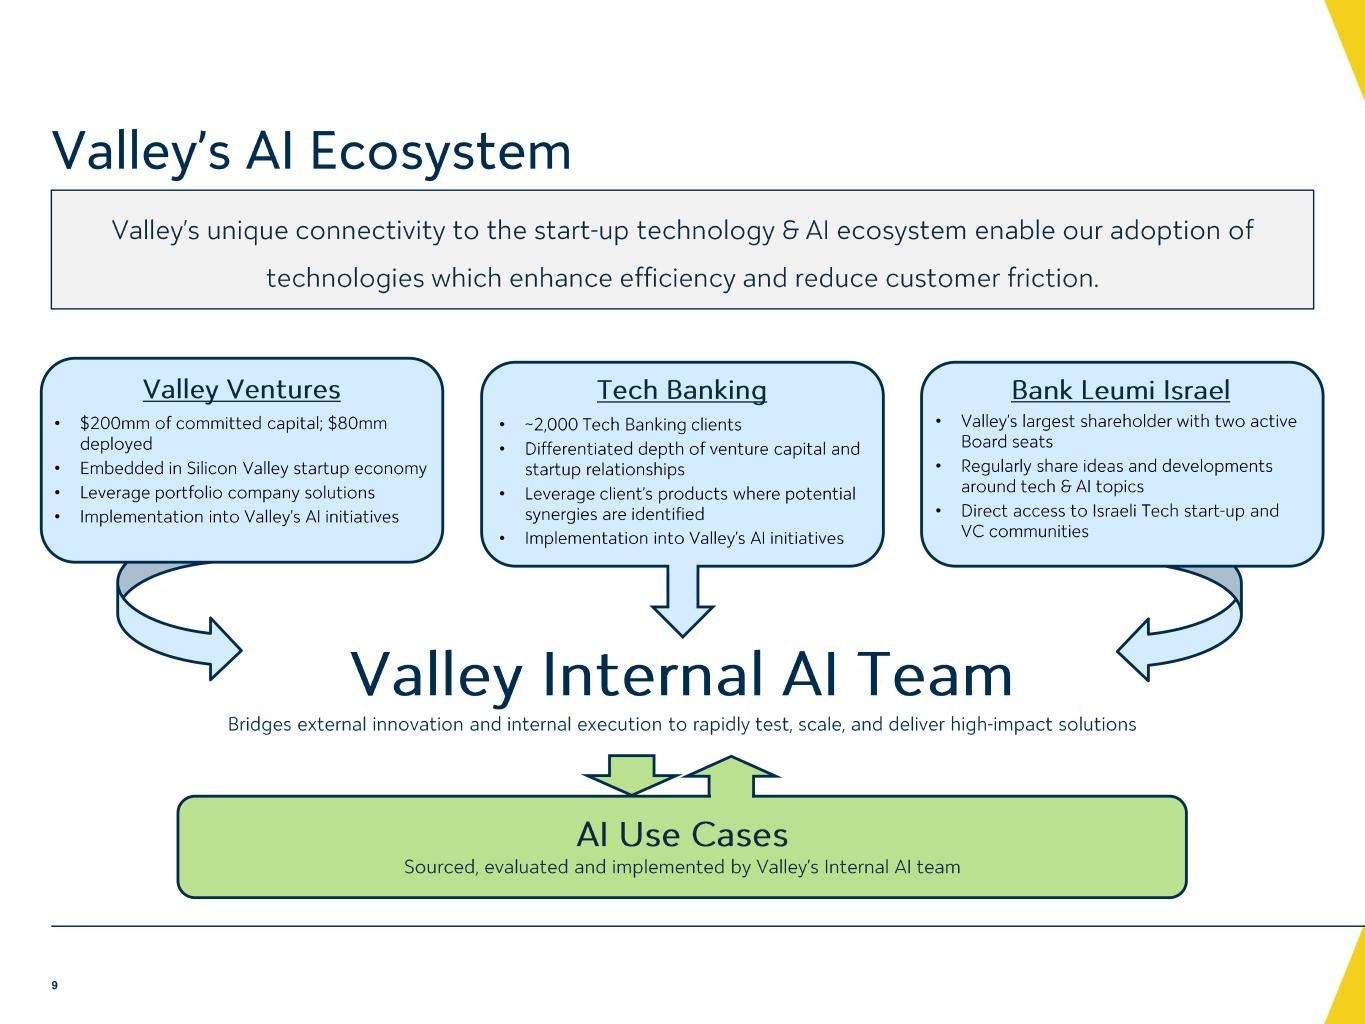
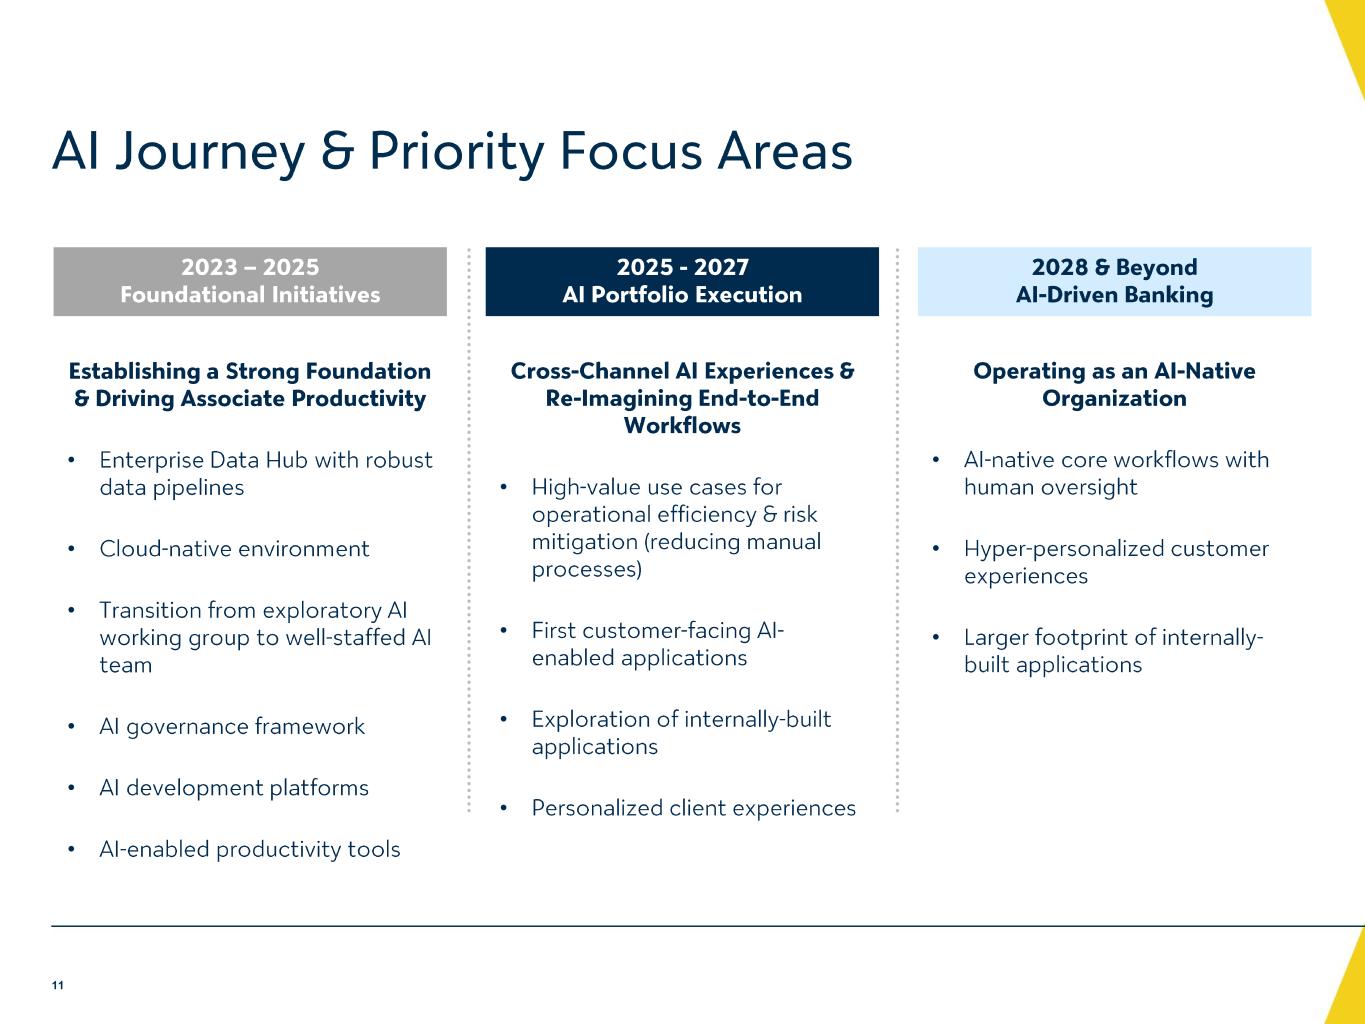
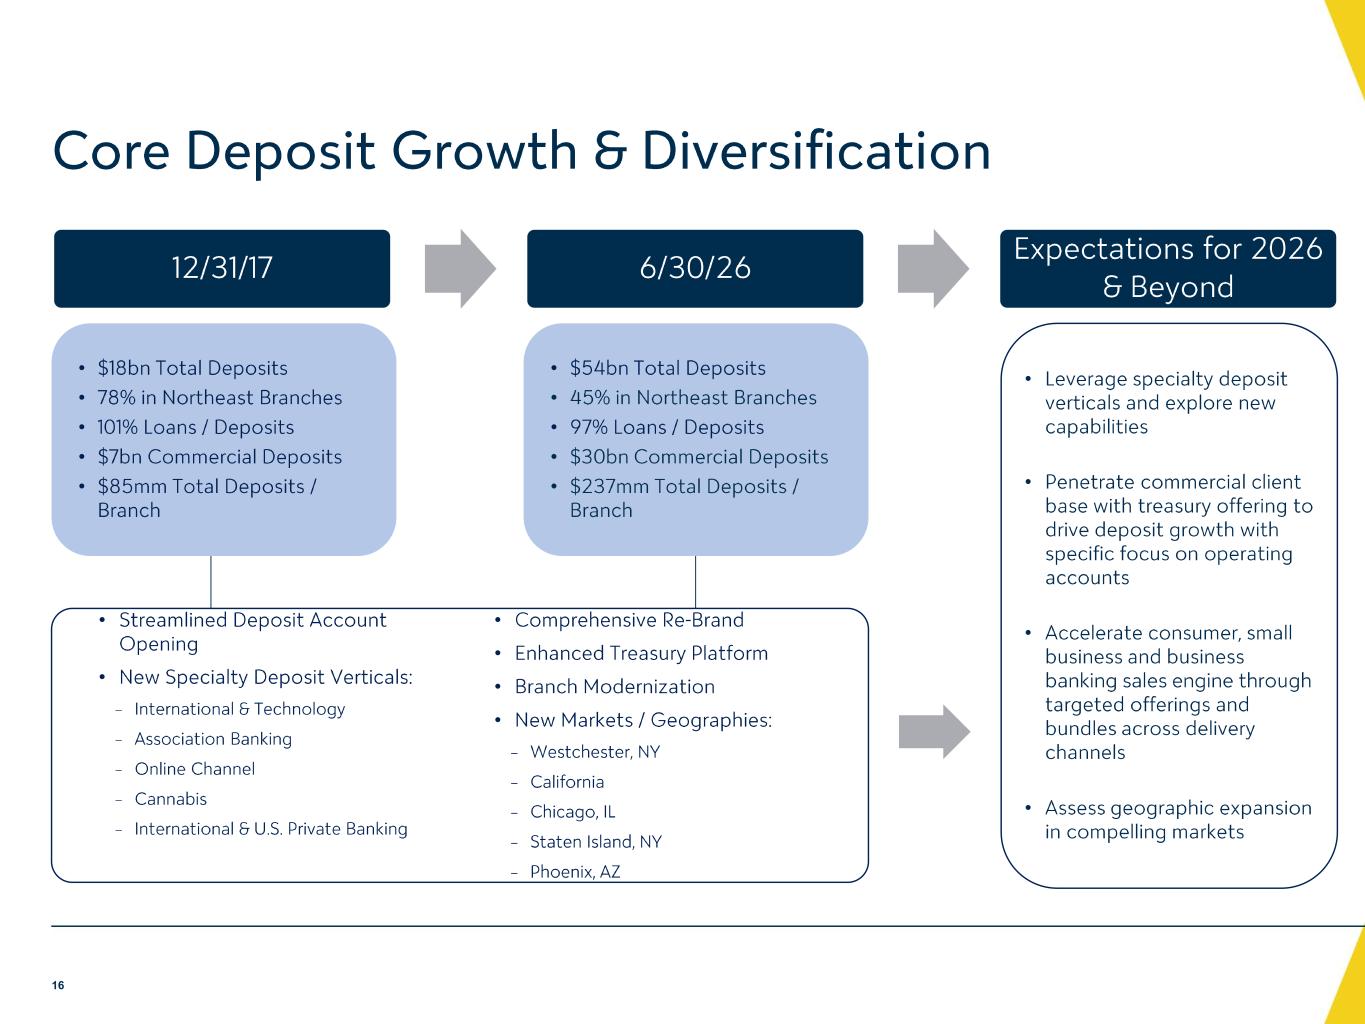
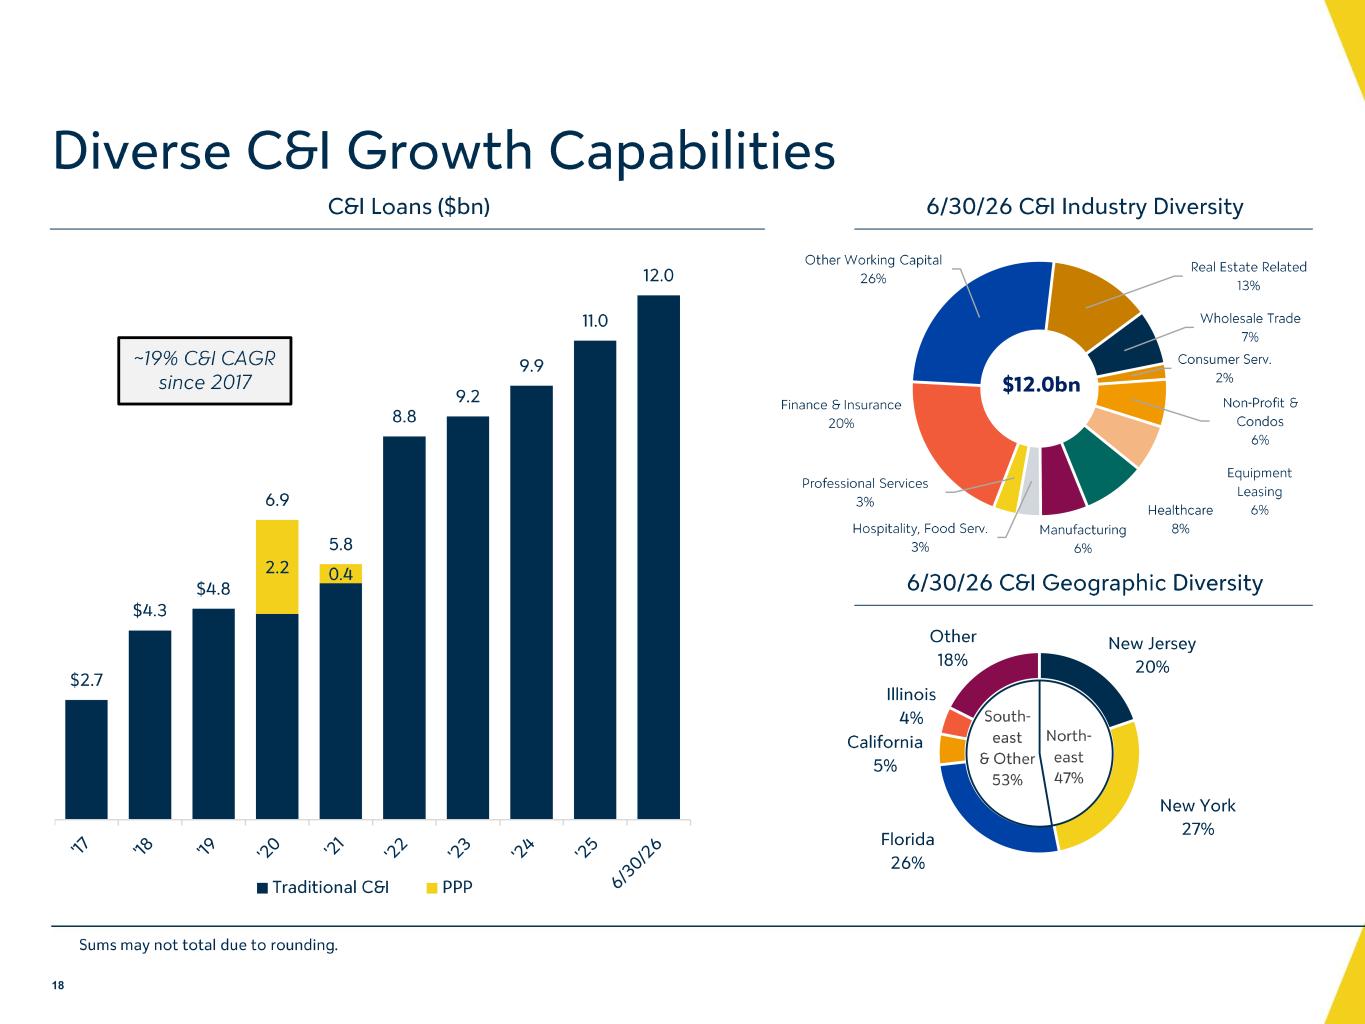
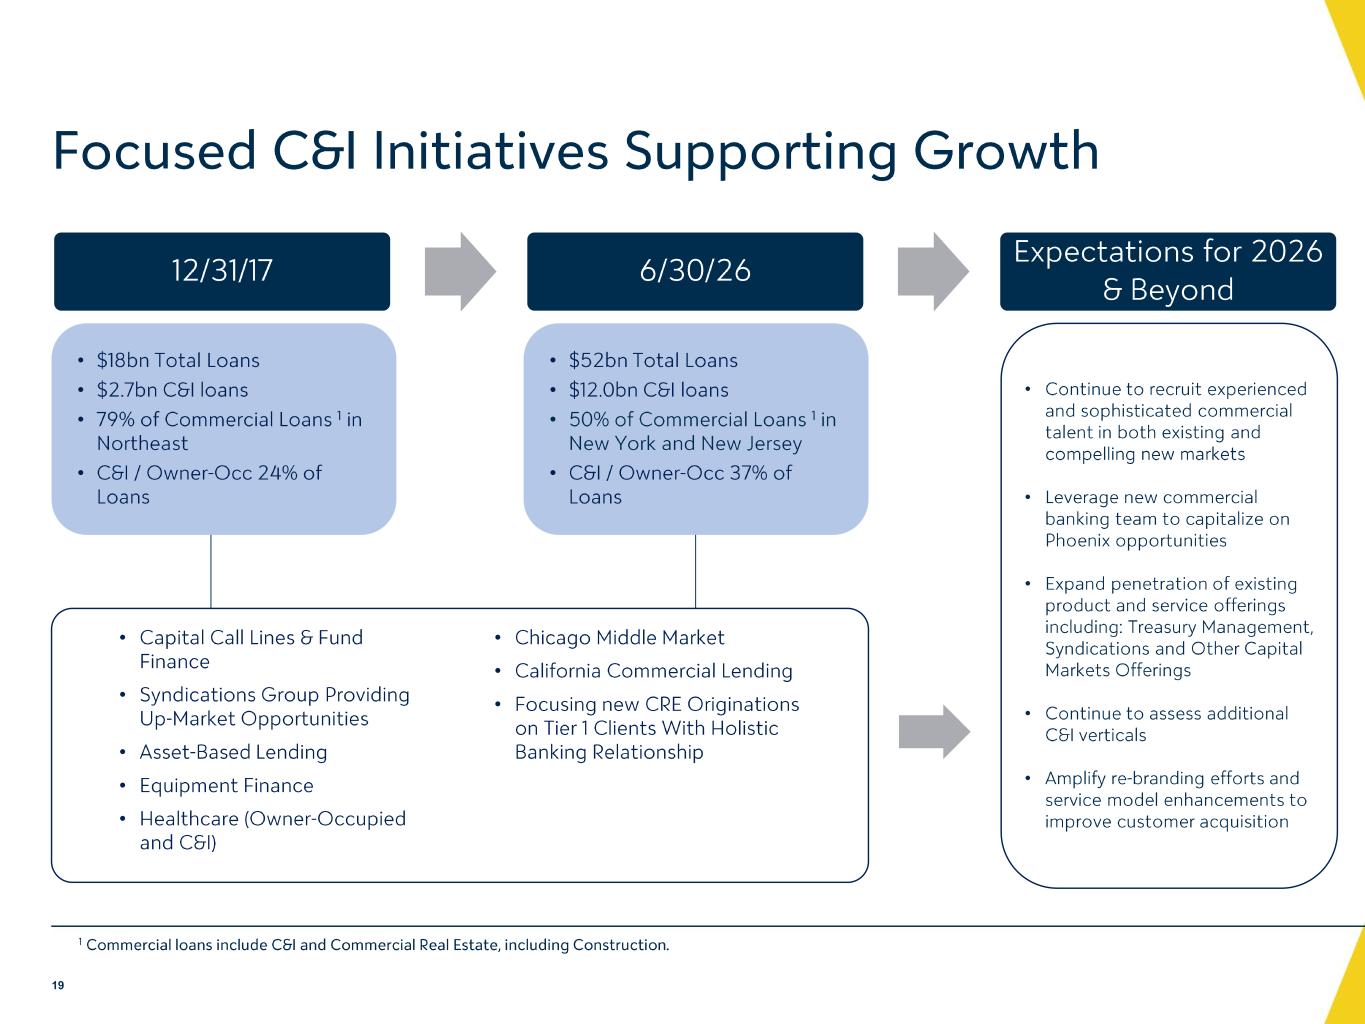
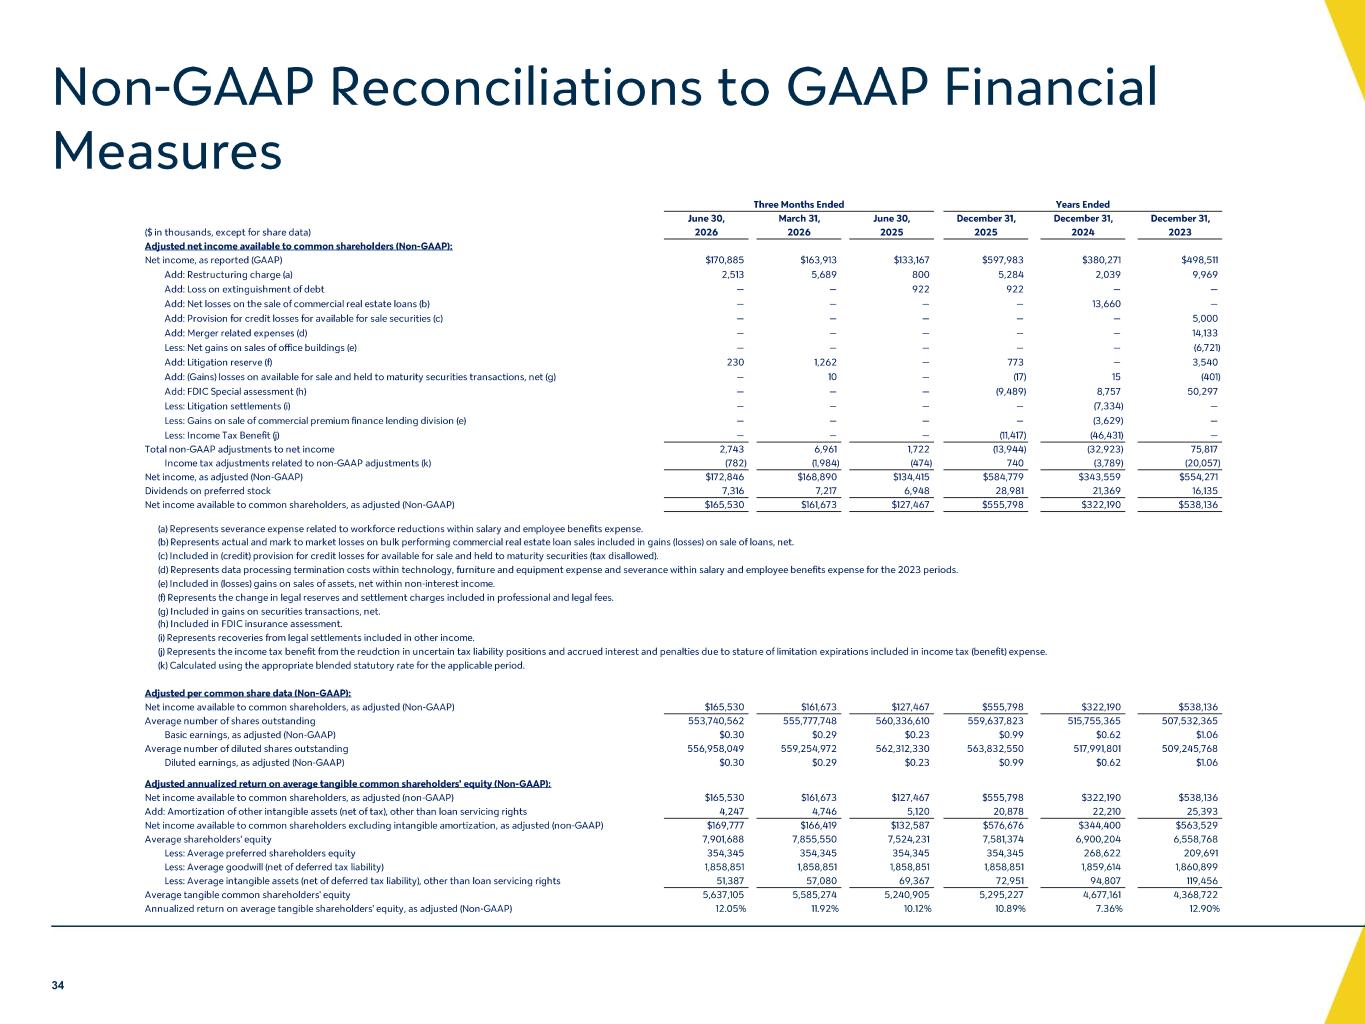
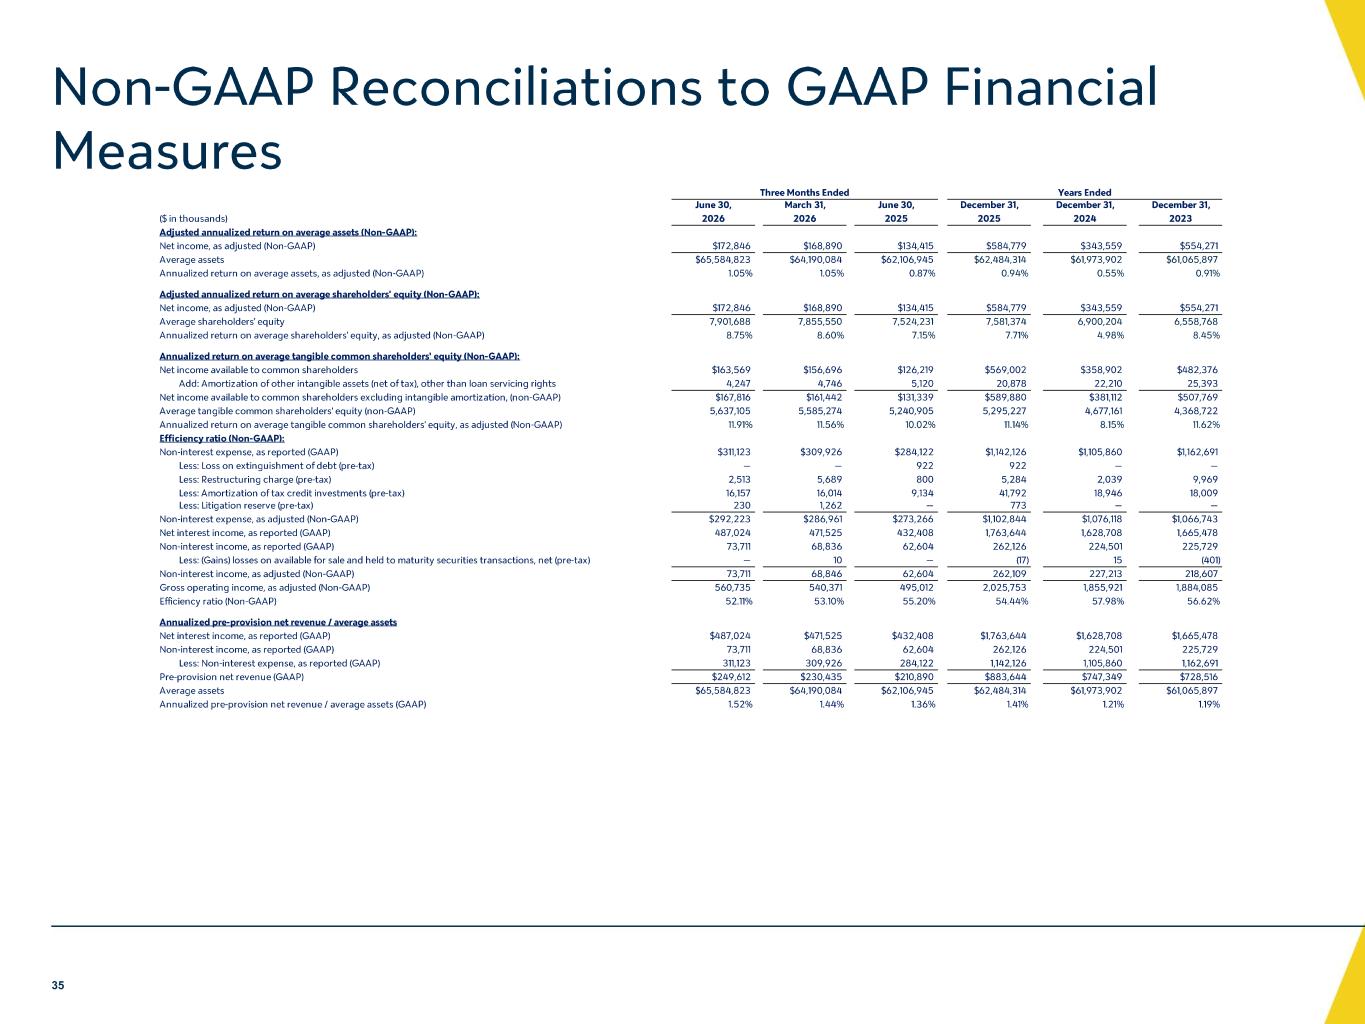
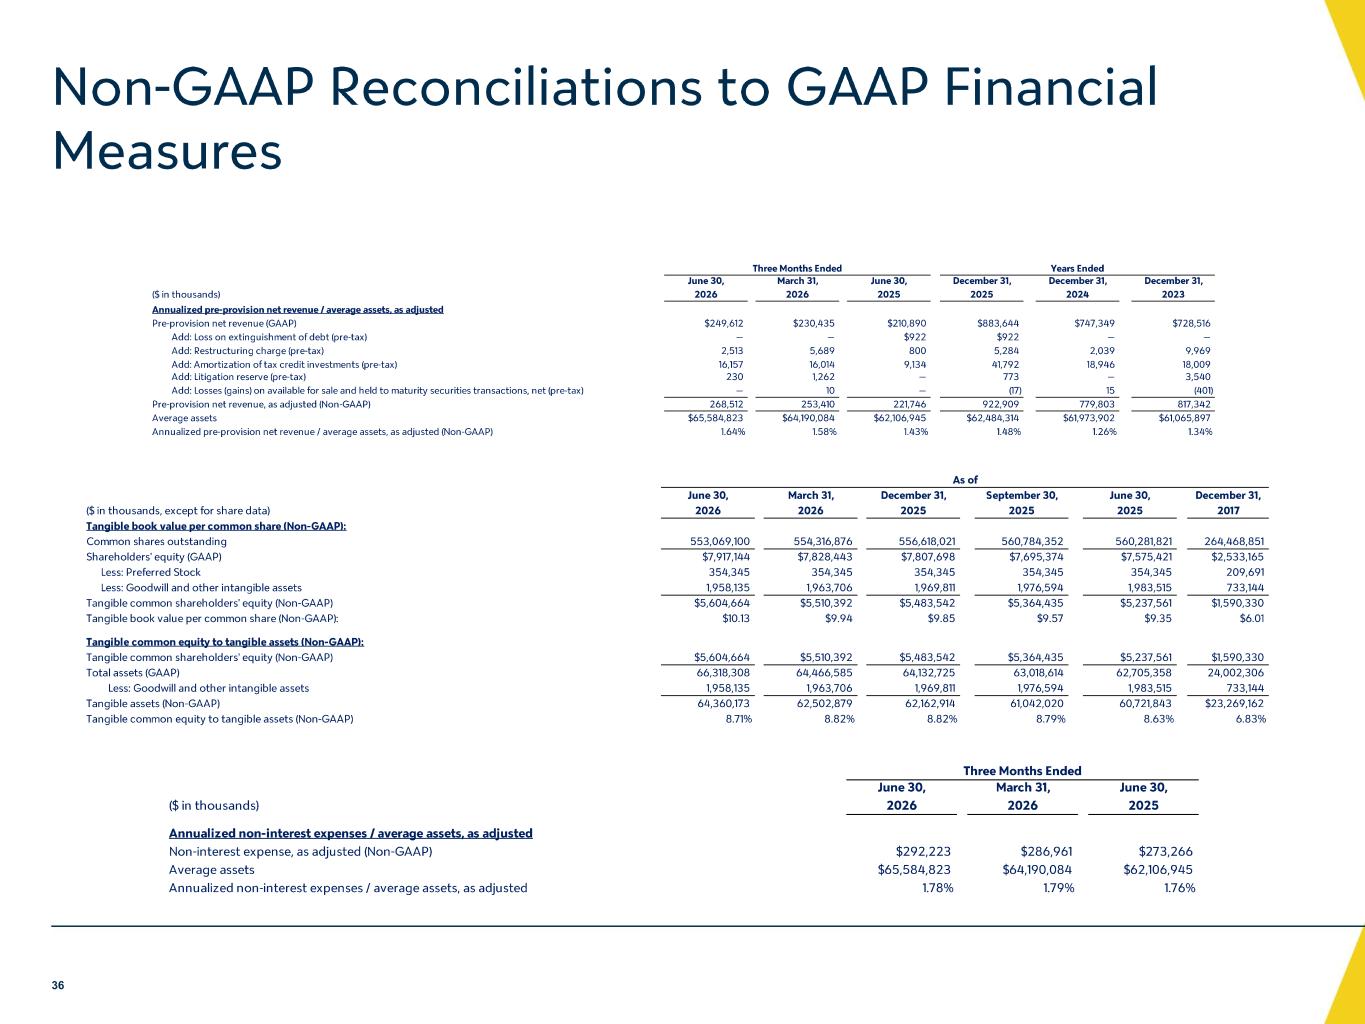
Thank you, Andrew. Our second quarter results illustrate continued progress against our strategic growth priorities. We delivered strong customer deposit growth, including meaningful growth and non-interest-sparing balances. We generated diverse loan growth concentrated in C&I and owner-occupied commercial real estate. And we continued to expand fee income in both absolute dollars and as a percentage of revenue. We remained focused on strengthening our value proposition by scaling our relationship-oriented, commercially-focused model across our markets and business lines. While the quarter's growth was encouraging, our focus remains on the quality, durability, and strategic value of the relationships that we attract. We believe continued execution against these priorities will support stronger returns over time. This execution translated into strong financial performance for the quarter. Net income was approximately $171 million, or 29 cents per diluted share. Excluding certain non-core items, adjusted net income was approximately $173 million, or $0.30 per diluted share. Adjusted pre-provision net revenue increased 6% from the prior quarter, and at 1.64% of average assets, reached its highest level since the fourth quarter of 2022. Deposit growth remains central to our strategy. We believe that our diversified commercial and consumer funding channels are increasingly critical as deposit competition intensifies across the industry. By expanding our commercial banking talent and driving greater adoption of our treasury platform, we expect to continue to win relationships based on service, capability, and value, not simply based on rates. These efforts directly contributed to nearly $300 million of non-interest-bearing deposit growth during the quarter. On the asset side, our focus in C&I and owner-occupied commercial real estate continues to drive strong loan growth and greater portfolio diversification. C&I growth was broad-based during the quarter, with contributions from New York, Florida, Chicago, and our specialty health care and fund finance verticals. These efforts also support our non-interest-bearing deposit growth as we continue to target disciplined, well-funded commercial relationships that can contribute to our sustained profitability improvement. Fee income was another area of strength. Sequential growth was driven by high-quality, sustainable businesses, including capital markets and tax credit advisory. Within capital markets, we continue to see a strong pipeline of value-led syndication opportunities, while swap activity has benefited from higher commercial real estate origination volumes. These fee-based capabilities are an important part of our commercial value proposition, and based on performance to date, we remain on track to achieve our 2026 growth objectives. As we discussed a bit last quarter, technology and artificial intelligence are becoming increasingly important to our ability to further scale our franchise. From a macro perspective, we believe that banks can effectively adopt AI, have the potential to structurally shift their efficiency ratios lower by around 500 basis points. At Valley, we intend to be an industry leader, and we are excited about the progress that we have made to date. As shown on Flight 9 of ADECT, we believe that Valley has several structural advantages that support our AI strategy, including Valley Ventures, our international and technology banking business, and our relationship with Bank Leumi in Israel. Valley Ventures give us direct exposure to the startup ecosystem and access to emerging talent and technologies Our international and technology banking team provides deep relationships with venture capital funds and early-stage technology companies including businesses expanding from Israel into the United States Additionally, our relationship with Bank Liumi gives us additional visibility into leading practices in cyber, fraud, and risk management We have a robust team of AI practitioners focused on sourcing use cases and aligning solutions from these relationships that I just mentioned. Importantly, our AI strategy is embedded in our broader operating model and is intended to support productivity, risk management, client experience, and scalable growth. As we look ahead, our priorities remain consistent and clear, continue to grow core deposits, deepen commercial relationships, generate more diversified loan and fee income growth, and improve operating efficiency to translate our progress into stronger returns. We expect our continued commitment to these areas to drive further shareholder value over time. With that overview, I will now turn the call over to Travis to walk through the financial results and our outlook in more detail. Thank you, Ira.
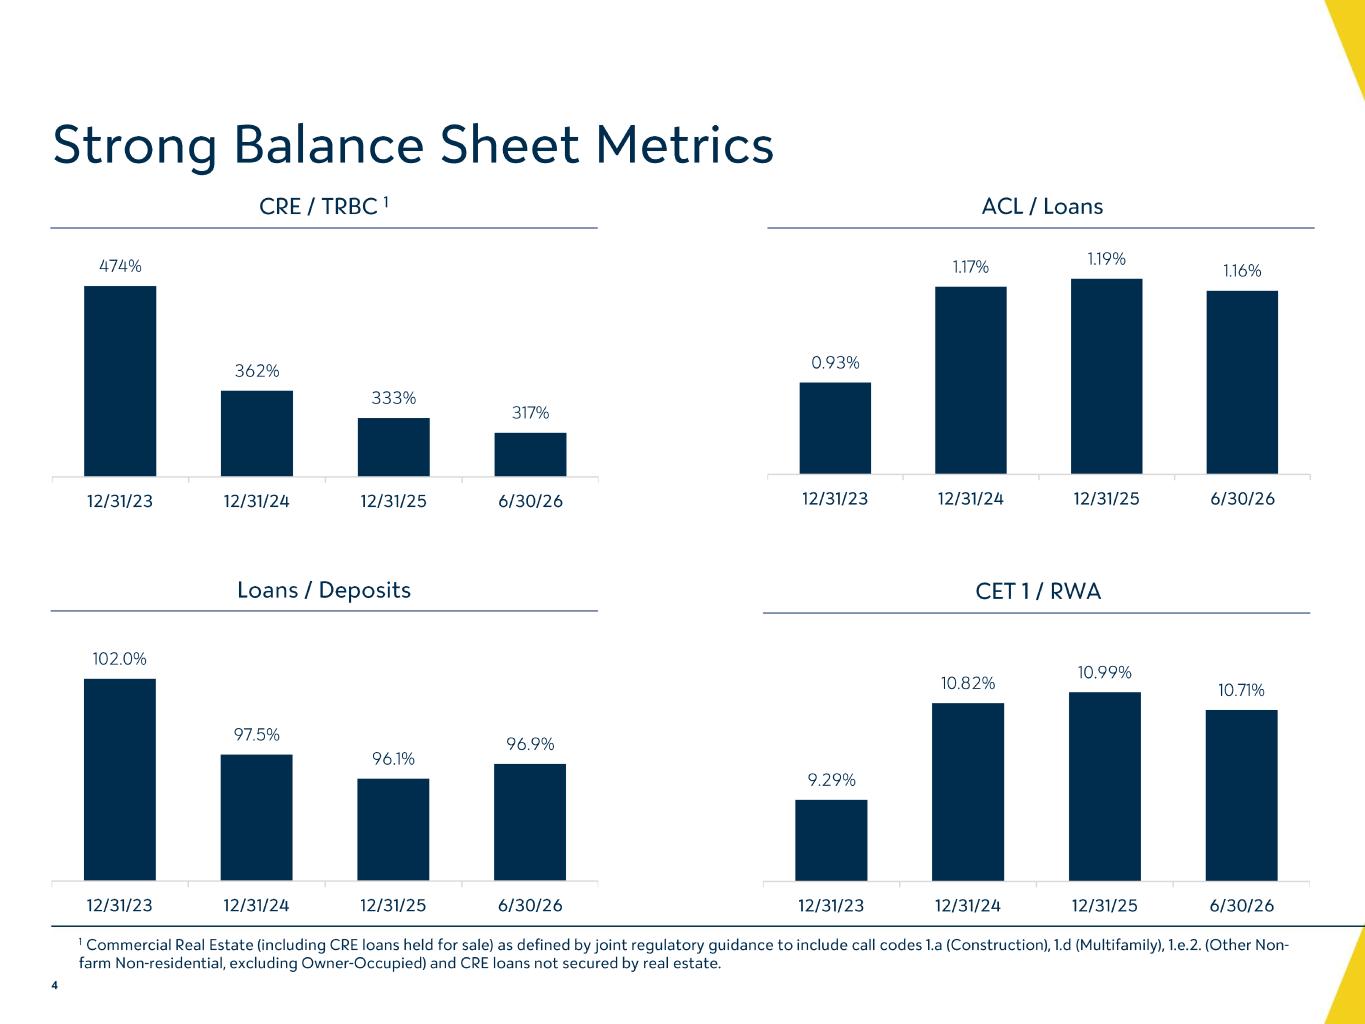
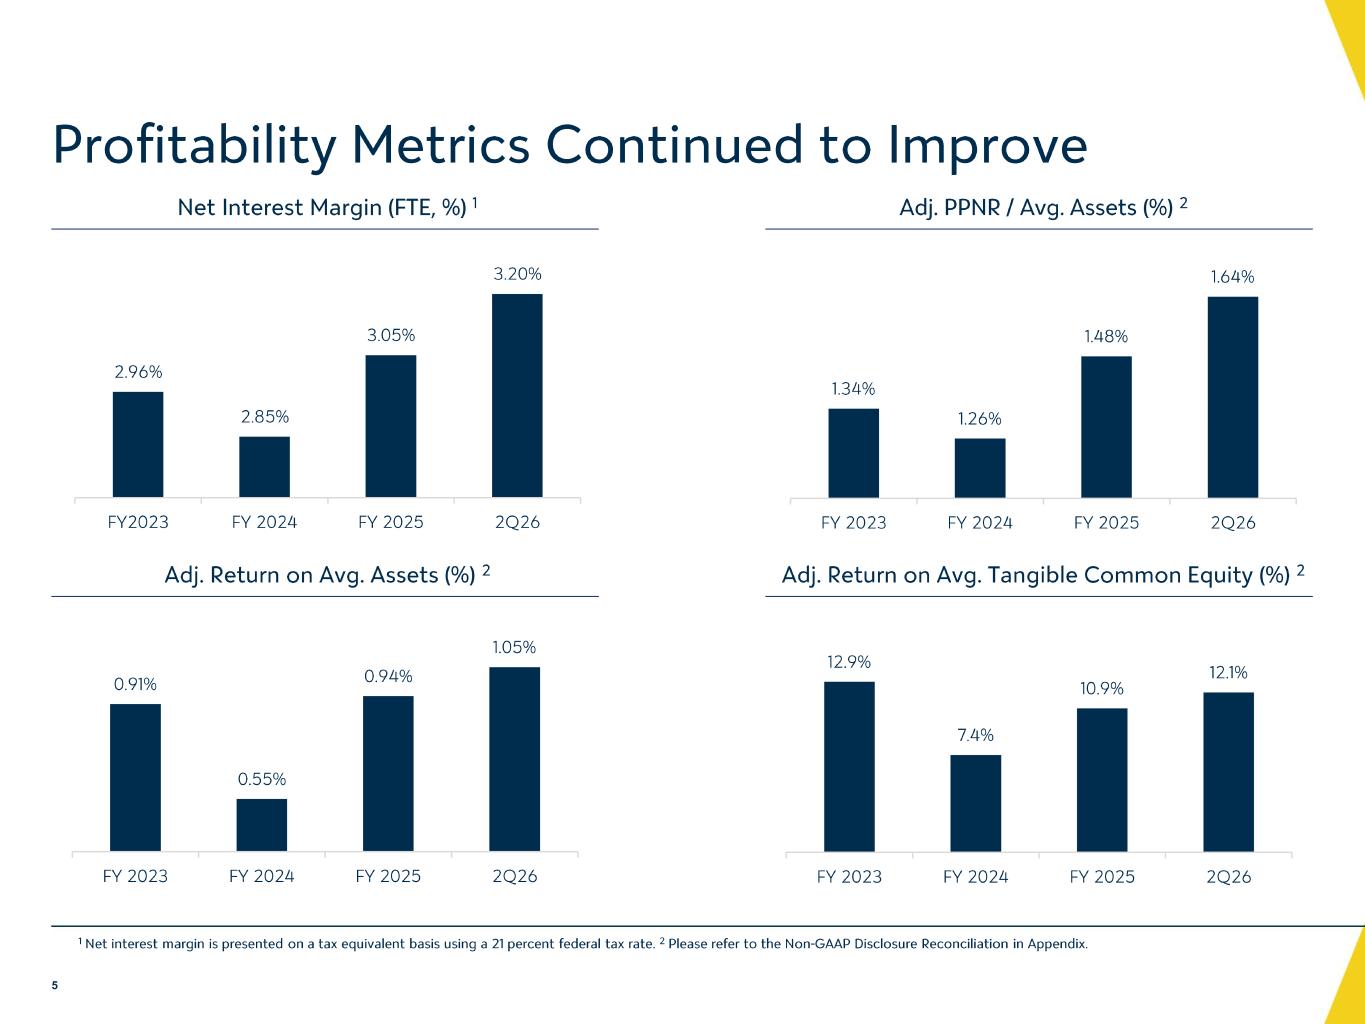
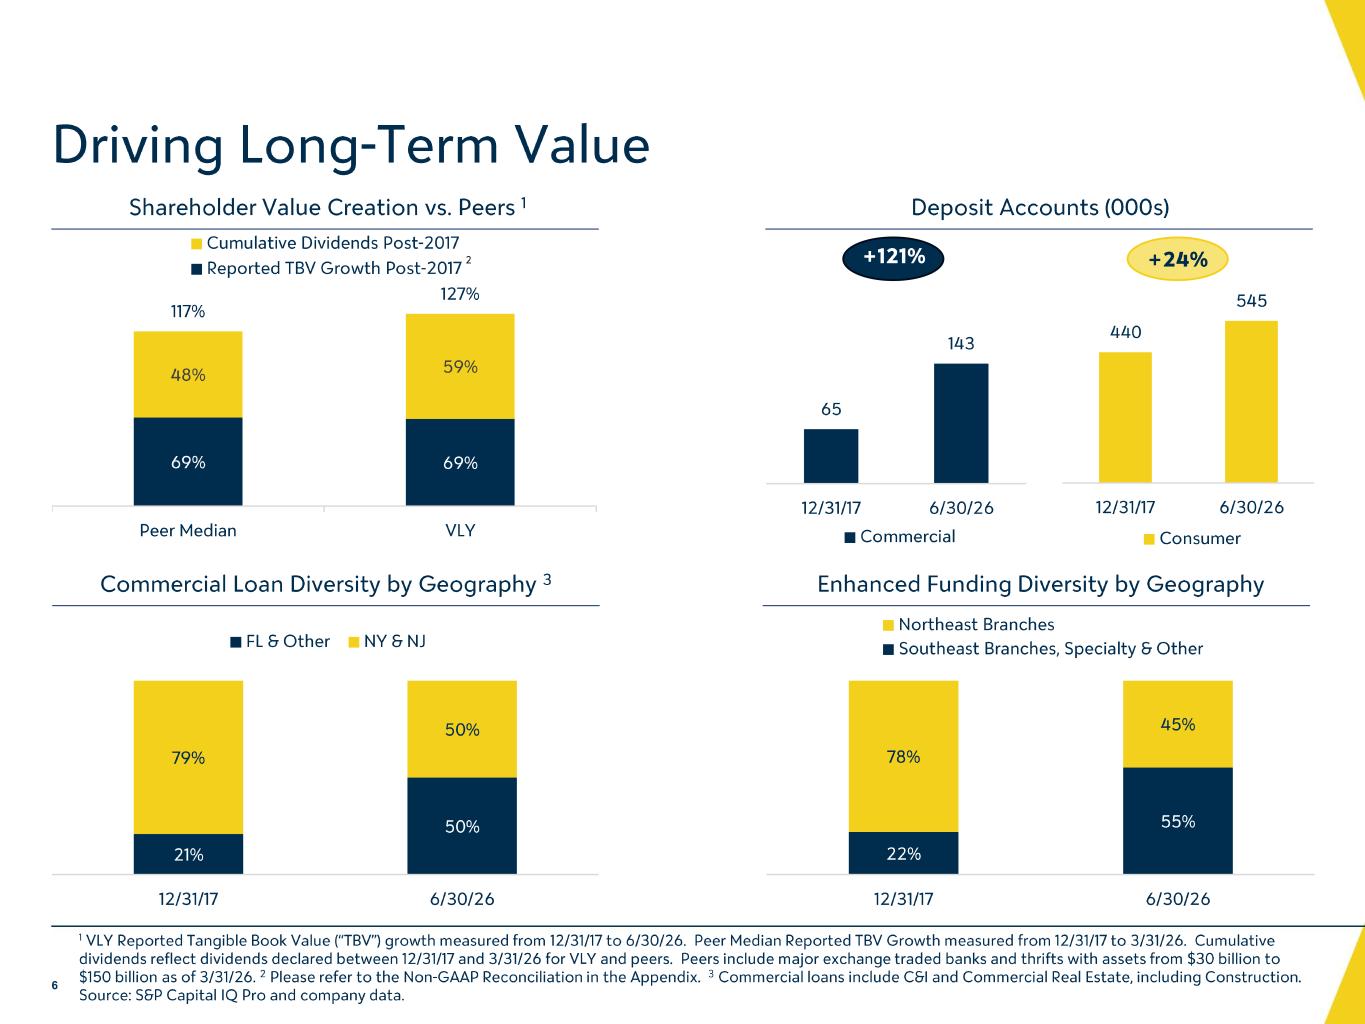
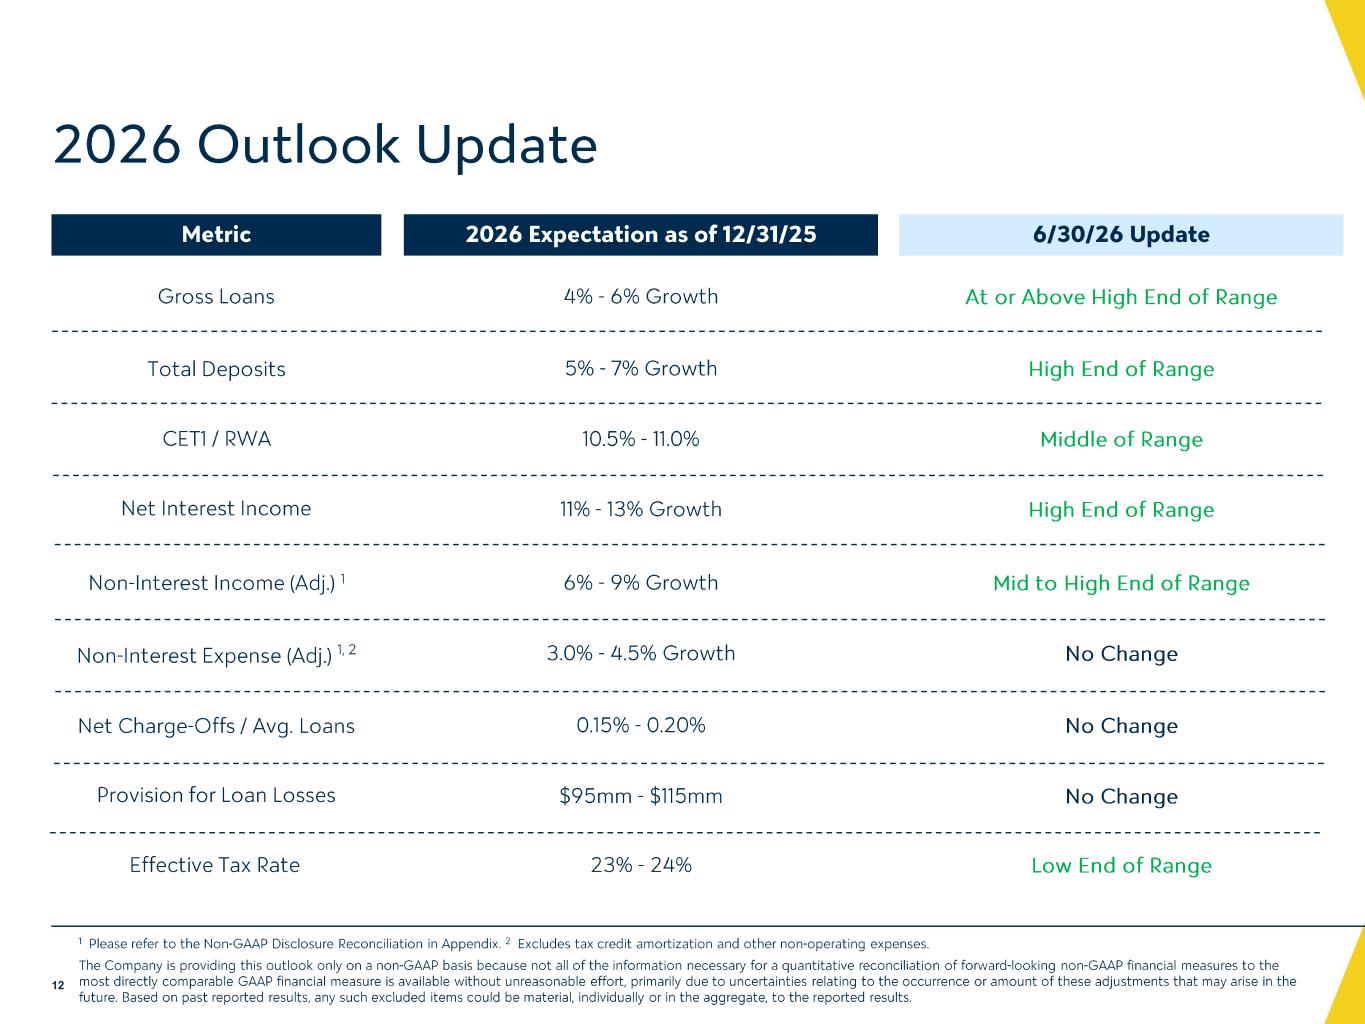
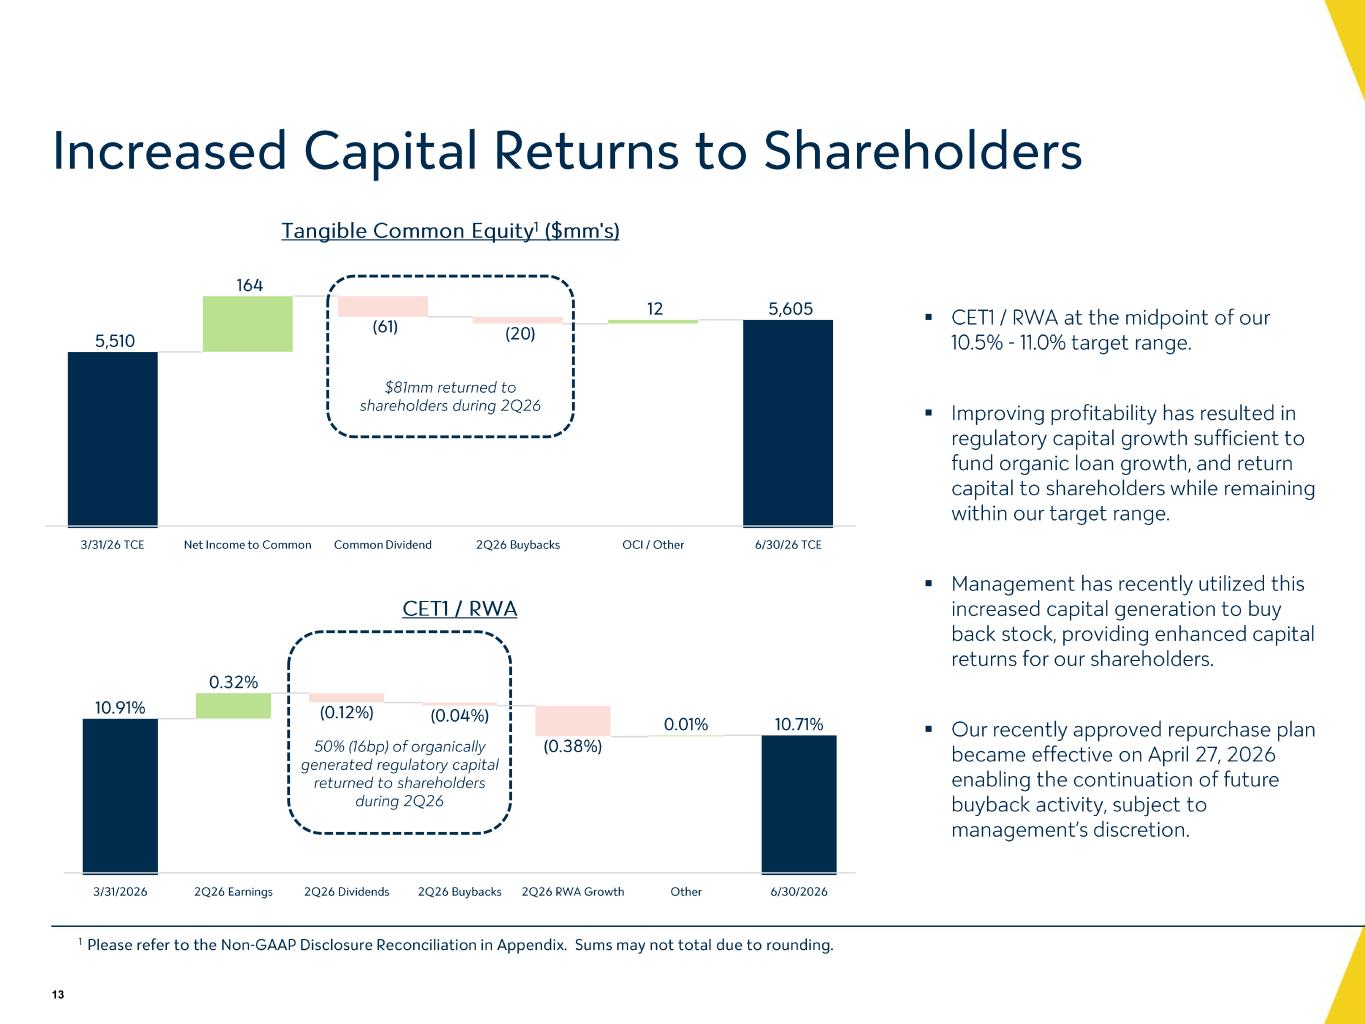
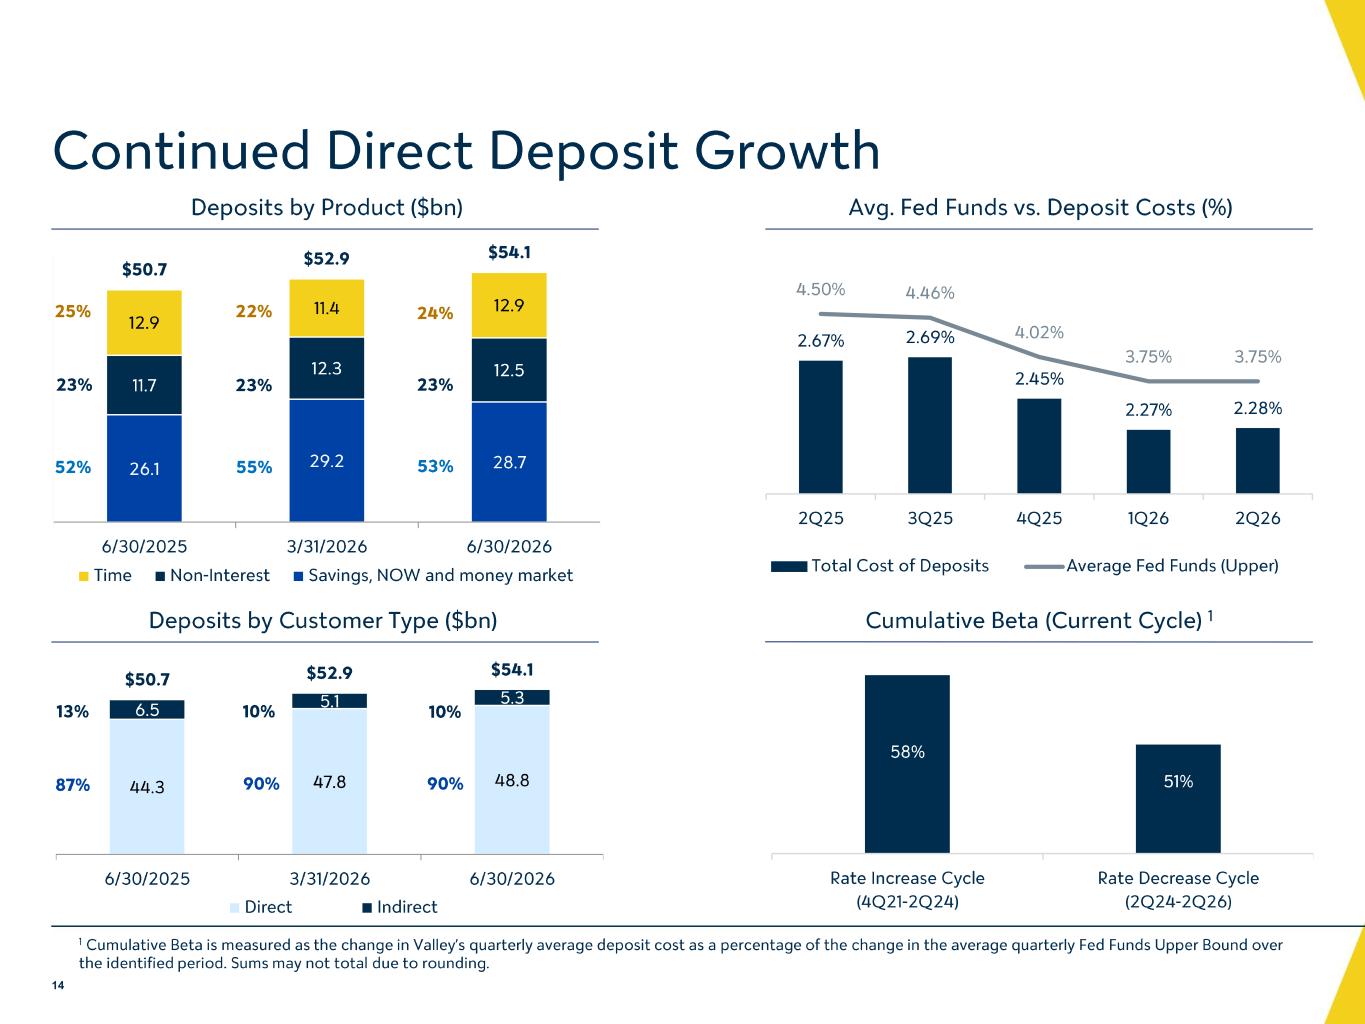
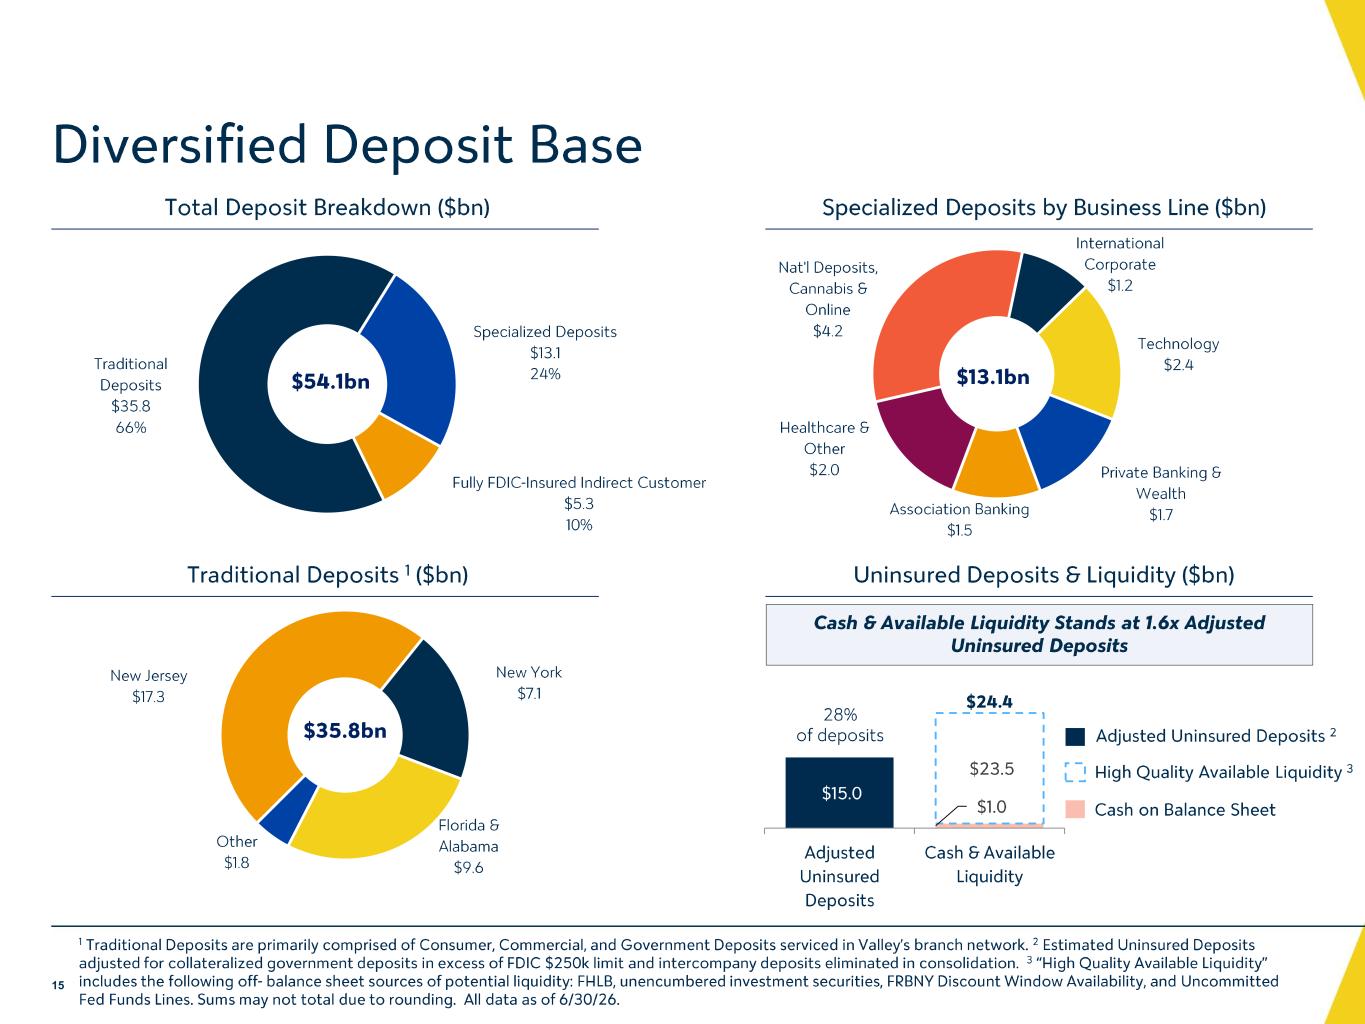
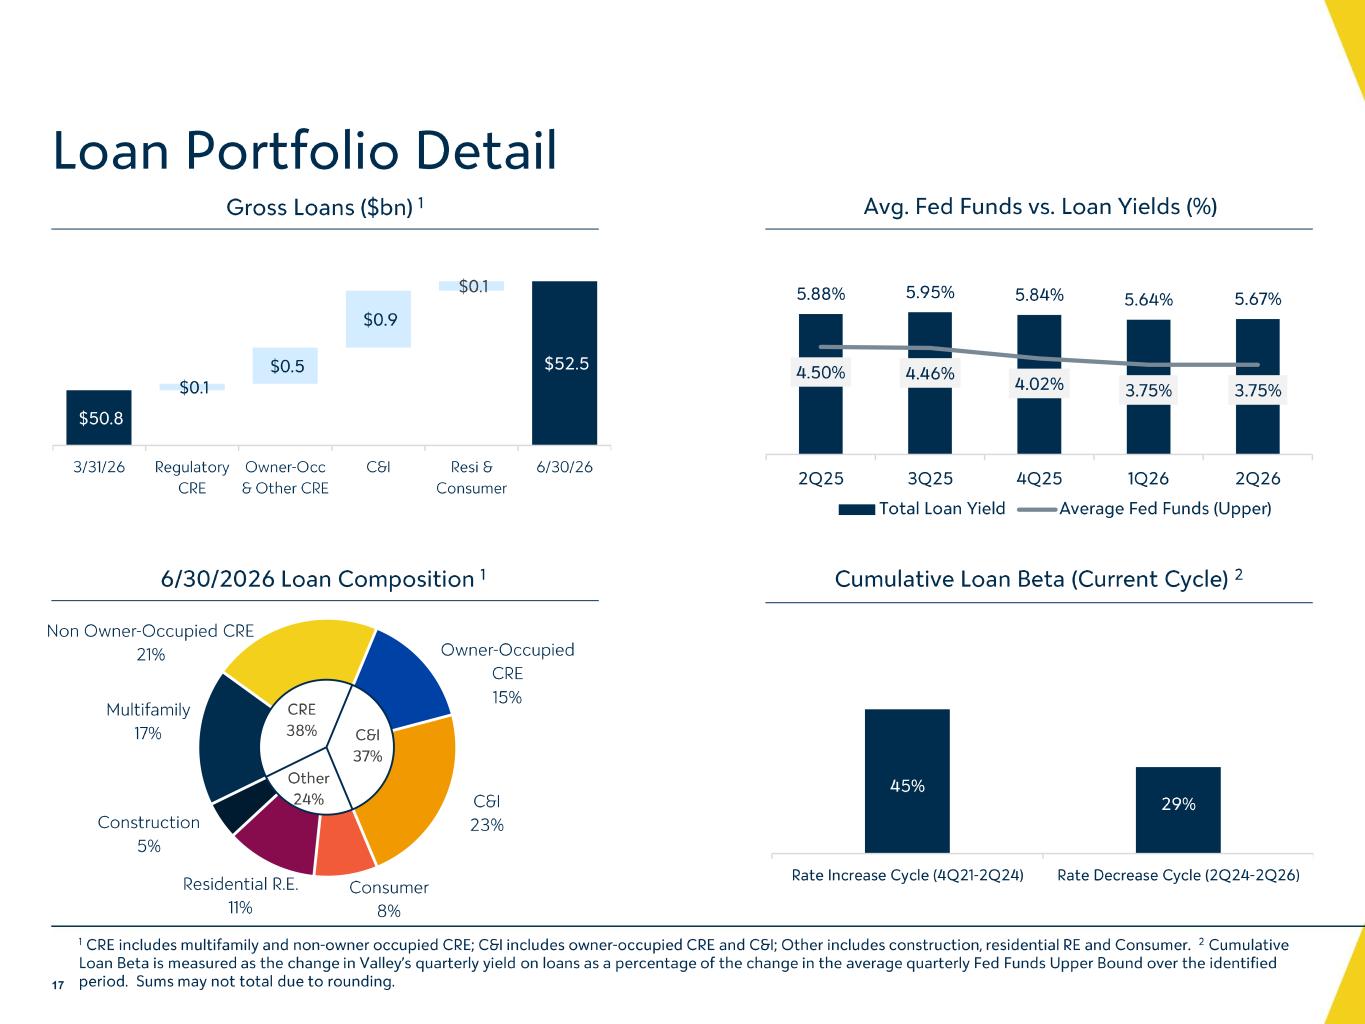
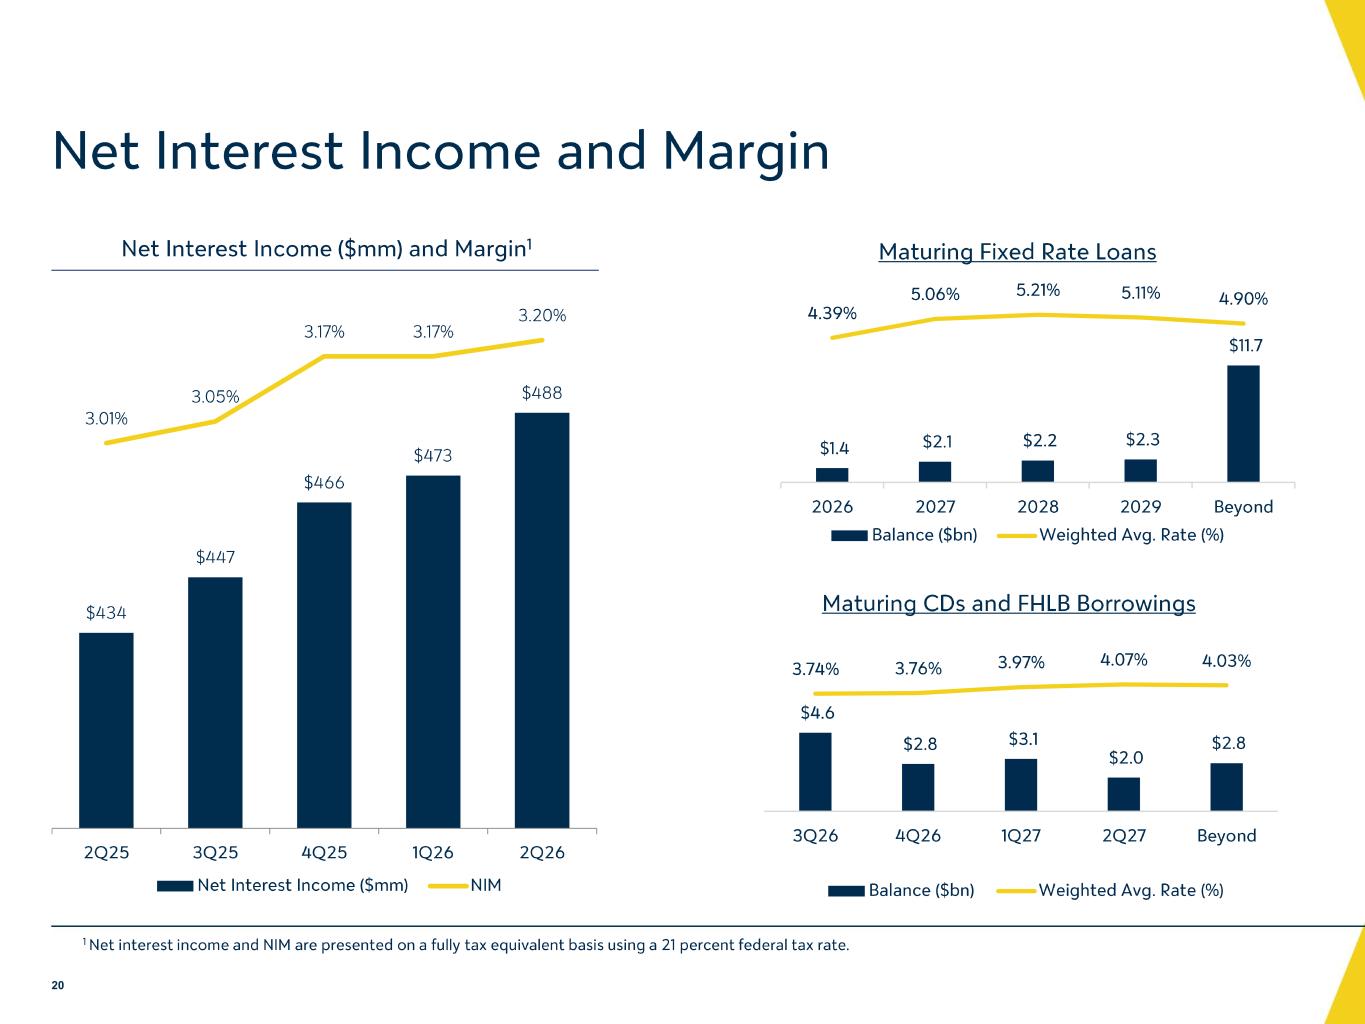
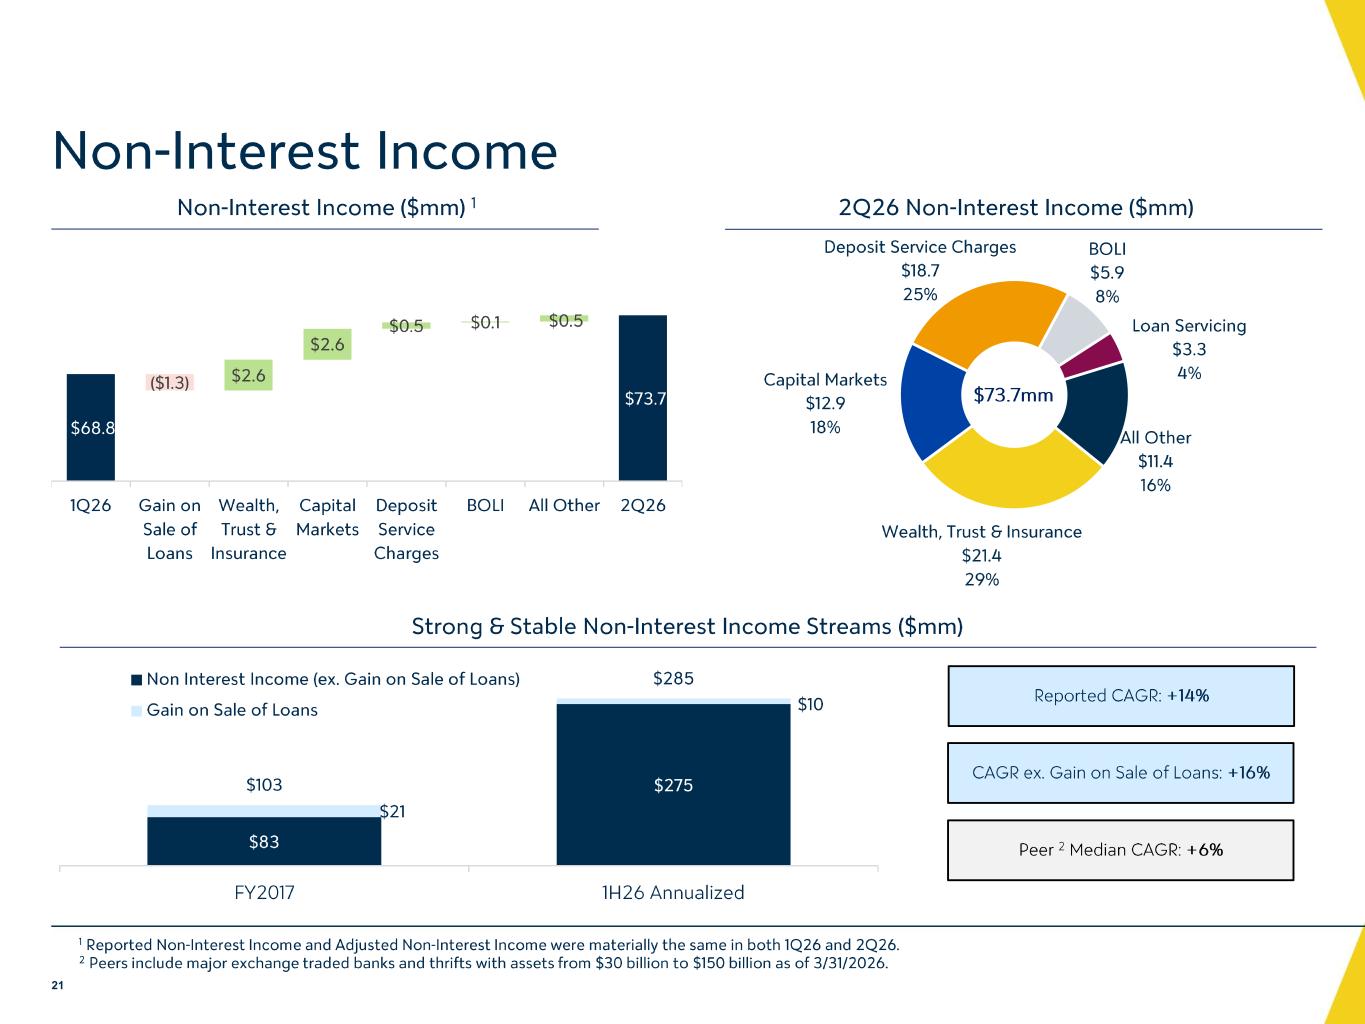
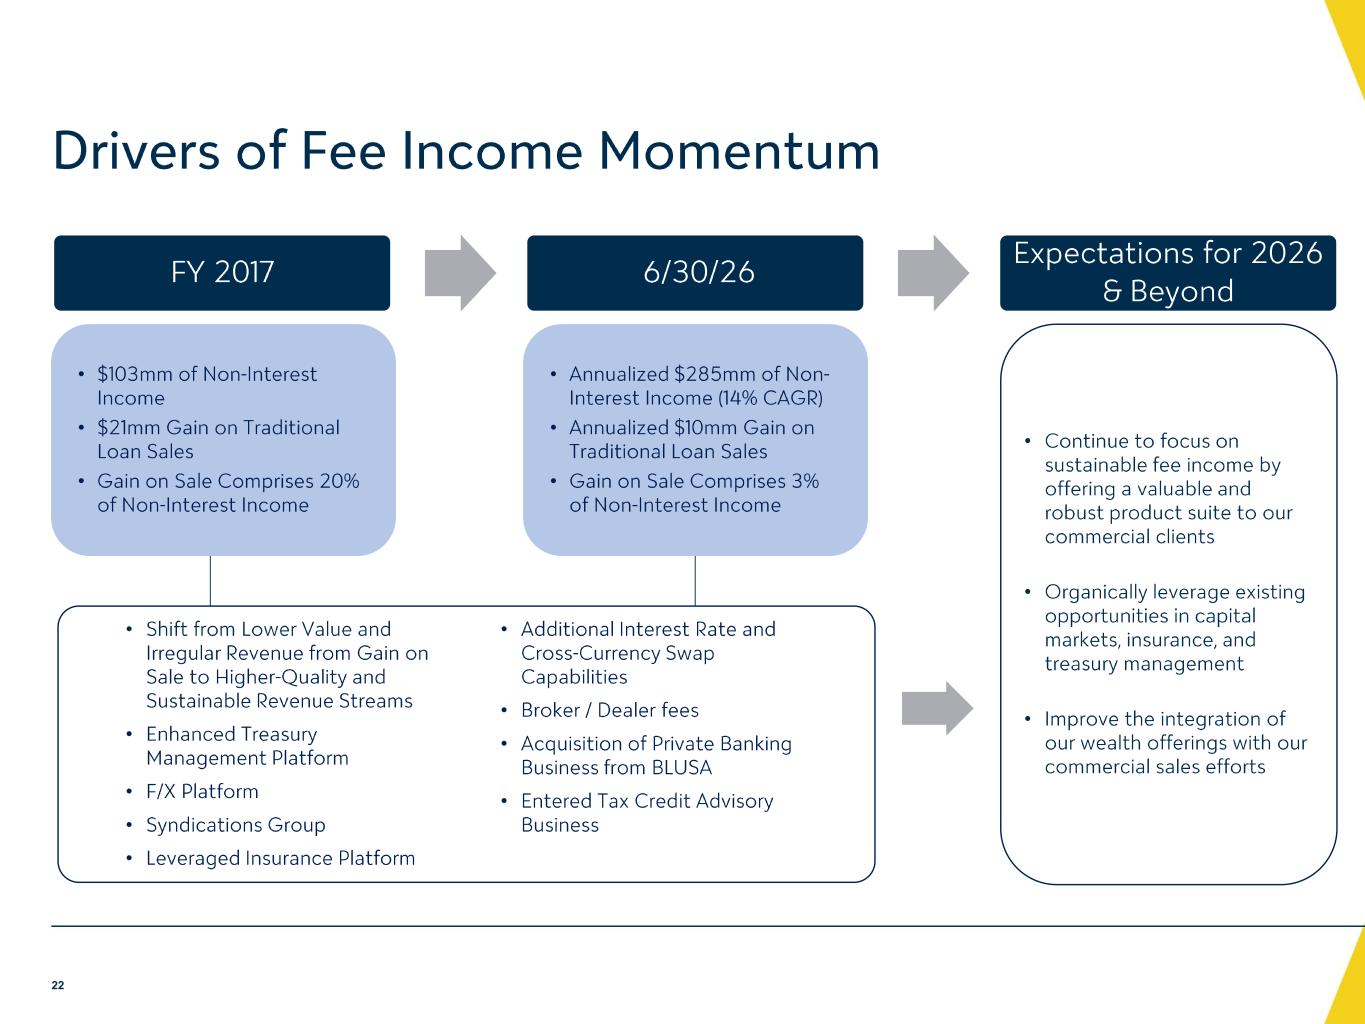
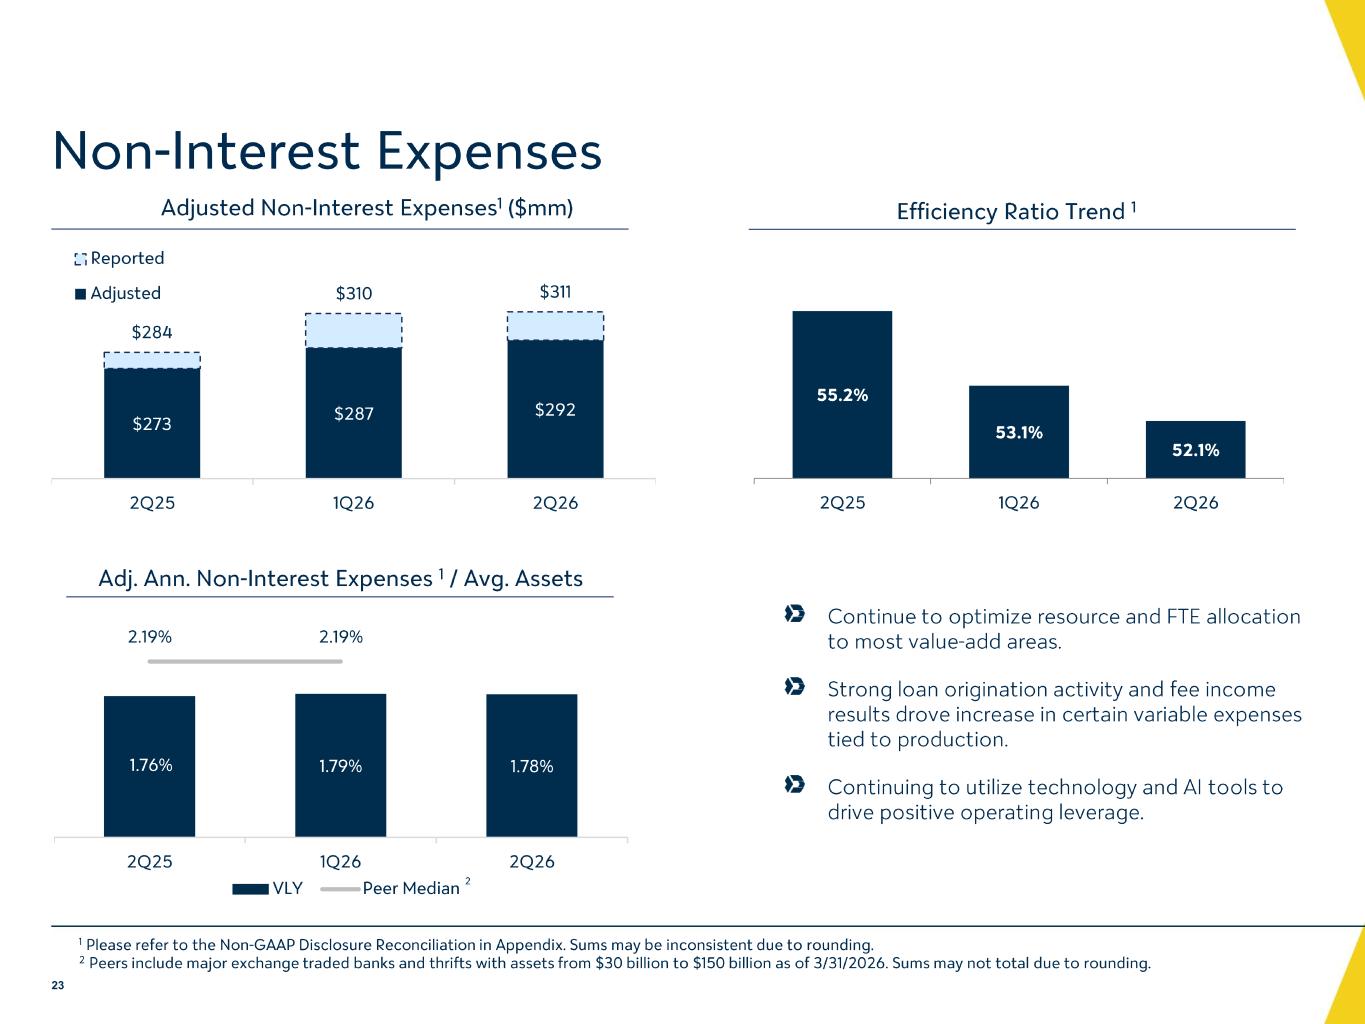
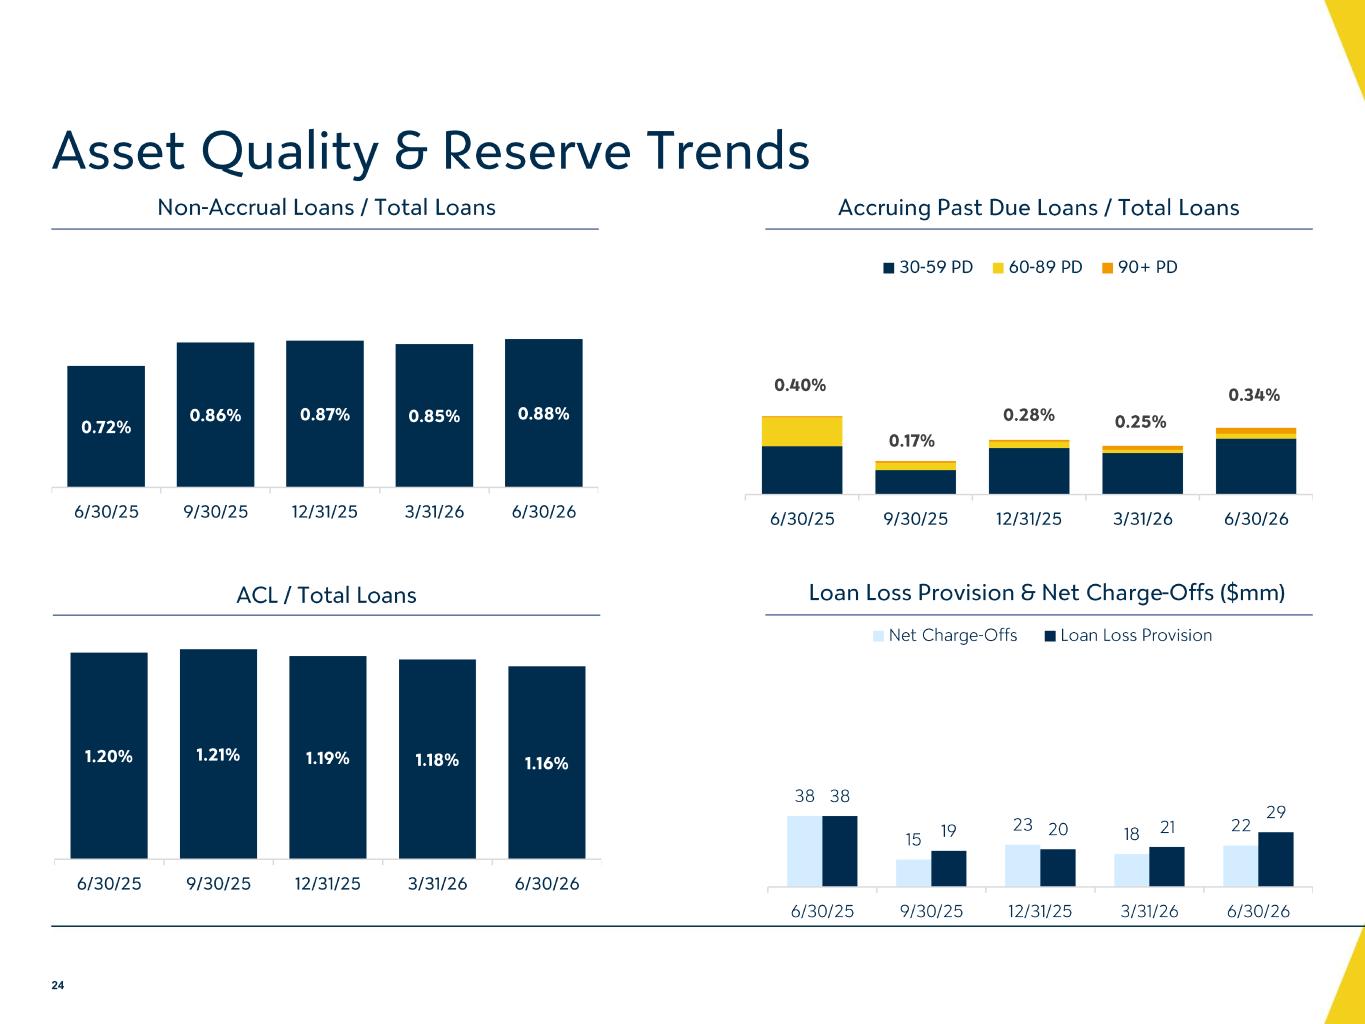
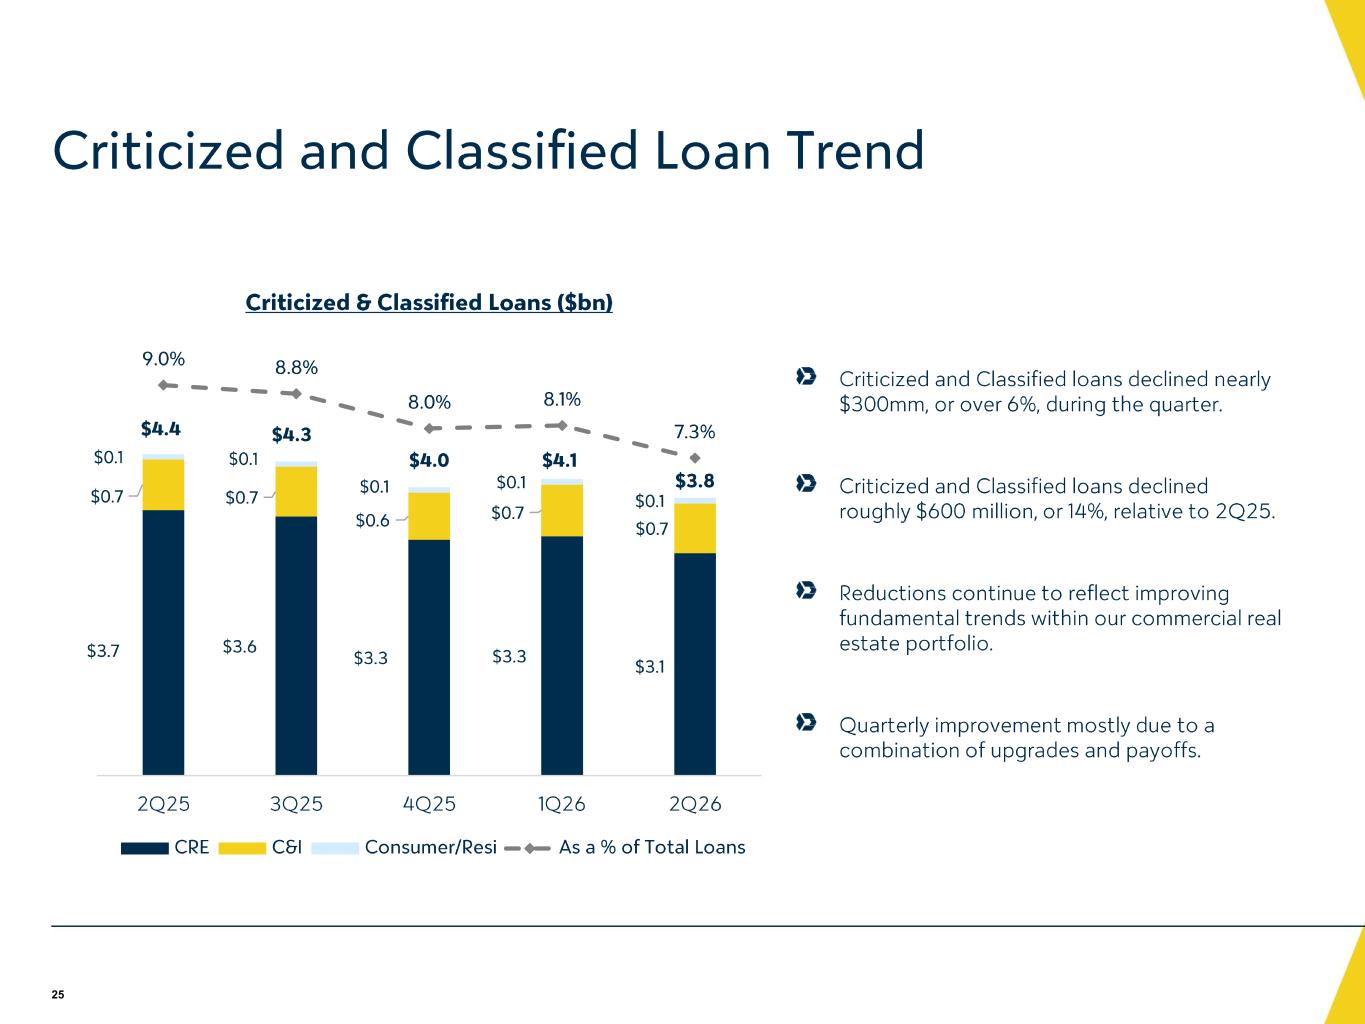
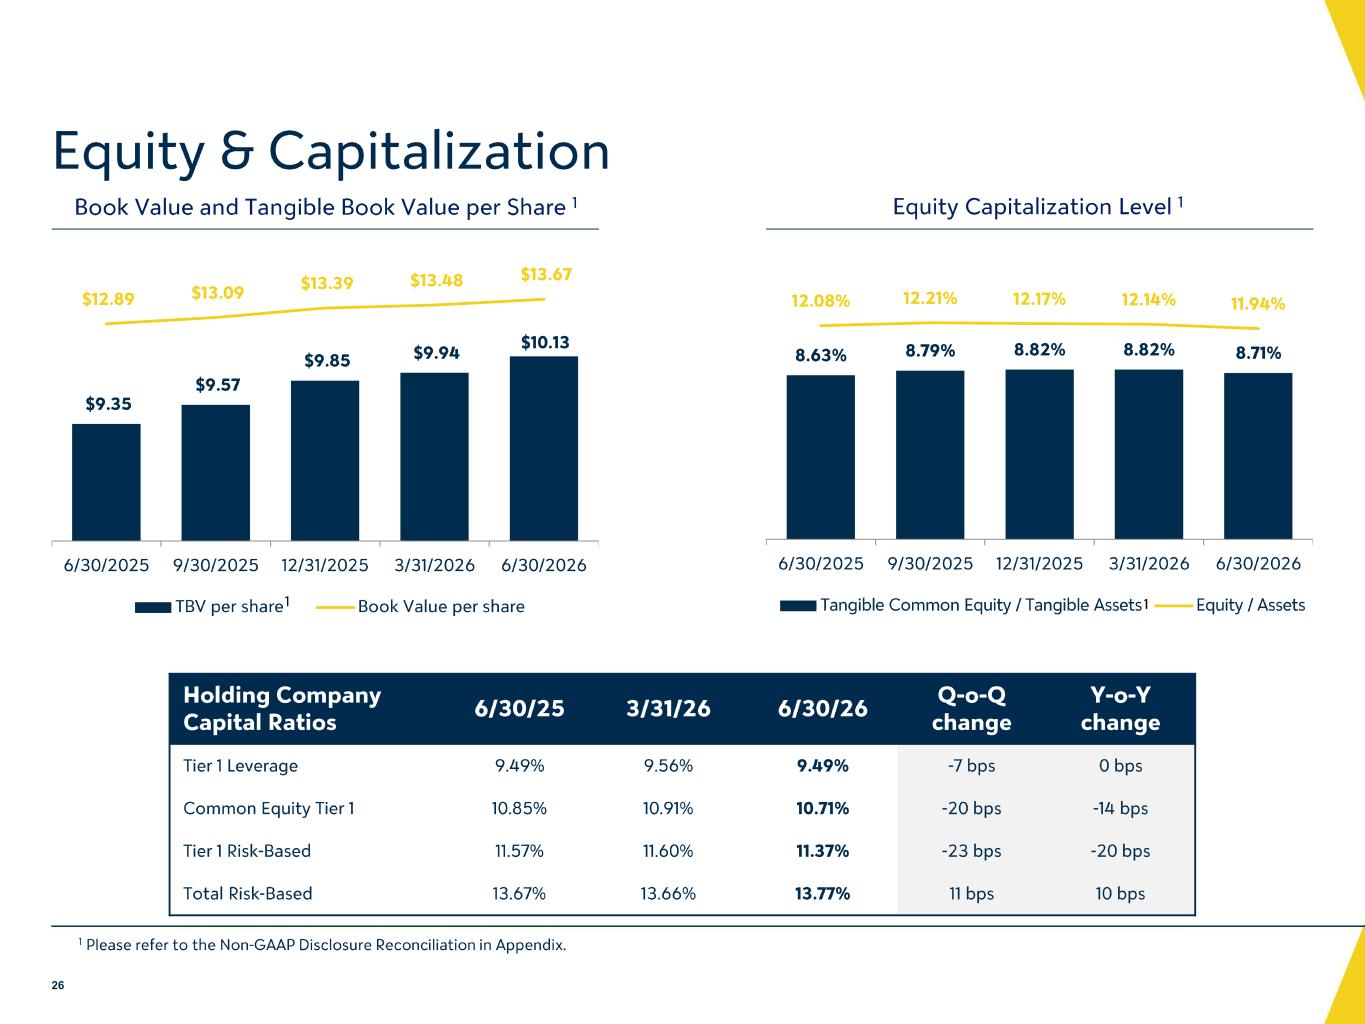
Based on our first half results and the continued momentum that we are seeing, we are maintaining our strong outlook for 2026. We now expect gross loan growth at or somewhat above the high end of our range and believe that fee income will also migrate towards the high end of our expected range. Our outlook for deposit growth and net interest income is unchanged from the upwards revision announced on last quarter's call. We expect continued earnings growth and profitability improvement throughout the remainder of the year and into 2027. Turning to capital deployment, we continue to balance organic growth, capital returns, and balance sheet flexibility during the quarter. We returned approximately $81 million to shareholders in the form of common dividends and the repurchase of 1.5 million shares. The quarter's reduced buyback activity was the product of our exceptional loan growth, and we will continue to toggle our buyback appetite in the context of near-term loan growth expectations. We remain very comfortable with our regulatory capital ratios. Our ability to support substantial loan growth, repurchase shares, and reduce our regulatory CRE as a percentage of risk-based capital by another 12 percentage points during the quarter demonstrates our flexibility and the value of our accelerating organic capital generation. Slide 14 illustrates the quarter's strong deposit growth. Direct customer deposits increased $1.1 billion during the quarter, including nearly $300 million of non-interest deposit growth, $200 million of interest-bearing non-maturity deposits, and $600 million of retail CDs. While core deposit growth remained extremely strong during the quarter, we did utilize $200 million of incremental brokered deposits to fund the temporary timing mismatch resulting from our high-quality loan growth. We also strategically rotated nearly $700 million of floating rate now balances to brokered CDs within our indirect deposit portfolio. Total deposit costs were effectively unchanged from the first quarter and remain meaningfully lower than 2.67 percent a year ago. We remain focused on growing high-quality direct deposits and continuing to improve our funding profile over time. Slide 17 details the $1.6 billion increase in loans during the quarter, equating to around 13 percent on an annualized basis. Incremental growth continues to be focused in our C&I and owner-occupied CREE portfolios, and as Ira mentioned, we saw specific strength in the New York, Florida, and Illinois markets and our health care vertical during the quarter. Regulatory CREE, which excludes owner-occupied loans, grew less than $100 million during the quarter. As a result of our strong organic capital accretion and our successful subordinated debt issuance in May 2026, our Cree concentration ratio declined to approximately 317% at June 30th from 329% at March 31st. In general, our loan portfolio continues to evolve in line with our strategic priorities as we replace low-value transactional Cree with relationship-based C&I and owner-occupied Cree loans, which are contributing deposits to the bank. Net interest income on a tax equivalent basis increased to $488 million, up approximately $16 million from the first quarter and $55 million from the year-ago period. Net interest margin on a tax equivalent basis expanded three basis points linked quarter to 3.2% and was up 19 basis points from the second quarter of 2025. The linked quarter increase in net interest income reflected at higher average loan balances and higher yields on new loan originations and investment securities. These benefits were mitigated somewhat by the cost of carrying excess subordinated debt between our issuance of $500 million in May and the redemption of our $300 million callable notes in June. We estimate that this dynamic weighed on net interest income by around $2 million during the quarter. Non-interest income increased $4.9 million to $73.7 million and contributed over 13% of our total revenue during the quarter. The linked quarter increase was driven primarily by a $2.6 million increase in capital markets revenue and a $1.6 million increase in wealth management and trust fees. The fee growth reflected higher transaction volumes within loan participations and syndications and tax credit advisory services. We continue to view fee income as an important part of our business model evolution. Our enhanced treasury management platform, capital markets capabilities, tax credit advisory activity, and broader commercial product set are giving us more ways to deepen relationships and generate additional high-quality and sustainable non-interest income. As mentioned earlier, we now expect 2026 fee income growth to be toward the higher end of our previously announced 6% to 9% range. Reported non-interest expense was $311 million, up approximately $1 million from the first Adjusted non-interest expense increased by $5 million as lower compensation costs were offset by higher FDIC expense, third-party spend associated with our operational transformation efforts, and incremental costs related to the quarter's strong growth and fee income results. Our efficiency ratio improved to 52.1% from 53.1% in the first quarter and 55.2% a year ago, and expenses as a percent of average assets remains well below peer levels. As Ira mentioned, we remain focused on driving positive operating leverage, including through the continued use of technology and AI tools to support productivity, improve process consistency, and reallocate capacity towards higher value activities. We expect our efficiency ratio will continue to improve as we drive additional revenue growth and control operating expenses in the remainder of 2026 and beyond. Despite a modest uptick in non-accrual and past-due loans during the quarter, we saw a significant reduction in criticizing classified assets on both a sequential quarter and year-over-year basis. As detailed on slide 25, criticized and classified assets now stand at 7.3% of total loans versus 8.1% the quarter ago and 9% last year. The continued improvement reflects improving underlying trends within our CRE portfolio, which has led to upgrades out of special mention and substandard classifications in addition to traditional payoff activity. Net charge-offs totaled $22 million or 17 basis points of average loans, compared with $18 million or 14 basis points last quarter. The provision for credit losses for loans was $29 million compared to $21 million in the first quarter. The higher provision was due, in part, to the strong loan growth, particularly within the CNI category. Our allowance for credit losses for loans declined to 1.16% of total loans from 1.18% at March 31st. This modest allowance coverage reduction is reflective of the criticized and classified asset reduction I just mentioned. For the remainder of 2026, we continue to expect charge-offs and provisions in line with our prior guidance. Tangible book value increased nearly 8% on an annualized basis. Our CET1 ratio of 10.7% remains within our previously stated target range, and our successful issuance of new subordinated notes, net of redemptions, bolstered total risk-based capital during the quarter. Our current capital levels provide appropriate flexibility to support our growth in capital return aspirations going forward. In summary, the second quarter demonstrated continued progress against the strategic priorities we have outlined. Stronger core deposits, more diversified relationship-based loan growth, improving net interest income and margin, sustainable fee income growth, expense discipline, and balanced capital deployment. We are pleased with the momentum in the business and remain focused on delivering continued profitability improvement through the remainder of the year. With that, I will turn the call back to the operator to begin Q&A. Thank you.
Operator
Thank you. As a reminder, if you would like to ask a question, please press star 11 on your telephone. You'll hear the automated message advice and your hand is raised. We also ask that you please wait for your name and company to be announced before proceeding with your questions. One moment while we compile the Q&A roster. Our first question today will be coming from the line of Fede Strickland of Javi Group. Please go ahead.
Hey, good morning. You know, just wanted to touch on fee income. Seems like a really strong quarter there, and the guide seems pretty positive. If we continued at this level, it looked like you'd probably exceed the guide. Is the expectation that some of the more volatile lines like capital markets likely step down from the high point in the second quarter?
Yeah, Fetty, this is Travis. No, I think there's good consistency in continued growth opportunity. The one element that you kind of referenced within capital markets is our interest rate swap income, which is heavily tied to commercial real estate originations. As you saw, the second quarter loan growth was extremely strong. and included some pull forward from things that we may have expected to have closed in the third quarter. So, I do think the swap income element was slightly elevated. Maybe that equates to a million or two million dollars in aggregate. But other than that, I think you still see continued growth in deposit service charges, loan syndications were strong, tax credit advisory was strong as well, and insurance picked up. So, I think there are other elements, but I do think the interest rate swaps is the one that may have been slightly elevated during the quarter.
All right. Great. Thank you. And if I could just switch gears to credit, great to see the criticized and classifieds start to decline again. You mentioned some positive trends and CRE driving some of that. Can you provide any more detail on maybe what some of those trends are and really what you're seeing to drive some of these upgrades?
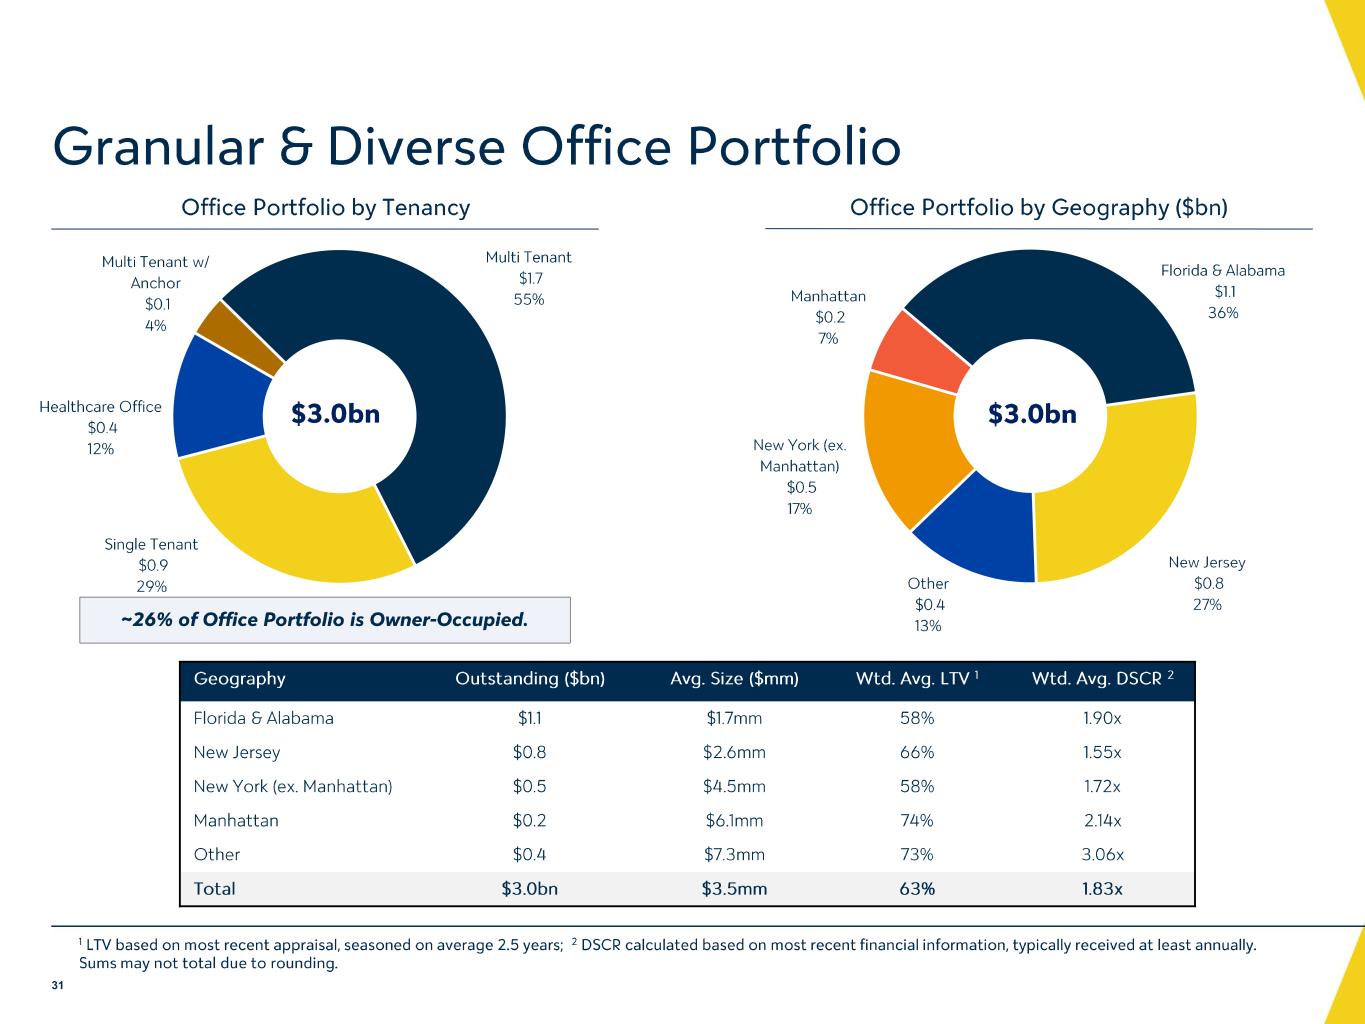
Absolutely, Fetty. It's Mark Sager. So in general, Right. When the feel of our Cree clients is that the market continues to be robust in all asset classes, for the most part, including office, we're starting to see positive progress in lease up in office. Our portfolio upgrades and payoffs primarily associated with some assets that were in transition and in lease up and were downgraded. We had strong sponsor support. We had expected those properties to perform and lease up and we are seeing that and that's attributing to our payoffs, our upgrades. And, again, we feel that there's room in portfolio to continue to see that positive trend and criticize.
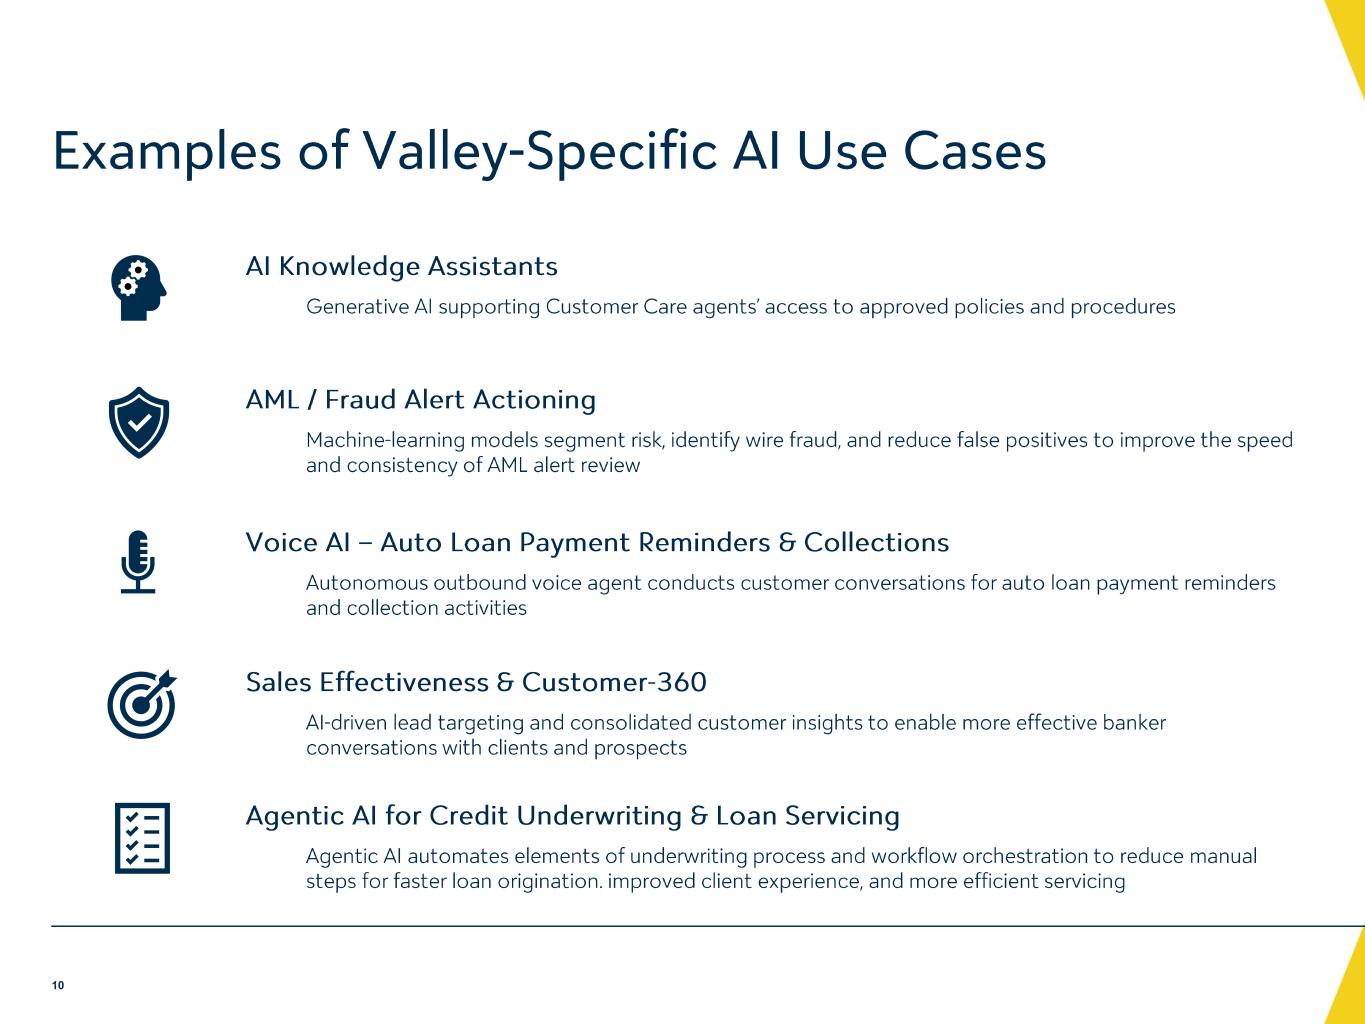
If I could squeeze in one more on credit, can you just talk about the agentic AI for underwriting? Just curious if you have any examples of kind of how that works and what parts of the process you see the most opportunity to speed up, you know, maybe underwriting without compromising on the quality of the underwriting.
Sure, absolutely. And to be clear, for us, we're in exploration and examination phase. We don't have a Gentic in our core analysis right now, but traditional proven financial statement spreading, rent roll population within our core systems, those we are employing right now. But we're highly invested in examination to continue to expand those capabilities, although not employed.
This is Travis. I would just add, Betty, that I think like most AI use cases, right, the manual work can be automated, but it doesn't change the oversight and approval and governance that's around those AI efforts. So, you know, elements, to Mark's point, have already been embedded, but it's not like that's occurring in a vacuum with no human oversight. It's just shifting the roles and responsibilities somewhat.
Got it. Makes sense. Thanks, Travis and Mark. I'll sit back.
Operator
Thank you. One moment for the next question. Our next question is coming from the line of Chris McGrady of KBW. Please go ahead.
Oh, great. Good morning, everybody. Travis, the focus on a lot of the mid-caps this quarter in the regionals has just been the accelerating loan growth, but a little bit of funding pressures. Interested in kind of where, how you're thinking about that dynamic growth versus margin as you go into the back half of next year. And then secondarily, do you have the spot price on the deposits?
So I think that's fair. The expectation for rates has changed somewhat since we came into the year. We've talked about being effectively neutral to the front end of the curve from a rate sensitivity perspective. I think we still see that playing out. So, I mean, for us, I think we have some differentiated opportunities because we still have $5 billion of brokered deposits. You know, over the last 12 months, we've generated about $4.5 billion of new core deposits. That's $8 billion over the last eight quarters. So we're seeing the core deposit growth trend, you know, be consistent and expanding. We have in the next, in the remainder of this year, we have $2 billion of brokered CDs coming off at a rate of 4.1% and $1.4 billion of fixed rate loans at 4.7%. So when you think about the repricing benefits of both of those items, it gives us good confidence in the margin outlook. I don't think there's any argument that deposit competition is heating up, but I do think that that's occurring more on the consumer side. And a lot of our focus has been on commercial deposit growth opportunities. This quarter, we originated exclusive of CDs, $1.3 billion of new deposits at a blended rate of 1.66%. Last quarter, excluding CDs, that number would have been 800 million at 1.78%. So we had some CD promos out there that helped us generate volume. But exclusive of that, we're actually seeing our ability to generate new deposits at lower rates. And I think all that's supportive of our margin guidance, for sure, through the rest of the year. From a spot deposit perspective, the rate was 2.29% as we exited June. Part of that was elevated from March by two or three basis points because of the CD promos that we had out in the market.
Okay. Great color. And Ira, I want to make sure I heard the AI discussion right. I think the regular comments was 500 basis points. I think that was either operating leverage or an efficiency comment. I guess I'm more interested in how the role of AI plus the role of capital smarter regulation is going to impact perhaps that mid-teens ROI that you've been talking about for some time. Thanks.
Yeah, thanks for the question. I think there's tremendous opportunity on both sides of the balance sheet when we think about the AI implications to it, when we think about how much or what the composition of that 500 basis points is going to be, in my mind, it's more along the efficiency ratio, but it's really driven probably around 65% coming from expenses and around 35% coming from revenue. And as we think about resource deployment, whether it be capital or human, as to how we're thinking about extracting that actual benefit, that's probably where those allocations come from. On the expense side, we think about gearing ratios and what the implications of those are going to be across front line and support areas. We're already seeing the elimination of certain software across the organization, so reduction in specific expenses and just improvement in efficiency. On the revenue side, we do believe that we're going to be able to get a larger share of wallet based on some of the enhancements we're doing with the data and the analytics and the ability to really provide some critical value, add information to our clients, and we believe that's going to be differentiating for us and give us additional revenue opportunities as well. So we're definitely looking at deploying capital associated with it. I think for the year to date, we've seen about $15 million plus or minus, Travis, correct?
Yeah, all in, we have $15 million of saves in the expense run rate against about $3 or $4 million of AI-associated expenses that are new, whether it's headcount or vendor spend.
So for us, it's not just in an exploratory phase. There's actually, you know, a real ROI that's already coming from it, and we think that it's going to be enhanced, and that will help us get to the 15% ROTC that we targeted. But I think as Travis has talked about before, there's not a reliance upon the ROTC, excuse me, on the AI, to get to the 15% ROTC number. That's great, Collie.
Operator
Thank you. One moment for the next question. Our next question will be coming from the line of David Smith of Truist Securities. Please go ahead.
Hey, good morning. Could you talk a little bit more about your loan and deposit pipelines and how you're thinking about the timing and drivers of growth over the rest of the year? I guess the guidance implies deposits outgrowing loans by about $400 million for the full year, but through the first half, I think it's kind of the opposite. Loans have been about $400 million ahead of deposits. So I don't know if there's any seasonality or timing for either of those lines that we should be thinking about. And then secondly, as core deposits catch up to loans, should we expect meaningful improvement in deposit costs as you're running Brokered Down?
Yeah. David, this is Travis. On the loan growth, I mean, we're running 9% on an annualized basis. But if you look back over the last 12 months, I mean, I think it's hit kind of exactly what we've said, which is around 10% growth in CNI. in mid-single-digit aggregate loan growth. So I would expect the second half of the year looks more like what we've done over the last 12 months than what we did this quarter, which was exceptional. We've been talking for the last 12 to 15 months about hiring efforts on the commercial side. Those efforts resulted in a growing pipeline. Coming into the second quarter, we saw a very strong pull through. So the pipeline's down about a billion dollars from March 31st to June 30th, but remains a couple hundred million dollars ahead of where it was coming into the year. I think seasonally, the third quarter is typically a little bit slower with summer vacations and things like that. And you see acceleration then in the fourth quarter and towards year end. So when we revised the loan growth guidance higher, we said to kind of add or somewhat above the high end of the 4% to 6% range. I think that's accurate. I also think that because of the timing expectation, it's probably not a material change relative to our average loan expectations for the year. On the deposit side, I mean, we continue to see, as I said earlier, you know, very consistent growth. I mean, we've been growing about a billion dollars a quarter in core deposits. One thing we've observed, obviously, is as we put on C&I loans, there is somewhat of a lag to achieve the deposit expectations that come with those loans. So we look back at, just as an example, loans we originated in January. As of March, they had generated about 10% of the deposits that they'd expected. We looked again in June, that was up to 80%. So there's a three- to six-month lag in terms of getting all the deposit opportunity achieved. So that's why I think we highlighted something of a timing mismatch this quarter. The loan growth was exceptional. The deposit growth was exceptional. But over the next two quarters, I do expect that that gap will certainly close. And we'll continue to see the brokered deposits come down. Again, the broker that we have for the remainder of the year, about $2 billion of brokered CDs coming off at a rate of 4.1%. on a blended basis this quarter. I kind of gave you what the new origination for deposits was well below that. And I think that's part of what drives the structural tailwind that we have and that differentiates us from a lot of peers.
Got it. Any change to your NIM outlook for the fourth quarter?
No, we still think exiting, you know, low to mid-330s is what we've talked about. There's no change to that.
Operator
All right, great. One moment for the next question. And the next question. We'll be coming from the line of tomorrow about Braziliar of UBS. Please go ahead.
Going back to the expense conversation and some of the expected benefits from AI, I guess any caller you can provide on potential timeline there? I know that there's some potential learnings from Luwumi as well. Maybe just talk us through kind of the expense side of the equation when we can actually start seeing some of those benefits, minimizing some of the more recent expense growth.
Yeah, this is Travis. I think, again, as Ira mentioned, you have some of it's already in, and obviously we continued to execute on opportunities there. I wouldn't let some of the expense items this quarter kind of cloud that message. And when I say that, I mean, you know, when you look at the expense growth this quarter, $5 million sequentially, a million of that is from higher FDIC expenses. We just talked about the amount of deposit growth that we've seen. We had exceptional growth this quarter in loans and fee income. There are certain incentives that are associated with that that get tied into your expense number and then we've used third parties to help us operationalize some of our transformation efforts which in some cases includes AI but not in all cases. I think that in the professional service line you'll see come down. There will be some follow-up transition though as we continue to optimize our onshore headcount you'll see a transition where compensation costs should continue to come down or stabilize and you'll see some professional fees offsetting that overall that's a positive trade for our expenses and our efficiency ratio but there's always a lot of moving pieces in every quarter and I feel very good about the AI efficiencies that we're getting and that there's more to come but I wouldn't take too much again from the sequential change in expenses I kind of gave you some of those items that are very unrelated to to the AI discussion that we're having okay great and then
And maybe looking at the loan growth this quarter, we saw multifamily get reengaged. You called out some strong growth in the healthcare vertical for Cree. I'm just wondering the kind of the mix of future loan growth and maybe talk through some of the spread dynamics within the Cree bucket versus what you're putting on Cree Yeah, for sure. Within commercial real estate...
Oh, sorry, you cut out there at the end, Teamer. Maybe repeat whatever you said after asking about loan spreads.
Yeah, just if that spread persists, that's going to have a meaningful change on loan yields going forward.
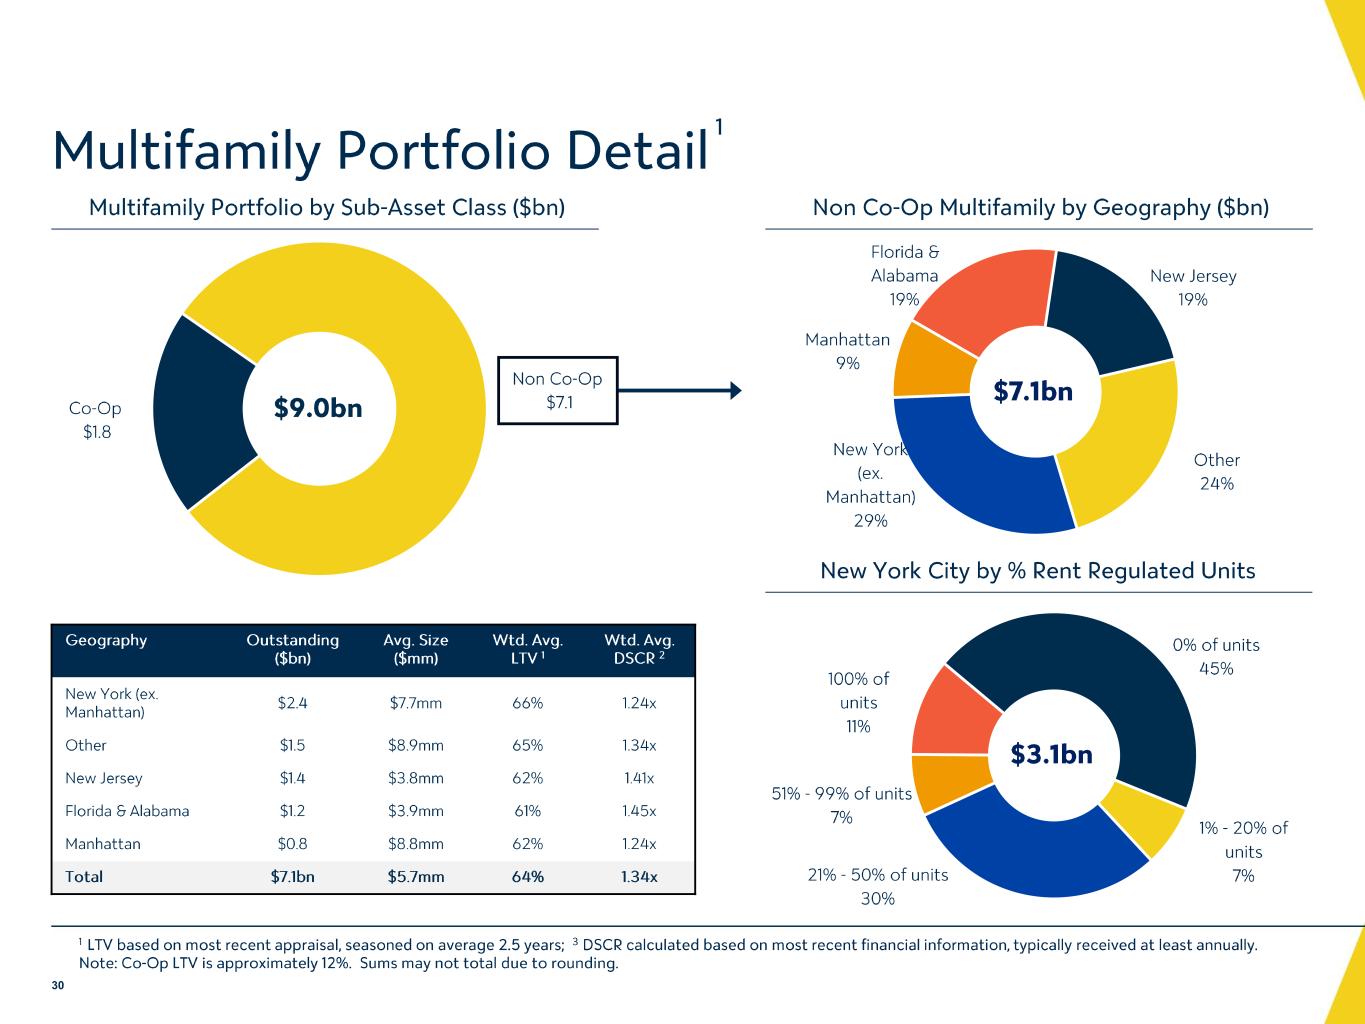
Yep, gotcha. Thank you. Within commercial real estate, again, the majority of our growth is coming from the owner-occupied portfolio. You did call out multifamily was higher this quarter, but you'll see construction was down. So a good amount of that multifamily growth was construction loans that went into PERM. So it's effectively neutral to your regulatory Cree ratio. From a spread perspective, obviously we're hearing a lot in the market about spread compression and we see volatility on a monthly basis. But in general, it's been fairly stable for us. Part of this, to your point, is CNI loan originations have picked up and our spreads are hanging in better there than in Cree, and so that loan origination growth in C&I has offset some spread compression in Cree. So we were conservative coming into the year, assuming that spreads were tighter. Nothing that we've seen is candidly out of line with the expectations that we had, so we feel good about that. But yeah, it remains competitive out there, particularly in Cree.
Operator
Thank you. One moment for the next question, please. And the next question is coming from the line of David Chiaveria of Jefferies. Please go ahead.
Frank
Analyst — Jefferies
Hi, everyone. This is Frank on for Dave. On asset repricing, loan yields came in, I believe, three basis points higher quarter over quarter, and you guys called out the new originations coming in at higher rates.
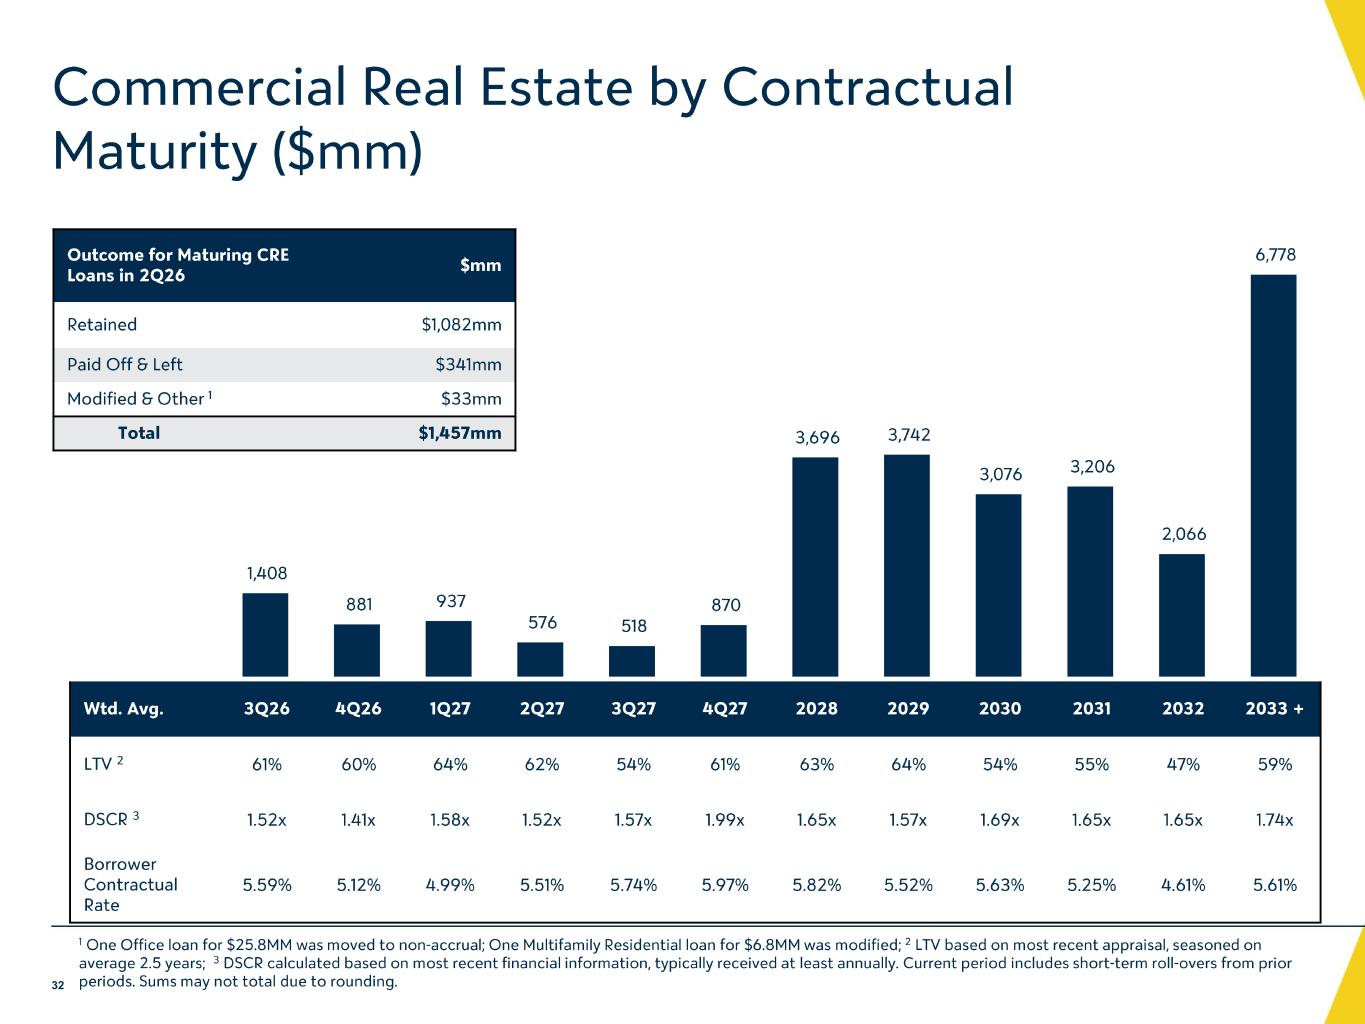
Can you just provide any color about how much fixed asset repricing that we still have going into the second half of the year and maybe anything into 2027 yep for sure so for the remainder of this year we have 1.4 billion dollars of fixed rate loans that are maturing at a rate of four point six seven percent so that's call it 150 basis points lower than where new originations are for the first half of next year there should be an additional just doing some quick map an additional $1 billion at a rate of about $475 that matures. So I think, you know, that that provides some of the tailwind that we're talking about on the loan side.
Frank
Analyst — Jefferies
Great. Thank you. And just last one for me on capital. How are you guys prioritizing capital between, I guess, loan growth buybacks and potential CRE concentration bring down from here? Thanks.
Yeah, I don't think there's been any change in the way we think about capital deployment. We continue to see, you know, our focus primarily is on well-funded, high-quality loan growth and secondarily on the buyback. So this quarter, obviously, we had more significant loan growth and we toggled back on the buyback. But next quarter, should loan growth lighten up a little bit, then we'd be more active on the buyback. So I think we've been pretty consistent with how we approach that. CET1 is right in the middle of our guidance range. There's no change to those expectations. And then I forget the last question.
Frank
Analyst — Jefferies
The CRE concentration.
Oh, CRE concentration, yeah. I mean, that's, you know, you've seen it come down consistently. I mean, this quarter I think is a very good example where it came down 12 percentage points. Nine percent, nine of those 12 percent was because of the excess sub-debt, but the remaining 3 percent was due to organic capital accretion. I mean, we still grew regulatory Cree by $100 million, and we're able to drive that ratio lower by effectively 3% on an organic basis. Great. Thank you.
Operator
Thank you. One moment, please, for the next question. And that will be coming from Anthony Ilion of J.P. Morgan. Please go ahead.
This is Mike on for Tony.
I'll start on credit quality. You guys saw some migration in and out of the 30- to 59-day bucket in non-accurals. You attributed that to some CRE loan.
Could you, I mean, share a little bit more on that and sort of latest thoughts on how you're feeling about credit quality overall until the second half of the year?
Absolutely, Mike. This is Mark Sager again. For the migration into non-accrual, two of the three loans that moved in to that category today are appraised extremely strongly, we're covered by value, a unique scenario, one office portfolio where we could not come to terms with a continuation and are looking to exit. So that's matured. We're continuing to receive payments on that, and it's well collateralized. The other loan has been wavering between hovering at the 60-day bucket. It did go beyond 90 days. We moved it into non-accrual. They did make a payment and are running closer to 60 days on that one as well. Very well collateralized. We're not concerned about the value and continue to expect to get payments on that. I point out in our non-accrual portfolio, we continue to have approximately 50% of our non-accruals continuing to pay interest. So we really look at the overall trends and the large reduction in criticize as more of an indication of where the portfolio is going, and we're seeing really solid trends there.
And then on the ACL ratio, it fell a few basis points quarter over quarter, but you guys reiterated the provision expense outlook.
Do you still think you'd be able to get back up to the 120 by the end of this year?
I don't think we have a hard and fast target of 120. I think it's well within a range that we're very comfortable with. If you look on a year-over-year basis, it's down two basis points, the allowance coverage, despite a 15-percentage point reduction in our criticized and classified. And so as criticizing classified continues to come down, it would imply a lower ACL. It's then offset by the C&I loan growth that we're putting on, which is obviously carrying a higher allowance with it. So I think everything's playing out kind of as we expect. You know, we say general stability each quarter, but we always note that it'll move around a couple basis points just given the economic assumptions in the model and other things. But I think generally this has been pretty stable now for a long period of time. Got it. Thanks, guys.
And then how much of the $5 billion in brokered do you think you can or do you want to replace with core? I'm assuming there's some residual that's there on an ongoing basis. I'm curious what that number is.
Yeah. On the deposit cost, I mean, we continue to – I think the easiest way to think about it is the level of competition has the potential impact of raising core deposit costs. However, we have the offset from the brokerage. When we look at that in aggregate, I mean, our model currently has, call it, four or five basis points of deposit cost expansion in the next two quarters. And I say that noting that in aggregate, we think margin will be improving five to seven basis points for each of the next two quarters as well. So you're getting enough offsets on the earning asset side. Within brokered, I don't think it's ever going to get to zero. I mean, brokered deposits serve a very important purpose from an interest rate risk management perspective. But as we've said, our goal is to get loans to non-brokered to 100%. And I think we can certainly do that. I mean, there have been periods when you look back over the last eight or ten quarters where it's been very chunky in terms of the brokered reduction. So, again, the core deposit growth has been very consistent. I think it's something we're very proud of. I think our ability to grow core deposits without relying solely on rate has been differentiated. And we'll continue to make good progress there. But to your point, I don't think brokered goes to zero. I think there's a reasonable level where it's helping to support our interest rate risk management strategy and securities.
Yep. Yep. Okay. And then you touched on a little bit, but just thinking about the NIM longer term, obviously we're in this period now where there's a lot of kind of fixed asset repricing benefits. But if I look back to like 2023 when loan yields started to spike for the industry, assuming some of that rolls off in 2028, I'm just curious, you know, do you start to see from your model the NIM kind of level off as we exit 27 and into 2028 because of that? I'm curious. I'm curious just kind of your longer term NIM thoughts, I guess.
Yeah, I mean, I'll get you through to the end of 2027, which is we expect continued expansion, you know, between now and the end of 27. It's not like it peters out at any point during the next year. And I would expect that there is continued tailwinds beyond 2027. I think the thing to keep in mind for us is given our CRE concentration entering 23 and 24, we weren't originating a lot of fixed rate CRE loans when rates were highest. And so for that reason, we don't have kind of what I would call the repricing headwind of higher fixed rate loans coming off. The fixed rate loans that we have coming off remain pretty low yielding. And so I think A, that gives us an opportunity, and B, helps us to kind of like others may have seen more volatility in prepayment activity. We haven't really seen that because, again, we weren't putting on a lot of Cree loans when rates were highest. Matt, I would just add to that.
I think we've made a lot of structural changes across the organization since then as well. As you think about the investments that we've made within the Treasury Solution product that we have, the C&I teams that we brought in, the de-emphasis of some of the commercial real estate assets, which obviously have a lower relationship and compensating balance associated with it. And so I think Travis speaks to, you know, sort of what the model lays out. You know, I think we've made a lot of progress as to how we think about what value is going to look like in 28 versus maybe what it looked like in 23. And the structural funding advantages we think will definitely have a lot of tailwind associated with it as well.
Ira, maybe while I got you, you know, we talked about that mid-teens ROTC outlook. When do you think you can hit that based on what you know today?
I think we've given guidance towards, you know, beginning of 28, I think, is sort of where we said some of this ROTC to 15% was going to be. I still think we see a lot of tailwind and where the margin is going. I know we talked about the deposit pressure that we're seeing from an industry perspective, but we feel pretty confident about where that is and a lot of positive operating leverage is going to come as we think about where the expenses are headed across the organization as well. I think the guidance that we've given in my mind really hasn't changed at this point. I appreciate it. I'll leave it there.
Operator
Thank you. One moment for the next question. Next question will be coming from the line of Janet Leigh of TD Cowan. Please go ahead.
Speaker 5
On expenses, can we assume that the professional and legal fees are trending down in the second half of 26 and through 2027? I believe this line item has been elevated because of the transformation efforts that have been ongoing for the past few years. And also, you're talking up a lot of AI benefits and the positive impact on efficiency ratio and positive operating leverage, plus your expectations on NIM expansions through 2027. How should we think about how that's impacting the efficiency ratio target? You've talked about sub-50%-ish by the end of 26. How should we think about it beyond 2026, if you could comment on it?
Yeah, maybe I'll start with the second one. There's no change to our expectation that the efficiency ratio should be 50% or lower as we exit 2026. And I think Ira made a comment that industry-wide, AI, longer term, should give people a potential opportunity to enhance their efficiency ratios by, call it, 500 basis points. And I don't think we feel any differently at Valley. So if you're going to exit 26 at or below 50%, I think there's an additional opportunity to continue to drive it lower. I mean, for us, a lot of the revenue tailwinds that we're benefiting from in 26 continue into 27, as we've talked about. So our expectation is our efficiency ratio continues to drive lower. I think there's a good opportunity to do that as we continue to drive net interest income and fee income growth and keep expense growth, you know, much lower than the pace of revenue. So I think that plays out. From an expense perspective, you asked about the professional fee line. I agree with your comment. I think this will be, you know, close to the peak or the peak in professional fees as we kind of now begin to off-board some of the third parties that have been here to help us from a transformation perspective. So I agree with your comment.
Speaker 5
Okay, thanks for all the color. And sorry if I missed, but are the new deposits that are coming into the bank on the core side, including NIB, are they coming in around 2.5%, which is, I believe, what was quoted about a quarter or two ago, or maybe slightly higher than that, or maybe you could give an updated number?
Yeah, for sure. So I'm going to give a lot of numbers here, so I apologize, and hopefully it plays out right in the transcript. But in the first quarter, in aggregate, we originated $1.4 billion of new core deposits at a rate of 2.55%. This quarter, we originated $2.5 billion in aggregate at a rate of 2.71%. So to your point, it's slightly higher. However, this quarter's originations include about $600 million of retail CD promos at a rate of 4%. If you were to exclude CDs from both quarters, we originated in the first quarter $800 million at 1.78%, and in the second quarter $1.3 billion at 1.66%. So exclusive of CDs, we originated $500 million of more core deposits at a rate that was 12 basis points lower than the first quarter.
Operator
Thank you. And we do have a follow-up question coming from the line of David Smith of Trois. Please go ahead.
Thanks for letting me come back in. I just wanted to clarify. I don't know if you had mentioned the Fed interest rate assumptions for the NII guide. Could you confirm those, please? And apologies if I just missed it.
Yeah, no worries. At this point, we have one hike assumed for 2026. And I think another half-hike, as bizarre as that sounds, for 2027. We've talked about, David, being effectively neutral to the front end of the curve. And so that continues to be our balance sheet positioning. Effectively, our floating rate loans, which is about 40% of our loan portfolio, balances the amount of deposits when you adjust for beta that would also float on the front end. So whether there's two cuts or two hikes or no hikes or cuts, doesn't materially change our NII outlook. We're more exposed to the belly of the curve, and we've seen some good expansion there since the beginning of the year.
And to remind us, is that on a constant size balance sheet, or does that include a presumed slowdown and balance sheet growth if rates are a little bit higher?
Well, as we do more C&I, the amount of loans that float on the front end of the curve would increase. At the same time, that's effectively where our deposit growth is coming as well. So the statement is made with our balance sheet today, but given the growth that we're seeing, I think it would be consistent going forward. To the degree there would be any change in our sensitivities, we would be willing to use hedges to make sure that we're keeping our sensitivity within ranges that we're highly comfortable with.
Oh, no, I meant more along the lines that, like, higher rates can weigh on, like, loan growth, for example.
Oh, gotcha. No, I think we're far away from that. I mean, we've done, you know, we've added a lot of talent. We're in the right markets. We're in the right specialty verticals to continue to grow. You know, I don't think that we expect that it would materially change our loan growth outlook, you know, with some reasonable expansion in longer-term rates.
Operator
And that does conclude the Q&A session for today. I would like to go ahead and turn the call back over to Ira Robbins for closing remarks. The floor is yours.
I just want to once again thank everyone for taking the time to join us this quarter. Obviously, we're very excited about the results and what we're looking for for the rest of the year and looking forward to talk to you again after the third. Thank you.
Operator
This concludes today's program and thank you for joining. You may now disconnect.