Operator
Good day and thank you for standing by. Welcome to the Q2 2025 Valley National Bancorp Earnings Conference Call. At this time, all participants are in a listen-only mode. After the speaker's presentation, there will be a question and answer session. To ask a question during this session, you will need to press star 11 on your telephone. You will then hear an automated message advising you. Your hand is raised. To withdraw your question, please press star 11 again. Please be advised that today's conference is being recorded. I would now like to hand the conference over to your speaker today, Travis Lance. Please go ahead. Good morning, and welcome to Valley's
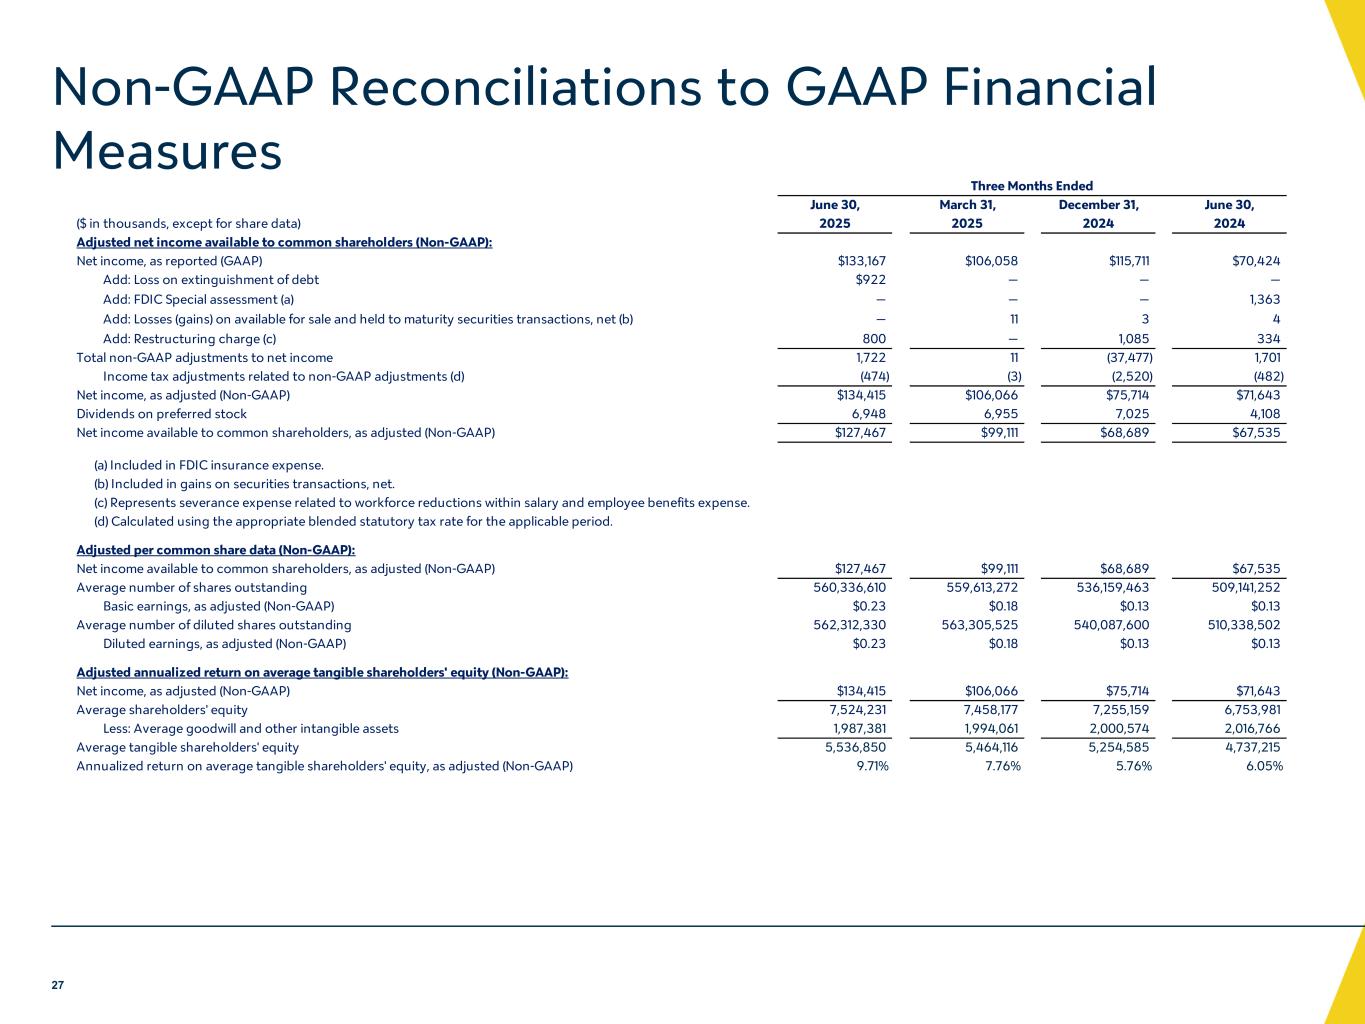
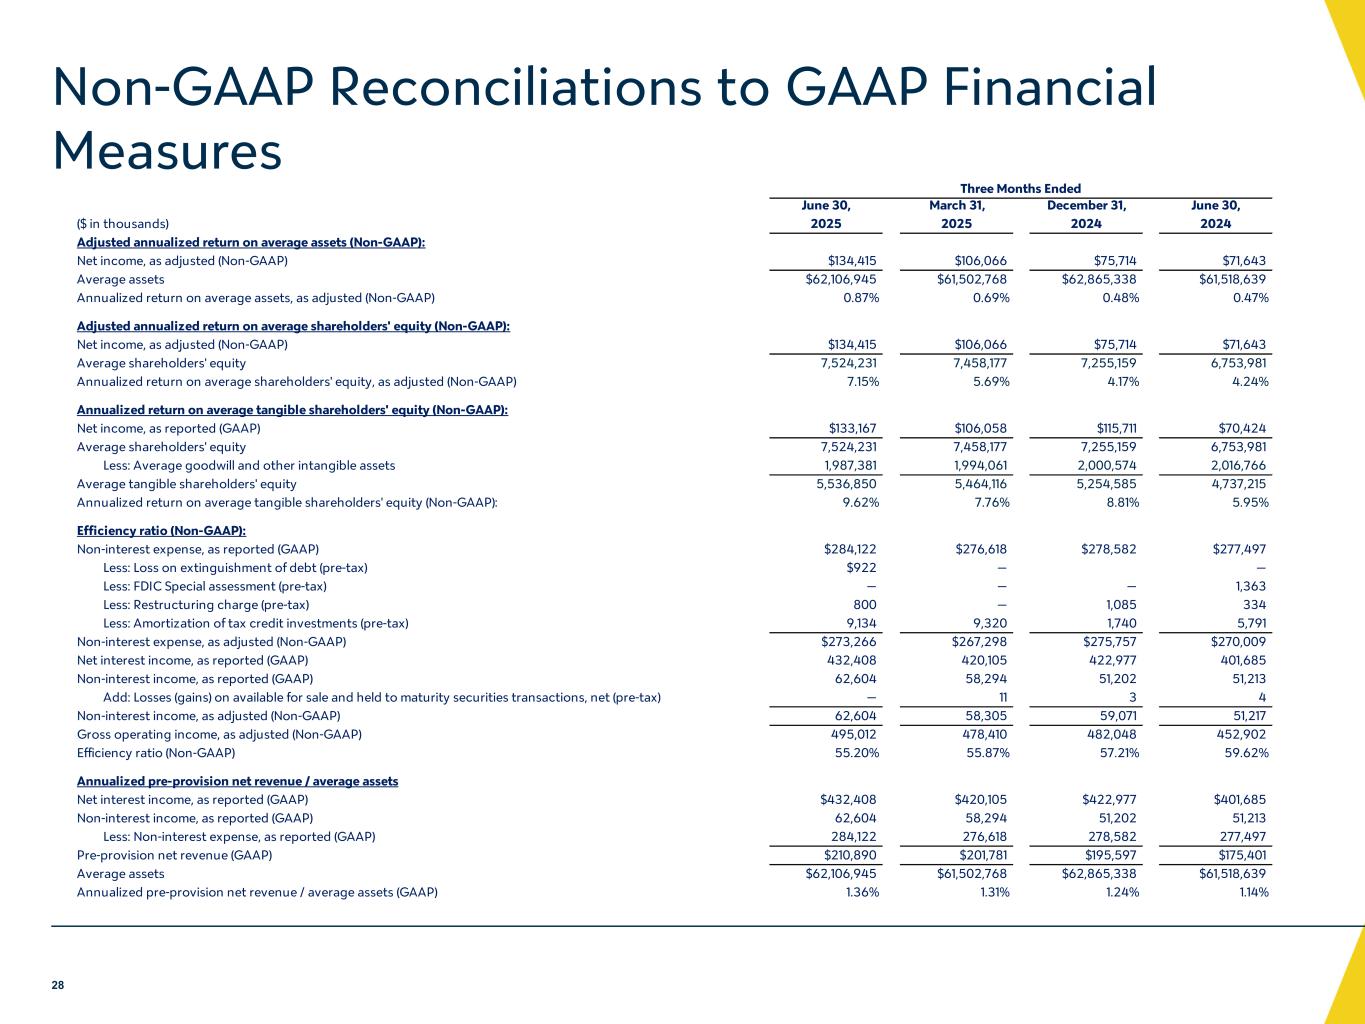
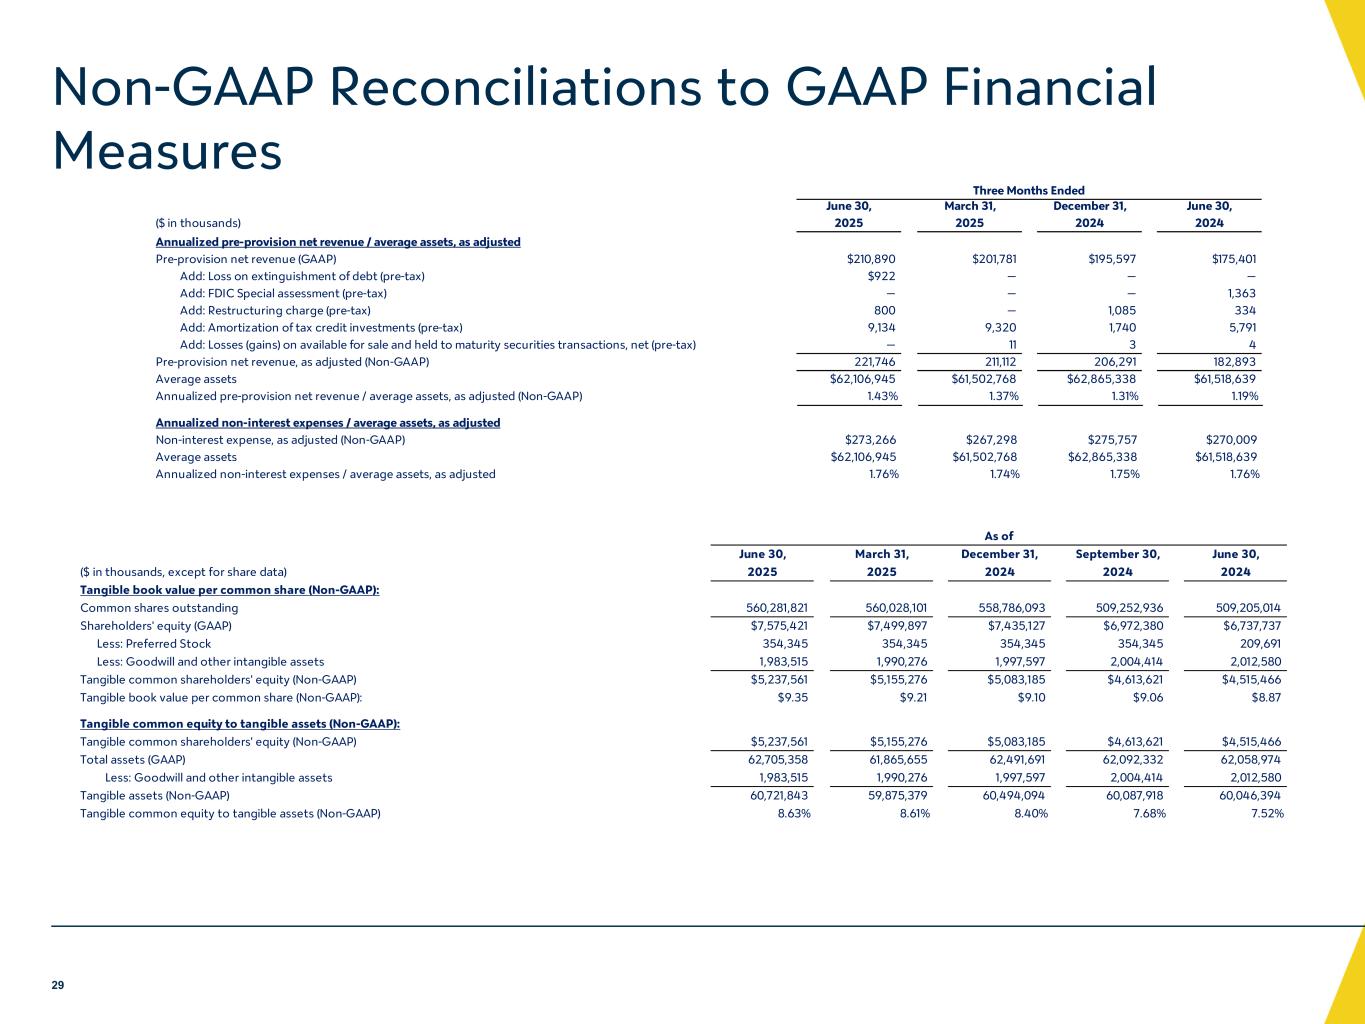
second quarter 2025 earnings conference call. I am joined today by CEO Ira Robbins and Chief Credit Officer Mark Sager. Before we begin, I would like to make everyone aware that our quarterly earnings release and supporting documents can be found on our company website at valley.com. When discussing our results, we refer to non-GAAP measures which exclude certain items from reported results. Please refer to today's earnings release for reconciliations of these non-GAAP measures. Additionally, I would like to highlight slide two of our earnings presentation and remind you that comments made during this call may contain forward-looking statements relating to Valley National Bank Corp. and the banking industry. Valley encourages all participants to refer to our SEC filings, including those found on forms 8K, 10Q, and 10K, for a complete discussion of forward-looking statements and the factors that could cause actual results to differ from those statements. With that, I'll turn the call over to Ira Robbins. Thank you, Travis. During the second
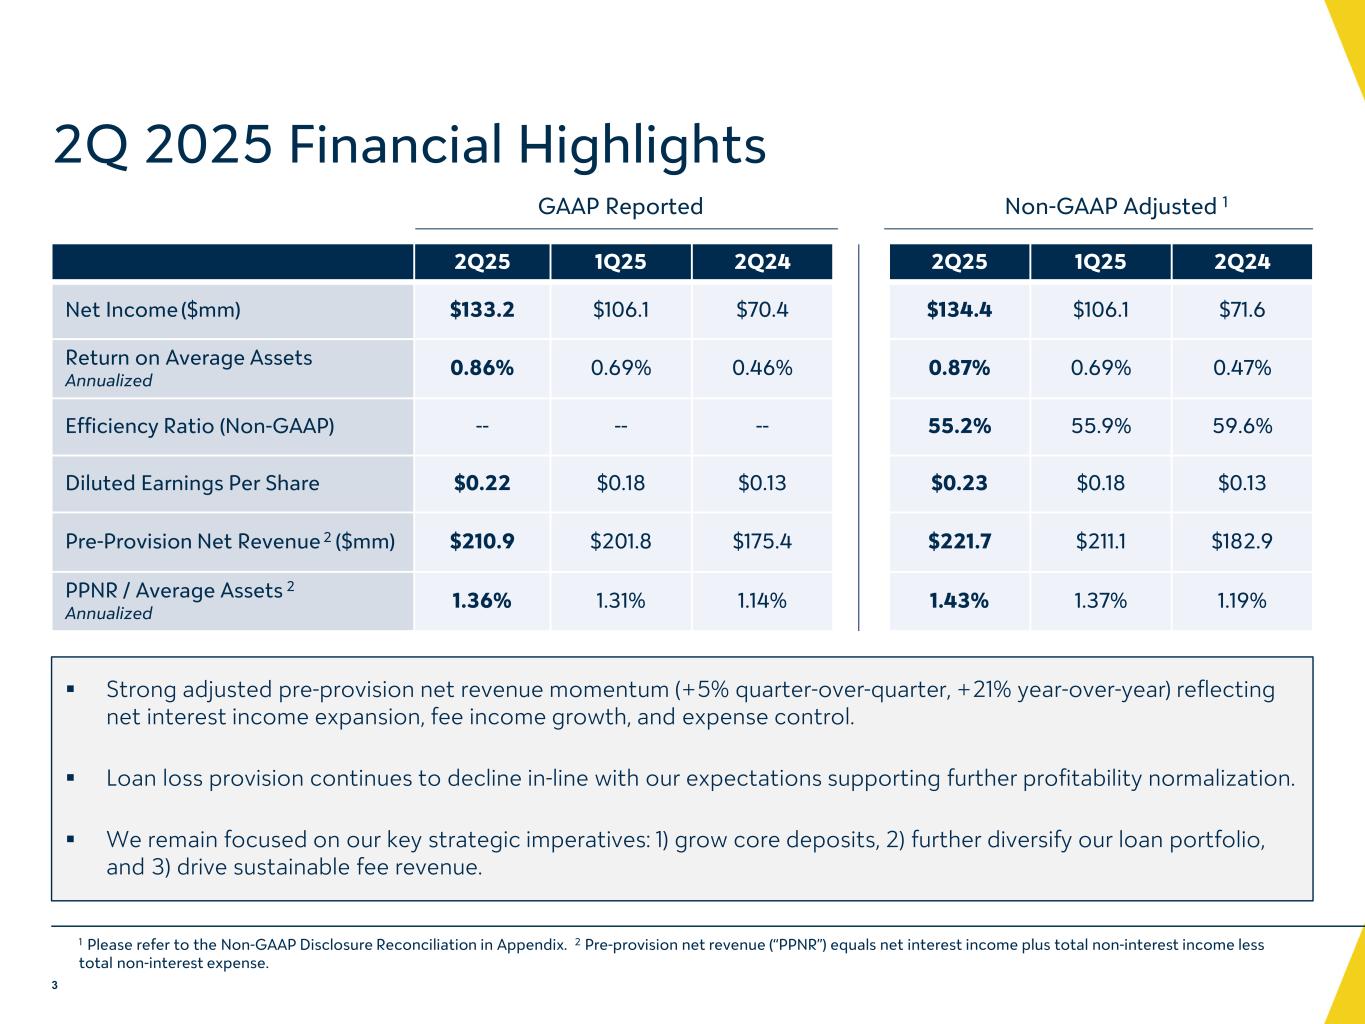
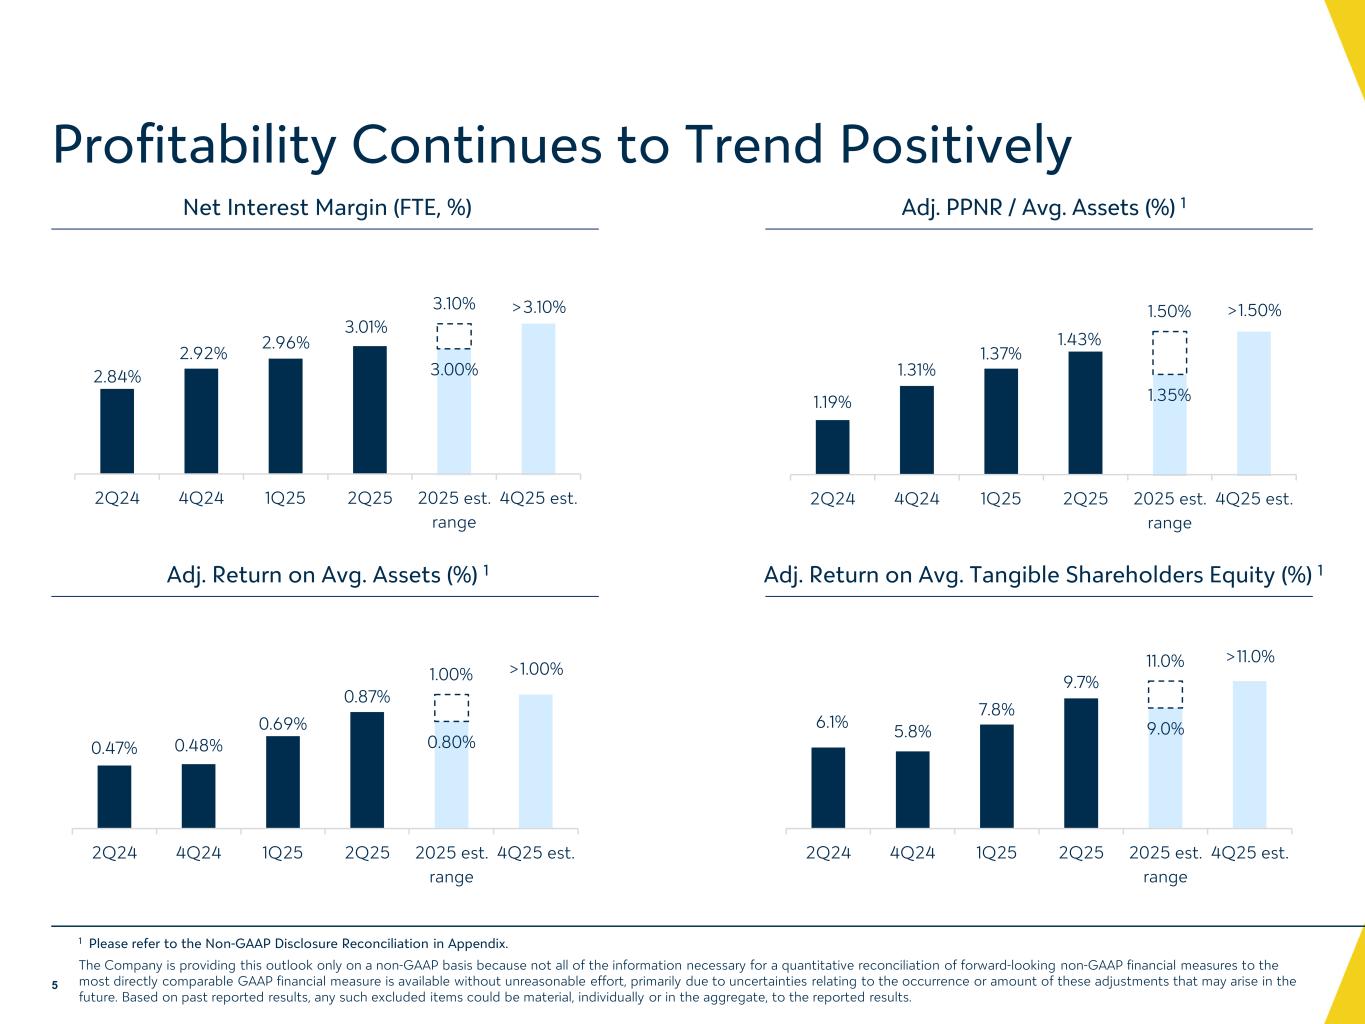
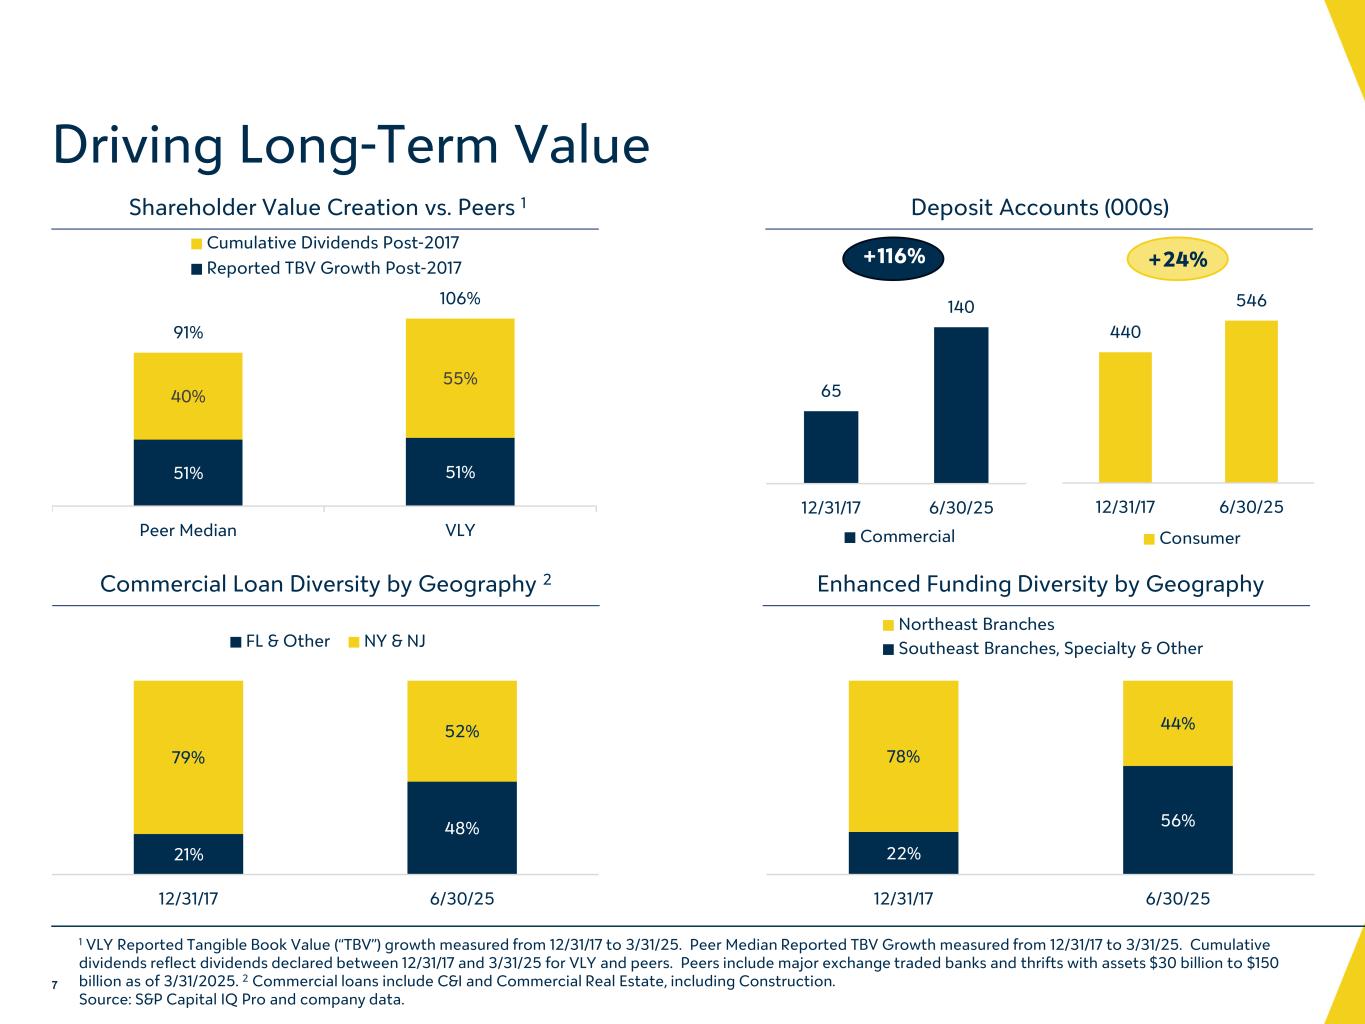
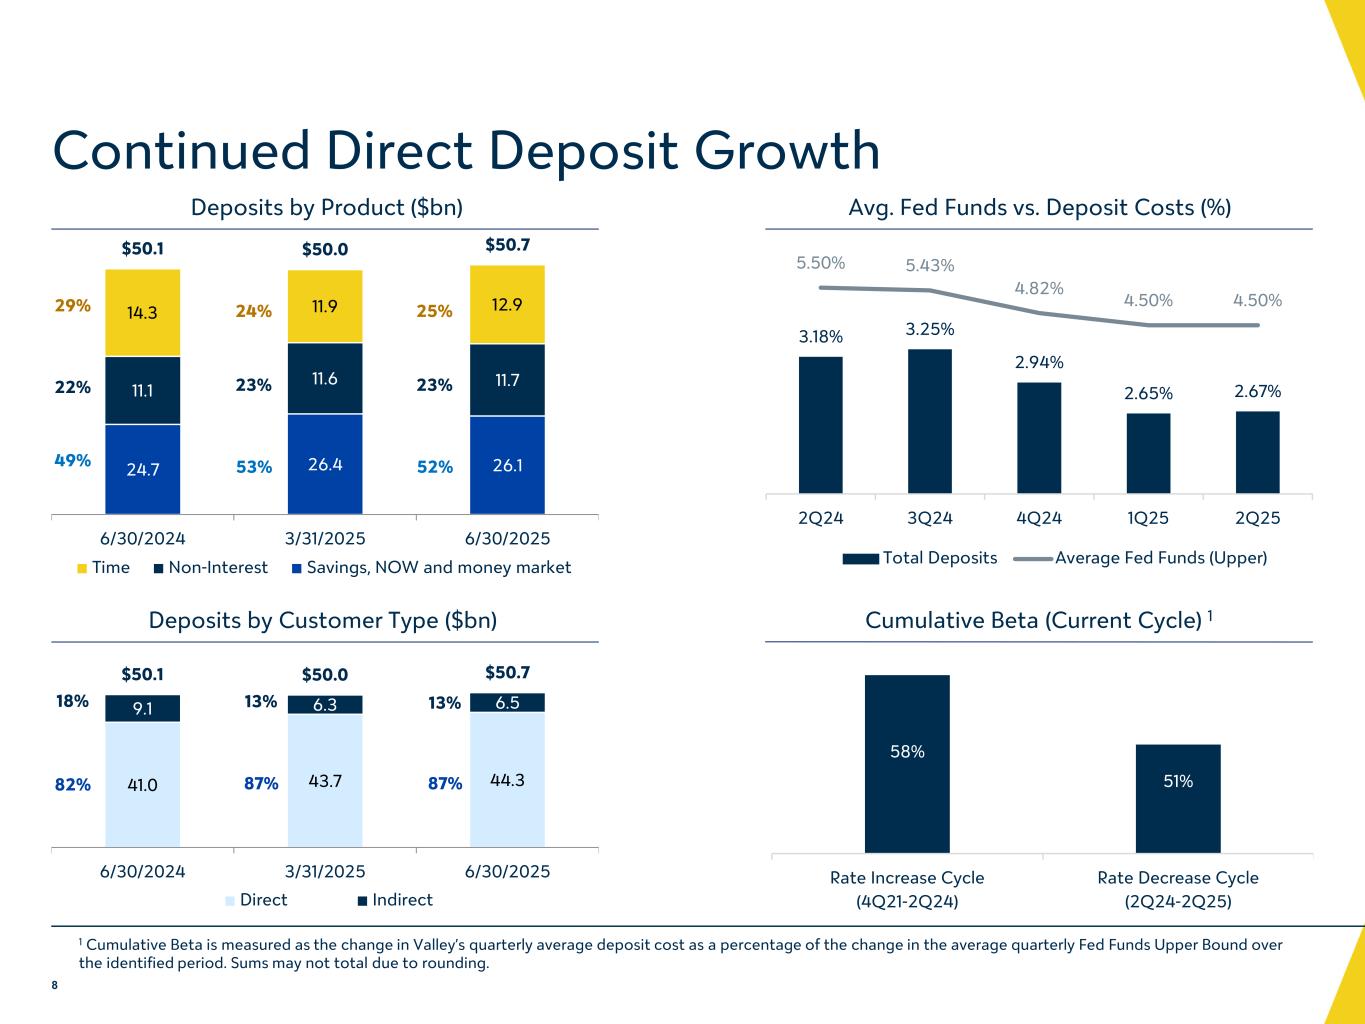
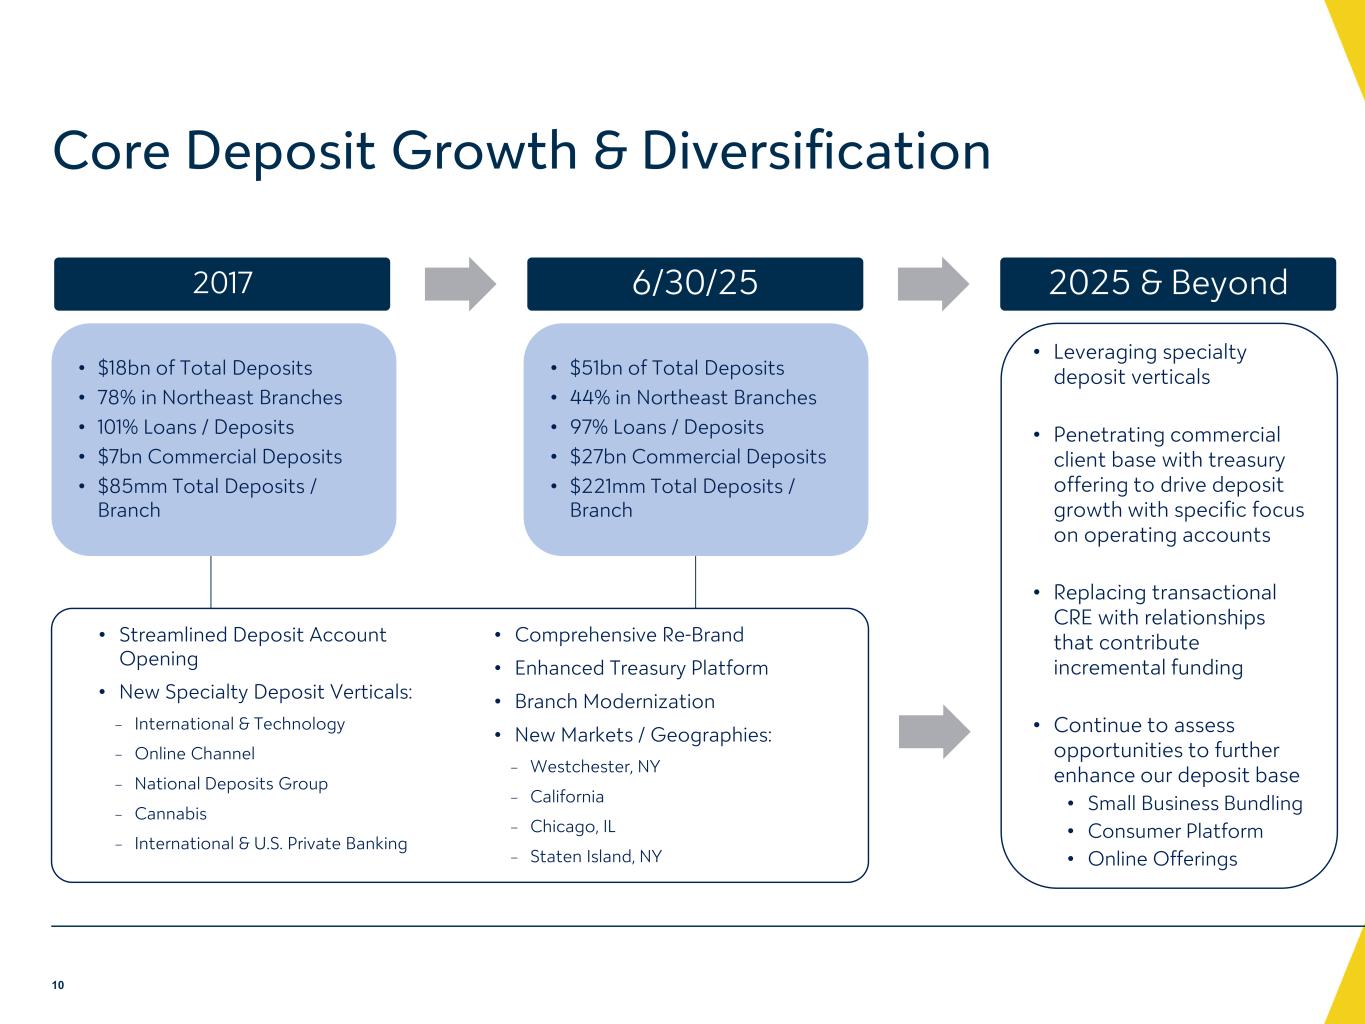
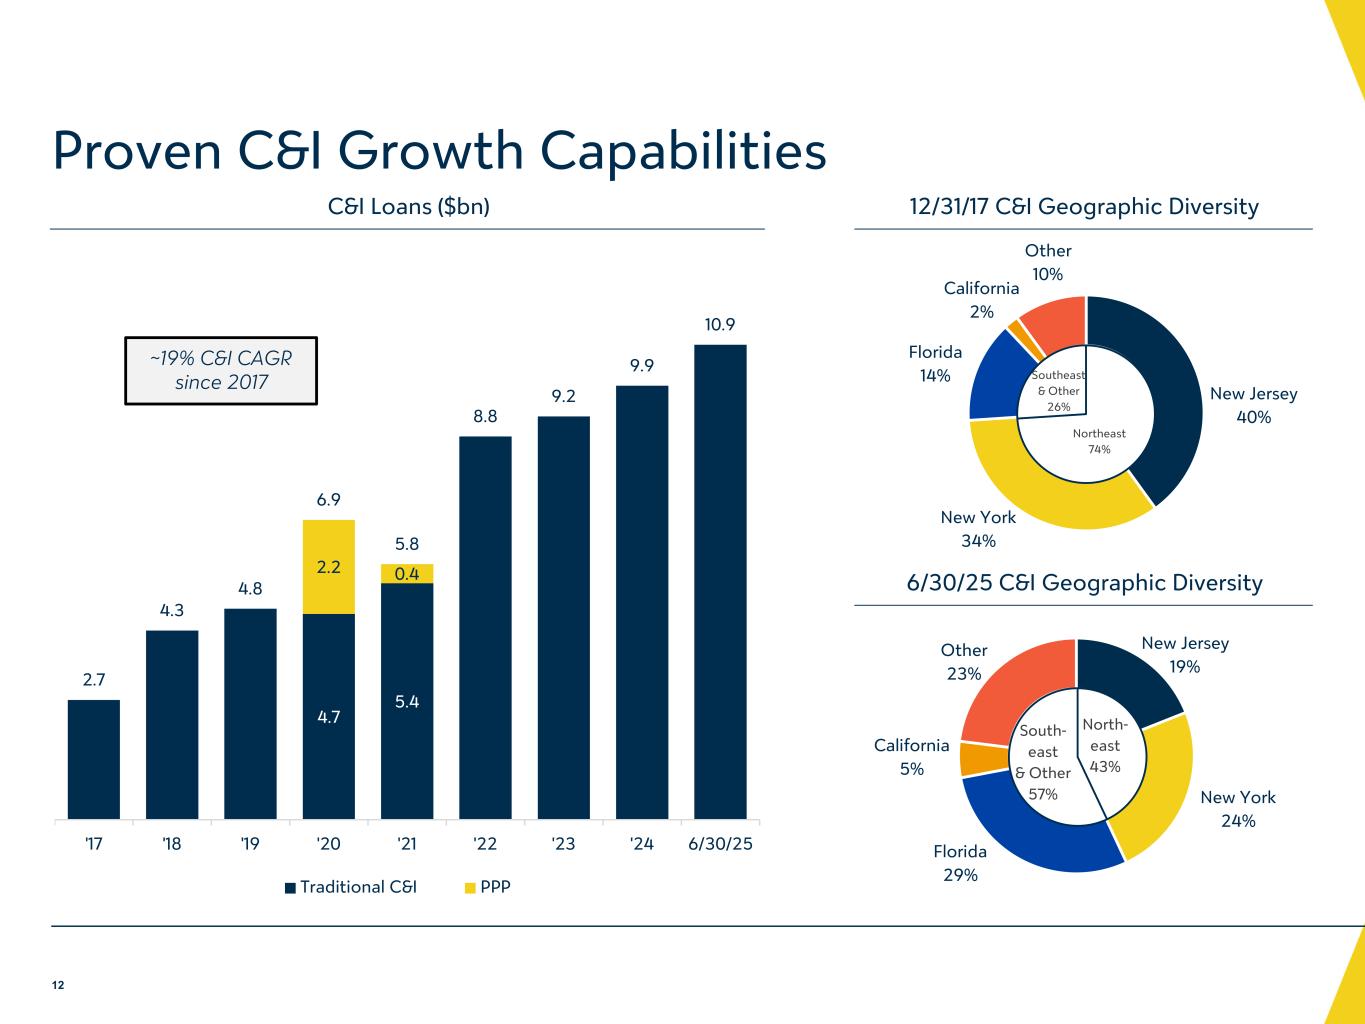
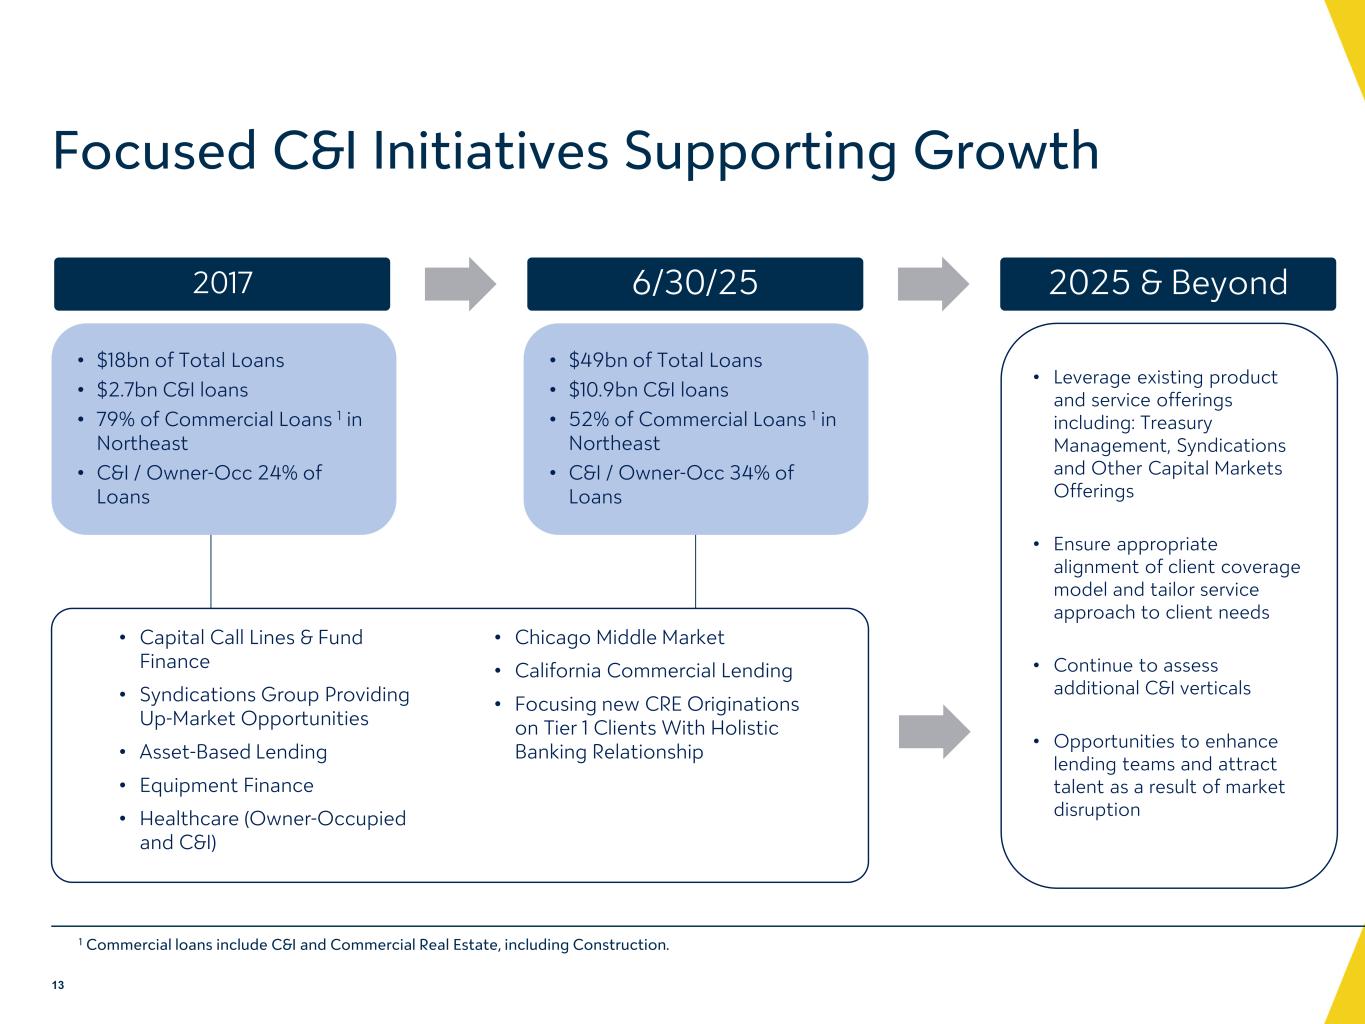
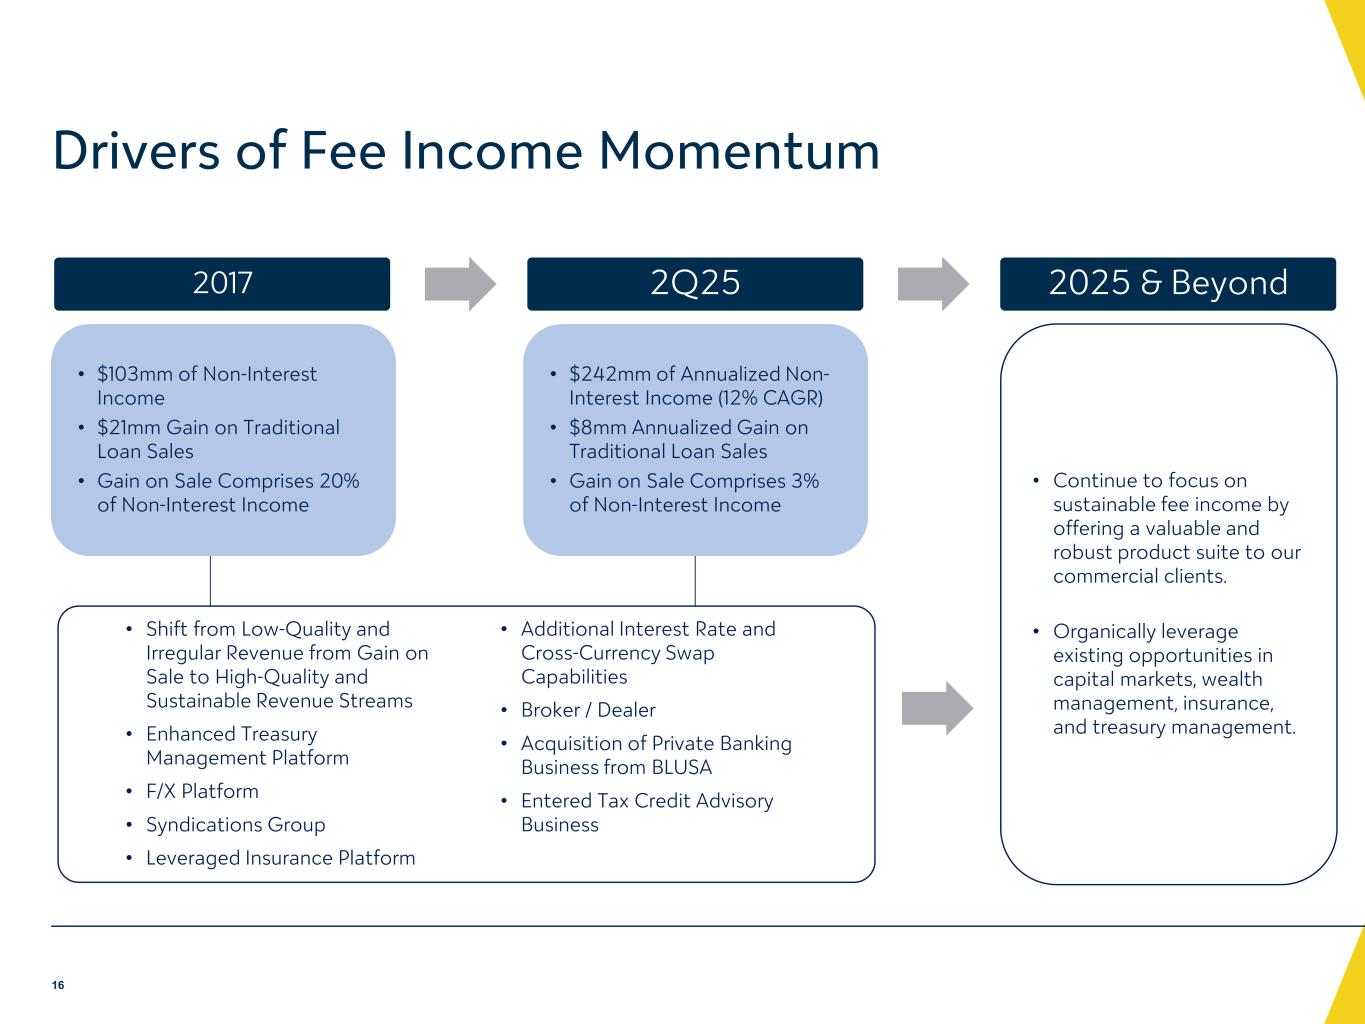
quarter of 2025, we reported net income of $133 million, or $0.22 per diluted share, and adjusted net income of $134 million, or $0.23 per share. This compares to $106 million and $0.18 on both a reported and adjusted basis a quarter ago. The sequential growth in adjusted earnings reflect solid momentum in both net interest income and non-interest income and a lower loan loss provision. Our profitability ratios, including return on average assets and return on tangible shareholders' equity, continue to trend higher and are on track to meet the full-year guidance that we outlined this past January. Beyond the numbers, I am extremely proud of the consistency of our execution across the strategic imperatives that defined VALI's long-term value proposition. This quarter's presentation supplements our traditional financial information with specific qualitative detail on the underlying initiatives that have contributed to this progress. And this morning, I would like to take some time to provide additional detail around those imperatives. First, deposit growth and funding transformation. Over the past 12 months, we have added over 105,000 new deposit accounts, which has contributed to approximately 8% core deposit growth. As a result, our reliance on indirect deposits has declined from 18% down to 13%. This has been achieved alongside a 51 basis point reduction in our average cost of deposits for the second quarter of 2025, as compared to the same period of 2024. Since 2017, we have increased commercial deposit accounts at an average annual rate of 11% per year. These results are not coincidental. They are the product of deliberate investments in three channels, talent and technology, targeted market penetration, and the expansion of our specialty verticals. Our ability to attract and retain relationship-based deposits in a competitive environment is a valuable differentiator, and we remain laser-focused on sustaining this momentum. Second, commercial loan diversification. Since 2017, we have grown our C&I portfolio at a 19% compound annual rate, including nearly 15% growth over the last 12 months. This success reflects disciplined, relationship-driven growth in the most dynamic commercial markets in the country. Our geographic footprint, combined with certain specially nationwide verticals like healthcare and fund finance, gives us the flexibility to be selective and the scale to be impactful. We have specifically targeted these nationwide business lines, given their attractive risk-adjusted return profiles. Valley has been active in the healthcare C&I space for nearly 20 years, and we have never, I'll repeat never, taken a loss on any Valley-originated healthcare C&I loans over this 20-year period. While we have historically been active in the capital call space, our efforts have increased as we continue to leverage our technology banking business. Similar to our healthcare experience, we have never taken a loss on a capital call loan. Third, building durable, high-quality fee income. Non-interest income has grown at a 12% annual rate since 2017, more than double the pace of our peers. And importantly, the composition of that income has improved dramatically. Volatile gain on residential loan sale revenue represented just 3% of total non-interest income in the second quarter of 2025, down from 20% in 2017. We're focusing our growth efforts on our capital markets, treasury management, and tax credit advisory offerings. These are scalable, client-centric businesses that deepen relationships and enhance our earnings resilience. Taken together, these strategic imperatives continue to transform Valley into a more diversified, efficient, and valuable institution. We operate in markets that offer extraordinary growth potential, and we build a platform that is increasingly well-positioned to take advantage of these opportunities. Our balance sheet is well-positioned, our profitability metrics are improving, and our near-term priorities remain aligned with our long-term vision. And while these strategic initiatives have significantly transformed Valley's value proposition, I'm pleased we have achieved this success without denigrating Valley's financial performance. As reflected on slide 7, we have grown cumulative tangible book value with dividends over 105% during my tenure as CEO. This is approximately 15% greater than the peer medium. That said, we recognize that there remains a meaningful disconnect between the quality of our franchise and the valuation of our shares. But we believe that continued execution of our strategy will close that gap over time. With that, I would turn the call back to Travis to discuss the quarter's financial highlights. After Travis concludes his remarks, Mark, Travis, and I will be available for your questions.
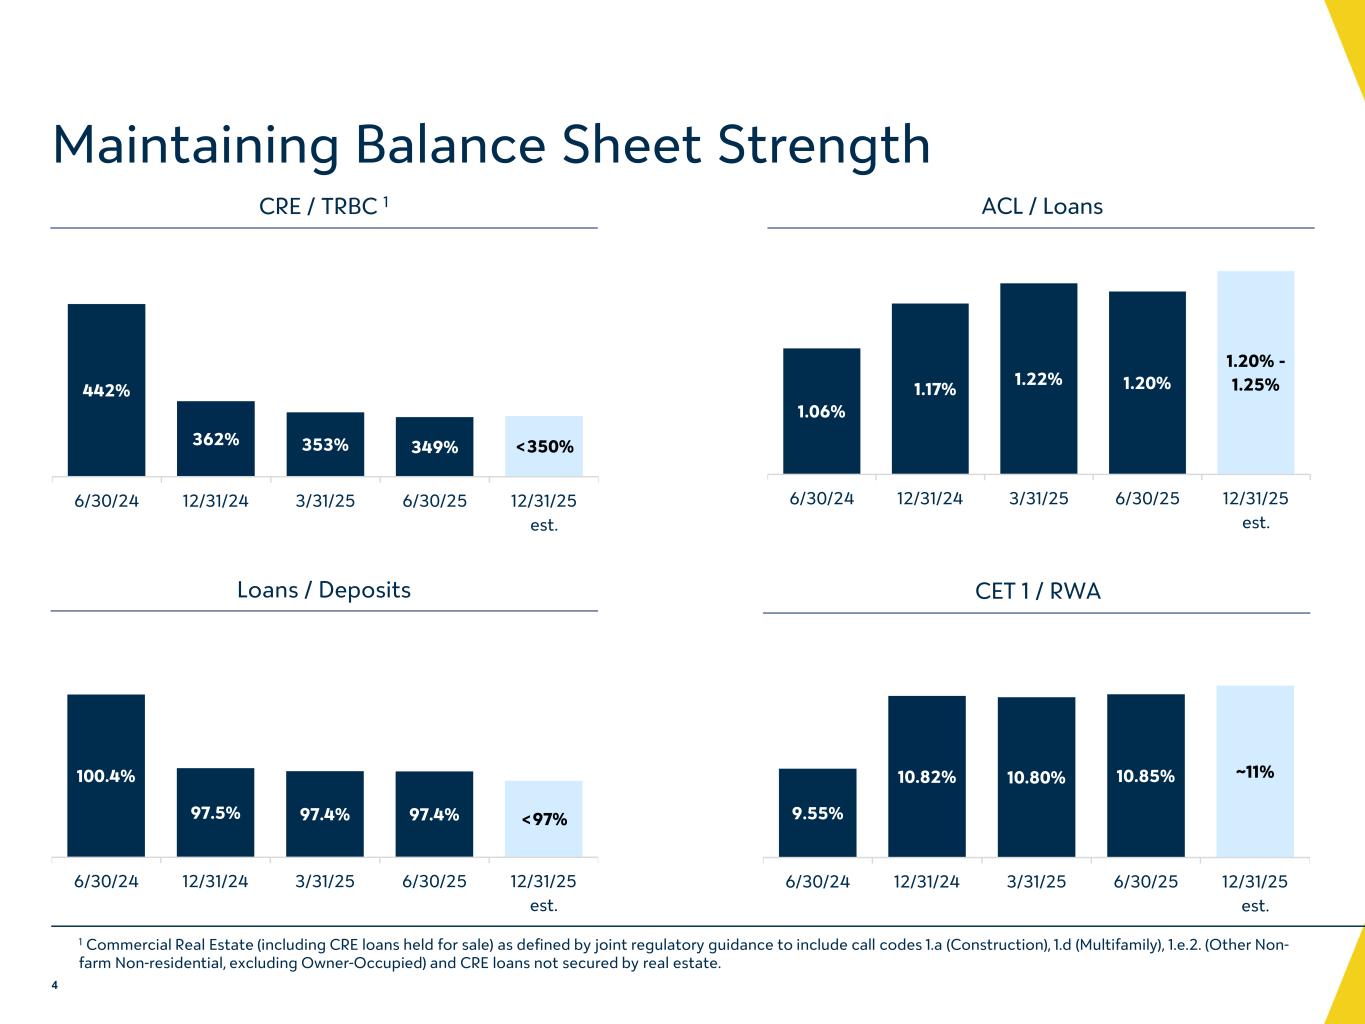
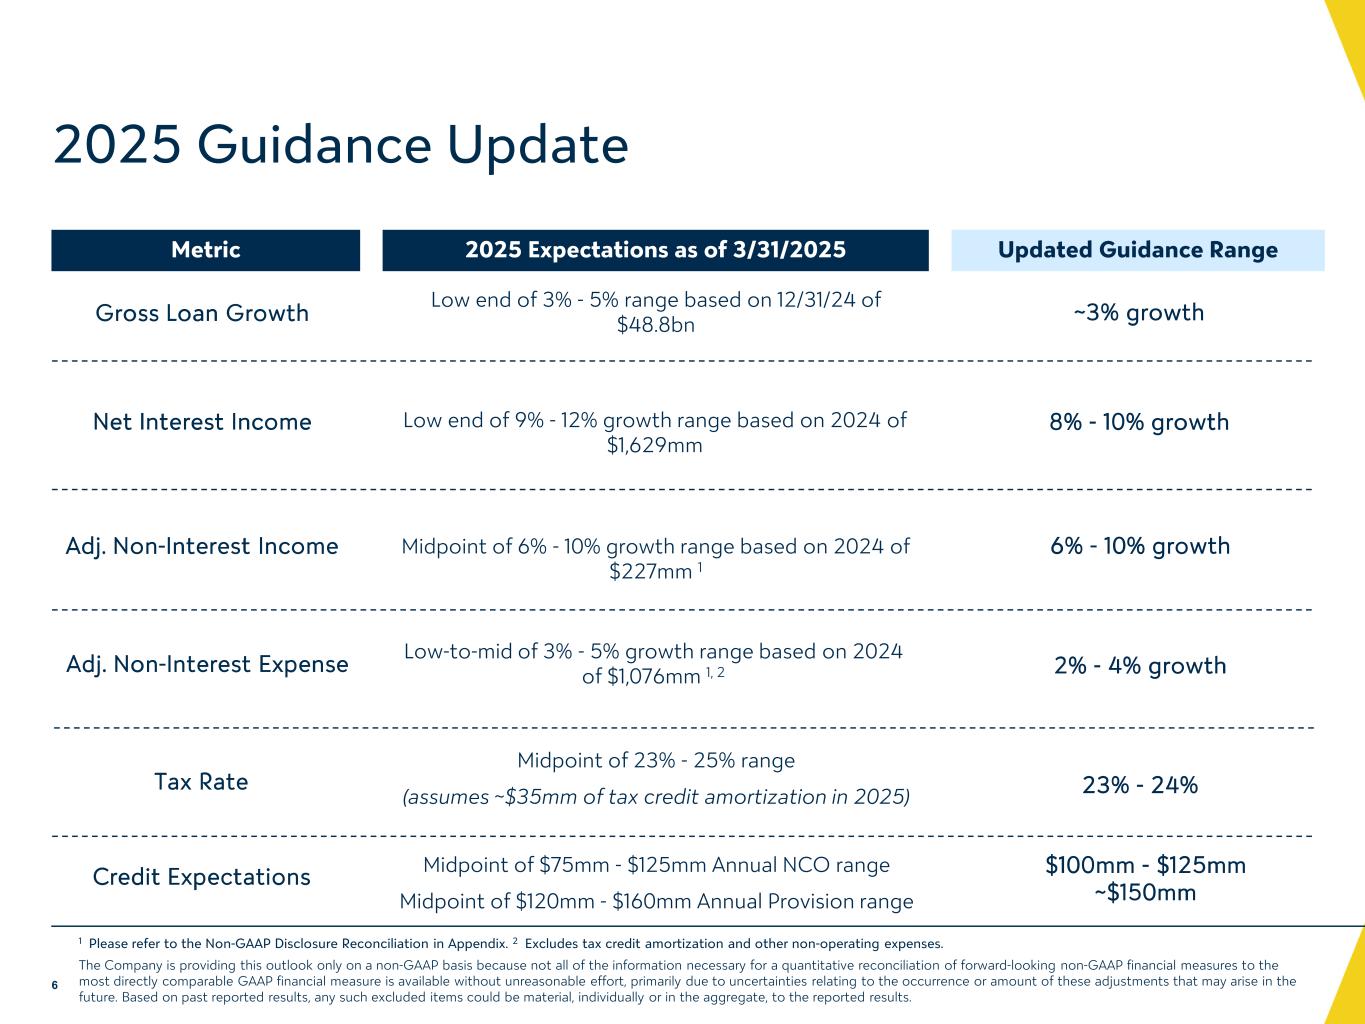
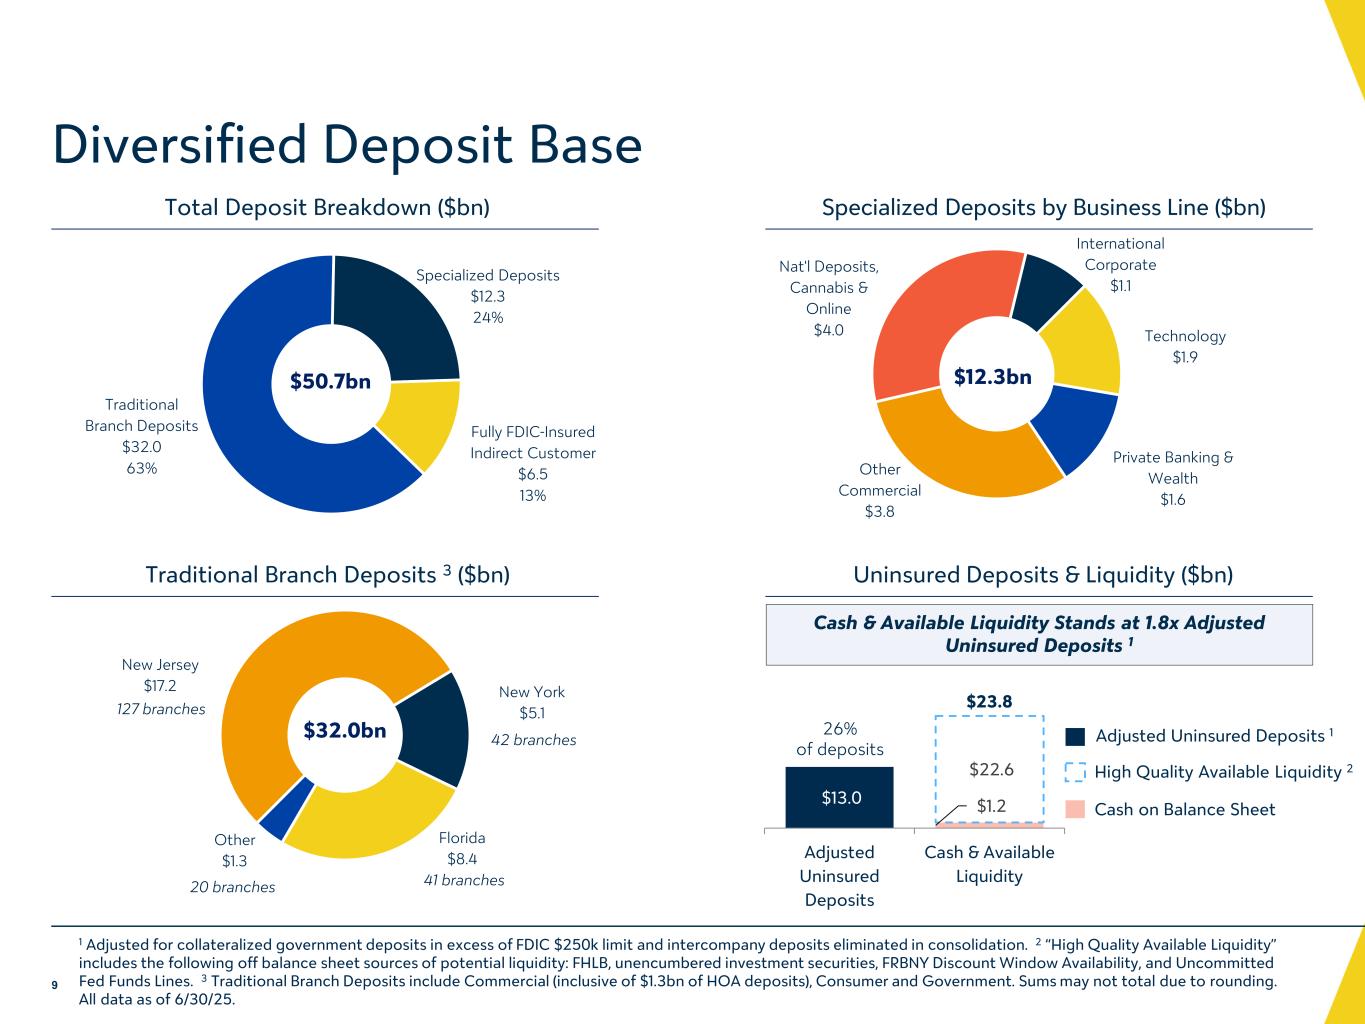
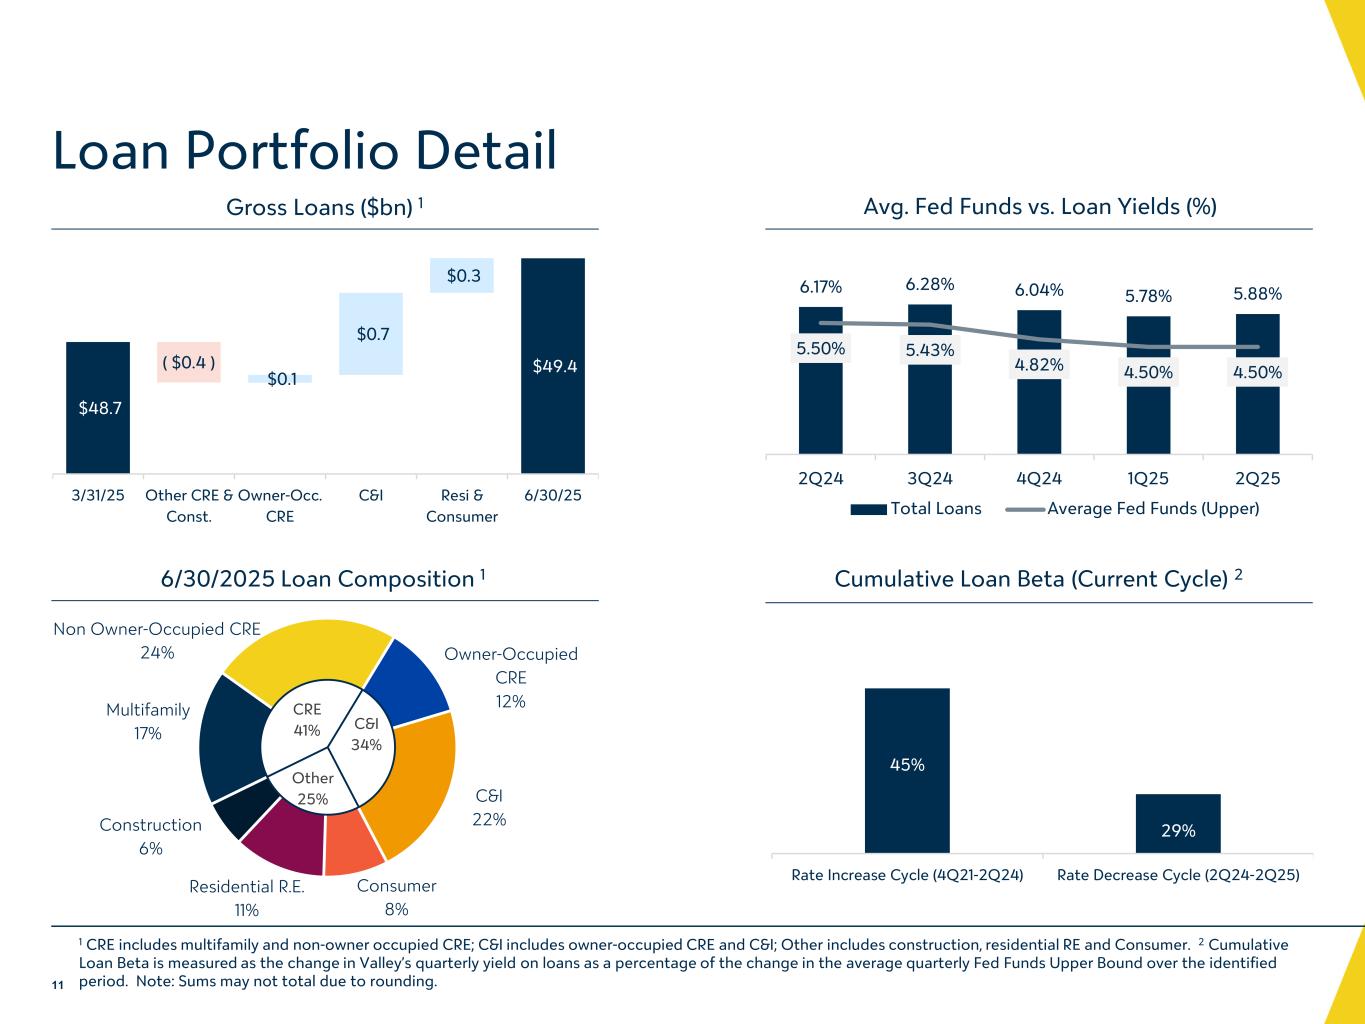
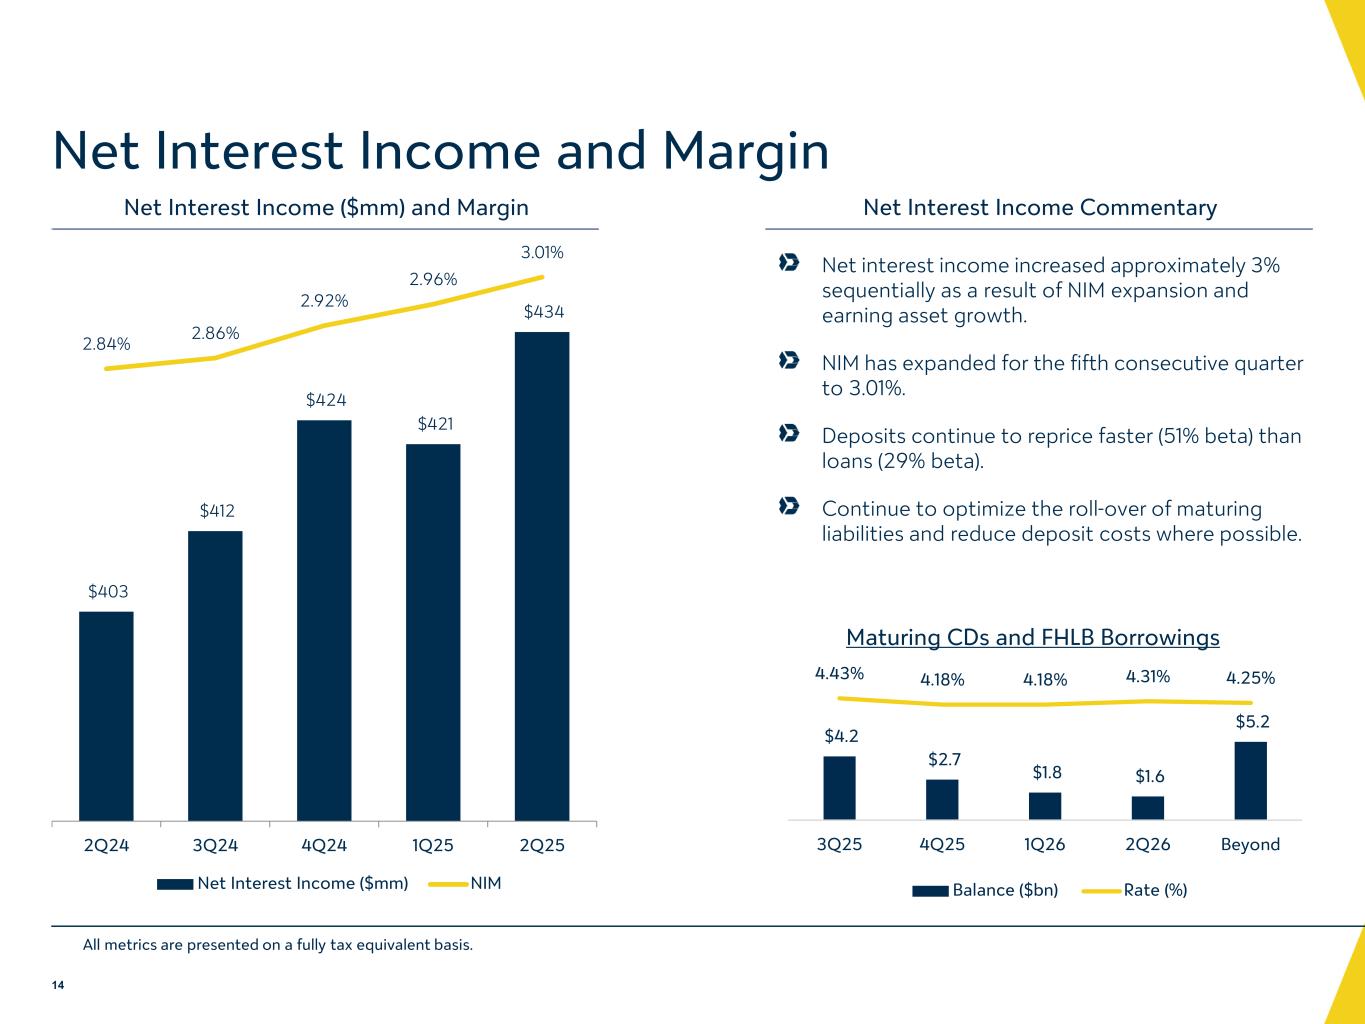
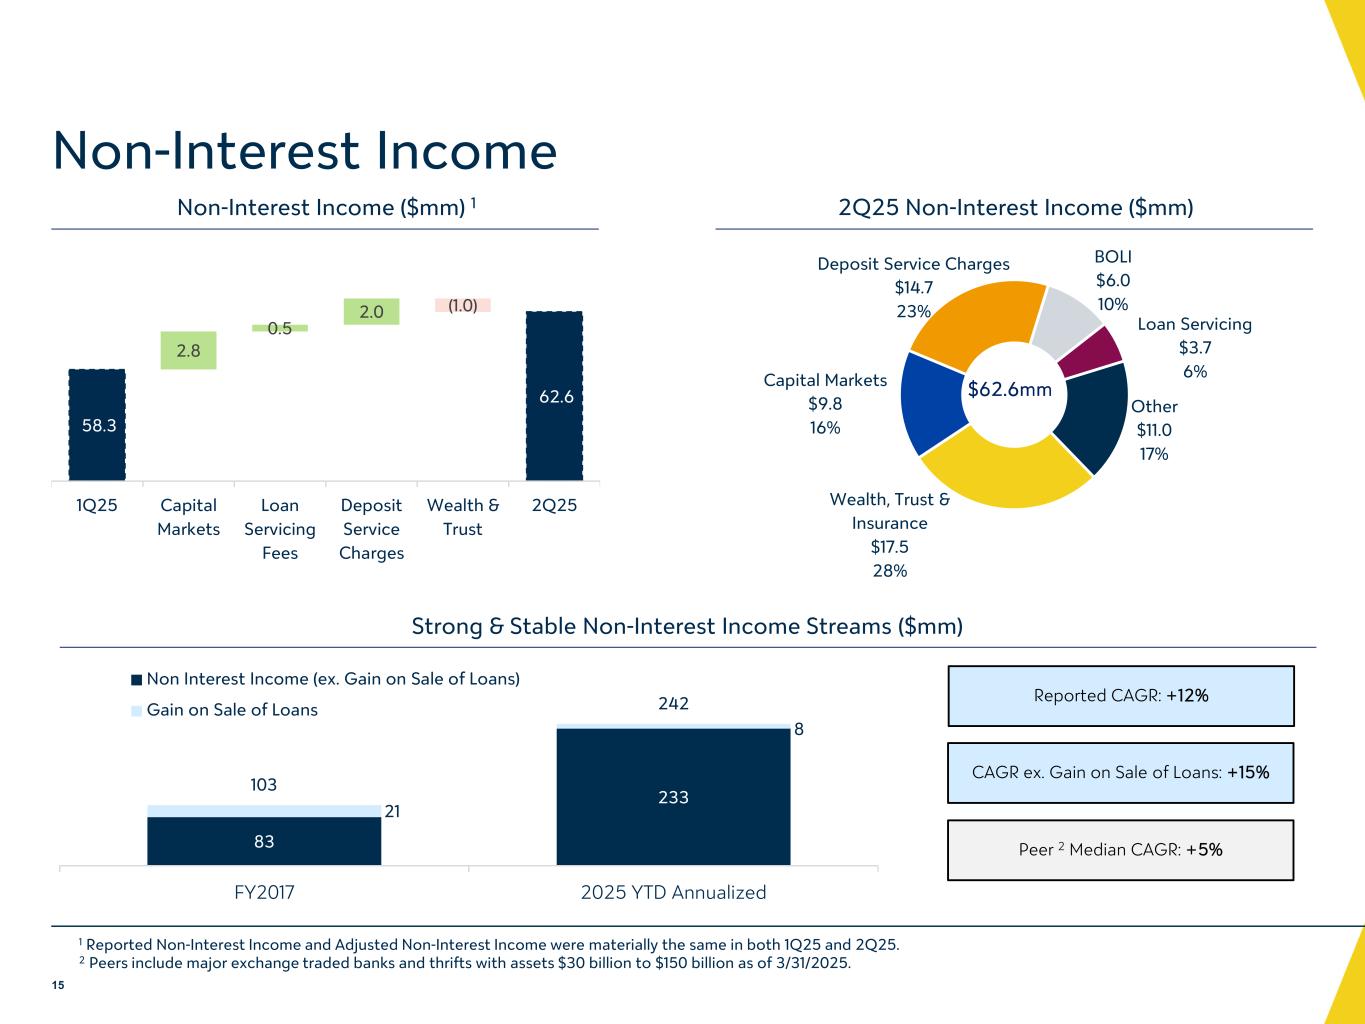
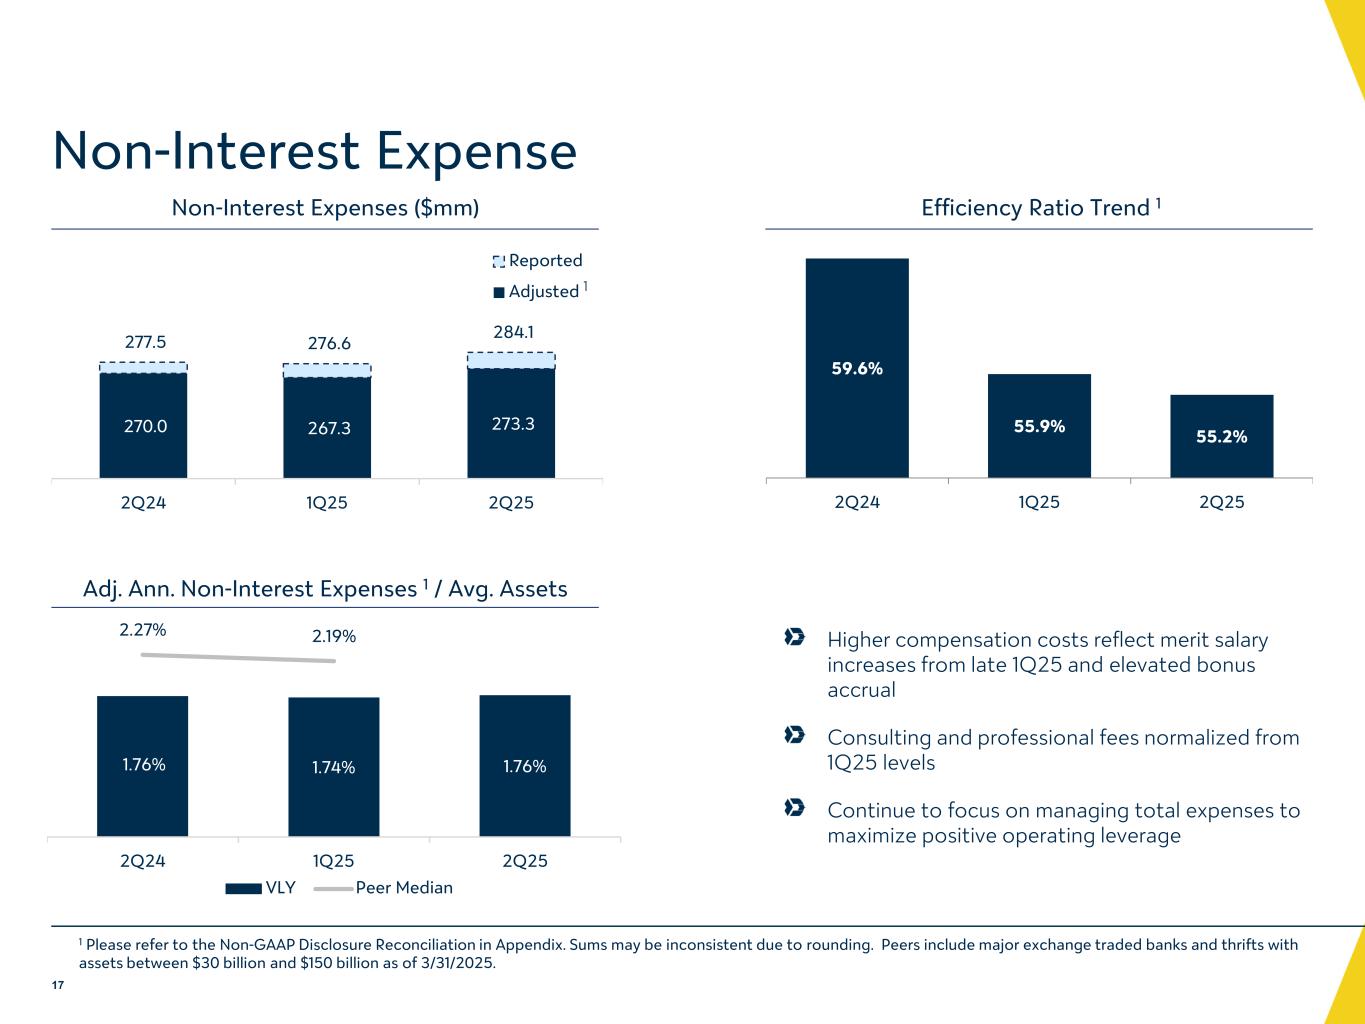
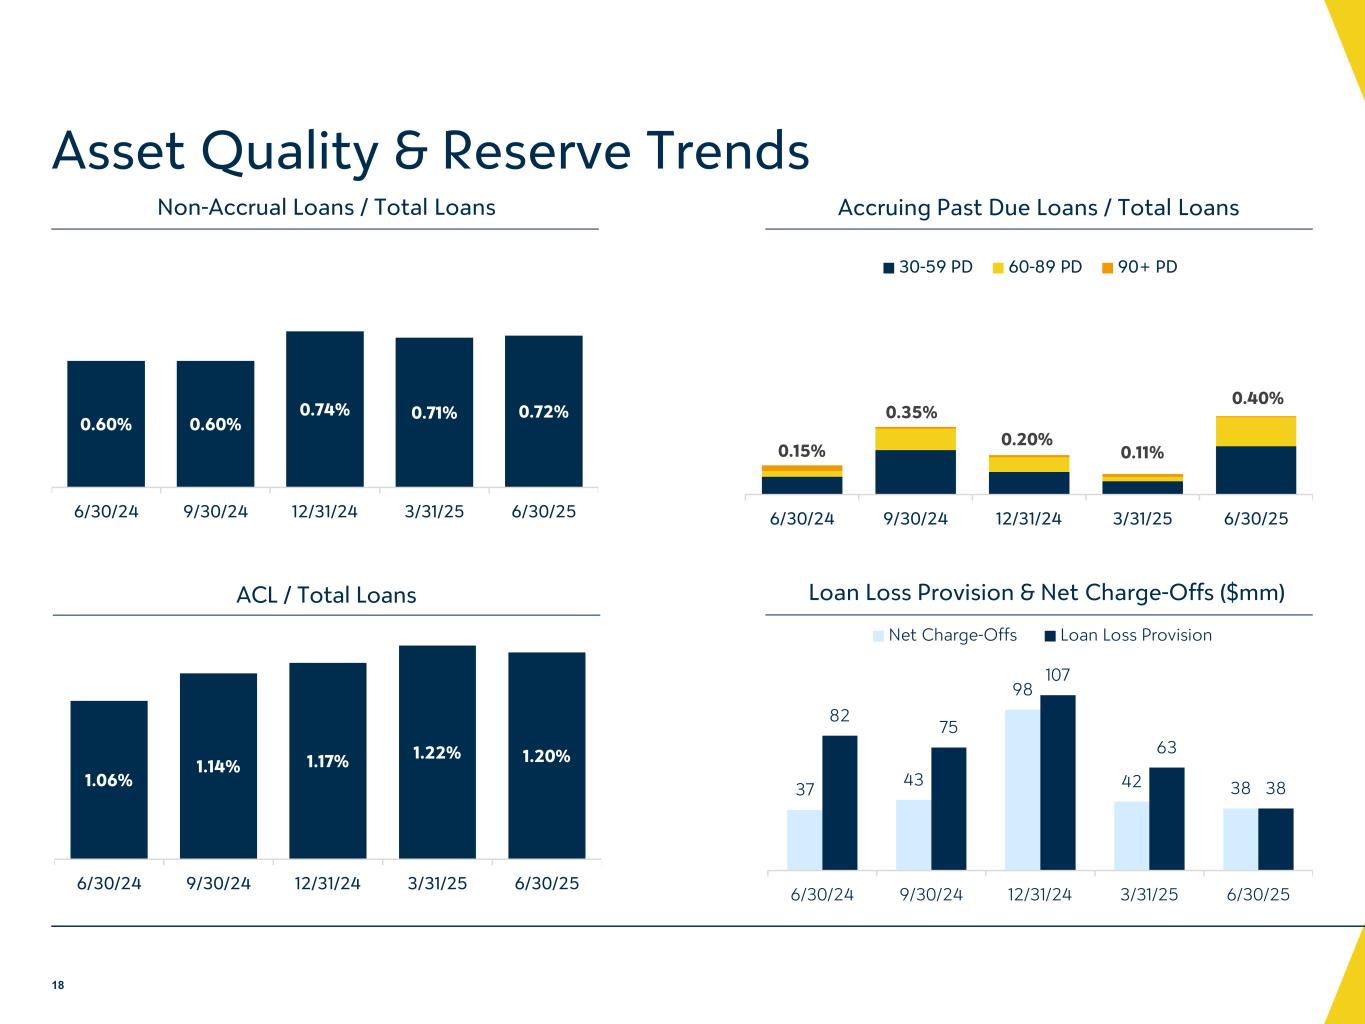
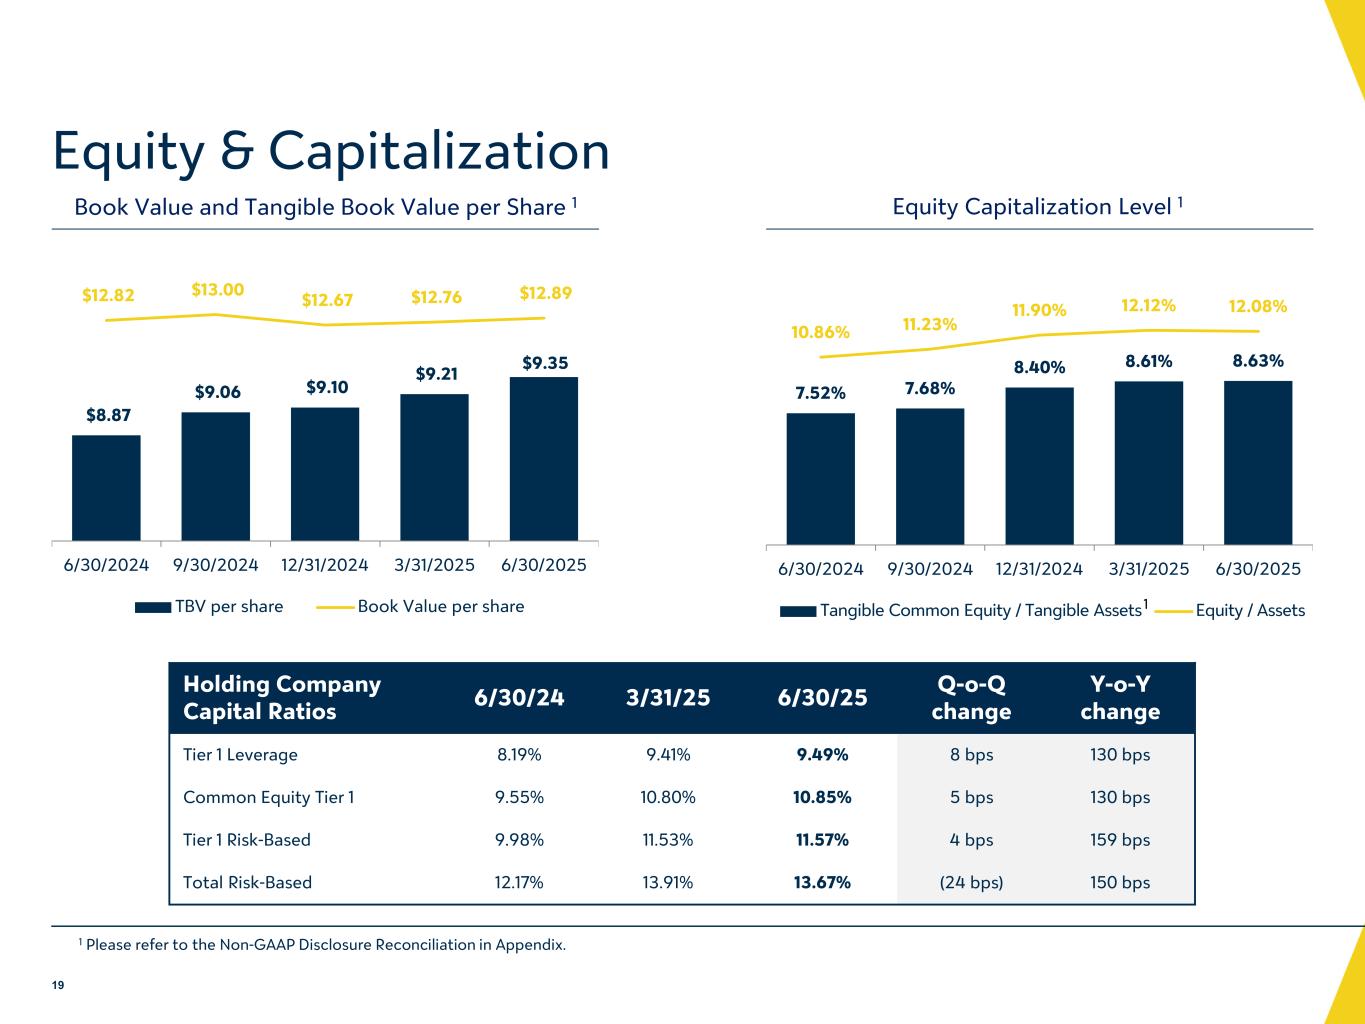
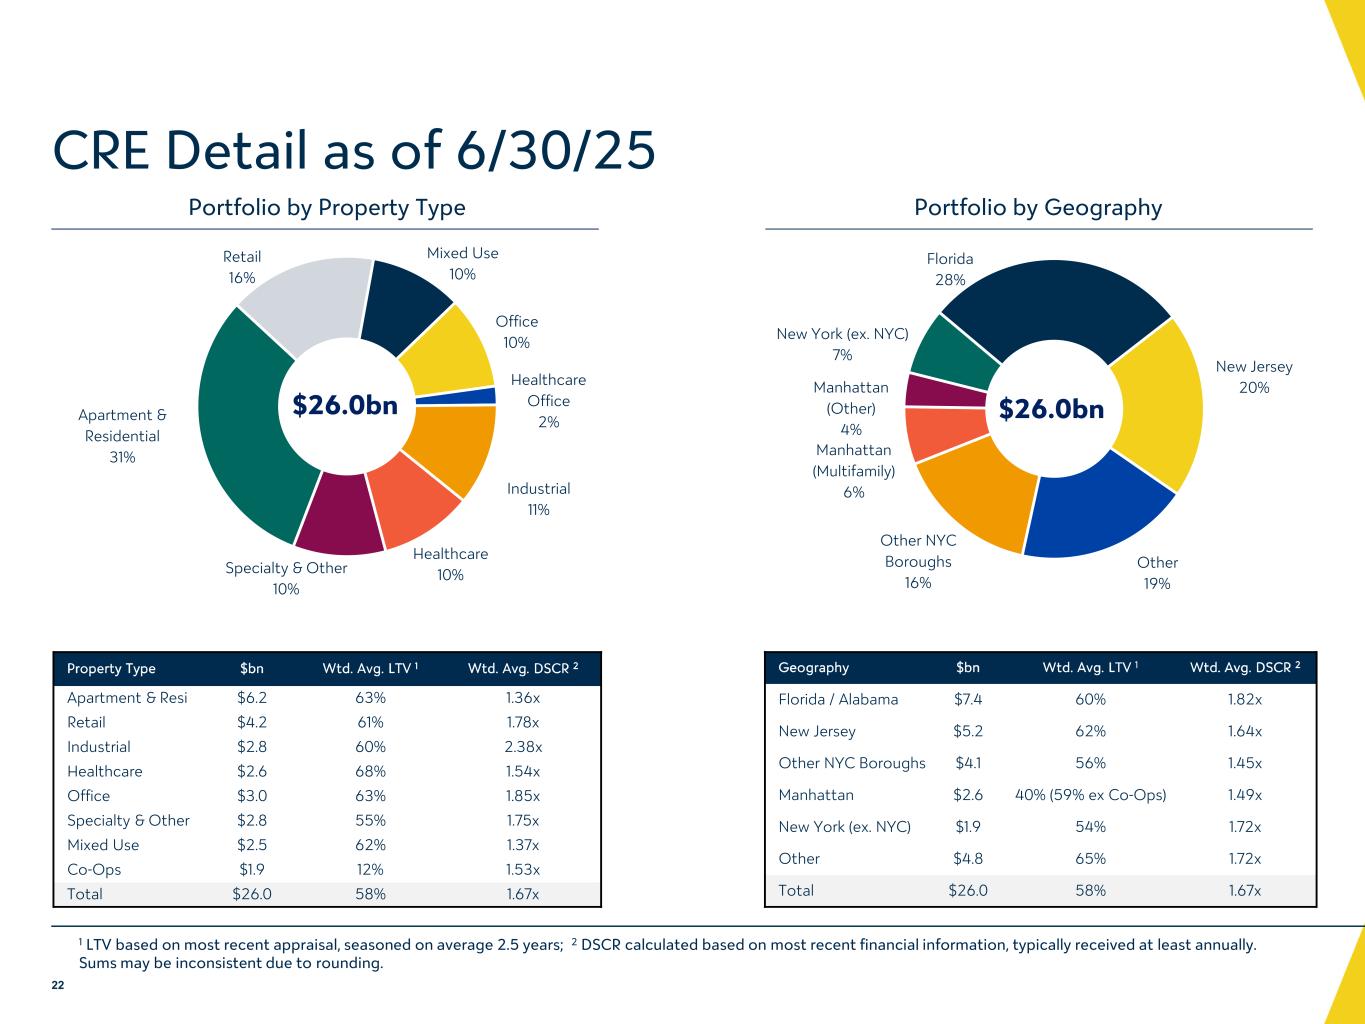
Thank you, Ira. Before we dive into the quarter's results, I'd like to provide an update on our full year 2025 guidance. We continue to expect approximately 3% loan growth for the year, consistent with our prior Given that loan growth is trending toward the lower end of our original guidance, we are refining our net interest income growth estimate to a range of 8% to 10%. Our outlook for non-interest income remains unchanged at 6% to 10% growth, supported largely by the areas that Ira just mentioned. We are lowering our non-interest expense growth guidance to a range of 2% to 4%, reflecting our ongoing focus on cost discipline and operating leverage. From a credit standpoint, we are tightening our net charge-off expectations to $100 million to $125 million for the year and are refining our provision estimate to approximately $150 million for the full year. In aggregate, these modest directional adjustments are expected to result in full-year earnings per share that remains broadly in line with current consensus estimates. Turning to slide eight, we delivered another strong quarter with $600 million of core customer deposit growth. This was driven by a combination of continued growth in commercial non-interest bearing deposits and promotional CD offerings. From a pricing perspective, we were able to largely mitigate competitive pressures through disciplined management of our back book. Our cumulative total deposit data during the recent rate decrease cycle stands at 51%, which has supported consistent net interest margin expansion over the last five quarters. Slide 10 further highlights the transformation of our deposit base since 2017. Commercial deposits have nearly quadrupled and our delivery channels have become significantly more efficient. A key driver of this transformation has been the success of our differentiated specialty verticals, which now contribute over $12 billion of deposits to our franchise. These verticals include international technology, our online delivery channel, and our private banking business, among others. As we continue to leverage these verticals and align our product offerings with client needs, we anticipate sustained deposit momentum. Turning to slide 11, gross loans increased at an annual pace of 6%, led by strong growth in C&I and indirect auto lending. C&I loan growth was particularly robust, fueled by activity in our fund finance and healthcare verticals, as well as contributions from our teams in Florida, New Jersey, and Chicago. Fund finance and healthcare collectively contributed roughly 60% of the quarter's net growth in C&I. While we expect C&I growth to moderate somewhat, we remain confident in our ability to selectively attract high-quality relationships to the bank. Cree runoff slowed this quarter as a result of higher origination activity with respect to our targeted relationship-driven clients. As of June 30, 2025, our Cree concentration ratio has declined to 349% from 474% at the end of 2023, surpassing our year-end target ahead of schedule. Slide 12 reinforces the consistency of our C&I growth since 2017, which reflects both our disciplined team building and our ability to capitalize on market disruption. Our national specialty platforms, including fund finance and healthcare, continue to provide valuable diversification. In early 2024, we added a seasoned syndications team, enhancing our ability to structure and lead larger transactions for upmarket clients. These capabilities, combined with our expanded Treasury and Capital Markets offerings, continue to provide attractive growth opportunities for Valley. Slide 14 shows a 3% sequential increase in net interest income driven by continued net interest margin expansion and growth in average earning assets. This marks our fifth consecutive quarter of NIM improvement, supported by our asset repricing tailwind in disciplined deposit cost management. The interest rate backdrop, combined with additional asset repricing opportunities, remained supportive of further NIM expansion throughout the year. We also delivered strong non-interest income growth this quarter. Capital markets activity picked up meaningfully, with increased swap volumes tied to CREE originations and growth in both FX and syndication fees. Deposit service charges also rose significantly, reflecting additional penetration of our Treasury platform and enhanced pricing. Slide 16 illustrates the long-term trajectory of our fee income. Since 2017, we've grown fee income at a 12% taker, more than double the peer median. And as Ira mentioned, we've improved the quality of that income. Our capital markets, treasury, and tax credit advisory businesses are now core contributors to a more stable revenue stream. Turning to slide 17, adjusted non-interest expenses grew modestly, primarily due to merit-based salary increases, which took effect late in the first quarter and higher incentive accruals during the second quarter. Professional expenses also normalized from unusually low levels in the first quarter. Despite these modest headwinds, our efficiency ratio improved to 55.2%, the best level since the first quarter of 2023, driven by strong revenue growth and continued cost discipline. Slide 18 illustrates our asset quality and reserve trends. Non-accrual loans remain generally stable during the quarter, while accruing past dues increased to 40 basis points of total loans. Roughly two-thirds of this increase was related to a pair of Cree loans which are no longer past due. Net loan charge-offs and loan loss provision both declined from the first quarter in line with our expectations. We continue to anticipate further credit normalization and a decline in both provision and charge-offs throughout the remainder of the year. Similar to this quarter's results, we anticipate general stability in our allowance coverage ratio going forward, all else equal. Turning to slide 19, tangible book value increased as a result of retained earnings and a favorable OCI impact associated with our available-for-sale securities portfolio. While our total risk-based capital ratio declined due to the redemption of $115 million of subordinated debt, other regulatory capital ratios improved. We remain extremely well capitalized relative to our risk profile and have ample flexibility to support our strategic objectives. With that, I will turn the call back to the operator to begin Q&A. Thank you.
Operator
Thank you. As a reminder, to ask a question, please press star 11 on your telephone and wait for your name to be announced. To withdraw your question, please press star 11 again. Please stand by while we compile our Q&A roster. Our first question is going to come from the line of Chris McGrady with KBW. Your line is open. Please go ahead.
Travis, maybe start with you. You talked about the margin continuing to expand. Can you speak to the ability to maintain deposit pricing given competitive nature and the growth outlook? I think you had talked previously about maybe getting overtime to like a three and a quarter. Any changes to the way you're thinking about the cadence of margins?
No, I don't think there is, Chris. I mean, I think we still anticipate the margin will increase as the year goes on and then into 2026 as well. I'd say that benefit or that increase is driven by a combination of asset repricing tailwinds and general stability on the deposit side. I think we've noticed that the deposit competition for new deposits, new to bank deposits, has maybe picked up recently. That said, we still have the structural opportunity with our $6.5 billion of brokered deposits to reprice those lower over time. Some of that's structural, where we have, as an example, in the third quarter, a billion two of brokered that has an average cost of 510. So we've been replacing that into brokered. There's still a pickup. We think there's an opportunity to replace it more with core. This quarter, we added over a billion dollars of new deposits at a blended rate of 277. So that gives you a sense, I think, for some of the opportunity that we have there on the funding side.
Okay. You said at 377 or 477? Sorry, I missed that.
New deposits were over a billion dollars at a blended rate of 2.77%. 277.
And then the charge-off guide, I think it implies a decent step down in the charge-offs in the back half of the year. I may be interested in comments about new non-accrual formation in the quarter, a little bit of the tweak in the reserve, and then your comments about
stability and visibility in the credit. Thanks. Yeah, I think if we point to stabilization on non-accruals that we saw this quarter and also, you know, want to point out for the first quarter, we had flat criticized level of assets. That's after two years of some migration. It's consistent with what we were seeing in fourth quarter and first quarter where we saw the growth and criticized really diminish materially. We point to the stabilization that we're seeing within the real estate market as the primary driver. And in a world where the economic outlook continues to be consistent with what we're seeing today, we would expect that that trend continues on the criticized. And the guidance we had given was an expectation for charge-offs and reserve levels, to provision levels to be higher at the beginning of the year, and that's consistent now with our guidance that we're showing through the end of the year. Great. Thank you.
Operator
Thank you. And one moment as we move on to our next question. Our next question is going to come from the line of David Smith with Truist Securities. Your line is open. Please go ahead.
Good morning. Good morning. You know, there's been a lot of activity in, you know, the broader technology and software sector in recent months you know both for the industry itself as well as seemingly and banks interested in banking the space you know with more intensity it was curious if you could speak to the the competitive landscape there and you know how how you're adapting Valley for this environment it's a great question David you know we
had actually looked to get into the business five to six years ago from an organic perspective. And we went through a strategic initiative looking at, you know, not just what the relationship managers needed to do and what that target client was, but really the infrastructure that was required from a treasury service solution, the credit piece that comes with it. And it was really a significant build is what we had identified at that time. We were fortunate enough with the Blues acquisition back in 2022 to be able to acquire a really experienced team that has a lot of connectivity to the Israeli market. Right now, I think they have well over 50% of the market share of anything from Israel coming to the United States really really goes through Valley so a real strong kind of connectivity there but really an infrastructure that we can leverage so what you're seeing now is the ability to expand that into the domestic space so the infrastructure is already there the incremental knowledge that's really needed to bank that space already exists within the organization so we're really excited about the continued focus that we're seeing and the growth in that market, and we think we'll definitely
get our fair share. Thanks. And then just staying on the topic of markets, I know, you know, the New York metro area and rent-regulated multifamily isn't as big a part of your portfolio as it once was, but any thoughts you have about the developments in the mayoral race and how that
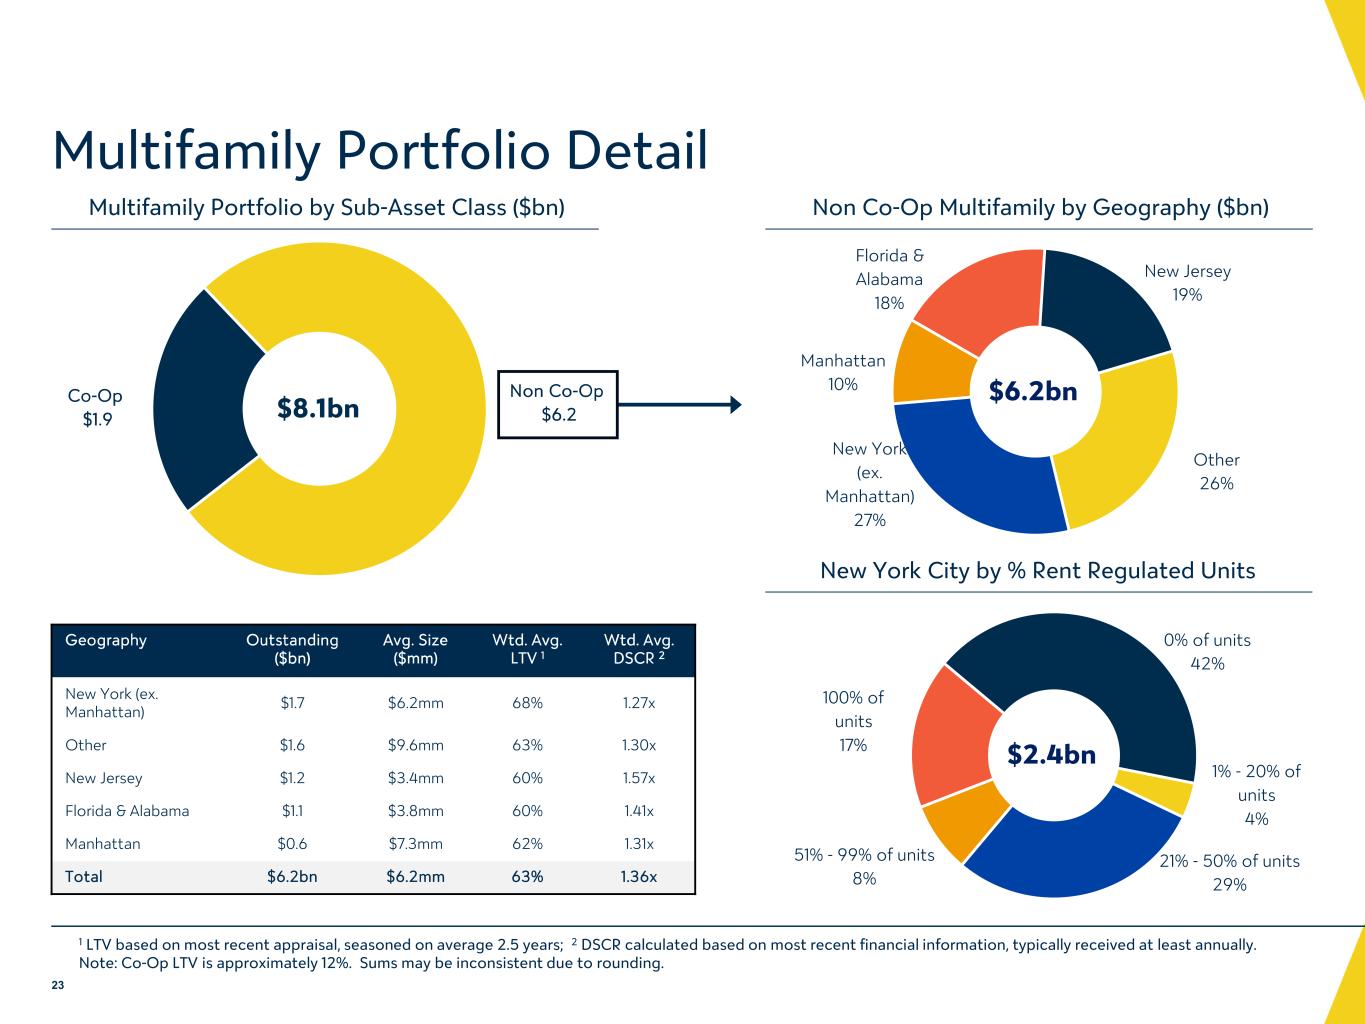
could affect your portfolio here? So this is Mark Sager. Yeah, we don't want to preempt the voters of New York on who will actually be the mayor, but based on our forward-looking, we do think that potential pressure would continue only to be on the rent stabilized. We've mentioned in the past, very small part of our portfolio, $600 million in total, very granular portfolio for us, $6 million average loan size, and our average yield on that portfolio is 4.87. So we don't have concerns. We feel we're adequately provisioned on that portfolio. We'll point out what we've mentioned in other calls. We've always underwritten in that space to in-place leases and NOI coverage. So an inability to increase in the future, we don't believe we'll have a material impact on our portfolio. All right. That's helpful. Thank you.
Operator
Thank you. And one moment for our next question. Our next question is going to come from the line of Manana and Gasalia with Morgan Stanley. Your line is open. Please go ahead.
Hey, good morning, all. Morning. I wanted to start on the loan growth this quarter. Apologies if you've already covered some of this, but the CNI loan growth was particularly strong this quarter. Can you talk about what you're seeing and hearing from borrowers? How much of this growth is coming from the environment improving versus the actions you guys have taken?
I would love to say that it's all the actions that we've taken and the infrastructure that we've built, but I think client sentiment definitely has an impact upon that as well. I think we've done a really good job in providing the right treasury solutions that we need, providing the right credit appetite, and just the internal relationships that are required to really grow in some of the segments that we've expanded into fund banking as well as healthcare. That said, I think from what we see with our clients, there still seems to be real positivity in how they're individually thinking about the market. The C&I pipeline, I believe, is at 30% higher than where it was last quarter. So we're continuing to see real strong growth coming out of that segment today. I know there was a lot of noise regarding tariffs previously. I think we really bank a unique client that really is that small to mid-sized business that has the agility to really capitalize on what happens with tariffs and some of the uncertainty. So when we look at an environment like we're staring at today where there's increased volatility and increased uncertainty, we think the types of clients that really look to value for their financing needs are the ones that are going to be the ones that are the beneficiaries of this environment.
I would just add on to that, Manon, specific to this quarter. You know, we grew CNI a little bit over $700 million. About 30% of that growth came from each fund finance and healthcare CNI, so 60% in total was related to those two specialty areas. The additional 40% was primarily tied to activity in Florida, Chicago, and New Jersey.
Got it. Really helpful. And then maybe pivoting over to credit, any more color on what drove the increase in the past use this quarter and what gives you the confidence in the credit outlook that you laid out in the slide deck?
Absolutely. Again, I think we mentioned, but the increase in delinquencies was driven by three credits. Two of those credits at approximately $100 million are already cleared. We had one $39 million property sell and paid off in full. The $60 million credit has been brought current for the July payment. We were in the midst of negotiating a modification for that customer. And the other remaining delinquency is a matured loan where the borrower hasn't agreed with our extension terms, but has received an alternative financing opportunity, and we expect this quarter for that to be resolved. Then I would also point, again, to, yeah, stabilized, criticized level and non-accrual levels. So we do think that these were just unique situations on the delinquency.
Operator
Thank you. And one moment for our next question. Our next question is going to come from the line of Matthew Breeze with Stephen Zink. Your line is open. Please go ahead.
Good morning, everybody. I wanted to touch on deposits first, you know, the 8% quarter-to-quarter growth in CDEs. What was the blended price on those? And then, Ira, I appreciate your comments on, you know, quality of deposit improvements, but I guess I'm thinking about this in the context of deposit costs being high to begin with and up quarter-to-quarter. And so, I guess my question is, with all the new hires and investments, you're growing C&I, which is, you know, better for deposits. I guess I just feared there'd be more opportunity to reduce deposits. Maybe you could
help me out there. Yeah, Matt, this is Travis. I think just to start with, there is a lot of kind of noise within the deposit numbers. So the growth in CDs was a combination of two things. The first is, you know, we did have some promotional CDs out there that we always expect to have at least one promotion in the market at a given time. So there was about 400 million of retail CD growth in that number. Then there was, within brokered deposits in total, which were up $100 million, we reduced brokered ICS one-way buy, which falls into now money market and savings, and replaced that with brokered CDs. So when you look at our deposits quarter over quarter and see the reduction in now money market and savings, the reality is the customer balances were stable to slightly higher, but we did see that runoff in ICS one-way that was replaced with brokered CDs. I think there is also some degree of mismatch between the timing of loan growth. This quarter's loan growth was extremely strong, particularly on the CNI side. And I think the core deposit growth was strong as well, although it couldn't keep pace with the loan growth that we saw. Through the rest of the year, we anticipate loan growth will kind of pull back to about 1% on a quarterly basis. And I think we have good deposit tailwinds to fully fund that on a core basis. And then you get kind of a continuation of the repricing dynamic on the brokered side. To reiterate what I said in the first response in the Q&A session, you know, we grew, we originated net new deposits this quarter of $1.8 billion at that $2.77 rate for customers. And again, we have $1.2 billion to have brokered in the third quarter here that's going to roll off at a price of $5.10. So I think we have a combination of tailwinds on the deposit side. that reflect both just the interest rate environment and repricing those lower and the structural benefits of continuing to grow deposits on a core basis. And we're in a unique period here coming out of the inverted curve where you do feel like the margin's at a good inflection point to the upside. We have asset repricing tailwinds on both the asset and liability side, and that's pretty unique. So just some color there.
And I think, Matt, just from the strategic, I mean, from my mind, I think the puts and pulls in each individual quarter are definitely important and make a difference for what that NIM looks like. But my mind really goes to some of the more strategic initiatives that we've done and the different verticals that we've gone into and the ability to really have some pricing power within those individual verticals as we continue to expand some of those relationships. I think about the number of accounts and the growth that we've seen. I mean, if you go back to when I've taken over at CEO, we've grown commercial accounts 11% consistently on an annualized basis. We've been able to grow consumer accounts, I think, 2% to 3% on a consistent annualized basis. So I think those are things that really drive long-term strategic value. The capabilities that we have within our treasury platform really begin to get differentiated versus some of our peers. So I think there really is the foundational strategic elements that support a lot of the tailwinds that we're describing today when it comes to the deposit initiatives. And I do believe over a longer-term basis that this cost will come down to more peer-like numbers. That said, considering we are operating in a very challenging New York market from a deposit perspective versus some of our peers that may be operating in the Midwest or some other geographies, I do believe there is more pricing difficulty or competitiveness in our markets. But we have a right to win for these deposits, and we do believe that that right is really showing up in the number of accounts that we continue to add every single year.
Got it. Okay. And then I guess I had two others, if you'll indulge me. The first one is just, Ira, you had mentioned your opening comments, a disconnect between fundamentals and valuation. Could you talk about a potential buyback? I mean, how much flexibility do you have capital-wise to do that understanding the CRE concentration is still a bit elevated?
I think we have a lot more flexibility today than we've ever had in my time of being at Valley, whether that's been CEO or really working in the finance area. So I think that in itself, I think, is a wonderful ability to have some flexibility that we haven't had before. That said, I think there are organic growth opportunities for us, So it really becomes a balance of whether we're generating accretion through the buyback versus more sustainable long-term value creation through some of the organic initiatives that So I think that really becomes more of a balance than really where that Cree ratio is. We feel very, very comfortable with where the Cree ratio is, with where the trajectory is. So I don't really think that's an impediment at this point. It really is more on the organic side. You know, I think we talked about a year ago or the beginning of the year of some of those performance metrics that we wanted to get to, right, 1% by the end of the year. We talk long-term about where that 15% ROTC number should look for us. We do see a pretty clear path to get to those numbers, and I think those are really driving initiatives for us.
Yeah, and that's my follow-up. You know, 1% ROA by the end of the year, that's intact. What does that look like in 2026 and when you get to that 15% roster? That's all I have.
I think those are what we're focused on, right? Because I think there is, in my mind, a disconnect with where that multiple is. And obviously, there's an overhang on the stock still with where that Cree ratio is, which is fine. I think it's important for us to continue to make sure that we're driving performance that supports more peer-like multiples. You know, for us, it's getting to that 1% at the end of the year, which when you look at the trajectory of where the NIM is and the guidance we're giving on where the reserve goes, or excuse me, where the provision goes, I mean, those don't take a lot of math to really get to those overall numbers. When you then extrapolate that and continue it forward, you know, we're running between $12 to $17 million a quarter in incremental net interest income growth, as Travis alluded to earlier. Those are tailwinds that we don't think are going to disappear for some time. I mean it's it's not too difficult to easily forecast by you know a certain part of next year 12 to 12 and a half percent ROTC and then getting closer to that 15% and 27 is really where we think we're going to end up and there is a real clear comfortable glide path towards that thank you thank you and as a
Operator
reminder to ask a question please press star one one on your telephone our next question is going to come from the line of Jared Shaw with Barclays your
line is open. Please go ahead. Hi, this is John Rowan for Jared. Good morning. Hey, how are you? Okay, doing good. Could you maybe just talk a little bit about the competitive environment in New Jersey and if there's been any shift in sentiment among, I guess, New Jersey-based customers versus New York, just given the mayor race there, any impact on sentiment or demand?
I think it's a great question, right, because we have borrowers that play in both spaces. I think there is a bit more of a wait and see as to where they're going to allocate some of their capital and to where they want to begin to invest into. That said, I think the families that we tend to bank are really more long-term generational families. And for them, there may be going to be a buying opportunity or an investment opportunity in New York based on what happens with the mayoral race. So these are families that have much more longer-term views of what New York City is. And I think we probably share in that sentiment from a long-term perspective, we are still optimistic about New York.
I would just add that this quarter I did call out New Jersey as having strong C&I growth. The reality is as the quarter went on, the pipeline in New York grew, and right now New York's C&I pipeline stands pretty strong heading into the third quarter. Combination of activity in the boroughs in Long Island appears to be percolating. So, you know, I don't think, you know, Mark responded to the question on the mayoral race specific to rent-regulated multifamily, but the reality is the commercial environment in New York, I think, remains pretty robust.
Okay, perfect. Thanks for that color there. And then just on looking further ahead to, like, 2026 loan growth, how much of a headwind is the CRE runoff still going to be, just in terms of dollars or just percentage for the year?
Yeah. As we head into 2026, I don't anticipate Cree will be a headwind from a dollar perspective. I mean, I would think that our Cree balance is stabilized as we get towards the end of 2025 here and would anticipate kind of low single-digit growth in Cree in 2026 as we think about it today.
Yeah, I guess with taking that into account with the T&I growth, any indication on what total loan growth could be for 2026 is like the high single-digit number of two?
We haven't provided any 2026 guidance yet, as we talked about the 3% loan growth guide for 2025. I mean, keep in mind that that will include a couple of quarters of Cree runoff if you were to neutralize that and, you know, kind of plug that in for 26, I think you probably get to something that's, you know, closer to 5% total loan growth. But again, we have not yet provided any 26 guidance.
Okay. Thanks for the color. That's all for me.
Operator
Thank you. And I'm showing no further questions at this time. And I would like to hand the conference back to Ira Robbins for closing remarks.
Thank you, Michelle. And more importantly, thank you to all of you for joining us today. We appreciate the interaction and look forward to talking to you next quarter.
Operator
This concludes today's conference call. Thank you for participating and you may now disconnect. Everyone have a great day.