Operator
Good day, and thank you for standing by. Welcome to the Brady Corporation's second quarter, 2026 earnings conference call. At this time, all participants are in a listen-only mode. After the speaker's presentation, there will be a question and answer session. To ask a question during the session, you will need to press star 11 on your telephone. You will then hear an automated message advising your hand is raised. To withdraw your question, please press star 11 again. Please be advised that today's conference is being recorded. I would now like to hand the conference over to your speaker today, Anne Thornton, Chief Financial Officer. Please go ahead.
Speaker 6
Good morning and welcome to the Brady Corporation Fiscal 2026 Second Quarter Earnings Conference The slides for this morning's call are located on our website at www.bradycorp.com slash investors. We will begin our prepared remarks on slide number three. Please note that during this call, we may make comments about forward-looking information, Words such as expect, will, may, believe, forecast, and anticipate are just a few examples of words identifying a forward-looking statement. It's important to note that forward-looking information is subject to various risk factors and uncertainties, which could significantly impact expected results. Risk factors were noted in our news release this morning and in Brady's Fiscal 2025 Form 10-K, which was filed with the SEC in September. Also, please note that this teleconference is copyrighted by Brady Corporation and may not be rebroadcast without the consent of Brady. We will be recording this call and broadcasting it on the internet. As such, your participation in the Q&A session will constitute your consent to being recorded. I'll now turn the call over to Brady's President and Chief Executive Officer, Russell Schaller. Russell?
Thanks Anne. Thank you for joining today. We released our fiscal 2026 second quarter results this morning and I'm pleased to report that this marks our 20th consecutive quarter of organic sales growth. Top-line growth is a key metric, and achieving this milestone for five straight years of quarterly sales growth demonstrates the strength of Brady's business model. This quarter, we also improved our gross margin, our cash generation was incredibly strong, and we grew adjusted earnings per share 9%. I'm proud of the team and proud of our first half of the year. Brady's core mission is to create new world-class products to serve our industrial customers. Just last week we launched an exciting new product that's unlike any other on the market, the I4311 Transportable Industrial Desktop Label Printer. This is the first transportable printer that can print on materials that are up to four inches wide. It has an all-day battery, it's Wi-Fi and Bluetooth enabled, and includes our LabelSense software technology. The difference maker with this new printer is that it adds portability when our customers need to print on larger adhesive-backed materials, which greatly expands the use cases for our customers. With the I-4311, our customers can set up shop anywhere, and they can print up to 5,000 labels on a single charge on hundreds of different specialty materials across wire ID, safety and facility ID, and product ID. The battery is rechargeable and can be easily swapped out, maximizing productivity at all times. And just like our entire printer will line up, The I-4311 is incredibly versatile and ideal for a wide variety of applications, including both indoor and outdoor uses, safety and OSHA requirements, harsh environments, lean manufacturing, electrical and data comm, and lab applications. This is just one of the many examples of our R&D developments which span our printers to RFID to optical image recognition to lasers and more. I've always been most excited about Brady's commitment to R&D. When I first joined Brady a bit over a decade ago, we spent roughly 3% of our revenue on R&D. This has grown to almost 6% in 2026, while our pre-tax earnings have more than tripled over the same period in January. I'm personally delighted to have her on Brady's leadership team, where she's bringing a wealth of insights to improve our technical roadmap. And as always, the environment. Now I'll turn it over to Ann to provide more details on our financial results.
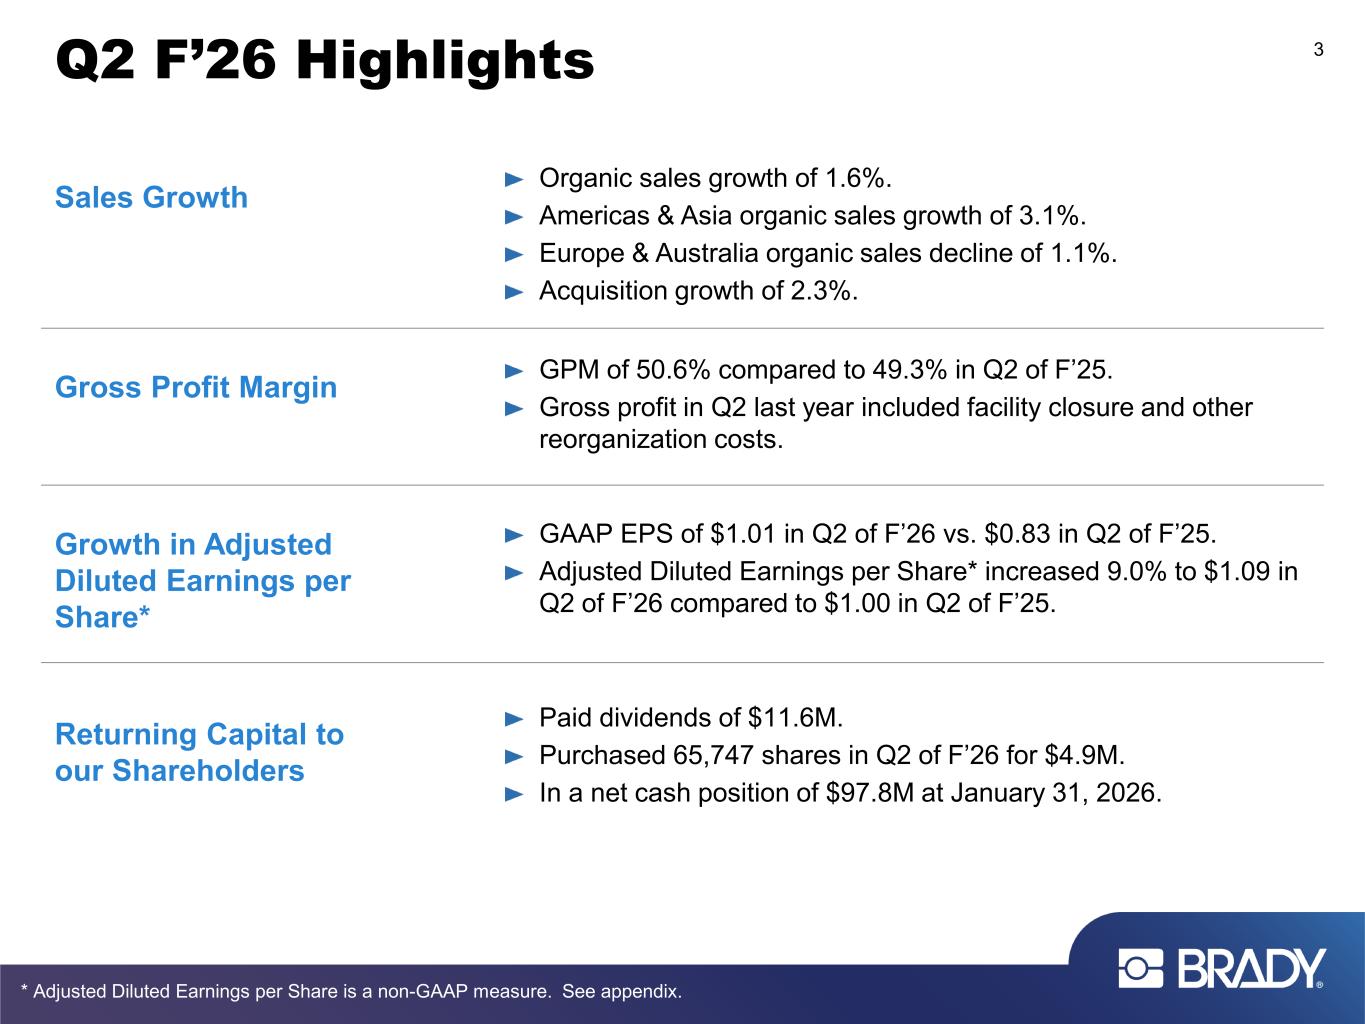
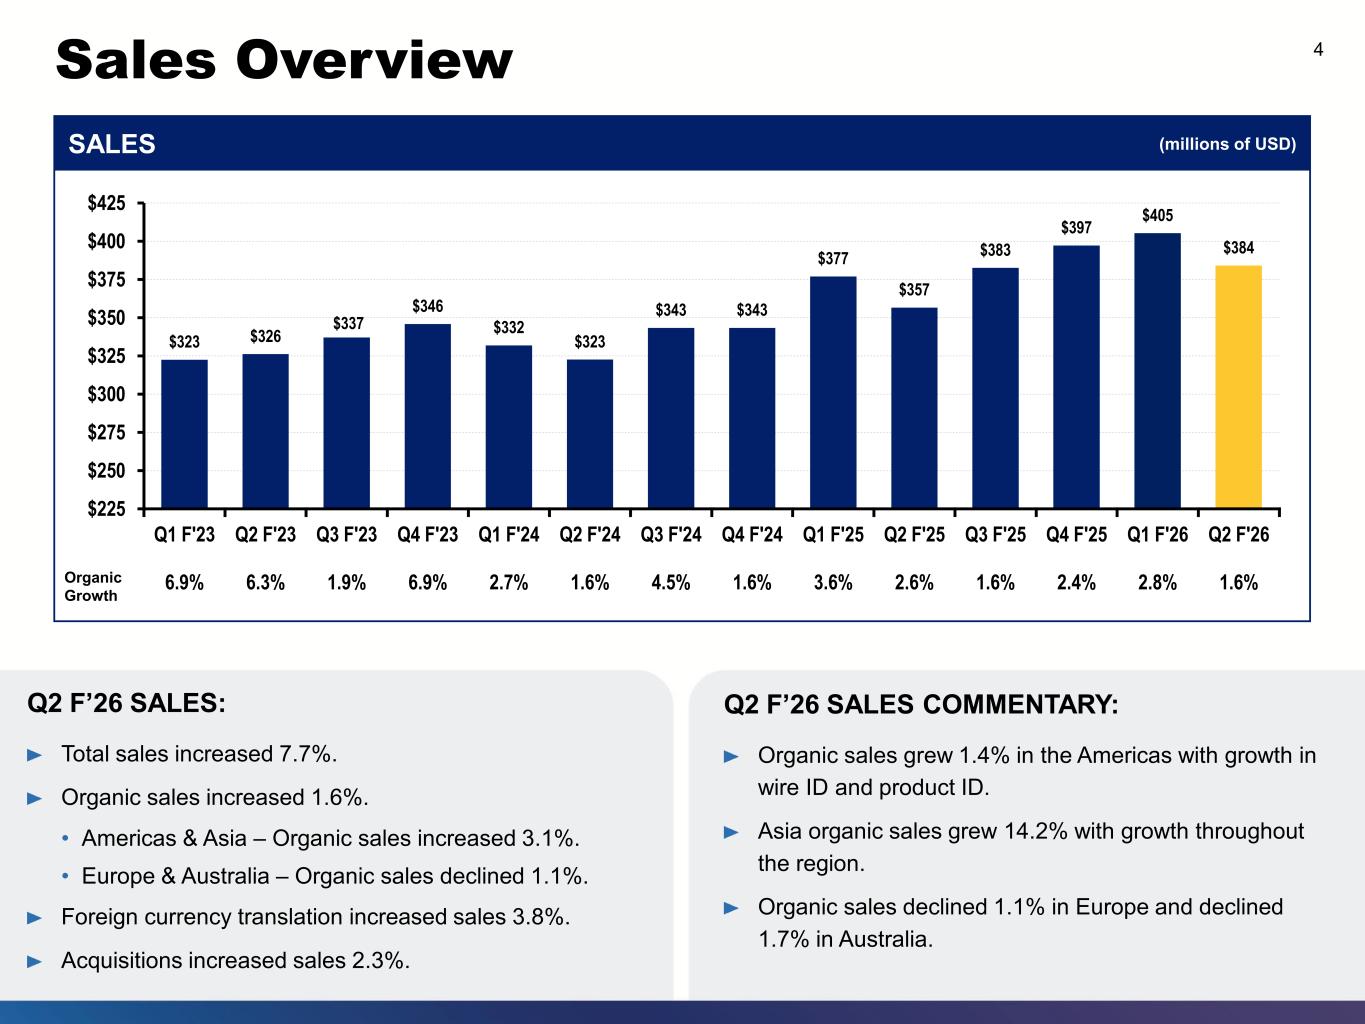
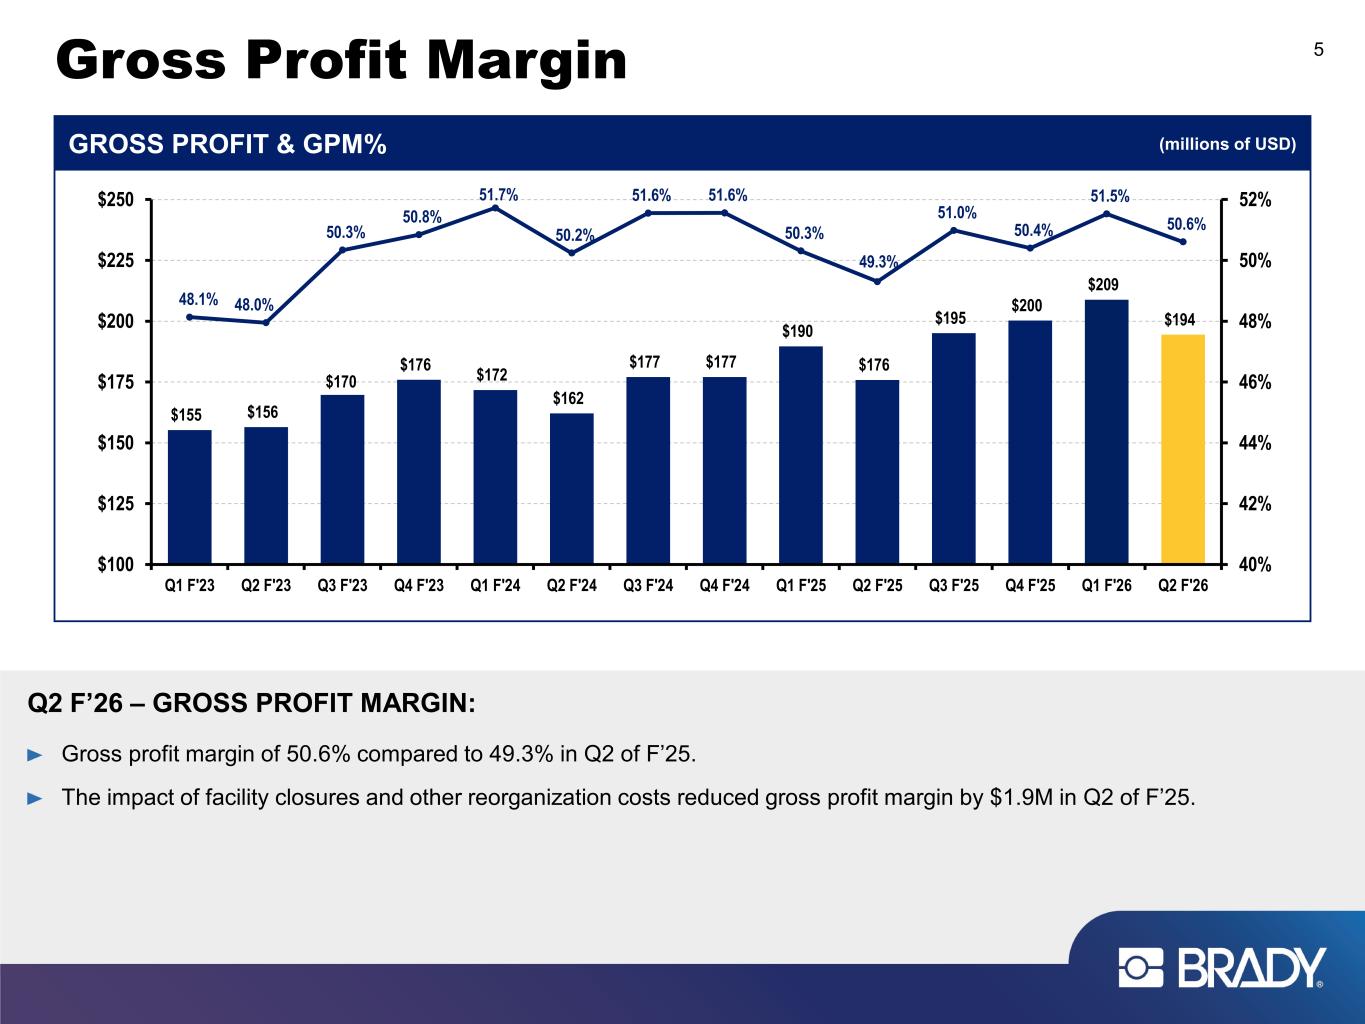
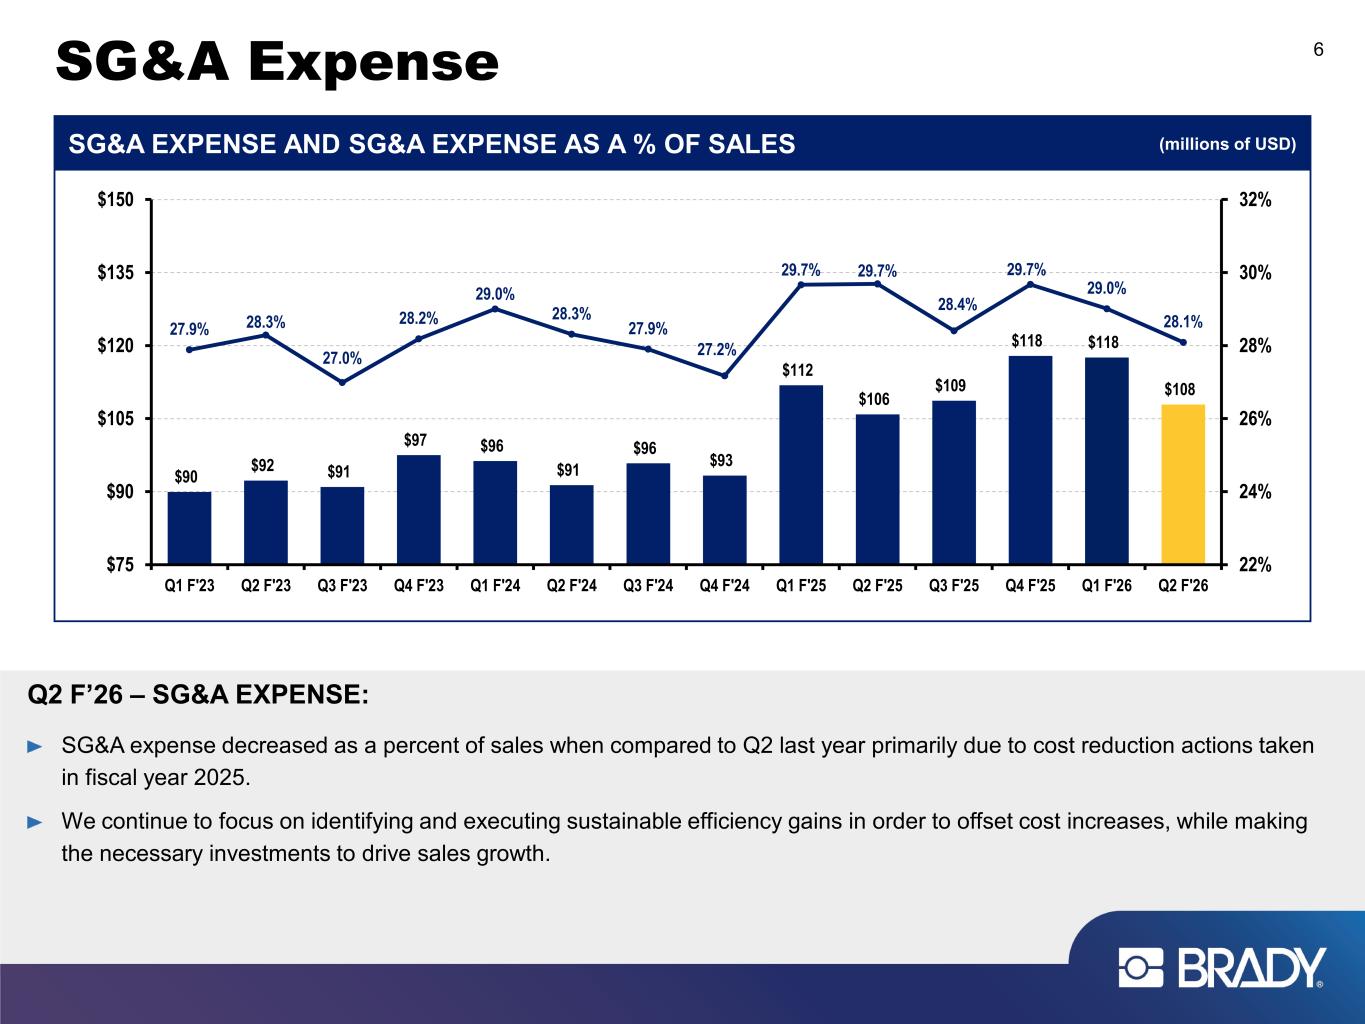
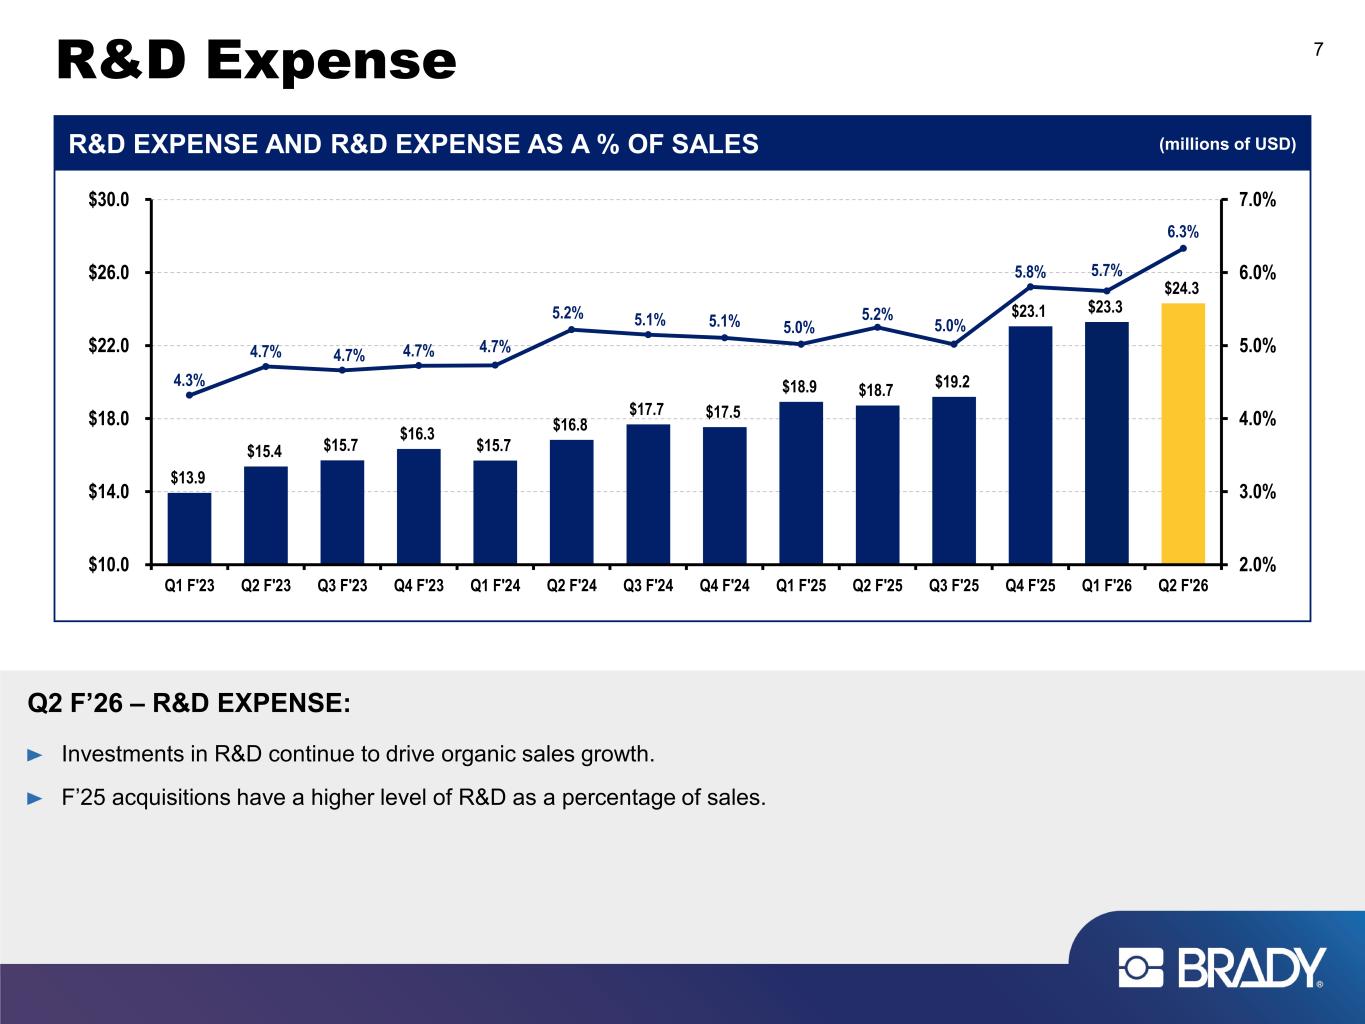
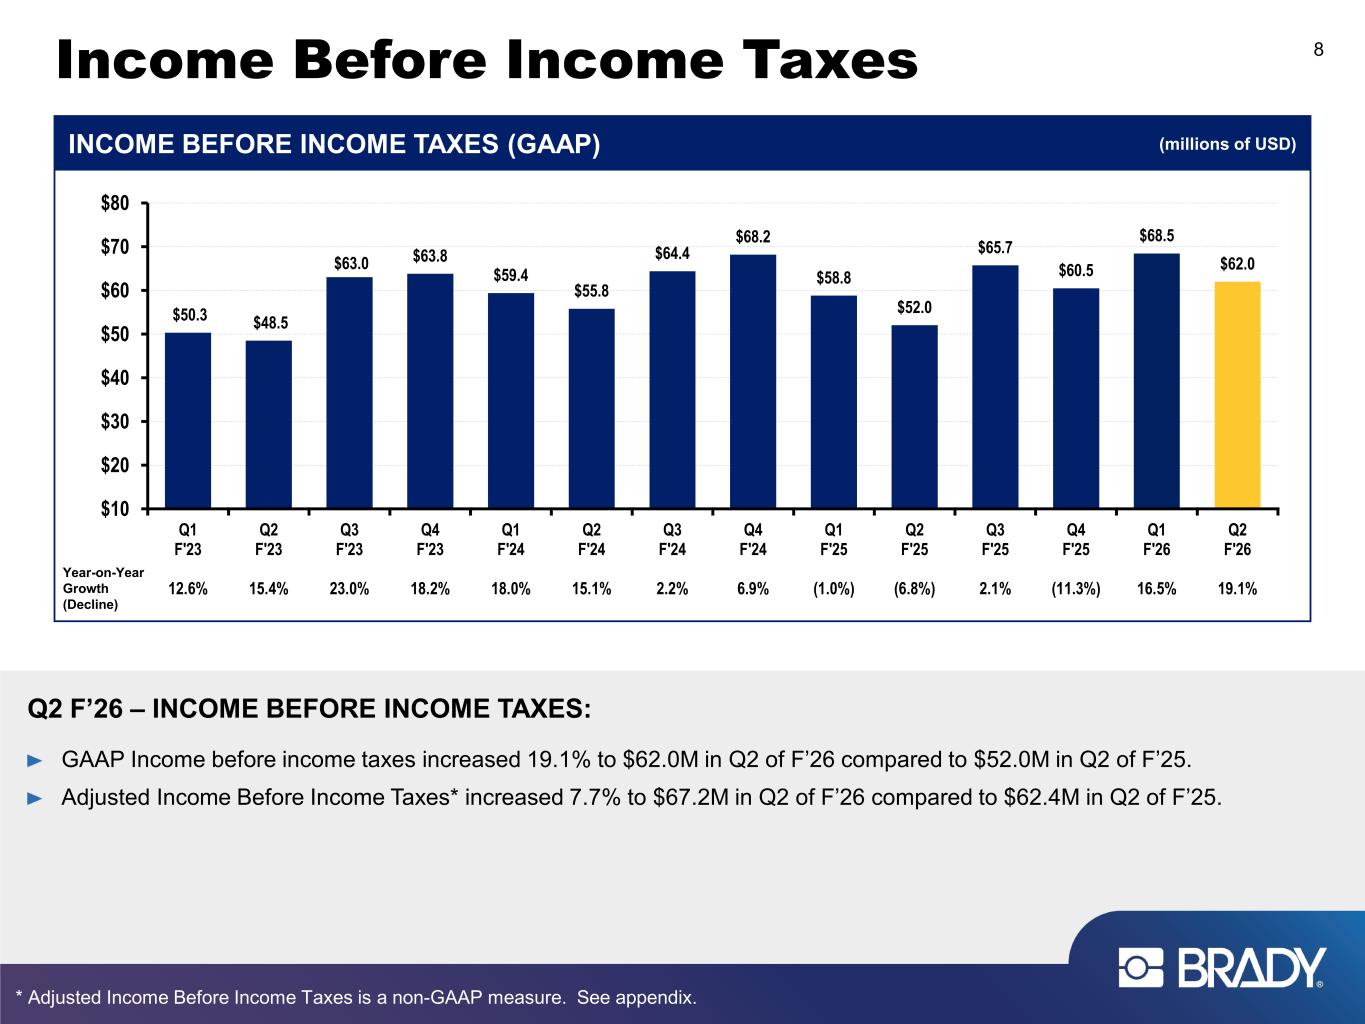
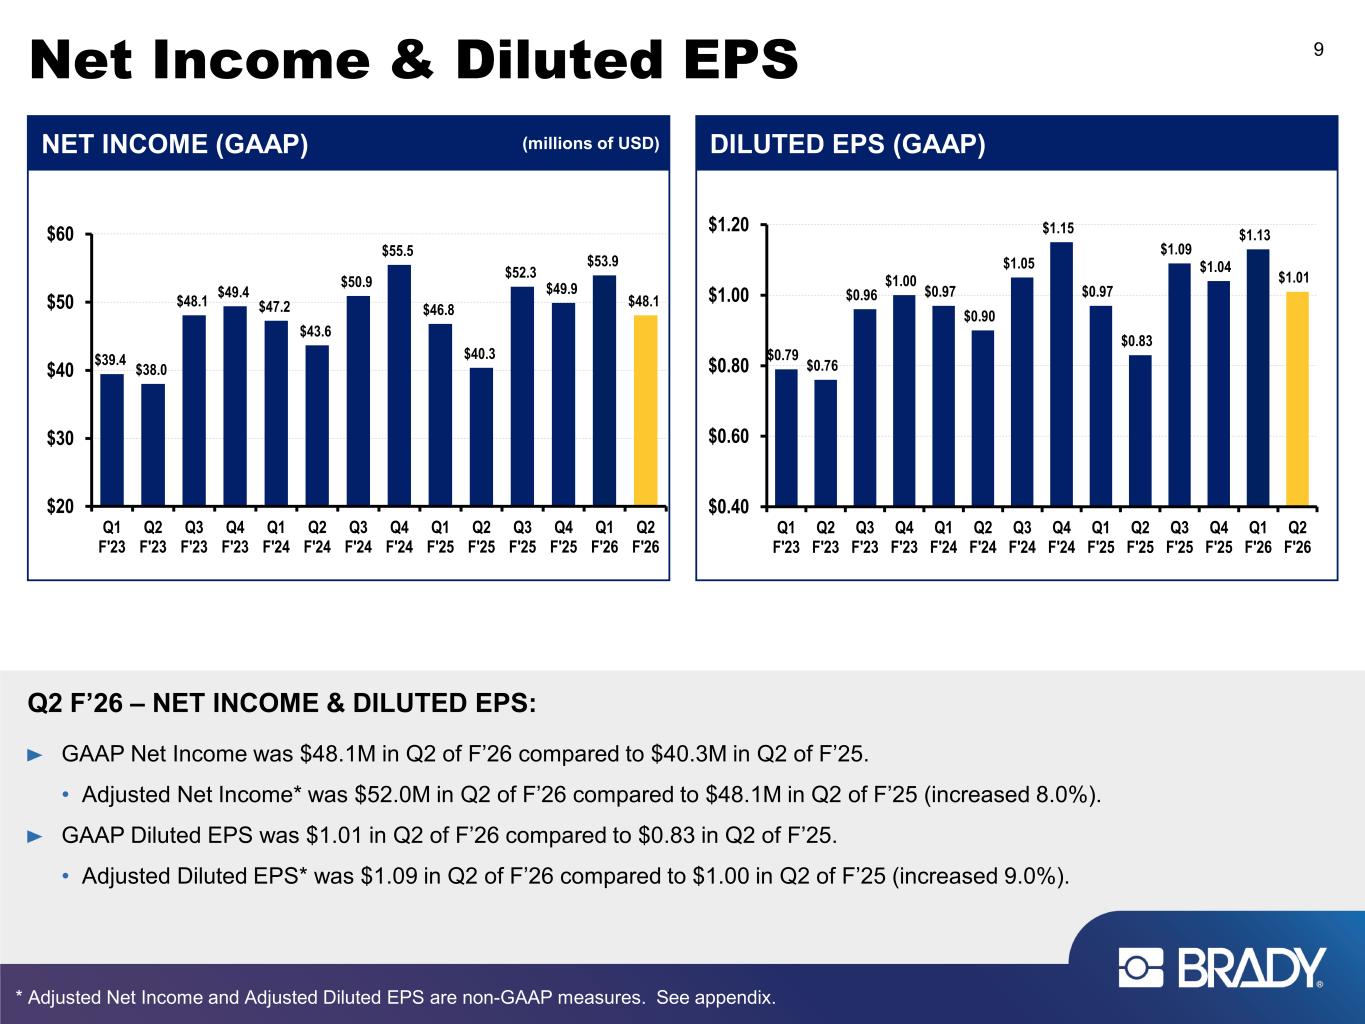
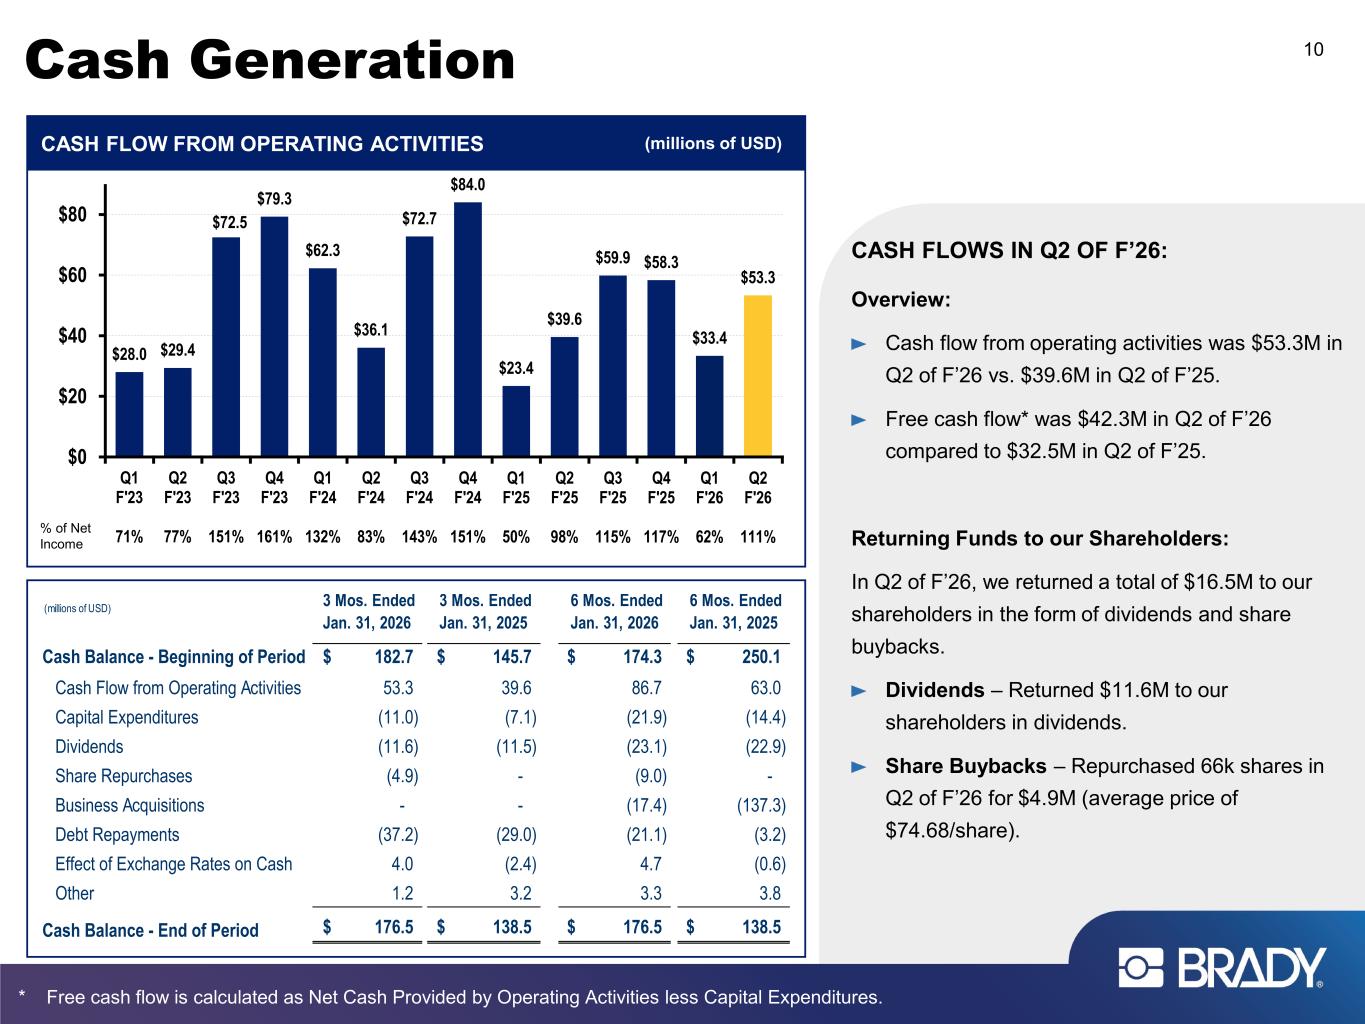
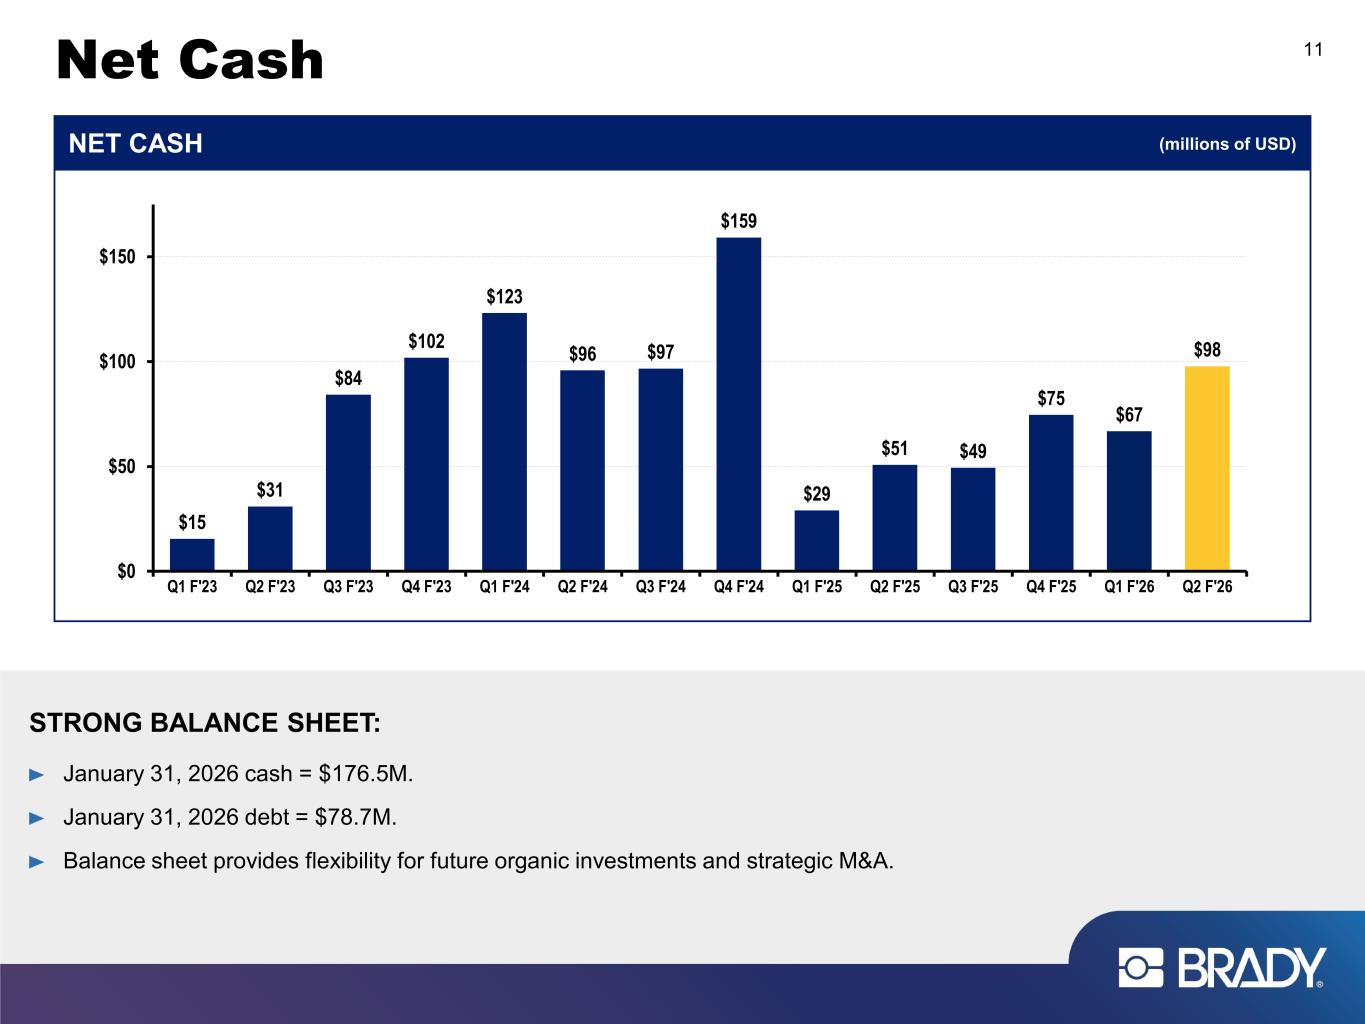
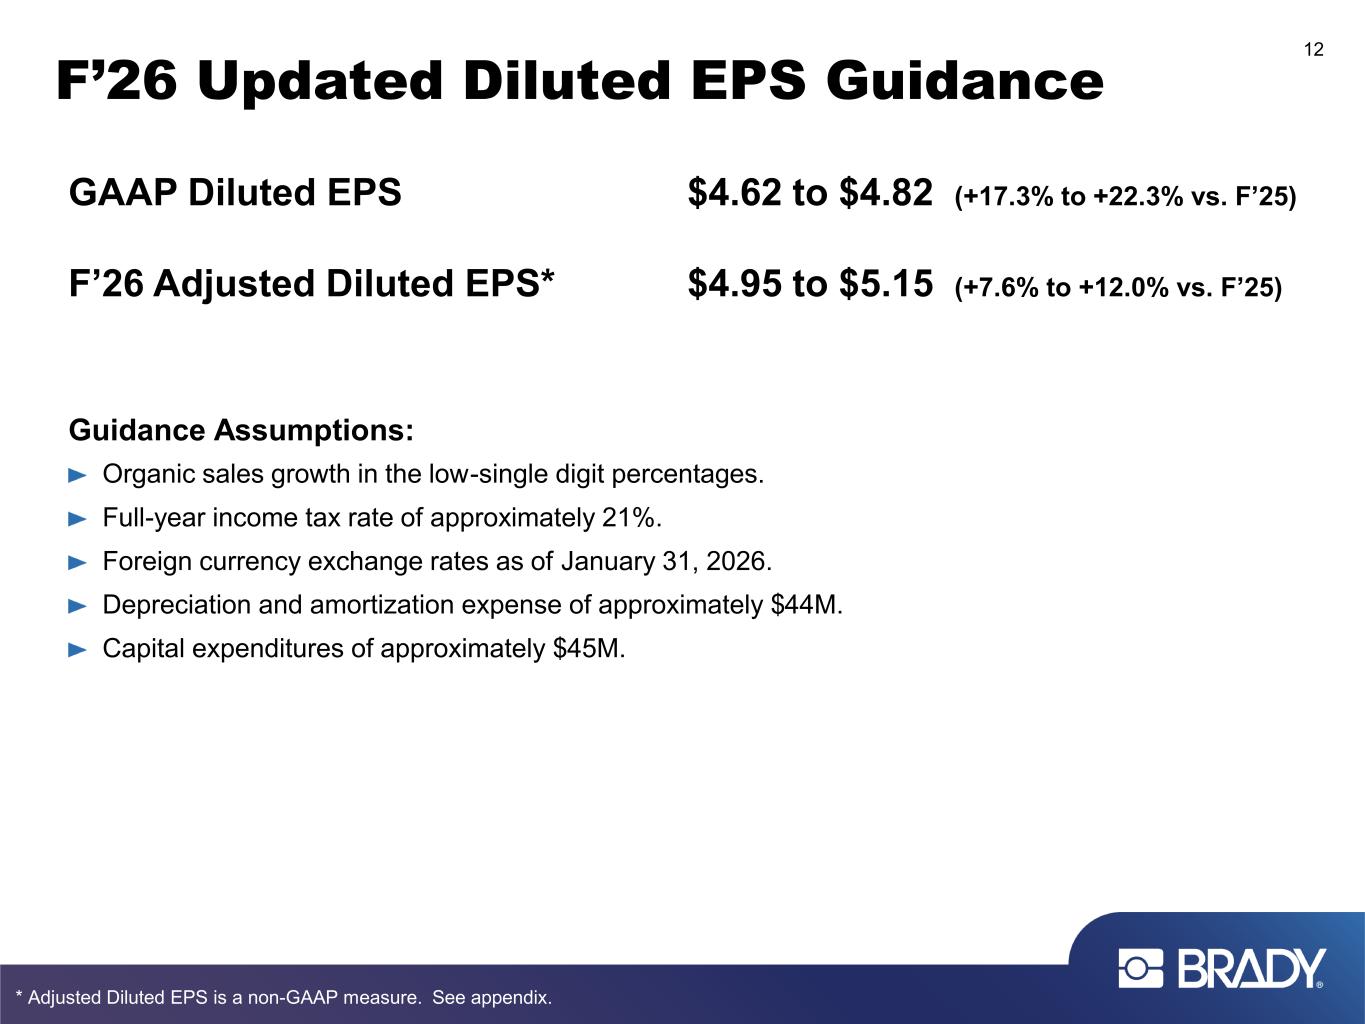
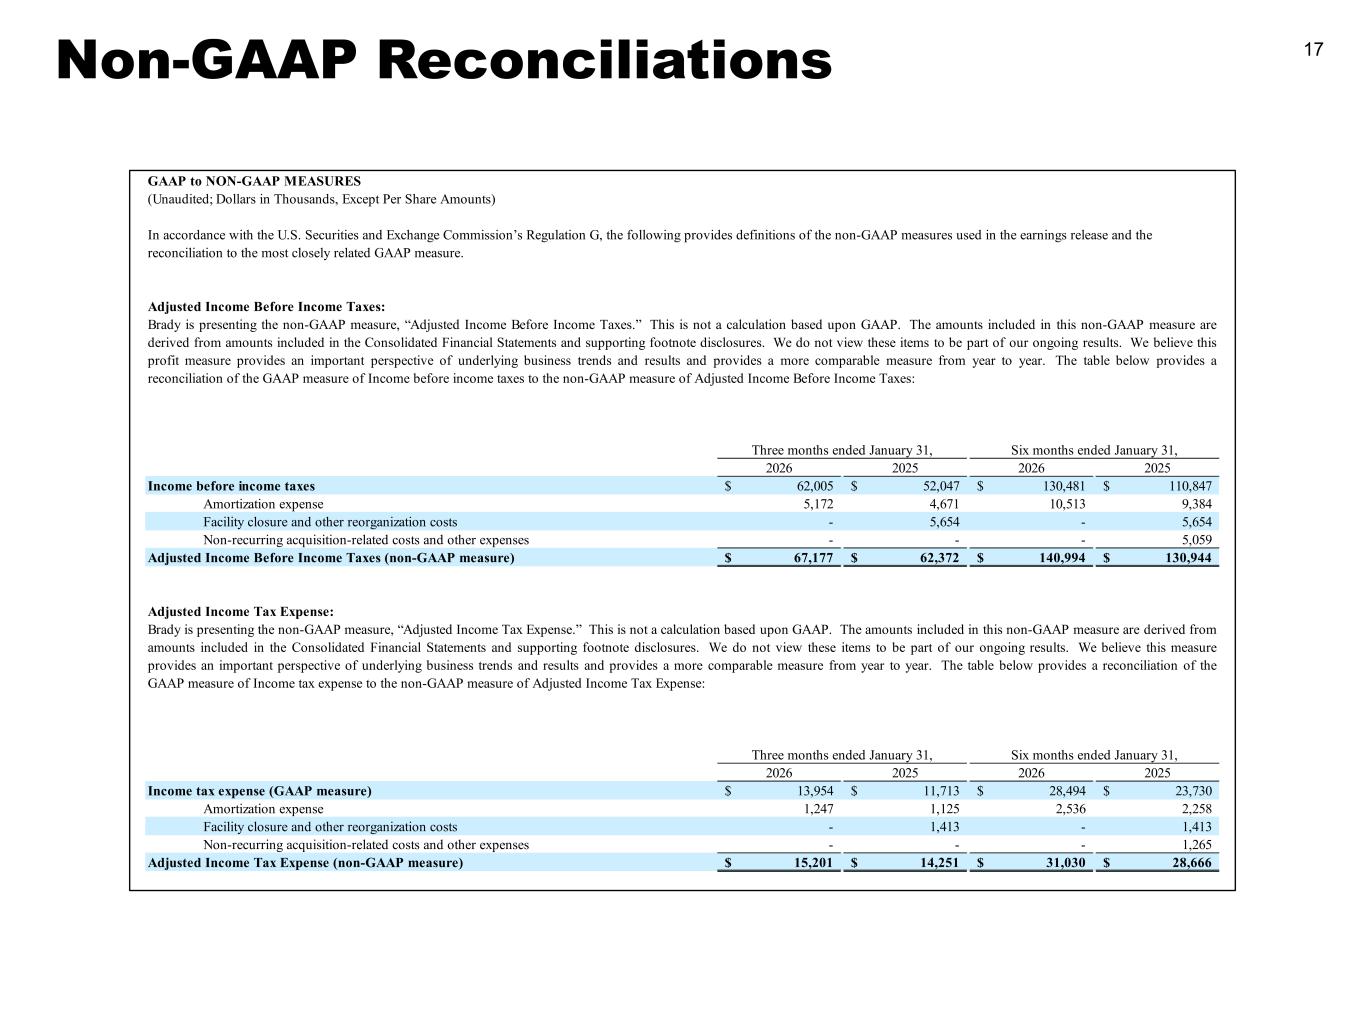
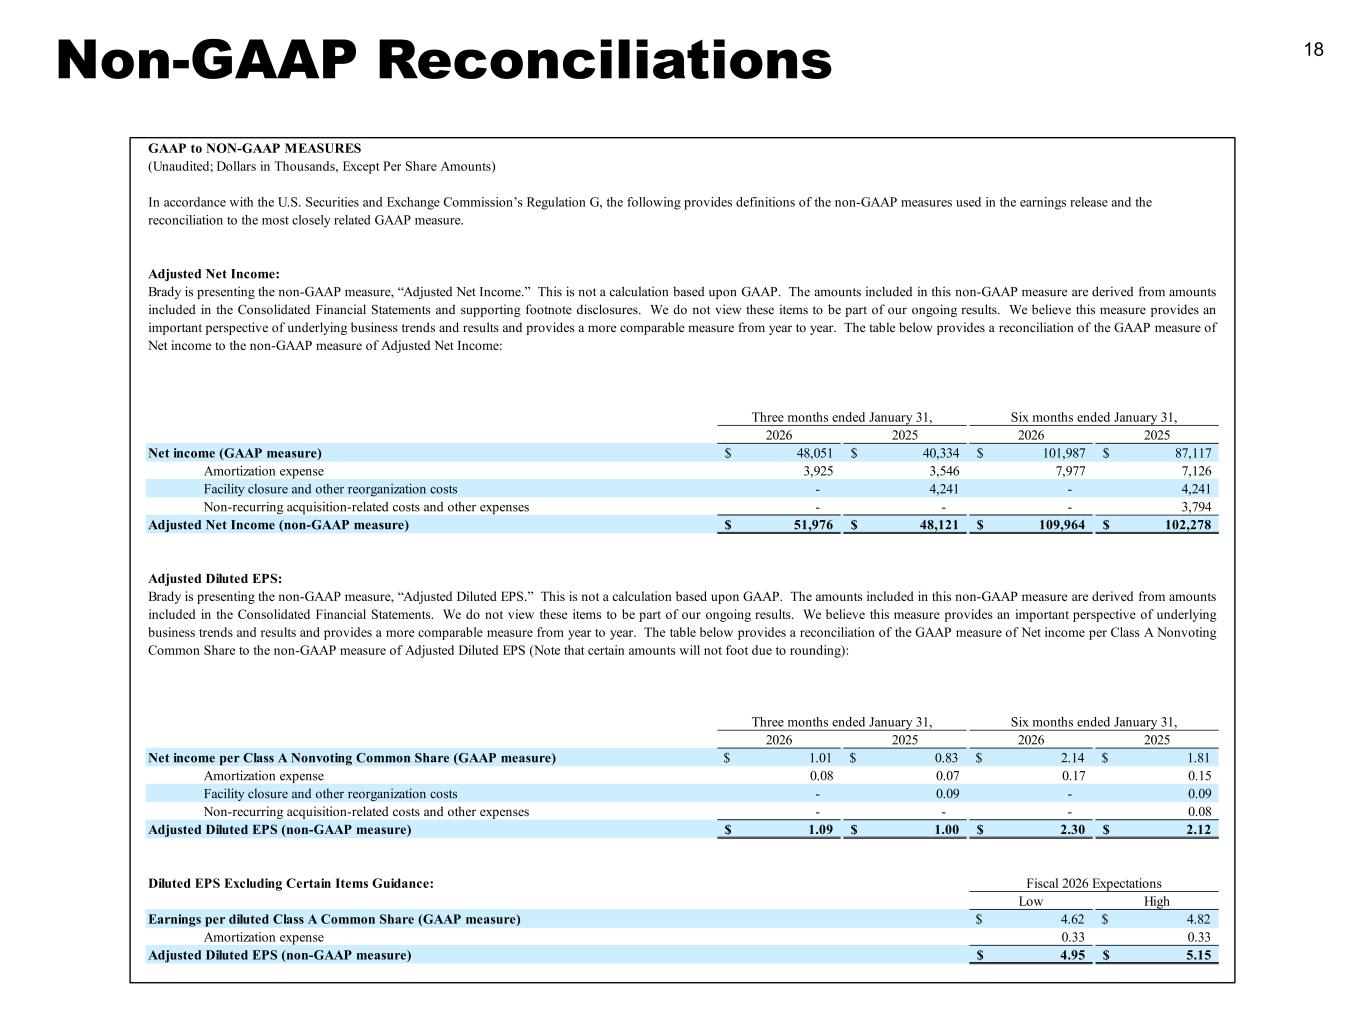
Thanks, Russell, for strong once again in the second quarter. Organic sales were up 1.6%, and as Russell just mentioned, this was our 20th consecutive quarter of organic sales growth as a company, which was led by the top line performance in our Americas and Asia region. The Americas and Asia grew 3.1% organically, which was partially offset by a slight organic decline of 1.1% in the Europe and Australia region. We also reported strong growth in our adjusted pre-tax income, as well as our adjusted diluted earnings per share in the quarter, while funding a significant increase in research and development. And we finished the quarter in a net cash position, which allows us to continue to invest in both organic opportunities and strategic acquisitions to continue to drive shareholder value into the future. Slide number four details our quarterly sales trends. Organic sales grew 1.6% this quarter, acquisitions added 2.3%, and foreign currency translation increased sales by 3.8% for total sales growth of 7.7%. Slide number five details our quarterly gross margin trending. Our gross profit margin was 50.6% this quarter compared to 49.3% in the second quarter of last year. Last year, we took actions to streamline our cost structure and we closed manufacturing facilities in Beijing, China, and Buffalo, New York, and we reorganized our overhead structure in Europe. Adjusting for the one-time charges in gross margin in last year's Q2, our gross profit margin would have been 49.8% in last year's second quarter. You can see the gross margin benefit from cost reduction actions in our results, along with our sales growth coming from our highly engineered products, both of which led to the improvement in gross profit margin from 49.8% last year to 50.6% this year. Turning to slide number 6, this details our SG&A expense trending. SG&A was $107.9 million this quarter compared to $105.9 million in the second quarter last year. As a percent of sales, SG&A decreased to 28.1% of sales from 29.7% last year. If you exclude amortization expense from the current and prior year, as well as the facility closure and other reorganization costs that we incurred last year, then SG&A was 26.7 percent of sales this quarter compared to 27.3 percent of sales last quarter. A decline of 60. We're seeing the benefits of our facility closure and other cost structure actions that we took last year, while we continue to invest in growth through targeted additions to our sales force, as well as expanding in certain geographies. Moving to slide number seven, this details the trending of our investments in research and development. We continue to increase our investment in new products within our organic business with products like BI 4311 that Wessel just described, as well as products from our acquisitions from last year. R&D expense was $24.3 million or 6.3% of sales this quarter, which was an increase from $18.7 million or 5.2% of sales in last year's second quarter. We funded a nearly 30% increase in R&D in the quarter and still improved profitability. This year, we do expect R&D as a percent of sales to be around 5.5%, slightly below six for 2026. So the trending of our pre-tax earnings. Pre-tax earnings on a gap basis increased 19.1% from 52 million to 62 million in the quarter. If you exclude amortization from both periods and exclude the facility closure and other reorganization charges we incurred last year, Pre-tax earnings increased 7.7% from $62.4 million to $67.2 million. Turning to slide number nine, this details the trending of our net income and earnings per share. Our net income increased 19.1% from $40.3 million to $48.1 million. Excluding amortization from both periods as well as with facility closure and other reorganization charges from last year, net income increased 8 percent from $48.1 million to $52 million. Deluded earnings per share was $1.01 compared to $0.83 last year. Excluding amortization from both periods and the facility closure and other reorg charges from last year, our adjusted diluted earnings per share grew to $1.09 this year from $1 last year, an increase of 9 percent. Our results continue to benefit from sales growth in our highest gross margin products, as well as from the cost reduction actions that we took last year in certain areas of our business. Moving to slide number 10, this details our cash generation. Operating cash flow increased 34.7% to $53.3 million in the second quarter of this year, compared to $39.6 million in the second quarter of last year. And free cash flow increased 30.5% to $42.3 million in Q2 of this year, compared to $32.5 million in last year's Q2. Year-to-date, our cash flow from operating activities is up nearly 38% versus last year, which demonstrates our high-quality earnings and our consistent focus on cash basis. Slide number 11 outlines the impact that our cash generation has had on our balance sheet. As of January 31st, we were in a net cash position of $97.8 million. Our approach to capital allocation is consistent, and that is to always fund organic sales growth and efficiency opportunities. This includes investing in new product development, sales generating resources, capability enhancing capex, and improvements in automation. We have the ability to invest throughout the economic cycle so that we're always positioned to grow the top line and our profitability. And we're focused on consistently increasing our dividends. At the beginning of this fiscal year, we announced our 40th consecutive annual dividend increase, which was a very exciting milestone for us as a company. From here, we're disciplined and opportunistic in our approach to both acquisitions and share buybacks. We're focused on identifying acquisitions with clear synergies, and we have the financial strength to do all of this, to fund our organic business, our dividend, M&A opportunities and share buybacks. So far this year, we've purchased 121,000 shares for $9 million, which works out to an average price of $74.23 per share. Moving to slide number 12, this details our fiscal 2026 guidance. We're increasing the bottom end of our full year fiscal 2026 previously announced adjusted diluted EPS guidance range from $4.90 to $5.15 per share to $4.95 to $5.15 per share. And we're increasing the bottom end of our full year gap EPS guidance range from $4.57 to $4.82 per share to $4.62 to $4.82 per share. Our adjusted diluted EPS guidance range represents a range of growth of between 7.6% to 12% compared to 2025. We expect organic sales growth in the low single-digit percentages for the year ending July 31, 2026. Other elements of our guidance include depreciation and amortization expense of approximately $44 million, capital expenditures of approximately $45 million, and a full-year income tax rate of approximately 21%. Our income tax rate generally tends to be slightly lower in the fourth quarter compared to our full-year expectation, which is based upon our historical profit mix and the expected timing of other discrete adjustments. Potential risks to our guidance, among others, include potential strengthening of the U.S. dollar, inflationary pressures that we're unable to offset in a timely enough manner, or an overall slowdown in economic activity. Now I'll turn it back over to Russell to cover our regional results and to provide some closing thoughts before Q&A.
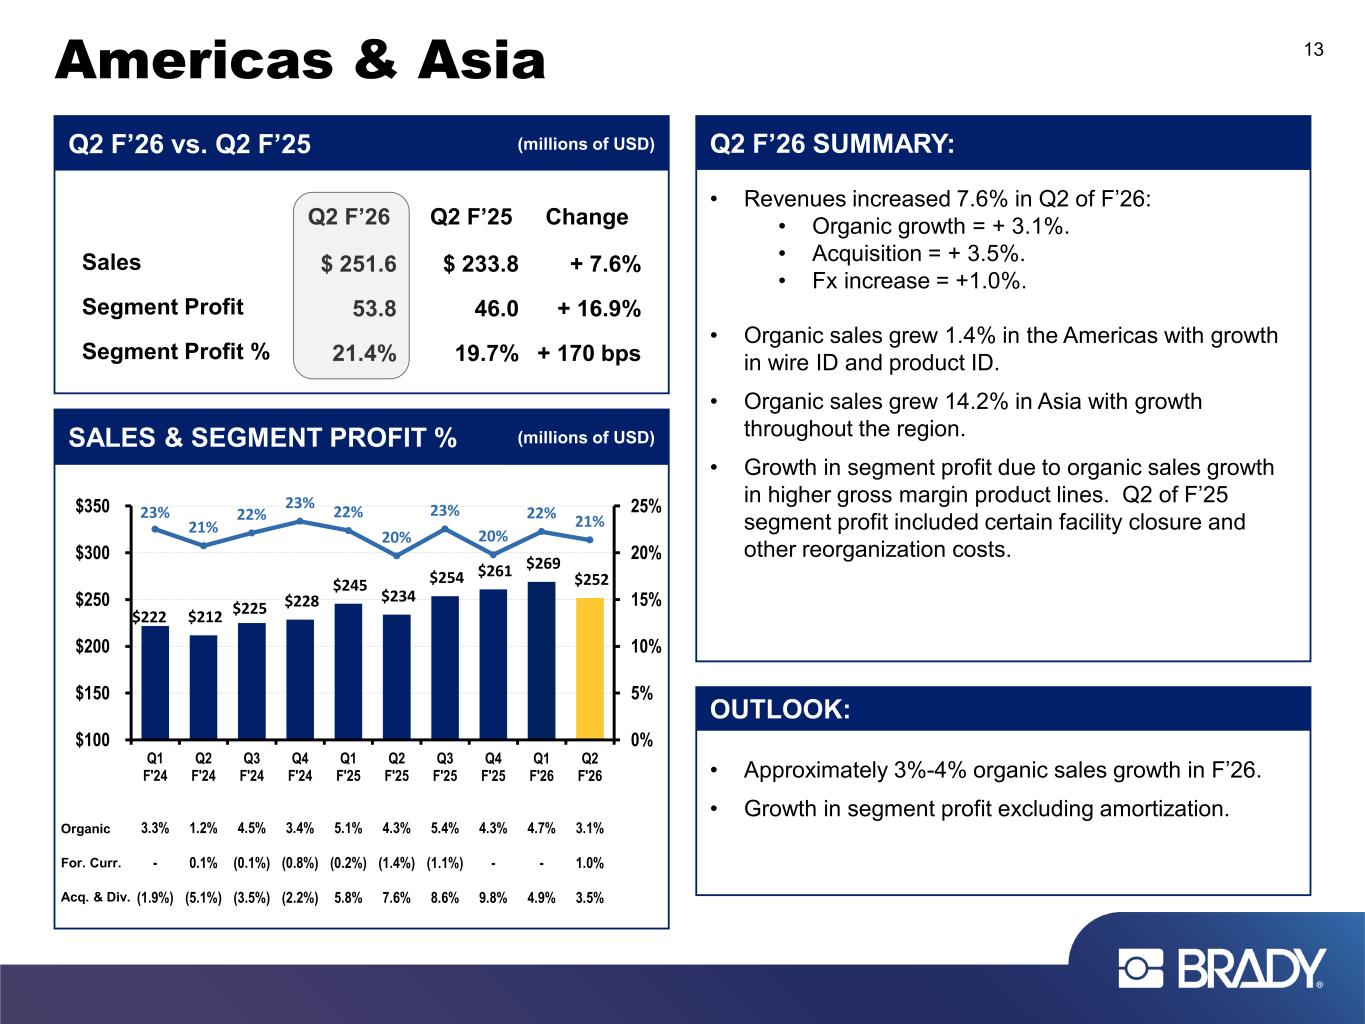
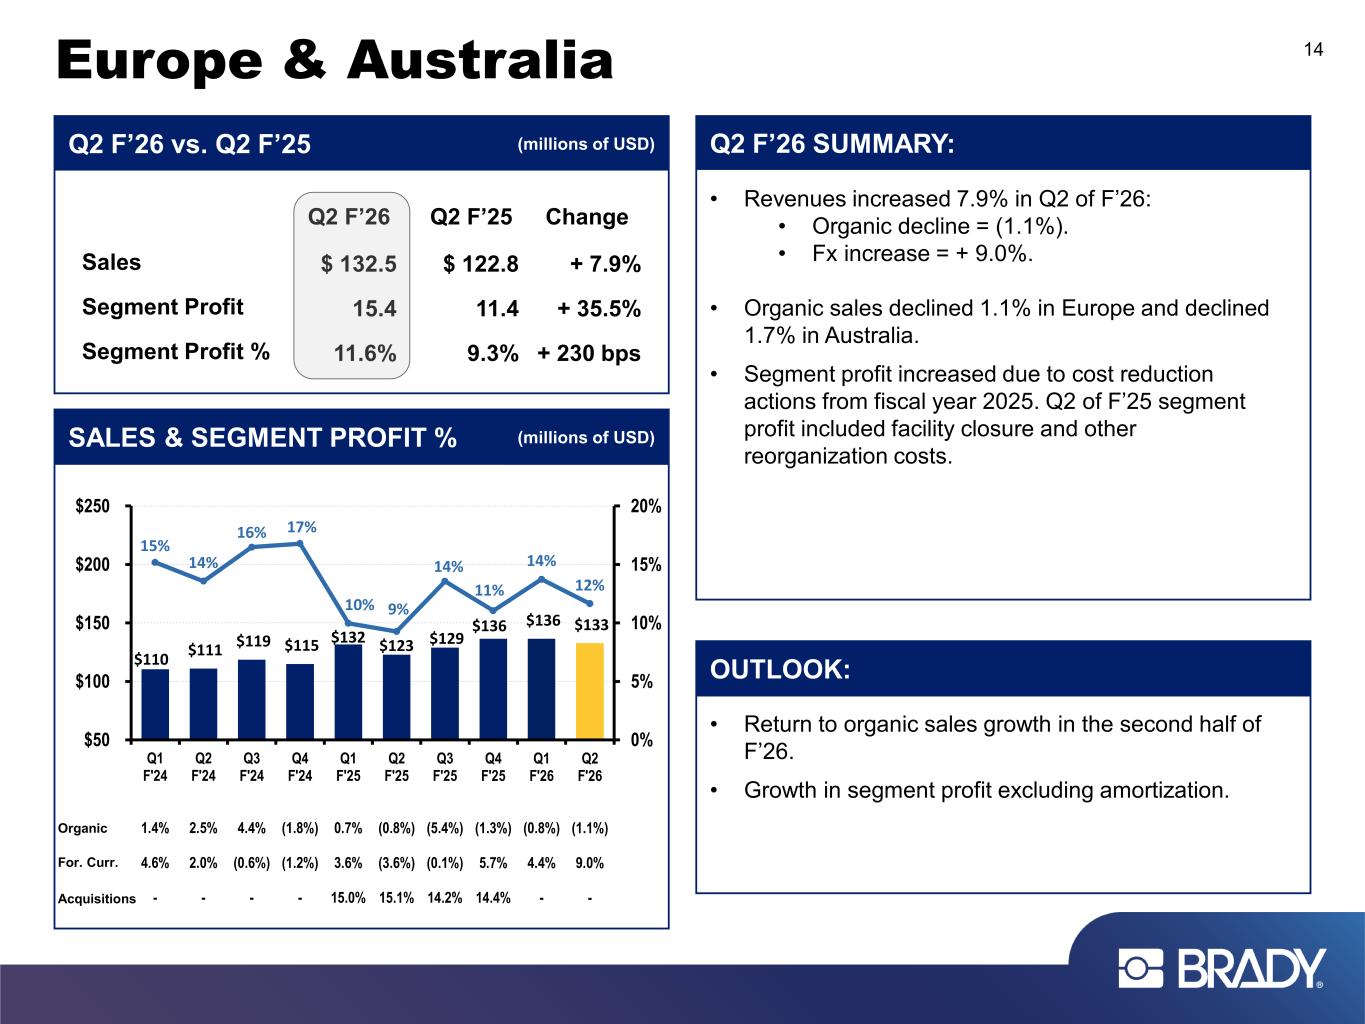
Slide 13 details the financial results of America's and Asia region. Sales were $251.6 million this quarter, up 7.6 from Q2 last year. Organic sales growth was 3.1%, acquisitions added 3.5%, and foreign currency translation increased sales 1%. We grew sales in most of our major product lines with growth once again led by our wire identification product line and nearly 8% in the quarter. Data centers are an ideal use case for our specialty wire ID solutions and this has been a growth leader for us. Asia continues its strength of strong performance with organic growth of 14.2%. Asia with nearly 25% organic sales growth this quarter. of India over the last several years, and India is now our second largest business in Asia. In America's and Asia region increased 16.9% to $53.8 million, and segment profit as a percentage of sales increased from 19.7% to 21.4% in the second quarter. The amortization in both the current quarter and last year's Q2, these from last year, segment profit increased 11.3%. Our sales growth in engineered products, at least from last year, have led to improved profitability. Tariffs are still a headwind in the U.S. compared to last year's second quarter. We're constantly taking steps to mitigate the effects, and halfway through the year, we continue to expect the full-year incremental impact to be at the low end of the range we initially provided, which was approximately $8 million. Slide 14 details the financial results of our Europe and Australia region. Sales were $132.5 million in the quarter. Organic sales declined 1.1% and foreign currency translated added 9% for a total growth of 7.9% in the region. The manufacturing environment in Europe has been weak for the last several quarters and we're feeling the effects of that. But we still saw growth in our WireID product line in the quarter, so we're benefiting from the data center expansion in this key product line in Europe and Australia as well. We saw sales declines in safety and facility ID and product ID, which are more closely tied to general manufacturing and automotive. Despite the weak macro activity in the region, we reported significant improvement in segment profit once again this quarter. Our reported segment profit in Europe and Australia increased 35.5% in the quarter to $15.4 million, and segment profit as a percentage of sales increased from 9.3% to 11.6%. If you exclude the impact of amortization in both the current quarter and last year's Q2 as well as the facility closure and other reorganization activities from last year, segment profit increased 10.6% compared to the prior year. We took several actions last year to reduce our cost structure in both Europe and Australia and we're seeing the benefits in our results this year. We're positioned for increased profitable growth when manufacturing activity picks up in the region. I know we're on the right track halfway through the year. We're growing sales, we're improving profitability, and we're generating increased cash flow all while investing in our products. I'm really looking forward to our customers' reactions to the brand new i4311 transportable label printer and we have a lot more to come in our product pipeline. We work hard to help our customers operate a safe and productive workplace in any industry anywhere in the world. Product marketing and identification requirements are rapidly changing with the upcoming GS1 standards and the European Union product labeling requirements being only a couple of examples. This means that our customers are facing a more extensive set of identification requirements that call for both the knowledge and the solutions to be able to comply. This is exactly where Brady excels. Our goal is to provide our customers with easy-to-use products that meet complex requirements in situations with a high cost of failure. We value our customers, and our number one focus is to provide them with solutions that keep them coming back to Brady. We've reported a strong first half of 2026, we have momentum in our Americas and Asia region, and we've nearly returned to growth in Europe and Australia. Our acquisitions added direct part marking and inkjet printing capabilities to our product portfolio, helping us achieve our objective, which is to provide easy-to-use solutions for all of our customers' identifications need. With that, I'd like to turn it over for Q&A. Operator, would you please provide instructions to our listeners?
Operator
Thank you. As a reminder, to ask a question, please press star 11 on your telephone and wait for your name to be announced. To withdraw your question, please press star 11 again. Please stand by while we compile the Q&A roster. Our first question comes from the line of Steve Ferrazani with Sidoti. Your line is now open.
Morning, Russell. Morning, Ann. Thanks for the detail on the call. I wanted to start with, you know, what I can say to us was a negative surprise was the organic sales growth in the Americas. I mean, down to only just over 1%. I mean, if I group that with what you're doing in Europe and Australia, it looks like if I combine those, your organic growth is completely dependent on Asia right now, despite the fact you're investing, you know, 6% plus sales in R&D. Was this a one-quarter blip, or where is the growth going to be?
Steve, our organic growth in the Americas and Asia region this quarter was actually up 3.1%.
I'm speaking specifically about the Americas. That's what I'm saying. If you put the Americas and group them with Australia and Europe, net that's probably going to be down, which means all your organic growth came from Asia.
Gotcha. My apologies. Yeah, the Americas on its own was up 1.4%, and Asia on its own was up 14.2%. So we did take the bid step back and the momentum on organic growth in the Americas on its own in the quarter.
That's what I'm asking. Is that a one-quarter blip or what's the trend here? What are you seeing as you late in the quarter from orders and now into pretty deep into Q3?
Yeah, so we feel like we're headed in a better direction for us. November was actually a little bit on the weak side in the Americas, but as we exited the quarter, we definitely saw some improvements. You know, I think there is still some struggling out there with U.S. manufacturing, certainly not as bad as Europe, but it has not been as robust as we would have expected.
And how much of that 1.4% growth in the Americas was price versus volume?
It was virtually no price, okay. What do you think gets you back to a growth trajectory? Is it going to be completely macro-dependent?
Yeah, we correlate very tightly, particularly in America, to U.S. manufacturing capacity utilization, which right now is in the 78%, 77% range. We see something closer to 80% is very stimulative for us. It's starting to trend up a little bit, but it's still not at a point that we would like.
Okay. And then if I can ask about the very healthy margins again, it sounds like you weren't that aggressive on pricing, so it sounds like more of a mix for this quarter.
Yeah, it's a mix. As you can imagine, you know, our more commoditized products have actually done less well compared to our engineered products. So, you know, while I'll say the empty calories of our commoditized products have clearly gone down year over year, the engineering products have more than compensated for that, which is in turn bumped up our margins.
Thanks, Russell. Thanks, Anne.
Operator
Thank you. Our next question comes from the line of Keith Halsam with North Coast Research. Your line is now open.
Good morning, guys. appreciate the opportunity as always. You know, Russell, you have confidence in Europe and Australia returning to growth here in the second half of the year. I guess what's giving you some of that confidence?
I was taking a tour of Pulse of manufacturing over there. It feels like there will be modest, I mean, and when I mean modest, they'll go from a contraction to maybe a 1% growth. I'm not saying by any stretch of the imagination that we saw something super robust that they actually hit bottom towards the end of last calendar year and they're starting to see a recovery. So I think there's still an awful lot of headwinds in Europe in terms of energy prices and some of their policies due to manufacturing. You know, it's no surprise if you read about heavy manufacturing in Europe has been particularly hard hit by energy prices and the influx of lower cost Chinese products. So, you know, we're hoping they're doing it. And, you know, we also are seeing some growth in some of the non-core European countries. Middle East is doing pretty well for us. The Poland and Eastern Europe also doing well, Scandinavia, unfortunately, those economies are not quite as big as the Germany, France, and UK, which largely are still struggling.
Got it. And then, you know, the GravSec acquisition is probably a year and a half behind you. You guys have added MECO or MECO, I apologize for the way you say it, and how is that performing for you guys? I know you guys had some, you know, restructuring you guys were doing there, but how are we in terms of growth trajectory?
Yeah, so it's technology perspective. It has done 100% of what we wanted. We wanted to have that capability for direct part marking, which we see as a significant growth potential, particularly if you look at European digital passports and some of the initiatives here in the United States to have unique parts. I think in the short term, we're definitely seeing a little bit of an impact of European automotive. They do serve the European automotive market, and manufacturing in Europe, particularly in Germany, has been pretty hard hit, in fact, is still below where they were in 2019. So there's one slice of Gravotech related to automotive that I think has been weak, but the rest of the business is doing well and actually amongst that group.
Interesting. Appreciate that. You know, just to get this question out there, because I'll ask everybody, I know your printer has used a small amount of memory. Any issues you guys are facing in terms of pricing or shortages on memory?
No issues, long period of time. We're a memory light user, you know, will it affect our bomb a teeny bit? Yeah, probably, but, you know, we're not anywhere near, say, the usage of a tablet or a mobile computer or something like that. So, you know, at the margin, it's just a very, very small effect.
Gotcha. And I appreciate your commentary on R&D and R&D is an investment for the longer term, but maybe help reconcile it for investors because, again, we did see, you know, 1.1% organic growth or 1.6%, whatever it was, you know, probably less than what we expected. But yet R&D has, you know, significant investment. how should we reconcile the increase in the R&D versus the, I guess, the declining, you know, organic growth?
So, if I look at our non-engineered products, we're probably collectively in the 40% growth margin. Now, fortunately, that's a small percentage of our portfolio versus the engineered products are mid-50s and higher. I wish all of our products had the engineering behind them. So, you know, we continue to do that. I think that is 100% of Brady's growth story over the last decade. And it was a part of what I said. You know, for us, engineering is a multi-year journey. The investments we're making today are things that pay back in three years. I would never look at engineering and R&D on a quarterly basis. It's kind of irrelevant. I would look at it more of the journey Brady's been on in the last 10 years where we've tripled our operating income while R&D has gone from 3% to 6%. So I wish we can keep that trend going for the next decade. And again, I am super delighted to have our new CTO joined. I can't say enough about the experiences. She's bringing in a more connected ecosystem. She came from Honeywell, and I think that is, she will help us get to the next level in the coming years.
Great. Last question for me. If I think about the European business, it probably has always had a little bit more of the commodity type products, but it's been more defensible and the pricing has been better Any signs or concerns that that pricing for the commodity type of products might be breaking Yeah.
So, that was always has been an issue in the UK, much, much less so in the other countries. You know, we've seen it. We continue to see some deterioration in the UK, but it's also the backdrop of the overall UK economy, which isn't awesome as well. So as Brady goes on, I wouldn't say that there's any trend there that is catastrophic. It's just the long-term revolving of Brady out of commodity products into manufactured products. It's a journey we've been on for years. It will continue to happen. unfortunately it is a little bit of drag on our overall growth but we'll we're going to get through it and that's that's kind of the story of Brady.
Great thanks guys appreciate it.
Operator
Thank you and I'm currently showing no further questions at this time I now like to hand the call back over to Russell Schaller for closing remarks.
Your time and participation today we have to do the first half of 2026 with momentum going into the second half of the year we're investing in new product development and it's our highly engineered products that drive organic sales growth and profitability improvement. We have more products in our pipeline that are focused on solving our customers' problems in the simplest way possible, which also gives us the opportunity to engage with a broader set of customers and markets. Despite the tariff environment and the decline in manufacturing activity in Europe and Australia, we still grew organic sales for the 20th century, increasing our investment in R&D. We keep our focus on and what we control, and we move forward with a long-term, I continue to be optimistic about this year and our ability to deliver improved results for our shareholders. Thank you for your time this morning. Operator, you may disconnect the call.
Operator
This concludes today's conference. Thank you for your participation. You may now disconnect.