Operator
Good afternoon, ladies and gentlemen, and welcome to the C.H. Robinson fourth quarter 2025 conference call. At this time, all participants are in a listen-only mode. Following the company's prepared remarks, we will open the line for a live question and answer session. To ask a question, please press star 1 on your telephone. If anyone needs assistance at any time during the conference, please press star 0. As a reminder, this conference is being recorded Wednesday, January 28th, 2026. I would now like to turn the conference over to Chuck Ives, Senior Director of Investor Relations.
Thank you, Operator, and good afternoon, everyone. On the call with me today is Dave Bozeman, our President and Chief Executive Officer, Michael Castagnetto, our President of North American Surface Transportation, Arun Rajan, our Chief Strategy and Innovation Officer, and Damon Lee, our Chief Financial Officer. I'd like to remind you that our remarks today contain forward-looking statements. Slide two in today's presentation lists factors that could cause our actual results to differ from management's expectations. Our earnings presentation slides are supplemental to our earnings release and can be found in the investor section of our website at investor.chrobinson.com. Today's remarks also contain non-GAAP measures and reconciliations of those measures to gap measures are included in the presentation. With that, I'll turn the call over to Dave. Thank you, Chuck.
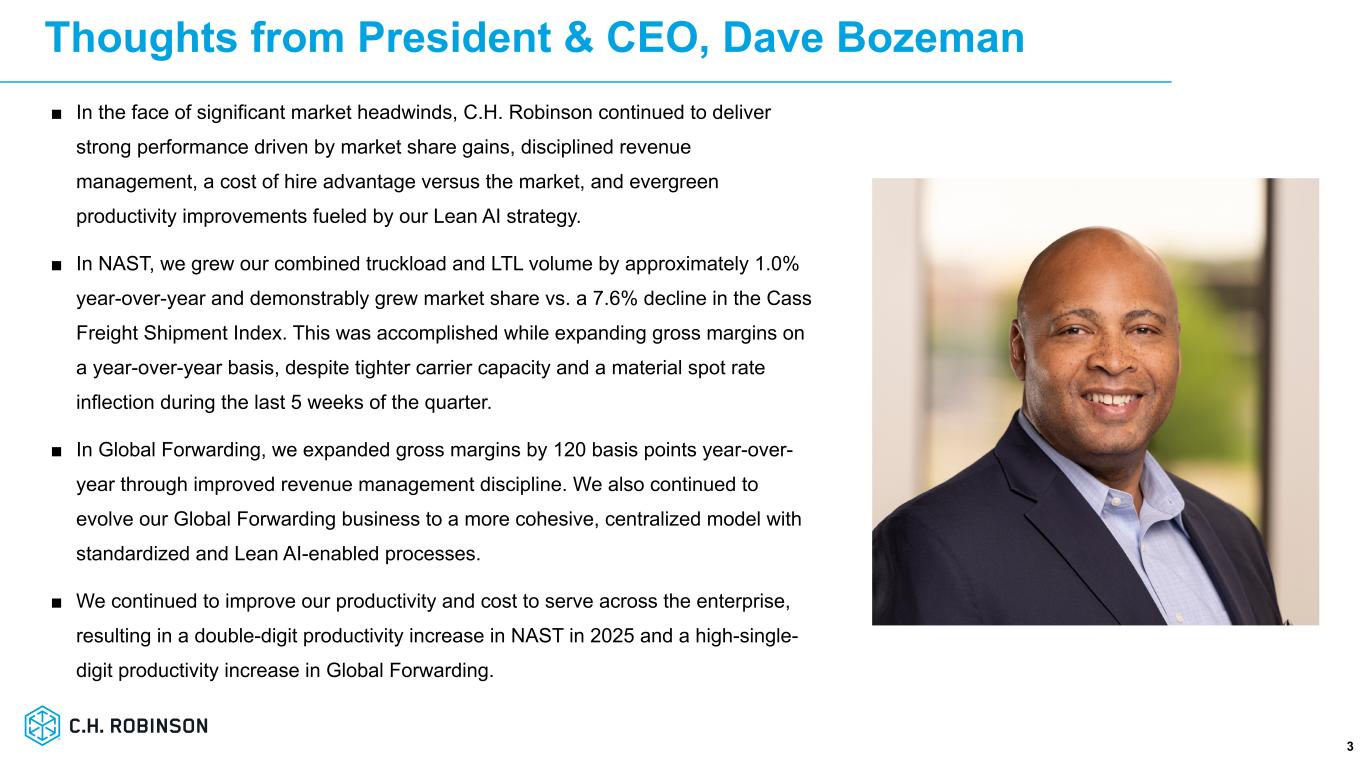
Good afternoon, everyone, and thank you for joining us today. Over the past year, we've consistently said that we're not immune to macroeconomic conditions, but that we are managing them better than we have in the past. The fourth quarter certainly provided a challenging macro environment. With weak global freight demand, rising spot costs in trucking, and falling ocean rates all providing headwinds to our business. The Cash Freight Shipment Index declined year over year for the 13th consecutive quarter and was the lowest Q4 reading since the financial crisis of 2009. Spot market costs for truckload capacity spiked during the last five weeks of the quarter. due to a seasonal decline in capacity, three winter storms, and incremental pressure from the cumulative enforcement of various commercial driver regulations. International freight continues to be impacted by global trade policies, which caused previous front loading, a dislocation of shipments, and a more pronounced decline in demand after the Q3 peak season. Combined with excess vessel capacity this caused ocean rates to decline substantially versus a year ago consistent with the expectations that we laid out at our investor day in december of 2024. so the macro conditions for global transportation companies were difficult in q4 and we are not impervious to these volume and rate dynamics however we've consistently focused on controlling what we can control which is providing differentiated service and solutions to our customers and carriers, executing with discipline, and continuously improving our business model and our cost to serve. This focus and the strength of our lean AI, which is the combination of our lean operating model, industry-leading technology, and the best logisticians, has enabled us to consistently outperformed over the last two years and we did it again in q4 in nast we grew our total volume by one percent and our truckload volume by approximately three percent on a year-over-year basis compared to a 7.6 percent year-over-year decline in the cash freight shipment index this reflects another quarter of demonstrable market share growth this was accomplished while mitigating some of the market pressure on gross profits through strong revenue management practices and by improving our cost of higher advantage these disciplines enabled us to improve our nas agp margin by 20 basis points on a year-over-year basis despite the pressure on spot market costs from a decline in available capacity in global 40 we expanded gross margins by 120 basis points year over year through improved revenue management discipline we also continue to evolve our global 40 business to a more cohesive centralized model with standardized and lean ai enabled processes we continue to improve our productivity and cost to serve across the enterprise, resulting in a double-digit productivity increase in NAVs for the full year and a high single-digit productivity increase in Global 40. As we continue to purposely engineer our work to drive higher automation, a lower cost to serve, and improve customer outcomes, all of this is aimed at building the best model for demonstrable outgrowth while continuing to have industry-leading operating margins. I'm proud of our employees for navigating difficult market conditions with discipline and ingenuity, and for embracing the culture shift that has fundamentally changed this company. Changing the culture of a company is hard work. We've shifted to a culture of solving problems with speed, and the implementation of a lean operating model has contributed greatly to this change. we certainly encounter challenges along the way but how we solve them now is different and it's not easy for others to replicate with the discipline and tools that we've armed our people with we solve challenges with a lean mindset with experimentation and with urgency as we've said consistently over the past year we are not waiting for a market recovery to improve our financial results, and the strategies that our team is executing are built to be effective in any market environment. With our strong balance sheet and cash flow generation, we are comfortable operating in an environment that is lower for longer. We're also highly confident in our ability to continue executing on all of our strategic initiatives including further increasing our operating leverage when freight demand eventually inflects our model with an industry-leading cost to serve is highly scalable and we expect it will improve further as we continue to harness the evolving power of ai to drive automation across the quote to cash life cycle of a load while we've made considerable progress we're still in the early innings of our lean ai journey lean ai is our unique disciplined approach to ai innovation that is transforming supply chains it combines the principles of our robinson operating model rooted in lean methodology with the power of custom-built ai and the expertise of our people to maximize value minimize waste and drive better outcomes for customers and carriers as a result we are building an ever-expanding fleet of ai agents that continues to not only improve our productivity and operational performance by automating manual tasks that free up our industry-leading talent to focus on more strategic higher value work but they're also directly enhancing the service and value we deliver to our customers and contributing to our market share gains. In other words, we are using our trusted domain expertise to build technology that delivers on our customer promise and drives higher value for all of our stakeholders. We are the trusted provider that customers look to for cutting-edge innovation, differentiated solutions, and best-in-class service. And while we're pleased with the results we've delivered in the last two years, we are still in the early stages of our transformation. Significant runway exists as we continue to deepen the lean mindset and scale custom-built AI agents across the enterprise. I'll turn it over to Michael now to provide more details on our NAS results.
Thanks, Dave, and good afternoon, everyone. In Q4, the macro conditions that Dave mentioned provided another opportunity for us to test our lean disciplines, our revenue management practices, and our ability to widen our cost of capacity advantage versus the market. While we continue to identify opportunities for further improvement, the expertise and discipline of our team and the resilience of the Robinson operating model once again demonstrated what we can do in a difficult freight environment. For the 11th consecutive quarter, the team delivered market share growth in Q4. With the freight recession exceeding three years, the Cass Freight Shipment Index declined on a year-over-year basis for the 13th consecutive quarter in Q4 and was down 7.6%. In contrast, our combined truckload and LTL volume delivered positive growth of approximately 1% year-over-year. Truckload volume rose approximately 3% year-over-year, and LTL volume increased approximately 0.5% year-over-year, reflecting market share gains in both modes. One of the keys to our consistent market share gains has been volume growth in some key verticals that we've specifically targeted. During Q4, we delivered double-digit year-over-year volume growth in both the retail and automotive verticals. These results reflect the execution of our strategic focus and our expanded capabilities that directly support these segments and evolving customer needs, such as our leading drop trailer and cross-border capabilities. Over the course of 2025, we augmented our value-added solutions in these areas, including introduction of our drop trailer asset management system and cross-border freight consolidation while expanding our warehousing and cross-docking space at the U.S.-Mexico border. These solutions are designed to address real customer pain points while simplifying complexity, reducing costs, and delivering consistent, high-quality service across the supply chain. In our greater than $3 billion LTL business, where we move more LTL freight than any other 3PL in North America, we delivered year-over-year volume growth for the eighth consecutive quarter, reflecting consistent outperformance versus the broader LTL market. Through our deep, long-standing relationships with LTL carriers and our proven ability to manage service variability among the carriers to deliver a consistently high level of service to our customers, they continue to turn to us to simplify the complexities of LTL freight and to reduce their costs. One example of how we're applying our lean AI to simplify complexity is with AI agents that we launched in 2025 to use a widespread shipper pain point of missed LTL pickups. These new AI agents are tracking down missed pickups and using advanced reasoning to determine how to keep freight moving. They're also collecting and analyzing previously unavailable data that LTL carriers are now using to improve their technology, scheduling, and operations. As a result, shippers' freight moves up to a day faster, and return trips to pick up missed freight have been reduced by 42%. Additionally, 95% of our checks on missed LTL pickups are now automated, saving over 350 hours of outsourced manual work a day. This is another example of Robinson only deploying AI agents where they can deliver tangible business results. As Arun and Damon like to say, there's no hobby AI at Robinson. As I mentioned earlier, Q4 also provided another opportunity to test our revenue management practices and our ability to widen our cost of capacity advantage versus the market. That opportunity arose due to a five-week stretch of capacity disruptions caused by a seasonal decline in capacity, three consecutive winter storms, and incremental pressure from the cumulative enforcement of various commercial driver regulations. As a result, drive-van load-to-truck ratios increased to approximately 10 to 1 versus 6 to 1 during the comparable period in 2024, and spot market costs for truckload capacity spiked. Our team of freight experts once again responded to the spot rate inflection, supported by our lean operating model disciplines and our cost and price discovery tools to widen our cost of higher advantage during the quarter and to capture higher margin loads in the spot market to somewhat offset the margin pressure on our contractual portfolio. Despite the tougher conditions and a higher mix of contractual volume, these efforts enabled us to hold our truckload AGP per mile flat year-over-year and to deliver improvement in our NAST gross margin. Our ability to deliver these results continue to give us confidence in our ability to handle a sustained spot rate inflection better than we have in the past, resulting in a gross margin squeeze that we expect to be shorter in duration and shallower in impact than historically. Our team continues to actively assess the market and optimize for the most effective combination of volume and margin to enhance earnings performance. With strategic agility built into our model, we have the flexibility to pivot toward volume or margin as market dynamics evolve, making disciplined, data-driven adjustments in real time, all while staying focused on long-term value creation. We're also making smarter use of our proprietary digital capabilities and getting actionable data and AI-powered tools into the hands of our freight experts faster, enabling them to make better decisions and to capture the optimal freight for us. These digital capabilities also enabled us to continue delivering double-digit productivity increases in NAST in 2025. Since the end of 2022, we have delivered a more than 40% increase in shipments per person per day, and this is measured across the entirety of our NAST organization. This enhanced efficiency is not only lowering our industry-leading cost to serve, but it is also elevating the customer experience by enabling faster, more reliable service. And while shifts in market dynamics and regulatory changes continue to occur, we remain confident in the strength and reliability of our carrier network. Our diversified carrier base and thorough vetting give us a high degree of comfort in our ability to navigate these changes without disruption and to maintain a high level of service quality for our customers. Looking ahead to Q1, it is typically a seasonally weaker quarter compared to Q4, and then the market usually shows seasonal growth in Q2 and Q3. For Q1, the 10-year average of the CASS Freight Shipment Index reflects a 2.3% sequential volume decline from Q4. The spot rate trend in Q1 is historically a near-mirror image of Q4, with rates ramping up in Q4 and then trending back down to pre-holiday levels by the end of Q1 or early Q2, as capacity returns after the holidays and demand enters a softer period. The timing, frequency, and severity of winter storms during Q1 usually impacts the pace and magnitudes of those trends. There is less elasticity in the supply of capacity, and market events now cause more dramatic changes in spot rates, and the cost pressures that we experienced in December have carried into January. As Dave said in his opening comments, we'll remain focused on what we can control, regardless of market conditions, and we will continue to deliver industry-leading solutions and flexibility that only a scaled broker can provide to customers and carriers. Our people and their unmatched expertise enable us to deliver exceptional service, greater value, and they are relentlessly driving improved results. I'm proud of our 2025 results and proud of our team that continues to learn and improve. With much more runway for improvement in front of us, we're still in the early innings of our transformation journey. With that, I'll turn it over to Arun to provide an update on the innovation we're delivering to strengthen our customer and carrier experience and improve our gross margin and operating leverage.
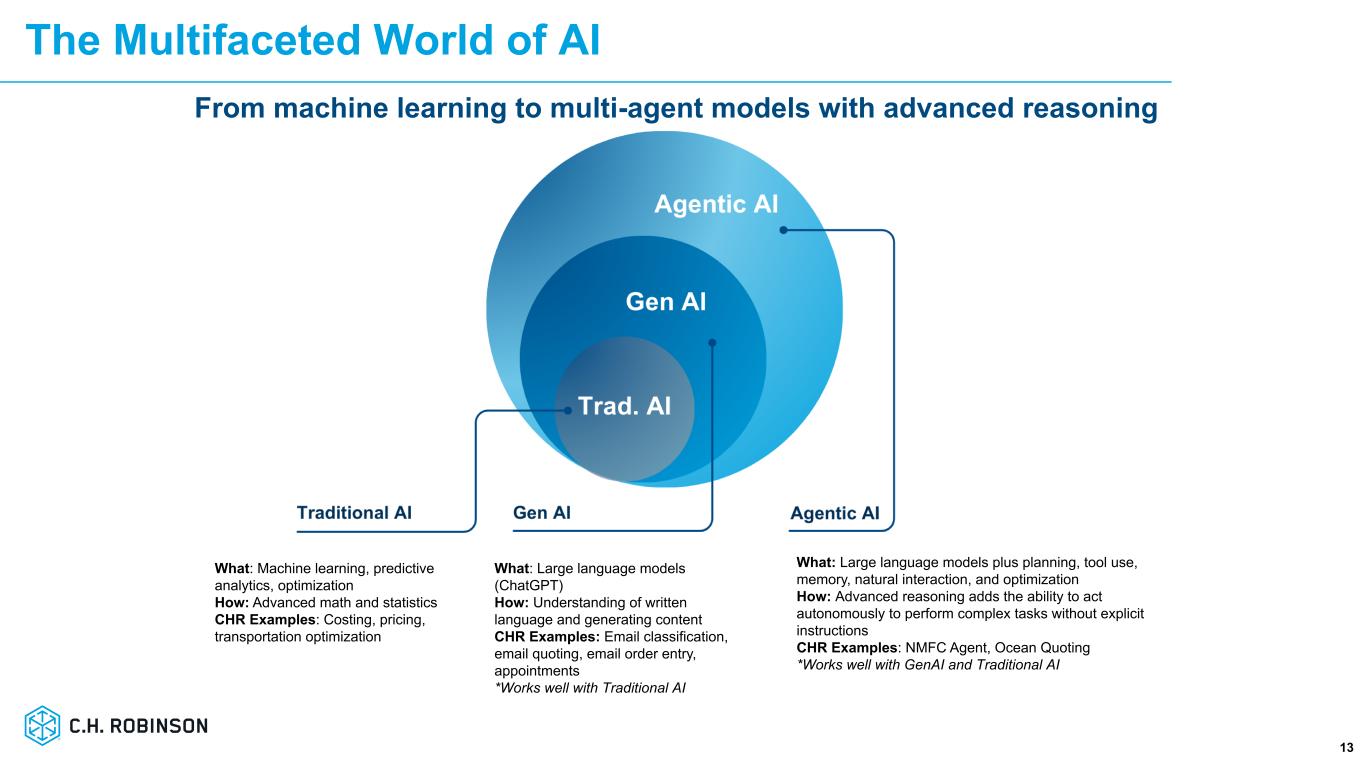
Thanks, Michael, and good afternoon, everyone. As Dave and Michael mentioned, we continue to scale several innovations to better serve our customers and widen our competitive moat, including our fleet of secure proprietary custom-built AI agents across the extensive processes within our quote-to-cash lifecycle of an order. one component of ch robinson's culture that enables us to widen our moat is our builder culture which has existed at robinson for many years and resulted in the company's proprietary transportation management system and extensive application stack that sits on top of it this builder culture has honed the company's skills around the fundamentals of engineering data science, infrastructure, security, and privacy. And we have an in-house team of more than 450 engineers and data scientists that effectively and efficiently build fit-for-purpose AI agents. Builder culture is in contrast to a buy and integrate culture where companies end up cobbling software and systems together. Companies with a strong builder culture, such as the tech companies that I came from, Travelocity, Zappos, and Amazon, had a strategy of owning the technology and building it, and this is our strategy as well. Once we've invested a fixed cost to build software or an AI agent, the marginal cost per transaction is very low, and now a highly scalable model has been created. As we scale our AI solutions, the primary incremental cost is just the cost of ai tokens versus paying by the transaction to a software as a service provider and the cost per token has declined significantly due to the tremendous competition in this space so owning the technology and engineering it in such a way that we have a scalable model is a critical component to widening our mode our build model is also important from a speed of implementation perspective. If a company is using multiple third-party providers to create and implement AI agents, they are beholden to that external provider who doesn't know the business as well. With our builder culture, we're leveraging the vast domain expertise of our in-house team that has engineered our technology landscape and has a deep understanding of our industry. We own and control the code, and we own the application layer because we're building our own AI agents. We therefore have more control over the implementation process and the speed of integrating those agents with our proprietary technology landscape. That faster speed to ideate, build, operationalize, and scale our AI agents is a differentiator and is showing up in our outperformance. The difference at Robinson is our industry-leading technology is combined with our lean AI operating model, and we expect that our in-house team with deep domain expertise will enable us to sustainably build and implement our proprietary AI innovations in a disciplined, cost-effective way that maximizes the return on our tech investments. Our fleet of AI agents is growing quickly as we continue to pioneer new ways to automate manual tasks and supercharge our industry-leading freight experts to solve for complexity and deliver high-quality service to our customers and carriers. We continue to leverage and scale the use of Agentec AI to power new capabilities that are backed by our unmatched data and scale, and we are continuing to disrupt from within. Agentic AI's advanced reasoning capabilities are allowing us to unlock previously trapped value in unstructured data, such as phone calls, emails, and tribal knowledge, through its ability to understand context and make real-time decisions. However, unlike linear rules-based automation, agentic AI operates with a degree of autonomy and unpredictability, making its progress nonlinear and requiring ongoing human-in-the-loop oversight as it advances through cycles of progress and retrenchment. Our lean AI process of discovering, learning, and building, where missteps and resulting learnings are milestones, is not only necessary, but is the best path to uncover what truly works. Continued improvements of our service to cost-efficient AI task agents that listen, learn, and act all day, every day, enables us to deliver fast, accurate, and personalized service at scale and in any market. All of these innovations are delivering on three items that are key to our strategy. The first is providing a superior customer and carrier experience to elevate our service offering and drive market share growth. The second is responding more surgically and faster than ever to dynamic market conditions by performing more frequent algorithmic price and cost discovery, which along with our operating model rigor and our revenue management practices is contributing to the gross margin improvement that we're delivering. and finally the growing automation across our quote-to-cash life cycle enables us to decouple headcount growth from volume growth and to create greater operating leverage and operating margin expansion as dave said all of our strategies are aimed at building the best model for demonstrable outgrowth while continuing to have industry-leading operating margins as technology continues to evolve we will continue to disrupt from within to stay at the forefront of the evolution and to further widen our competitive note. With that, I'll turn the call over to Damon for a review of our fourth quarter results.
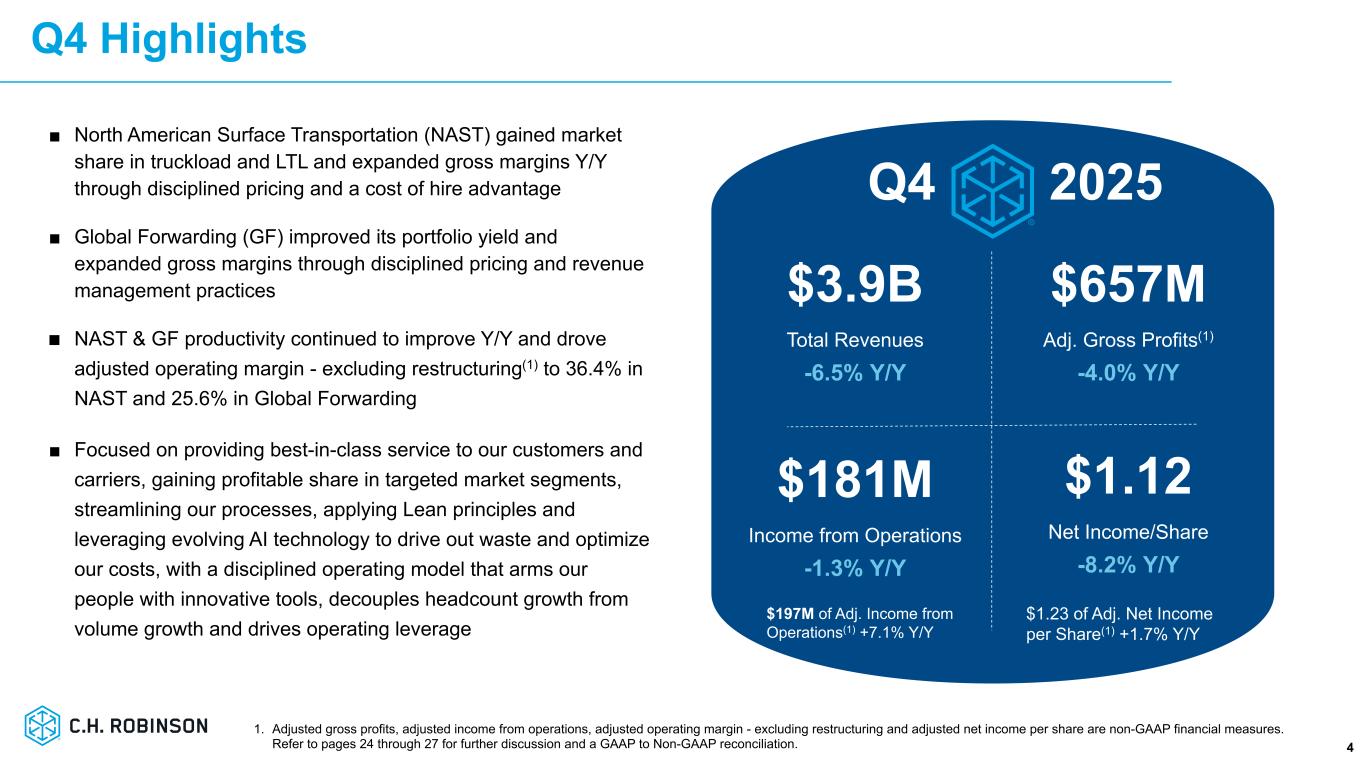
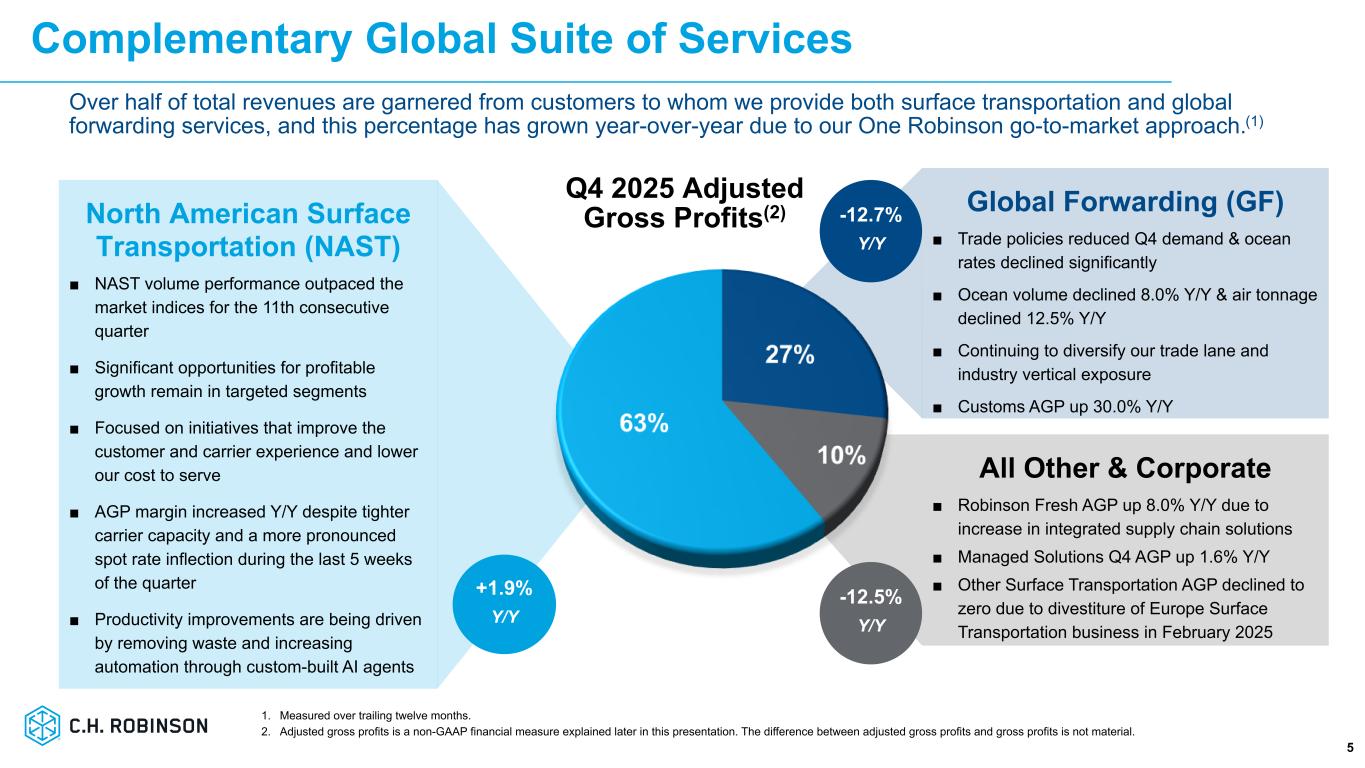
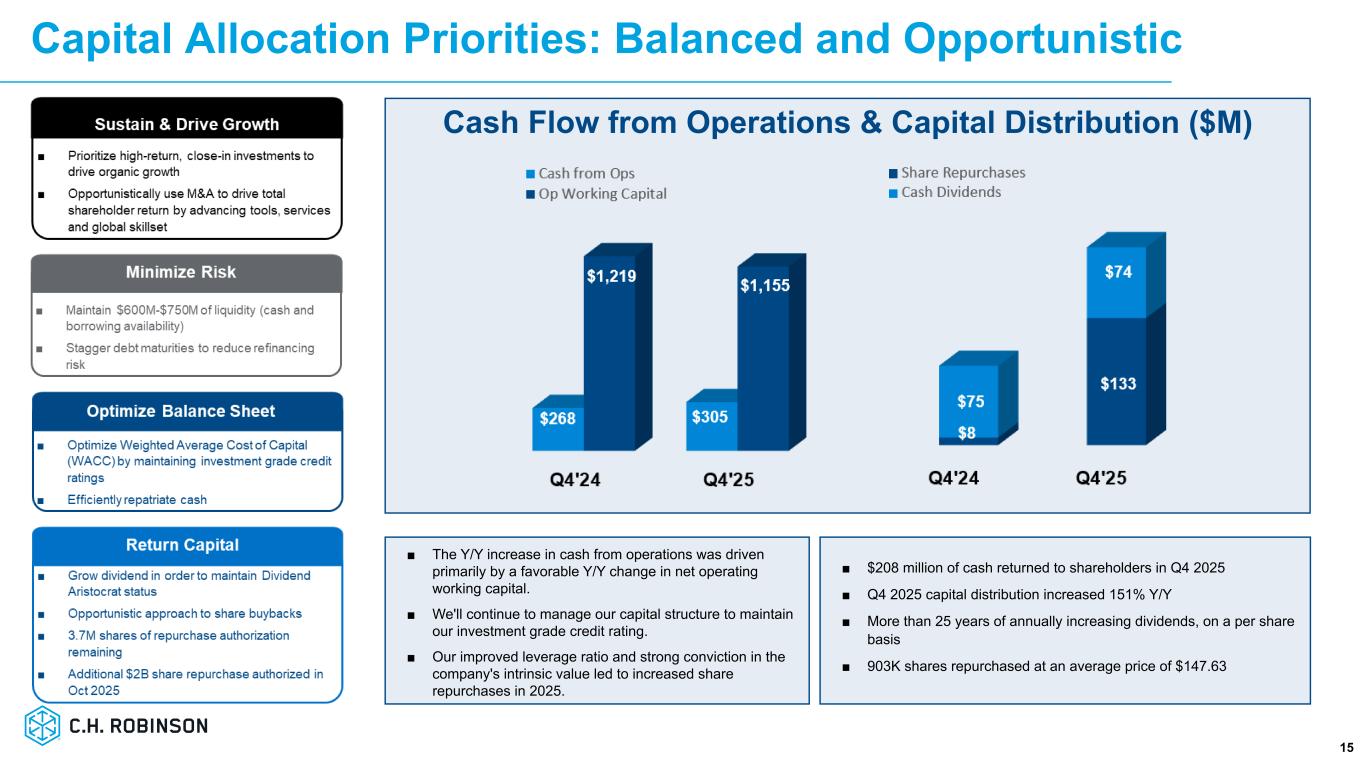
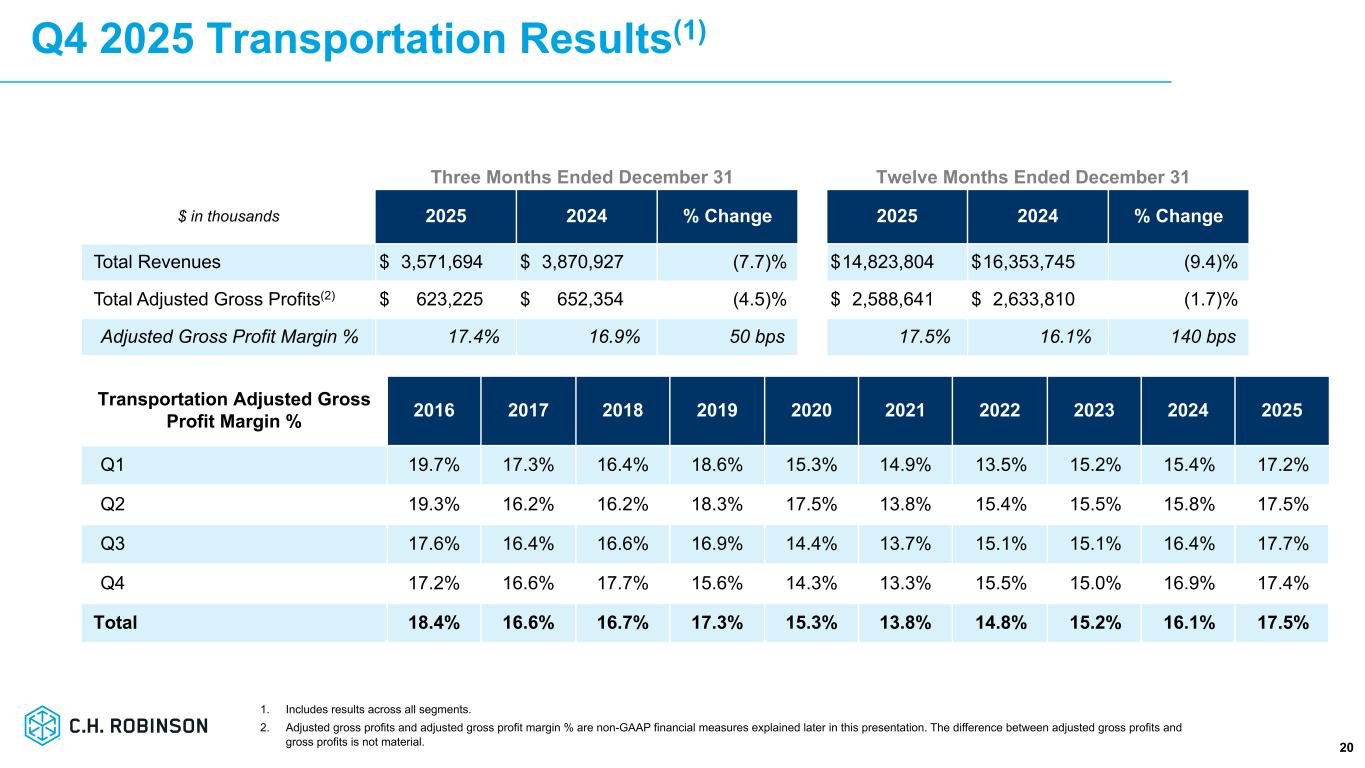
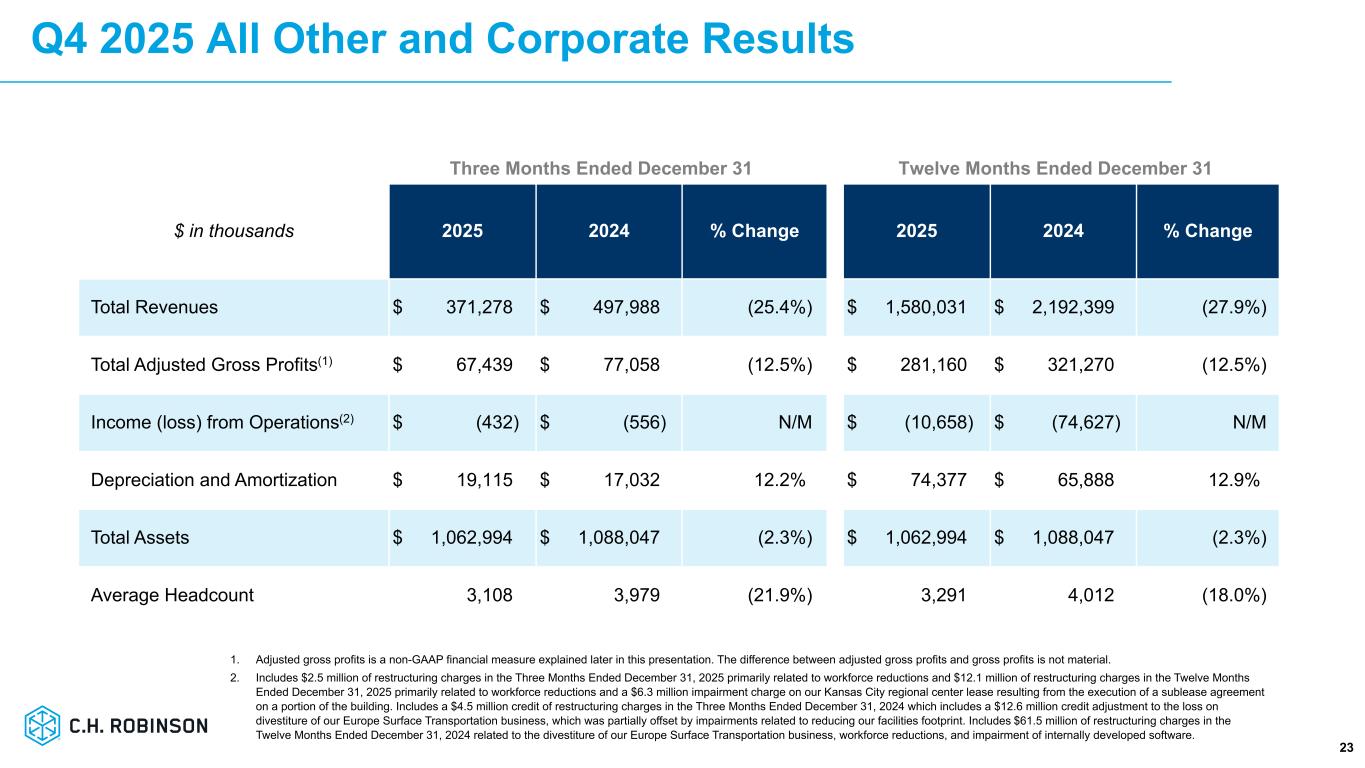
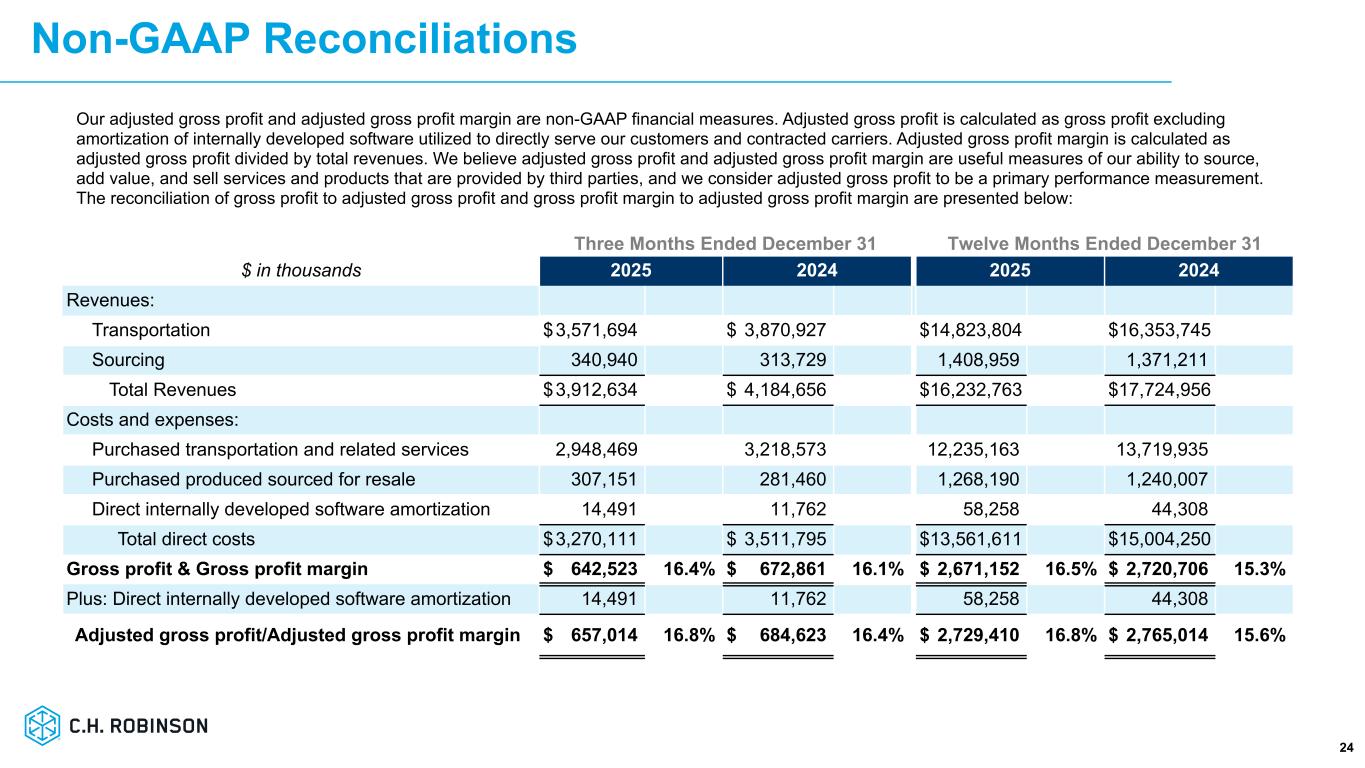
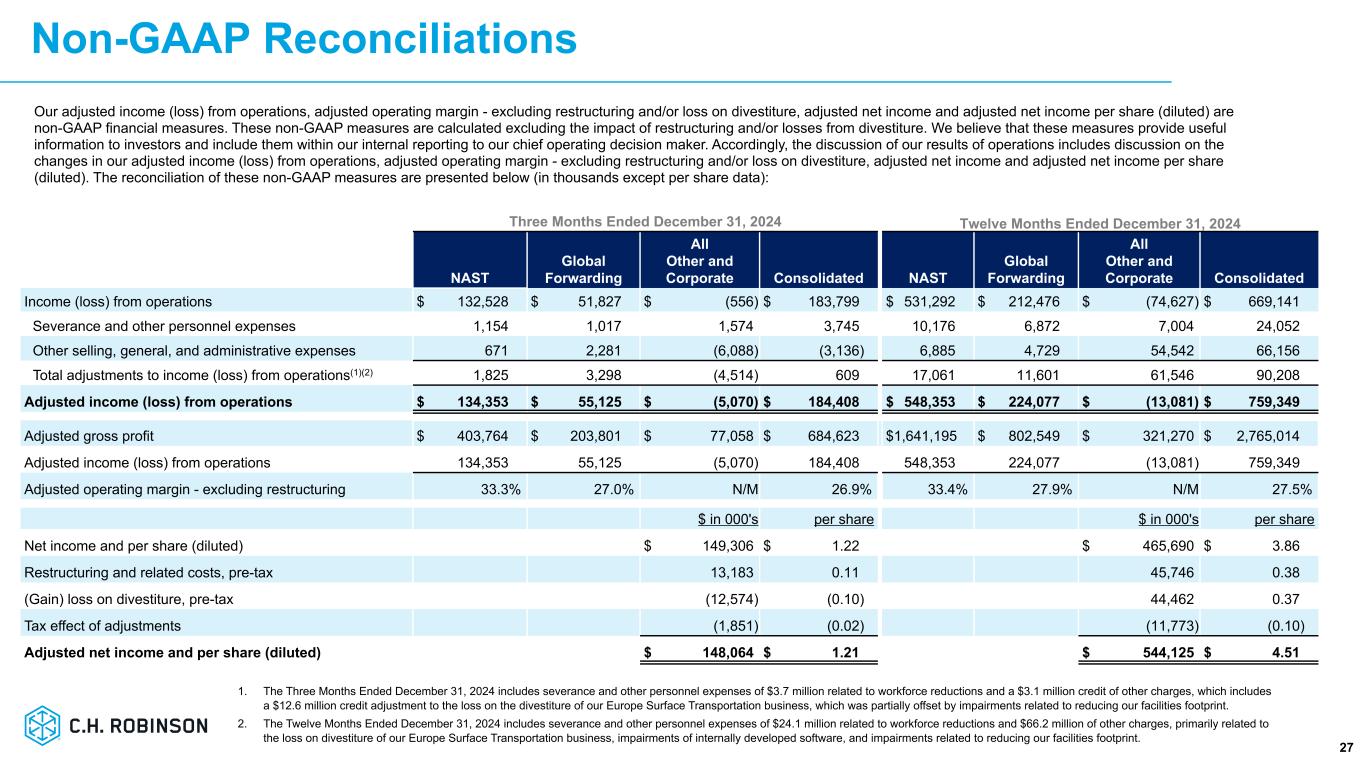
Thanks, Arun, and good afternoon, everyone. As you have heard, we delivered another quarter of discipline execution as we further advanced our focused strategic initiatives aimed at market share growth, continued optimization of adjusted gross profit, or AGP, discipline cost management, and further productivity gains, all supported by our lean AI operating model. The macro environment continued to provide significant headwinds in Q4, and our Q4 total revenue in AGP declined approximately 7% and 4% year-over-year, respectively. The AGP decline was driven by a 13% year-over-year decline in Global Forwarding's AGP, which was primarily due to a significant drop in ocean rates driven by a market imbalance from declining demand and growing vessel capacity. The February 2025 sale of our Europe surface transportation business also contributed to the decrease in AGP and was partially offset by a 2% increase in NAST AGP. On a monthly basis, compared to Q4 of last year, our total company AGP per business day was down 5% in October, up 6% in November, and down 12% in December. This was primarily driven by lower ocean rates, which caused Q4 ocean AGP per shipment to decline 15.2% year over year, and this was most pronounced in December. In the face of those headwinds, we continued our track record of outperformance. Turning to expenses, Q4 personnel expenses were $337 million, including $15.2 million of restructuring charges related to workforce reductions. Excluding restructuring charges in 2025 and 2024, our Q4 personnel expenses were 321.8 million, down 28.8 million, or 8.2% due to our continued productivity and cost optimization efforts and the divestiture of our Europe surface transportation business. Our average headcount was down 12.9% year-over-year in Q4 and was down 3.8% sequentially, illustrating how we continue to decouple headcount growth from volume growth and optimize our organizational structure. Our Q4 SG&A expenses totaled $138.7 million, excluding $0.9 million of other restructuring charges in 2025 and a $3.1 million net benefit in 2024, primarily related to the divestiture of our Europe surface transportation business, SG&A expenses were down 11.8 million or 7.9 percent year-over-year due to cost optimization efforts. As a result of our efforts to grow market share, improve gross margins, and increase our productivity and operating leverage, we expanded our operating margin, excluding restructuring costs, by 320 basis points year over year. And despite the considerably tougher macro conditions for truck brokerage, NAST expanded their operating margin, excluding restructuring costs by 310 basis points year over year. This is the Lean AI strategy at work, and we remain confident in the 2026 operating income target that we updated last quarter. Turning to our 2026 annual operating expense guidance, we expect 2026 personnel expenses to be in the guidance range of $1.25 to $1.35 billion. This includes an expectation that we will generate double-digit productivity improvements in both NAST and Global Forwarding in 2026, as we continue to implement agentic AI across our quote-to-cash lifecycle of an order. As we shared last quarter, along with our updated 2026 operating income target, these productivity improvements are expected to be over-indexed to the second half of 2026. On a quarterly basis, it's important to note that our Q1 personnel expenses are expected to increase sequentially due to the employer portion of FICA taxes resetting to a higher level until employees' annual FICA wage limits are met. This impact is estimated to be approximately 15 million dollars in Q1 versus Q4, after which the quarterly FICA taxes and personnel expenses are expected to decline. We expect 2026 SG&A expenses to be 540 to 590 million, including depreciation and amortization of $95 to $105 million for the year. Although most of our SG&A expenses are subject to inflation, we expect continued cost improvements to partially offset the inflationary impact. Shifting back to Q4, our effective tax rate for the quarter was 18.1%, resulting in a full-year tax rate of 18.7%. For 2026, we expect the full-year tax rate to be in the range of 18 to 20 percent. As a reminder, our tax rate historically is lower in Q1 due to the incremental tax benefits from stock-based compensation deliveries that occur in the quarter. As a result, we expect our Q1 tax rate to be below 15 percent. Our capital expenditures were 15.7 million during the quarter, bringing our 2025 total to 70.5 million. For 2026, we expect our full year capital expenditures to be $75 to $85 million. Turning to cash and our balance sheet, we generated $305.4 million in cash from operations in Q4, and we ended Q4 with approximately $1.49 billion of liquidity. This included $1.33 billion of committed funding under our credit facilities, and a cash balance of $161 million. Our net debt to EBITDA leverage at the end of Q4 was 1.03 times, down from 1.17 times at the end of Q3. This financial strength is a key differentiator in our industry, giving us the ability to continue investing through the bottom of the freight cycle to further enhance our capabilities and to return capital to our shareholders. While our capital allocation strategy remains grounded in maintaining an investment-grade credit rating, our financial strength and improved leverage ratio enabled us to return approximately $207.7 million of cash to shareholders in Q4 through $133.3 million of share repurchases and $74.3 million of dividends. Through the disciplined execution of our strategy, with our lean operating model and ai innovation at its core q4's results further validate the lean ai transformation underway at ch robinson i have been part of significant transformations in my career most recently at general electric what we're doing at robinson is carving a similar path and i'm extremely proud of the progress we have made and as we've said we are still in the early innings of our transformation. We are excited about the significant runway that remains in executing our lean AI strategy and in our ability to deliver sustainable, profitable growth and long-term value for all of our stakeholders. With that, I'll turn the call back to Dave for his final comments.
Thanks, Damon. As you've heard in our prepared remarks today, we've made significant in progress in 2025 on the transformation of ch robinson into the global leader in lean ai supply chains our differentiating lean ai gives us a unique opportunity to create new ways to solve complex challenges at scale helping our customers build supply chains that are smarter faster and more resilient in a world where disruption is constant and agility is essential with today's geopolitical landscape, there are a lot of unknowns and potential volatility that will be out of our control. But what is in our control is our ability to discover, learn, innovate, and solve problems. And that is where the lean operating model is so important to our success. As lean disciplines continue to be deployed more broadly across our organization, our teams are becoming increasingly equipped to identify root causes of problems, implement countermeasures, and drive meaningful improvements. That's how we've consistently delivered our outperformance for the last two years, and how we're positioned to continue doing so regardless of market conditions or cycle. And as we lead our industry and stay on offense with our Lean AI strategy, technology, we've never been more excited about the future. Our technology is lifting manual, repetitive work off our people's plates, freeing them up to use their expertise to do more strategic work, to reach more customers, to garner more wallet share, and to move up the value stack by leveraging our growing capabilities to provide better outcomes and more value for our customers and carriers. Our technology is improving our gross margins by allowing us to better align capacity and pricing to the specific needs of our customers and to specific market conditions. These superior dynamic costing and pricing capabilities will be even more important when we eventually see a turn in overall freight demand. And our technology is augmenting our evergreen productivity initiatives and improving our industry-leading cost-to-serve. I want to thank our people for their relentless efforts throughout 2025 to provide exceptional service to our customers and carriers for embracing the Robinson operating model and continuing to execute with discipline. We've reinvigorated a winning culture, and we're getting our swagger back. but we're nowhere near done. We are the new disruptor. We will continue to lead with purpose and move with urgency, and we expect to drive sustainable outperformance across market cycles. You've heard us say that we expect the next two years to be more exciting than the last two years, and the last two years have been pretty damn exciting. That concludes our prepared remarks. I'll turn it back to the operator now for the Q&A portion of the call.
Operator
Thank you. As a reminder, to ask a question, please press star 1 on your telephone keypad. The first question comes from Tom Wadowitz with UBS. You may proceed with your question.
Thank you, and congratulations on the results against a pretty tough market backdrop. I wanted to, I think from Damon maybe, I wanted to see if you could give a little more perspective on first quarter. I think the progression through by months with AGP growth, it showed more pressure in December. I guess that's unsurprising. You commented on Ocean and obviously spot rates up in truck, but how should we think about the kind of net revenue growth in or adjusted gross profit growth in first quarter and just to shape that a little better. And then I wanted to give you one other, uh, we, um, you know, I think we're pretty optimistic on what you can do in kind of 20, 20, 27. I know that's looking at a lot further, but you know, if you look at ways to get a stronger market for truckload pricing and volume growth, do you think you can kind of overshoot meaningfully on that operating margin target in NAST? I mean, if you get, can you get to like a mid forties number against the strong backdrop, or is that something where you really want to kind to, you know, just not let it get too high and do a lot more on the volume side. So I guess two different timeframes, but thank you for the time.
Yep. Thanks for the, thanks for the question and the comments, Tom. So look, as it relates to progression from Q4 to Q1, I mean, as you noted, I mean, December was a, was a challenging month for the market. And certainly, you know, we weren't immune to those, to those pressures. You know, what, what I would say, as you think about December going into q1 is certainly december was heavily impacted by global 40 and the ocean rate normalization that we've been talking about for for quite a while if you remember back in q3 when we gave our 2026 operating target update you know and we called it out on our waterfall we mentioned that ocean rates were continuing to normalize certainly q3 was a heavy normalization quarter that continued into q4 and we expect that to continue into q1 as as well as we've highlighted as part of our path to $6 EPS with no market growth. So certainly December as a standalone month, heavily influenced by ocean rates. I mean, that was clearly the number one driver for what you see in that December result there. You know, just specifically for Q1, and as you know, we don't give guidance, so I'll keep my comments fairly elevated here. You know, certainly the the spot rate cost pressure that we saw in uh in december certainly did carry over to to january right so that wasn't a um thanksgiving to end of year event right those that cost pressure did carry over to january um you know but our commitment in q1 is to continue to demonstrate the outperformance continue to demonstrate the execution of our strategy and continue to use the tools like revenue management that's at our disposal to continue to drive out performance both on the top line and the bottom line in in q1 um so q1 you know starting out a little a little challenging but but so you know q4 ended a little challenging you saw the results we delivered so we we feel you know confident we'll continue to over deliver uh and execute our strategy and in q1 you know as it relates to your broader question around the future specifically 2027 we won't go quite as far as giving guidance there. I will remind the audience here that we've talked a lot about optionality as it relates to our margins going forward. And we're going to make the right decisions for Robinson and the right decisions for investors. And in many cases, converting that margin to demonstrable market share in many cases could be the right decision for the company and for our shareholders so what i would say is you know we're still on a really good trajectory to get to those mid-cycle uh margins that we laid out for nast and global 14 with 40 being the margin target for nast at mid-cycle still on a very good trajectory to get to that to that target but once we get beyond that target you know we'll make an earnings growth and a quality of earnings growth decision on whether we continue to expand margins at that point or whether we reinvest that into uh into demonstrable growth thanks for the question tom great thank you the next question
comes from bascom majors with susquehanna you may proceed with your question thanks for taking my questions um just to follow up on that last point about 2027 you talked a little bit uh longer term strategically about you know the balance of volume in in margin expansion and you talked a little bit in the prepared remarks tactically about, you know, tweaking price intraday and making the right decision minute by minute. You know, how do you think somewhere between that, you know, how does it feel in 2026 right now, the balance of a margin expansion and you potentially seeking more share growth, you know, on that bridge to a world where you might consistently have margins above your mid-cycle level? Thank you.
Yeah, thanks for the question, Bascombe. What I would say is that I'll just start again with the optionality, right? We want to make the right decision for what I consider quality earnings growth, right? And so we're experimenting with that every day, every week, every month today in 2025 and now coming into 2026, right? I mean, certainly we're making revenue management decisions, you know, multiple times an hour, you know, hundreds of times a day on that right balance between volume and margins, And it really does come down to the trade-off. Once we get to what we consider is our threshold for quality of earnings, which we've set out already, 40% for NAST at mid-cycle and 30% for global forwarding, we feel like that is a fair, and it's typically been acknowledged by the market that, look, those are the thresholds we'd expect you guys to be able to get to. And we've agreed with that. We've set our targets in a similar range. But we believe beyond that point, we really don't have anything left to prove on a quality of earnings perspective, right? So we'll make the decision beyond that point on what is the right decision for earnings growth. And in many cases, that will be supercharging the outgrowth of the market that you've seen us do today. So if you take Q4, where truckload outgrowth over the cash index was over 1,000 basis points, we think we can certainly beat that mark when we get to a point of investing margin into profitable growth for our businesses, right? So it's all about optionality. It's all about quality earnings growth as we go through 26 and 27 and beyond. And we do believe it's important to establish those quality of earnings thresholds that I mentioned. But beyond that, we'll make the right decisions for the company and our shareholders on a high quality of earnings growth that we think will be difficult to compete with in the industry.
Hey, Bascom, and I think that was well said by Damon. The other thing is that we often say is that we're just going to be disciplined and measured in how we're going about this with the right economics, and we're not stopping that. That's just how we've done it, and that's how we're going to continue to do it. Thank you both.
Operator
The next question comes from Brandon O'Bensi with Barclays. You may proceed with your question.
Hey, good evening, gentlemen. Thanks for taking the question. We get this response a lot like, okay, what is C.H. Robinson doing and why can't other headers just copy it? And I think, especially for transportation folks and investors, we don't fully understand what a lean operating model means, the way you guys are very targeted in deploying AI. So I don't know, maybe if you or Arun could dig into that, I'd appreciate it.
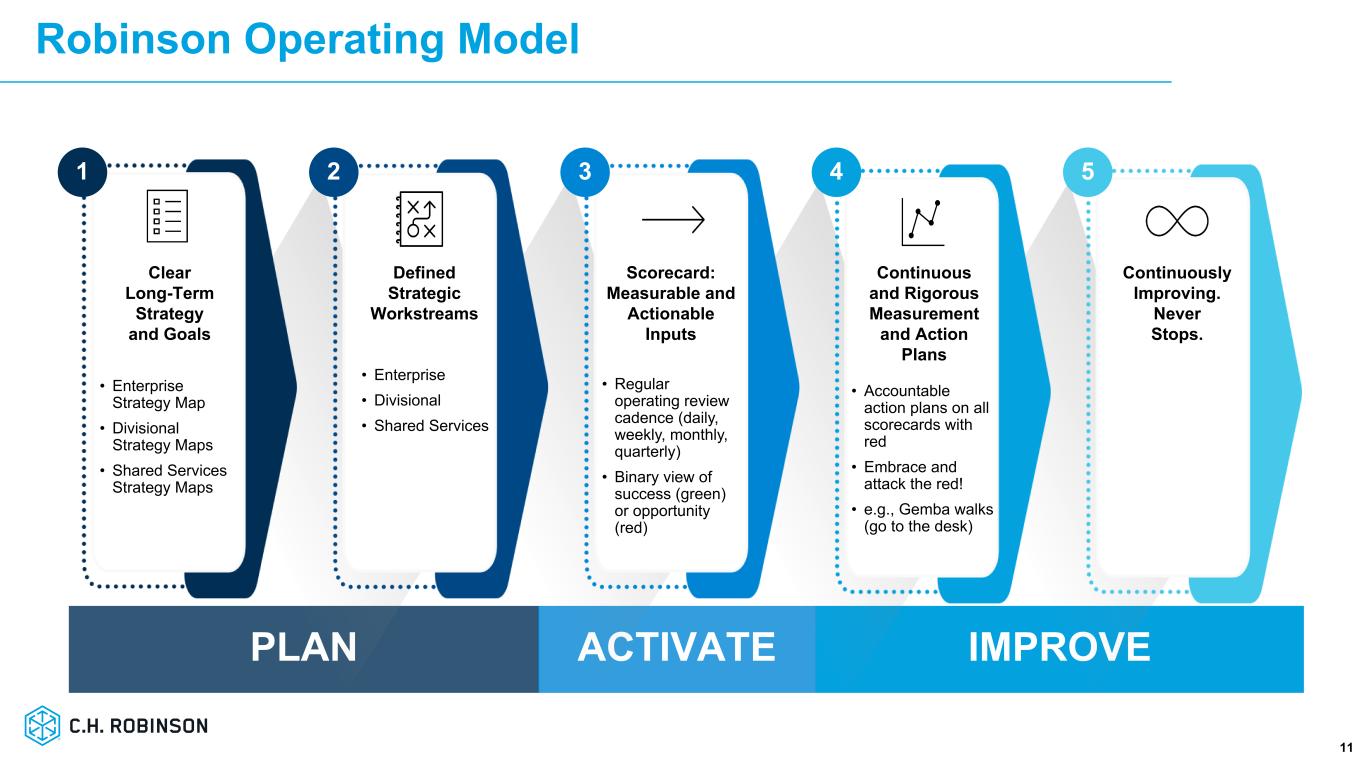
Yeah, we can do that. First of all, thanks for the question, Brandon. And certainly we don't have the real estate to go really, really deep in answering that question. So I'll kind of give you the highlights. And then when we hit the road, we talked about it much deeper. But essentially, three key things that we're driving the company with. Number one, it's our people. We start there. That's why customers do business with us. Really the best logisticians in the world. Two, it's our technology, which we think is industry-leading. It is internally built, and it's a competitive advantage for us. And then three is our lean operating model, in which that is the mortar that brings all of this together and what has been the change for the company as we've gone through this transformation. And essentially, it drives a rhythm and a cadence and drives accountability, but also innovation and speed in a company and, quite frankly, in an industry that that is not the norm. And so when we talk about making changes at breakneck speed, like Damon talked about, that's really going to inputs versus outputs. And it's allowed us to use our data and make it intelligent and really, really makes that a competitive advantage. We think it deepens the moat, widens the moat when we operate at that pace and scale for what we're calling lean AI. so a number of things we can go deeper on but those are the three things but I'll have a really just just just touch on how then that supercharges that technology that's really been a game-changer for us yeah so just adding to Dave's comments on the technology side you know I talked about our builder culture and we're a company that builds software we have an engineering culture we build software so there's a couple of things that are super important in that.
When the operating model connects our strategy and our technology, and then we build towards that, we have this massive advantage. And so by being a builder culture, we don't rely on third-party software vendors, as an example, to get our work done. Obviously, we depend on Microsoft as a hyperscaler, but in terms of we don't have to buy software from third parties and cobble them together, which I've seen other companies do, and that is expensive and it takes a long time. The builder culture is also driven by domain experts. Our engineers have been at this company for a long time, and they understand this industry really well. So in terms of speed that both Dave and Damon just talked about, we get incredible speed with this builder culture and this domain knowledge that sits in-house and then that gets compounded with you know the accumulation of our data that we've got in terms of our pricing and costing capabilities to put all that together and you get uh and you get this advantage and finally you know ai and agentic ai back to our builder culture the fact that our engineers can implement it versus having to hire you know accenture to come and do the work uh is a big differentiator we don't need it we don't need a consultant to come in and do the work we trained our engineers internally uh to go after to go after these
opportunities and everything connects back to our strategy and our financials uh which as we discussed you know we discussed that uh that investor day so that's how it plays out and brandon just putting a period on that uh we do have the experience uh within the team now on doing lean transformations it's it's you asked what's the difference it's not easy um to do this It takes discipline. You have to be measured, and you really have to lead from the top to do this. That is something that this industry has not really done, but we don't own that. We didn't create AI. We didn't create lean. We didn't do any of that, but we do execute, I think, at a high level with that, and there's a long way for us to go, so a lot more from what you've seen so far. Thank you both.
Operator
The next question comes from Jonathan Chappell with Evercore ISI. You may proceed with your question.
Thank you. Good afternoon. Michael, Brandon covered one of the bigger long-term questions we get, shifting to one of the shorter-term ones. I think there's a lot of confusion about how this cycle could be different for a broker. You mentioned in your commentary shorter and probably less painful margin squeeze at the early part of the cycle. But I guess if there's any way to give any tangible evidence or any way to kind of explain why it would be shorter and maybe less painful this time around, either using some examples from what you've implemented in the last two years or, you know, anything else that can help us put a pin on it.
Yeah, John, thanks for the question. You know, I'd start with, you know, maybe playing off a little bit where Arun just finished, which is taking that data and technology and putting it in our people's hands. So we've talked about that for the last couple quarters, that we're getting information into our people's hands quicker, more accurately, and more often. And that really showed up in Q4 in our cost of higher advantage and how we performed versus the market in what was a difficult period. You know, as we said, we weren't immune to the squeeze, but we do think we handled it better than the market. But we also think we handled it better than we probably would have handled it ourselves, whether it was a quarter ago, a year ago, et cetera. um you know when you think about a an actual market inflection which we're all you know we've been trying to predict as an industry for the better part of three and a half years now is we still even saw in q4 and we saw this through cast there wasn't a material demand change during the quarter we're still having to go take share you know intelligently as damon said on the right freight with the right combination of service for our customers and the freight that fits us. And so the real question is in the inflection is what does the demand signal look like? And we believe with a true demand signal where we start to see additional freight enter the marketplace, our ability through cost of higher advantage and then to match the right freight to the right carrier to service our customers' needs, we believe we'll be able to manage that squeeze. We've said multiple times, we aren't going to be immune from it. We will feel that squeeze when it happens but we have a high expectation that we will manage it quicker we will address it faster and more intelligently and that we'll get to the other side of that squeeze which historically for for us is a good place to get to the other side of that squeeze and demand is starting to grow as an industry okay thank you the next question comes from reed say with stevens you may proceed with your question hey guys thanks for taking my question um obviously you've made strides here with the technology that you've been implementing and the
head count reductions that you've continued to make um this seems different from the old ca robinson where maybe these heads would need to come back with volumes uh but how do you balance this head count reductions without compromising the human touch that we know some shippers and carriers prefer from their broker and avoid maybe losing some of that volume as as we make these headcount reductions but any thoughts there would be helpful hey reed this is dave just uh real quick thanks for the question i'm going to start but we need to double click on what you're asking here so the guys will jump in i'll just start with you know we the way we look at that is we
don't start and have headcount, you know, there's not a headcount KPI at Robinson. That's just not the way that we operate the business because we engineer the business. And again, the output might be a shift in our headcount because, again, we are shifting to more customer focus. That order the cash process, which has a lot of friction, a lot of entry-level headcount on that. We're automating that. And for some of that, we're not backfilling, and that's something that we're shifting out of. But we just don't look at it in the traditional fashion of cutting at a percent for a headcount. That's just not how we operate the business.
So I just wanted to set that that that structure up first and then we can double click on where i think you're getting that in your in your question yeah read i'll add a little color and then ultimately let michael wrap this up since you know we've had significant benefit in our nas business to to date um i think just a pivot from what what dave was saying there i mean if you think about how we've generated the productivity that we've generated how we've generated the results we have we have fundamentally changed the processes, right? So this isn't asking people to work harder. This isn't hoping that we can do something when volume returns. A process which used to be, you know, a heavy human touch process before is now a light human touch process today. The process itself has fundamentally changed. The technology allows us to scale at a very large magnitude. And so it's really not even a question on if we add headcount back to these processes when when volume returns the question is there's no reason to right the process has fundamentally changed where that it no longer requires um you know human scale when when the process you know when the when the volume returns right so i would say think about it in terms of you know a process through our lean operating model and our technology that is just fundamentally different than it was um you know kind of pre the journey that Robinson's on. Take the example we give often around our requests for freight quote operation, right? Previously, we were only getting to 60% of those requests. Today, we get to 100%. Previously, it was taking a cycle time of 17 to 20 minutes. Today, it takes less than 32 seconds, right? That process has fundamentally changed, right? So if today we're doing 600,000 requests for freight quotes and it goes to 6 million, we don't have to add anyone back to the process to manage that inflection in volume because the technology can absorb that scale, right? That process has fundamentally changed. That's just one example. But think about that across the 30 agents plus that we've operationalized at scale at Robinson. And I think that'll just give you a little bit of the color on why it's different, right? It's not about working harder or asking people to work harder. The processes themselves have fundamentally changed. And so, therefore, the human input that would have been required four, five, six years ago when an inflection may happen is just no longer required today. Michael, add some color there.
Yeah, so, Reed, the one thing I will agree with you on, though, is the importance of relationships in our business and connecting with customers and connecting with them where we deliver the highest value. And so our focus has been to increase and improve the customer-facing roles and experience, our carrier-facing roles and experience. We were very public about our reinvestment into SMB and adding folks in that space. But we do believe there continue to be more opportunities for us to take away tasks that are not maybe driving the higher value or higher return for our customers as we work to provide supply chain solutions. You know, we had a press release just this week on our LTL missed pickup agent. And so that's, you know, we said in the release, 350 hours a day of human work that was done just to follow up on missed pickups. Well, that's an example of, you know, we won't have to have humans doing that in the future, but it's not really a high-value concept in terms of do we need somebody doing that role. The relationship is now our people will get that information more accurately. They're going to get it quicker, and they're going to be able to call their customers and talk to them about a solution to a pickup that maybe was missed, and what are we going to do about it? How do we fix this for the next time? So, really, I think it's a great question, but I think there's a really good blend going on between meeting what you described and how we're accomplishing it.
Operator
The next question comes from Scott Group with Wolf Research.
You may proceed with your question. hey thanks good afternoon so um when you guys talk about demonstrable market share growth is this sort of high single digit spread versus cast what you have in mind or do you think that spread should be bigger over time and then maybe just damon just one like numbers question if i take if i just take the fourth quarter personnel expense and annualize it you sort of get like a little bit below the midpoint of your guide for personnel expense so it doesn't feel like the guide has double-digit productivity savings in there so I don't know any any thoughts on that thank you yes just got thanks
for the thanks for the the questions I'll take the personnel expense one first and then we can we can answer the first question second so on personal expenses I think certainly as we define productivity is shipments per person per day, right? It's certainly different math than the dollars of personnel cost, right? If you think about personnel cost, it includes not only the salaries of our people, but it also includes benefit costs, which are typically inflationary. And then the one thing we're really proud of is the success that we've realized the last 18 to 24 months, our people have been a huge portion of that success, right? And so we've been rewarded our people. We did so in 25. We'll continue to do so as the performance warrants that. And so I think, you know, part of that math between double-digit productivity gains and what you're seeing on the percentage on personnel expense is really some of those items that aren't tied directly to, you know, headcount per se, right? So it is benefit cost. It is rewarding our employees, you know, for the great job that they're doing. But make no mistake, we're committed to, yeah, and one other item there is just, you know, our $6 target is based on no market growth, right? But we do have growth built into our plan next year. So no market growth, but certainly we do have outgrowth built into our plan. And when we talk about productivity, it is a combination of what I would call traditional productivity and cost avoidance. And so certainly that cost avoidance won't show up as part of that double-digit productivity math, but it'll show up as operating leverage as we deliver that outgrowth above a zero market assumption. So if you take everything that I just kind of went through there, I mean, that's the rationale why the math is going to always be different between a shipments per person per day productivity number that we've pegged at double digits for 2026 versus the dollars you would calculate on personnel expenses. But make no mistake, we're committed to our double-digit productivity. We're committed to the continuous improvement that we've talked about now for 18 plus months. And we're committed with high confidence to the $6 EPS target that we updated in our Q3 earnings call, again, with a very high confidence, right? So all of that together, hopefully that gives you a little clarity and color. But all of it together, we feel really good about where we're going and a high degree of confidence committed to our $6 EPS target with no market growth.
Yeah, I think at the end you had the question about a demonstrable call out. Michael, you could jump in here, but I mean, essentially we look at it and if you look at the CAS index and how we're performing and, you know, between 800 and 1,000 basis points different we think that that is um starting to be demonstrable differences um uh across the board on on performance and proud of the team for um for doing that in very very tough conditions that uh we're not immune from so that that's some of the color that we feel but michael anything to add and then yeah i'll just jump in one point and i'll give it to michael is is i mean scott the way we think about demonstrable right is i mean look certainly our relative comparison to cass is it's a data point for us to know, you know, how we're performing versus the overall market.
But when we talk about demonstrable, it is really about taking market share within this industry, right? And if you think about where our share is today, there's no cap on where that share can go tomorrow, right? So when we talk about demonstrable, I wouldn't limit it to just a certain outperformance of CAS, right? Because I think, you know, that relative performance is going to be very dependent on, you know, that market for that specific time period of that specific quarter, right? But our commitment is to take demonstrable market share as we move into the future. That optionality that I talked about, which we're not even really putting in play today, we are, but it's below the 40% threshold. That optionality we talk about of investing future margins into even more demonstrable outgrowth, that's what really gets us excited. Everything we're doing today on productivity, everything we're doing today on revenue management, all of that is setting the stage for taking demonstrable market share in the future. We're already doing that today. We feel like we could do that at another level in the future.
Yeah, I think, Damien, you covered it. Only thing I'd add is we're very cognizant of outperformance within the conditions of the current business that's the right return for our customers, our carriers, and our shareholders. Do we expect to outperform the market? Absolutely. The level of that outperformance will be driven by that combination of what's the right mix for those three stakeholders at that time.
That's right, as supported by our strategy. Scott, if you remember, our strategy is to outgrow our end markets and expand our operating margins. What Michael just walked through is there's always going to be some level of governor on our outgrowth. We don't want bad freight, right? We only want good freight. And certainly we use our margins to dictate that decision.
Operator
Our last question comes from Richa Harnain with Deutsche Bank. You may proceed with your question. This now concludes our question and answer session. I would like to turn the call back over to Chuck for closing comments.
All right. It looks like we're up on time. So thank you everyone for joining us today. That does conclude our call. And we'll talk to you again in the coming days. Thanks. Have a good evening.