Operator
Good afternoon, ladies and gentlemen. Welcome to C.H. Robinson's first quarter, 2026 conference call. At this time, all participants are in a listen-only mode. Following the company's prepared remarks, we will open the line for a live question and answer session. To ask a question, please press star 1 or your telephone keypad. If anyone needs assistance at any time during the conference, please press star 0. As a reminder, this conference is being recorded Wednesday, April 29th, 2026. I would now like to turn the conference over to Chuck Ayers, Senior Director of Investment Relations.
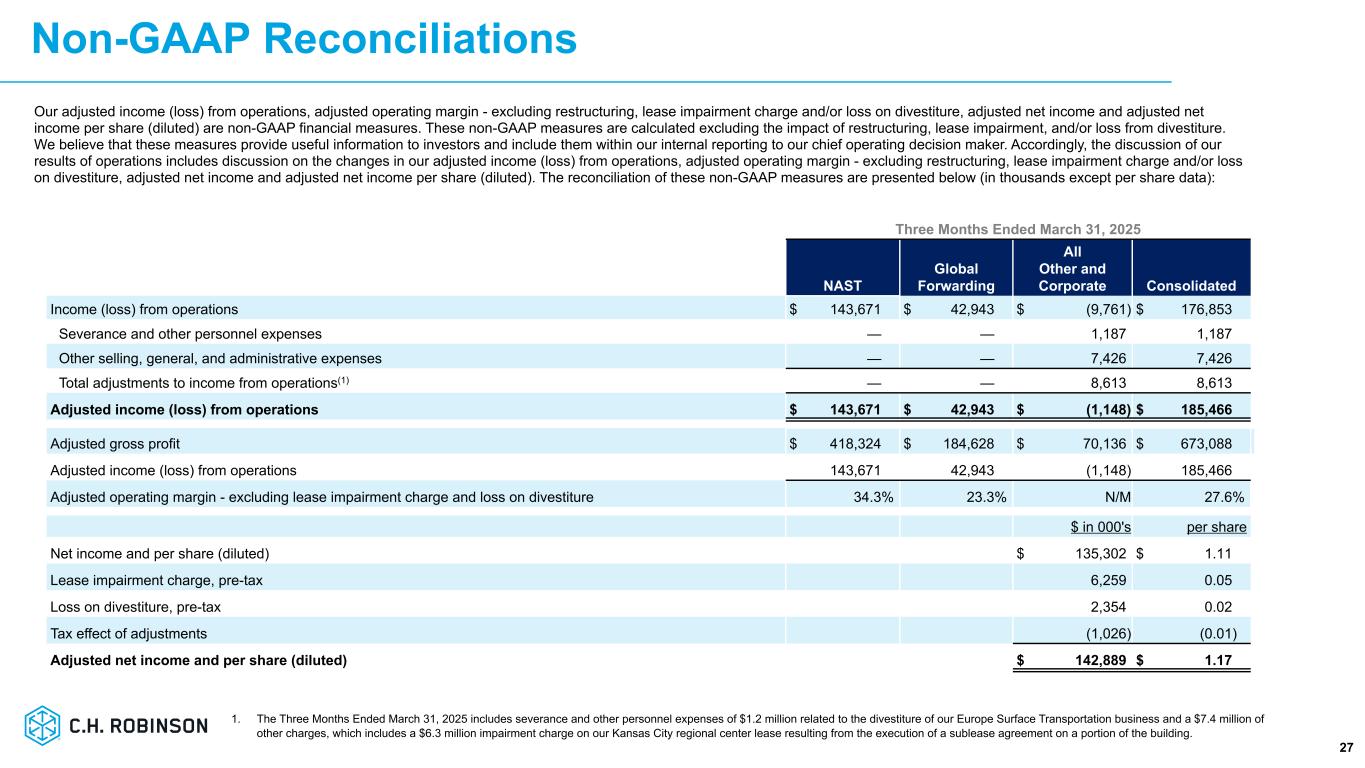
Thank you, Operator, and good afternoon, everyone. On the call with me today is Dave Bozeman, our President and Chief Executive Officer, Michael Castagnetto, our President of North American Surface Transportation, Arun Rajan, our Chief Strategy and Innovation Officer, and Damon Lee, our Chief Financial Officer. I'd like to remind you that our remarks today contain forward-looking statements. Slide 2 in today's presentation lists factors that could cause our actual results to differ from management's expectations. Our earnings presentation slides are supplemental to our earnings release and can be found in the Investor section of our website at investor.chrobinson.com. Today's remarks also contain certain non-GAAP measures, and reconciliations of those measures to GAAP measures are included in the presentation. With that, I'll turn the call over to Dave.
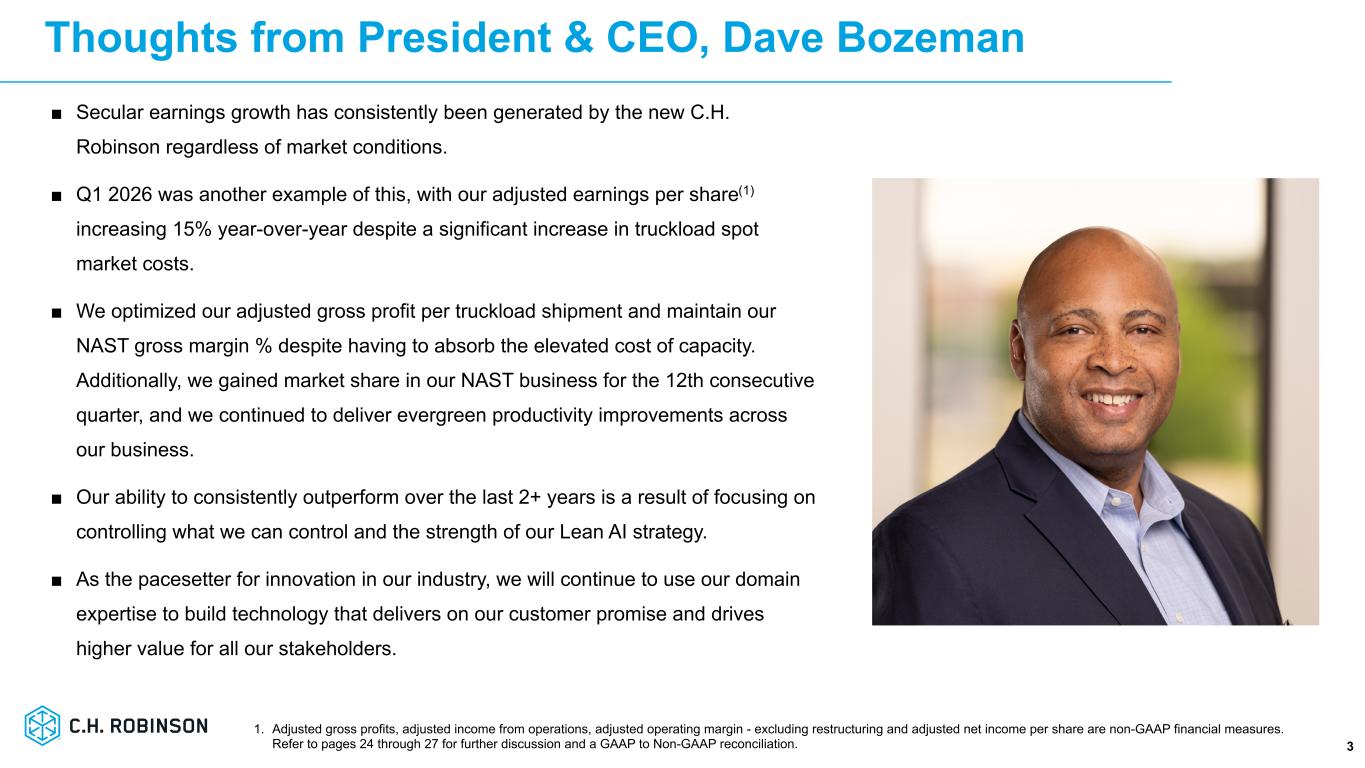
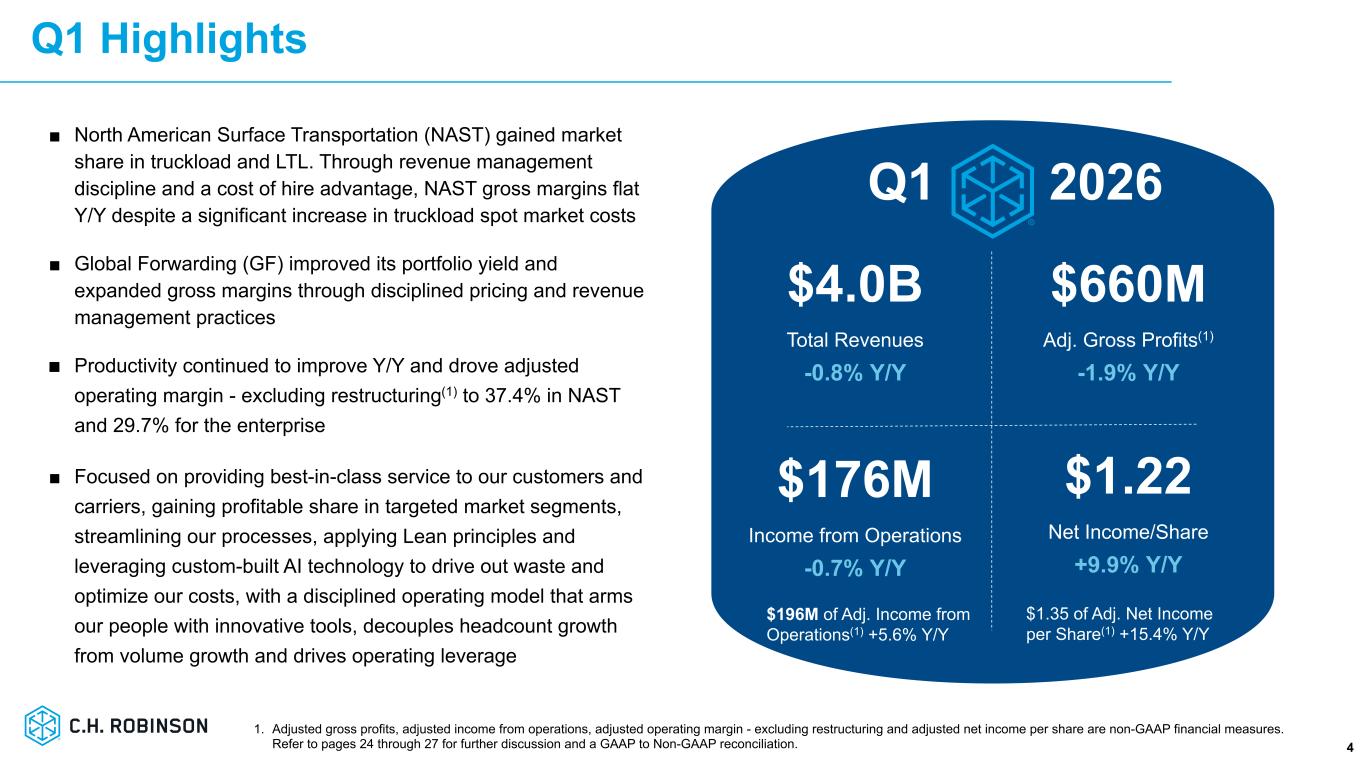
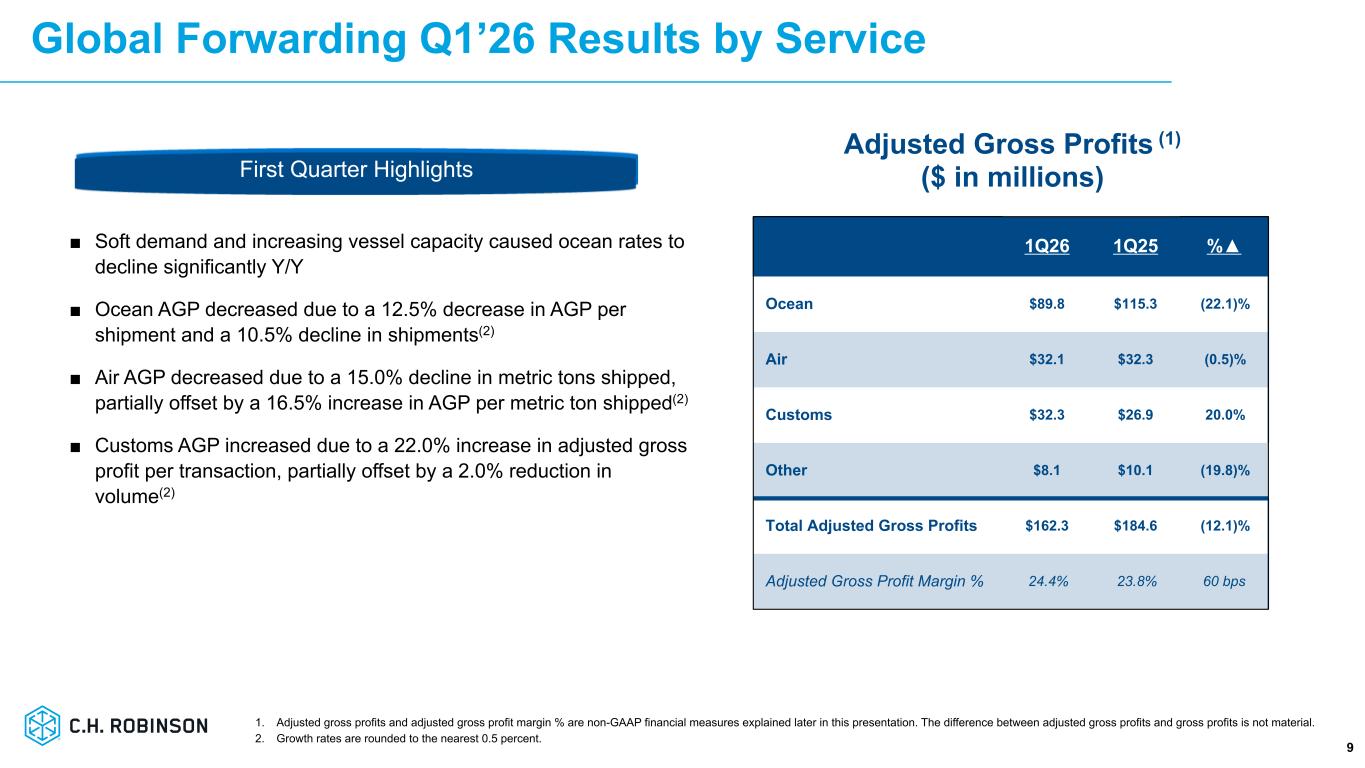
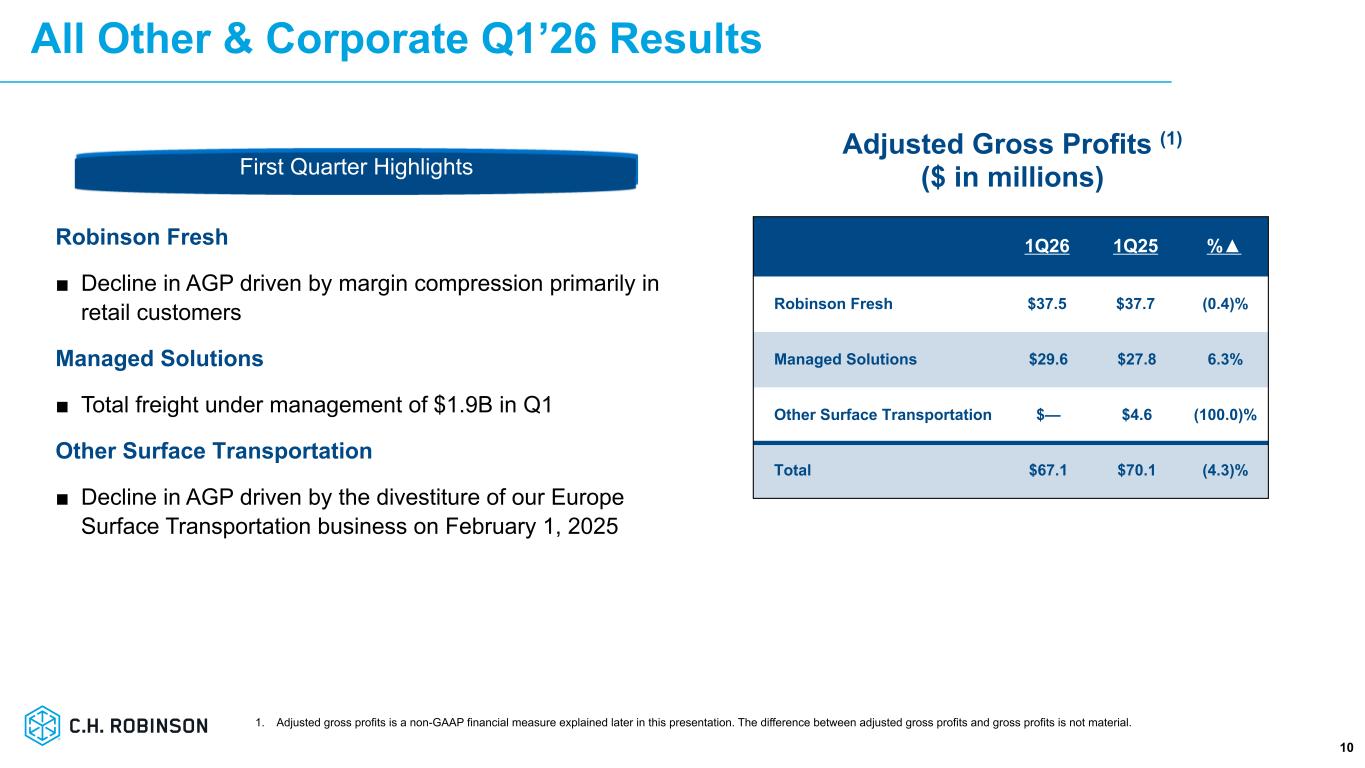
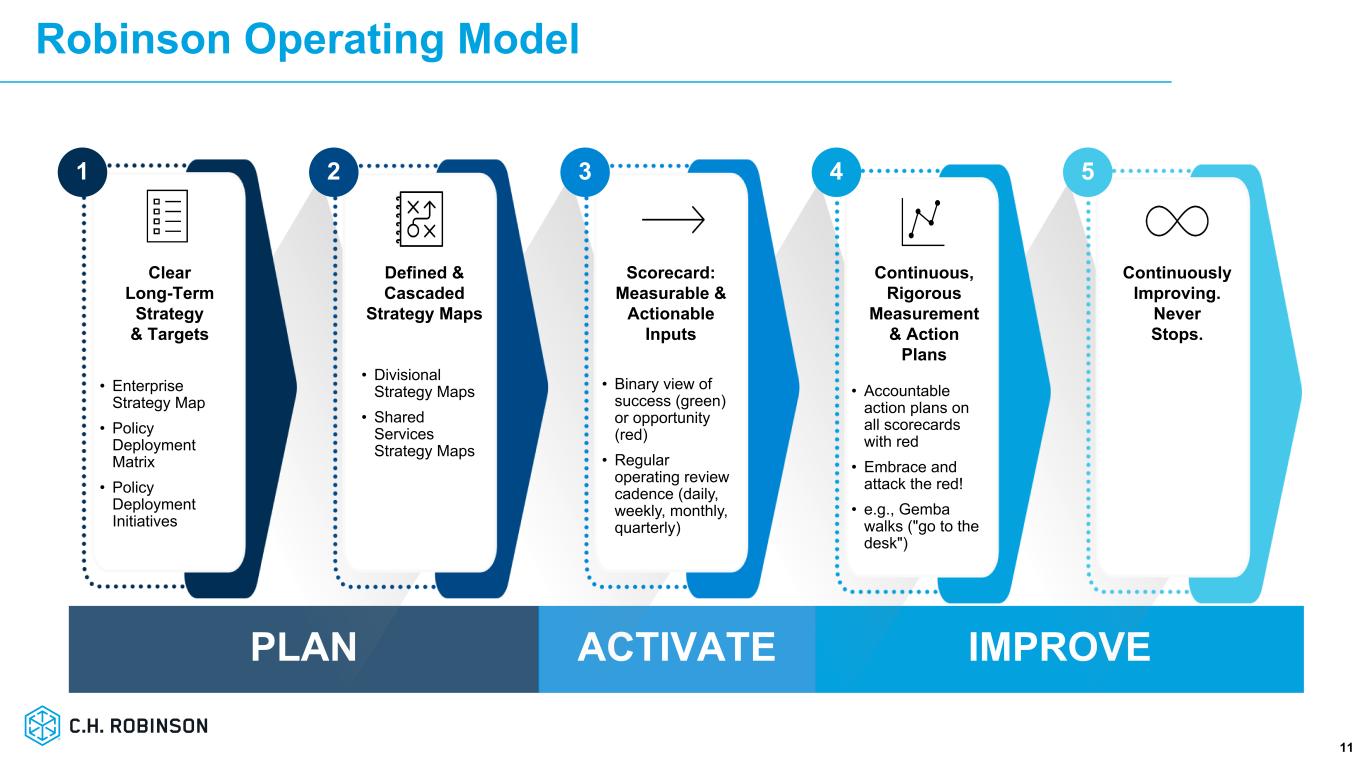
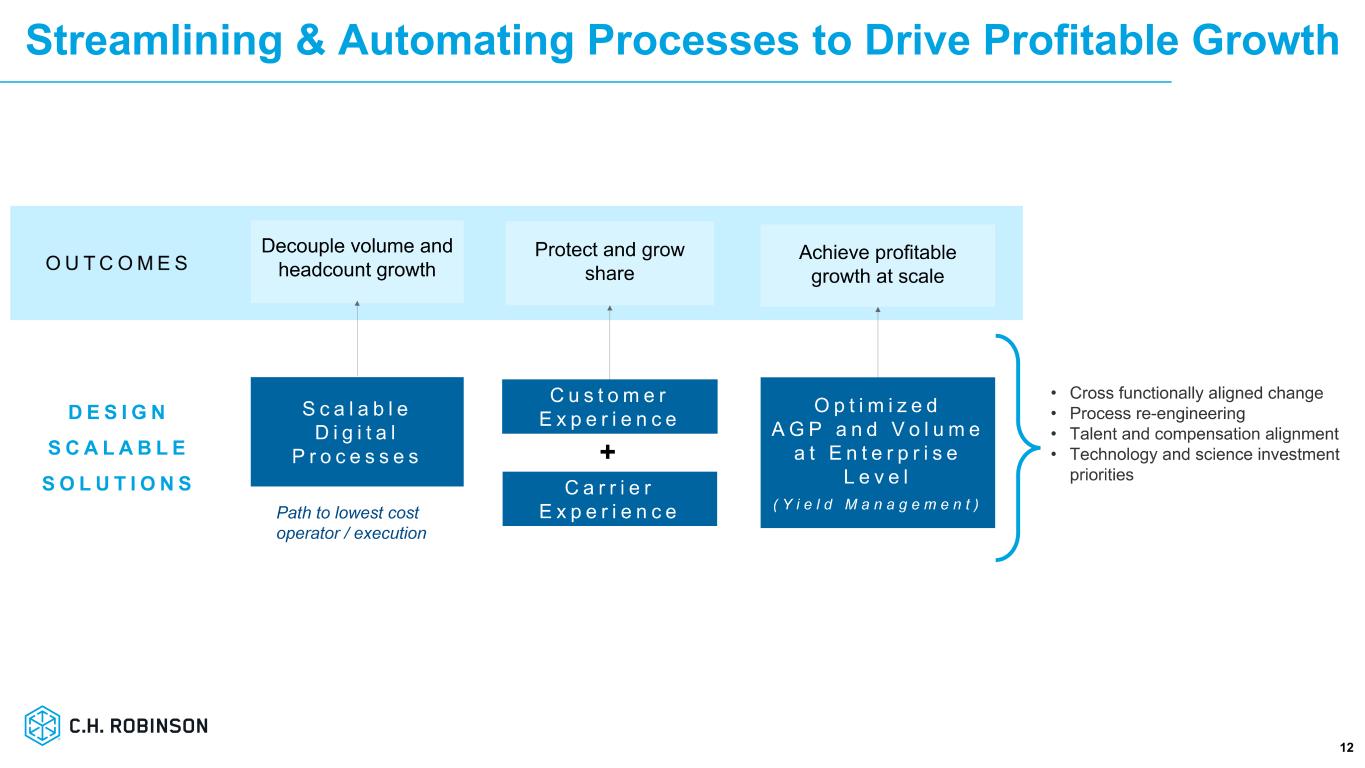
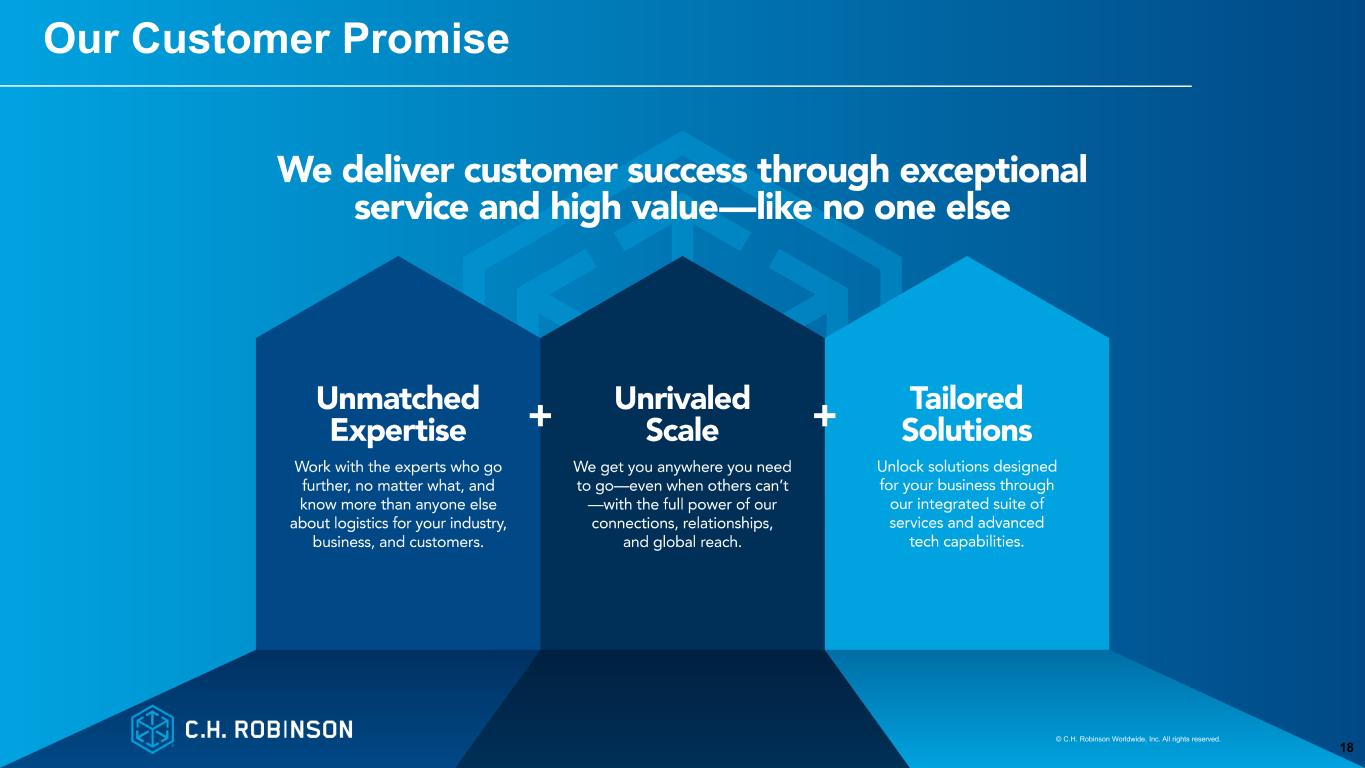
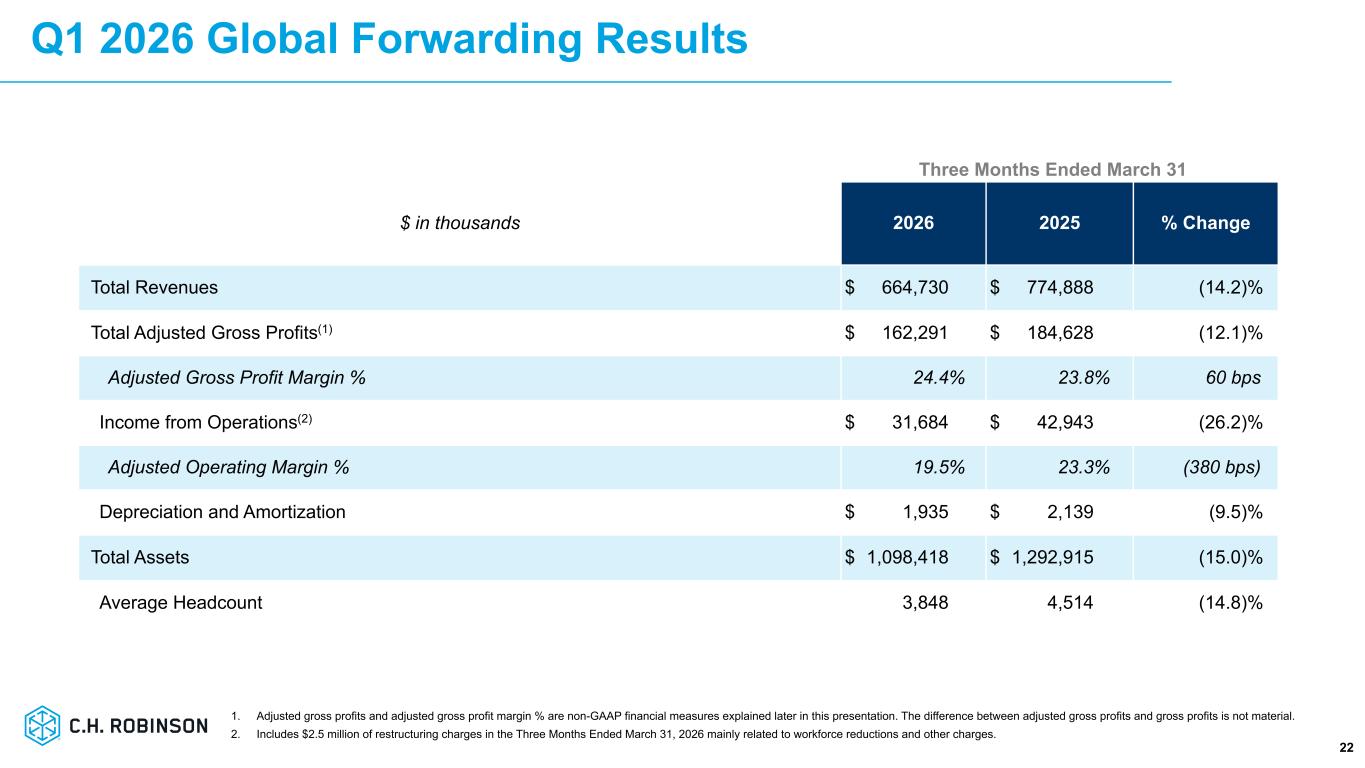
Thank you, Chuck. Good afternoon, everyone, and thank you for joining us today. As has been widely discussed in recent months, the North American trucking market has entered a period of supply drilling tightening. As that has occurred, we've heard old tapes being replayed regarding which transportation providers benefit most during certain parts of the truckload cycle. But those storylines don't fully appreciate the secular earnings growth that has consistently been generated at the new C.H. Robinson, regardless of market conditions. The first quarter of 2026 was another example of this, and our adjusted earnings per share increased 15% year over year, despite a significant increase in truckload spot market costs. We continue to outperform by opportunistically capturing transactional volumes at higher margins as the industry's tender rejection rates increased, by continuing to exercise our disciplined revenue management practices, by repricing some of our contractual business in a very targeted fashion, and by continuing to widen our cost of higher advantage, all of which have improved as we implemented our new lean operating model this enabled us to optimize our adjusted gross profit per truckload shipment and maintain our nas gross margin percentage despite having to absorb the elevated cost of capacity additionally we gained market share in our nas business for the 12th consecutive quarter and we continue to deliver evergreen productivity improvements across our business over the past year we've consistently said that we're not immune to macroeconomic conditions or an inflection in spot costs but that we are managing those conditions better than we have in the past and better than our competitors our first quarter performance puts another check mark on our say do scorecard our ability to To consistently outperform over the last two plus years is a result of focusing on controlling what we can control and the strength of our lean AI strategy. Lean AI is our unique, disciplined approach to AI innovation that is transforming supply chains. It combines the principles of our Robinson operating model rooted in lean methodology with the power of custom-built AI and the expertise of our people to maximize value, minimize waste, and drive better outcomes for customers and carriers. As we continue to purposely engineer our work to drive higher automation and industry-leading cost-to-serve and improve customer outcomes, all of this is aimed at building the best model for demonstrable outgrowth while continuing to have industry-leading operating margins. I'm proud of our employees for navigating ever-changing market conditions with discipline and ingenuity, and for embracing the culture shift that has fundamentally changed this company. Our global forwarding team continues to help our customers navigate disruptions such as conflict-driven rerouting and reduced flexibility across global shipping networks. The international freight market has been tumultuous and impacted by global trade policies, geopolitical conflicts, and route restrictions. Similar to the second half of 2025, excess vessel capacity has caused ocean rates to decline versus the elevated rates from a year ago. As the team helps customers comply with changing customs regulations and continues to implement the same revenue management disciplines that have been deployed in NASS the team expanded gross margins in Q1 by 60 basis points year over year we also continue to evolve our global 40 business to a more cohesive centralized model with standardized and lean AI enabled processes we'll continue to focus on providing differentiated service and solutions to our customers and carriers executing with discipline and improving our business model and our cost-to-serve we're highly confident in our ability to continue executing on all of our strategic initiatives and the strategies that our team is executing are built to be effective in any market condition we're excited about the prospects for a possible return to a healthier demand environment but with our strong balance sheet and cash flow generation we're also comfortable if the freight market ends up being lower for longer in either scenario we're ready to serve our two-sided marketplace and to deliver a higher highs and higher lows across the market cycle our model with an industry-leading cost to serve is highly scalable and we expect it will continue to improve further as we continue to harness the evolving power of AI to drive automation across the quote-to-cash lifecycle of a load as the pace that are for innovation in our industry we will continue to fail fast and use our domain expertise to build technology that delivers on our customer promise and drives higher value for all of our stakeholders we are the trusted provider that customers look to for cutting-edge innovation, differentiated solutions, and best-in-class service. And while we're pleased with the results we've delivered in the last two years, we are still in the early stages of our transformation. Significant runway exists as we continue to deepen the lean mindset and scale custom-built AI agents across the enterprise. I'll turn it over to Michael now to provide more details on our NAST results.
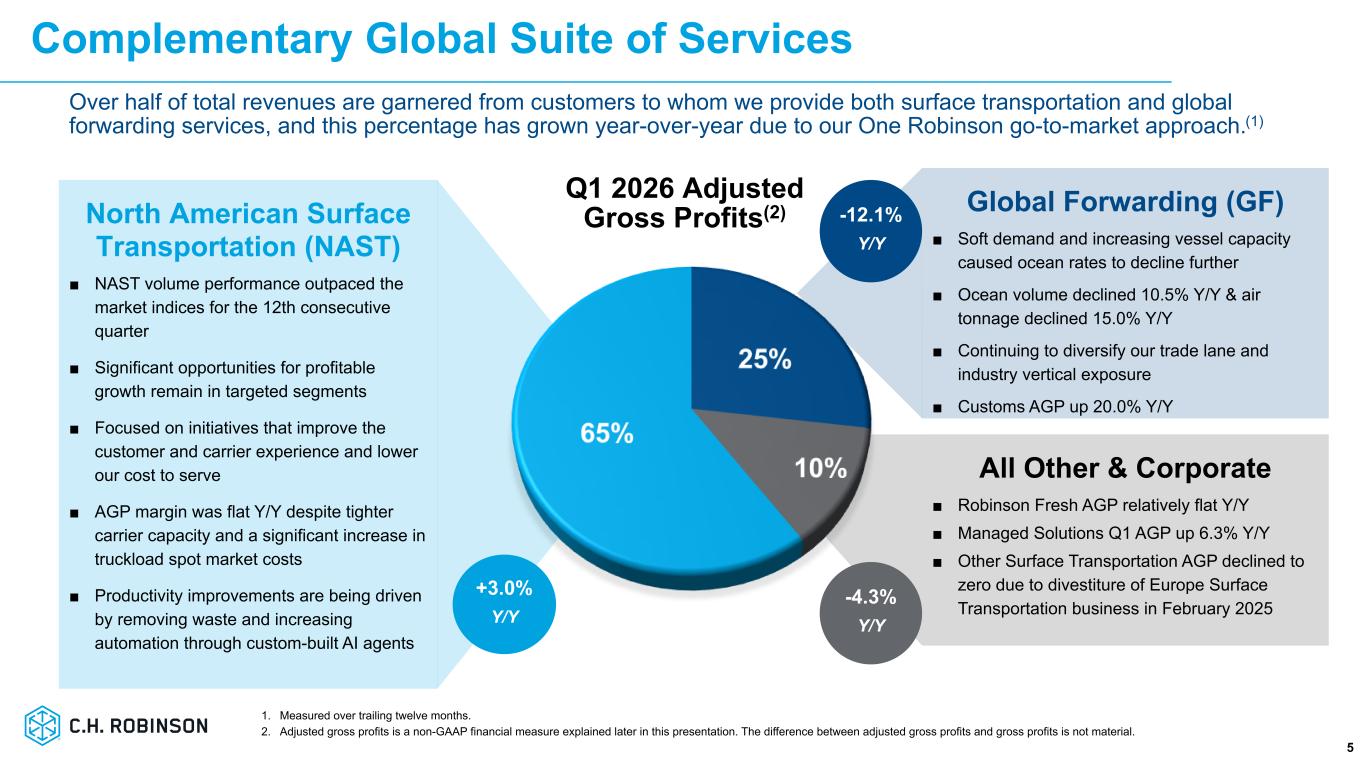
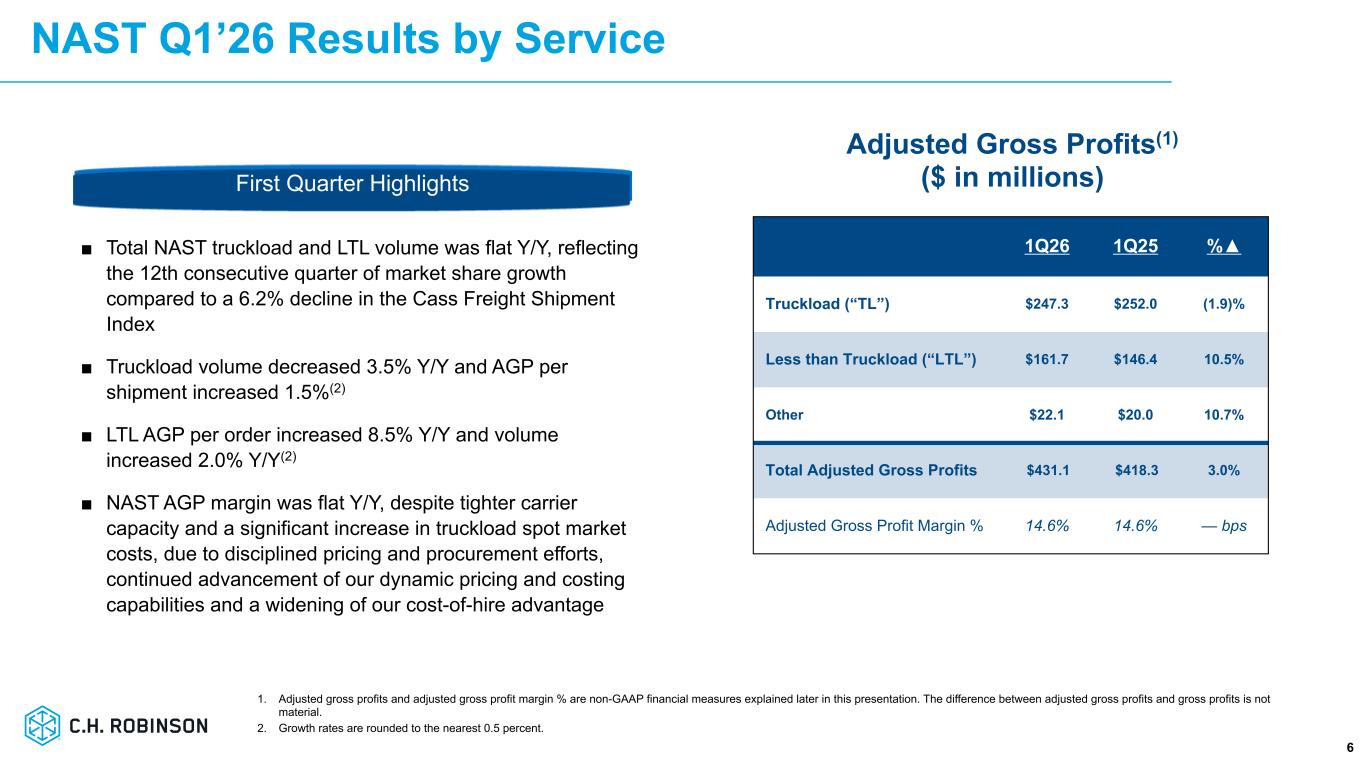
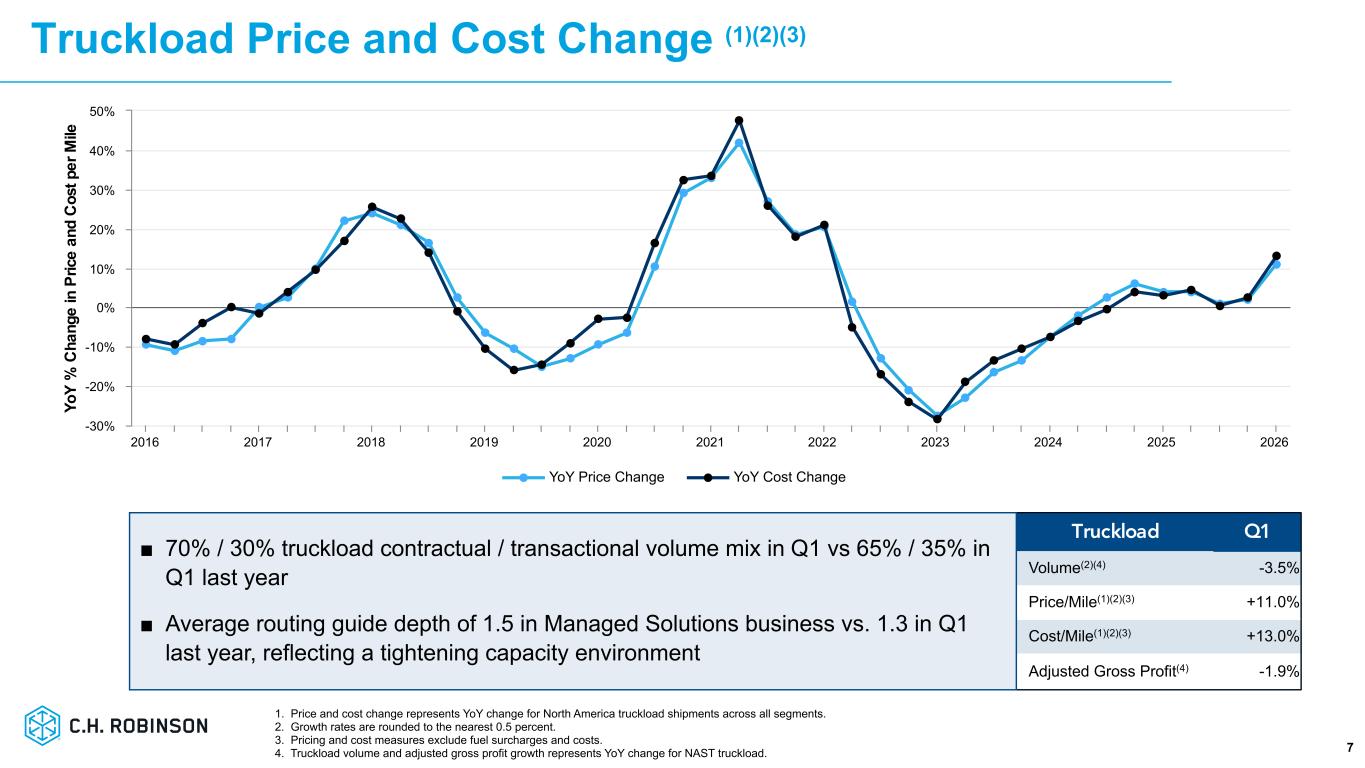
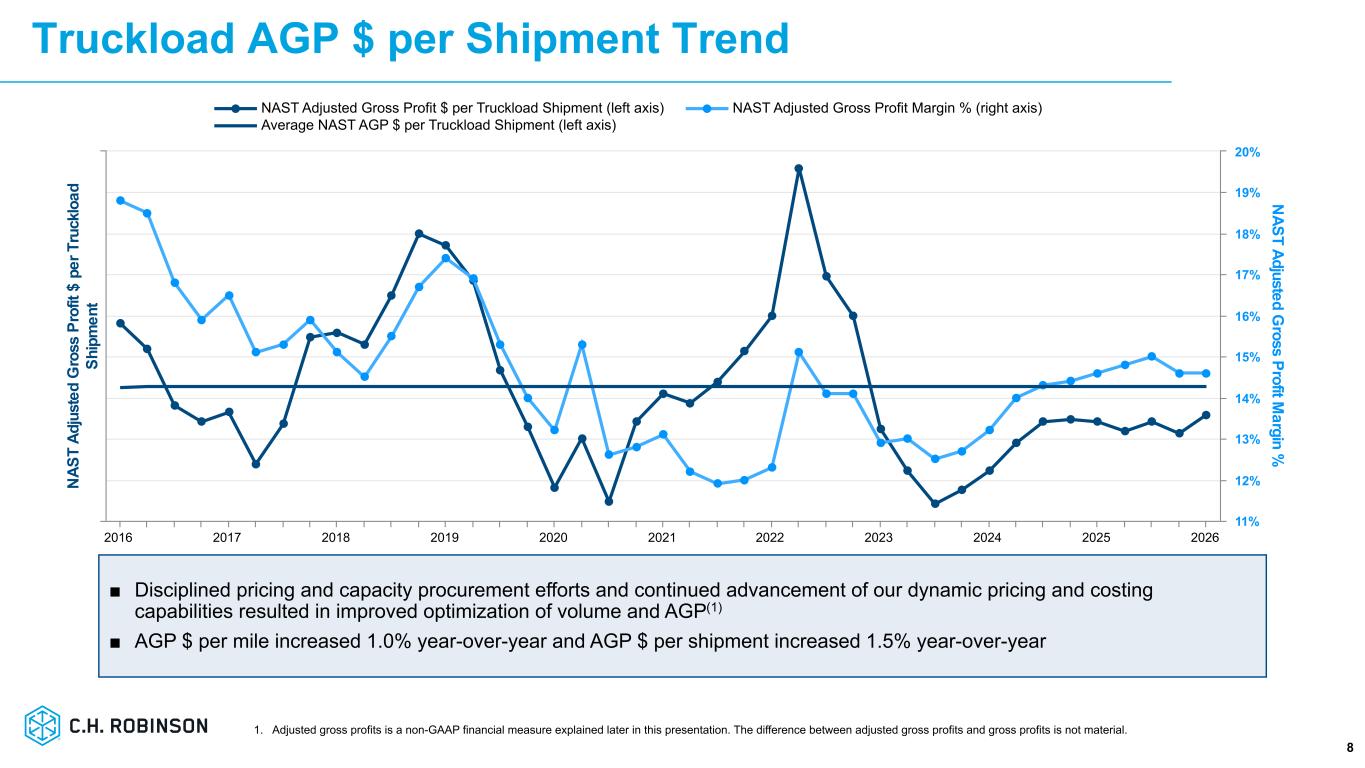
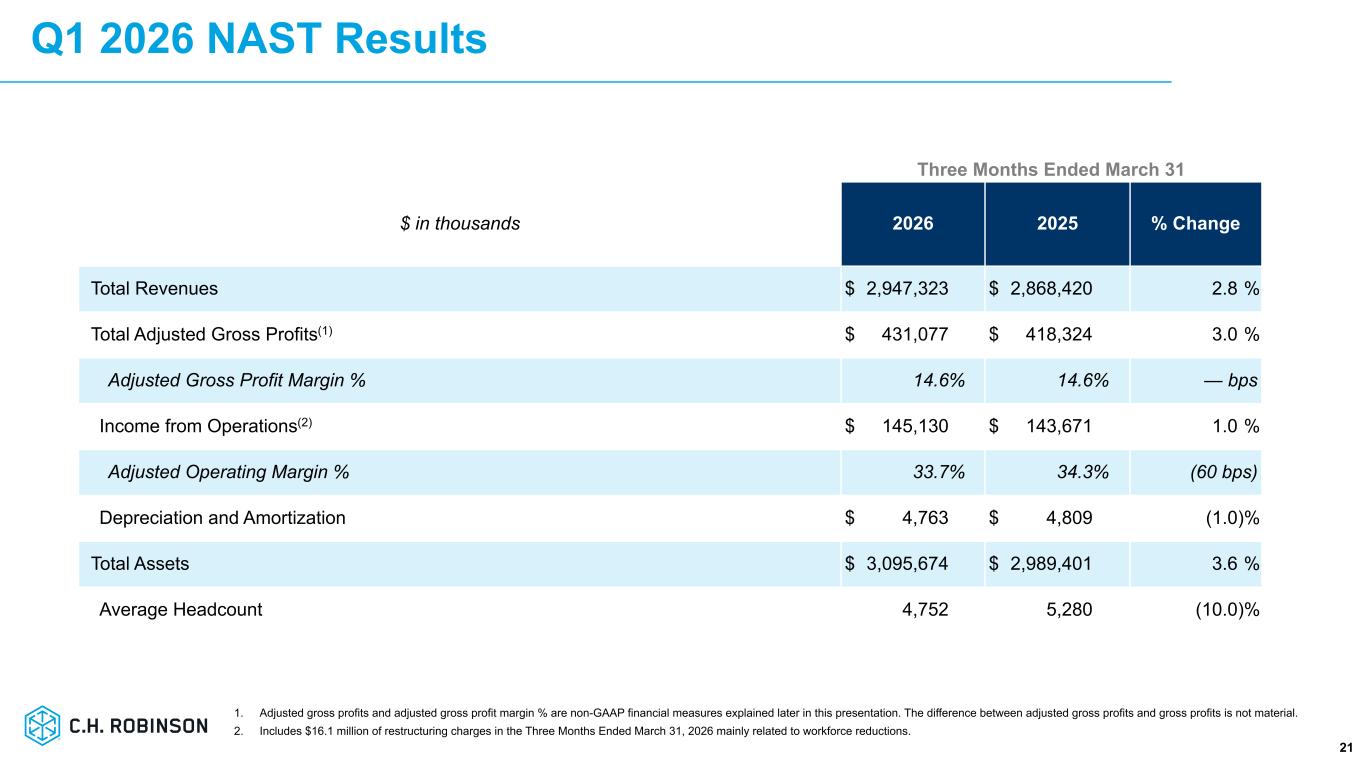
Thank you Dave and good afternoon everyone. I'm extremely proud of the team's disciplined execution in Q1 that showcased the secular earnings growth underway in NAST and our improved ability to offset pressure on our contractual truckload margin as the cost of capacity increased significantly. As a result of standing by our customers in Q1 with an industry-leading tender acceptance rate, our contractual truckload volume grew year over year. It also increased due to a win rate that has improved over the past year with a particular focus on growth in certain verticals that we've targeted with improved horizontal capabilities and solutions. As a result, our mix of contractual truckload volume increased from approximately 65% in Q1 last year to approximately 70% this year. At the same time, Q1 truckload spot market costs, excluding fuel, increased approximately 19% year-over-year, according to DAT. This was a result of several supply-driven constraints, including CDL and other enforcement actions, and multiple winter storms that disrupted the typical seasonal rate softening across several impacted regions and prevented spot rates from following their normal downward trajectory in Q1. As a result, tender rejection rates rose across the industry. Contractual route guides began to fail and route guide depth increased throughout Q1. This created opportunities for transactional volumes at higher margins and armed with better disciplines and tools than in the past, our team of freight experts did a great job of capturing the right transactional volume. Combined with targeted repricing of some of our contractual business, widening our cost of hire advantage, and strong performance within our LTL business, we were able to offset the pressure of our contractual margins and maintain our NAS gross margin at 14.6 percent in q1 this also included absorbing the higher cost of fuel while it has very minimal impact on our gross profit dollars due to being a pass-through cost in our brokerage model a rising fuel surcharge reduces our gross margin percentage for example the increase in fuel surcharges from february to march reduced our truckload gross margin in march by over 50 basis points sequentially Again, no impact on gross profit dollars, but it does impact the margin percentage, and this could continue into Q2 given the still elevated fuel costs. While maintaining our overall NAS gross margin in Q1, the team also outgrew the Cass Freight Shipment Index for the 12th consecutive quarter. Our Q1 total NAS volume was flat year-over-year, compared to a 6.2% decline in the index. Our LTL volume increased approximately 2% year-over-year, while our truckload volume declined approximately 3.5% year-over-year, reflecting market share gains in both modes. It's important to understand that we could have grown our truckload volume by considerably more, but our focus on optimizing our gross profit and earnings outweighed further market share gains in Q1. As a result, our year-over-year and sequential growth in adjusted gross profit outperformed the market again in Q1. We'll continue to appropriately exercise our optionality on a monthly, weekly, and daily basis to pivot toward volume or margins as market dynamics evolve, making disciplined, data-driven adjustments to optimize for the most effective combination that drives earnings growth and long-term value creation. One of the keys to our consistent market share gains has been volume growth in some key verticals that we've specifically targeted. During Q1, we continued to deliver year-over-year truckload volume growth in both the retail and automotive verticals. These results reflect the execution of our strategic focus and our expanded capabilities that directly support these segments and evolving customer needs, such as our leading drop trailer, cross-border, and short-haul capabilities. In our greater than $3 billion LTL business, where we move more LTL freight than any other 3PL in North America, we delivered year-over-year volume growth for the ninth consecutive quarter, reflecting consistent outperformance versus the broader LTL market. Our deep, long-standing relationships with LTL carriers and our proven ability to manage service variability across the carriers enable us to consistently deliver a high level of service to our customers. They continue to turn to us to simplify the complexities of LTL freight and to reduce their costs. Across our NAS business, we're also making smarter use of our proprietary digital capabilities and getting actionable data and AI-powered tools into the hands of our freight experts faster, enabling them to make better decisions and to capture the optimal freight for us. These digital capabilities also enabled us to continue delivering double-digit productivity increases in NAST in Q1. Since the end of 2022, we have delivered a more than 50% increase in shipments per person per day, and this is measured across the entirety of our NAST organization. This enhanced efficiency is not only lowering our industry-leading cost to serve, but it is also elevating the customer experience by enabling faster, more reliable service. Looking ahead to Q2, it is typically a seasonally stronger quarter compared to Q1, beginning with produce season and continuing with stronger food and beverage demand as the weather gets warmer across the country. Due to these seasonal trends, the 10-year average of the Cass Freight Shipment Index, excluding the pandemic-impacted year of 2020, reflects a 4.5% sequential volume increase in Q2. Truckload spot rates are expected to remain elevated, and we're now expecting a 17% year-over-year increase in dry van spot rates for the full year, up from 8% only three months ago. There is less elasticity in the supply of capacity, and carriers' operating costs continue to rise, and this is leading to higher spot and contract rates. None of this changes our expectation to continue outperforming in any market condition, and we're excited about our strong results from ongoing contractual bids and further opportunities to win in the spot or transactional market. As Dave said in his opening comments, we remain focused on what we can control, regardless of market conditions, and we will continue to deliver industry-leading solutions and flexibility that only a scaled broker can provide to customers and carriers. Our people and their unmatched expertise enable us to deliver exceptional service, greater value, and they are relentlessly driving improved results. With much more runway for improvement in front of us, we're still in the early innings of our transformation journey. With that, I'll turn it over to Arun to provide an update on the durable advantages of our technology, scale, and expertise.
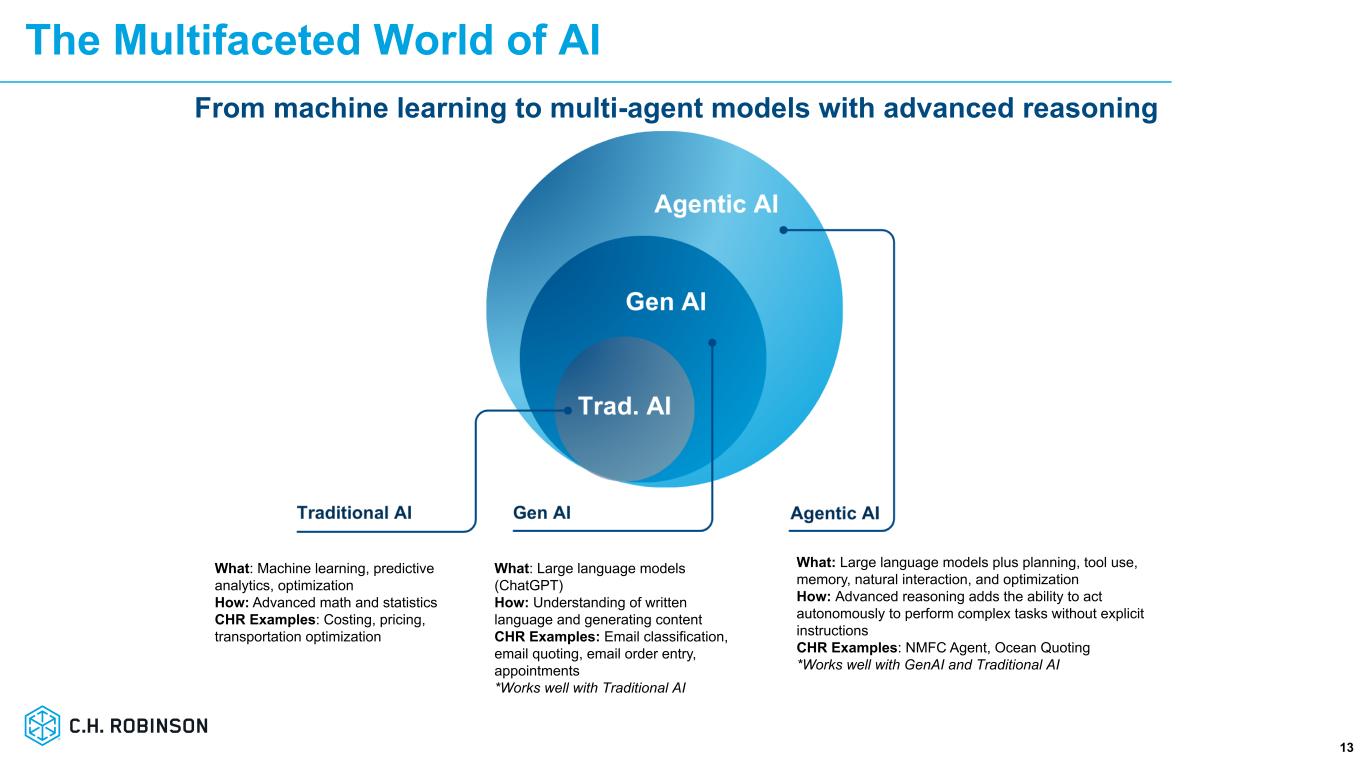
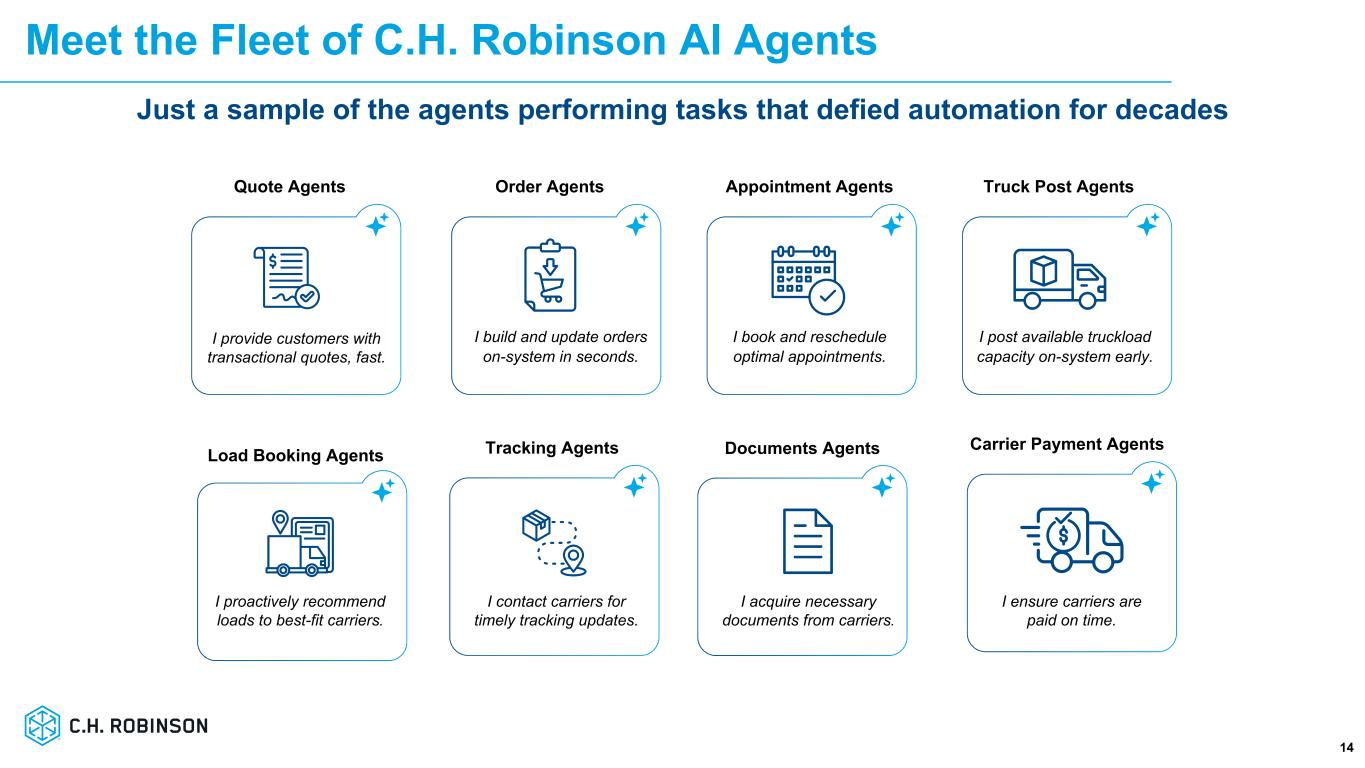
Thanks, Michael, and good afternoon, everyone. As Dave and Michael described, we continue to execute our discipline strategy, delivering for our customers and carriers, while scaling several innovations that better serve our customers and widen our competitive mode. At the center of these efforts is our Lean AI strategy, which combines our lean operating model with deep industry expertise and our proprietary, custom-built AI agents embedded directly into the workflows within our quote-to-cash lifecycle. This strategy enables us to automate, scale, and execute in a sustainable and repeatable way without letting external narratives blur the difference between perception and reality. We take a highly focused and disciplined approach to AI deployment, and there is no hobby AI at Robinson. We deploy AI where it delivers real-world results and measurable outcomes that show up in our P&L. We prioritize our efforts based on ROI, leveraging extensive instrumentation to identify the most manual and high-friction work, and then scale our AI capabilities within our existing technology spend. access to ai itself is not a differentiator and anyone can say they're using ai but what matters is how ai is engineered operationalized and scaled and ai is only as effective as the data and context that powers it part of our competitive advantage comes from the scale scope depth and proprietary nature of our data and context which i'll explain shortly We combine that with a disciplined operating model that allows our tech to be continuously operationalized and improved. Before going deeper, it is worth grounding in how AI works at a high level. In the AI ecosystem, there are broadly three layers. At the foundation is infrastructure, which provides compute and storage. Above that are AI models, which are increasingly accessible to everyone. neither of these layers provides a durable competitive moat the real differentiation and advantage exists at the third layer which is the application layer at ch robinson we own our application layer this is where the benefits of ai come to life when deployed correctly and how we deploy ai agents is another source of our competitive advantage ch robinson's builder culture produced our proprietary transportation management system and an extensive application stack including advanced ai and machine learning capabilities that sit on top of that that same culture now enables us to design build and deploy fit for purpose ai agents that drive value for the customer carrier and robinson with more than 450 in-house engineers and data scientists who have domain expertise and deeply understand our business we're able deploy agents faster and with greater control than a buy and integrate model that relies on stitching together third-party solutions that are generic and lack the data set and context that represent the scale complexity and nuance of our business and the industry our unmatched scale proprietary systems and deep logistics expertise provide the data context and and human in the loop oversight that makes our AI agents more effective, more reliable, and more difficult to replicate. Our data and context advantage spans multiple modes, such as dry van, flatbed, temp control, ocean, and air. They also span multiple services, such as short haul, drop trailer, cross border, expedited, and customs, as well as multiple geographies, customers, and lanes. This level of granular, disaggregated data cannot be purchased. And this depth of data, such as data on individual warehouses, enables us to understand price and cost dynamics better than anyone in the industry. Scale, scope, and depth of the context that we provide to our custom-built AI agents is also part of our moat and competitive advantage. Through our human-in-the-loop process and extensive instrumentation, We collect institutional knowledge from workflows and tribal knowledge from our freight experts into a context layer that enables our AI agents to execute and continuously improve alongside our expert logisticians. In effect, our people teach our AI agents in the same way they would train a new operations employee. Routine work can then be executed autonomously, allowing our teams to handle non-routine surges in volume and higher value, more strategic activities for our customers. For example, think about appointment automation and the breadth of customers, freight dimensions, and dock management systems we deal with. Every one of these customers' dimensions and locations has policies and nuances that that are known to the appointment agent by way of an engineered context layer. Economically, this model scales efficiently. After the initial build and implementation, our marginal costs are very low. The ongoing costs are primarily tied to AI token usage rather than having to pay by transaction to a software as a service provider. So owning the technology and engineering it in such a way that we have a scalable model is a critical component to widening our competitive moat. Our build model is also important from a speed of implementation perspective. If a company is using multiple third-party providers to create and implement AI agents, they are beholden to that external provider who doesn't know the business as well. With our builder culture, we're leveraging the vast domain expertise of our in-house team. Since we're building our own AI agents, we have more control over the implementation process and the speed of integrating those AI agents. That faster speed to ideate, build, operationalize, and scale our AI agents is a differentiator, and it's showing up in our outperformance. Our fleet of AI agents is growing quickly as we continue to pioneer new ways to automate manual tasks and supercharge our industry-leading trade experts to solve for complexity and deliver high-quality service and outcomes to our customers and carriers. We continue to leverage and scale the use of Lean AI to power new capabilities that are backed by our unmatched data, scale, and context, and we're continuing to disrupt from within. Identic AI operates with a degree of autonomy and unpredictability, making its progress nonlinear and requiring ongoing human-in-the-loop oversight as it advances through cycles of progress and retrenchment. Our lean AI process of discovering, learning, and building where missteps and resulting learnings are milestones is not only necessary, but is the best path to uncover what truly works. Continued improvements of our service to cost-efficient AI task agents that listen, learn, and act all day, every day, enables us to deliver fast, accurate, and personalized service at scale and in any market. we have a clear view of both what has been built and what remains ahead and we are still in the early innings of our transformation there is significant runway across our business to continue scaling ai agents and we've automated only a fraction of the hundreds of processes and sub processes that exist across the quote to cash life cycle of an order as dave said our strategies focus on building the best model for demonstrable outgrowth while continuing to have
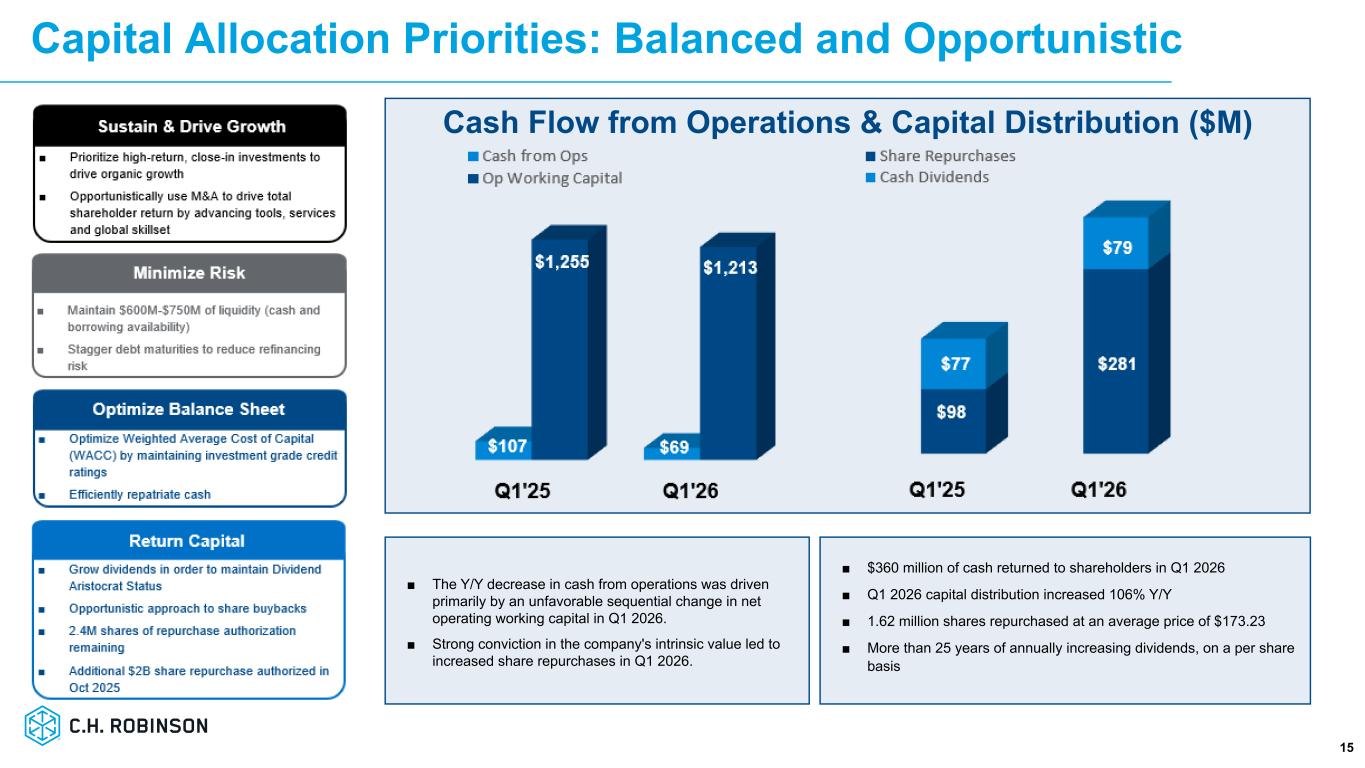
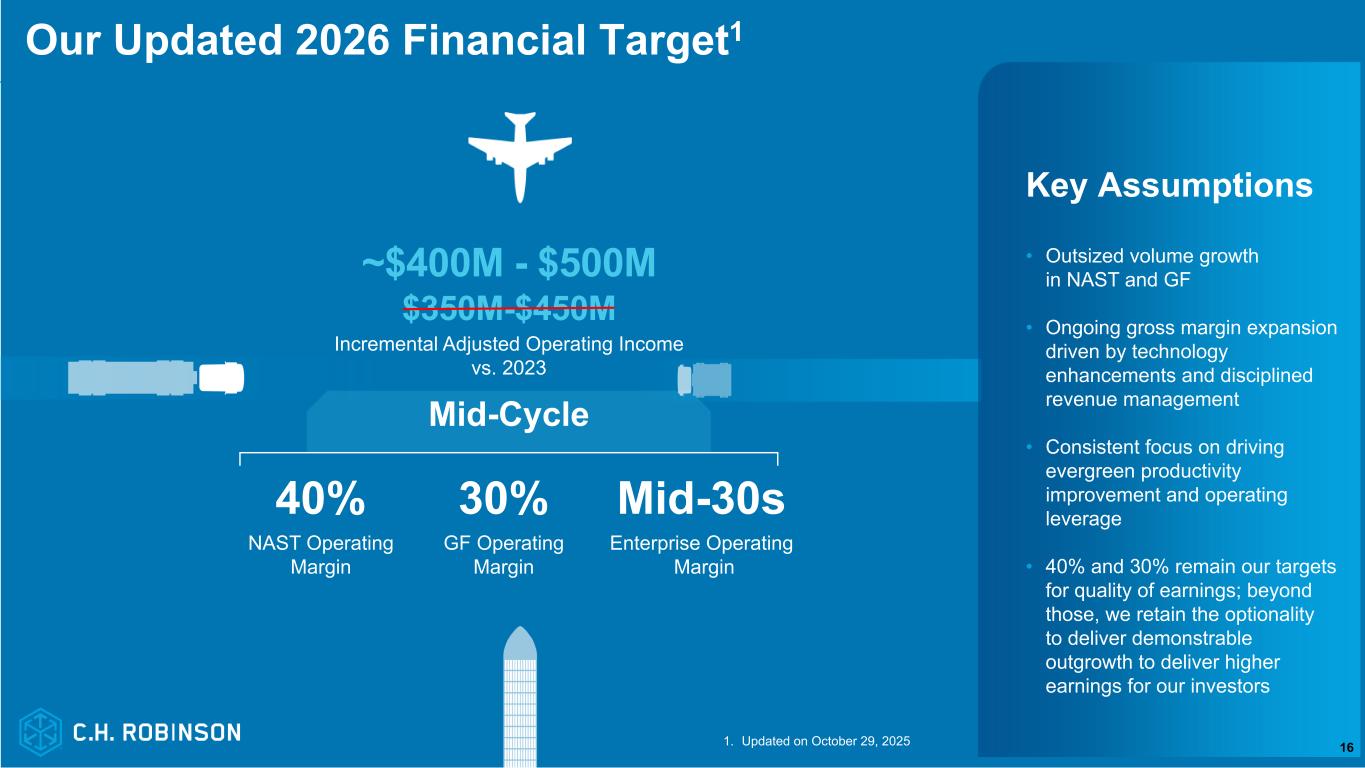
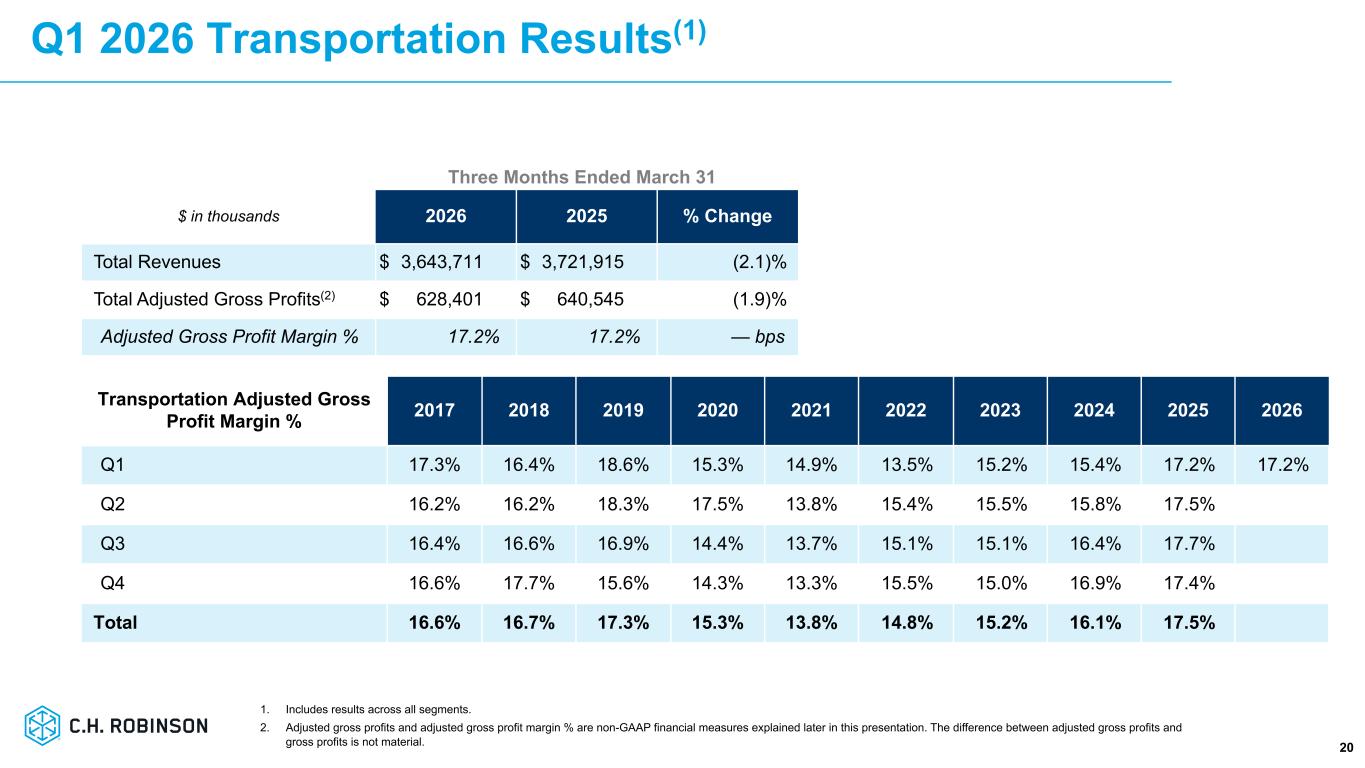
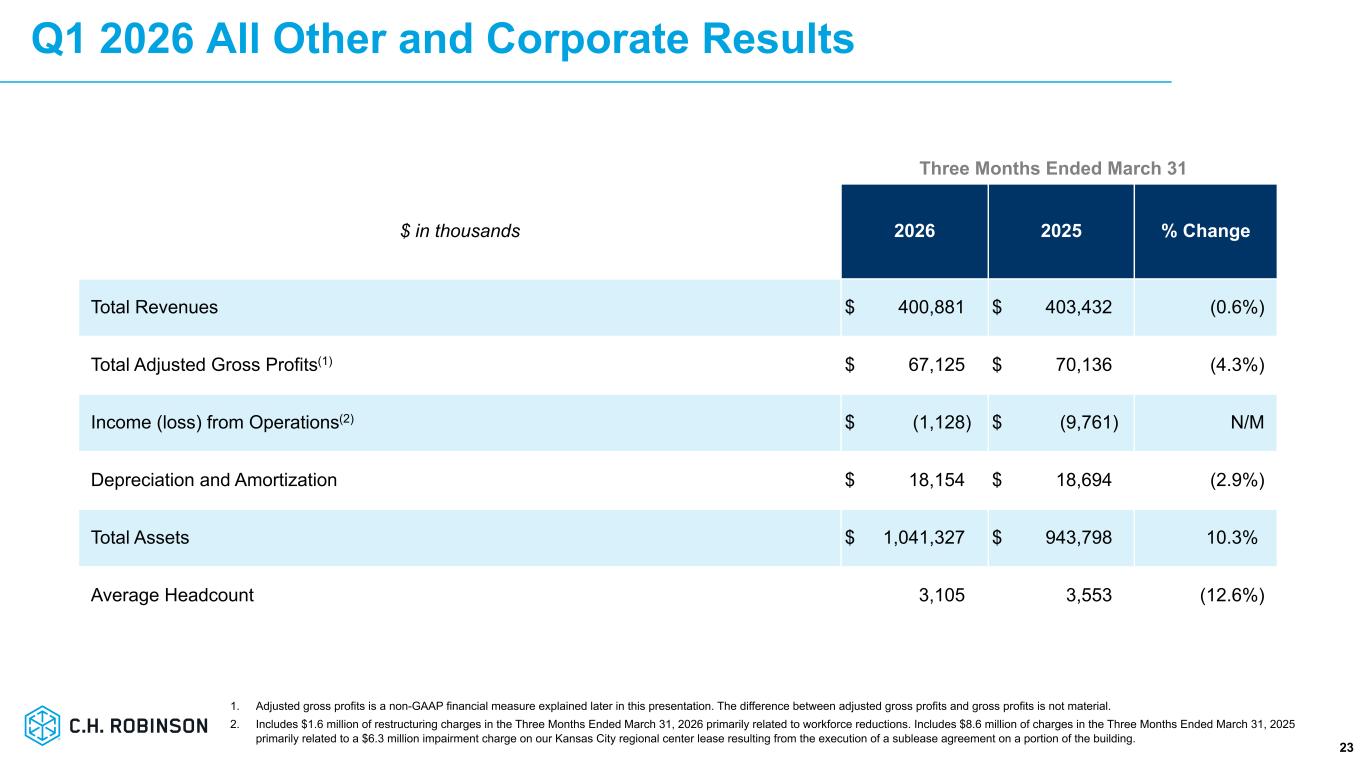
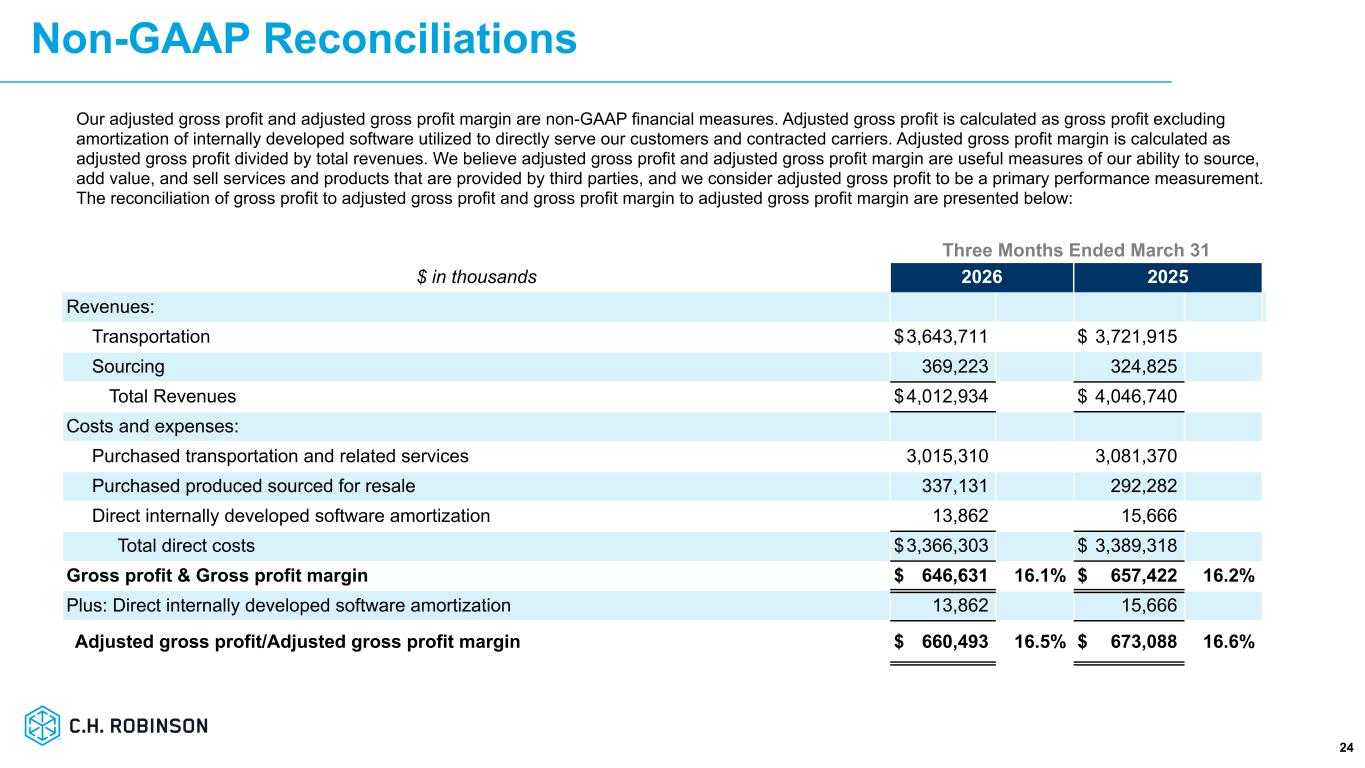
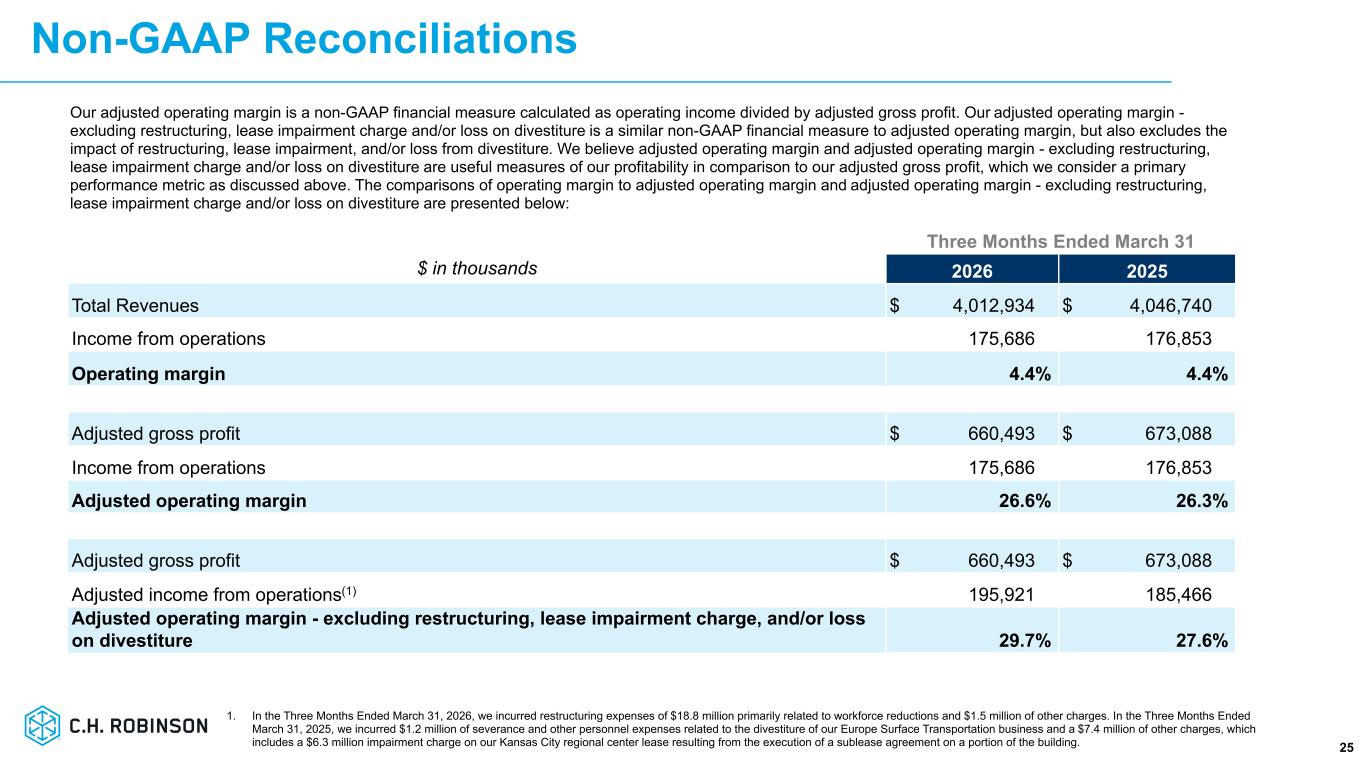
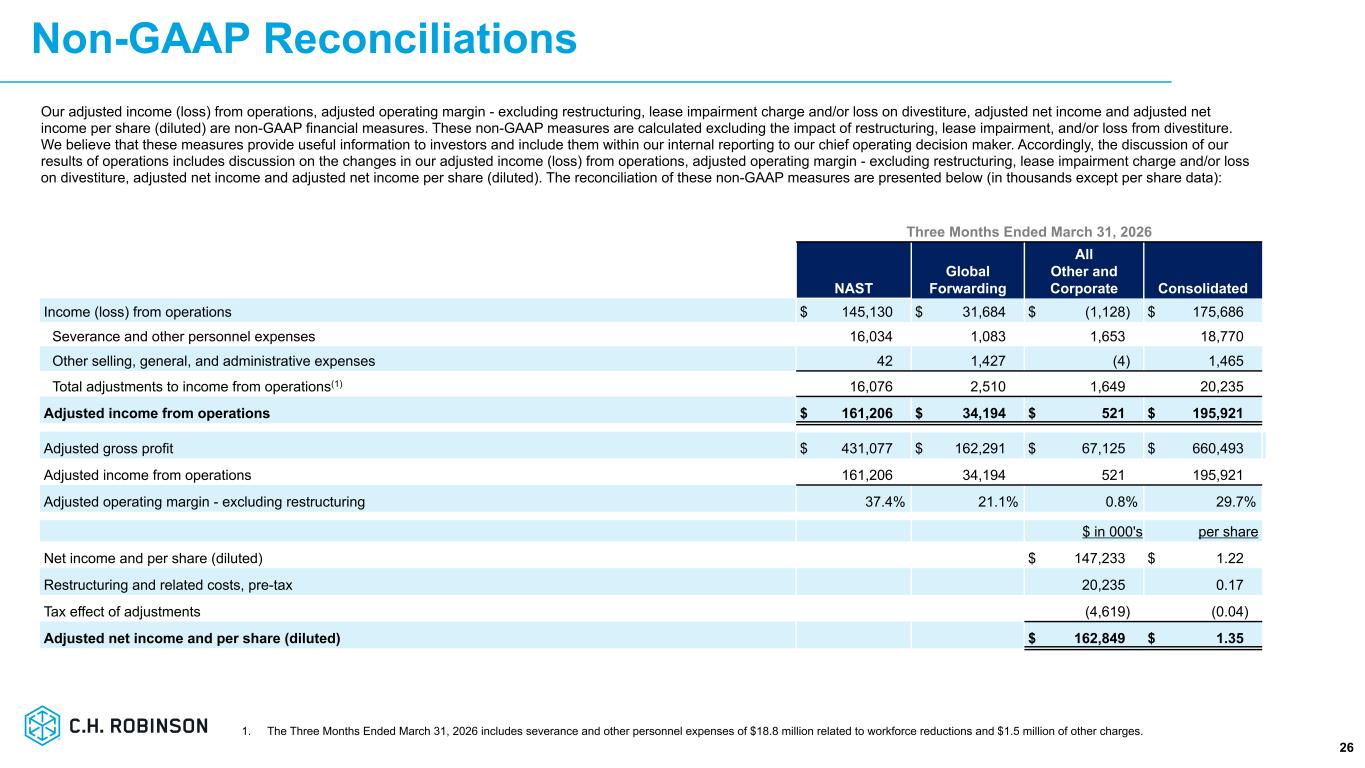
industry-leading operating margins our technology is unmatched and we will continue to disrupt ourselves to stay at the forefront of the ai revolution and to further further widen our competitive modes with that i'll turn the call over to damon for a review our first quarter results thanks arun and good afternoon everyone through another quarter of discipline execution we delivered secular earnings growth and continued to advance our strategic priorities aimed at market share growth, gross profit optimization, and increasing our operating leverage, all supported by our lean AI strategy. The macro environment continued to provide pressure in Q1, with the CAS index down 6.2% year-over-year against easier COPs. While we outperformed the index, our Q1 total revenue and AGP declined approximately 1% and 2% year-over-year, respectively. The AGP decline was primarily driven by a 12% year-over-year decline in global forwarding due to lower adjusted gross profit per transaction and lower volume in our ocean services. For the total company on a monthly basis, our AGP per business day compared to the prior year was down 4% in January, down 2% in February, and flat in March. Turning to expenses, Q1 personnel expenses were $352.7 million, including $18.8 million of restructuring charges related to workforce reductions. Excluding restructuring charges, our Q1 personnel expenses were $334 million, down $13.4 million, or 3.9%, primarily due to our continued productivity improvements and cost optimization efforts. Our average headcount was down 12.3% year-over-year in Q1 and was down 3.1% sequentially, illustrating how we continue to decouple headcount growth from volume growth and optimize our organizational structure. We continue to expect that our 2026 personnel expenses will be in the range of 1.25 to 1.35 billion. This includes an expectation that we will generate double-digit productivity improvements in both NAST and Global Forwarding in 2026 as we continue to implement agentic AI solutions across our quote-to-cash life cycle of an order. As we have stated previously, we expect these productivity improvements to be over-indexed to the second half of 2026, and the same can be said of the sequential declines that are expected in our personnel expenses. Our Q1 SG&A expenses totaled $132.1 million. Excluding $1.5 million in restructuring charges, SG&A expenses were down $9.6 million, or 6.9% year-over-year, due to cost optimization efforts. We still expect our 2026 SG&A expenses to be in the range of $540 to $590 million, including depreciation and amortization of $95 to $105 million for the year. Although most of our SG&A expenses are subject to inflation, we expect continued cost improvements to partially offset the inflationary impact. As a result of our efforts to grow market share, improve gross margins, and increase our productivity and operating leverage, we expanded our operating margin, excluding restructuring costs, by 210 basis points year over year. And despite the significant increase to spot market cost in the truckload market, NAST expanded its operating margin, excluding restructuring costs, by 310 basis points year over year. This is the lean AI strategy at work, and we reaffirm our 2026 its operating income target that we raised in October of last year. Shifting to below operating income, our effective tax rate for the quarter was 11.7%. Historically, our tax rate has been lower in the first quarter of the year due to incremental tax benefits from stock-based compensation deliveries that occur in Q1. For the year, we continue to expect the full-year tax rate to be in the range of 18% to 20%. Our capital expenditures were $15 million for the quarter, and we still expect our 2026 capital expenditures to be $75 to $85 million. Turning to cash and our balance sheet, we generated $68.6 million in cash from operations in Q1, and we ended Q1 with approximately $1.24 billion of liquidity. Our financial strength continues to be a key differentiator in our industry, giving us the ability to invest throughout the freight cycle to further enhance our capabilities and to return capital to our shareholders. Our net debt to EBITDA ratio at the end of Q1 was 1.32 times, up from 1.03 times at the end of Q4 as we opportunistically deployed capital for a higher amount of share repurchases while our capital allocation strategy remains grounded in maintaining an investment grade credit rating our balance sheet strength enabled us to return approximately 360 million of cash to shareholders in Q1 this represents a more than two-fold increase compared to Q1 of last year and includes 280.7 million of share repurchases and 79 million of dividends. We have strong conviction in the strategy we are executing and in the intrinsic value of the business. Our share repurchase activity reflects that conviction and our confidence in the long-term fundamentals of the company. There is tremendous runway for improvement ahead and our operating model, our technology, and our people continue to differentiate Robinson and widen our competitive moats. With that, I'll turn the call back to Dave for his final comments.
Thanks, Damon. As you've heard in our prepared remarks today, we've continued to deliver secular earnings growth from the disciplined execution of our strategy. I'm proud of the progress we've made collectively to transform CH Robinson into the global leader in lean AI supply chains. With our lean operating model, our commitment to continuous improvement, and our AI innovation is at the core of our transformation, I continue to be even more excited about what we believe we can deliver in the coming years. Our differentiating lean AI gives us a unique opportunity to create new ways to solve complex challenges at scale helping our customers build supply chains that are smarter faster and more resilient in a world where disruption is constant and agility is essential we will never stop with our push to discover learn innovate and solve problems with speed and that is where the lean operating model is so important for our success as lean disciplines continue to be deployed more broadly across our organization our teams are becoming increasingly equipped to identify root causes of problems implement countermeasures and drive meaningful improvements that's how we delivered further earnings growth in q1 and how we've consistently delivered our performance for the last two plus years it's also why we're positioned to continue doing so regardless of of market conditions or cycles. The strength of our strategies, our technology, our people, and our operating model disciplines are differentiating and sustainable in any market environment, including an inflecting spot rate environment like we've seen recently, or eventually an inflecting demand environment. And as we lead our industry and stay on offense with our Lean AI strategy, I want to thank our people for their relentless efforts to provide exceptional service to our customers and carriers for embracing the Robinson operating model and continuing to execute with discipline. We've been a leader in this industry for more than a century, and we will continue to be. Our scale, our technology, our people, and the Robinson way enable the operational excellence that has defined us for decades. The Robinson Way means being authentic, persistent, accountable, curious, and united. And those values, along with our longstanding commitment to safety, guide how we operate every day. Anything suggesting otherwise is misinformed. We will continue to lead with purpose and move with urgency to disrupt ourselves and the industry. and we expect to drive sustainable outperformance profitable growth and long-term value for all our stakeholders that concludes our prepared remarks i'll turn it back to the operator now for the q a portion of the call thank you and with that we will now be conducting a question and answer session we ask that you please limit yourself to one question and one follow-up if you would like To ask a question, please press star 1 on your telephone keypad.
Operator
The confirmation tone will indicate that your line is in the question queue. You may press star 2 to remove yourself from the queue. For any participants using speaker equipment, it may be necessary to pick up the handset before pressing the star keys. One moment while we poll for questions. And our first question comes from the line of Tom Wadowitz with UBS. Please proceed with your question.
Yeah, great. Great. Thank you. And, you know, it's continuously good to see the strong results against, you know, a kind of evolving freight backdrop. I wanted to ask you on, I guess, how you would think about the impact to your business, you know, from the cycle improvement, right? So I generally think stronger contract rates are good. Yeah, the brokers can get, you know, you can be squeezed for a bit. Obviously, you've managed that well, but, you know, is that potentially if contract rates are up quite a bit, you know, we're hearing kind of 10 to 15% contract increases for brokers and truckloads, is that potentially a driver of upside to your $6 number for the You know, maybe that helps you in second half. And then I guess the other question is, just along the lines of the Montgomery case, I think that, you know, we're expecting a decision May or June. So, you know, it seems like probably some, you know, over 50% chance, let's say, that you win. But, you know, how would you respond if you end up losing in the Montgomery case, just in terms of other things you can do on the safety side to do more? Or would you say, hey, you know, we're fine because it hurts others more than it hurts us because we have scale and financial strength?
Hey, Tom, this is Dave. Hey, thanks for the question. I think we're going to start, I'll start with the back half of your question on Montgomery, and then Michael will fill in on the first part of the question. Look, let me, I want to be really clear about this. The Montgomery case is a case that we expect to win. We have argued, I think, a really good case going to the Supreme Court. It's important that you know on the context here, and I think you do, is this case is really not about immunity for brokers. This is about safety, and this is why we support this case. Not having 50 different state rules, and when it comes down to the ruling of it, which we're anxiously awaiting, if it comes in our favor or not, we obviously have a playbook for either, but this is really about driving safety for the industry. And we think that if it's not in the favor, that certainly brings some headwinds to the industry because you'll have to start dealing with various brokers, and this should be the FMCSA really being the ones driving safety of carriers. But we're expecting, because we've won in the Seventh Circuit, we've won, obviously, in the Southern District of Illinois, we expect that we'll win this in the Supreme Court as well. Either way, Robinson will be prepared to go, and we have a playbook for either.
Yeah, Tom, this is Michael. I'll maybe tackle the first part of your question around kind of just the overall rate environment and how that will move forward. You know, first of all, I'd say just really proud of the team and how they managed what was a difficult Q1, which was really an extension of kind of the back half of Q4 through the holiday and then into the multiple storm periods, as well as the impact of regulatory changes on the overall supply of capacity in the marketplace. You know, one, I think the team did an incredible job of being very active in terms of our repricing efforts in the quarter, very rifled in our approach. We've talked about that, that we expected ourselves to be faster than we have in the past, but to do it with more accuracy, more specificity, and to really work with our customers to reprice the places where the market requires it to keep supply chains healthy, but to do it with them. And I think they've appreciated that through Q1, and we saw that in our results and really have had some success with repricing. Kind of from our prepared comments, we're really pleased with our recent bid activity. Q4 and Q1 are large RFP periods for the industry as a whole. We feel really good about how we came out of those periods and feel good that we're going to be in a position to manage the ongoing higher cost marketplace that we're in right now but also feel good that our process to manage repricing with our customers that we did well in q1 would continue into q2 if needed thank you and our next question comes from the line of ken hexter from bank of america please proceed with your question hey great uh good afternoon um
dave congrats on on really uh impressive moves on on the automation but i i'm sorry on on technology adoption. In dropping the 12% of employees or a little bit less year over year, is there any, maybe walk through that process and where we're seeing that change, where it's coming out of? Is it adjusting sales at all? Maybe kind of talk about that and how you can continue to accelerate that from this point forward. And then Michael, is it normal for contract as a percent of the total book to go up this soon in the turn? I guess, don't you want to play the spot and take advantage of that fluctuating rate to offset the negative impact of the contract? Or do you feel like you're catching up on the book of business fast enough? Thanks.
Yeah, Ken, thanks a lot. Hey, let me just start with a little bit of context on that. First of all, the way we look at this, and we've said this pretty consistently, as we look at workflows at Robinson. And for us, it's been the order-to-cash process, which has been a very kind of frictionless manual process in its workflow. That's where we've really kind of gone at it with our technology. But also in this industry and with us, you have low double-digit turnover that happens in the industry. And that's really allowed us to really drive efficiencies while not, in some cases, backfilling some of those roles that we've had in that kind of entry-level kind of order-to-cash process that we've had. we've also shifted as we've said consistently we've shifted our our focus on more customer focus and that's where we've actually invested in some roles in our small medium business as well as customer facing for for for solution solving with customers but there's just there was just a lot to go when we start looking at that order to cash process that's kind of the context that that we really had when it came to headcount and as Damon and I have always said we really don't have a KPI at Robinson when it comes to headcount because we've shifted to an input focus versus output focus and so we really in re-engineer the work and the output is the output that's how we really kind of kind of look at it here Robinson yeah and Ken this is Damon I'll just put a bow on what Dave said so this year we've committed to double-digit productivity across the enterprise So both NASDAQ and our global forwarding businesses, we've also commented that that will be over-indexed to the second half of the year.
And the way we think about productivity going forward, just to remind the audience, is we've committed to single-digit productivity every year, regardless of circumstances. So our operating model will generate productivity in the single digits, mid-single digits, every single year. And then years like 2025 and 2026, where we have waves of innovation, so whether that be Gen AI adoption, you know, agentic AI adoption, you know, then we're committing to double-digit productivity when you compound those waves of innovation with baseline continuous improvement. But look, we're in the early innings of our productivity journey, both in early innings of the lean adoption, early innings of our technology adoption. So there's a long runway to go as it relates to productivity today, Robinson.
And, Ken, from your second question, kind of on the mix of business, I think you're right in kind of a longer time frame that our goal as the market shifts would be to move that percentage to more equalization. But really in Q1, most of the activity in the marketplace were supply event-driven, either storms, regulatory impacts on capacity. And while we're optimistic that there's some life in the market, it was still dominated by supply-driven events. And so it was really important for us as we come out of our RFP business to make sure that we take care of our customers, that we select the right transactional business to win, which I think we did based on the combination of mix of business and our margin performance. And really, early in the quarter, a lot of the transactional pricing wasn't matching where the market was, or maybe I guess I would say the transactional market didn't match where maybe the pricing and capacity market was. And we saw that improve throughout the quarter. So I feel really good about how the team balanced that. It's important that we also make sure that we take care of the customers who've awarded us business through what we, as we said in our prepared comments, was a successful RFP season. But we do look for that to equalize over time, especially if demand improves throughout the rest of the year.
Yeah, and Ken, just to put a bow on what Michael said, I mean, this has been a strong bid season. We expect to gain share through this bid season and price. So as Michael said, just to summarize that, really strong bid season for C.H. Robinson.
Thanks. Damon, just a quick follow-up, if I can, for Arun. How is global forwarding in terms of the AI deployment, or is it still all brokerage? Is that balanced and catching up, or still mainly brokerage?
Yeah, so, Ted, we're actively deploying the same playbook that we used in NAST over in Global Forwarding. You'll start to see more of that kind of kick in the second half of this year. And, you know, just like NAST, you've seen the journey over the past few years. We've got a lot of runway in Global Forwarding.
Thanks for the time, guys. Appreciate it.
Operator
Thank you. And our next question comes from the line of Chris Weatherby with Wells Fargo. Please proceed with your question.
Hey, thanks. Good afternoon, guys. I guess I do want to ask a little bit on sort of your view on spot activity and demand as we went through the quarter. So obviously, AGP improved as we went month to month. But can you talk a little bit about spot activity and maybe in the context of the contract comments that you're talking about, what level of contract rate increases we're seeing so far through the bid season so far?
Yeah, thank you for the question. I think what we saw early in January was there was still a bit of a decision process of whether the storm impacts of early January and flowing into early February were events or whether they were a continuous and ongoing cost-increasing market. And I think what you saw from a lot of customers was pushing the loads off or rolling the loads beyond the storm without necessarily pushing the loads into the transactional marketplace. As it became clear throughout the rest of the quarter that the cost side of the marketplace was going to hold, then the transactional marketplace started to pick up some steam. But in many cases, the overall demand ecosystem was loads being moved from the C side of the business to the T side of the business without a total increase in loads available. And so, again, really pleased with how the team mixed the service to our customers, but also to take advantage of the transactional freight that delivered the margins that we required in that marketplace. But overall, feel really good about that. But to your second part, you know, we look at repricing as an ongoing event in terms of how is the market performing. And so we don't have a preset goal of percentages. We just know that we are going to have to continue to manage the health of our customer supply chains. And for some customers, that might mean little to no repricing. For other customers, it might be significant. It just depends on the mix. Geographic is a large component right now. There are areas that are impacted more than others by the regulatory changes. And so, again, feel really good about our process, about our revenue management process, and the tools we're getting into our people's hands. And so very confident that we can continue to take share from an RFP perspective and then manage that business appropriately.
Great. That's hopeful. And then a quick follow-up. Just, Dave, if we zoom out a little bit, we think about Montgomery, we think about potential outcomes here. If there's an adverse outcome, I guess, how do you think about market share? It strikes us that there's a whole bunch of this industry that is making essentially no money as it stands right now. And theoretically, there should be some cost pressures from insurance coverage or other factors, I guess. What's the opportunity for Robinson in that scenario from a share standpoint?
Yeah, Chris, thanks. Hey, listen, let me, again, I'm going to address it this way, and hopefully you guys can appreciate this. It is really important that, you know, we put on a strong argument and that we win this case. It's important because, you know, the Supreme Court really has an opportunity to resolve kind of that disagreement of the lower courts. We got to ensure consistency in the application of this preemption of these claims, and it'll reduce this uncertainty, as you know, for brokers, shippers, and carriers alike. I mean, the opposite to that is 50 different state rules, and we support one national safety standard. That's super, super important. When it comes to the impact to Robinson, we don't look at it that way. This is a long tail for a lot of brokers, but we have to plan for both sides of it. And you're right in that you called that out. Obviously, there's going to be some insurance implications if you're going to be in this business, and that's going to impact different people in different ways, depending on your health and your size. And we're prepared either way for that, but we really put up a strong case. It's important for the industry that we bring clarity to this and not just a positive or whatever impact just to Robinson. That's not how we're looking at it.
Operator
Thank you. And our next question comes from the line of Jonathan Chappelle with Evacor ISI. Please proceed with your question.
Thank you. Michael, you gave a good example of the very active and rifled, in your words, repricing approach to the spot rate backdrop. I think what people really want to understand more is the sustainability of what you've managed to do in these first two quarters of the upturn. So in addition to that, just the repricing approach and the collaboration with your customers, can you give more tangible evidence of how you've managed these first two quarters differently than from prior upcycles, and then how that translates into 2Q or 3Q? if rates can kind of continue to stabilize from here and kind of stop the parabolic move higher?
Yeah, thanks, John. I think I'd start with, you know, we've talked about our revenue management capabilities and getting tools into our people's hands faster and faster. And so, you know, if you compare it to maybe the past, I think it would have taken us most of Q1 to figure out where our problems were and most of the quarter to understand what level of repricing we needed, where and how. And really with our lean AI disciplines now, our tech being in our people's hands faster, they're able to see where the supply chains of our customers are having breaking points, where the health of that supply chain is impacted. And then we're able to have conversations with customers where we can make disciplined decisions together. And we can make those either in a one time event if needed based on the change or an ongoing event based on the, you know, really the volatility of that part of their supply chain. You know, we've talked in the past about whether we would have noticed it weeks after or months after, and now we're noticing it that day. We're recognizing the trend. And we're really able to talk to our people about how are we going to fix this and what timeframes do we think this adjusts to. And so I see our process continuing, whether the market goes up or goes down, we're going to continue to have those conversations with our people and our customers. But I feel really good that we have the tools available to handle a continued upswing in the manner it has for the last four months, the market stabilizing, or it potentially going back down depending on just the overall conditions of the marketplace. So I hope that answers your question, but I feel really confident that we're getting the team what they need to service customers regardless of market conditions.
Yeah, and John, I would just to add, this is Damon, that just with the frequency in which we're interrogating the market from a price and a volume perspective, as Michael said, we don't have to set a strategy and hope that strategy materializes within a quarter. We're changing strategies multiple times a day, hundreds of times a month, right? And so to Michael's point, we're working within the conditions the market has given us, and we're outgrowing that market, and we're taking price at the same time right with our operating margin expansion so i think for us whatever the market conditions bear i think the frequency and the surgical nature of our revenue management gives us capability that we think few have in this marketplace all right thank you and our next question comes from the line of bruce chan with stifle please proceed with your question Yeah, thanks.
And good afternoon, everyone. Maybe just wanted to get your thoughts on forwarding in terms of maybe volume development and margin shaping. I know you don't always get into that granularity, but there's obviously a lot going on right now with the Middle East and capacity and the fact that we're lapping the trade disruption this quarter. So any color there would be really helpful for our models. Thanks.
Yep. Thanks for the question, Bruce. What I would say is, look, I think we say this almost every quarter because it feels like we're always in uncertainty as it relates to our forwarding business. I think another really solid quarter in a very difficult macro environment that our global forwarding team performed, right? So as you mentioned, tremendous disruption in the Middle East. And what I would say directly is our direct exposure to the Middle East is quite immaterial to our book. But the knock-on effect to global rates and global capacity has been the challenges that our team has helped our customers work through in the quarter. And I think they did an exceptional job with that challenge. You can imagine capacity being staged in one area that's being relocated to another area for demand patterns and repositioning. I think the team's done a really good job there. And so I'd say in a quarter where disruption could have been impactful to our business just because of the knock-on effect of the global impact of capacity and rates, the team managed that impact to a very immaterial number for Robinson Global 40 in the quarter. So I would say, look, your opening comment of, look, there is a lot of disruption, a lot of global displacement because of the conflict in the Middle East. But I'd say as far as the impact to our business, we've been able to manage it quite well. The impact has been relatively immaterial to our results, and we continue to help our customers solve continuing global conflicts and challenges on the forwarding space.
Operator
Thank you. And with that, our next question is Brandon Oakland from Barclays. Please proceed with your question.
Hi, good evening, everyone, and thanks for taking the question. So I think implied in your 2026 earnings outlook, you guys had embedded quite a bit of expected efficiency gains, especially in the back half of the year. I guess especially given commentary around fundamentals with bid season maybe going a little bit better, Or how do we think about earnings progression, again, into the back half of 2026? Thank you.
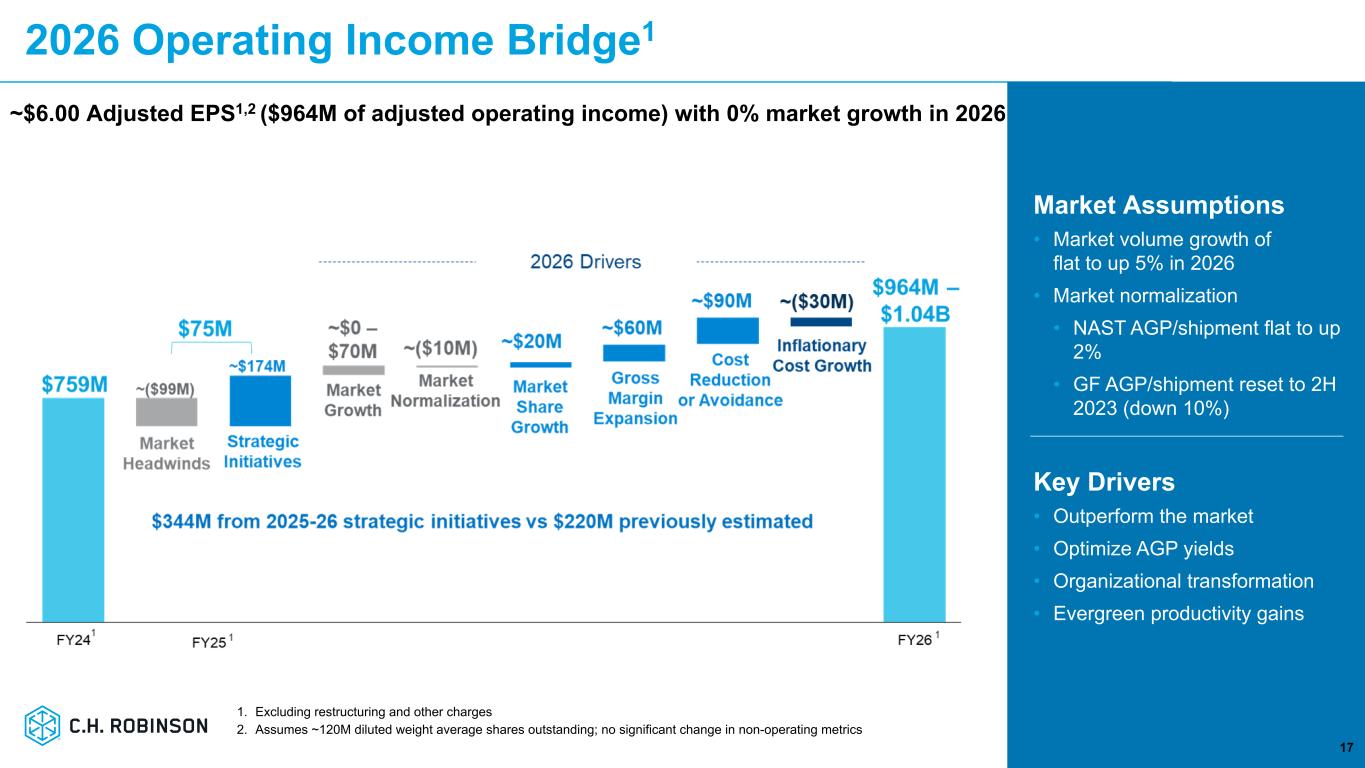
Yeah, thanks for the question, Brandon. This is Damon. Look, I think we feel very good about our investor day update, so the $6 EPS with no market growth. As usual, the market starts out and the year starts out differently than you planned. So certainly there's been, I'd call it market headwinds in the terms of spot rates being substantially higher than certainly we forecasted or anybody forecasted for 2026, but the team has managed that exceptionally well. And we continue to perform exceptionally well on our self-help initiatives around outgrowing the markets, revenue management capability, and productivity. So I would say we have a very high degree of confidence in our $6 EPS target. I wouldn't say we're in a position to change that target or the profile of that target at this point in time as we did mention you know the productivity improvements that we that we've referenced in in those those commitments are over indexed to the second half of the year we think that profile still aligns to our our deliverables but I would just say high degree of confidence in delivering our six dollars with with no market growth assumed we feel very confident in delivering that in 26 thank you and our next question comes from the line of richa our name from deutsche bank please proceed with your question hey yeah thanks uh good evening gentlemen um yeah obviously
very solid results in that um just wanted to better understand the flat volumes and down three and a half percent cl volumes mike i know you discussed this in earnest about you know, a deliberate decision you were making about being disciplined on growth opportunities, but maybe dive deeper into that and what you're seeing, market that prohibited you from maybe profitably participating in more volume opportunities. Maybe it was just PT, but I just want to better understand and, you know, see if volume growth could start to be more significant as we go through the year.
Hey, Richa, thanks for the question. And, you know, I'll speak predominantly to kind of what we saw in the quarter. And I'd say really the impact on volume was, first of all, like we said, we made very deliberate choices about the volume we wanted to win in the transactional space at the margins we thought the market required, as well as to make sure we serviced our customers in the contractual space. It's also important to realize that there were some major storm events that impacted very large shipping areas and volumes. And while many of that volume does end up getting shipped. You don't get all of it back. So there was a volume impact just to the type of events that we went through through the quarter. And so I think when we look at that, look at the balance of what freight was available to us, look at how our customers were impacted, we feel really good about the volume we produced in the quarter. We've talked about, as Damon mentioned, the market did not grow in the quarter, as you saw with cash down 6.2%. So market outgrowth in both modes, year-over-year growth in LTL. So we continue to believe we're taking the right share at the right time. We certainly expect ourselves to continue to do that. Whether the market starts to improve or not, we're going to continue to hold ourselves to that high bar. But we're going to continue to do it based on what is the right return for all shareholders, customers, carriers, employees, and shareholders.
And Richard, this is Damon. I would just add to that is, and we've been pretty adamant about this for, you know, almost two years now, right, is we take the volume we want in a given quarter, right? And so in Q1, you know, we took the volume that we felt met our criteria. Now, make no mistake, Michael and team could have outgrown the market substantially more than what we did, right? But based on our own financial expectations, based on our own quality of earnings, you You know, we focused on the volume that mattered most to us. And I think the best way to frame this up, and I won't name specific companies, but I think the bookends are important here, right? We had one competitor that had pretty high growth in the quarter, right? Double-digit growth, but yet negative gross margin dollars and a significant contraction in rate in the quarter. Yet another competitor that had a significant volume reduction, almost 20% in the quarter, but maintained rates, right? we believe our model is superior right we had what I consider very strong outgrowth in the quarter while maintaining our rates around maintaining our AGP margins in a quarter where spot rates were up 18 to 20 percent so as Michael said we feel like we've got the strategy that works we take the share we want we deliver the margin we need we feel like we have the best cost-to-serve model in the industry, and I think Q1 was a perfect example of that.
Operator
Thank you. And with that, ladies and gentlemen, this does conclude our question and answer session. I would now like to turn the floor back to Chuck Ives for closing comments.
Yeah, thank you, everyone, for joining us today, and thank you for your questions. We look forward to talking to you throughout the quarter. Have a good evening.
Operator
Thank you. And with that, ladies and gentlemen, this does conclude today's teleconference. We thank you for your participation. You may disconnect your lines at this time and have a wonderful rest of your day.