
DDD 8-K
3D Systems Corp (DDD)
8-K
2021-05-11
For: 2021-05-10
View Original
Added on
April 09, 2026
UNITED STATES
SECURITIES AND EXCHANGE COMMISSION
Washington, D.C. 20549
FORM 8-K
CURRENT REPORT
PURSUANT TO SECTION 13 OR 15(d)
OF THE SECURITIES ACT OF 1934
Date of Report (Date of earliest event reported): May 11, 2021 (May 10, 2021 )
(Exact name of registrant as specified in its charter)
(State or other jurisdiction of incorporation or organization) | (Commission File Number) | (I.R.S. Employer Identification No.) | ||||||||||||
(Address of Principal Executive Offices) | (Zip Code) | |||||||||||||
Registrant's telephone number, including area code: (803 ) 326-3900
N/A
(Former name or former address, if changed since last report.)
Check the appropriate box below if the Form 8-K filing is intended to simultaneously satisfy the filing obligation of the registrant under any of the following provisions (see General Instruction A.2. below):
Securities registered pursuant to Section 12(b) of the Act:
| Title of each class | Trading Symbol(s) | Name of each exchange on which registered | ||||||
Indicate by check mark whether the registrant is an emerging growth company as defined in Rule 405 of the Securities Act of 1933 (§230.405 of this chapter) or Rule 12b-2 of the Securities Exchange Act of 1934 (§240.12b-2 of this chapter).
Emerging growth company ☐
If an emerging growth company, indicate by check mark if the registrant has elected not to use the extended transition period for complying with any new or revised financial accounting standards provided pursuant to Section 13(a) of the Exchange Act.
o
Item 2.02. Results of Operations and Financial Condition.
On May 10, 2021, 3D Systems Corporation (the “Company”) issued a press release setting forth certain unaudited financial results for its first quarter ended March 31, 2021 (the “Press Release”). A copy of the Press Release is furnished herewith as Exhibit 99.1 and is incorporated into this Item 2.02 by reference. The information in this Item 2.02 (and in the Press Release) shall not be deemed “filed” with the SEC for purposes of the Securities Exchange Act of 1934, as amended (the “Exchange Act”), nor incorporated by reference in any registration statement filed by the Company under the Securities Act of 1933, as amended (the “Securities Act”).
Item 7.01. Regulation FD Disclosure.
Included in the Press Release is an announcement that the Company plans to hold a conference call and webcast at 8:30 a.m., Eastern Time, on Tuesday, May 11, 2021, to discuss its first quarter ended March 31, 2021 financial results and other matters relating to the Company’s plans and operations. A copy of the Press Release, which contains additional information regarding how to access the conference call and webcast and how to listen to a recorded playback of the call after it is completed, is furnished herewith as Exhibit 99.1 and incorporated by reference herein. The slides to be presented on the webcast are furnished herewith as Exhibit 99.2 and incorporated into this Item 7.01 by reference.
The information in this Item 7.01 (and in the Press Release) shall not be deemed “filed” with the SEC for purposes of the Exchange Act, nor incorporated by reference in any registration statement filed by the Company under the Securities Act.
Item 9.01. Financial Statements and Exhibits.
(d) Exhibits.
| Press Release issued by 3D Systems Corporation, dated May 10, 2021. | ||||||||
| Investor information to be presented by 3D Systems Corporation on May 11, 2021. | ||||||||
| 104 | Cover Page Interactive Data File (embedded within Inline XBRL document). | |||||||
SIGNATURES
Pursuant to the requirements of the Securities Exchange Act of 1934, the registrant has duly caused this report to be signed on its behalf by the undersigned hereunto duly authorized.
| 3D SYSTEMS CORPORATION | ||||||||
Date: May 11, 2021 | /s/ Andrew M. Johnson | |||||||
| (Signature) | ||||||||
| Name: Andrew M. Johnson | ||||||||
Title: Executive Vice President, Chief Legal Officer and Secretary | ||||||||
EXHIBIT 99.1
3D Systems Reports
First Quarter 2021 Financial Results
ROCK HILL, South Carolina - May 10, 2021 - 3D Systems Corporation (NYSE:DDD) announced today its financial results for the first quarter ended March 31, 2021.
First Quarter Financial and Operational Results
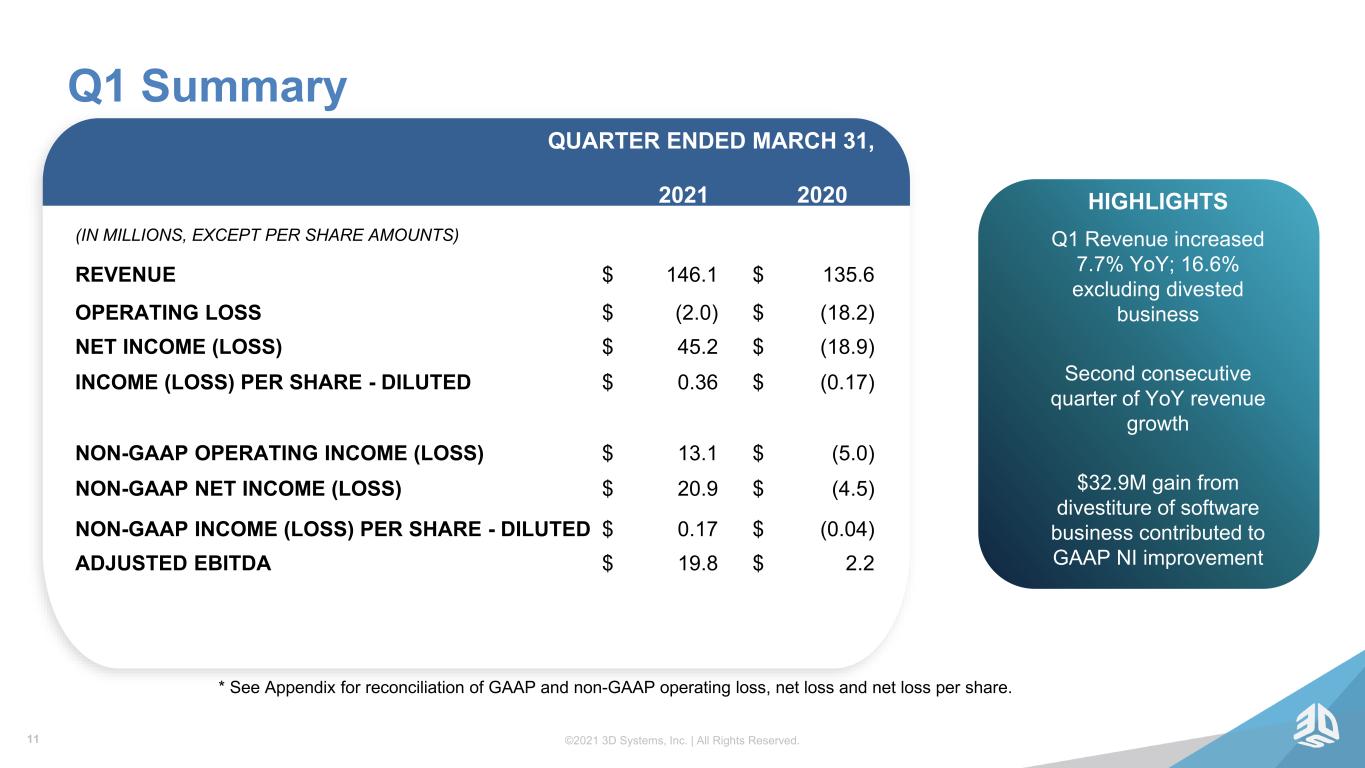
•Q1 2021 revenue increased by 7.7% to $146.1 million, compared to $135.6 million in Q1 2020
•Organic revenue growth, which excludes businesses divested in 2020, was 16.6% for Q1 2021 compared to Q1 2020
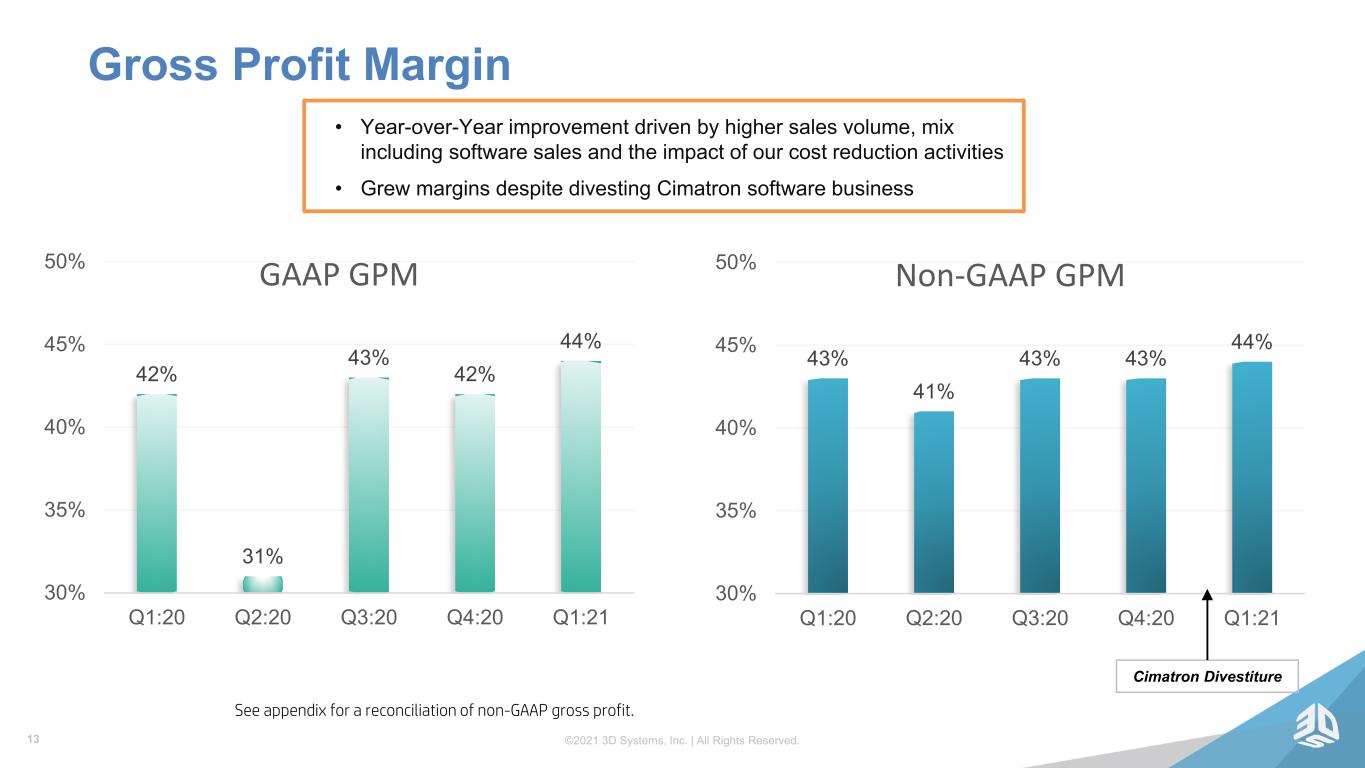
•Q1 2021 gross margins of 44.0% compared to gross margins of 42.1% in Q1 2020
•Q1 2021 GAAP earnings of $0.36 per diluted share compared to a loss of $0.17 per share in Q1 2020
•Q1 2021 Non-GAAP earnings of $0.17 per diluted share compared to a loss of $0.04 per share in Q1 2020
•GAAP operating loss of $2.0 million and GAAP net income of $45.2 million
•Strong revenue growth and cost improvements drove adjusted EBITDA margins of 13.6% and positive operating cash flow of $28.5 million
| Quarter Ended March 31, | ||||||||||||||
| (in millions, expect per share data) | 2021 | 2020 | ||||||||||||
| Revenue | $ | 146.1 | $ | 135.6 | ||||||||||
| Operating loss | $ | (2.0) | $ | (18.2) | ||||||||||
| Net income (loss) | $ | 45.2 | $ | (18.9) | ||||||||||
| Net income (loss) per share - basic | $ | 0.37 | $ | (0.17) | ||||||||||
| Net income (loss) per share - diluted | $ | 0.36 | $ | (0.17) | ||||||||||
Non-GAAP measures for year-over-year comparisons (1) | ||||||||||||||
| Non-GAAP operating income (loss) | $ | 13.1 | $ | (5.0) | ||||||||||
| Non-GAAP net income (loss) | $ | 20.9 | $ | (4.5) | ||||||||||
| Non-GAAP income (loss) per share - basic | $ | 0.17 | $ | (0.04) | ||||||||||
| Non-GAAP income (loss) per share - diluted | $ | 0.17 | $ | (0.04) | ||||||||||
| Adjusted EBITDA | $ | 19.8 | $ | 2.2 | ||||||||||
(1) See Appendix for reconciliation of GAAP and non-GAAP operating income (loss), net income (loss) and basic and diluted income (loss) per share.
Summary Comments on Results
Commenting on the results, President and Chief Executive Officer, Dr. Jeffrey Graves said, “During my first year at 3D Systems, we established a clear strategic purpose that is driving our work every day: To be leaders in enabling additive manufacturing solutions for applications in growing markets that demand high-reliability products. We laid out a four-stage plan to reach that goal and I am pleased that these efforts have contributed to impressive Q1 results. We delivered almost 8% year-over-year revenue growth despite divestments of non-core businesses in 2020 and 2021. When we exclude the revenue from these divested businesses, organic revenue grew nearly 17%. Our Healthcare business continues to deliver exceptional growth, posting a 39% year-over-year increase, with strength in both dental and medical applications. Industrial sales continue to stabilize as global economies gradually open up from the pandemic. We believe the exciting growth our company is now delivering is the result of two factors. One is the ongoing opportunity for additive manufacturing to enhance the design and manufacturing processes of our customers, and the second is our ability to leverage our exceptional technology portfolio, solutions strategy, and intense focus on execution.
In conjunction with our topline growth, we have also maintained a tight focus on our cost structure, generating gross margins of 44%, an almost two-point improvement year-over-year, and double-digit adjusted-EBITDA margins. This combination of strong top line growth, profitability, and cash generation distinguishes us in our industry. We attribute this performance to the breadth of our technology portfolio, which includes industrial metal and polymer systems, leading edge software solutions, and a rapidly increasing range of materials for both human and industrial application. This technology base, brought to an intense focus through high value customer applications, creates an exciting environment for sustained value creation for all our stakeholders.”
Dr. Graves continued, “With our solid progress on the initial stages of our transformation plan, we have now increased our focus on the fourth stage of our plan, which is to invest for accelerated growth and profitability in support of our long-term financial goals of sustained double-digit revenue growth, 50% gross profit margins and 20% adjusted-EBITDA margins. Our recently announced acquisitions of Allevi, a developer of bioprinting solutions, comprising bioprinters, biomaterials, and specialized laboratory software, and Additive Works, a software company focused on optimization and automation of AM print setup and workflow generation, are key steps to reaching our long term goals. In addition to these two exciting acquisitions, last week we announced an investment to expand our operations in Colorado, which will allow us to meet the increasing demand for our industry-leading Healthcare solutions that target patient-specific applications, while also expanding our industrial application development capabilities, spearheaded by our Application Innovation Group, adding expertise and technology to address new, more complex industrial applications.”
Dr. Graves summarized, “I’m very proud of our teams’ performance in the first quarter of the year and am excited about our trajectory and the long-term potential of our company. More than ever, I believe that additive manufacturing will play a key role in transforming the way components can be designed and manufactured for critical applications ranging from complex aerospace systems, to electric vehicles, to even the human body. Our strong financial performance and balance sheet, combined with industry leading technology and application expertise, will allow us to lead that transformation.”
Summary of First Quarter Results
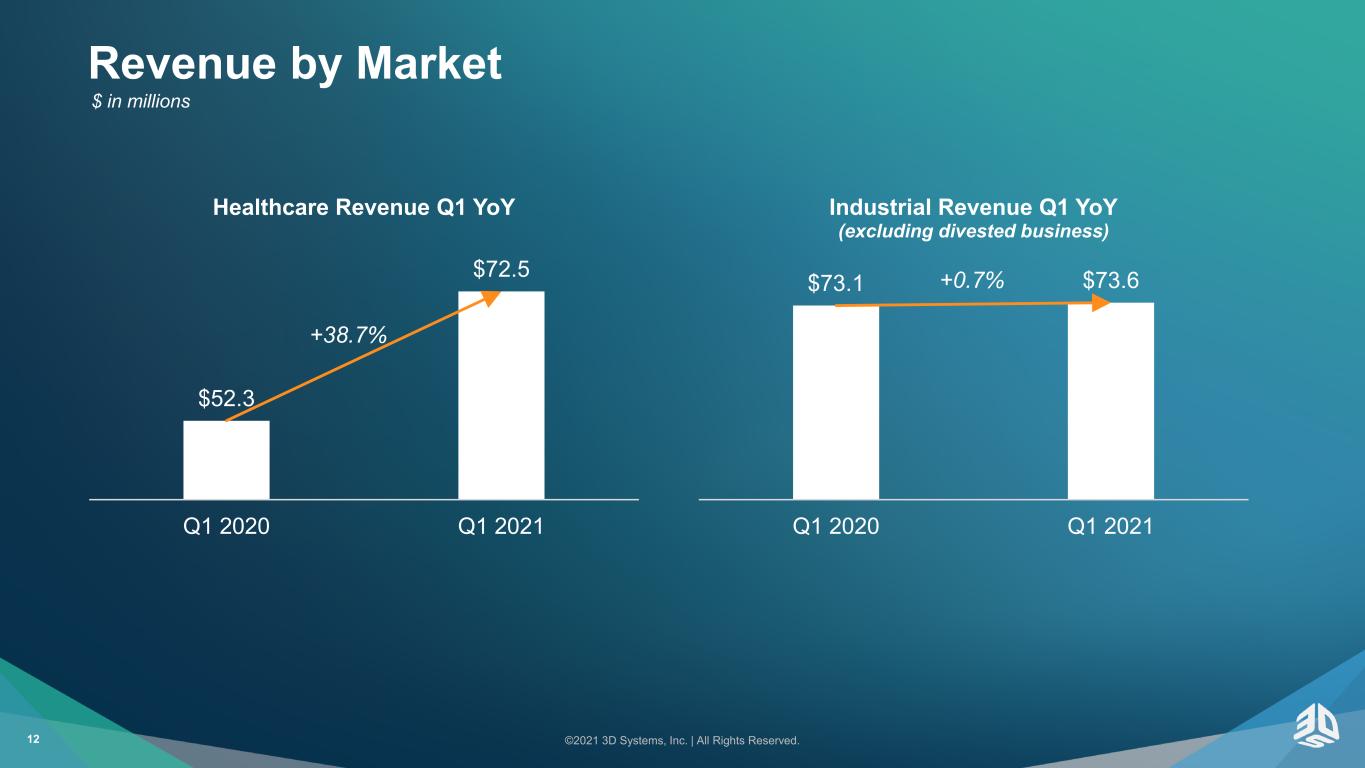
Revenue for the first quarter of 2021 increased 7.7% compared to the same period last year, and excluding businesses divested in 2020 and 2021, increased 16.6%. The results reflect strong performance in Healthcare and a continued stabilization of Industrial as economies around the world reopen from pandemic-related shutdowns. Revenue from Healthcare increased 38.7% to $72.5 million, compared to the same period last year, driven by strong sales in both dental applications and medical
applications. Industrial sales decreased 11.7% to $73.6 million, compared to the same period last year; excluding businesses divested in 2020 and 2021, Industrial sales increased 0.7%.
Gross profit margin in the first quarter of 2021 was 44.0% compared to 42.1% in the same period last year. Non-GAAP gross profit margin was 44.0% compared to 42.7% in the same period last year.
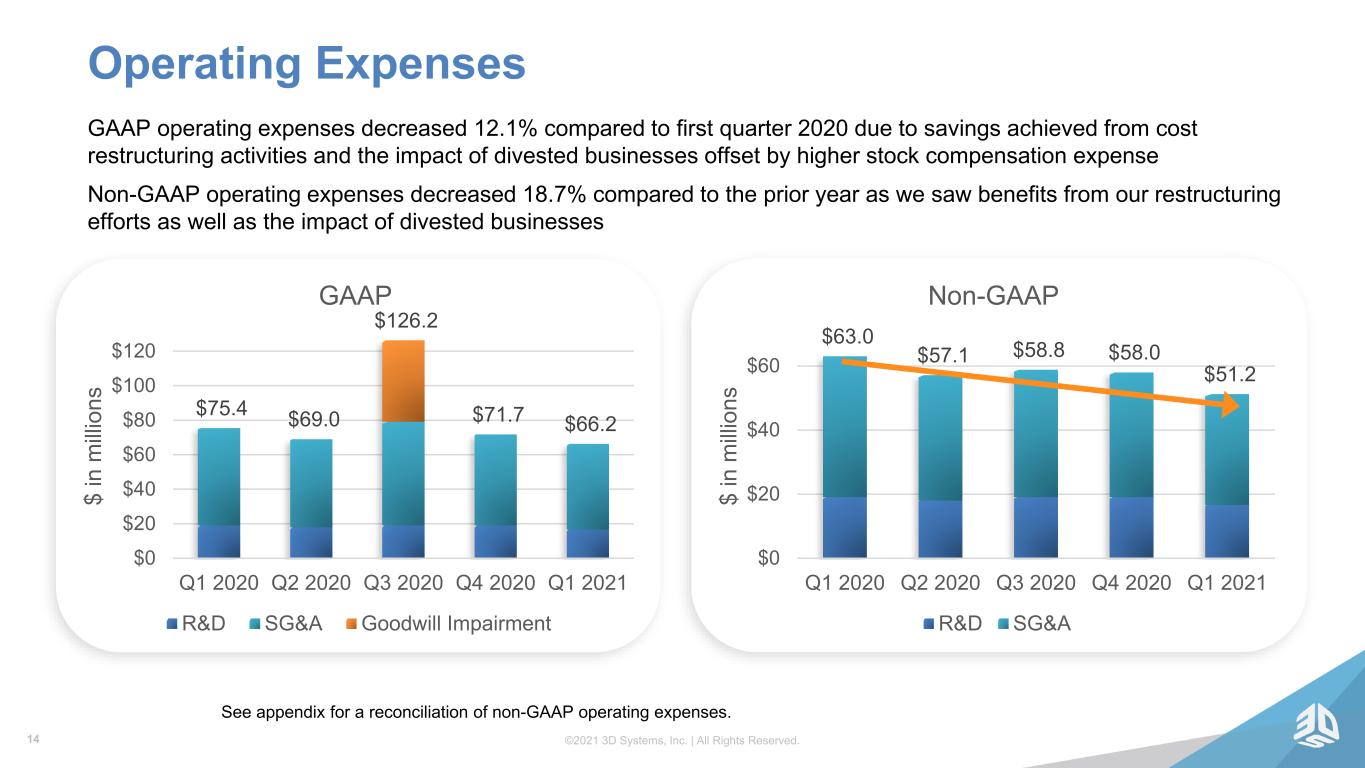
Operating expenses decreased 12.1% to $66.2 million in the first quarter of 2021, compared to the same period a year ago. On a non-GAAP basis, operating expenses were $51.2 million, an 18.7% decrease from the first quarter of the prior year. The lower non-GAAP operating expenses reflect savings achieved from cost restructuring activities.
Financial Liquidity
At March 31, 2021, the company had cash on hand of $133.0 million including restricted cash, no debt and a $100 million unused revolving credit facility with approximately $92.0 million of availability based on the terms of the agreement. Cash on hand has increased $48.2 million since December 31, 2020, driven primarily by net proceeds from divestitures of $54.7 million and cash generated from operations of $28.5 million, offset by a debt repayment of $21.4 million and other financing and investing uses of cash.
Q1 2021 Conference Call and Webcast
3D Systems expects to file its Quarterly Report on Form 10-Q for the quarter ended March 31, 2021 with the Securities and Exchange Commission today, May 10, 2021. The company will host a conference call and simultaneous webcast to discuss these results tomorrow morning, which may be accessed as follows:
Date: Tuesday, May 11, 2021
Time: 8:30 a.m. Eastern Time
Listen via webcast: www.3dsystems.com/investor
Participate via telephone: 201-689-8345
A replay of the webcast will be available approximately two hours after the live presentation at www.3dsystems.com/investor.
Forward-Looking Statements
Certain statements made in this release that are not statements of historical or current facts are forward-looking statements within the meaning of the Private Securities Litigation Reform Act of 1995. Forward-looking statements involve known and unknown risks, uncertainties and other factors that may cause the actual results, performance or achievements of the company to be materially different from historical results or from any future results or projections expressed or implied by such forward-looking statements. In many cases, forward looking statements can be identified by terms such as “believes,” “belief,” “expects,” “may,” “will,” “estimates,” “intends,” “anticipates” or “plans” or the negative of these terms or other comparable terminology. Forward-looking statements are based upon management’s beliefs, assumptions and current expectations and may include comments as to the company’s beliefs and expectations as to future events and trends affecting its business and are necessarily subject to uncertainties, many of which are outside the control of the company. The factors described under the headings “Forward-Looking Statements” and “Risk Factors” in the company’s periodic filings with the Securities and Exchange Commission, as well as other factors, could cause actual results to differ materially from those reflected or predicted in forward-looking statements. Although management believes that the expectations reflected in the forward-looking statements are reasonable, forward-looking statements are not, and should not be relied upon as a guarantee of future performance or results, nor
will they necessarily prove to be accurate indications of the times at which such performance or results will be achieved. The forward-looking statements included are made only as the date of the statement. 3D Systems undertakes no obligation to update or revise any forward-looking statements made by management or on its behalf, whether as a result of future developments, subsequent events or circumstances or otherwise.
Presentation of Information in this Press Release
3D Systems reports is financial results in accordance with GAAP. To facilitate a better understanding of the impact that strategic acquisitions, non-recurring charges and certain non-cash expenses had on its financial results, management reviews certain non-GAAP measures, including non-GAAP Operating Income, non-GAAP Net Income (Loss), non-GAAP Basic and Diluted Income (Loss) per Share, non-GAAP Gross Profit, non-GAAP Gross Profit Margin, non-GAAP SG&A Expenses and non-GAAP Operating Expenses, each of which exclude the impact of amortization of intangibles, acquisition and severance expenses, stock-based compensation expense, litigation settlements and charges related to strategic decisions and portfolio realignment, and Adjusted EBITDA, defined as non-GAAP Operating Income plus depreciation, and Adjusted EBITDA Margins to better evaluate period-over-period performance. A reconciliation of GAAP to non-GAAP results is provided in the accompanying schedule.
3D Systems does not provide forward-looking guidance on a GAAP basis. The company is unable to provide a quantitative reconciliation of these forward-looking non-GAAP measures to the most directly comparable forward-looking GAAP measures without unreasonable effort because 3D Systems cannot reliably forecast legal, acquisition and divestiture expenses, restructuring expenses, product end of life adjustments and goodwill impairment, which are difficult to predict and estimate. These items are inherently uncertain and depend on various factors, many of which are beyond the company’s control, and as such, any associated estimate and its impact on GAAP performance could vary materially.
About 3D Systems
More than 30 years ago, 3D Systems brought the innovation of 3D printing to the manufacturing industry. Today, as the leading Additive Manufacturing solutions partner, we bring innovation, performance, and reliability to every interaction - empowering our customers to create products and business models never before possible. Thanks to our unique offering of hardware, software, materials and services, each application-specific solution is powered by the expertise of our application engineers who collaborate with customers to transform how they deliver their products and services. 3D Systems’ solutions address a variety of advanced applications in Healthcare and Industrial markets such as Medical and Dental, Aerospace & Defense, Automotive and Durable Goods. More information on the company is available at www.3dsystems.com
Tables Follow
3D Systems Corporation
Unaudited Condensed Consolidated Balance Sheets
March 31, 2021 and December 31, 2020
| (In thousands, except par value) | March 31, 2021 (unaudited) | December 31, 2020 | |||||||||
| ASSETS | |||||||||||
| Current assets: | |||||||||||
| Cash and cash equivalents | $ | 132,440 | $ | 75,010 | |||||||
| Accounts receivable, net of reserves — $4,106 and $4,392 | 98,117 | 114,254 | |||||||||
| Inventories | 110,377 | 116,667 | |||||||||
| Prepaid expenses and other current assets | 34,821 | 33,145 | |||||||||
| Current assets held for sale | — | 18,439 | |||||||||
| Total current assets | 375,755 | 357,515 | |||||||||
| Property and equipment, net | 71,467 | 75,356 | |||||||||
| Intangible assets, net | 24,896 | 28,083 | |||||||||
| Goodwill | 156,113 | 161,765 | |||||||||
| Right of use assets | 50,748 | 48,620 | |||||||||
| Deferred income tax asset | 4,865 | 6,247 | |||||||||
| Assets held for sale | — | 31,684 | |||||||||
| Other assets | 21,663 | 23,785 | |||||||||
| Total assets | $ | 705,507 | $ | 733,055 | |||||||
| LIABILITIES AND EQUITY | |||||||||||
| Current liabilities: | |||||||||||
| Current portion of long-term debt | $ | — | $ | 2,051 | |||||||
| Current right of use liabilities | 9,238 | 9,534 | |||||||||
| Accounts payable | 44,945 | 45,174 | |||||||||
| Accrued and other liabilities | 61,230 | 69,812 | |||||||||
| Customer deposits | 6,973 | 7,750 | |||||||||
| Deferred revenue | 32,006 | 30,302 | |||||||||
| Current liabilities held for sale | — | 11,107 | |||||||||
| Total current liabilities | 154,392 | 175,730 | |||||||||
| Long-term debt, net of deferred financing costs | — | 19,218 | |||||||||
| Long-term right of use liabilities | 51,099 | 48,469 | |||||||||
| Deferred income tax liability | 3,331 | 4,716 | |||||||||
| Liabilities held for sale | — | 2,952 | |||||||||
| Other liabilities | 34,552 | 51,247 | |||||||||
| Total liabilities | 243,374 | 302,332 | |||||||||
| Commitments and contingencies (Note 14) | |||||||||||
| Stockholders’ equity: | |||||||||||
| Common stock, $0.001 par value, authorized 220,000 shares; issued 126,523 and 127,626 | 126 | 128 | |||||||||
| Additional paid-in capital | 1,397,276 | 1,404,964 | |||||||||
| Treasury stock, at cost — 1,623 shares and 3,494 shares | (10,492) | (22,590) | |||||||||
| Accumulated deficit | (898,075) | (943,303) | |||||||||
| Accumulated other comprehensive loss | (26,702) | (8,476) | |||||||||
| Total stockholders’ equity | 462,133 | 430,723 | |||||||||
| Total liabilities and stockholders’ equity | $ | 705,507 | $ | 733,055 | |||||||
3D Systems Corporation
Unaudited Condensed Consolidated Statements of Operations
Quarter Ended March 31, 2021 and 2020
| Quarter Ended March 31, | |||||||||||
| (in thousands, except per share amounts) | 2021 | 2020 | |||||||||
| Revenue: | |||||||||||
| Products | $ | 93,648 | $ | 79,739 | |||||||
| Services | 52,468 | 55,896 | |||||||||
| Total revenue | 146,116 | 135,635 | |||||||||
| Cost of sales: | |||||||||||
| Products | 53,364 | 48,453 | |||||||||
| Services | 28,512 | 30,050 | |||||||||
| Total cost of sales | 81,876 | 78,503 | |||||||||
| Gross profit | 64,240 | 57,132 | |||||||||
| Operating expenses: | |||||||||||
| Selling, general and administrative | 49,600 | 56,106 | |||||||||
| Research and development | 16,599 | 19,244 | |||||||||
| Total operating expenses | 66,199 | 75,350 | |||||||||
| Loss from operations | (1,959) | (18,218) | |||||||||
| Interest and other income (expense), net | 38,853 | (2,564) | |||||||||
| Income (loss) before income taxes | 36,894 | (20,782) | |||||||||
| Benefit for income taxes | 8,334 | 1,858 | |||||||||
| Net income (loss) | $ | 45,228 | $ | (18,924) | |||||||
| Net income (loss) per common share: | |||||||||||
| Basic | $ | 0.37 | $ | (0.17) | |||||||
| Diluted | $ | 0.36 | $ | (0.17) | |||||||
| Weighted average shares outstanding: | |||||||||||
| Basic | 121,705 | 114,590 | |||||||||
| Diluted | 125,070 | 114,590 | |||||||||
3D Systems Corporation
Unaudited Condensed Consolidated Statements of Cash Flows
Quarter Ended March 31, 2021 and 2020
| Quarter Ended March 31, | |||||||||||
| (in thousands) | 2021 | 2020 | |||||||||
| Cash flows from operating activities: | |||||||||||
| Net income (loss) | $ | 45,228 | $ | (18,924) | |||||||
| Adjustments to reconcile net income (loss) to net cash provided by (used in) operating activities: | |||||||||||
| Depreciation and amortization | 9,102 | 11,690 | |||||||||
| Stock-based compensation | 11,050 | 6,312 | |||||||||
| Loss on hedge termination | 721 | — | |||||||||
| Provision for bad debts | (142) | 817 | |||||||||
| (Gain) loss on the disposition of businesses, property, equipment and other assets | (39,401) | 137 | |||||||||
| Provision for deferred income taxes and reserve adjustments | (8,889) | (106) | |||||||||
| Impairment of goodwill and assets | — | 1,100 | |||||||||
| Changes in operating accounts: | |||||||||||
| Accounts receivable | 15,941 | 1,568 | |||||||||
| Inventories | 2,699 | (2,694) | |||||||||
| Prepaid expenses and other current assets | (2,303) | (14,298) | |||||||||
| Accounts payable | 1,665 | 6,616 | |||||||||
| Deferred revenue and customer deposits | 1,552 | 10,242 | |||||||||
| Accrued and other liabilities | (17,491) | (5,741) | |||||||||
| All other operating activities | 8,721 | 996 | |||||||||
| Net cash provided by (used in) operating activities | 28,453 | (2,285) | |||||||||
| Cash flows from investing activities: | |||||||||||
| Purchases of property and equipment | (3,878) | (4,366) | |||||||||
| Proceeds from sale of assets and businesses, net of cash | 54,747 | 552 | |||||||||
| Purchase of noncontrolling interest | (4,000) | (12,500) | |||||||||
| Other investing activities | (306) | (284) | |||||||||
| Net cash provided by (used in) investing activities | 46,563 | (16,598) | |||||||||
| Cash flows from financing activities: | |||||||||||
| Repayment of borrowings/long-term debt | (21,392) | (627) | |||||||||
| Proceeds from inventory financing agreements | — | 2,509 | |||||||||
| Payments related to net-share settlement of stock-based compensation | (2,749) | (949) | |||||||||
| Other financing activities | (196) | 296 | |||||||||
| Net cash (used in) provided by financing activities | (24,337) | 1,229 | |||||||||
| Effect of exchange rate changes on cash, cash equivalents and restricted cash | (2,434) | (3,241) | |||||||||
| Net increase (decrease) in cash, cash equivalents and restricted cash | 48,245 | (20,895) | |||||||||
Cash, cash equivalents and restricted cash at the beginning of the period (a) | 84,711 | 134,617 | |||||||||
Cash, cash equivalents and restricted cash at the end of the period (a) | $ | 132,956 | $ | 113,722 | |||||||
(a)The amounts for cash and cash equivalents shown above include restricted cash of $516 and $946 as of March 31, 2021 and 2020, respectively, and $540 and $952 as of December 31, 2020, and 2019, respectively, which were included in Other assets, net, and $9,161 as of December 31, 2020, which was included in Current assets held for sale in the condensed consolidated balance sheets.
3D Systems Corporation
Loss Per Share
Quarter Ended March 31, 2021 and 2020
| Quarter Ended March 31, | |||||||||||
| (in thousands, except per share amounts) | 2021 | 2020 | |||||||||
| Numerator: | |||||||||||
| Net income (loss) | $ | 45,228 | $ | (18,924) | |||||||
| Denominator: | |||||||||||
| Weighted average shares - basic | 121,705 | 114,590 | |||||||||
| Dilutive securities | 3,365 | — | |||||||||
| Weighted average shares - diluted | 125,070 | 114,590 | |||||||||
| Net income (loss) per share - basic | $ | 0.37 | $ | (0.17) | |||||||
| Net income (loss) per share - diluted | $ | 0.36 | $ | (0.17) | |||||||
Appendix
3D Systems Corporation
Unaudited Reconciliations of GAAP to Non-GAAP Measures
Quarter Ended March 31, 2021 and 2020
| Quarter Ended March 31, | |||||||||||
| (in millions) | 2021 | 2020 | |||||||||
| GAAP Revenue - as reported | $ | 146.1 | $ | 135.6 | |||||||
| Non-GAAP Revenue | 146.1 | 135.6 | |||||||||
| GAAP Cost of sales - as reported | 81.9 | 78.5 | |||||||||
| Amortization, stock-based compensation & other | 0.1 | 0.1 | |||||||||
| Legal, acquisition and divestiture related | — | 0.1 | |||||||||
| Cost optimization plan, including severance costs | — | 0.7 | |||||||||
| Non-GAAP Cost of sales | 81.9 | 77.7 | |||||||||
| GAAP Gross Profit - as reported | 64.2 | 57.1 | |||||||||
| Amortization, stock-based compensation & other | 0.1 | 0.1 | |||||||||
| Legal, acquisition and divestiture related | — | 0.1 | |||||||||
| Cost optimization plan, including severance costs | — | 0.7 | |||||||||
| Non-GAAP Gross Profit | 64.3 | 58.0 | |||||||||
| GAAP Gross Profit Margin | 44.0 | % | 42.1 | % | |||||||
| Non-GAAP Gross Profit Margin | 44.0 | % | 42.7 | % | |||||||
| GAAP Selling, general and administrative - as reported | 49.6 | 56.1 | |||||||||
| Amortization, stock-based compensation & other | 13.3 | 10.6 | |||||||||
| Legal, acquisition and divestiture related | 0.5 | 0.2 | |||||||||
| Cost optimization plan, including severance costs | 1.0 | 1.5 | |||||||||
| Non-GAAP Selling, general and administrative | 34.6 | 43.9 | |||||||||
| GAAP Research and development - as reported | 16.6 | 19.2 | |||||||||
| Cost optimization plan, including severance costs | — | 0.1 | |||||||||
| Non-GAAP Research and development | 16.6 | 19.1 | |||||||||
| GAAP Operating Expenses - as reported | 66.2 | 75.3 | |||||||||
| Amortization, stock-based compensation & other | 13.3 | 10.6 | |||||||||
| Legal, acquisition and divestiture related | 0.5 | 0.2 | |||||||||
| Cost optimization plan, including severance costs | 1.0 | 1.6 | |||||||||
| Non-GAAP Operating expenses | 51.2 | 63.0 | |||||||||
| GAAP Operating Income (loss) - as reported | (2.0) | (18.2) | |||||||||
| Amortization, stock-based compensation & other | 13.4 | 10.7 | |||||||||
| Legal, acquisition and divestiture related | 0.5 | 0.2 | |||||||||
| Cost optimization plan, including severance costs | 1.0 | 2.3 | |||||||||
| Non-GAAP Operating Income (loss) | 13.1 | (5.0) | |||||||||
| Depreciation | 6.7 | 7.3 | |||||||||
| Adjusted EBITDA | 19.8 | 2.2 | |||||||||
| GAAP Other Income and expense, net - as reported | 38.9 | (2.6) | |||||||||
| Legal, acquisition and divestiture related | (39.4) | 0.1 | |||||||||
| Impairment of cost-method investments | — | 1.1 | |||||||||
| Non-GAAP Other Income and expense, net | (0.5) | (1.3) | |||||||||
| GAAP Net Income (loss) - as reported | 45.2 | (18.9) | |||||||||
| Amortization, stock-based compensation & other | 13.4 | 10.7 | |||||||||
| Legal, acquisition and divestiture related | (38.9) | 0.4 | |||||||||
| Cost optimization plan, including severance costs | 1.0 | 2.3 | |||||||||
| Impairment of cost-method investments | — | 1.1 | |||||||||
| Non-GAAP Net Income (loss) | $ | 20.9 | $ | (4.5) | |||||||
3D Systems Corporation
Unaudited Reconciliations of GAAP to Non-GAAP Measures
Quarter Ended March 31, 2021 and 2020
| Quarter Ended March 31, | |||||||||||
| 2021 | 2020 | ||||||||||
GAAP Net income (loss) per share - basic | $ | 0.37 | $ | (0.17) | |||||||
| GAAP Net income (loss) per share - diluted | 0.36 | (0.17) | |||||||||
| Adjustments: | |||||||||||
Amortization, stock-based compensation & other | 0.11 | 0.09 | |||||||||
Legal, acquisition and divestiture related | (0.31) | — | |||||||||
Cost optimization plan, including severance costs | 0.01 | 0.02 | |||||||||
Impairment of cost-method investments | — | 0.01 | |||||||||
Non-GAAP Net income (loss) per share - basic | $ | 0.17 | $ | (0.04) | |||||||
| Non-GAAP Net income (loss) per share - diluted | $ | 0.17 | $ | (0.04) | |||||||
•Amounts in table may not foot due to rounding
©2021 3D Systems, Inc. | All Rights Reserved. First Quarter 2021 Financial Results May 11, 2021 EXHIBIT 99.2

©2021 3D Systems, Inc. | All Rights Reserved.2 Welcome and Participants Dr. Jeffrey Graves President and Chief Executive Officer Jagtar Narula Executive VP and Chief Financial Officer Andrew Johnson Executive VP and Chief Legal Officer John Nypaver, Jr. VP, Treasurer and Investor Relations To participate via phone, please dial: 1-201-689-8345
©2021 3D Systems, Inc. | All Rights Reserved. Certain statements made in this presentation that are not statements of historical or current facts are forward-looking statements within the meaning of the Private Securities Litigation Reform Act of 1995. Forward-looking statements include statements concerning plans, objectives, goals, strategies, expectations, intentions, projections, developments, future events, performance or products, underlying assumptions, and other statements which are other than statements of historical facts. In some cases, you can identify forward-looking statements by terms such as “believes,” “beliefs,” ''may,'' ''will,'' ''should,'' expects,'' ''intends,'' ''plans,'' ''anticipates,'' ''estimates,'' ''predicts,'' ''projects,'' ''potential,'' ''continue,'' and other similar terminology or the negative of these terms. From time to time, we may publish or otherwise make available forward-looking statements of this nature. All such forward-looking statements, whether written or oral, and whether made by us or on our behalf, are expressly qualified by the cautionary statements described in this message including those set forth below. Forward-looking statements are based upon management’s beliefs, assumptions and current expectations concerning future events and trends, using information currently available, and are necessarily subject to uncertainties, many of which are outside our control. In addition, we undertake no obligation to update or revise any forward-looking statements made by us or on our behalf, whether as a result of future developments, subsequent events or circumstances, or otherwise, or to reflect the occurrence or likelihood of unanticipated events, and we disclaim any such obligation. Forward-looking statements are only predictions that relate to future events or our future performance and are subject to known and unknown risks, uncertainties, assumptions, and other factors, many of which are beyond our control, that may cause actual results, outcomes, levels of activity, performance, developments, or achievements to be materially different from any future results, outcomes, levels of activity, performance, developments, or achievements expressed, anticipated, or implied by these forward-looking statements. Although we believe that the expectations reflected in the forward-looking statements are reasonable, forward-looking statements are not, and should not be relied upon as a guarantee of future performance or results, nor will they necessarily prove to be accurate indications of the times at or by which any such performance or results will be achieved. 3D Systems' actual results could differ materially from those stated or implied in forward- looking statements. Past performance is not necessarily indicative of future results. We do not undertake any obligation to and do not intend to update any forward-looking statements whether as a result of future developments, subsequent events or circumstances or otherwise. Further, we encourage you to review “Risk Factors” in Part 1 of our Annual Report on Form 10-K and Part II of our Quarterly Reports on Form 10-Q filed with the SEC as well as other information about us in our filings with the SEC. These are available at www.SEC.gov. 3 Forward Looking Statements
©2021 3D Systems, Inc. | All Rights Reserved. Dr. Jeffrey Graves President & Chief Executive Officer 4
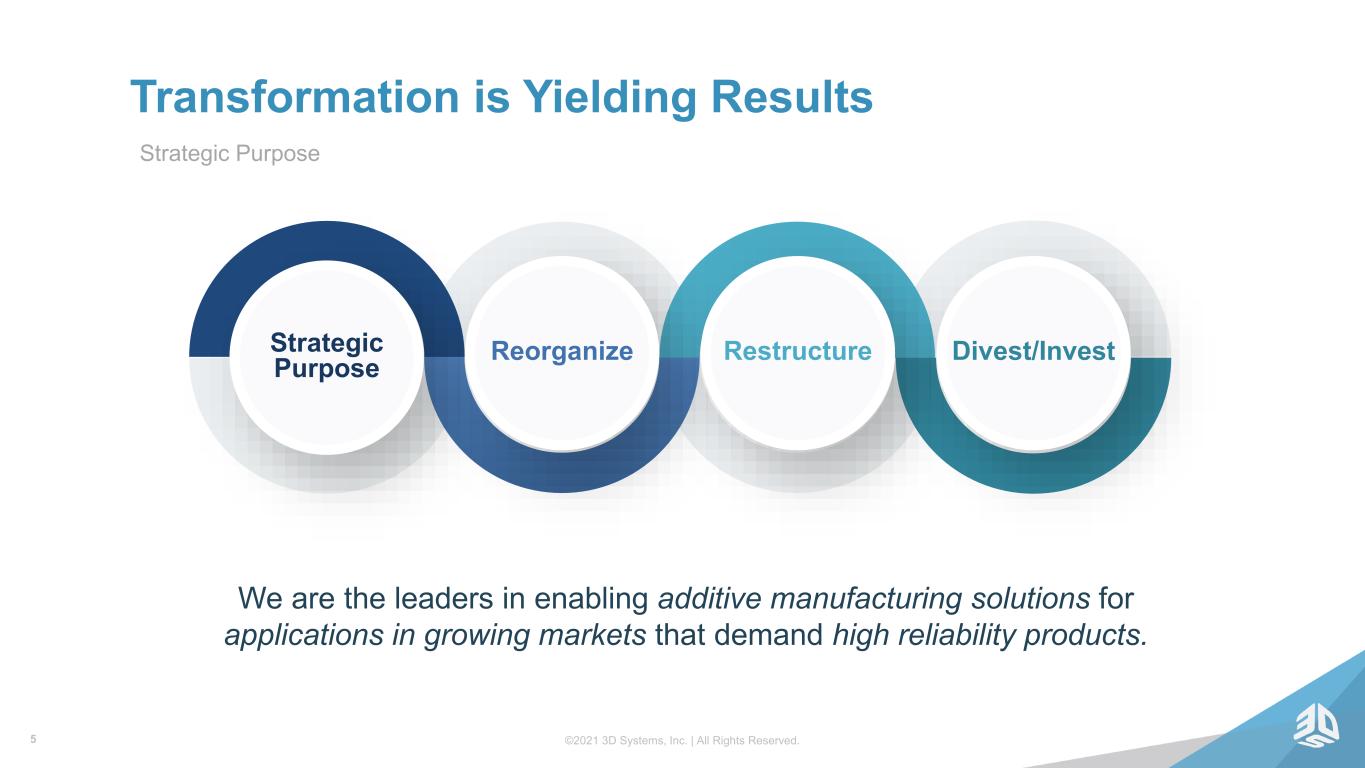
©2021 3D Systems, Inc. | All Rights Reserved.5 Transformation is Yielding Results Strategic Purpose Strategic Purpose Reorganize Restructure Divest/Invest We are the leaders in enabling additive manufacturing solutions for applications in growing markets that demand high reliability products.
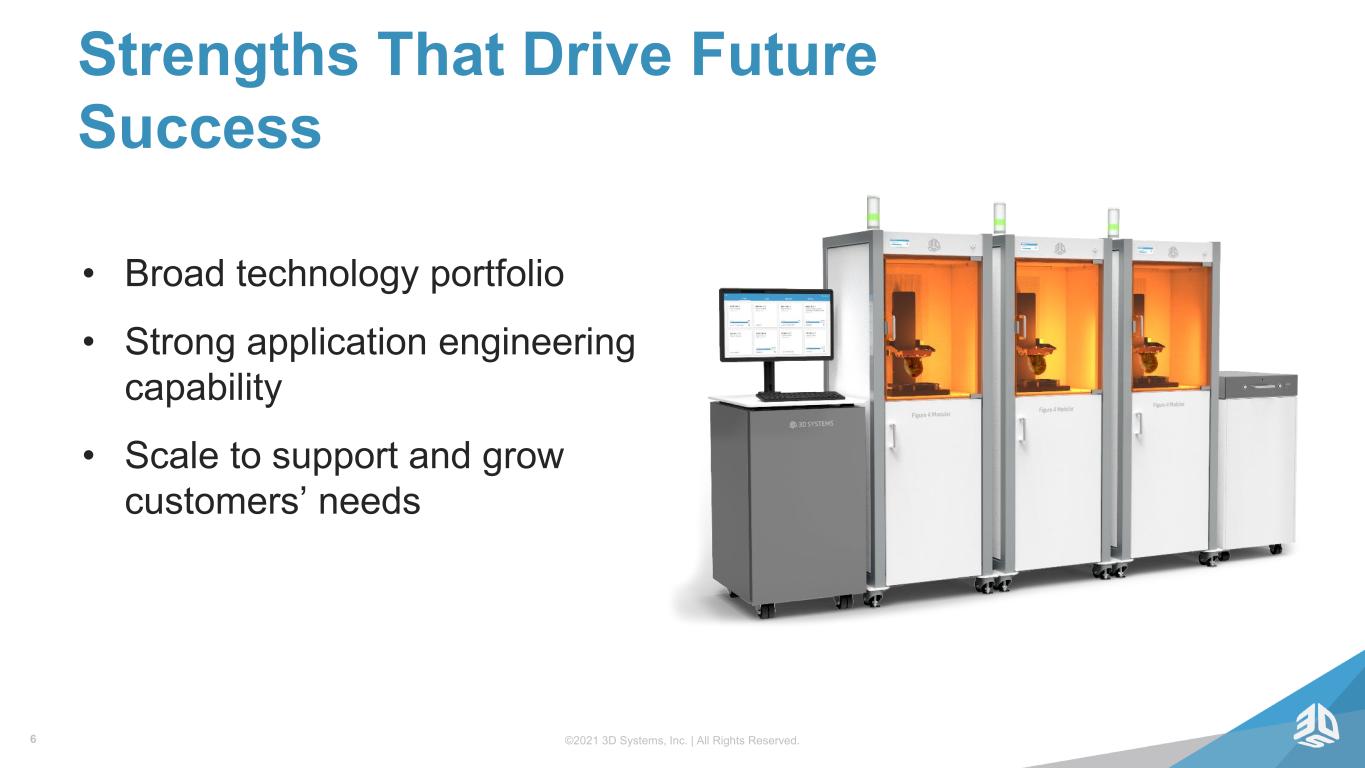
©2021 3D Systems, Inc. | All Rights Reserved.6 Strengths That Drive Future Success • Broad technology portfolio • Strong application engineering capability • Scale to support and grow customers’ needs
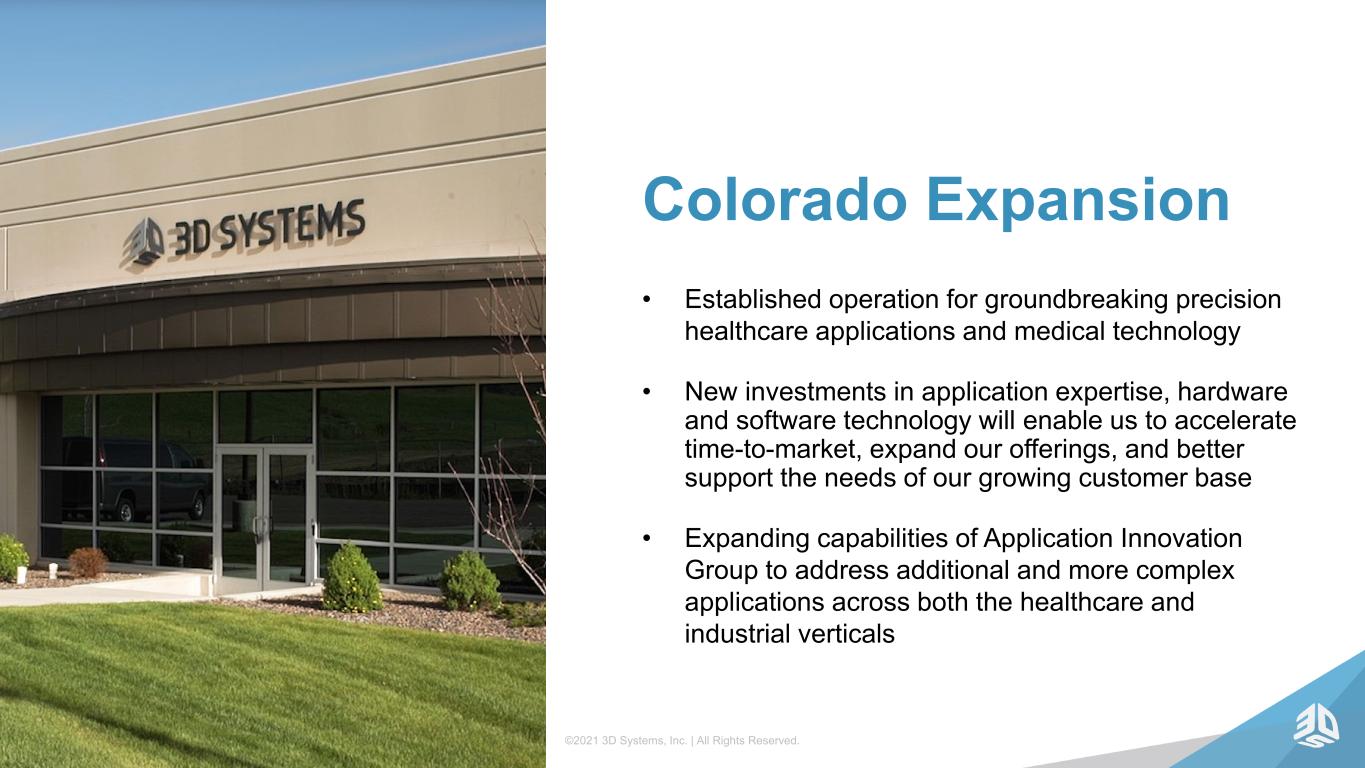
©2021 3D Systems, Inc. | All Rights Reserved.7 Colorado Expansion • Established operation for groundbreaking precision healthcare applications and medical technology • New investments in application expertise, hardware and software technology will enable us to accelerate time-to-market, expand our offerings, and better support the needs of our growing customer base • Expanding capabilities of Application Innovation Group to address additional and more complex applications across both the healthcare and industrial verticals
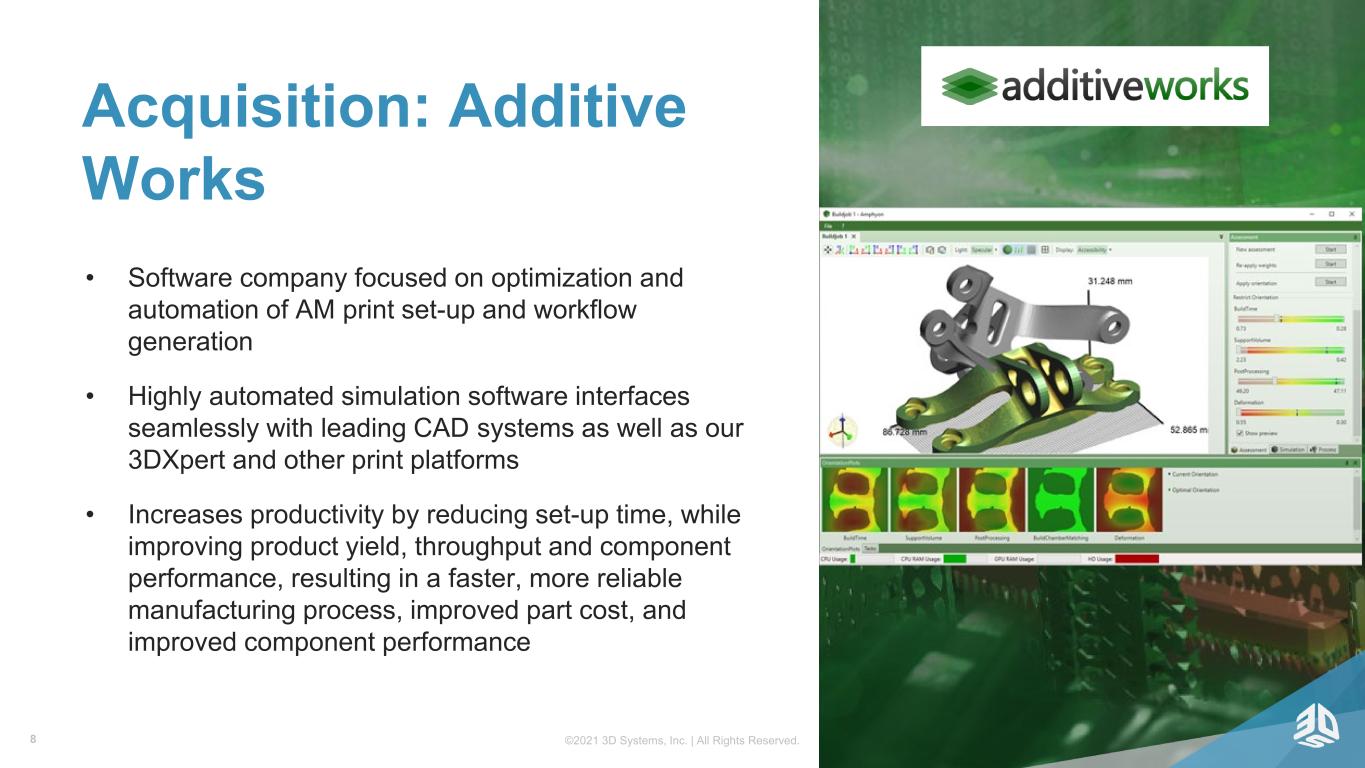
©2021 3D Systems, Inc. | All Rights Reserved.8 Acquisition: Additive Works • Software company focused on optimization and automation of AM print set-up and workflow generation • Highly automated simulation software interfaces seamlessly with leading CAD systems as well as our 3DXpert and other print platforms • Increases productivity by reducing set-up time, while improving product yield, throughput and component performance, resulting in a faster, more reliable manufacturing process, improved part cost, and improved component performance
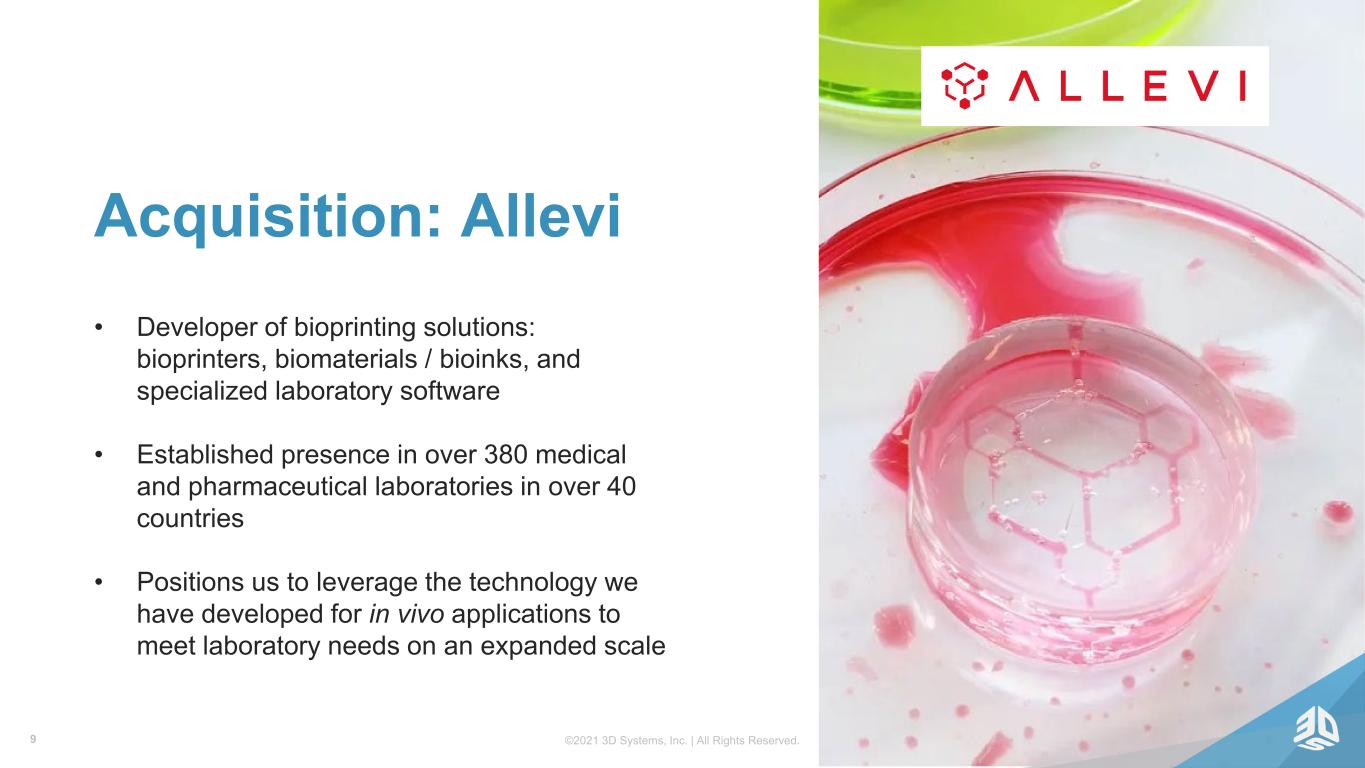
©2021 3D Systems, Inc. | All Rights Reserved.9 Acquisition: Allevi • Developer of bioprinting solutions: bioprinters, biomaterials / bioinks, and specialized laboratory software • Established presence in over 380 medical and pharmaceutical laboratories in over 40 countries • Positions us to leverage the technology we have developed for in vivo applications to meet laboratory needs on an expanded scale

©2021 3D Systems, Inc. | All Rights Reserved. Jagtar Narula Chief Financial Officer 10
©2021 3D Systems, Inc. | All Rights Reserved.11 Q1 Summary QUARTER ENDED MARCH 31, 2021 2020 (IN MILLIONS, EXCEPT PER SHARE AMOUNTS) REVENUE $ 146.1 $ 135.6 OPERATING LOSS $ (2.0) $ (18.2) NET INCOME (LOSS) $ 45.2 $ (18.9) INCOME (LOSS) PER SHARE - DILUTED $ 0.36 $ (0.17) NON-GAAP OPERATING INCOME (LOSS) $ 13.1 $ (5.0) NON-GAAP NET INCOME (LOSS) $ 20.9 $ (4.5) NON-GAAP INCOME (LOSS) PER SHARE - DILUTED $ 0.17 $ (0.04) ADJUSTED EBITDA $ 19.8 $ 2.2 * See Appendix for reconciliation of GAAP and non-GAAP operating loss, net loss and net loss per share. HIGHLIGHTS Q1 Revenue increased 7.7% YoY; 16.6% excluding divested business Second consecutive quarter of YoY revenue growth $32.9M gain from divestiture of software business contributed to GAAP NI improvement
©2021 3D Systems, Inc. | All Rights Reserved.12 Revenue by Market $ in millions $73.1 $73.6 Q1 2020 Q1 2021 Industrial Revenue Q1 YoY (excluding divested business) +0.7% $52.3 $72.5 Q1 2020 Q1 2021 Healthcare Revenue Q1 YoY +38.7%
©2021 3D Systems, Inc. | All Rights Reserved.13 Gross Profit Margin • Year-over-Year improvement driven by higher sales volume, mix including software sales and the impact of our cost reduction activities • Grew margins despite divesting Cimatron software business See appendix for a reconciliation of non-GAAP gross profit. 43% 41% 43% 43% 44% 30% 35% 40% 45% 50% Q1:20 Q2:20 Q3:20 Q4:20 Q1:21 Non-GAAP GPM 42% 31% 43% 42% 44% 30% 35% 40% 45% 50% Q1:20 Q2:20 Q3:20 Q4:20 Q1:21 GAAP GPM Cimatron Divestiture
©2021 3D Systems, Inc. | All Rights Reserved.14 Operating Expenses $75.4 $69.0 $126.2 $71.7 $66.2 $0 $20 $40 $60 $80 $100 $120 Q1 2020 Q2 2020 Q3 2020 Q4 2020 Q1 2021 $ in m ill io ns GAAP R&D SG&A Goodwill Impairment $63.0 $57.1 $58.8 $58.0 $51.2 $0 $20 $40 $60 Q1 2020 Q2 2020 Q3 2020 Q4 2020 Q1 2021 $ in m ill io ns Non-GAAP R&D SG&A GAAP operating expenses decreased 12.1% compared to first quarter 2020 due to savings achieved from cost restructuring activities and the impact of divested businesses offset by higher stock compensation expense Non-GAAP operating expenses decreased 18.7% compared to the prior year as we saw benefits from our restructuring efforts as well as the impact of divested businesses See appendix for a reconciliation of non-GAAP operating expenses.
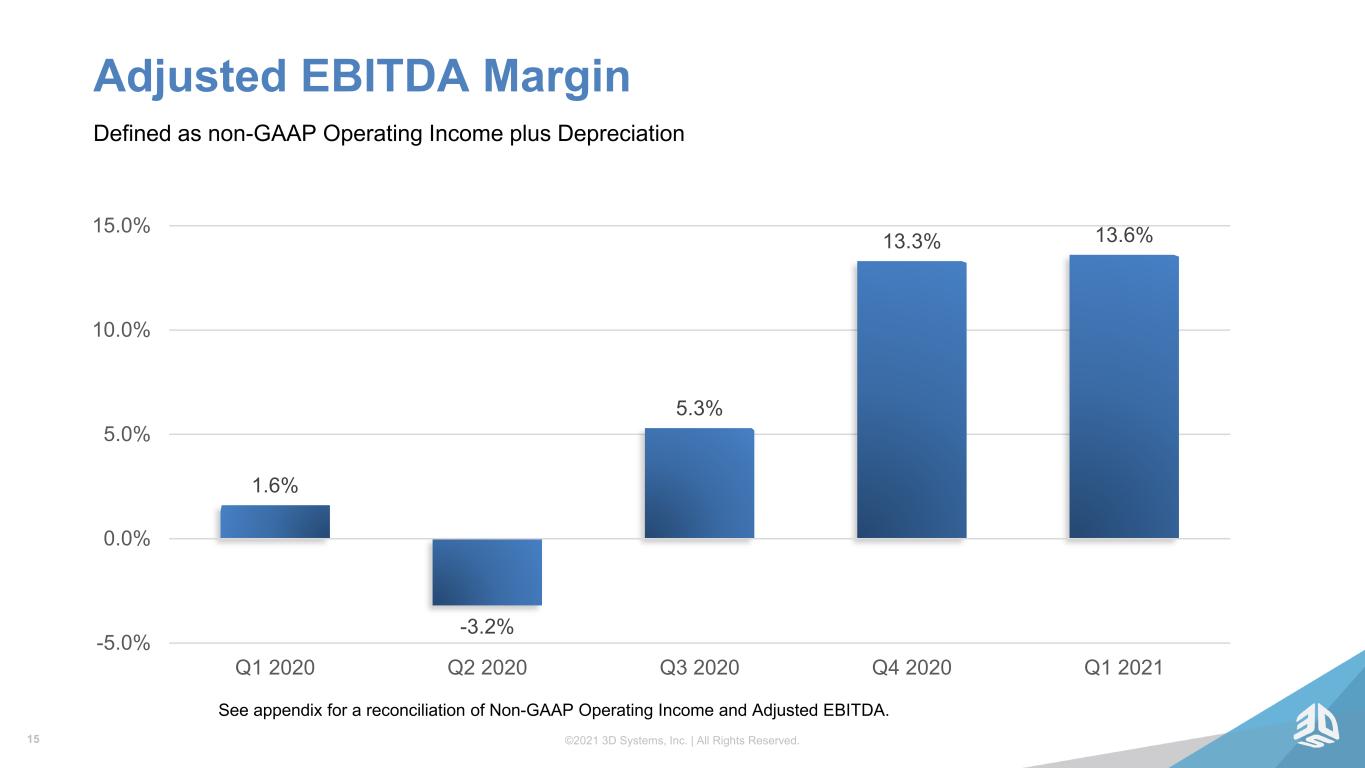
©2021 3D Systems, Inc. | All Rights Reserved.15 1.6% -3.2% 5.3% 13.3% 13.6% -5.0% 0.0% 5.0% 10.0% 15.0% Q1 2020 Q2 2020 Q3 2020 Q4 2020 Q1 2021 Adjusted EBITDA Margin Defined as non-GAAP Operating Income plus Depreciation See appendix for a reconciliation of Non-GAAP Operating Income and Adjusted EBITDA.
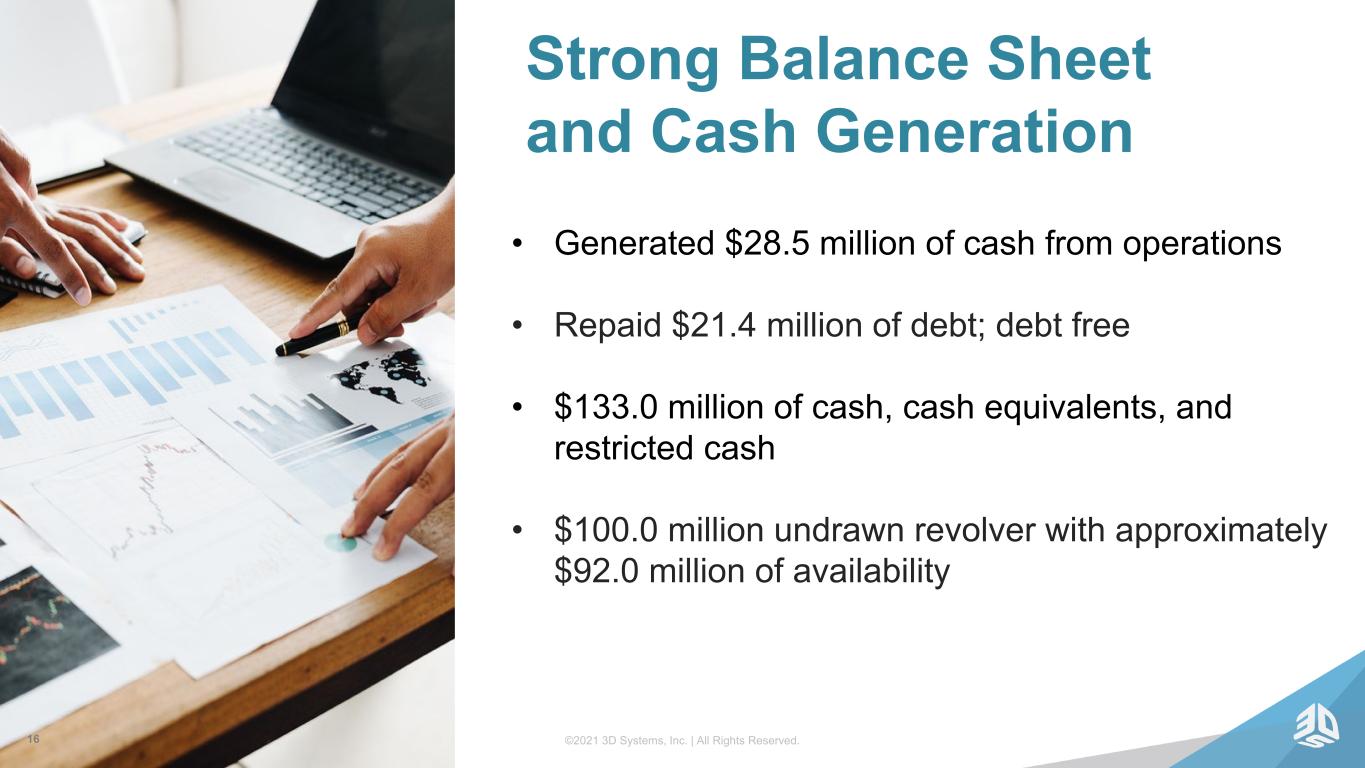
©2021 3D Systems, Inc. | All Rights Reserved.16 Strong Balance Sheet and Cash Generation • Generated $28.5 million of cash from operations • Repaid $21.4 million of debt; debt free • $133.0 million of cash, cash equivalents, and restricted cash • $100.0 million undrawn revolver with approximately $92.0 million of availability
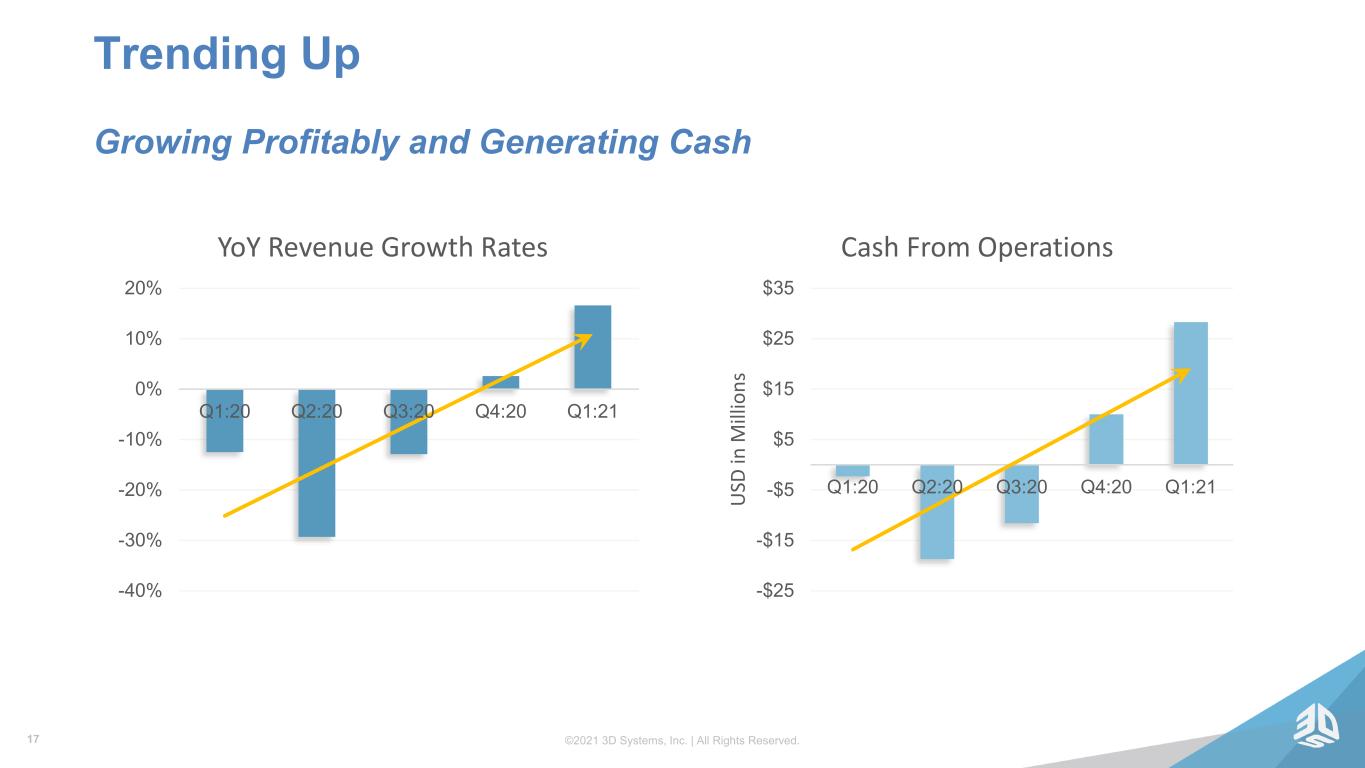
©2021 3D Systems, Inc. | All Rights Reserved.17 -40% -30% -20% -10% 0% 10% 20% Q1:20 Q2:20 Q3:20 Q4:20 Q1:21 YoY Revenue Growth Rates Trending Up Growing Profitably and Generating Cash -$25 -$15 -$5 $5 $15 $25 $35 Q1:20 Q2:20 Q3:20 Q4:20 Q1:21 U SD in M ill io ns Cash From Operations

©2021 3D Systems, Inc. | All Rights Reserved. INVESTOR DAY September 9, 2021 Denver, Colorado Details coming soon
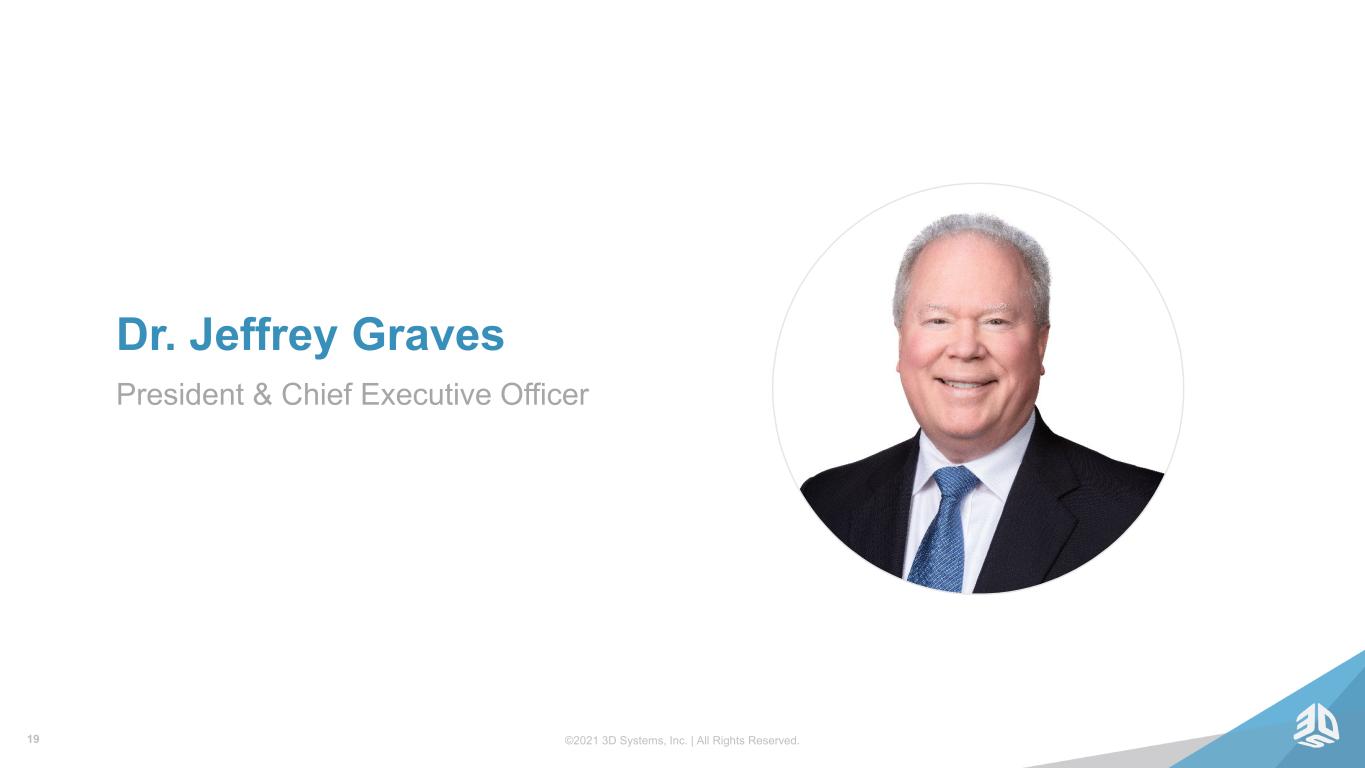
©2021 3D Systems, Inc. | All Rights Reserved. Dr. Jeffrey Graves President & Chief Executive Officer 19
©2021 3D Systems, Inc. | All Rights Reserved.20 Summary Focus on operational execution • Return to year-over-year growth • Strong balance sheet and cash generation Intentional action on our 4-stage plan • Exploring additional divestitures of non- core assets • Investing for sustained growth and profitability

©2021 3D Systems, Inc. | All Rights Reserved.21 Q&A Session 1-201-689-8345
©2021 3D Systems, Inc. | All Rights Reserved.22 Thank You Find out more at: www.3dsystems.com

©2021 3D Systems, Inc. | All Rights Reserved. Appendix
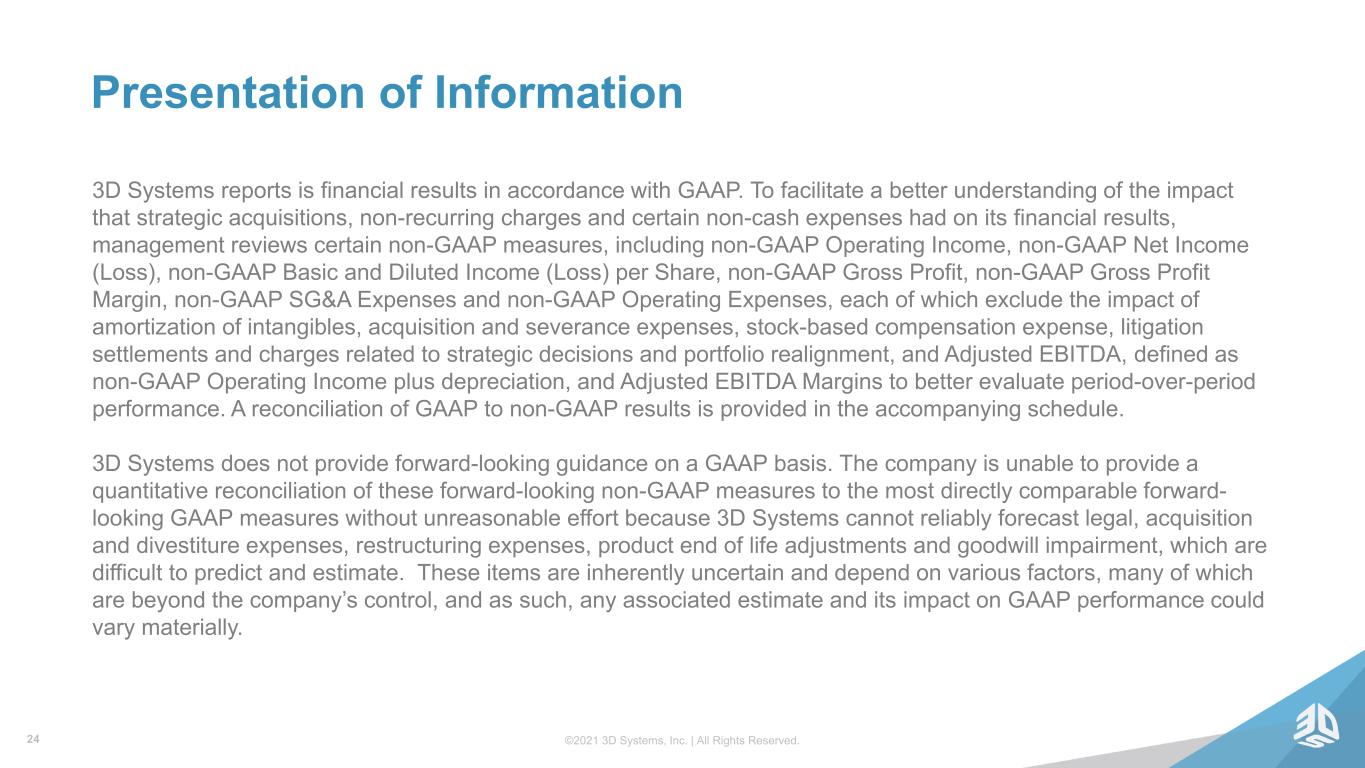
©2021 3D Systems, Inc. | All Rights Reserved.24 Presentation of Information 3D Systems reports is financial results in accordance with GAAP. To facilitate a better understanding of the impact that strategic acquisitions, non-recurring charges and certain non-cash expenses had on its financial results, management reviews certain non-GAAP measures, including non-GAAP Operating Income, non-GAAP Net Income (Loss), non-GAAP Basic and Diluted Income (Loss) per Share, non-GAAP Gross Profit, non-GAAP Gross Profit Margin, non-GAAP SG&A Expenses and non-GAAP Operating Expenses, each of which exclude the impact of amortization of intangibles, acquisition and severance expenses, stock-based compensation expense, litigation settlements and charges related to strategic decisions and portfolio realignment, and Adjusted EBITDA, defined as non-GAAP Operating Income plus depreciation, and Adjusted EBITDA Margins to better evaluate period-over-period performance. A reconciliation of GAAP to non-GAAP results is provided in the accompanying schedule. 3D Systems does not provide forward-looking guidance on a GAAP basis. The company is unable to provide a quantitative reconciliation of these forward-looking non-GAAP measures to the most directly comparable forward- looking GAAP measures without unreasonable effort because 3D Systems cannot reliably forecast legal, acquisition and divestiture expenses, restructuring expenses, product end of life adjustments and goodwill impairment, which are difficult to predict and estimate. These items are inherently uncertain and depend on various factors, many of which are beyond the company’s control, and as such, any associated estimate and its impact on GAAP performance could vary materially.
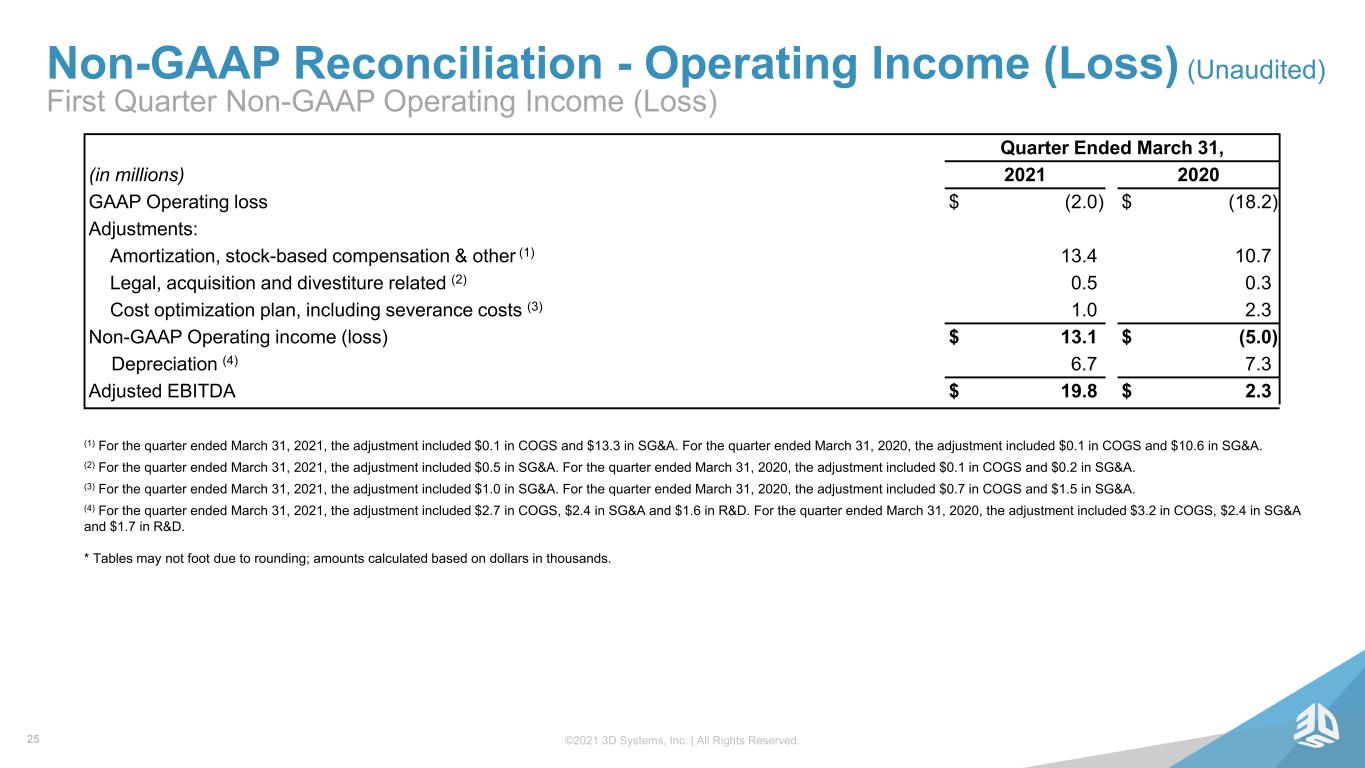
©2021 3D Systems, Inc. | All Rights Reserved. Non-GAAP Reconciliation - Operating Income (Loss) (Unaudited) First Quarter Non-GAAP Operating Income (Loss) 25 Quarter Ended March 31, (in millions) 2021 2020 GAAP Operating loss $ (2.0) $ (18.2) Adjustments: Amortization, stock-based compensation & other (1) 13.4 10.7 Legal, acquisition and divestiture related (2) 0.5 0.3 Cost optimization plan, including severance costs (3) 1.0 2.3 Non-GAAP Operating income (loss) $ 13.1 $ (5.0) Depreciation (4) 6.7 7.3 Adjusted EBITDA $ 19.8 $ 2.3 (1) For the quarter ended March 31, 2021, the adjustment included $0.1 in COGS and $13.3 in SG&A. For the quarter ended March 31, 2020, the adjustment included $0.1 in COGS and $10.6 in SG&A. (2) For the quarter ended March 31, 2021, the adjustment included $0.5 in SG&A. For the quarter ended March 31, 2020, the adjustment included $0.1 in COGS and $0.2 in SG&A. (3) For the quarter ended March 31, 2021, the adjustment included $1.0 in SG&A. For the quarter ended March 31, 2020, the adjustment included $0.7 in COGS and $1.5 in SG&A. (4) For the quarter ended March 31, 2021, the adjustment included $2.7 in COGS, $2.4 in SG&A and $1.6 in R&D. For the quarter ended March 31, 2020, the adjustment included $3.2 in COGS, $2.4 in SG&A and $1.7 in R&D. * Tables may not foot due to rounding; amounts calculated based on dollars in thousands.
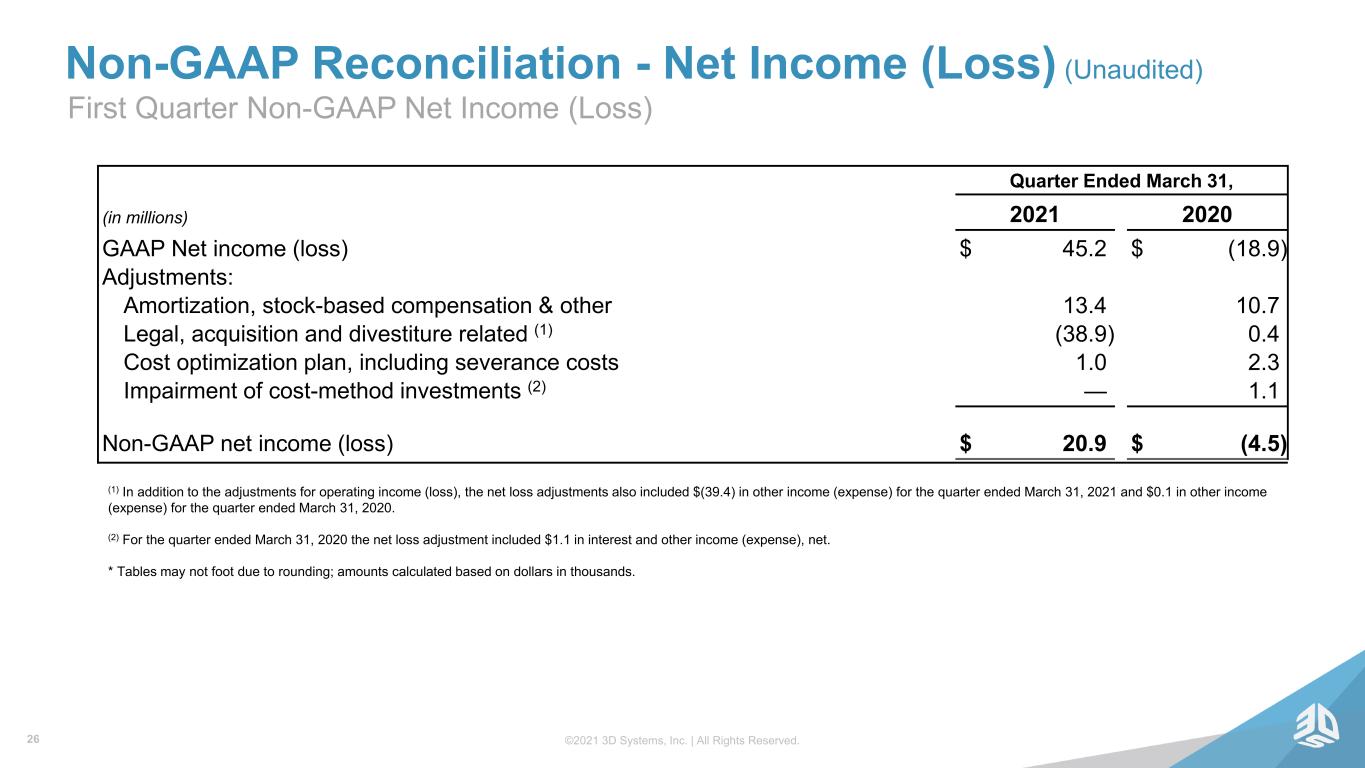
©2021 3D Systems, Inc. | All Rights Reserved. Non-GAAP Reconciliation - Net Income (Loss) (Unaudited) First Quarter Non-GAAP Net Income (Loss) 26 Quarter Ended March 31, (in millions) 2021 2020 GAAP Net income (loss) $ 45.2 $ (18.9) Adjustments: Amortization, stock-based compensation & other 13.4 10.7 Legal, acquisition and divestiture related (1) (38.9) 0.4 Cost optimization plan, including severance costs 1.0 2.3 Impairment of cost-method investments (2) — 1.1 Non-GAAP net income (loss) $ 20.9 $ (4.5) (1) In addition to the adjustments for operating income (loss), the net loss adjustments also included $(39.4) in other income (expense) for the quarter ended March 31, 2021 and $0.1 in other income (expense) for the quarter ended March 31, 2020. (2) For the quarter ended March 31, 2020 the net loss adjustment included $1.1 in interest and other income (expense), net. * Tables may not foot due to rounding; amounts calculated based on dollars in thousands.
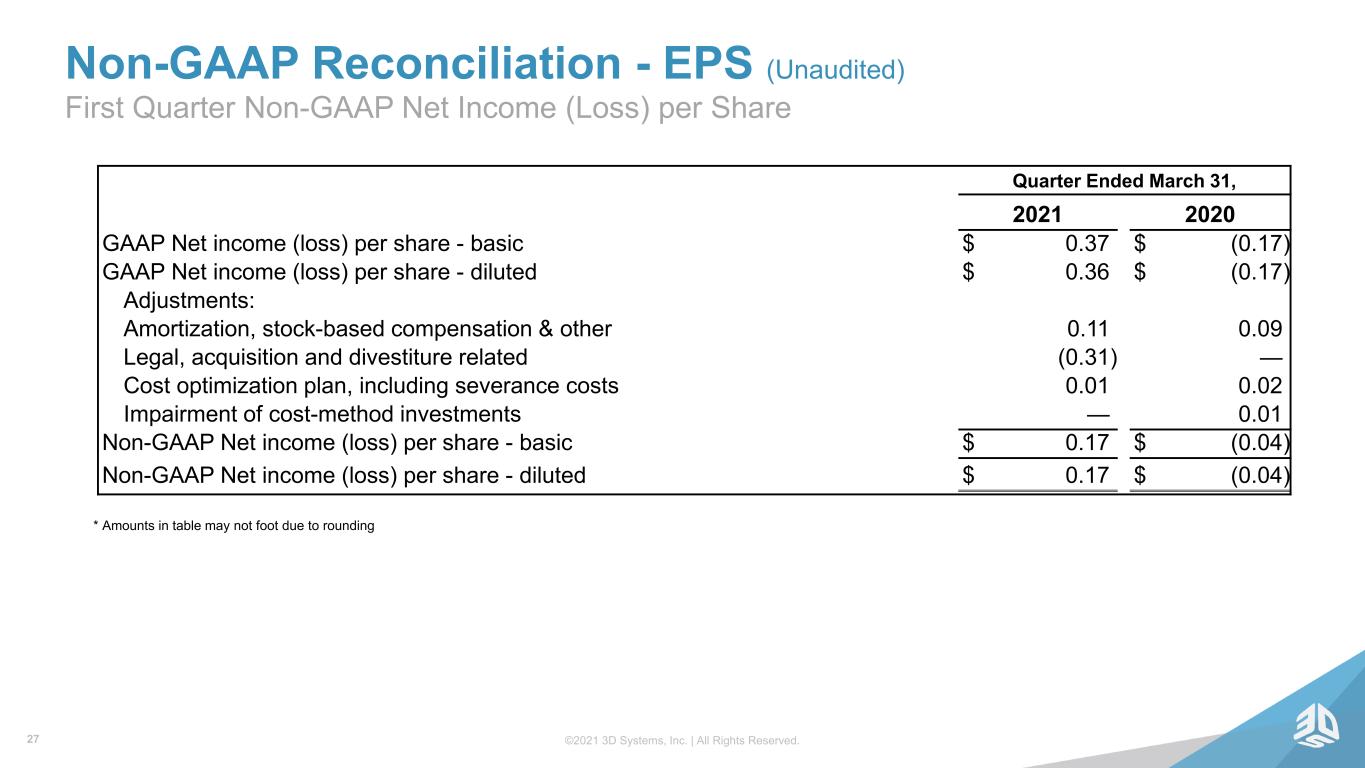
©2021 3D Systems, Inc. | All Rights Reserved. Non-GAAP Reconciliation - EPS (Unaudited) First Quarter Non-GAAP Net Income (Loss) per Share * Amounts in table may not foot due to rounding 27 Quarter Ended March 31, 2021 2020 GAAP Net income (loss) per share - basic $ 0.37 $ (0.17) GAAP Net income (loss) per share - diluted $ 0.36 $ (0.17) Adjustments: Amortization, stock-based compensation & other 0.11 0.09 Legal, acquisition and divestiture related (0.31) — Cost optimization plan, including severance costs 0.01 0.02 Impairment of cost-method investments — 0.01 Non-GAAP Net income (loss) per share - basic $ 0.17 $ (0.04) Non-GAAP Net income (loss) per share - diluted $ 0.17 $ (0.04)
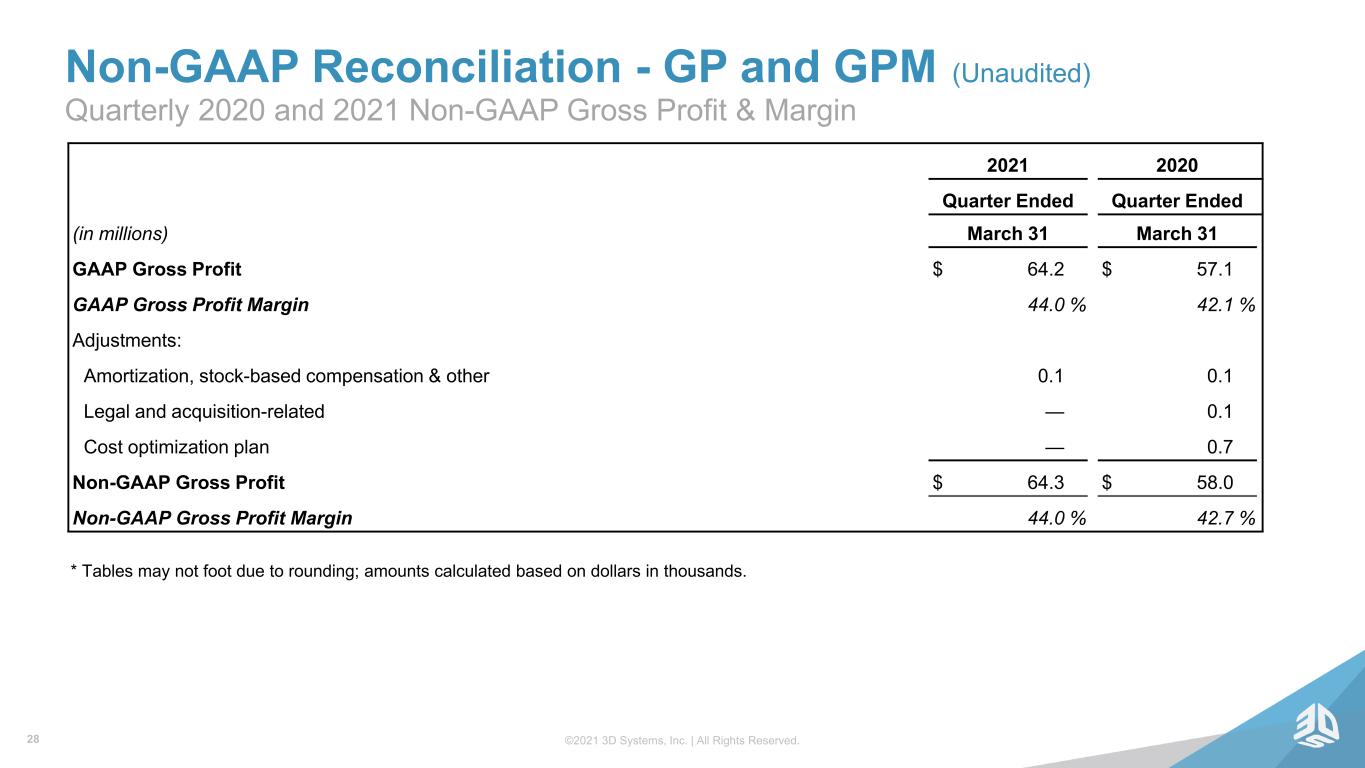
©2021 3D Systems, Inc. | All Rights Reserved. Non-GAAP Reconciliation - GP and GPM (Unaudited) Quarterly 2020 and 2021 Non-GAAP Gross Profit & Margin * Tables may not foot due to rounding; amounts calculated based on dollars in thousands. 28 2021 2020 Quarter Ended Quarter Ended (in millions) March 31 March 31 GAAP Gross Profit $ 64.2 $ 57.1 GAAP Gross Profit Margin 44.0 % 42.1 % Adjustments: Amortization, stock-based compensation & other 0.1 0.1 Legal and acquisition-related — 0.1 Cost optimization plan — 0.7 Non-GAAP Gross Profit $ 64.3 $ 58.0 Non-GAAP Gross Profit Margin 44.0 % 42.7 %
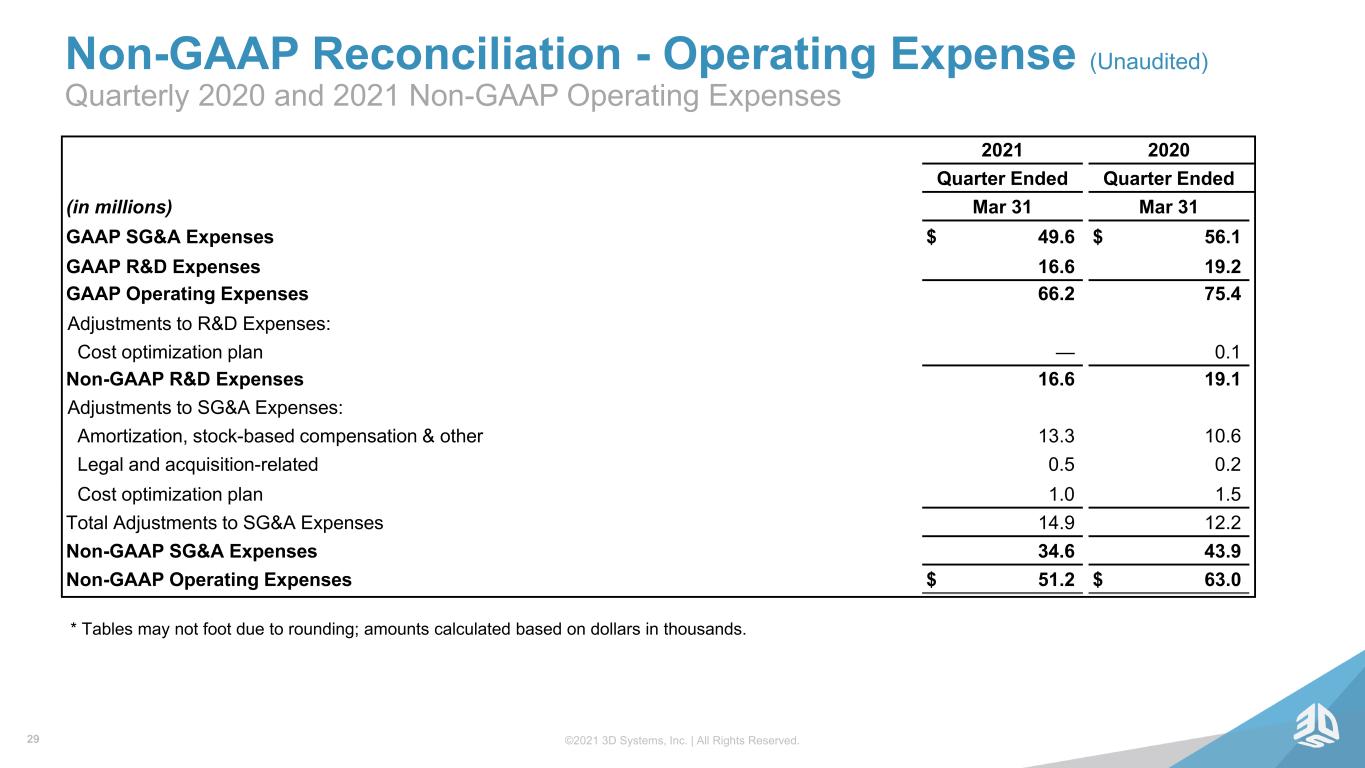
©2021 3D Systems, Inc. | All Rights Reserved. Non-GAAP Reconciliation - Operating Expense (Unaudited) Quarterly 2020 and 2021 Non-GAAP Operating Expenses * Tables may not foot due to rounding; amounts calculated based on dollars in thousands. 29 2021 2020 Quarter Ended Quarter Ended (in millions) Mar 31 Mar 31 GAAP SG&A Expenses $ 49.6 $ 56.1 GAAP R&D Expenses 16.6 19.2 GAAP Operating Expenses 66.2 75.4 Adjustments to R&D Expenses: Cost optimization plan — 0.1 Non-GAAP R&D Expenses 16.6 19.1 Adjustments to SG&A Expenses: Amortization, stock-based compensation & other 13.3 10.6 Legal and acquisition-related 0.5 0.2 Cost optimization plan 1.0 1.5 Total Adjustments to SG&A Expenses 14.9 12.2 Non-GAAP SG&A Expenses 34.6 43.9 Non-GAAP Operating Expenses $ 51.2 $ 63.0