
DK 8-K
Delek US Holdings, Inc. (DK)
8-K
2020-02-26
For: 2020-02-25
View Original
Added on
April 11, 2026
UNITED STATES
SECURITIES AND EXCHANGE COMMISSION
WASHINGTON, D.C. 20549
FORM 8-K
CURRENT REPORT
Pursuant to Section 13 or 15(d) of the Securities Exchange Act of 1934
Date of Report (Date of earliest event reported)
(Exact name of registrant as specified in its charter)
(State or other jurisdiction of incorporation) | (Commission File Number) | (IRS Employer Identification No.) | |
 | |||
(Address of Principal Executive) | (Zip Code) | ||
(615 ) 771-6701
(Registrant’s telephone number, including area code)
Not Applicable
(Former name, former address and former fiscal year, if changed since last report)
Check the appropriate box below if the Form 8-K filing is intended to simultaneously satisfy the filing obligation of the registrant under any of the following provisions (see General Instruction A.2 below):
Securities registered pursuant to Section 12(b) of the Act:
Title of each class | Trading Symbol(s) | Name of each exchange on which registered |
Indicate by check mark whether the registrant is an emerging growth company as defined in Rule 405 of the Securities Act of 1933 (§230.405 of this chapter) or Rule 12b-2 of the Securities Exchange Act of 1934 (§240.12b-2 of this chapter).
Emerging growth company ☐
If an emerging growth company, indicate by check mark if the registrant has elected not to use the extended transition period for complying with any new or revised financial accounting standards provided pursuant to Section 13(a) of the Exchange Act. ☐
Item 2.02 Results of Operations and Financial Condition
On February 25, 2020, Delek US Holdings, Inc. (the “Company”) announced its financial results for the quarter ended December 31, 2019. The full text of the press release is furnished as Exhibit 99.1 hereto.
The information in the attached Exhibit is being furnished pursuant to Item 2.02 “Results of Operations and Financial Condition” on Form 8-K. The information shall not be deemed “filed” for purposes of Section 18 of the Securities Exchange Act of 1934 or otherwise subject to the liabilities of that section, nor shall it be deemed incorporated by reference in any filing under the Securities Act of 1933 or the Securities Exchange Act of 1934, each as amended, except as shall be expressly set forth by specific reference in such filing.
Item 7.01 Regulation FD Disclosure
On February 26, 2020, the Company will use the materials included in Exhibit 99.2 (the "Earnings Call Slides") to this report in connection with the fourth quarter earnings call. The Earnings Call Slides are incorporated into this Item 7.01 by this reference and will also be available on the Company's website at www.delekus.com.
The information in this Item 7.01 is being furnished, not filed, pursuant to Regulation FD. Accordingly, the information in Item 7.01 of this report will not be incorporated by reference into any registration statement filed by the Company under the Securities Act of 1933, as amended, unless specifically identified therein as being incorporated therein by reference. The furnishing of the information in this report is not intended to, and does not, constitute a determination or admission by the Company that the information in this report is material or complete, or that investors should consider this information before making an investment decision with respect to any security of the Company or any of its affiliates.
Item 9.01 Financial Statements and Exhibits.
(a) Financial statements of businesses acquired.
Not applicable.
(b) Pro Forma Financial Information.
Not applicable.
(c) Shell company transactions.
Not applicable.
(d) Exhibits.
104 | Cover Page Interactive Data File - the cover page XBRL tags are embedded within the Inline XBRL document. | |
SIGNATURES
Pursuant to the requirements of the Securities Exchange Act of 1934, the registrant has duly caused this report to be signed on its behalf by the undersigned hereunto duly authorized.
Dated: February 26, 2020 | DELEK US HOLDINGS, INC |
/s/ Assaf Ginzburg | |
Name: Assaf Ginzburg | |
Title: Executive Vice President and Chief Financial Officer (Principal Financial and Accounting Officer) | |
Exhibit 99.1

Delek US Holdings Reports Fourth Quarter 2019 Results
• | Reported fourth quarter net income of $32.7 million and Adjusted EBITDA of $66.0 million |
• | Biodiesel tax credit (BTC) extended through 2022 and provides significant cash benefit in first half 2020 |
• | Secured Wink to Webster project financing through new joint venture |
• | Increasing EBITDA guidance for Big Spring Gathering to $45 to $55 million in 2022 |
• | CAPEX in 2020 expected to decline approximately 24 percent to $325 million |
• | Increasing regular quarterly dividend by $0.01 or 3.3 percent to $0.31 per share |
BRENTWOOD, Tenn.-- February 25, 2020 -- Delek US Holdings, Inc. (NYSE: DK) (“Delek US”) today announced financial results for its fourth quarter ended December 31, 2019. Delek US reported fourth quarter 2019 net income of $32.7 million, or $0.44 per diluted share, versus a net income of $121.6 million, or $1.48 per diluted share, for the quarter ended December 31, 2018. On an adjusted basis, Delek US reported Adjusted net loss of $(8.5) million, or $(0.11) per share for the fourth quarter 2019. This compares to Adjusted net income of $165.7 million, or $2.03 per share, in the prior-year period. Adjusted earnings before interest, taxes, depreciation and amortization ("Adjusted EBITDA") was $66.0 million compared to Adjusted EBITDA of $287.4 million in the prior-year period. Reconciliations of net income reported under U.S. GAAP to Adjusted net income and Adjusted EBITDA are included in the financial tables attached to this release.
Adjusted quarterly results include a net income benefit of approximately $7.2 million, or $0.10 per share. This consists of a $31.1 million (after-tax) benefit from the retroactive biodiesel tax credit (BTC) attributable to the first three quarters of 2019, partially offset by headwinds of approximately $23.9 million (after-tax). These headwinds include $11.4 million related to environmental expenses and incremental employee costs. In addition, approximately $12.5 million is related to operating factors, such as accelerated work and product inventory builds at Krotz Springs and Big Spring, respectively, along with unplanned repairs and maintenance.
For the full year 2019, Delek US reported net income of $310.6 million, or $4.06 per diluted share, compared to net income of $340.1 million, or $3.95 per diluted share in 2018. Net income in 2019 includes the benefit of $40.4 million (after-tax) of retroactive BTC related to 2018, while 2018 net income included the benefit of $24.9 million (after-tax) of retroactive BTC related to 2017. Adjusted net income was $252.5 million, or $3.30 per share in 2019, compared to net income of $416.6 million, or $4.92 per share in 2018. Adjusted net income for both 2019 and 2018 reflect adjustments to present BTC impacts in the year to which they relate. The overall decrease in year-over-year results were primarily driven by a lower crude differential environment where the benchmark Midland to Brent differential declined from $13.85 per barrel for full year 2018 to $7.83 per barrel for full year 2019. The effect from a lower crude oil differential was partially offset by the alkylation unit at Krotz Springs that began operating in the second quarter 2019 and an increase in income from joint ventures. Adjusted EBITDA was $659.4 million compared to Adjusted EBITDA of $864.6 million in the prior year period.
Uzi Yemin, Chairman, President and Chief Executive Officer of Delek US, stated, "Our company had solid execution and financial performance in 2019. Last year in refining we brought the alkylation unit at Krotz Springs on line and completed turnaround and vacuum tower work at El Dorado. In retail we continued to high grade our portfolio with the divestiture of select stores and progress on re-branding. Strategically, we took meaningful steps to transition our portfolio to become more integrated and diversified, mainly through midstream investments. These steps included the ongoing build-out of the Big Spring Gathering system, where we are increasing EBITDA guidance, participation in the Wink to Webster pipeline joint venture, and Delek Logistics Partners' acquisition of an interest in the Red River pipeline joint venture. These midstream assets should provide a significant contribution to future results and gain momentum into 2021 and 2022. We remain confident in our annualized midstream EBITDA target of $370 to $395 million by 2023. With our midstream growth, we are looking to simplify the capital structure of our MLP and unlock value through potential asset drop-down opportunities. During 2019, we also returned approximately $265 million of cash to shareholders in the form of dividends and share repurchases as we strive to balance growth while simultaneously returning cash."
Mr. Yemin continued, "Cash generation in the first half of 2020 should benefit from the retroactive approval of the BTC, along with project financing from Wink to Webster. Additionally, our capital spending this year should decline approximately 24% to $325 million. Between the
1 | | |
work completed at El Dorado last year and the turnaround at the Big Spring refinery in the first quarter of 2020, our system should be positioned to capture market opportunities throughout the balance of this year. Finally, our strong balance sheet positions us well for macro volatility. As a result, our quarterly dividend is being increased by 3.3% from the third quarter 2019, marking the seventh increase since the dividend paid during the first quarter of 2018."
Regular Quarterly Dividend and Share Repurchase
Delek US announced today its Board of Directors declared a regular quarterly cash dividend of $0.31 per share. This represents a 3.3% increase from our previous regular quarterly dividend. Shareholders of record on March 10, 2020 will receive this cash dividend payable on March 24, 2020.
During the fourth quarter 2019, Delek US repurchased approximately 863 thousand shares of Delek US common stock for approximately $30.3 million, with an average price of $35.05 per share. For the full year 2019, Delek US repurchased approximately 5.0 million shares for approximately $178.0 million with an average price of $35.33 per share. At December 31, 2019, there was approximately $231.7 million of total available authorization remaining to repurchase shares.
Liquidity
As of December 31, 2019, Delek US had a cash balance of $955.3 million and total consolidated long-term debt of $2,067.1 million, resulting in net debt of $1,111.8 million. As of December 31, 2019, Delek Logistics Partners, LP (NYSE: DKL) ("Delek Logistics") had $833.1 million of total debt and $5.5 million of cash, which is included in the consolidated amounts on Delek US' balance sheet. Excluding Delek Logistics, Delek US had approximately $949.8 million in cash and $1,234.0 million of debt, or a $284.2 million net debt position.
Refining Segment
Refining segment contribution margin was $161.5 million in the fourth quarter 2019 compared to $235.3 million in the fourth quarter 2018. On a year-over-year basis, results were negatively impacted by a lower crude differential environment and lower sales volumes. In the fourth quarter 2018, results included an approximate $16.0 million reduction in operating expenses related to environmental indemnification proceeds at the idled Bakersfield, California location.
Fourth-quarter 2019 contribution margin includes a benefit of $67.9 million for the BTC attributable to volumes blended in 2018 and the first three quarters of 2019. The benefit was recognized in the fourth quarter since the legislation authorizing the credit was enacted in December 2019.
Logistics Segment
The logistics segment contribution margin in the fourth quarter 2019 was $42.5 million compared to $45.0 million in the fourth quarter 2018. Results in the fourth quarter 2019 were negatively impacted by spill related costs of $7.1 million, which were partially offset by improved performance in the Paline Pipeline and SALA Gathering System.
Retail Segment
For the fourth quarter 2019, contribution margin was $12.1 million compared to $13.1 million in the prior year period for the retail segment. Merchandise sales were approximately $72.9 million with an average retail margin of 30.6% in the fourth quarter 2019, compared to merchandise sales of approximately $81.0 million with an average retail margin of 30.2% in the prior-year period. Approximately 51.5 million retail fuel gallons were sold at an average margin of $0.29 per gallon in the fourth quarter 2019 compared to 53.3 million retail fuel gallons sold at an average margin of $0.30 per gallon in the fourth quarter 2018. In the fourth quarter 2019, the average store count was 258 compared to 295 in the prior year period. On a same store sales basis in the fourth quarter 2019, merchandise sales increased 0.5% and fuel gallons sold increased 2.4% compared to the prior-year period.
Corporate/Other
Contribution margin from Corporate/Other was a loss of $44.7 million in the fourth quarter 2019 compared to a loss of $8.0 million in the prior-year period. The year over year decrease was mainly driven by hedging losses of approximately $39.0 million in the fourth quarter 2019.
Fourth Quarter 2019 Results | Conference Call Information
Delek US will hold a conference call to discuss its fourth quarter 2019 results on Wednesday, February 26, 2020 at 8:30 a.m. Central Time. Investors will have the opportunity to listen to the conference call live by going to www.DelekUS.com and clicking on the Investor Relations tab. Participants are encouraged to register at least 15 minutes early to download and install any necessary software. Presentation materials accompanying the call will be available on the investor relations tab of the Delek US website approximately five minutes prior to the start of the call. For those who cannot listen to the live broadcast, the online replay will be available on the website for 90 days. A telephonic replay of the call will also be available through March 11, 2020. The replay can be accessed by dialing (855) 859-2056 with the conference ID number 4691547.
2 | | |
Investors may also wish to listen to Delek Logistics’ (NYSE: DKL) fourth quarter 2019 earnings conference call that will be held on Wednesday, February 26, 2020 at 7:30 a.m. Central Time and review Delek Logistics’ earnings press release. Market trends and information disclosed by Delek Logistics may be relevant to the logistics segment reported by Delek US. Both a replay of the conference call and press release for Delek Logistics are available online at www.deleklogistics.com.
About Delek US Holdings, Inc.
Delek US Holdings, Inc. is a diversified downstream energy company with assets in petroleum refining, logistics, renewable fuels and convenience store retailing. The refining assets consist of refineries operated in Tyler and Big Spring, Texas, El Dorado, Arkansas and Krotz Springs, Louisiana with a combined nameplate crude throughput capacity of 302,000 barrels per day.
The logistics operations primarily consist of Delek Logistics Partners, LP (NYSE: DKL). Delek US Holdings, Inc. and its affiliates own approximately 63% (including the 2% general partner interest) of Delek Logistics Partners, LP. Delek Logistics Partners, LP is a growth-oriented master limited partnership focused on owning and operating midstream energy infrastructure assets.
The convenience store retail operates approximately 252 convenience stores in central and west Texas and New Mexico.
Safe Harbor Provisions Regarding Forward-Looking Statements
This press release contains forward-looking statements that are based upon current expectations and involve a number of risks and uncertainties. Statements concerning current estimates, expectations and projections about future results, performance, prospects, opportunities, plans, actions and events and other statements, concerns, or matters that are not historical facts are “forward-looking statements,” as that term is defined under the federal securities laws. These statements contain words such as “possible,” “believe,” “should,” “could,” “would,” “predict,” “plan,” “estimate,” “intend,” “may,” “anticipate,” “will,” “if", “potential,” “expect” or similar expressions, as well as statements in the future tense. These forward-looking statements include, but are not limited to, statements regarding throughput at the Company’s refineries; crude oil prices, discounts and quality and our ability to benefit therefrom; share repurchases; returning cash to shareholders; payments of dividends; growth; investments into our business; the performance and execution of our midstream growth initiatives, including the Big Spring Gathering System, the Red River joint venture and the Wink to Webster long-haul crude oil pipeline, and the flexibility, benefits and the expected returns therefrom; RINs waivers and tax credits and the value and benefit therefrom; cash and liquidity; opportunities and anticipated performance and financial position.
Investors are cautioned that the following important factors, among others, may affect these forward-looking statements. These factors include, but are not limited to: uncertainty related to timing and amount of future share repurchases and dividend payments; risks and uncertainties with respect to the quantities and costs of crude oil we are able to obtain and the price of the refined petroleum products we ultimately sell; risks related to Delek US’ exposure to Permian Basin crude oil, such as supply, pricing, gathering, production and transportation capacity; gains and losses from derivative instruments; management's ability to execute its strategy of growth, including risks associated with acquisitions and dispositions; acquired assets may suffer a diminishment in fair value as a result of which we may need to record a write-down or impairment in carrying value of the asset; the possibility of litigation challenging renewable fuel standard waivers;changes in the scope, costs, and/or timing of capital and maintenance projects; the ability to grow the Big Spring Gathering System; the ability of the Red River joint venture to complete the expansion project to increase the Red River pipeline capacity; the ability of the joint venture to construct the Wink to Webster long haul crude oil pipeline; operating hazards inherent in transporting, storing and processing crude oil and intermediate and finished petroleum products; our competitive position and the effects of competition; the projected growth of the industries in which we operate; general economic and business conditions affecting the geographic areas in which we operate; and other risks described in Delek US’ filings with the United States Securities and Exchange Commission (the “SEC”), including risks disclosed in our Annual Report on Form 10-K, Quarterly Reports on Form 10-Q and other filings and reports with the SEC.
Forward-looking statements should not be read as a guarantee of future performance or results and will not be accurate indications of the times at, or by, which such performance or results will be achieved. Forward-looking information is based on information available at the time and/or management's good faith belief with respect to future events, and is subject to risks and uncertainties that could cause actual performance or results to differ materially from those expressed in the statements. Delek US undertakes no obligation to update or revise any such forward-looking statements to reflect events or circumstances that occur, or which Delek US becomes aware of, after the date hereof, except as required by applicable law or regulation.
3 | | |
Non-GAAP Disclosures:
Our management uses certain “non-GAAP” operational measures to evaluate our operating segment performance and non-GAAP financial measures to evaluate past performance and prospects for the future to supplement our GAAP financial information presented in accordance with U.S. GAAP. These financial and operational non-GAAP measures are important factors in assessing our operating results and profitability and include:
• | Adjusted net income (loss) - calculated as net income attributable to Delek US adjusted for certain identified infrequently occurring items, non-cash items and items that are not attributable to our on-going operations (collectively, "Adjusting Items") recorded during the period; |
• | Adjusted unrealized hedging (gains) losses - calculated as GAAP unrealized (gains) losses on commodity derivatives that are economic hedges but not designated as hedging instruments adjusted to exclude unrealized (gains) losses where the instrument has matured but where it has not cash settled as of the balance sheet date. This adjustment more appropriately aligns matured commodity derivatives gains and losses with the recognition of the related cost of materials and other. There are no premiums paid or received at the inception of the derivative contracts, and upon settlement there is no cost recovery associated with these contracts; |
• | Adjusted net income (loss) per share - calculated as Adjusted net income (loss) divided by weighted average shares outstanding, assuming dilution, as adjusted for any anti-dilutive instruments that may not be permitted for consideration in GAAP earnings per share calculations but that nonetheless favorably impact dilution; |
• | Earnings before interest, taxes, depreciation and amortization ("EBITDA") - calculated as net income attributable to Delek adjusted to add back interest expense, income tax expense, depreciation and amortization; |
• | Adjusted EBITDA - calculated as EBITDA adjusted for the identified adjusting items in Adjusted net income (loss) that do not relate to interest expense, income tax expense, depreciation or amortization, and adjusted to include income (loss) attributable to non-controlling interests; |
• | Refining margin - calculated as the difference between total refining revenues and total cost of materials and other; |
• | Adjusted refining margin -- calculated as refining margin adjusted for certain identified infrequently occurring items, non-cash items and items that are not attributable to our on-going refining operations recorded during the period; |
• | Refining margin per sales barrel - calculated as refining margin divided by our average refining sales in barrels per day (excluding purchased barrels) multiplied by 1,000 and multiplied by the number of days in the period; and |
• | Adjusted refining margin per sales barrel - calculated as adjusted refining margin divided by our average refining sales in barrels per day (excluding purchased barrels) multiplied by 1,000 and multiplied by the number of days in the period; |
We believe these non-GAAP operational and financial measures are useful to investors, lenders, ratings agencies and analysts to assess our ongoing performance because, when reconciled to their most comparable GAAP financial measure, they provide improved comparability between periods through the exclusion of certain items that we believe are not indicative of our core operating performance and that may obscure our underlying results and trends.
Non-GAAP measures have important limitations as analytical tools, because they exclude some, but not all, items that affect net earnings and operating income. These measures should not be considered substitutes for their most directly comparable U.S. GAAP financial measures. Additionally, because Adjusted net income or loss, Adjusted net income or loss per share, EBITDA and adjusted EBITDA or any of our other identified non-GAAP measures may be defined differently by other companies in its industry, Delek US' definition may not be comparable to similarly titled measures of other companies. See the accompanying tables in this earnings release for a reconciliation of these non-GAAP measures to the most directly comparable GAAP measures.
4 | | |
Delek US Holdings, Inc. | ||||||||
Condensed Consolidated Balance Sheets (Unaudited) | ||||||||
(In millions, except share and per share data) | ||||||||
December 31, 2019 | December 31, 2018 | |||||||
ASSETS | ||||||||
Current assets: | ||||||||
Cash and cash equivalents | $ | 955.3 | $ | 1,079.3 | ||||
Accounts receivable, net | 792.6 | 514.4 | ||||||
Inventories, net of inventory valuation reserves | 946.7 | 677.9 | ||||||
Other current assets | 268.7 | 148.7 | ||||||
Total current assets | 2,963.3 | 2,420.3 | ||||||
Property, plant and equipment: | ||||||||
Property, plant and equipment | 3,362.8 | 2,999.6 | ||||||
Less: accumulated depreciation | (934.5 | ) | (804.7 | ) | ||||
Property, plant and equipment, net | 2,428.3 | 2,194.9 | ||||||
Operating lease right-of-use assets | 183.6 | — | ||||||
Goodwill | 855.7 | 857.8 | ||||||
Other intangibles, net | 110.3 | 104.4 | ||||||
Equity method investments | 407.3 | 130.3 | ||||||
Other non-current assets | 67.8 | 52.9 | ||||||
Total assets | $ | 7,016.3 | $ | 5,760.6 | ||||
LIABILITIES AND STOCKHOLDERS’ EQUITY | ||||||||
Current liabilities: | ||||||||
Accounts payable | $ | 1,599.7 | $ | 1,011.2 | ||||
Current portion of long-term debt | 36.4 | 32.0 | ||||||
Obligation under Supply and Offtake Agreements | 332.5 | 312.6 | ||||||
Current portion of operating lease liabilities | 40.5 | — | ||||||
Accrued expenses and other current liabilities | 346.8 | 307.7 | ||||||
Total current liabilities | 2,355.9 | 1,663.5 | ||||||
Non-current liabilities: | ||||||||
Long-term debt, net of current portion | 2,030.7 | 1,751.3 | ||||||
Obligation under Supply and Offtake Agreements | 144.8 | 49.6 | ||||||
Environmental liabilities, net of current portion | 137.9 | 139.5 | ||||||
Asset retirement obligations | 68.6 | 75.5 | ||||||
Deferred tax liabilities | 267.9 | 210.2 | ||||||
Operating lease liabilities, net of current portion | 144.3 | — | ||||||
Other non-current liabilities | 30.9 | 62.9 | ||||||
Total non-current liabilities | 2,825.1 | 2,289.0 | ||||||
Stockholders’ equity: | ||||||||
Common stock, $0.01 par value, 110,000,000 shares authorized, 90,987,025 shares and 90,478,075 shares issued at December 31, 2019 and December 31, 2018, respectively | 0.9 | 0.9 | ||||||
Additional paid-in capital | 1,151.9 | 1,135.4 | ||||||
Accumulated other comprehensive income | 0.1 | 28.6 | ||||||
Treasury stock, 17,516, 814 shares and 12,477,780 shares, at cost, as of December 31, 2019 and December 31, 2018, respectively | (692.2 | ) | (514.1 | ) | ||||
Retained earnings | 1,205.6 | 981.8 | ||||||
Non-controlling interests in subsidiaries | 169.0 | 175.5 | ||||||
Total stockholders’ equity | 1,835.3 | 1,808.1 | ||||||
Total liabilities and stockholders’ equity | $ | 7,016.3 | $ | 5,760.6 | ||||
5 | | |
Delek US Holdings, Inc. | ||||||||||||||||
Condensed Consolidated Statements of Income (Unaudited) (1) | ||||||||||||||||
(In millions, except share and per share data) | ||||||||||||||||
Three Months Ended December 31, | Year Ended December 31, | |||||||||||||||
2019 | 2018 | 2019 | 2018 | |||||||||||||
Net revenues | $ | 2,283.7 | $ | 2,474.1 | $ | 9,298.2 | $ | 10,233.1 | ||||||||
Cost of sales: | ||||||||||||||||
Cost of materials and other | 1,926.0 | 2,023.3 | 7,657.2 | 8,560.5 | ||||||||||||
Operating expenses (excluding depreciation and amortization presented below) | 161.8 | 137.8 | 580.2 | 538.5 | ||||||||||||
Depreciation and amortization | 45.0 | 42.0 | 170.7 | 161.3 | ||||||||||||
Total cost of sales | 2,132.8 | 2,203.1 | 8,408.1 | 9,260.3 | ||||||||||||
Operating expenses related to retail and wholesale business (excluding depreciation and amortization presented below) | 24.5 | 27.6 | 102.0 | 106.5 | ||||||||||||
General and administrative expenses | 77.4 | 71.5 | 274.7 | 247.6 | ||||||||||||
Depreciation and amortization | 2.6 | 11.0 | 23.6 | 38.1 | ||||||||||||
Other operating (income) expense, net | (1.8 | ) | (21.9 | ) | (2.5 | ) | (31.3 | ) | ||||||||
Total operating costs and expenses | 2,235.5 | 2,291.3 | 8,805.9 | 9,621.2 | ||||||||||||
Operating income | 48.2 | 182.8 | 492.3 | 611.9 | ||||||||||||
Interest expense | 35.7 | 30.7 | 131.1 | 125.9 | ||||||||||||
Interest income | (2.3 | ) | (2.8 | ) | (11.3 | ) | (5.8 | ) | ||||||||
Income from equity method investments | (5.9 | ) | (2.8 | ) | (34.3 | ) | (9.7 | ) | ||||||||
Gain on sale of business | — | (0.1 | ) | — | (13.3 | ) | ||||||||||
Impairment loss on assets held for sale | — | — | — | 27.5 | ||||||||||||
Loss on extinguishment of debt | — | — | — | 9.1 | ||||||||||||
Other expense (income), net | 0.8 | 0.6 | 4.1 | (7.3 | ) | |||||||||||
Total non-operating expenses (income), net | 28.3 | 25.6 | 89.6 | 126.4 | ||||||||||||
Income from continuing operations before income tax expense | 19.9 | 157.2 | 402.7 | 485.5 | ||||||||||||
Income tax (benefit) expense | (12.1 | ) | 29.6 | 71.7 | 101.9 | |||||||||||
Income from continuing operations, net of tax | 32.0 | 127.6 | 331.0 | 383.6 | ||||||||||||
Discontinued operations: | ||||||||||||||||
Income (loss) from discontinued operations, including gain (loss) on sale of discontinued operations | 7.6 | (0.2 | ) | 6.6 | (10.9 | ) | ||||||||||
Income tax expense (benefit) | 1.6 | — | 1.4 | (2.2 | ) | |||||||||||
Income (loss) from discontinued operations, net of tax | 6.0 | (0.2 | ) | 5.2 | (8.7 | ) | ||||||||||
Net income | 38.0 | 127.4 | 336.2 | 374.9 | ||||||||||||
Net income attributed to non-controlling interests | 5.3 | 5.8 | 25.6 | 34.8 | ||||||||||||
Net income attributable to Delek | $ | 32.7 | $ | 121.6 | $ | 310.6 | $ | 340.1 | ||||||||
Basic income (loss) per share: | ||||||||||||||||
Income from continuing operations | $ | 0.36 | $ | 1.50 | $ | 4.03 | $ | 4.31 | ||||||||
Income (loss) from discontinued operations | 0.08 | — | $ | 0.07 | $ | (0.20 | ) | |||||||||
Total basic income per share | $ | 0.44 | $ | 1.50 | $ | 4.10 | $ | 4.11 | ||||||||
Diluted income (loss) per share: | ||||||||||||||||
Income from continuing operations | $ | 0.36 | $ | 1.48 | $ | 3.99 | $ | 4.14 | ||||||||
Income (loss) from discontinued operations | 0.08 | — | $ | 0.07 | $ | (0.19 | ) | |||||||||
Total diluted income per share | $ | 0.44 | $ | 1.48 | $ | 4.06 | $ | 3.95 | ||||||||
Weighted average common shares outstanding: | ||||||||||||||||
Basic | 74,042,343 | 81,321,240 | 75,853,187 | 82,797,110 | ||||||||||||
Diluted | 74,700,926 | 82,528,339 | 76,574,091 | 86,768,401 | ||||||||||||
Dividends declared per common share outstanding | $ | 0.30 | $ | 0.26 | $ | 1.14 | $ | 0.96 | ||||||||
6 | | |
Delek US Holdings, Inc. | |||||||||||||||
Condensed Cash Flow Data (Unaudited) | |||||||||||||||
(In millions) | |||||||||||||||
Three Months Ended December 31, | Year Ended December 31, | ||||||||||||||
2019 | 2018 | 2019 | 2018 | ||||||||||||
Cash flows from operating activities: | |||||||||||||||
Cash provided by operating activities - continuing operations | $ | 126.8 | $ | 359.1 | $ | 575.2 | $ | 590.4 | |||||||
Cash used in operating activities - discontinued operations | — | — | — | (30.1 | ) | ||||||||||
Net cash provided by operating activities | 126.8 | 359.1 | 575.2 | 560.3 | |||||||||||
Cash flows from investing activities: | |||||||||||||||
Cash (used in) provided by investing activities - continuing operations | (181.8 | ) | (88.1 | ) | (691.3 | ) | (145.3 | ) | |||||||
Cash provided by investing activities - discontinued operations | — | — | — | 20.0 | |||||||||||
Net cash (used in) provided by investing activities | (181.8 | ) | (88.1 | ) | (691.3 | ) | (125.3 | ) | |||||||
Cash flows from financing activities: | |||||||||||||||
Cash used in financing activities - continuing operations | 3.9 | (300.8 | ) | (7.9 | ) | (297.6 | ) | ||||||||
Net cash used in financing activities | 3.9 | (300.8 | ) | (7.9 | ) | (297.6 | ) | ||||||||
Net increase (decrease) in cash and cash equivalents | (51.1 | ) | (29.8 | ) | (124.0 | ) | 137.4 | ||||||||
Cash and cash equivalents at the beginning of the period | 1,006.4 | 1,109.1 | 1,079.3 | 941.9 | |||||||||||
Cash and cash equivalents at the end of the period | 955.3 | 1,079.3 | 955.3 | 1,079.3 | |||||||||||
Less cash and cash equivalents of discontinued operations at the end of the period | — | — | — | — | |||||||||||
Cash and cash equivalents of continuing operations at the end of the period | $ | 955.3 | $ | 1,079.3 | $ | 955.3 | $ | 1,079.3 | |||||||
7 | | |
Delek US Holdings, Inc. | ||||||||||||||||||||
Segment Data (Unaudited) | ||||||||||||||||||||
(In millions) | ||||||||||||||||||||
Three Months Ended December 31, 2019 | ||||||||||||||||||||
Refining | Logistics | Retail | Corporate, Other and Eliminations | Consolidated | ||||||||||||||||
Net revenues (excluding inter-segment fees and revenues) | $ | 1,999.1 | $ | 68.7 | $ | 197.8 | $ | 18.1 | $ | 2,283.7 | ||||||||||
Inter-segment fees and revenues | 162.8 | 69.9 | — | (232.7 | ) | — | ||||||||||||||
Operating costs and expenses: | ||||||||||||||||||||
Cost of materials and other | 1,864.7 | 73.8 | 162.8 | (175.3 | ) | 1,926.0 | ||||||||||||||
Operating expenses (excluding depreciation and amortization presented below) | 135.7 | 22.3 | 22.9 | 5.4 | 186.3 | |||||||||||||||
Segment contribution margin | $ | 161.5 | $ | 42.5 | $ | 12.1 | $ | (44.7 | ) | 171.4 | ||||||||||
Depreciation and amortization | 35.4 | 6.9 | (0.3 | ) | 5.6 | 47.6 | ||||||||||||||
General and administrative expenses | 77.4 | |||||||||||||||||||
Other operating income, net | (1.8 | ) | ||||||||||||||||||
Operating income | $ | 48.2 | ||||||||||||||||||
Capital spending (excluding business combinations) | $ | 72.8 | $ | 3.7 | $ | 6.2 | $ | 20.6 | $ | 103.3 | ||||||||||
Three Months Ended December 31, 2018 | ||||||||||||||||||||
Refining | Logistics | Retail | Corporate, Other and Eliminations | Consolidated | ||||||||||||||||
Net revenues (excluding intercompany fees and sales) | $ | 2,093.2 | $ | 97.2 | $ | 214.6 | $ | 69.1 | $ | 2,474.1 | ||||||||||
Intercompany fees and sales | 198.8 | 62.1 | — | (260.9 | ) | — | ||||||||||||||
Operating costs and expenses: | ||||||||||||||||||||
Cost of materials and other | 1,938.0 | 98.5 | 177.3 | (190.5 | ) | 2,023.3 | ||||||||||||||
Operating expenses (excluding depreciation and amortization presented below) | 118.7 | 15.8 | 24.2 | 6.7 | 165.4 | |||||||||||||||
Segment contribution margin | $ | 235.3 | $ | 45.0 | $ | 13.1 | $ | (8.0 | ) | 285.4 | ||||||||||
Depreciation and amortization | 34.6 | 6.3 | 7.8 | 4.3 | 53.0 | |||||||||||||||
General and administrative expenses | 71.5 | |||||||||||||||||||
Other operating income, net | (21.9 | ) | ||||||||||||||||||
Operating income | $ | 182.8 | ||||||||||||||||||
Capital spending (excluding business combinations) | $ | 67.6 | $ | 4.2 | $ | 4.0 | $ | 30.5 | $ | 106.3 | ||||||||||
8 | | |
Delek US Holdings, Inc. | ||||||||||||||||||||
Segment Data (Unaudited) | ||||||||||||||||||||
(In millions) | ||||||||||||||||||||
Year Ended December 31, 2019 | ||||||||||||||||||||
Refining | Logistics | Retail | Corporate, Other and Eliminations | Consolidated | ||||||||||||||||
Net revenues (excluding intercompany fees and sales) | $ | 8,095.9 | $ | 323.0 | $ | 838.0 | $ | 41.3 | $ | 9,298.2 | ||||||||||
Intercompany fees and sales | 702.6 | 261.0 | — | (963.6 | ) | — | ||||||||||||||
Operating costs and expenses: | ||||||||||||||||||||
Cost of materials and other | 7,544.5 | 336.5 | 684.7 | (908.5 | ) | 7,657.2 | ||||||||||||||
Operating expenses (excluding depreciation and amortization presented below) | 492.4 | 74.1 | 94.8 | 20.9 | 682.2 | |||||||||||||||
Segment contribution margin | $ | 761.6 | $ | 173.4 | $ | 58.5 | $ | (34.7 | ) | 958.8 | ||||||||||
Depreciation and amortization | 134.3 | 26.7 | 11.2 | 22.1 | 194.3 | |||||||||||||||
General and administrative expenses | 274.7 | |||||||||||||||||||
Other operating income, net | (2.5 | ) | ||||||||||||||||||
Operating income | $ | 492.3 | ||||||||||||||||||
Capital spending (excluding business combinations) | $ | 266.6 | $ | 9.9 | $ | 20.5 | $ | 131.1 | $ | 428.1 | ||||||||||
Year Ended December 31, 2018 | ||||||||||||||||||||
Refining | Logistics | Retail | Corporate, Other and Eliminations | Consolidated | ||||||||||||||||
Net revenues (excluding intercompany fees and sales) | $ | 8,771.4 | $ | 416.8 | $ | 915.4 | $ | 129.5 | $ | 10,233.1 | ||||||||||
Intercompany fees and sales | 839.0 | 240.8 | — | (1,079.8 | ) | — | ||||||||||||||
Operating costs and expenses: | ||||||||||||||||||||
Cost of materials and other | 8,279.9 | 429.1 | 755.8 | (904.3 | ) | 8,560.5 | ||||||||||||||
Operating expenses (excluding depreciation and amortization presented below) | 465.4 | 58.7 | 100.7 | 20.2 | 645.0 | |||||||||||||||
Segment contribution margin | $ | 865.1 | $ | 169.8 | $ | 58.9 | $ | (66.2 | ) | 1,027.6 | ||||||||||
Depreciation and amortization | 133.7 | 26.0 | 24.6 | 15.1 | 199.4 | |||||||||||||||
General and administrative expenses | 247.6 | |||||||||||||||||||
Other operating income, net | (31.3 | ) | ||||||||||||||||||
Operating Income | $ | 611.9 | ||||||||||||||||||
Capital spending (excluding business combinations) | $ | 203.9 | $ | 11.6 | $ | 10.0 | $ | 91.7 | $ | 317.2 | ||||||||||
9 | | |
Refining Segment | Three Months Ended December 31, | Year Ended December 31, | ||||||||||||||
2019 | 2018 | 2019 | 2018 | |||||||||||||
Tyler, TX Refinery | (Unaudited) | (Unaudited) | ||||||||||||||
Days in period | 92 | 92 | 365 | 365 | ||||||||||||
Total sales volume - refined product (average barrels per day)(1) | 75,931 | 79,137 | 76,178 | 78,658 | ||||||||||||
Products manufactured (average barrels per day): | ||||||||||||||||
Gasoline | 42,347 | 44,280 | 40,801 | 42,138 | ||||||||||||
Diesel/Jet | 30,635 | 27,936 | 30,673 | 30,035 | ||||||||||||
Petrochemicals, LPG, NGLs | 1,816 | 2,094 | 2,798 | 2,564 | ||||||||||||
Other | 1,537 | 1,508 | 1,554 | 1,665 | ||||||||||||
Total production | 76,335 | 75,818 | 75,826 | 76,402 | ||||||||||||
Throughput (average barrels per day): | ||||||||||||||||
Crude oil | 70,284 | 66,719 | 70,516 | 70,041 | ||||||||||||
Other feedstocks | 6,355 | 9,448 | 5,873 | 6,770 | ||||||||||||
Total throughput | 76,639 | 76,167 | 76,389 | 76,811 | ||||||||||||
Per barrel of refined product sales: | ||||||||||||||||
Tyler refining margin | $ | 11.09 | $ | 7.19 | $ | 14.09 | $ | 11.88 | ||||||||
Tyler adjusted refining margin | $ | 9.68 | $ | 12.52 | $ | 12.42 | $ | 12.66 | ||||||||
Operating expenses | $ | 4.33 | $ | 4.21 | $ | 3.91 | $ | 3.64 | ||||||||
Crude Slate: (% based on amount received in period) | ||||||||||||||||
WTI crude oil | 100.0 | % | 90.8 | % | 92.7 | % | 83.0 | % | ||||||||
East Texas crude oil | — | % | 8.9 | % | 6.4 | % | 16.3 | % | ||||||||
Other | — | % | 0.3 | % | 0.8 | % | 0.7 | % | ||||||||
El Dorado, AR Refinery | ||||||||||||||||
Days in period | 92 | 92 | 365 | 365 | ||||||||||||
Total sales volume - refined product (average barrels per day)(1) | 74,617 | 62,422 | 62,420 | 71,381 | ||||||||||||
Products manufactured (average barrels per day): | ||||||||||||||||
Gasoline | 37,551 | 33,036 | 27,712 | 33,718 | ||||||||||||
Diesel | 27,263 | 22,194 | 20,753 | 24,609 | ||||||||||||
Petrochemicals, LPG, NGLs | 1,290 | 1,202 | 872 | 1,228 | ||||||||||||
Asphalt | 4,461 | 5,601 | 5,533 | 5,179 | ||||||||||||
Other | 903 | 806 | 735 | 732 | ||||||||||||
Total production | 71,468 | 62,839 | 55,605 | 65,466 | ||||||||||||
Throughput (average barrels per day): | ||||||||||||||||
Crude oil | 69,913 | 59,462 | 54,420 | 65,615 | ||||||||||||
Other feedstocks | 2,007 | 4,508 | 1,576 | 1,313 | ||||||||||||
Total throughput | 71,920 | 63,970 | 55,996 | 66,928 | ||||||||||||
Per barrel of refined product sales: | ||||||||||||||||
El Dorado refining margin | $ | 5.15 | $ | 7.74 | $ | 7.38 | $ | 8.64 | ||||||||
El Dorado adjusted refining margin | $ | 4.24 | 8.41 | $ | 6.89 | $ | 6.28 | |||||||||
Operating expenses | $ | 5.37 | $ | 6.26 | $ | 5.73 | $ | 5.22 | ||||||||
Crude Slate: (% based on amount received in period) | ||||||||||||||||
WTI crude oil | 41.0 | % | 29.2 | % | 49.9 | % | 58.6 | % | ||||||||
Local Arkansas crude oil | 17.9 | % | 23.7 | % | 23.1 | % | 21.2 | % | ||||||||
Other | 41.2 | % | 47.1 | % | 27.0 | % | 20.2 | % | ||||||||
10 | | |
Refining Segment | Three Months Ended December 31, | Year Ended December 31, | ||||||||||||||
2019 | 2018 | 2019 | 2018 | |||||||||||||
Big Spring, TX Refinery | (Unaudited) | (Unaudited) | ||||||||||||||
Days in period - based on date acquired | 92 | 92 | 365 | 365 | ||||||||||||
Total sales volume - refined product (average barrels per day) (1) | 72,559 | 80,809 | 76,413 | 74,721 | ||||||||||||
Products manufactured (average barrels per day): | ||||||||||||||||
Gasoline | 36,578 | 41,534 | 36,352 | 36,596 | ||||||||||||
Diesel/Jet | 27,025 | 29,023 | 27,602 | 26,660 | ||||||||||||
Petrochemicals, LPG, NGLs | 3,705 | 3,824 | 3,746 | 3,646 | ||||||||||||
Asphalt | 2,036 | 1,997 | 1,870 | 1,855 | ||||||||||||
Other | 1,292 | 1,263 | 1,327 | 1,339 | ||||||||||||
Total production | 70,636 | 77,641 | 70,897 | 70,096 | ||||||||||||
Throughput (average barrels per day): | ||||||||||||||||
Crude oil | 72,338 | 73,185 | 72,039 | 67,978 | ||||||||||||
Other feedstocks | (1,790 | ) | 3,273 | (453 | ) | 1,533 | ||||||||||
Total throughput | 70,548 | 76,458 | 71,586 | 69,511 | ||||||||||||
Per barrel of refined product sales: | ||||||||||||||||
Big Spring refining margin | $ | 10.23 | $ | 23.03 | $ | 13.69 | $ | 18.44 | ||||||||
Big Spring adjusted refining margin | $ | 10.06 | $ | 23.51 | $ | 13.56 | $ | 18.55 | ||||||||
Operating expenses | $ | 5.54 | $ | 4.44 | $ | 4.35 | $ | 4.20 | ||||||||
Crude Slate: (% based on amount received in period) | ||||||||||||||||
WTI crude oil | 74.0 | % | 76.8 | % | 75.5 | % | 73.8 | % | ||||||||
WTS crude oil | 26.0 | % | 23.2 | % | 24.5 | % | 26.2 | % | ||||||||
Krotz Springs, LA Refinery | ||||||||||||||||
Days in period - based on date acquired | 92 | 92 | 365 | 365 | ||||||||||||
Total sales volume - refined product (average barrels per day) (1) | 56,576 | 82,566 | 70,511 | 78,902 | ||||||||||||
Products manufactured (average barrels per day): | ||||||||||||||||
Gasoline | 32,848 | 38,810 | 35,026 | 36,729 | ||||||||||||
Diesel/Jet | 24,823 | 32,344 | 28,049 | 31,459 | ||||||||||||
Heavy oils | 1,198 | 1,136 | 1,131 | 1,216 | ||||||||||||
Petrochemicals, LPG, NGLs | 3,296 | 7,328 | 4,647 | 7,224 | ||||||||||||
Other | — | — | 26 | — | ||||||||||||
Total production | 62,165 | 79,618 | 68,879 | 76,628 | ||||||||||||
Throughput (average barrels per day): | ||||||||||||||||
Crude oil | 59,594 | 72,461 | 67,943 | 73,171 | ||||||||||||
Other feedstocks | 317 | 5,590 | (366 | ) | 2,211 | |||||||||||
Total throughput | 59,911 | 78,051 | 67,577 | 75,382 | ||||||||||||
Per barrel of refined product sales: | ||||||||||||||||
Krotz Springs refining margin | $ | 8.72 | $ | 11.64 | $ | 10.16 | $ | 9.48 | ||||||||
Krotz Springs adjusted refining margin | $ | 7.98 | $ | 12.56 | $ | 9.70 | $ | 8.61 | ||||||||
Operating expenses | $ | 5.55 | $ | 3.94 | $ | 4.46 | $ | 3.84 | ||||||||
Crude Slate: (% based on amount received in period) | ||||||||||||||||
WTI Crude | 65.4 | % | 59.1 | % | 72.0 | % | 61.3 | % | ||||||||
Gulf Coast Sweet Crude | 34.6 | % | 40.9 | % | 28.0 | % | 38.7 | % | ||||||||
(1) | Includes inter-refinery sales and sales to other segments which are eliminated in consolidation. See tables below. |
11 | | |
Included in the refinery statistics above are the following inter-refinery and sales to other segments:
Inter-refinery Sales | ||||||||||||
Three Months Ended December 31, | Year Ended December 31, | |||||||||||
(in barrels per day) | 2019 | 2018 | 2019 | 2018 | ||||||||
(Unaudited) | (Unaudited) | |||||||||||
Tyler refined product sales to other Delek refineries | 908 | 924 | 894 | 824 | ||||||||
El Dorado refined product sales to other Delek refineries | 37,743 | 41,066 | 38,394 | 28,737 | ||||||||
Big Spring refined product sales to other Delek refineries | 398 | 728 | 990 | 554 | ||||||||
Krotz Springs refined product sales to other Delek refineries | 12,552 | 1,200 | 9,734 | 19,644 | ||||||||
Refinery Sales to Other Segments | ||||||||||||
Three Months Ended December 31, | Year Ended December 31, | |||||||||||
(in barrels per day) | 2019 | 2018 | 2019 | 2018 | ||||||||
(Unaudited) | (Unaudited) | |||||||||||
Tyler refined product sales to other Delek segments | 429 | 2,106 | 252 | 986 | ||||||||
El Dorado refined product sales to other Delek segments | 11 | 631 | 83 | 562 | ||||||||
Big Spring refined product sales to other Delek segments | 24,075 | 24,743 | 25,223 | 25,661 | ||||||||
Krotz Springs refined product sales to other Delek segments | 1,030 | — | 462 | — | ||||||||
Pricing statistics | ||||||||||||||||
(average for the period presented) | ||||||||||||||||
Three Months Ended December 31, | Year Ended December 31, | |||||||||||||||
2019 | 2018 | 2019 | 2018 | |||||||||||||
(Unaudited) | (Unaudited) | |||||||||||||||
WTI — Cushing crude oil (per barrel) | $ | 56.88 | $ | 59.97 | $ | 56.99 | $ | 65.20 | ||||||||
WTI — Midland crude oil (per barrel) | $ | 57.80 | $ | 53.64 | $ | 56.31 | $ | 57.84 | ||||||||
WTS -- Midland crude oil (per barrel) (1) | $ | 57.21 | $ | 53.34 | $ | 56.27 | $ | 57.43 | ||||||||
LLS crude oil (per barrel) (1) | $ | 60.68 | $ | 67.48 | $ | 62.65 | $ | 70.19 | ||||||||
Brent crude oil (per barrel) | $ | 62.39 | $ | 68.69 | $ | 64.14 | $ | 71.69 | ||||||||
US Gulf Coast 5-3-2 crack spread (per barrel) (1) | $ | 12.40 | $ | 12.50 | $ | 13.78 | $ | 13.21 | ||||||||
US Gulf Coast 3-2-1 crack spread (per barrel) (1) | $ | 14.86 | $ | 15.42 | $ | 16.71 | $ | 16.63 | ||||||||
US Gulf Coast 2-1-1 crack spread (per barrel) (1) | $ | 10.40 | $ | 6.47 | $ | 9.90 | $ | 9.58 | ||||||||
US Gulf Coast Unleaded Gasoline (per gallon) | $ | 1.58 | $ | 1.59 | $ | 1.63 | $ | 1.83 | ||||||||
Gulf Coast Ultra low sulfur diesel (per gallon) | $ | 1.87 | $ | 2.01 | $ | 1.88 | $ | 2.05 | ||||||||
US Gulf Coast high sulfur diesel (per gallon) | $ | 1.76 | $ | 1.92 | $ | 1.76 | $ | 1.92 | ||||||||
Natural gas (per MMBTU) | $ | 2.41 | $ | 3.72 | $ | 2.53 | $ | 3.07 | ||||||||
(1) | For our Tyler and El Dorado refineries, we compare our per barrel refining product margin to the Gulf Coast 5-3-2 crack spread consisting of WTI Cushing crude, U.S. Gulf Coast CBOB and U.S, Gulf Coast Pipeline No. 2 heating oil (high sulfur diesel). For our Big Spring refinery, we compare our per barrel refined product margin to the Gulf Coast 3-2-1 crack spread consisting of WTI Cushing crude, Gulf Coast 87 Conventional gasoline and Gulf Coast ultra-low sulfur diesel, and for our Krotz Springs refinery, we compare our per barrel refined product margin to the Gulf Coast 2-1-1 crack spread consisting of LLS crude oil, Gulf Coast 87 Conventional gasoline and U.S, Gulf Coast Pipeline No. 2 heating oil (high sulfur diesel). The Tyler refinery's crude oil input is primarily WTI Midland and east Texas, while the El Dorado refinery's crude input is primarily a combination of WTI Midland, local Arkansas and other domestic inland crude oil. The Big Spring refinery’s crude oil input is primarily comprised of WTS and WTI Midland. The Krotz Springs refinery’s crude oil input is primarily comprised of LLS and WTI Midland. |
12 | | |
Delek US Holdings, Inc. | ||||||||||||||||
Reconciliation of Refining Margin per barrel to Adjusted Refining Margin per barrel (1) | ||||||||||||||||
$ in millions, except per share data | ||||||||||||||||
Three Months Ended December 31, | Year Ended December 31, | |||||||||||||||
2019 | 2018 | 2019 | 2018 | |||||||||||||
(Unaudited) | (Unaudited) | |||||||||||||||
Tyler (2) | ||||||||||||||||
Reported refining margin, $ per barrel | $ | 11.09 | $ | 7.19 | $ | 14.09 | $ | 11.88 | ||||||||
Adjustments: | ||||||||||||||||
LCM net inventory valuation (benefit) loss | (1.41 | ) | 5.33 | (1.37 | ) | 1.32 | ||||||||||
RIN waiver | — | — | (0.30 | ) | — | |||||||||||
Biodiesel tax credit allocated to refinery | — | — | — | (0.54 | ) | |||||||||||
Adjusted refining margin $/bbl | $ | 9.68 | $ | 12.52 | $ | 12.42 | $ | 12.66 | ||||||||
El Dorado (3) | ||||||||||||||||
Reported refining margin, $ per barrel | $ | 5.15 | $ | 7.74 | $ | 7.38 | $ | 8.64 | ||||||||
Adjustments: | ||||||||||||||||
LCM net inventory valuation (benefit) loss | (0.91 | ) | 0.67 | (0.17 | ) | 0.15 | ||||||||||
RIN waiver | — | — | (0.32 | ) | (2.28 | ) | ||||||||||
Biodiesel tax credit allocated to refinery | — | — | — | (0.23 | ) | |||||||||||
Adjusted refining margin $/bbl | $ | 4.24 | $ | 8.41 | $ | 6.89 | $ | 6.28 | ||||||||
Big Spring (4) | ||||||||||||||||
Reported refining margin, $ per barrel | $ | 10.23 | $ | 23.03 | $ | 13.69 | $ | 18.44 | ||||||||
Adjustments: | ||||||||||||||||
LCM net inventory valuation (benefit) loss | (0.17 | ) | 0.48 | (0.13 | ) | 0.11 | ||||||||||
Adjusted refining margin $/bbl | $ | 10.06 | $ | 23.51 | $ | 13.56 | $ | 18.55 | ||||||||
Krotz Springs (5) | ||||||||||||||||
Reported refining margin, $ per barrel | $ | 8.72 | $ | 11.64 | $ | 10.16 | $ | 9.48 | ||||||||
Adjustments: | ||||||||||||||||
LCM net inventory valuation (benefit) loss | (0.74 | ) | 0.92 | (0.27 | ) | 0.23 | ||||||||||
RIN waiver | — | — | (0.19 | ) | (1.10 | ) | ||||||||||
Adjusted refining margin $/bbl | $ | 7.98 | $ | 12.56 | $ | 9.70 | $ | 8.61 | ||||||||
(1) | Adjusted refining margin per barrel is presented to provide a measure to evaluate performance excluding inventory valuation adjustments and other items at the individual refinery level. Delek US believes that the presentation of adjusted measures provides useful information to investors in assessing its results of operations at each refinery. Because adjusted refining margin per barrel may be defined differently by other companies in its industry, Delek US' definition may not be comparable to similarly titled measures of other companies. |
(2) | Tyler adjusted refining margins exclude the following items. |
Net inventory valuation benefit/loss - There was approximately $9.9 million of valuation benefit and $38.8 million of valuation loss in the fourth quarter 2019 and 2018, respectively. There was approximately $38.2 million of valuation benefit and $37.9 million of valuation loss for the year ended December 31, 2019 and 2018, respectively. These amounts resulted from lower of cost or market adjustments on LIFO inventory in the respective periods.
Biodiesel tax credit allocation - There was approximately $15.4 million related to the 2017 retroactive biodiesel tax credit that was allocated to Tyler in the first quarter of 2018 that is included in the renewables portion of the refining segment for the year ended December 31, 2018.
RIN waiver - In August 2019, the Tyler,Texas refinery received approval from the Environmental Protection Agency for a small refinery exemption from the requirements of the renewable fuel standard for the 2018 calendar year. This waiver equated to a benefit of approximately $8.5 million recognized in the third quarter 2019.
13 | | |
(3) | El Dorado adjusted refining margins exclude the following items. |
Net inventory valuation loss - There was approximately $6.3 million of valuation benefit and $3.9 million of valuation loss in the fourth quarter 2019 and 2018, respectively. There was approximately $3.8 million of valuation benefit and $3.8 million of valuation loss for the year ended December 31, 2019 and 2018, respectively. These amounts resulted from lower of cost or market adjustments on FIFO inventory in the respective periods.
RIN waiver - In August 2019, the El Dorado, Arkansas refinery received approval from the Environmental Protection Agency for a small refinery exemption from the requirements of the renewable fuel standard for the 2018 calendar year. This waiver equated to a benefit of approximately $7.4 million recognized in the third quarter 2019. In March 2018, the El Dorado refinery received approval from the Environmental Protection Agency for a small refinery exemption from the requirements of the renewable fuel standard for the 2017 calendar year. This waiver equated to a benefit of approximately $59.3 million recognized in the first quarter 2018.
Biodiesel tax credit allocation - There was approximately $6.0 million related to the 2017 retroactive biodiesel tax credit that was allocated to El Dorado in the first quarter of 2018 that is included in the renewables portion of the refining segment for the year ended December 31, 2018.
(4) | Big Spring adjusted refining margins exclude the following items. |
Net inventory valuation loss - There was approximately $1.1 million of valuation benefit and $3.5 million of valuation loss in the fourth quarter 2019 and 2018, respectively. There was approximately $3.5 million of valuation benefit and $3.2 million of valuation loss for the year ended December 31, 2019 and 2018, respectively. These amounts resulted from lower of cost or market adjustments on FIFO inventory in the respective periods.
(5) | Krotz Springs adjusted refining margins exclude the following items. |
Net inventory valuation loss - There was approximately $3.9 million of valuation benefit and $7.0 million of valuation loss in the fourth quarter 2019 and 2018, respectively. There was approximately $7.0 million of valuation benefit and $7.0 million of valuation loss for the year ended December 31, 2019 and 2018, respectively. These amounts resulted from lower of cost or market adjustments on FIFO inventory in the respective periods.
RIN waiver - In August 2019, the Krotz Springs, Louisiana refinery received approval from the Environmental Protection Agency for a small refinery exemption from the requirements of the renewable fuel standard for the 2018 calendar year. This waiver equated to a benefit of approximately $4.9 million recognized in the third quarter 2019. In March 2018, the Krotz Springs refinery received approval from the Environmental Protection Agency for a small refinery exemption from the requirements of the renewable fuel standard for the 2017 calendar year. This waiver equated to a benefit of approximately $31.6 million recognized in the first quarter 2018.
Logistics Segment | Three Months Ended December 31, | Year Ended December 31, | ||||||||||||||
2019 | 2018 | 2019 | 2018 | |||||||||||||
(Unaudited) | (Unaudited) | |||||||||||||||
Pipelines & Transportation: (average bpd) | ||||||||||||||||
Lion Pipeline System: | ||||||||||||||||
Crude pipelines (non-gathered) | 55,521 | 45,416 | 42,918 | 51,992 | ||||||||||||
Refined products pipelines | 53,960 | 41,496 | 37,716 | 45,728 | ||||||||||||
SALA Gathering System | 30,917 | 15,536 | 21,869 | 16,571 | ||||||||||||
East Texas Crude Logistics System | 16,612 | 13,602 | 19,927 | 15,696 | ||||||||||||
Wholesale Marketing & Terminalling: | ||||||||||||||||
East Texas - Tyler Refinery sales volumes (average bpd) (1) | 73,016 | 77,896 | 74,206 | 77,487 | ||||||||||||
West Texas marketing throughputs (average bpd) | 9,972 | 12,938 | 11,075 | 13,323 | ||||||||||||
West Texas gross margin per barrel | $ | 3.12 | $ | 4.60 | $ | 4.44 | $ | 5.57 | ||||||||
Big Spring Marketing - Refinery sales volume (average bpd) (for period owned) (2) | 79,985 | 84,135 | 82,695 | 81,117 | ||||||||||||
Terminalling throughputs (average bpd) (3) | 160,298 | 164,028 | 160,075 | 161,284 | ||||||||||||
(1) Excludes jet fuel and petroleum coke.
(2) Throughputs for the year ended December 31, 2018 are for the 306 days we marketed certain finished products produced at or sold from the Big Spring Refinery following the execution of the Big Spring Marketing Agreement, effective March 1, 2018.
(3) Consists of terminalling throughputs at our Tyler, Big Spring, Big Sandy and Mount Pleasant, Texas, our El Dorado and North Little Rock, Arkansas and our Memphis and Nashville, Tennessee terminals. Throughputs for the Big Spring terminal are for the 306 days we operated the terminal following its acquisition effective March 1, 2018. Barrels per day are calculated for only the days we operated each terminal. Total throughput for the year ended December 31, 2018 was 56.6 million barrels, which averaged 155,193 barrels per day for the period.
14 | | |
Retail Segment | Three Months Ended December 31, | Year Ended December 31, | ||||||||||||||
2019 | 2018 | 2019 | 2018 | |||||||||||||
(Unaudited) | (Unaudited) | |||||||||||||||
Number of stores (end of period) | 252 | 279 | 252 | 279 | ||||||||||||
Average number of stores | 258 | 295 | 266 | 295 | ||||||||||||
Retail fuel sales (thousands of gallons) | 51,518 | 53,309 | 214,094 | 217,118 | ||||||||||||
Average retail gallons per average number of stores (in thousands) | 205 | 197 | 827 | 801 | ||||||||||||
Retail fuel margin ($ per gallon) (1) | $ | 0.29 | $ | 0.30 | $ | 0.28 | $ | 0.24 | ||||||||
Merchandise sales (in millions) | $ | 72.9 | $ | 81.0 | $ | 313.1 | $ | 339.0 | ||||||||
Merchandise sales per average number of stores (in millions) | $ | 0.3 | $ | 0.3 | $ | 1.2 | $ | 1.1 | ||||||||
Merchandise margin % | 30.6 | % | 30.2 | % | 30.8 | % | 30.9 | % | ||||||||
Same-Store Comparison | Three Months Ended December 31, 2019 | Three Months Ended December 31, 2018 | Year Ended December 31, 2019 | ||||||
Change in same-store fuel gallons sold (2) | 2.4 % | 0.1 | % | 2.9 | % | ||||
Change in same-store merchandise sales(2) | 0.5 | % | (0.7 | )% | (1.0 | )% | |||
(1) | Retail fuel margin represents gross margin on fuel sales in the retail segment, and is calculated as retail fuel sales revenue less retail fuel cost of sales. The retail fuel margin per gallon calculation is derived by dividing retail fuel margin by the total retail fuel gallons sold for the period. |
(2) | Same-store comparisons include period-over-period increases or decreases in specified metrics for stores that were in service at both the beginning of the earliest period and the end of the most recent period used in the comparison. |
15 | | |
Delek US Holdings, Inc. | ||||||||||||||||
Reconciliation of Amounts Reported Under U.S. GAAP | ||||||||||||||||
$ in millions | ||||||||||||||||
Three Months Ended December 31, | Year Ended December 31, | |||||||||||||||
Reconciliation of Net Income (Loss) attributable to Delek to Adjusted Net Income | 2019 | 2018 | 2019 | 2018 | ||||||||||||
(Unaudited) | (Unaudited) | |||||||||||||||
Reported net income attributable to Delek | $ | 32.7 | $ | 121.6 | $ | 310.6 | $ | 340.1 | ||||||||
Adjustments | ||||||||||||||||
Net inventory valuation (benefit) loss | (20.8 | ) | 53.4 | (52.3 | ) | 51.3 | ||||||||||
Tax effect of inventory valuation | 4.5 | (11.6 | ) | 11.4 | (11.1 | ) | ||||||||||
Net after tax inventory valuation loss (benefit) | (16.3 | ) | 41.8 | (40.9 | ) | 40.2 | ||||||||||
Environmental indemnification proceeds | — | (20.0 | ) | — | (20.0 | ) | ||||||||||
Tax effect of environmental indemnification proceeds | — | 4.5 | — | 4.5 | ||||||||||||
Net after tax environmental indemnification proceeds | — | (15.5 | ) | — | (15.5 | ) | ||||||||||
Contract termination/modification charges | — | 6.2 | — | 6.2 | ||||||||||||
Tax effect of contract termination/modification charges | — | (1.4 | ) | — | (1.4 | ) | ||||||||||
Net after tax contract termination/modification charges | — | 4.8 | — | 4.8 | ||||||||||||
Adjusted unrealized hedging loss (gain) | 17.1 | (27.1 | ) | 26.1 | (28.6 | ) | ||||||||||
Tax effect of adjusted unrealized hedging | (3.8 | ) | 6.1 | (5.9 | ) | 6.4 | ||||||||||
Net after tax adjusted unrealized hedging loss (gain) | 13.3 | (21.0 | ) | 20.2 | (22.2 | ) | ||||||||||
Transaction related expenses | — | 0.9 | — | 16.0 | ||||||||||||
Tax effect of transaction related expenses | — | (0.2 | ) | — | (3.4 | ) | ||||||||||
Net after tax transaction related expenses | — | 0.7 | — | 12.6 | ||||||||||||
Tax Cuts and Jobs Act adjustment | — | (2.7 | ) | — | (0.6 | ) | ||||||||||
Tax effect of Tax Cuts and Jobs Act adjustment | — | — | — | — | ||||||||||||
Net after tax Tax Cuts and Jobs Act adjustment | — | (2.7 | ) | — | (0.6 | ) | ||||||||||
Loss on extinguishment of debt | — | — | — | 9.1 | ||||||||||||
Tax effect of loss on extinguishment of debt | — | — | — | (2.1 | ) | |||||||||||
Net after tax loss on extinguishment of debt | — | — | — | 7.0 | ||||||||||||
Impairment loss on assets held for sale | — | — | — | 27.5 | ||||||||||||
Tax effect of impairment loss on assets held for sale | — | — | — | (0.5 | ) | |||||||||||
Net after tax impairment loss on assets held for sale | — | — | — | 27.0 | ||||||||||||
Gain on sale of the asphalt business | — | (0.1 | ) | — | (13.3 | ) | ||||||||||
Tax effect of gain on sale of the asphalt business | — | — | — | 2.9 | ||||||||||||
Net after tax gain on sale of the asphalt business | — | (0.1 | ) | — | (10.4 | ) | ||||||||||
Retroactive biodiesel tax credit (1) | (36.0 | ) | 36.0 | (36.0 | ) | 11.4 | ||||||||||
Tax effect of retroactive biodiesel tax credit | 0.1 | (0.1 | ) | 0.1 | (0.1 | ) | ||||||||||
Net after tax retroactive biodiesel tax credit | (35.9 | ) | 35.9 | (35.9 | ) | 11.3 | ||||||||||
Non-operating write-off of pre-acquisition asset | 4.8 | — | 4.8 | — | ||||||||||||
Tax effect of non-operating write-off of pre-acquisition asset | (1.1 | ) | — | (1.1 | ) | — | ||||||||||
Net after tax of non-operating write-off of pre-acquisition asset | 3.7 | — | 3.7 | — | ||||||||||||
Discontinued operations (income) loss | (7.6 | ) | 0.2 | (6.6 | ) | 10.9 | ||||||||||
Tax effect of discontinued operations | 1.6 | — | 1.4 | (2.2 | ) | |||||||||||
Net after tax discontinued operations (income) loss | (6.0 | ) | 0.2 | (5.2 | ) | 8.7 | ||||||||||
16 | | |
Income attributable to non-controlling interest of discontinued operations | — | — | — | 10.5 | ||||||||||||
Tax effect of income attributable to non-controlling interest of discontinued operations | — | — | — | (2.4 | ) | |||||||||||
Net after tax income attributable to non-controlling interest of discontinued operations | — | — | — | 8.1 | ||||||||||||
Tax adjustment related to unrealizable deferred taxes created in Big Spring Asset Acquisition | — | — | — | 5.5 | ||||||||||||
Total after tax adjustments | (41.2 | ) | 44.1 | (58.1 | ) | 76.5 | ||||||||||
Adjusted net (loss) income | $ | (8.5 | ) | $ | 165.7 | $ | 252.5 | $ | 416.6 | |||||||
(1) The portion of the retroactive biodiesel tax credit that was attributable to 2018 has been adjusted out of both the three months and year ended December 31, 2019, and has been added to the three months and year ended December 31, 2018 for comparability. Additionally, the retroactive 2017 biodiesel tax credit that was enacted during the first quarter of 2018 has been adjusted out of the adjusted net income for the year ended December 31, 2018, also for comparability.
Delek US Holdings, Inc. | ||||||||||||||||
Reconciliation of Amounts Reported Under U.S. GAAP | ||||||||||||||||
per share data | ||||||||||||||||
Three Months Ended December 31, | Year Ended December 31, | |||||||||||||||
Reconciliation of U.S. GAAP Income (Loss) per share to Adjusted Net Income per share | 2019 | 2018 | 2019 | 2018 | ||||||||||||
(Unaudited) | (Unaudited) | |||||||||||||||
Reported diluted income per share | $ | 0.44 | $ | 1.48 | $ | 4.06 | $ | 3.95 | ||||||||
Adjustments, after tax (per share) (1) | ||||||||||||||||
Net inventory valuation (benefit) loss | (0.22 | ) | 0.51 | (0.53 | ) | 0.46 | ||||||||||
Environmental indemnification proceeds | — | (0.19 | ) | — | (0.18 | ) | ||||||||||
Contract termination/modification charges | — | 0.06 | — | 0.06 | ||||||||||||
Adjusted unrealized hedging loss (gain) | 0.18 | (0.25 | ) | 0.26 | (0.26 | ) | ||||||||||
Transaction related expenses | — | 0.01 | — | 0.15 | ||||||||||||
Tax Cuts and Jobs Act adjustment | — | (0.03 | ) | — | (0.01 | ) | ||||||||||
Impairment loss on assets held for sale | — | — | — | 0.31 | ||||||||||||
Gain on sale of the asphalt business | — | — | — | (0.12 | ) | |||||||||||
Loss on extinguishment of debt | — | — | — | 0.08 | ||||||||||||
Retroactive biodiesel tax credit | (0.48 | ) | 0.44 | (0.47 | ) | 0.13 | ||||||||||
Non-operating write-off of pre-acquisition asset | 0.05 | — | 0.05 | — | ||||||||||||
Discontinued operations (income) loss | (0.08 | ) | — | (0.07 | ) | 0.10 | ||||||||||
Net income attributable to non-controlling interest of discontinued operations | — | — | — | 0.09 | ||||||||||||
Tax adjustment related to unrealizable deferred taxes created in Big Spring Asset Acquisition | — | — | — | 0.07 | ||||||||||||
Total adjustments | (0.55 | ) | 0.55 | (0.76 | ) | 0.88 | ||||||||||
Adjustment for economic benefit of note hedge related to Senior Convertible Notes (2) | — | — | — | 0.09 | ||||||||||||
Adjusted net (loss) income per share | $ | (0.11 | ) | $ | 2.03 | $ | 3.30 | $ | 4.92 | |||||||
(1) The tax calculation is based on the appropriate marginal income tax rate related to each adjustment and for each respective time period, which is applied to the adjusted items in the calculation of adjusted net income in all periods.
(2) Delek US had a convertible note hedge transaction in effect to offset the economic dilution of the additional shares from the Convertible Notes that matured on September 17, 2018.
17 | | |
Delek US Holdings, Inc. | ||||||||||||||||
Reconciliation of Amounts Reported Under U.S. GAAP | ||||||||||||||||
$ in millions | ||||||||||||||||
Three Months Ended December 31, | Year Ended December 31, | |||||||||||||||
Reconciliation of Net Income attributable to Delek to Adjusted EBITDA | 2019 | 2018 | 2019 | 2018 | ||||||||||||
(Unaudited) | (Unaudited) | |||||||||||||||
Reported net income attributable to Delek | $ | 32.7 | $ | 121.6 | $ | 310.6 | $ | 340.1 | ||||||||
Add: | ||||||||||||||||
Interest expense, net | 33.4 | 27.9 | 119.8 | 120.1 | ||||||||||||
Loss on extinguishment of debt | — | — | — | 9.1 | ||||||||||||
Income tax expense - continuing operations | (12.1 | ) | 29.6 | 71.7 | 101.9 | |||||||||||
Depreciation and amortization | 47.6 | 53.0 | 194.3 | 199.4 | ||||||||||||
EBITDA | 101.6 | 232.1 | 696.4 | 770.6 | ||||||||||||
Adjustments | ||||||||||||||||
Net inventory valuation (benefit) loss | (20.8 | ) | 53.4 | (52.3 | ) | 51.3 | ||||||||||
Environmental indemnification proceeds | — | (20.0 | ) | — | (20.0 | ) | ||||||||||
Contract termination charges | — | 6.2 | — | 6.2 | ||||||||||||
Adjusted unrealized hedging loss (gain) | 17.1 | (27.1 | ) | 26.1 | (28.6 | ) | ||||||||||
Transaction related expenses | — | 0.9 | — | 16.0 | ||||||||||||
Impairment loss on assets held for sale | — | — | — | 27.5 | ||||||||||||
Gain on sale of the asphalt business | — | (0.1 | ) | — | (13.3 | ) | ||||||||||
Retroactive biodiesel tax credit (1) | (36.0 | ) | 36.0 | (36.0 | ) | 11.4 | ||||||||||
Non-operating write-off of pre-acquisition asset | 4.8 | — | 4.8 | — | ||||||||||||
Discontinued operations (income) loss, net of tax | (6.0 | ) | 0.2 | (5.2 | ) | 8.7 | ||||||||||
Net income attributable to non-controlling interest | 5.3 | 5.8 | 25.6 | 34.8 | ||||||||||||
Total adjustments | (35.6 | ) | 55.3 | (37.0 | ) | 94.0 | ||||||||||
Adjusted EBITDA | $ | 66.0 | $ | 287.4 | $ | 659.4 | $ | 864.6 | ||||||||
(1) The portion of the retroactive biodiesel tax credit that was attributable to 2018 has been adjusted out of both the three months and year ended December 31, 2019, and has been added to the three months and year ended December 31, 2018 for comparability. Additionally, the retroactive 2017 biodiesel tax credit that was enacted during the first quarter of 2018 has been adjusted out of the adjusted net income for the year ended December 31, 2018, also for comparability.
18 | | |
Three Months Ended December 31, | Year Ended December 31, | |||||||||||||||
Reconciliation of Refining Segment Gross Margin to Refining Margin | 2019 | 2018 | 2019 | 2018 | ||||||||||||
(Unaudited) | (Unaudited) | |||||||||||||||
Net revenues | $ | 2,161.9 | $ | 2,292.0 | $ | 8,798.5 | $ | 9,610.4 | ||||||||
Cost of sales | 2,035.8 | 2,091.3 | 8,171.2 | 8,879.0 | ||||||||||||
Gross margin | 126.1 | 200.7 | 627.3 | 731.4 | ||||||||||||
Add back (items included in cost of sales): | ||||||||||||||||
Operating expenses (excluding depreciation and amortization) | 135.7 | 118.7 | 492.4 | 465.4 | ||||||||||||
Depreciation and amortization | 35.4 | 34.6 | 134.3 | 133.7 | ||||||||||||
Refining margin | $ | 297.2 | $ | 354.0 | $ | 1,254.0 | $ | 1,330.5 | ||||||||
Three Months Ended December 31, | Year Ended December 31, | |||||||||||||||
Reconciliation of Unrealized (Gains) Losses on Economic Hedge Commodity Derivatives Not Designated as Hedges to Adjusted Unrealized Hedging (Gains) Losses | 2019 | 2018 | 2019 | 2018 | ||||||||||||
(Unaudited) | (Unaudited) | |||||||||||||||
Unrealized loss (gain) on economic hedge commodity derivatives not designated as hedges | $ | 10.9 | $ | (29.3 | ) | $ | 41.0 | $ | (32.1 | ) | ||||||
Less: Net effect of settlement timing differences | ||||||||||||||||
Portion of current period unrealized loss (gain) where the instrument has matured but has not cash settled as of period end | 6.8 | (8.1 | ) | 6.8 | (8.1 | ) | ||||||||||
Less: Prior period unrealized loss (gain) where the instrument had matured but had not cash settled as of prior period end | 13.0 | (5.9 | ) | (8.1 | ) | (4.6 | ) | |||||||||
Total net effect of settlement timing differences | (6.2 | ) | (2.2 | ) | 14.9 | (3.5 | ) | |||||||||
Adjusted unrealized hedging losses (gains) | $ | 17.1 | $ | (27.1 | ) | $ | 26.1 | $ | (28.6 | ) | ||||||
Investor/Media Relations Contacts:
Blake Fernandez, Senior Vice President of Investor Relations and Market Intelligence, 615-224-1312
Jeb Bachmann, Manager of Investor Relations and Market Intelligence, 615-224-1118
Lenny Raymond, Manager of Investor Relations and Market Intelligence, 615-224-0828
Keith Johnson, Vice President of Investor Relations, 615-435-1366
Media/Public Affairs Contact:
Michael P. Ralsky, Vice President - Government Affairs, Public Affairs & Communications, 615-435-1407
19 | | |
Exhibit 99.2 Delek US Holdings, Inc. Fourth Quarter 2019 Earnings Call February 26, 2020
Disclaimers Forward Looking Statements: Delek US Holdings, Inc. (“Delek US”) and Delek Logistics Partners, LP (“Delek Logistics”; and collectively with Delek US, “we” or “our”) are traded on the New York Stock Exchange in the United States under the symbols “DK” and ”DKL”, respectively. These slides and any accompanying oral and written presentations contain forward-looking statements within the meaning of federal securities laws that are based upon current expectations and involve a number of risks and uncertainties. Statements concerning current estimates, expectations and projections about future results, performance, prospects, opportunities, plans, actions and events and other statements, concerns, or matters that are not historical facts are “forward-looking statements,” as that term is defined under the federal securities laws. These forward-looking statements include, but are not limited to, the statements regarding the following: financial and operating guidance for future and uncompleted financial periods; future crude slates; financial strength and flexibility; potential for and projections of growth; return of cash to shareholders, stock repurchases and the payment of dividends, including the amount and timing thereof; crude oil throughput; crude oil market trends, including production, quality, pricing, demand, imports, exports and transportation costs; light production from shale plays and Permian growth; differentials including increases, trends and the impact thereof on crack spreads and refineries; pipeline takeaway capacity and projects related thereto; refinery complexity, configurations, utilization, crude oil slate flexibility, capacities, equipment limits and margins; the ability to add flexibility and increase margin potential at the Krotz Springs refinery; improved product netbacks; the performance of our joint venture investments, including Red River and Wink to Webster, and the benefits, flexibility, returns and EBITDA therefrom; our ability to execute on the Big Spring Gathering System and the benefits, flexibility, returns and EBITDA therefrom; the potential for, and estimates of cost savings and other benefits from, acquisitions, divestitures, dropdowns and financing activities; divestiture of non-core assets and matters pertaining thereto; the attainment of certain regulatory benefits; retail growth and the opportunities and value derived therefrom; long-term value creation from capital allocation; execution of strategic initiatives and the benefits therefrom; and access to crude oil and the benefits therefrom. Words such as "may," "will," "should," "could," "would," "predicts," "potential," "continue," "expects," "anticipates," "future," "intends," "plans," "believes," "estimates," "appears," "projects" and similar expressions, as well as statements in future tense, identify forward-looking statements. Investors are cautioned that the following important factors, among others, may affect these forward-looking statements: uncertainty related to timing and amount of value returned to shareholders; risks and uncertainties with respect to the quantities and costs of crude oil we are able to obtain and the price of the refined petroleum products we ultimately sell; risks related to Delek US’ exposure to Permian Basin crude oil, such as supply, pricing, production and transportation capacity; gains and losses from derivative instruments; management's ability to execute its strategy of growth through acquisitions and the transactional risks associated with acquisitions and dispositions; acquired assets may suffer a diminishment in fair value as a result of which we may need to record a write-down or impairment in carrying value of the asset; changes in the scope, costs, and/or timing of capital and maintenance projects; the ability of the Wink to Webster joint venture to construct the long-haul pipeline; the ability of the Red River joint venture to expand the Red River pipeline; the ability to grow the Big Spring Gathering System; operating hazards inherent in transporting, storing and processing crude oil and intermediate and finished petroleum products; our competitive position and the effects of competition; the projected growth of the industries in which we operate; general economic and business conditions affecting the geographic areas in which we operate; and other risks contained in Delek US’ and Delek Logistics’ filings with the United States Securities and Exchange Commission. Forward-looking statements should not be read as a guarantee of future performance or results, and will not be accurate indications of the times at, or by which such performance or results will be achieved. Forward-looking information is based on information available at the time and/or management’s good faith belief with respect to future events, and is subject to risks and uncertainties that could cause actual performance or results to differ materially from those expressed in the statements. Neither Delek US nor Delek Logistics undertakes any obligation to update or revise any such forward-looking statements. Non-GAAP Disclosures: Delek US and Delek Logistics believe that the presentation of adjusted net income, adjusted earnings per share (“adjusted EPS”), earnings before interest, taxes, depreciation and amortization ("EBITDA") and adjusted EBITDA provide useful information to investors in assessing their financial condition, results of operations and cash flow their business is generating. Adjusted net income, adjusted EPS, EBITDA and adjusted EBITDA should not be considered as alternatives to net income, operating income, cash from operations or any other measure of financial performance or liquidity presented in accordance with U.S. GAAP. Adjusted net income, adjusted EPS, EBITDA and adjusted EBITDA have important limitations as analytical tools because they exclude some, but not all, items that affect net income. Additionally, because adjusted net income, adjusted EPS, EBITDA and adjusted EBITDA may be defined differently by other companies in its industry, Delek US' and Delek Logistics’ definitions may not be comparable to similarly titled measures of other companies, thereby diminishing their utility. Please see reconciliations of adjusted net income, adjusted EPS, EBITDA and adjusted EBITDA to their most directly comparable financial measures calculated and presented in accordance with U.S. GAAP in the appendix. 2
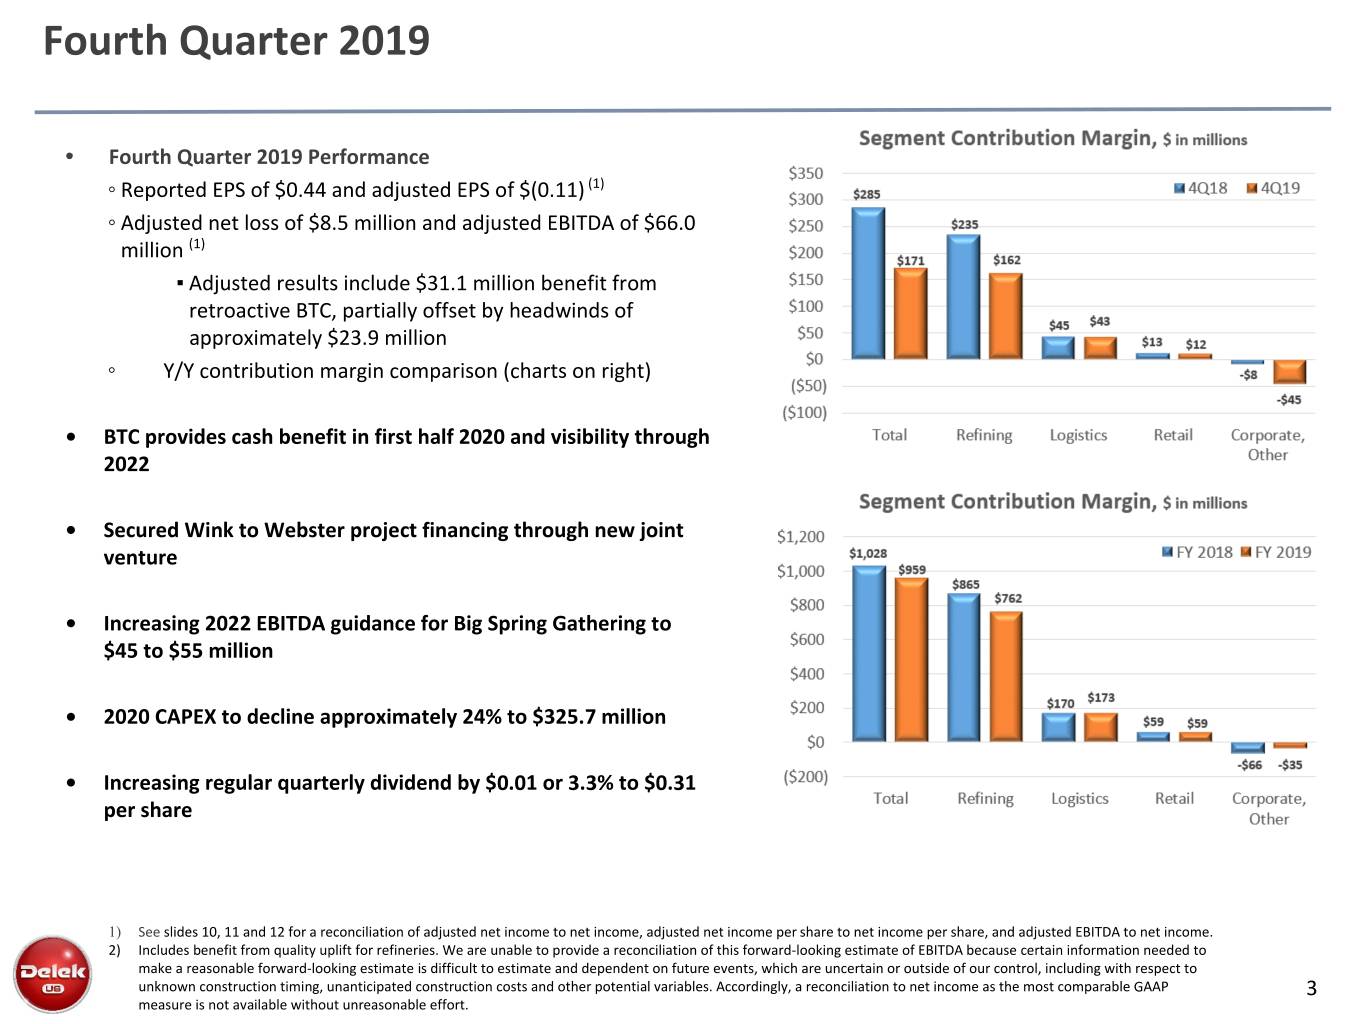
Fourth Quarter 2019 • Fourth Quarter 2019 Performance ◦ Reported EPS of $0.44 and adjusted EPS of $(0.11) (1) ◦ Adjusted net loss of $8.5 million and adjusted EBITDA of $66.0 million (1) ▪ Adjusted results include $31.1 million benefit from retroactive BTC, partially offset by headwinds of approximately $23.9 million ◦ Y/Y contribution margin comparison (charts on right) • BTC provides cash benefit in first half 2020 and visibility through 2022 • Secured Wink to Webster project financing through new joint venture • Increasing 2022 EBITDA guidance for Big Spring Gathering to $45 to $55 million • 2020 CAPEX to decline approximately 24% to $325.7 million • Increasing regular quarterly dividend by $0.01 or 3.3% to $0.31 per share 1) See slides 10, 11 and 12 for a reconciliation of adjusted net income to net income, adjusted net income per share to net income per share, and adjusted EBITDA to net income. 2) Includes benefit from quality uplift for refineries. We are unable to provide a reconciliation of this forward-looking estimate of EBITDA because certain information needed to make a reasonable forward-looking estimate is difficult to estimate and dependent on future events, which are uncertain or outside of our control, including with respect to unknown construction timing, unanticipated construction costs and other potential variables. Accordingly, a reconciliation to net income as the most comparable GAAP 3 measure is not available without unreasonable effort.
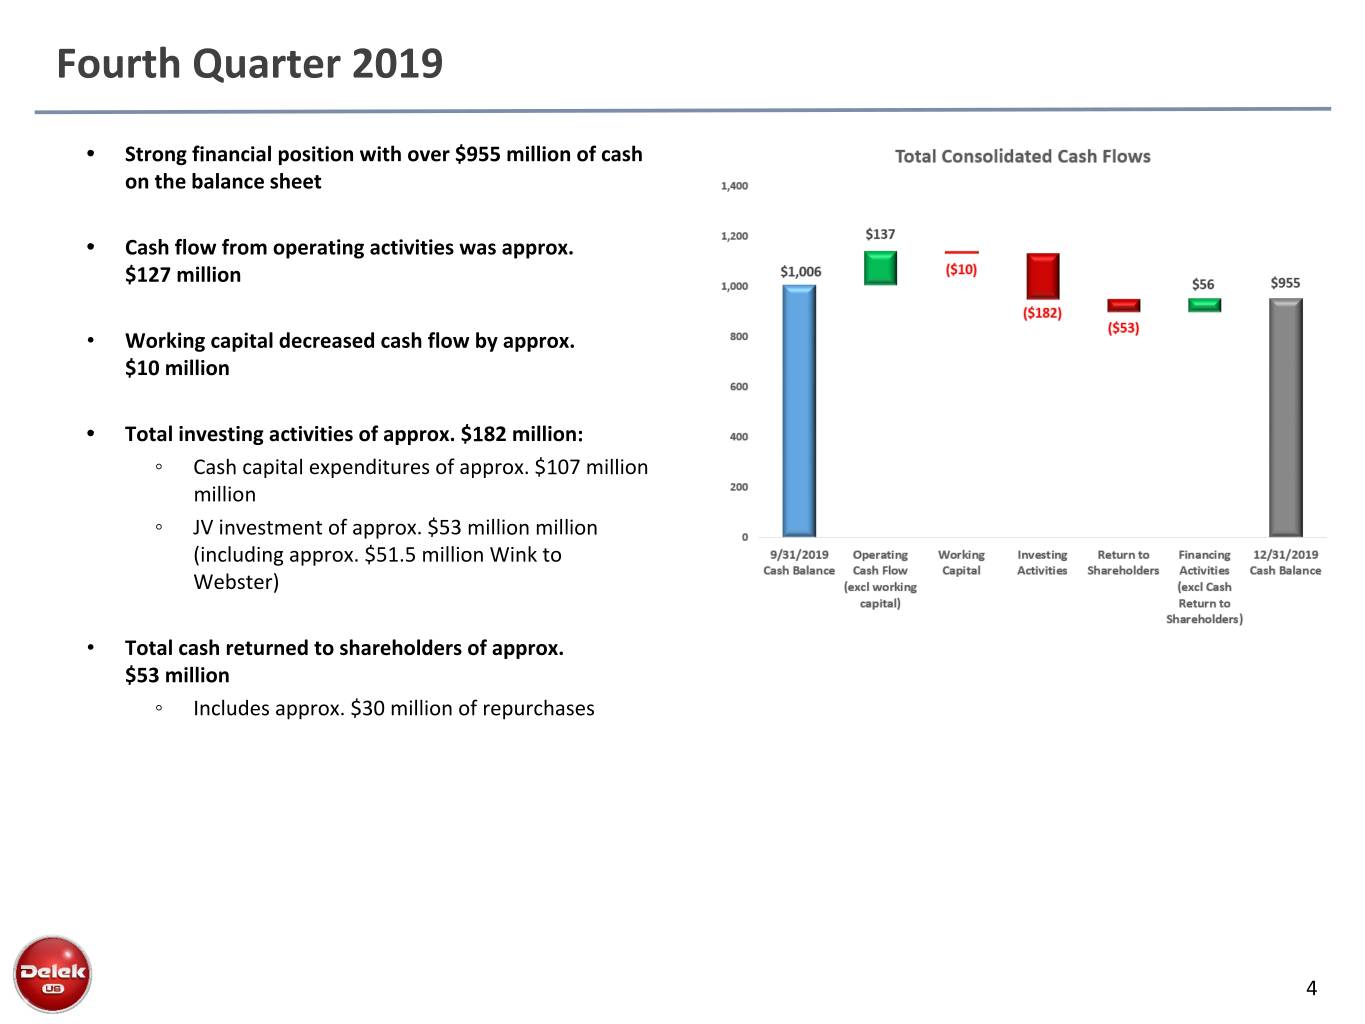
Fourth Quarter 2019 • Strong financial position with over $955 million of cash on the balance sheet • Cash flow from operating activities was approx. $127 million • Working capital decreased cash flow by approx. $10 million • Total investing activities of approx. $182 million: ◦ Cash capital expenditures of approx. $107 million million ◦ JV investment of approx. $53 million million (including approx. $51.5 million Wink to Webster) • Total cash returned to shareholders of approx. $53 million ◦ Includes approx. $30 million of repurchases 4
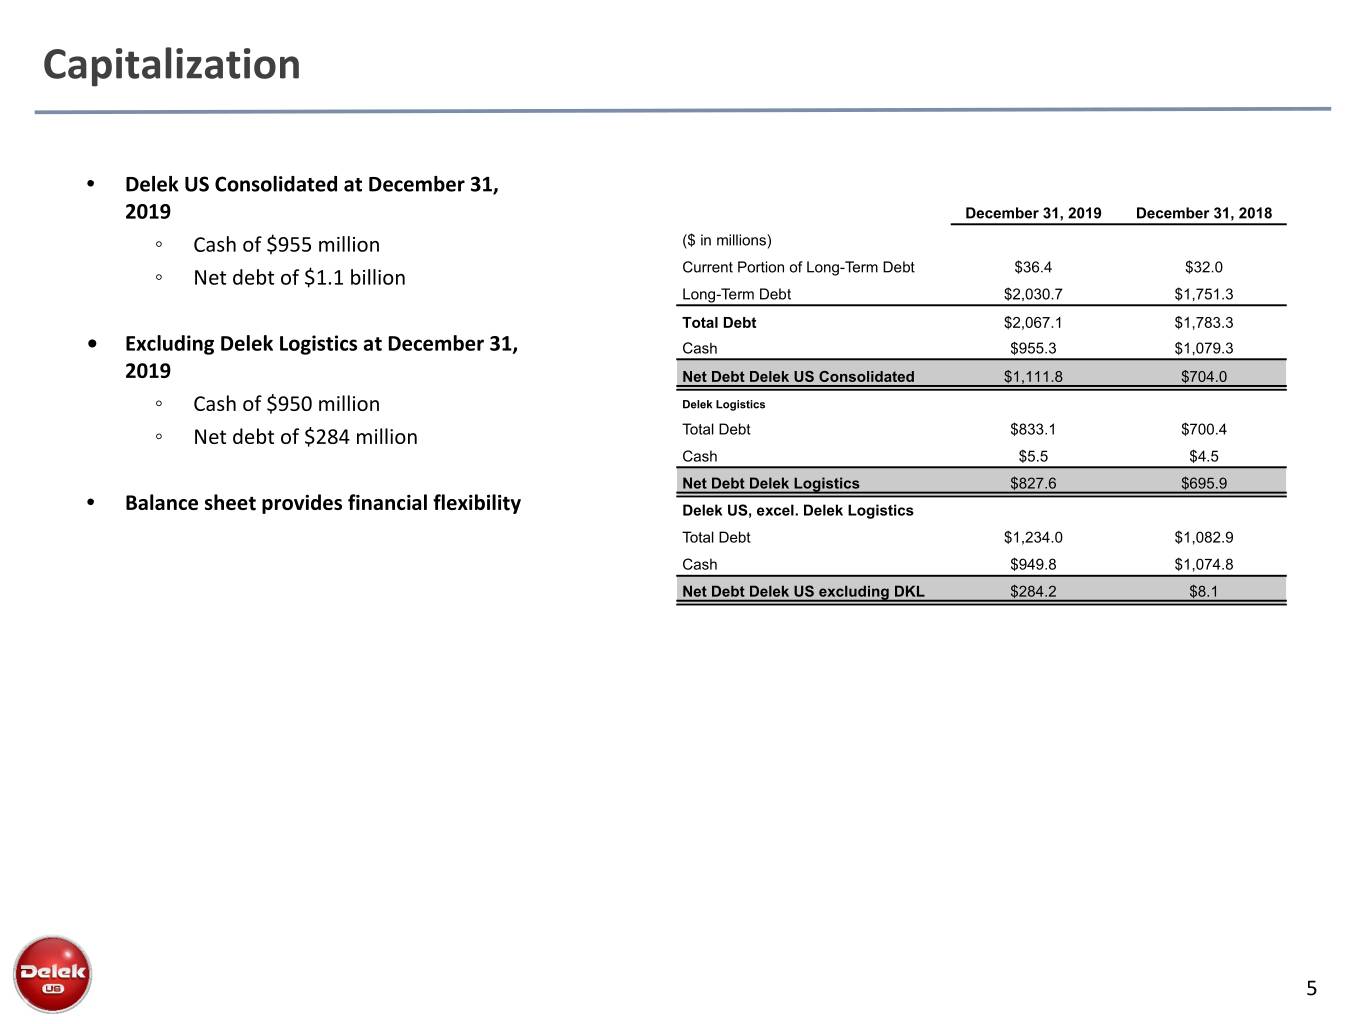
Capitalization • Delek US Consolidated at December 31, 2019 December 31, 2019 December 31, 2018 ◦ Cash of $955 million ($ in millions) Current Portion of Long-Term Debt $36.4 $32.0 ◦ Net debt of $1.1 billion Long-Term Debt $2,030.7 $1,751.3 Total Debt $2,067.1 $1,783.3 • Excluding Delek Logistics at December 31, Cash $955.3 $1,079.3 2019 Net Debt Delek US Consolidated $1,111.8 $704.0 ◦ Cash of $950 million Delek Logistics ◦ Net debt of $284 million Total Debt $833.1 $700.4 Cash $5.5 $4.5 Net Debt Delek Logistics $827.6 $695.9 • Balance sheet provides financial flexibility Delek US, excel. Delek Logistics Total Debt $1,234.0 $1,082.9 Cash $949.8 $1,074.8 Net Debt Delek US excluding DKL $284.2 $8.1 5
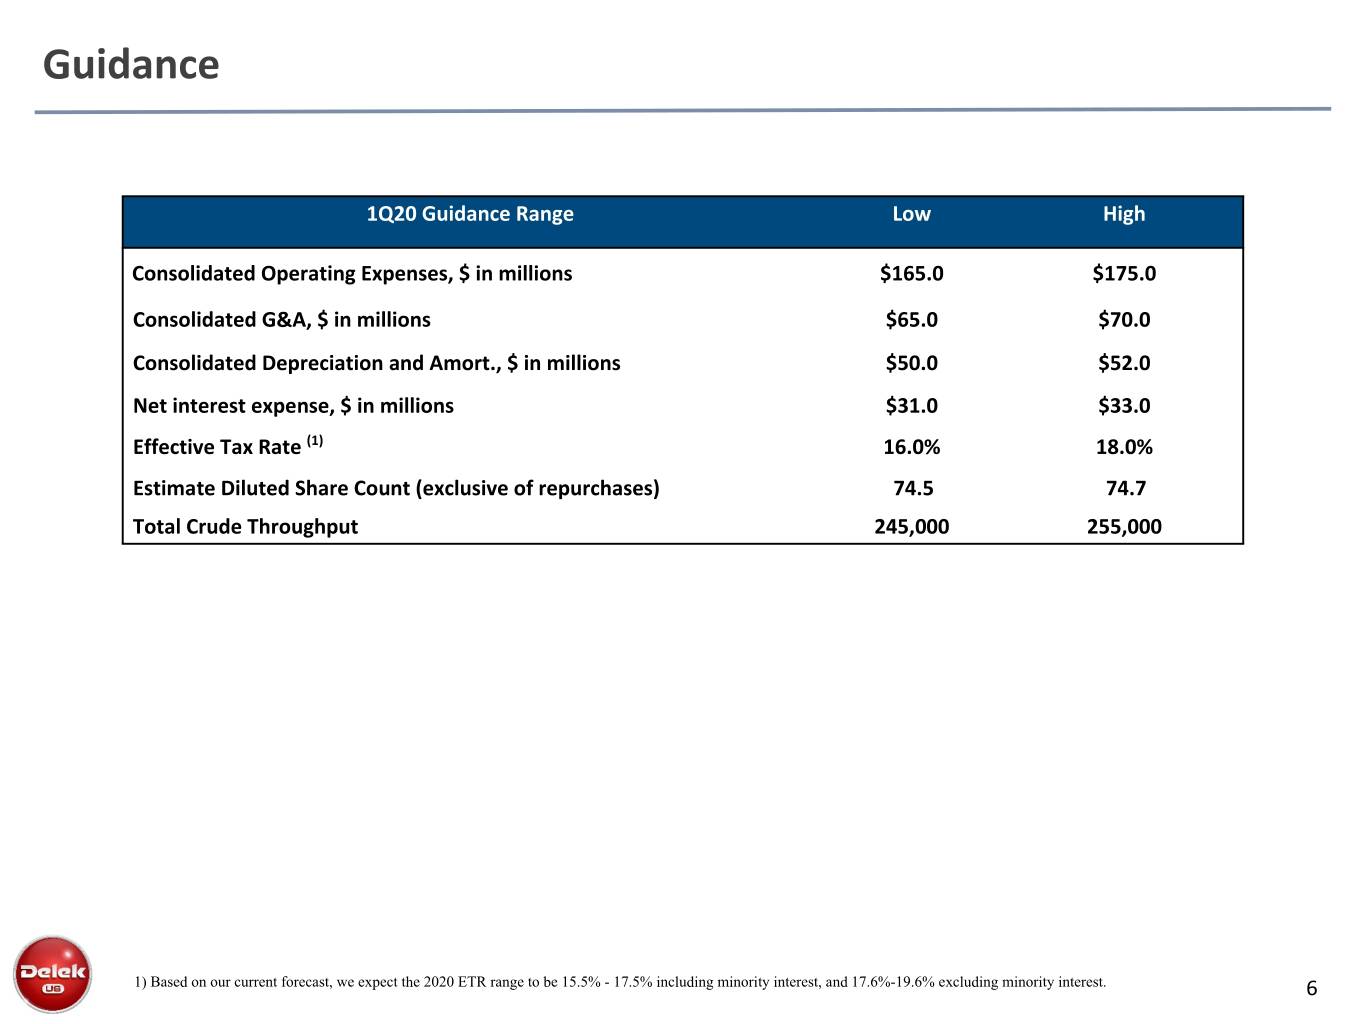
Guidance 1Q20 Guidance Range Low High Consolidated Operating Expenses, $ in millions $165.0 $175.0 Consolidated G&A, $ in millions $65.0 $70.0 Consolidated Depreciation and Amort., $ in millions $50.0 $52.0 Net interest expense, $ in millions $31.0 $33.0 Effective Tax Rate (1) 16.0% 18.0% Estimate Diluted Share Count (exclusive of repurchases) 74.5 74.7 Total Crude Throughput 245,000 255,000 1) Based on our current forecast, we expect the 2020 ETR range to be 15.5% - 17.5% including minority interest, and 17.6%-19.6% excluding minority interest. 6
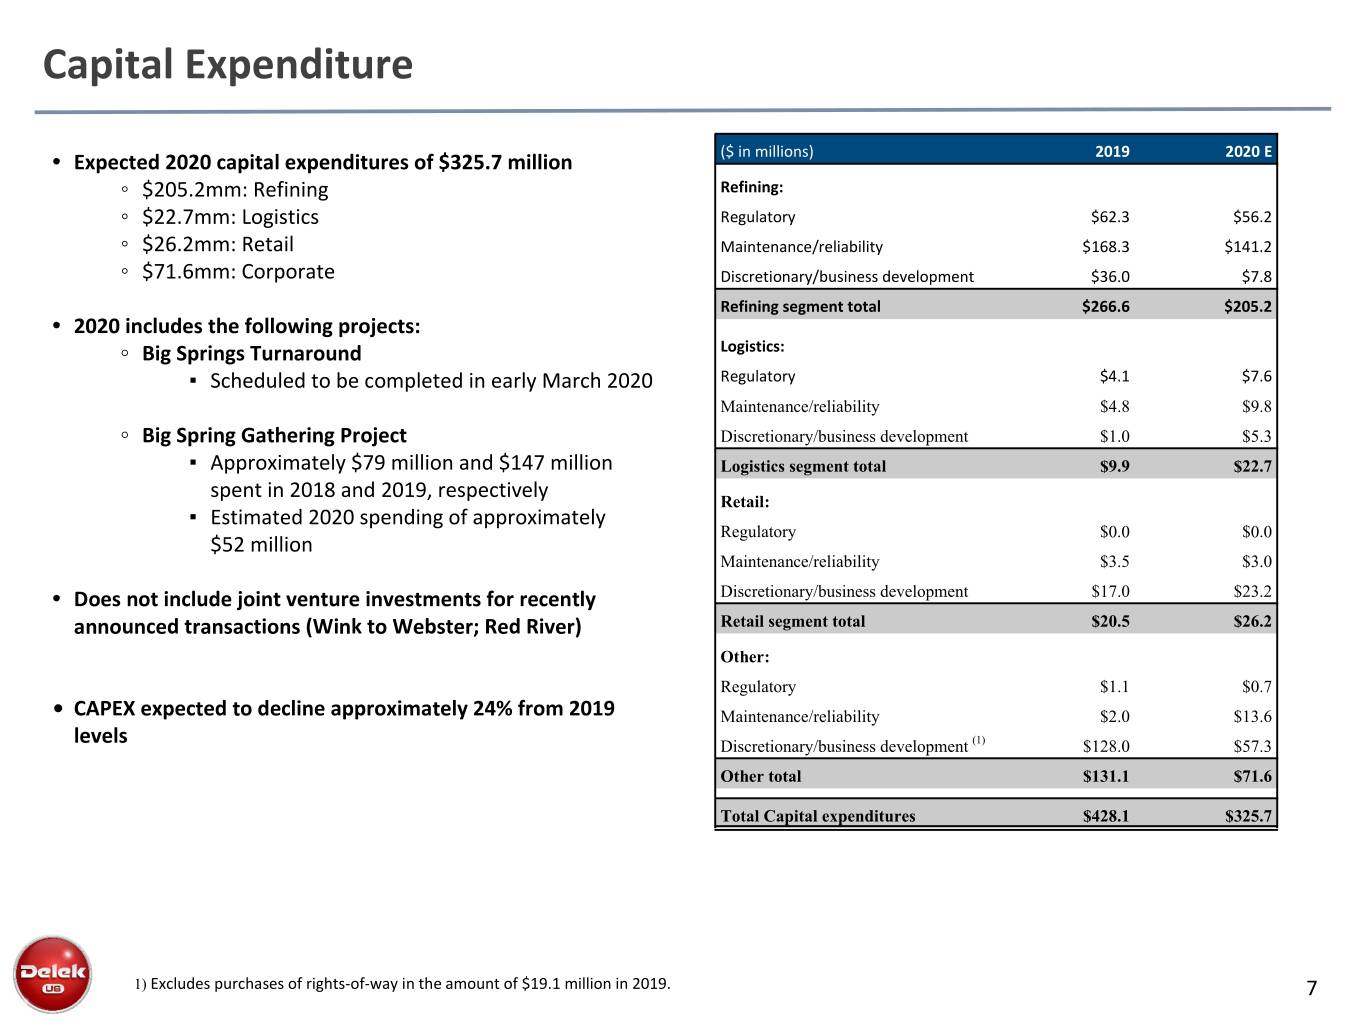
Capital Expenditure • Expected 2020 capital expenditures of $325.7 million ($ in millions) 2019 2020 E ◦ $205.2mm: Refining Refining: ◦ $22.7mm: Logistics Regulatory $62.3 $56.2 ◦ $26.2mm: Retail Maintenance/reliability $168.3 $141.2 ◦ $71.6mm: Corporate Discretionary/business development $36.0 $7.8 Refining segment total $266.6 $205.2 • 2020 includes the following projects: ◦ Big Springs Turnaround Logistics: ▪ Scheduled to be completed in early March 2020 Regulatory $4.1 $7.6 Maintenance/reliability $4.8 $9.8 ◦ Big Spring Gathering Project Discretionary/business development $1.0 $5.3 ▪ Approximately $79 million and $147 million Logistics segment total $9.9 $22.7 spent in 2018 and 2019, respectively Retail: ▪ Estimated 2020 spending of approximately Regulatory $0.0 $0.0 $52 million Maintenance/reliability $3.5 $3.0 • Does not include joint venture investments for recently Discretionary/business development $17.0 $23.2 announced transactions (Wink to Webster; Red River) Retail segment total $20.5 $26.2 Other: Regulatory $1.1 $0.7 • CAPEX expected to decline approximately 24% from 2019 Maintenance/reliability $2.0 $13.6 levels Discretionary/business development (1) $128.0 $57.3 Other total $131.1 $71.6 Total Capital expenditures $428.1 $325.7 1) Excludes purchases of rights-of-way in the amount of $19.1 million in 2019. 7
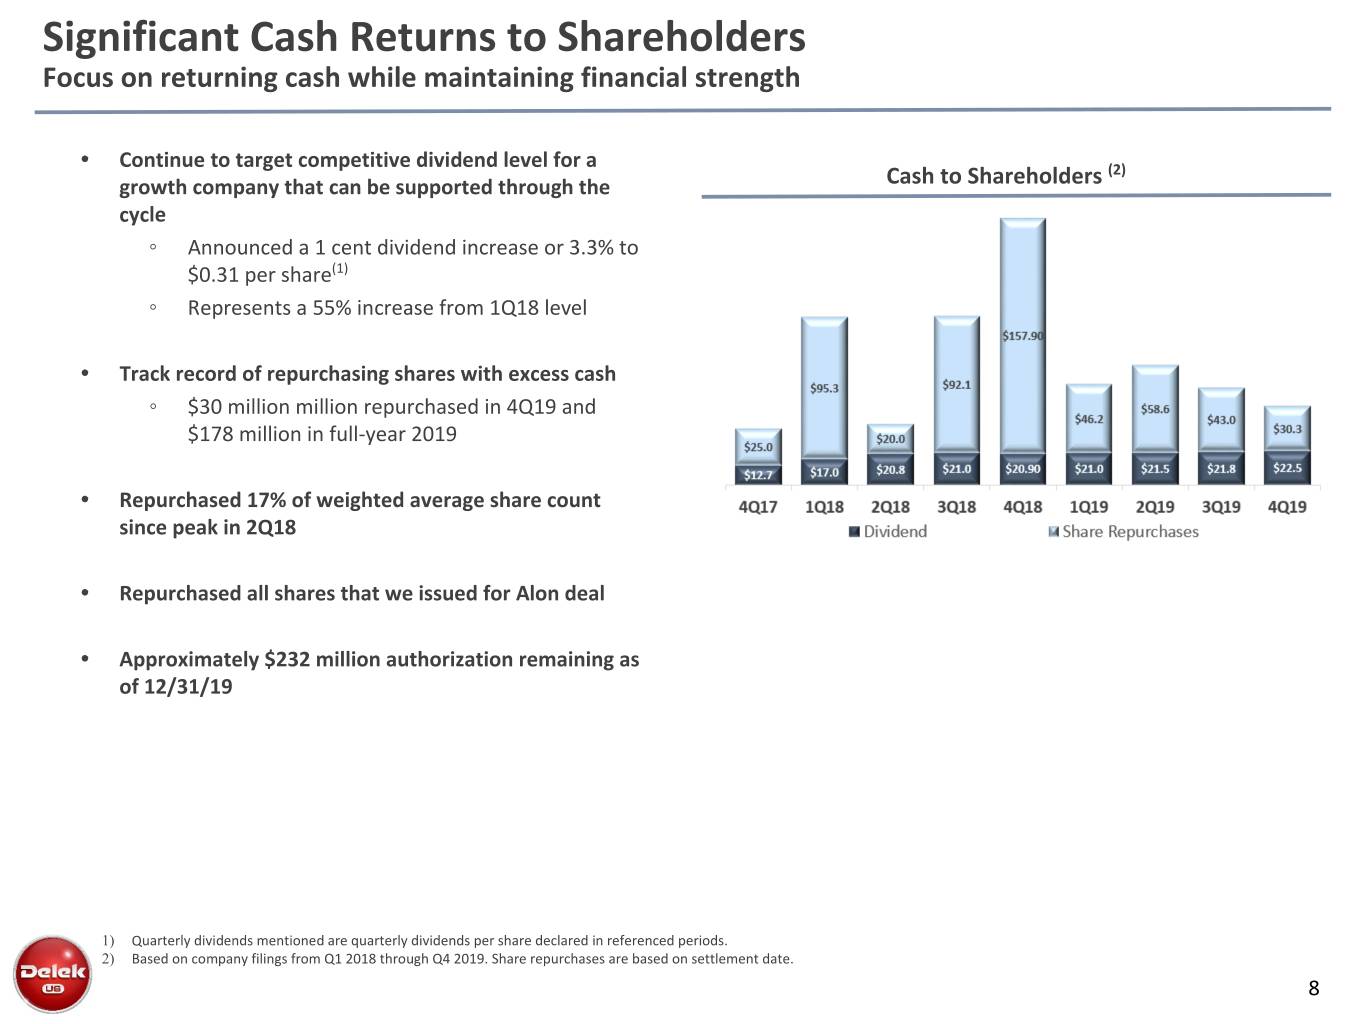
Significant Cash Returns to Shareholders Focus on returning cash while maintaining financial strength • Continue to target competitive dividend level for a (2) growth company that can be supported through the Cash to Shareholders cycle ◦ Announced a 1 cent dividend increase or 3.3% to $0.31 per share(1) ◦ Represents a 55% increase from 1Q18 level • Track record of repurchasing shares with excess cash ◦ $30 million million repurchased in 4Q19 and $178 million in full-year 2019 • Repurchased 17% of weighted average share count since peak in 2Q18 • Repurchased all shares that we issued for Alon deal • Approximately $232 million authorization remaining as of 12/31/19 1) Quarterly dividends mentioned are quarterly dividends per share declared in referenced periods. 2) Based on company filings from Q1 2018 through Q4 2019. Share repurchases are based on settlement date. 8
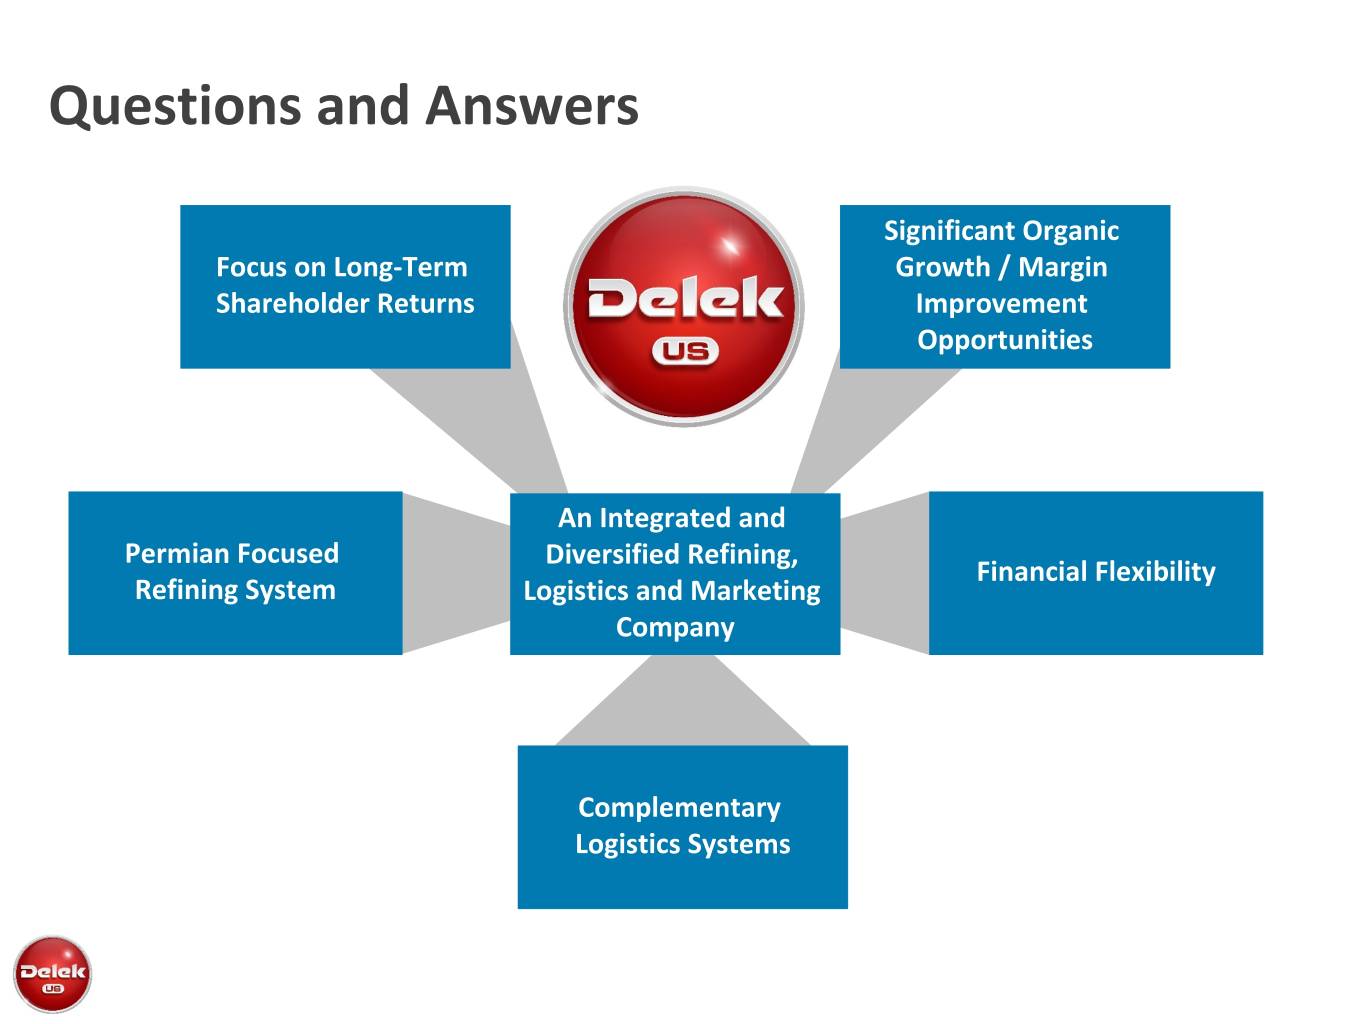
Questions and Answers Significant Organic Focus on Long-Term Growth / Margin Shareholder Returns Improvement Opportunities An Integrated and Permian Focused Diversified Refining, Financial Flexibility Refining System Logistics and Marketing Company Complementary Logistics Systems
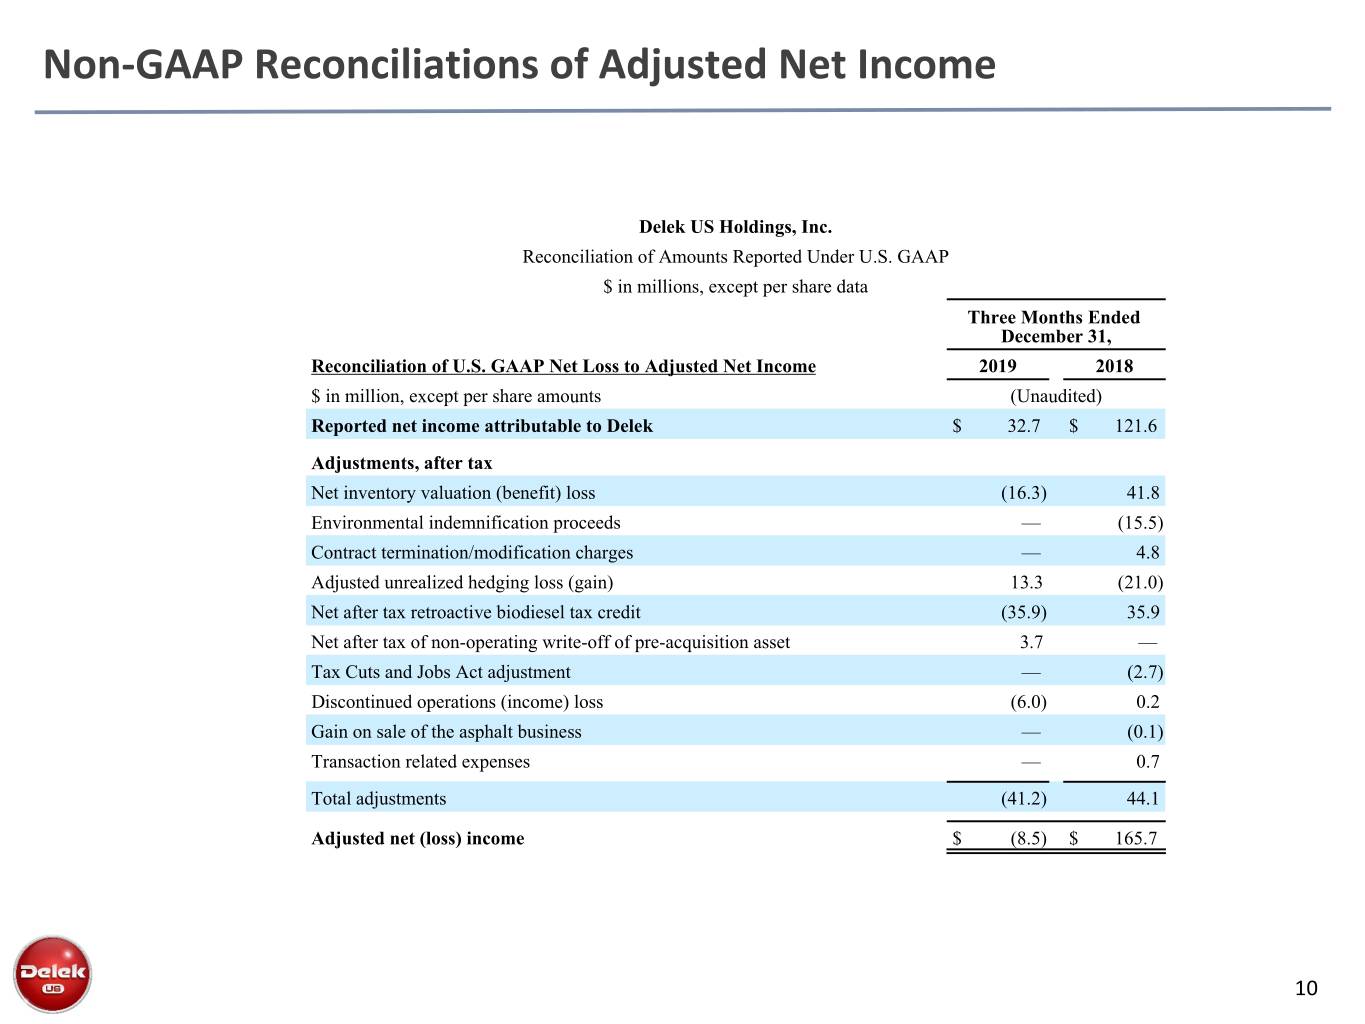
Non-GAAP Reconciliations of Adjusted Net Income Delek US Holdings, Inc. Reconciliation of Amounts Reported Under U.S. GAAP $ in millions, except per share data Three Months Ended December 31, Reconciliation of U.S. GAAP Net Loss to Adjusted Net Income 2019 2018 $ in million, except per share amounts (Unaudited) Reported net income attributable to Delek $ 32.7 $ 121.6 Adjustments, after tax Net inventory valuation (benefit) loss (16.3) 41.8 Environmental indemnification proceeds — (15.5) Contract termination/modification charges — 4.8 Adjusted unrealized hedging loss (gain) 13.3 (21.0) Net after tax retroactive biodiesel tax credit (35.9) 35.9 Net after tax of non-operating write-off of pre-acquisition asset 3.7 — Tax Cuts and Jobs Act adjustment — (2.7) Discontinued operations (income) loss (6.0) 0.2 Gain on sale of the asphalt business — (0.1) Transaction related expenses — 0.7 Total adjustments (41.2) 44.1 Adjusted net (loss) income $ (8.5) $ 165.7 10
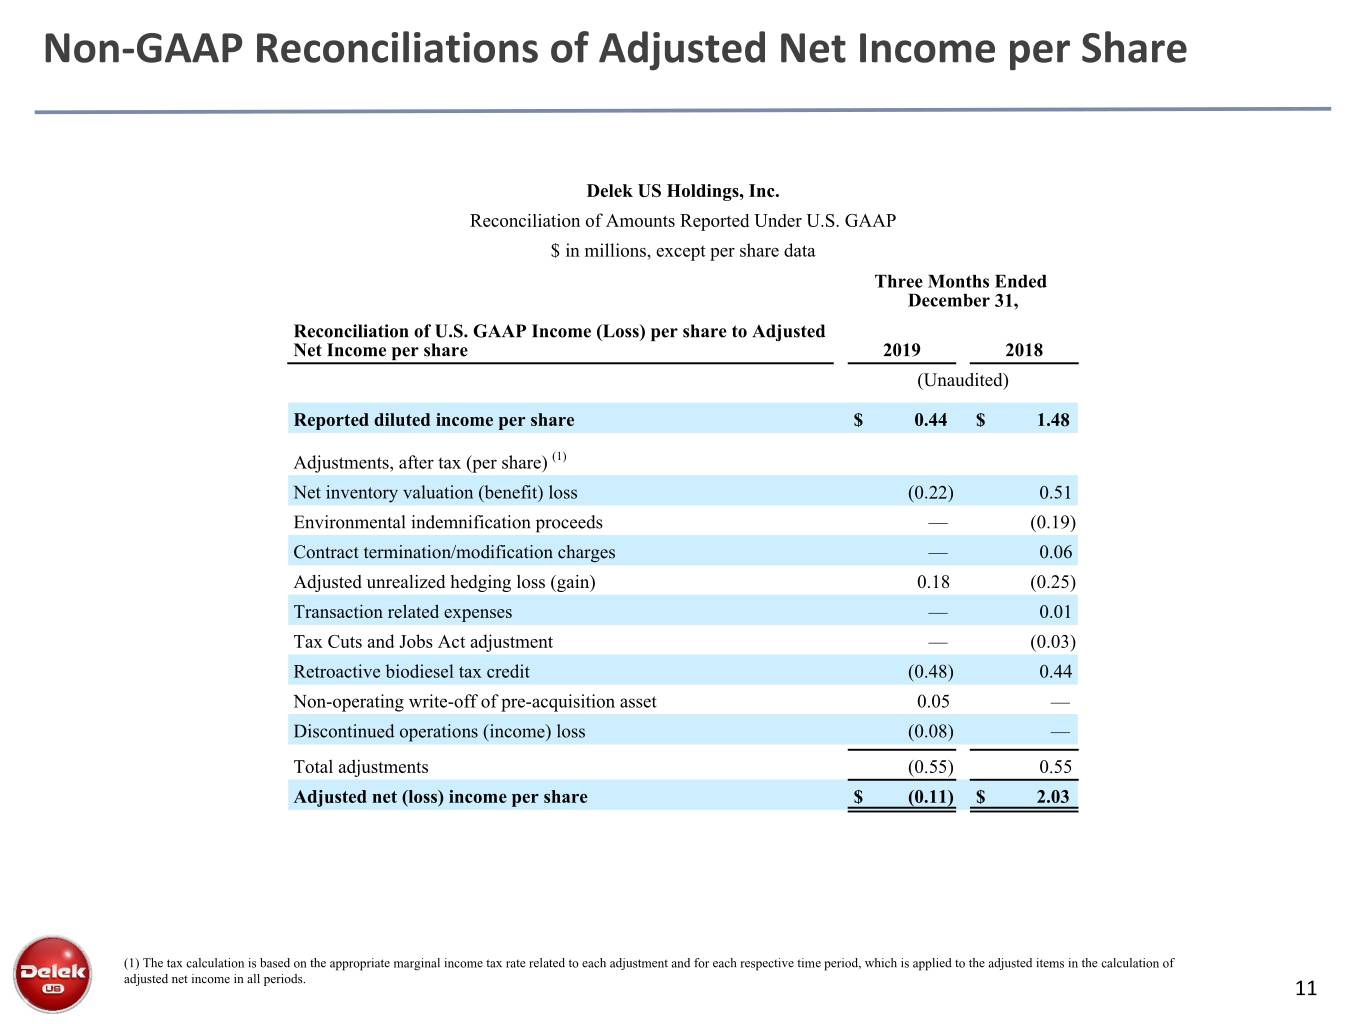
Non-GAAP Reconciliations of Adjusted Net Income per Share Delek US Holdings, Inc. Reconciliation of Amounts Reported Under U.S. GAAP $ in millions, except per share data Three Months Ended December 31, Reconciliation of U.S. GAAP Income (Loss) per share to Adjusted Net Income per share 2019 2018 (Unaudited) Reported diluted income per share $ 0.44 $ 1.48 Adjustments, after tax (per share) (1) Net inventory valuation (benefit) loss (0.22) 0.51 Environmental indemnification proceeds — (0.19) Contract termination/modification charges — 0.06 Adjusted unrealized hedging loss (gain) 0.18 (0.25) Transaction related expenses — 0.01 Tax Cuts and Jobs Act adjustment — (0.03) Retroactive biodiesel tax credit (0.48) 0.44 Non-operating write-off of pre-acquisition asset 0.05 — Discontinued operations (income) loss (0.08) — Total adjustments (0.55) 0.55 Adjusted net (loss) income per share $ (0.11) $ 2.03 (1) The tax calculation is based on the appropriate marginal income tax rate related to each adjustment and for each respective time period, which is applied to the adjusted items in the calculation of adjusted net income in all periods. 11
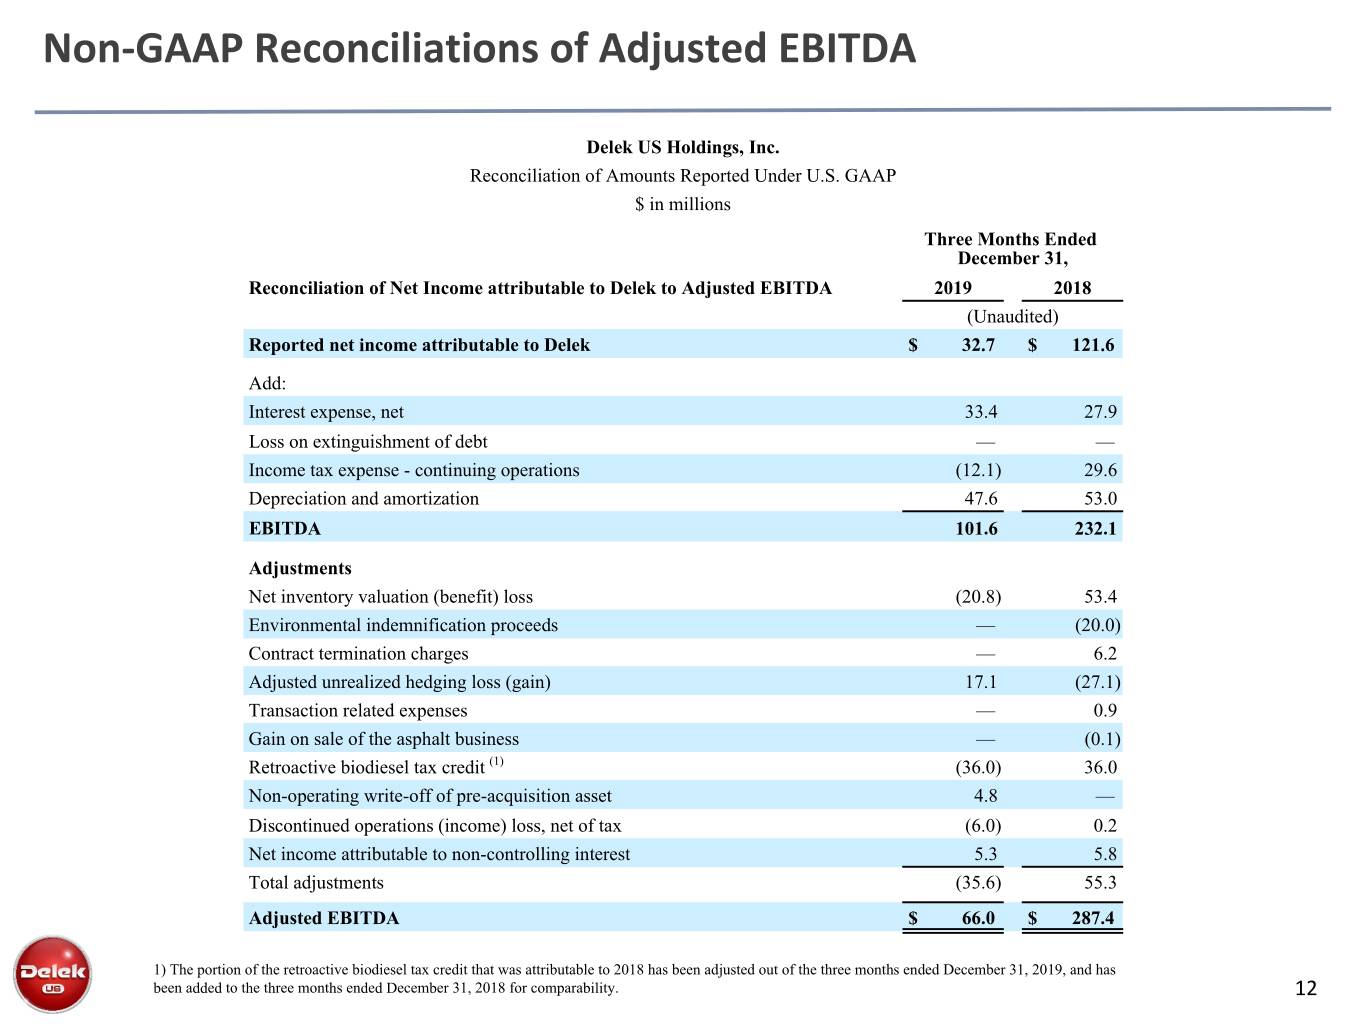
Non-GAAP Reconciliations of Adjusted EBITDA Delek US Holdings, Inc. Reconciliation of Amounts Reported Under U.S. GAAP $ in millions Three Months Ended December 31, Reconciliation of Net Income attributable to Delek to Adjusted EBITDA 2019 2018 (Unaudited) Reported net income attributable to Delek $ 32.7 $ 121.6 Add: Interest expense, net 33.4 27.9 Loss on extinguishment of debt — — Income tax expense - continuing operations (12.1) 29.6 Depreciation and amortization 47.6 53.0 EBITDA 101.6 232.1 Adjustments Net inventory valuation (benefit) loss (20.8) 53.4 Environmental indemnification proceeds — (20.0) Contract termination charges — 6.2 Adjusted unrealized hedging loss (gain) 17.1 (27.1) Transaction related expenses — 0.9 Gain on sale of the asphalt business — (0.1) Retroactive biodiesel tax credit (1) (36.0) 36.0 Non-operating write-off of pre-acquisition asset 4.8 — Discontinued operations (income) loss, net of tax (6.0) 0.2 Net income attributable to non-controlling interest 5.3 5.8 Total adjustments (35.6) 55.3 Adjusted EBITDA $ 66.0 $ 287.4 1) The portion of the retroactive biodiesel tax credit that was attributable to 2018 has been adjusted out of the three months ended December 31, 2019, and has been added to the three months ended December 31, 2018 for comparability. 12