MATX 8-K
Matson, Inc. (MATX)
UNITED STATES
SECURITIES AND EXCHANGE COMMISSION
Washington, D. C. 20549
FORM
CURRENT REPORT
Pursuant to Section 13 or 15(d) of The Securities Exchange Act of 1934
Date of Report (Date of earliest event reported): November 3, 2021 (
(Exact Name of Registrant as Specified in its Charter)
_____________________
|
| |||
(State or Other Jurisdiction of | (Commission File Number) | (I.R.S. Employer Identification |
| ||
(Address of principal executive offices) | (zip code) |
Registrant’s telephone number, including area code: (
(Former Name or former address, if changed since last report)
_____________________
Check the appropriate box below if the Form 8-K filing is intended to simultaneously satisfy the filing obligation of the registrant under any of the following provisions:
Written communications pursuant to Rule 425 under the Securities Act (17 CFR 230.425) |
Soliciting material pursuant to Rule 14a-12 under the Exchange Act (17 CFR 240.14a-12) |
Pre-commencement communications pursuant to Rule 14d-2(b) under the Exchange Act (17 CFR 240.14d-2(b)) |
Pre-commencement communications pursuant to Rule 13e-4(c) under the Exchange Act (17 CFR 240.13e-4(c)) |
Securities registered pursuant to Section 12(b) of the Act:
Title of each class | Trading Symbol(s) | Name of each exchange on which registered |
Indicate by check mark whether the registrant is an emerging growth company as defined in Rule 405 of the Securities Act of 1933 (§230.405 of this chapter) or Rule 12b-2 of the Securities Exchange Act of 1934 (§240.12b-2 of this chapter).
Emerging growth company
If an emerging growth company, indicate by check mark if the registrant has elected not to use the extended transition period for complying with any new or revised financial accounting standards provided pursuant to Section 13(a) of the Exchange Act. ☐
Item 2.02.Results of Operations and Financial Condition.
On November 3, 2021, Matson, Inc. (the “Company”) issued a press release announcing the Company’s earnings for the quarter ended September 30, 2021. A copy of the press release is attached hereto as Exhibit 99.1. In addition, the Company posted an investor presentation to its website. A copy of the investor presentation is attached hereto as Exhibit 99.2.
The information in this report (including Exhibits 99.1 and 99.2) is being furnished pursuant to Item 2.02 and shall not be deemed to be “filed” for purposes of Section 18 of the Securities Exchange Act of 1934, as amended.
Item 9.01.Financial Statements and Exhibits.
(a) - (c) Not applicable.
(d) Exhibits.
The exhibit listed below is being furnished with this Form 8-K.
99.1 | Press Release issued by Matson, Inc., dated November 3, 2021 |
99.2 | |
104 | Cover Page Interactive Data File (formatted in Inline XBRL and included as Exhibit 101). |
SIGNATURE
Pursuant to the requirements of the Securities Exchange Act of 1934, as amended, the registrant has duly caused this report to be signed on its behalf by the undersigned hereunto duly authorized.
MATSON, INC. | |
/s/ Joel M. Wine | |
Joel M. Wine | |
Executive Vice President and Chief Financial Officer | |
Dated: November 3, 2021 |
Exhibit 99.1

Investor Relations inquiries: | News Media inquiries: |
Lee Fishman | Keoni Wagner |
Matson, Inc. | Matson, Inc. |
510.628.4227 | 510.628.4534 |
FOR IMMEDIATE RELEASE
MATSON, INC. ANNOUNCES THIRD QUARTER 2021 RESULTS
| ● | 3Q21 EPS of $6.53 |
| ● | 3Q21 Net Income of $283.2 million |
| ● | 3Q21 EBITDA of $417.8 million |
| ● | Year-over-year increase in consolidated operating income driven primarily by China service strength |
| ● | Domestic tradelane volumes in 3Q21 well above volumes in 3Q20 |
| ● | Repurchased approximately 1.9 million shares from August 3, 2021 through November 2, 2021 |
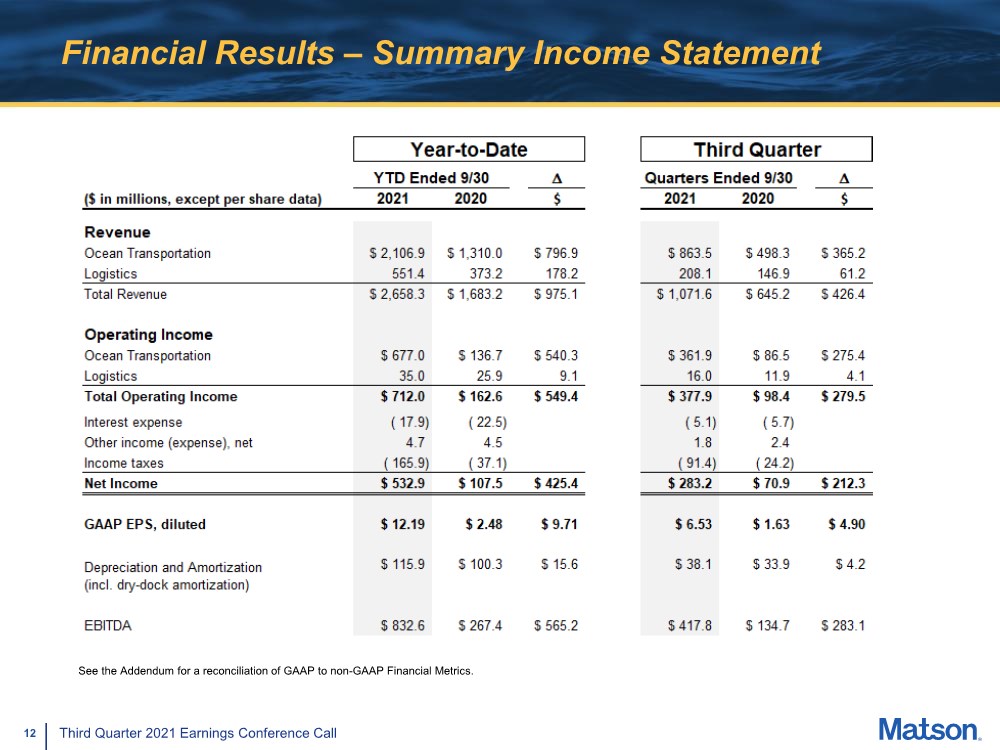
HONOLULU, Hawaii (November 3, 2021) – Matson, Inc. (“Matson” or the “Company”) (NYSE: MATX), a leading U.S. carrier in the Pacific, today reported net income of $283.2 million, or $6.53 per diluted share, for the quarter ended September 30, 2021. Net income for the quarter ended September 30, 2020 was $70.9 million, or $1.63 per diluted share. Consolidated revenue for the third quarter 2021 was $1,071.6 million compared with $645.2 million for the third quarter 2020.
“The strong economic and business trends we saw in the second quarter continued in the third quarter resulting in solid performance in both Ocean Transportation and Logistics,” said Chairman and Chief Executive Officer Matt Cox. “Within Ocean Transportation, our China service continued to see significant demand for its expedited ocean services, including the new CCX service, as volume for e-commerce, garments and other goods remained elevated heading into the peak season. Continued strong demand for the China service was the primary driver of the increase in consolidated operating income year-over-year. Currently, supply chain congestion continues in the Transpacific tradelane with the combination of ongoing elevated consumption trends, inventory restocking, and bottlenecks at critical points for both ocean and overland transportation. We expect these conditions to remain largely in place at least through mid-year 2022.”
Mr. Cox added, “In our domestic ocean tradelanes, we continued to see strong demand with higher year-over-year volumes compared to the largely pandemic-reduced volumes in the third quarter of last year. In Hawaii, we experienced elevated westbound freight demand as the state’s tourism and economy continued to rebound sharply from the pandemic lows, although towards the end of the quarter we experienced a modest negative impact in freight related to the state’s efforts to address the spread of the COVID-19 Delta variant. In Logistics, operating income increased year-over-year compared to the operating income achieved in the year ago period as we continued to see elevated goods consumption, inventory restocking and favorable supply and demand fundamentals in our core markets.”
Third Quarter 2021 Discussion and Update on Business Conditions
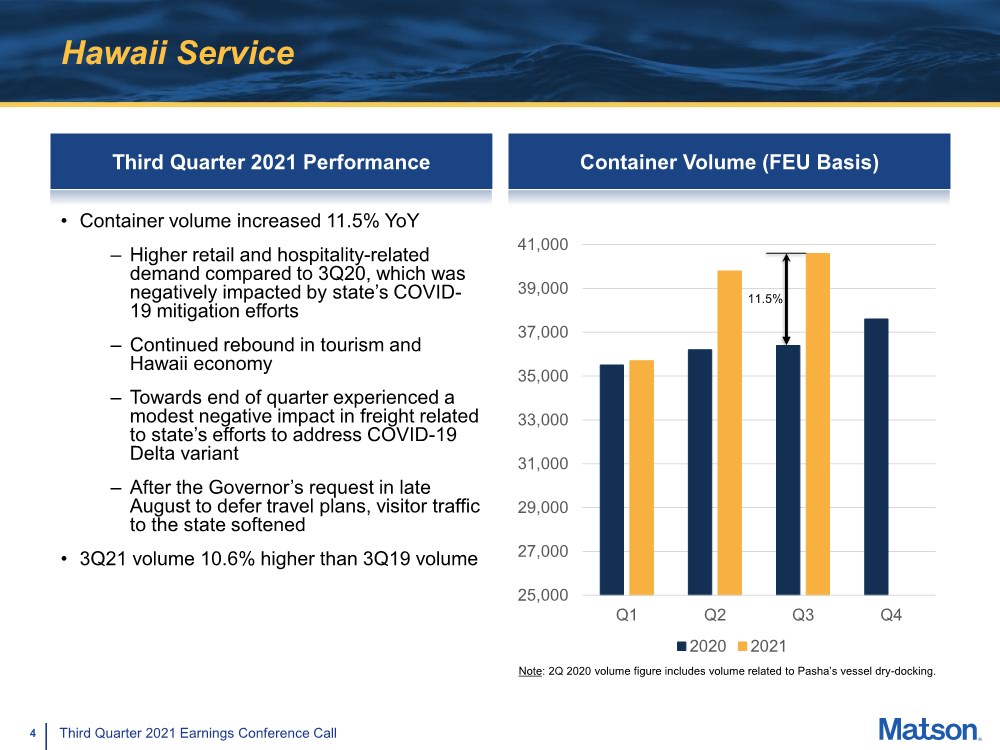
Ocean Transportation: The Company’s container volume in the Hawaii service in the third quarter 2021 was 11.5 percent higher year-over-year. The increase was primarily due to higher retail and hospitality-related demand due to the continued rebound in tourism and the Hawaii economy compared to the pandemic-reduced volume in the year ago period. Volume in the third quarter 2020 was negatively impacted by the state’s COVID-19 mitigation efforts, including restrictions on tourism. Domestic visitor travel to the state remained strong throughout much of the third quarter 2021
1
until the end of the quarter when the state’s efforts to address the spread of the COVID-19 Delta variant, including the Governor’s request to defer travel plans, led to a softening in airline passenger traffic. As a result, we experienced a modest negative impact in freight demand late in the quarter. In the near-term, the Hawaii economy may experience a brief slowdown as a result of the state’s response to the COVID-19 Delta variant and the related impacts on tourism trends. In late October, the Governor announced that non-essential travel to the state can resume on November 1, 2021.
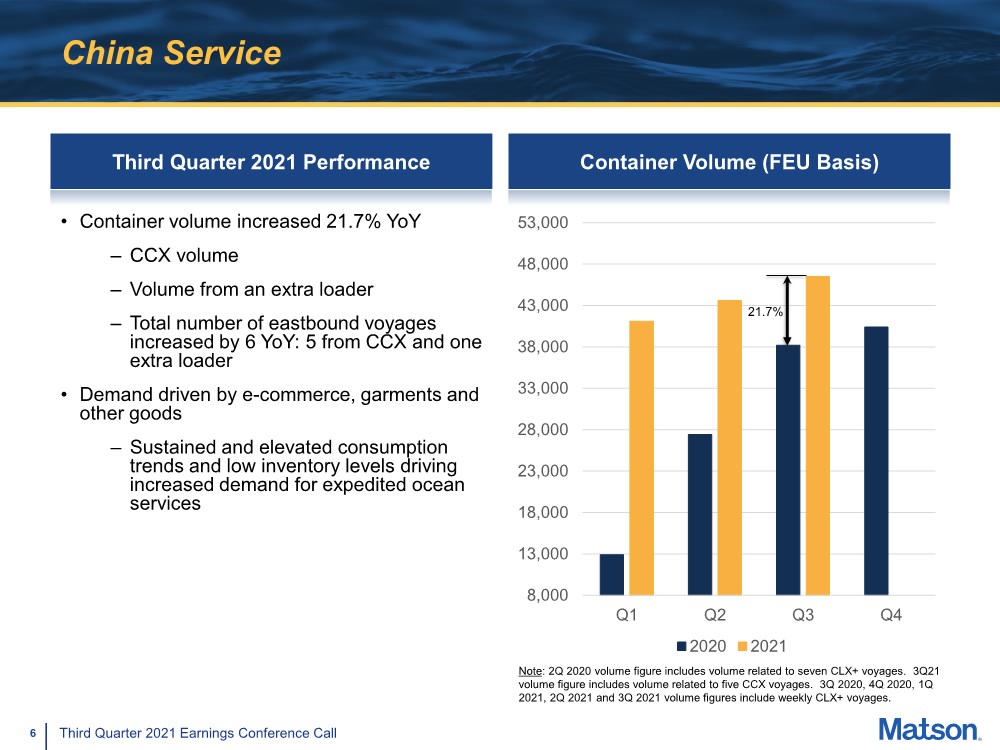
In China, the Company’s container volume in the third quarter 2021 increased 21.7 percent year-over-year. The increase was primarily due to volume from the China-California Express (“CCX”) service and volume from an extra loader. The total number of eastbound voyages in the China service increased by six year-over-year of which five were from CCX voyages and one from an extra loader. Volume demand in the quarter was driven by e-commerce, garments and other goods. Matson continued to realize a significant rate premium in the third quarter 2021 and achieved average freight rates that were considerably higher than in the year ago period. Currently, supply chain congestion continues in the Transpacific tradelane with the combination of ongoing elevated consumption trends, inventory restocking, and bottlenecks at critical points for both ocean and overland transportation. We expect these conditions to remain largely in place at least through mid-year 2022.
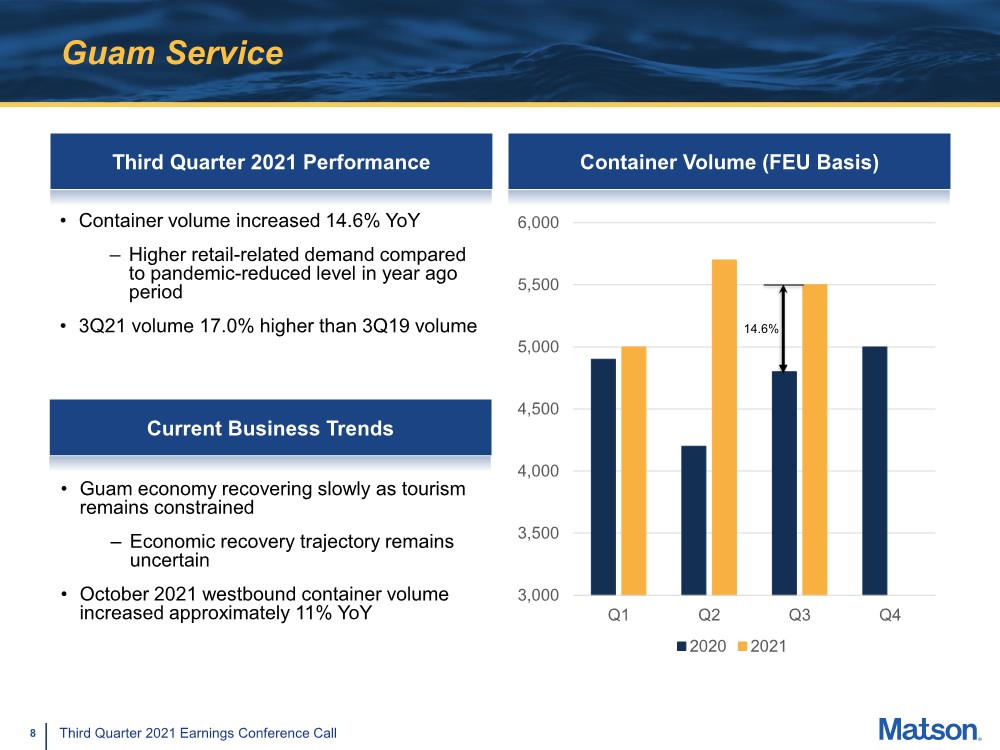
In Guam, the Company’s container volume in the third quarter 2021 increased 14.6 percent year-over-year primarily due to higher retail-related demand compared to the pandemic-reduced volume in the year ago period. The economic recovery trajectory in Guam continues to remain uncertain as the economy recovers slowly and tourism remains constrained.
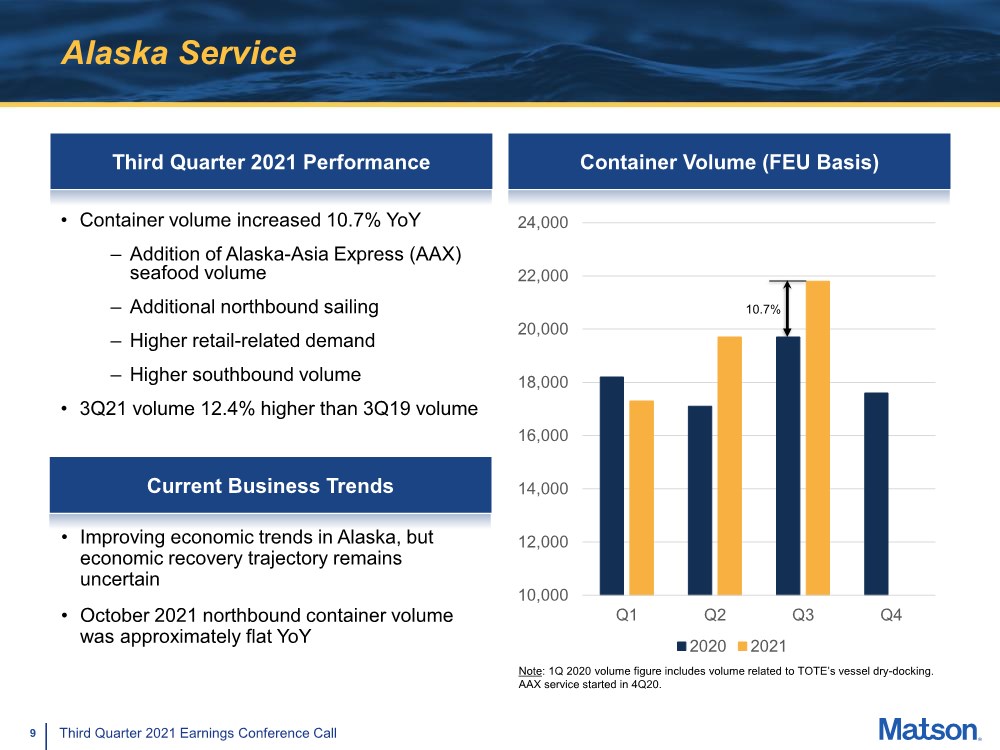
In Alaska, the Company’s container volume for the third quarter 2021 increased 10.7 percent year-over-year due to
(i) the addition of volume from the Alaska-Asia Express, (ii) higher northbound volume primarily due to an additional sailing and higher retail-related demand, and (iii) higher southbound volume. In the near-term, we expect improving economic trends in Alaska, but the recovery’s trajectory continues to remain uncertain.
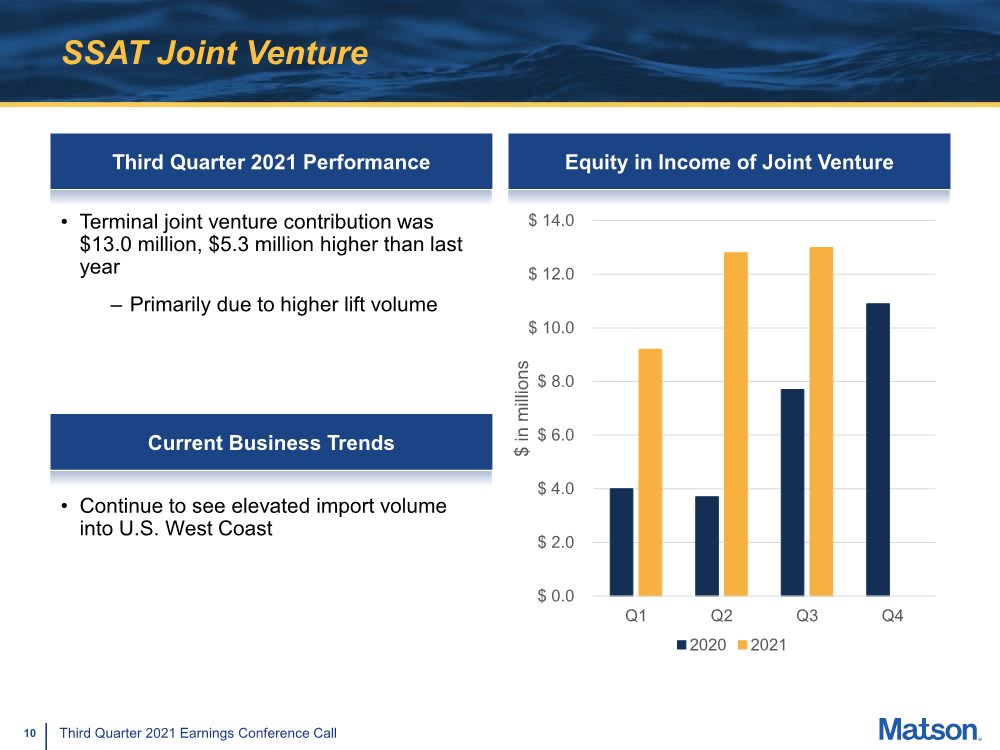
The contribution in the third quarter 2021 from the Company’s SSAT joint venture investment was $13.0 million, or $5.3 million higher than the third quarter 2020. The increase was primarily driven by higher lift volume.
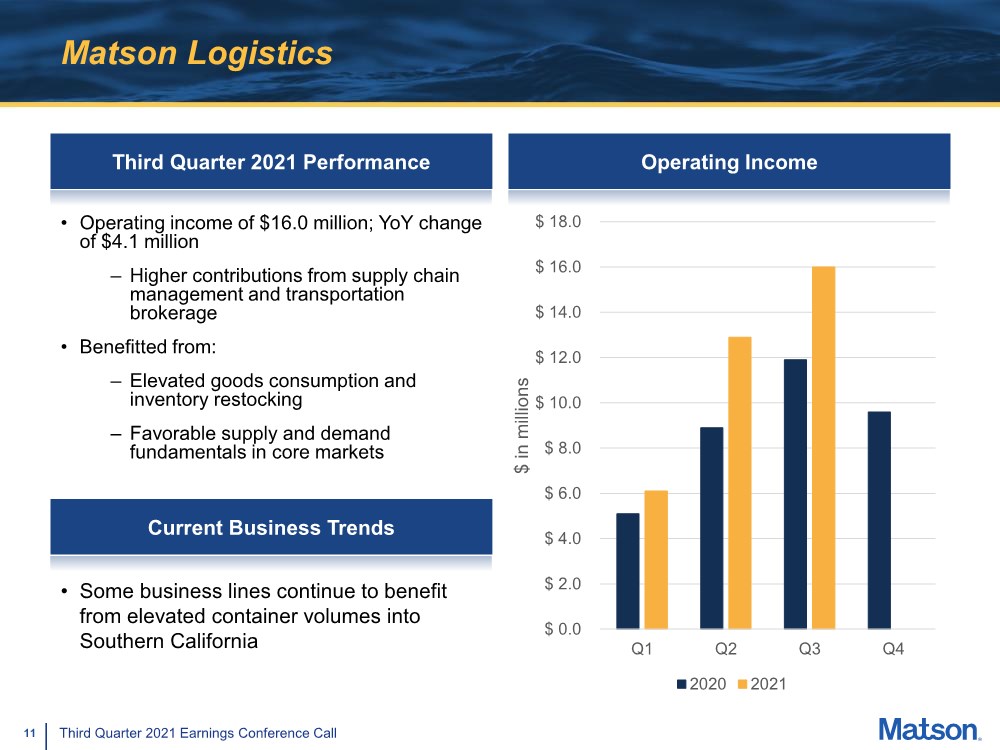
Logistics: In the third quarter 2021, operating income for the Company’s Logistics segment was $16.0 million, or $4.1 million higher compared to the level achieved in the third quarter 2020. The increase was due primarily to higher contributions from supply chain management and transportation brokerage as a result of elevated goods consumption, inventory restocking and favorable supply and demand fundamentals in our core markets.
2
Results By Segment
Ocean Transportation — Three months ended September 30, 2021 compared with 2020
| | Three Months Ended September 30, |
| |||||||||
(Dollars in millions) |
| 2021 |
| 2020 |
| Change |
| |||||
Ocean Transportation revenue | | $ | 863.5 | | $ | 498.3 | | $ | 365.2 | | 73.3 | % |
Operating costs and expenses | |
| (501.6) | |
| (411.8) | |
| (89.8) | | 21.8 | % |
Operating income | | $ | 361.9 | | $ | 86.5 | | $ | 275.4 | | 318.4 | % |
Operating income margin | |
| 41.9 | % |
| 17.4 | % |
| | | | |
| | | | | | | | | | | | |
Volume (Forty-foot equivalent units (FEU), except for automobiles) (1) | | | | | | | | | | | | |
Hawaii containers | |
| 40,600 | |
| 36,400 | |
| 4,200 | | 11.5 | % |
Hawaii automobiles | |
| 12,600 | |
| 12,900 | |
| (300) | | (2.3) | % |
Alaska containers | |
| 21,800 | |
| 19,700 | |
| 2,100 | | 10.7 | % |
China containers | |
| 46,500 | |
| 38,200 | |
| 8,300 | | 21.7 | % |
Guam containers | |
| 5,500 | |
| 4,800 | |
| 700 | | 14.6 | % |
Other containers (2) | |
| 5,400 | |
| 4,600 | |
| 800 | | 17.4 | % |
| (1) | Approximate volumes included for the period are based on the voyage departure date, but revenue and operating income are adjusted to reflect the percentage of revenue and operating income earned during the reporting period for voyages in transit at the end of each reporting period. |
| (2) | Includes containers from services in various islands in Micronesia and the South Pacific, and Okinawa, Japan. |
Ocean Transportation revenue increased $365.2 million, or 73.3 percent, during the three months ended September 30, 2021, compared with the three months ended September 30, 2020. The increase was primarily due to higher revenue in China, higher fuel-related surcharge revenue, and higher revenue in Hawaii and Alaska.
On a year-over-year FEU basis, Hawaii container volume increased 11.5 percent primarily due to higher retail and hospitality-related demand due to the continued rebound in tourism and the Hawaii economy compared to the volume in the year ago period, which was negatively impacted by the state’s COVID-19 mitigation efforts, including restrictions on tourism; Alaska volume increased 10.7 percent due to the addition of volume from the Alaska-Asia Express, higher northbound volume primarily due to an additional sailing and higher retail-related demand, and higher southbound volume; China volume was 21.7 percent higher primarily due to CCX volume and volume from an extra loader; Guam volume was 14.6 percent higher primarily due to higher retail-related demand; and Other containers volume increased 17.4 percent primarily due to higher volume in Okinawa.
Ocean Transportation operating income increased $275.4 million during the three months ended September 30, 2021, compared with the three months ended September 30, 2020. The increase was primarily due to a higher contribution from China.
The Company’s SSAT terminal joint venture investment contributed $13.0 million during the three months ended September 30, 2021, compared to a contribution of $7.7 million during the three months ended September 30, 2020. The increase was primarily driven by higher lift volume.
3
Ocean Transportation — Nine months ended September 30, 2021 compared with 2020
| | Nine Months Ended September 30, |
| |||||||||
(Dollars in millions) |
| 2021 |
| 2020 |
| Change |
| |||||
Ocean Transportation revenue | | $ | 2,106.9 | | $ | 1,310.0 | | $ | 796.9 | | 60.8 | % |
Operating costs and expenses | |
| (1,429.9) | |
| (1,173.3) | |
| (256.6) | | 21.9 | % |
Operating income | | $ | 677.0 | | $ | 136.7 | | $ | 540.3 | | 395.2 | % |
Operating income margin | |
| 32.1 | % |
| 10.4 | % | | | | | |
| | | | | | | | | | | | |
Volume (Forty-foot equivalent units (FEU), except for automobiles) (1) | | | | | | | | | | | | |
Hawaii containers | |
| 116,100 | |
| 108,100 | | | 8,000 | | 7.4 | % |
Hawaii automobiles | |
| 36,000 | |
| 34,400 | | | 1,600 | | 4.7 | % |
Alaska containers | |
| 58,800 | |
| 55,000 | | | 3,800 | | 6.9 | % |
China containers | |
| 131,200 | |
| 78,500 | | | 52,700 | | 67.1 | % |
Guam containers | |
| 16,200 | |
| 13,900 | | | 2,300 | | 16.5 | % |
Other containers (2) | |
| 14,600 | |
| 12,600 | | | 2,000 | | 15.9 | % |
| (1) | Approximate volumes included for the period are based on the voyage departure date, but revenue and operating income are adjusted to reflect the percentage of revenue and operating income earned during the reporting period for voyages in transit at the end of each reporting period. |
| (2) | Includes containers from services in various islands in Micronesia and the South Pacific, and Okinawa, Japan. |
Ocean Transportation revenue increased $796.9 million, or 60.8 percent, during the nine months ended September 30, 2021, compared with the nine months ended September 30, 2020. The increase was primarily due to higher revenue in China and Hawaii, higher fuel-related surcharge revenue and higher revenue in Alaska.
On a year-over-year FEU basis, Hawaii container volume increased 7.4 percent primarily due to higher retail and hospitality-related demand due to the reopening of the Hawaii economy compared to the negatively impacted volume in the year ago period as a result of the pandemic and the state’s COVID-19 mitigation efforts, partially offset by volume associated with the dry-docking of a competitor’s vessel in the second quarter of last year; Alaska volume increased by 6.9 percent due to higher northbound volume primarily due to higher retail-related demand compared to the negatively impacted volume in the year ago period as a result of the pandemic and the state’s COVID-19 mitigation efforts, higher southbound volume, and the addition of volume from the Alaska-Asia Express service; China volume was 67.1 percent higher primarily due to incremental volume from the CLX+ service, higher volume on the CLX service as a result of increased capacity in the tradelane, and the addition of volume from the CCX service; Guam volume was 16.5 percent higher primarily due to higher retail-related demand compared to the negatively impacted volume in the year ago period as a result of the pandemic and the island’s COVID-19 mitigation measures; and Other container volume increased 15.9 percent primarily due to higher volume in Okinawa.
Ocean Transportation operating income increased $540.3 million during the nine months ended September 30, 2021, compared with the nine months ended September 30, 2020. The increase was primarily due to a higher contribution from China.
The Company’s SSAT terminal joint venture investment contributed $35.0 million during the nine months ended September 30, 2021, compared to a contribution of $15.4 million during the nine months ended September 30, 2020. The increase was primarily driven by higher lift volume.
4
Logistics — Three months ended September 30, 2021 compared with 2020
| | Three Months Ended September 30, |
| |||||||||
(Dollars in millions) |
| 2021 |
| 2020 |
| Change |
| |||||
Logistics revenue | | $ | 208.1 | | $ | 146.9 | | $ | 61.2 | | 41.7 | % |
Operating costs and expenses | |
| (192.1) | |
| (135.0) | |
| (57.1) | | 42.3 | % |
Operating income | | $ | 16.0 | | $ | 11.9 | | $ | 4.1 | | 34.5 | % |
Operating income margin | |
| 7.7 | % |
| 8.1 | % | | | | | |
Logistics revenue increased $61.2 million, or 41.7 percent, during the three months ended September 30, 2021, compared with the three months ended September 30, 2020. The increase was primarily due to higher transportation brokerage and supply chain management revenue.
Logistics operating income increased $4.1 million, or 34.5 percent, for the three months ended September 30, 2021, compared with the three months ended September 30, 2020. The increase was primarily due to higher contributions from supply chain management and transportation brokerage.
Logistics — Nine months ended September 30, 2021 compared with 2020
| | Nine Months Ended September 30, |
| |||||||||
(Dollars in millions) |
| 2021 |
| 2020 |
| Change |
| |||||
Logistics revenue | | $ | 551.4 | | $ | 373.2 | | $ | 178.2 | | 47.7 | % |
Operating costs and expenses | |
| (516.4) | |
| (347.3) | |
| (169.1) | | 48.7 | % |
Operating income | | $ | 35.0 | | $ | 25.9 | | $ | 9.1 | | 35.1 | % |
Operating income margin | |
| 6.3 | % |
| 6.9 | % | | | | | |
Logistics revenue increased $178.2 million, or 47.7 percent, during the nine months ended September 30, 2021, compared with the nine months ended September 30, 2020. The increase was primarily due to higher transportation brokerage and supply chain management revenue.
Logistics operating income increased $9.1 million, or 35.1 percent, for the nine months ended September 30, 2021, compared with the nine months ended September 30, 2020. The increase was due primarily to higher contributions from transportation brokerage, supply chain management, and freight forwarding.
Liquidity, Cash Flows and Capital Allocation
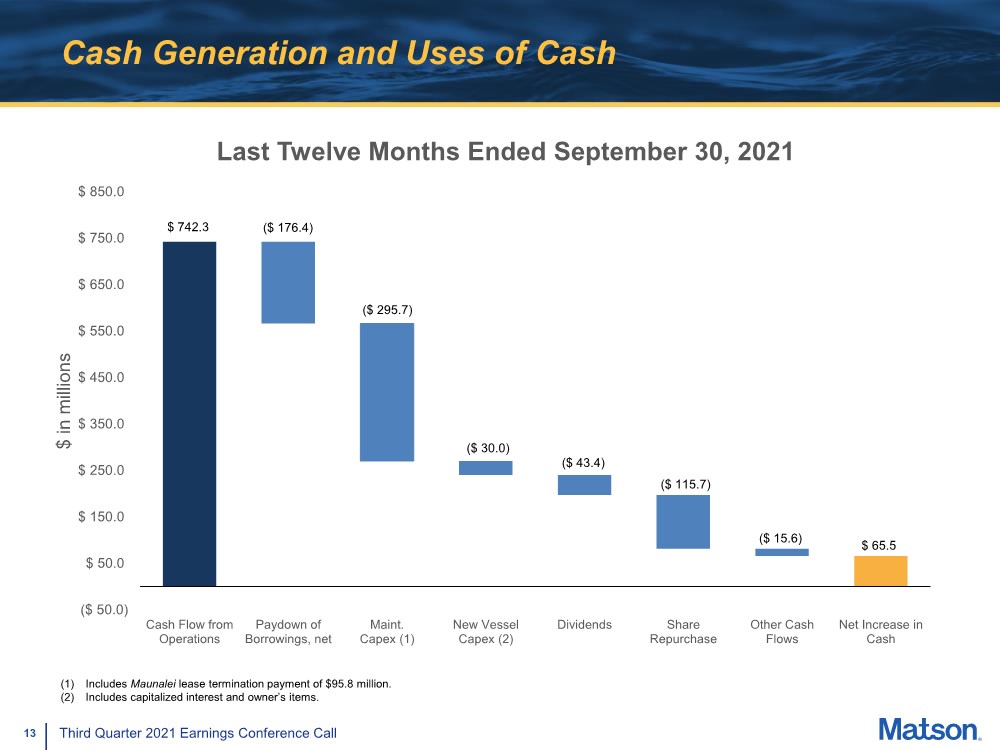
Matson’s Cash and Cash Equivalents increased by $61.5 million from $14.4 million at December 31, 2020 to $75.9 million at September 30, 2021. Matson generated net cash from operating activities of $583.3 million during the nine months ended September 30, 2021, compared to $270.8 million during the nine months ended September 30, 2020. Capital expenditures totaled $244.7 million for the nine months ended September 30, 2021, compared with $111.3 million for the nine months ended September 30, 2020. The increase in capital expenditures was primarily due to the lease termination payment of $95.8 million for Maunalei. Total debt decreased by $112.9 million during the nine months to $647.2 million as of September 30, 2021, of which $582.2 million was classified as long-term debt.
Under the recently amended debt agreements, as of September 30, 2021 Matson had available borrowings under its revolving credit facility of $641.9 million and a leverage ratio per the amended debt agreements of approximately 0.6x.
During the third quarter of 2021, Matson repurchased approximately 1.5 million shares for a total cost of $115.7 million. From October 1, 2021 through November 2, 2021, Matson repurchased an additional approximately 0.4 million shares for a total cost of $33.1 million. As of November 2, 2021, the Company had approximately 1.1 million shares remaining on its share repurchase program.
5
On July 7, 2021, a subsidiary of Matson entered into an agreement to terminate the outstanding operating lease on Maunalei for $95.8 million including accrued lease interest, thereby acquiring the vessel. The Company paid for the termination with a combination of cash on hand and borrowings on the revolving credit facility. As a result of the transaction, the Company expects approximately $6.0 million in lower cash operating costs in the second half of 2021 as a result of the elimination in lease expense.
As previously announced, Matson’s Board of Directors declared a cash dividend of $0.30 per share payable on December 2, 2021 to all shareholders of record as of the close of business on November 11, 2021.
6
Teleconference and Webcast
A conference call is scheduled on November 3, 2021 at 4:30 p.m. ET when Matt Cox, Chairman and Chief Executive Officer, and Joel Wine, Executive Vice President and Chief Financial Officer, will discuss Matson’s third quarter results.
Date of Conference Call: | Wednesday, November 3, 2021 |
Scheduled Time: | 4:30 p.m. ET / 1:30 p.m. PT / 10:30 a.m. HT |
Participant Toll Free Dial-In #: | 1-877-312-5524 |
International Dial-In #: | 1-253-237-1144 |
The conference call will be broadcast live along with an additional slide presentation on the Company’s website at www.matson.com, under Investors. A replay of the conference call will be available approximately two hours after the call through November 10, 2021 by dialing 1-855-859-2056 or 1-404-537-3406 and using the conference number 4158606. The slides and audio webcast of the conference call will be archived for one full quarter on the Company's website at www.matson.com, under Investors.
About the Company
Founded in 1882, Matson (NYSE: MATX) is a leading provider of ocean transportation and logistics services. Matson provides a vital lifeline to the domestic non-contiguous economies of Hawaii, Alaska, and Guam, and to other island economies in Micronesia. Matson also operates premium, expedited services from China to Long Beach, California, provides service to Okinawa, Japan and various islands in the South Pacific, and operates an international export service from Dutch Harbor to Asia. The Company's fleet of owned and chartered vessels includes containerships, combination container and roll-on/roll-off ships and custom-designed barges. Matson Logistics, established in 1987, extends the geographic reach of Matson’s transportation network throughout North America. Its integrated, asset-light logistics services include rail intermodal, highway brokerage, warehousing, freight consolidation, Asia supply chain services, and forwarding to Alaska. Additional information about the Company is available at www.matson.com.
GAAP to Non-GAAP Reconciliation
This press release, the Form 8-K and the information to be discussed in the conference call include non-GAAP measures. While Matson reports financial results in accordance with U.S. generally accepted accounting principles (“GAAP”), the Company also considers other non-GAAP measures to evaluate performance, make day-to-day operating decisions, help investors understand our ability to incur and service debt and to make capital expenditures, and to understand period-over-period operating results separate and apart from items that may, or could, have a disproportional positive or negative impact on results in any particular period. These non-GAAP measures include, but are not limited to, Earnings Before Interest, Income Taxes, Depreciation and Amortization (“EBITDA”) and Net Debt-to-EBITDA.
7
Forward-Looking Statements
Statements in this news release that are not historical facts are “forward-looking statements,” within the meaning of the Private Securities Litigation Reform Act of 1995, including without limitation those statements regarding performance and financial results; capital expenditures; vessel deployments; vessel transit times; cargo availability times; demand for our expedited Transpacific services; duration of the CCX service; supply and demand conditions in the Transpacific tradelane; supply chain congestion; consumption trends; retail and e-commerce demand; inventory restocking conditions; tourism and visitor levels; unemployment trends; economic recovery and drivers in Hawaii, Alaska and Guam; volume trends; impact of the COVID-19 Delta variant; lift activity at SSAT; goals, progress, expectations or reporting with respect to corporate responsibility, sustainability, environmental matters, including greenhouse gas emission reduction goals and the costs and timing of liquefied natural gas (“LNG”) installations on certain vessels, employees, policy, and procurement; and the financial effects of the Maunalei transaction. These statements involve a number of risks and uncertainties that could cause actual results to differ materially from those contemplated by the relevant forward-looking statement, including but not limited to risks and uncertainties relating to repeal, substantial amendment or waiver of the Jones Act or its application, or our failure to maintain our status as a United States citizen under the Jones Act; regional, national and international economic conditions; new or increased competition or improvements in competitors’ service levels; fuel prices, our ability to collect fuel-related surcharges and/or the cost or availability of required fuels, LNG, or carbon neutral fuels and technologies; our relationship with vendors, customers and partners and changes in related agreements; the actions of our competitors; our ability to offer a differentiated service in China for which customers are willing to pay a significant premium; the imposition of tariffs or a change in international trade policies; the magnitude and timing of the impact of public health crises, including COVID-19; any unanticipated dry-dock or repair expenses; any delays or cost overruns related to the modernization of terminals; consummating and integrating acquisitions; changes in general economic and/or industry-specific conditions; competition and growth rates within the logistics industry; freight levels and increasing costs and availability of truck capacity or alternative means of transporting freight; changes in relationships with existing truck, rail, ocean and air carriers; changes in customer base due to possible consolidation among customers; conditions in the financial markets; changes in our credit profile and our future financial performance; our ability to obtain future debt financings; continuation of the Title XI and CCF programs; the impact of future and pending legislation and regulations, including regulations related to greenhouse gas emissions and other environmental laws and regulations; government regulations and investigations; relations with our unions; satisfactory negotiation and renewal of expired collective bargaining agreements without significant disruption to Matson’s operations; war, terrorist attacks or other acts of violence; the use of our information technology and communication systems and cybersecurity attacks; and the occurrence of marine accidents, poor weather or natural disasters. These forward-looking statements are not guarantees of future performance. This release should be read in conjunction with our Annual Report on Form 10-K for the year ended December 31, 2020 and our other filings with the SEC through the date of this release, which identify important factors that could affect the forward-looking statements in this release. We do not undertake any obligation to update our forward-looking statements.
8
MATSON, INC. AND SUBSIDIARIES
Condensed Consolidated Statements of Income
(Unaudited)
| | Three Months Ended |
| Nine Months Ended | ||||||||
| | September 30, |
| September 30, | ||||||||
(In millions, except per share amounts) |
| 2021 |
| 2020 |
| 2021 |
| 2020 | ||||
Operating Revenue: | | | | | | | | | | | | |
Ocean Transportation | | $ | 863.5 | | $ | 498.3 | | $ | 2,106.9 | | $ | 1,310.0 |
Logistics | |
| 208.1 | |
| 146.9 | |
| 551.4 | |
| 373.2 |
Total Operating Revenue | |
| 1,071.6 | |
| 645.2 | |
| 2,658.3 | |
| 1,683.2 |
| | | | | | | | | | | | |
Costs and Expenses: | | | | | | | | | | | | |
Operating costs | |
| (649.3) | |
| (495.8) | |
| (1,809.6) | |
| (1,370.4) |
Income from SSAT | |
| 13.0 | |
| 7.7 | |
| 35.0 | |
| 15.4 |
Selling, general and administrative | |
| (57.4) | |
| (58.7) | |
| (171.7) | |
| (165.6) |
Total Costs and Expenses | |
| (693.7) | |
| (546.8) | |
| (1,946.3) | |
| (1,520.6) |
| | | | | | | | | | | | |
Operating Income | |
| 377.9 | |
| 98.4 | |
| 712.0 | |
| 162.6 |
Interest expense | |
| (5.1) | |
| (5.7) | |
| (17.9) | |
| (22.5) |
Other income (expense), net | |
| 1.8 | |
| 2.4 | |
| 4.7 | |
| 4.5 |
Income before Income Taxes | |
| 374.6 | |
| 95.1 | |
| 698.8 | |
| 144.6 |
Income taxes | |
| (91.4) | |
| (24.2) | |
| (165.9) | |
| (37.1) |
Net Income | | $ | 283.2 | | $ | 70.9 | | $ | 532.9 | | $ | 107.5 |
| | | | | | | | | | | | |
Basic Earnings Per Share | | $ | 6.60 | | $ | 1.65 | | $ | 12.31 | | $ | 2.50 |
Diluted Earnings Per Share | | $ | 6.53 | | $ | 1.63 | | $ | 12.19 | | $ | 2.48 |
| | | | | | | | | | | | |
Weighted Average Number of Shares Outstanding: | | | | | | | | | | | | |
Basic | |
| 42.9 | |
| 43.1 | |
| 43.3 | |
| 43.0 |
Diluted | |
| 43.4 | |
| 43.5 | |
| 43.7 | |
| 43.4 |
9
MATSON, INC. AND SUBSIDIARIES
Condensed Consolidated Balance Sheets
(Unaudited)
|
| September 30, |
| December 31, | ||
(In millions) | | 2021 | | 2020 | ||
ASSETS | | | | | | |
Current Assets: | | | | | | |
Cash and cash equivalents | | $ | 75.9 | | $ | 14.4 |
Other current assets | |
| 405.8 | |
| 291.5 |
Total current assets | |
| 481.7 | |
| 305.9 |
Long-term Assets: | | | | | | |
Investment in SSAT | |
| 37.2 | |
| 48.7 |
Property and equipment, net | |
| 1,826.8 | |
| 1,689.9 |
Goodwill | |
| 327.8 | |
| 327.8 |
Intangible assets, net | |
| 183.8 | |
| 192.0 |
Other long-term assets | |
| 365.5 | |
| 336.3 |
Total long-term assets | | | 2,741.1 | | | 2,594.7 |
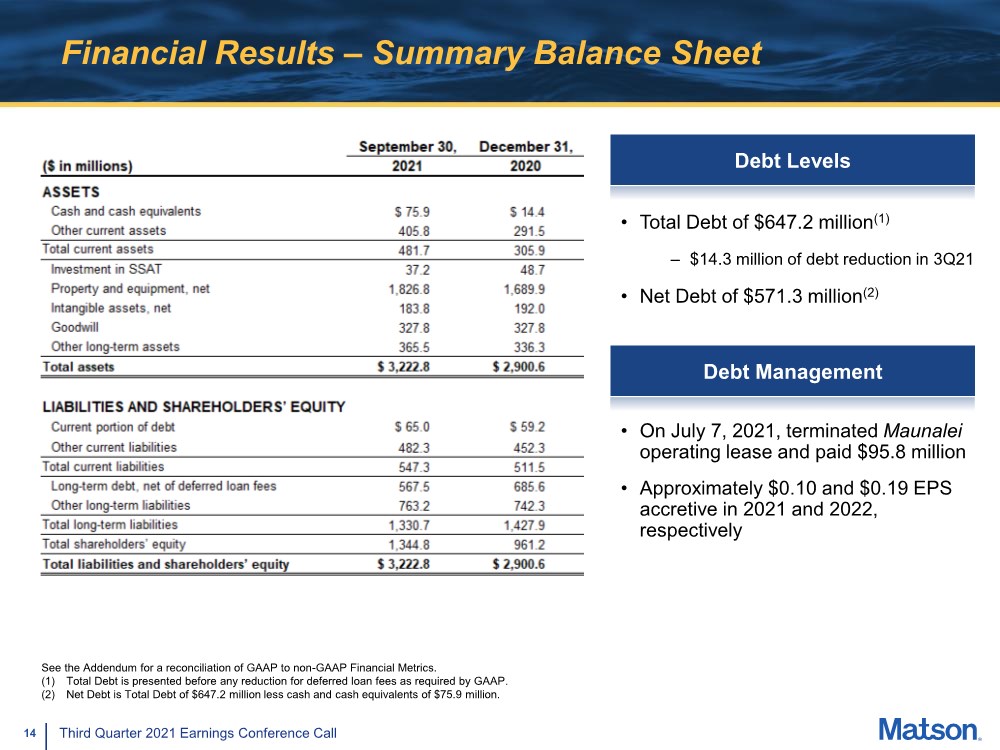
Total assets | | $ | 3,222.8 | | $ | 2,900.6 |
| | | | | | |
LIABILITIES AND SHAREHOLDERS’ EQUITY | | | | | | |
Current Liabilities: | | | | | | |
Current portion of debt | | $ | 65.0 | | $ | 59.2 |
Other current liabilities | |
| 482.3 | |
| 452.3 |
Total current liabilities | |
| 547.3 | |
| 511.5 |
Long-term Liabilities: | | | | | | |
Long-term debt, net of deferred loan fees | |
| 567.5 | |
| 685.6 |
Deferred income taxes | |
| 420.0 | |
| 389.6 |
Other long-term liabilities | |
| 343.2 | |
| 352.7 |
Total long-term liabilities | |
| 1,330.7 | |
| 1,427.9 |
| | | | | | |
Total shareholders’ equity | |
| 1,344.8 | |
| 961.2 |
Total liabilities and shareholders’ equity | | $ | 3,222.8 | | $ | 2,900.6 |
10
MATSON, INC. AND SUBSIDIARIES
Condensed Consolidated Statements of Cash Flows
(Unaudited)
| | Nine Months Ended September 30, | | ||||
(In millions) |
| 2021 |
| 2020 |
| ||
Cash Flows From Operating Activities: | | | | | | | |
Net income | | $ | 532.9 | | $ | 107.5 | |
Reconciling adjustments: | | | | | | | |
Depreciation and amortization | |
| 100.9 | |
| 84.5 | |
Amortization of operating lease right of use assets | | | 73.9 | | | 53.1 | |
Deferred income taxes | |
| 30.3 | |
| 33.5 | |
Share-based compensation expense | |
| 14.2 | |
| 12.0 | |
Income from SSAT | |
| (35.0) | |
| (15.4) | |
Distribution from SSAT | | | 46.9 | | | 37.9 | |
Other | | | (1.1) | | | 0.5 | |
Changes in assets and liabilities: | | | | | | | |
Accounts receivable, net | |
| (75.2) | |
| (28.9) | |
Deferred dry-docking payments | |
| (25.8) | |
| (11.1) | |
Deferred dry-docking amortization | |
| 18.0 | |
| 17.8 | |
Prepaid expenses and other assets | |
| (46.7) | |
| 19.6 | |
Accounts payable, accruals and other liabilities | |
| 30.2 | |
| 24.0 | |
Operating lease liabilities | | | (72.1) | | | (53.7) | |
Other long-term liabilities | |
| (8.1) | |
| (10.5) | |
Net cash provided by operating activities | |
| 583.3 | |
| 270.8 | |
| | | | | | | |
Cash Flows From Investing Activities: | | | | | | | |
Capitalized vessel construction expenditures | | | — | | | (57.8) | |
Other capital expenditures | |
| (244.7) | |
| (53.5) | |
Proceeds from disposal of property and equipment | |
| 2.2 | |
| 15.7 | |
Cash deposits into Capital Construction Fund | |
| (31.2) | |
| (97.1) | |
Withdrawals from Capital Construction Fund | | | 31.2 | | | 97.1 | |
Net cash used in investing activities | |
| (242.5) | |
| (95.6) | |
| | | | | | | |
Cash Flows From Financing Activities: | | | | | | | |
Proceeds from issuance of debt | |
| — | |
| 325.5 | |
Repayments of debt | |
| (41.1) | |
| (204.2) | |
Proceeds from revolving credit facility | | | 304.3 | | | 547.4 | |
Repayments of revolving credit facility | |
| (376.1) | |
| (803.5) | |
Payment of financing costs | | | (3.0) | | | (18.5) | |
Proceeds from issuance of capital stock | | | — | | | 0.1 | |
Dividends paid | | | (33.3) | |
| (29.1) | |
Repurchase of Matson common stock | | | (115.7) | |
| — | |
Tax withholding related to net share settlements of restricted stock units | | | (14.4) | | | (5.6) | |
Net cash used in financing activities | |
| (279.3) | |
| (187.9) | |
| | | | | | | |
Net Increase (Decrease) in Cash, Cash Equivalents and Restricted Cash | |
| 61.5 | |
| (12.7) | |
Cash, Cash Equivalents and Restricted Cash, Beginning of the Period | |
| 19.7 | |
| 28.4 | |
Cash, Cash Equivalents and Restricted Cash, End of the Period | | $ | 81.2 | | $ | 15.7 | |
| | | | | | | |
Reconciliation of Cash, Cash Equivalents and Restricted Cash, End of the Period: | | | | | | | |
Cash and Cash Equivalents | | $ | 75.9 | | $ | 12.7 | |
Restricted Cash | | | 5.3 | | | 3.0 | |
Total Cash, Cash Equivalents and Restricted Cash, End of the Period | | $ | 81.2 | | $ | 15.7 | |
| | | | | | | |
Supplemental Cash Flow Information: | | | | | | | |
Interest paid, net of capitalized interest | | $ | 15.3 | | $ | 22.4 | |
Income tax payments and (refunds), net | | $ | 162.1 | | $ | (18.0) | |
| | | | | | | |
Non-cash Information: | | | | | | | |
Capital expenditures included in accounts payable, accruals and other liabilities | | $ | 5.6 | | $ | 5.9 | |
11
MATSON, INC. AND SUBSIDIARIES
Total Debt to Net Debt and Net Income to EBITDA Reconciliations
(Unaudited)
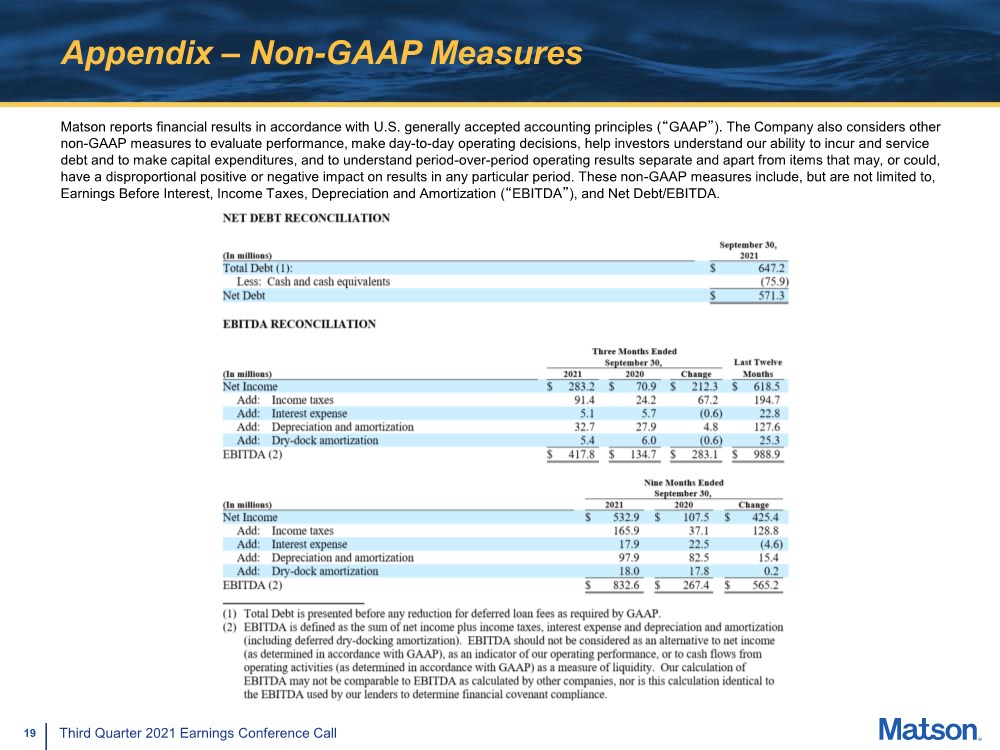
NET DEBT RECONCILIATION
| | September 30, | |
(In millions) |
| 2021 | |
Total Debt (1): | | $ | 647.2 |
Less: Cash and cash equivalents | |
| (75.9) |
Net Debt | | $ | 571.3 |
EBITDA RECONCILIATION
| | Three Months Ended |
| | | | |||||||
| | September 30, |
| Last Twelve | | ||||||||
(In millions) |
| 2021 |
| 2020 |
| Change |
| Months |
| ||||
Net Income | | $ | 283.2 | | $ | 70.9 | | $ | 212.3 | | $ | 618.5 | |
Add: Income taxes | |
| 91.4 | |
| 24.2 | |
| 67.2 | | | 194.7 | |
Add: Interest expense | |
| 5.1 | |
| 5.7 | |
| (0.6) | | | 22.8 | |
Add: Depreciation and amortization | |
| 32.7 | |
| 27.9 | |
| 4.8 | | | 127.6 | |
Add: Dry-dock amortization | |
| 5.4 | |
| 6.0 | |
| (0.6) | | | 25.3 | |
EBITDA (2) | | $ | 417.8 | | $ | 134.7 | | $ | 283.1 | | $ | 988.9 | |
| | Nine Months Ended |
| |||||||
| | September 30, |
| |||||||
(In millions) |
| 2021 |
| 2020 |
| Change |
| |||
Net Income | | $ | 532.9 | | $ | 107.5 | | $ | 425.4 | |
Add: Income taxes | |
| 165.9 | |
| 37.1 | |
| 128.8 | |
Add: Interest expense | |
| 17.9 | |
| 22.5 | |
| (4.6) | |
Add: Depreciation and amortization | |
| 97.9 | |
| 82.5 | |
| 15.4 | |
Add: Dry-dock amortization | |
| 18.0 | |
| 17.8 | |
| 0.2 | |
EBITDA (2) | | $ | 832.6 | | $ | 267.4 | | $ | 565.2 | |
| (1) | Total Debt is presented before any reduction for deferred loan fees as required by GAAP. |
| (2) | EBITDA is defined as the sum of net income plus income taxes, interest expense and depreciation and amortization (including deferred dry-docking amortization). EBITDA should not be considered as an alternative to net income (as determined in accordance with GAAP), as an indicator of our operating performance, or to cash flows from operating activities (as determined in accordance with GAAP) as a measure of liquidity. Our calculation of EBITDA may not be comparable to EBITDA as calculated by other companies, nor is this calculation identical to the EBITDA used by our lenders to determine financial covenant compliance. |
12
Exhibit 99.2
| 1 Third Quarter 2021 Earnings Conference Call Third Quarter 2021 Earnings Conference Call November 3, 2021 |

| 2 Third Quarter 2021 Earnings Conference Call Forward-Looking Statements Statements made during this presentation that set forth expectations, predictions, projections or are about future events are based on facts and situations that are known to us as of November 3, 2021. We believe that our expectations and assumptions are reasonable. Actual results may differ materially, due to risks and uncertainties, such as those described on pages 12-21 of our Form 10-K filed on February 26, 2021 and other subsequent filings by Matson with the SEC. Statements made during this presentation are not guarantees of future performance. We do not undertake any obligation to update our forward-looking statements. |
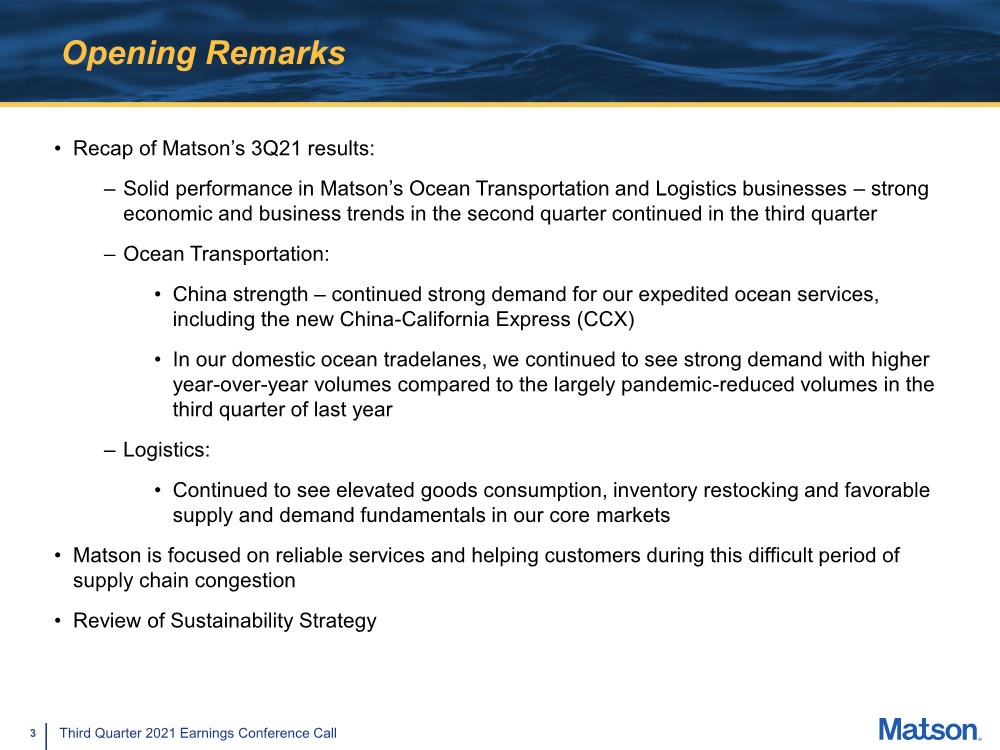
| 3 Third Quarter 2021 Earnings Conference Call Opening Remarks • Recap of Matson’s 3Q21 results: – Solid performance in Matson’s Ocean Transportation and Logistics businesses – strong economic and business trends in the second quarter continued in the third quarter – Ocean Transportation: • China strength – continued strong demand for our expedited ocean services, including the new China-California Express (CCX) • In our domestic ocean tradelanes, we continued to see strong demand with higher year-over-year volumes compared to the largely pandemic-reduced volumes in the third quarter of last year – Logistics: • Continued to see elevated goods consumption, inventory restocking and favorable supply and demand fundamentals in our core markets • Matson is focused on reliable services and helping customers during this difficult period of supply chain congestion • Review of Sustainability Strategy |
| 4 Third Quarter 2021 Earnings Conference Call Hawaii Service Third Quarter 2021 Performance • Container volume increased 11.5% YoY – Higher retail and hospitality-related demand compared to 3Q20, which was negatively impacted by state’s COVID- 19 mitigation efforts – Continued rebound in tourism and Hawaii economy – Towards end of quarter experienced a modest negative impact in freight related to state’s efforts to address COVID-19 Delta variant – After the Governor’s request in late August to defer travel plans, visitor traffic to the state softened • 3Q21 volume 10.6% higher than 3Q19 volume Container Volume (FEU Basis) 25,000 27,000 29,000 31,000 33,000 35,000 37,000 39,000 41,000 Q1 Q2 Q3 Q4 2020 2021 Note: 2Q 2020 volume figure includes volume related to Pasha’s vessel dry-docking. 11.5% |
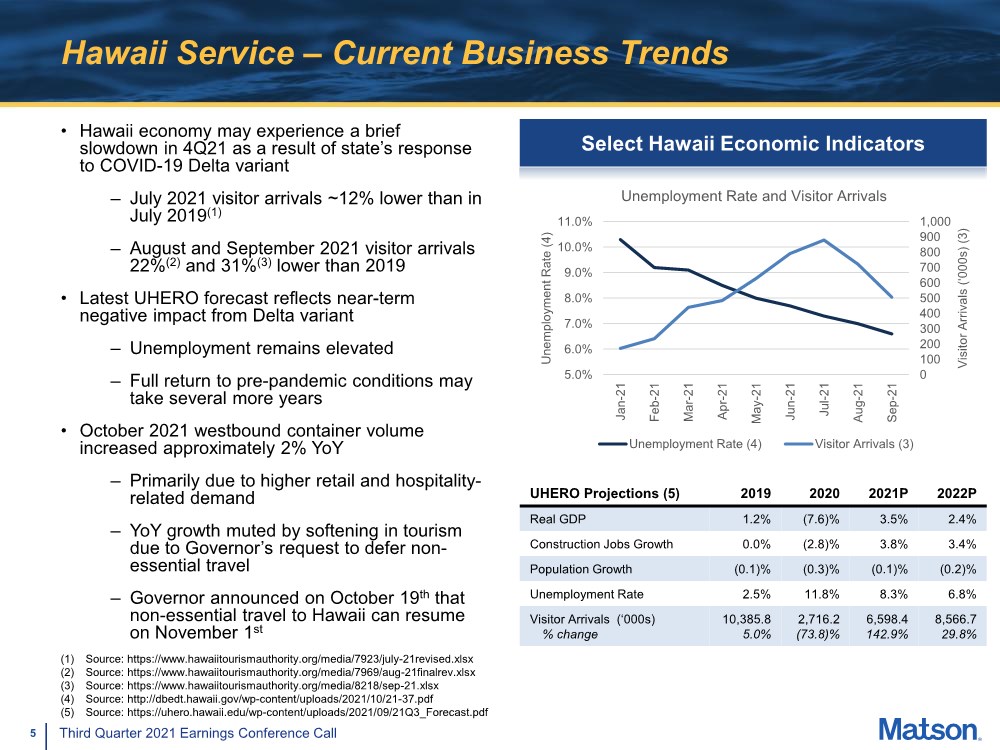
| 5 Third Quarter 2021 Earnings Conference Call Hawaii Service – Current Business Trends Select Hawaii Economic Indicators (1) Source: https://www.hawaiitourismauthority.org/media/7923/july-21revised.xlsx (2) Source: https://www.hawaiitourismauthority.org/media/7969/aug-21finalrev.xlsx (3) Source: https://www.hawaiitourismauthority.org/media/8218/sep-21.xlsx (4) Source: http://dbedt.hawaii.gov/wp-content/uploads/2021/10/21-37.pdf (5) Source: https://uhero.hawaii.edu/wp-content/uploads/2021/09/21Q3_Forecast.pdf UHERO Projections (5) 2019 2020 2021P 2022P Real GDP 1.2% (7.6)% 3.5% 2.4% Construction Jobs Growth 0.0% (2.8)% 3.8% 3.4% Population Growth (0.1)% (0.3)% (0.1)% (0.2)% Unemployment Rate 2.5% 11.8% 8.3% 6.8% Visitor Arrivals (‘000s) % change 10,385.8 5.0% 2,716.2 (73.8)% 6,598.4 142.9% 8,566.7 29.8% • Hawaii economy may experience a brief slowdown in 4Q21 as a result of state’s response to COVID-19 Delta variant – July 2021 visitor arrivals ~12% lower than in July 2019(1) – August and September 2021 visitor arrivals 22%(2) and 31%(3) lower than 2019 • Latest UHERO forecast reflects near-term negative impact from Delta variant – Unemployment remains elevated – Full return to pre-pandemic conditions may take several more years • October 2021 westbound container volume increased approximately 2% YoY – Primarily due to higher retail and hospitality- related demand – YoY growth muted by softening in tourism due to Governor’s request to defer non- essential travel – Governor announced on October 19th that non-essential travel to Hawaii can resume on November 1st 0 100 200 300 400 500 600 700 800 900 1,000 5.0% 6.0% 7.0% 8.0% 9.0% 10.0% 11.0% Jan-21 Feb-21 Mar-21 Apr-21 May-21 Jun-21 Jul-21 Aug-21 Sep-21 Visitor Arrivals (‘000s) (3) Unemployment Rate (4) Unemployment Rate and Visitor Arrivals Unemployment Rate (4) Visitor Arrivals (3) |
| 6 Third Quarter 2021 Earnings Conference Call China Service Third Quarter 2021 Performance Container Volume (FEU Basis) 8,000 13,000 18,000 23,000 28,000 33,000 38,000 43,000 48,000 53,000 Q1 Q2 Q3 Q4 2020 2021 Note: 2Q 2020 volume figure includes volume related to seven CLX+ voyages. 3Q21 volume figure includes volume related to five CCX voyages. 3Q 2020, 4Q 2020, 1Q 2021, 2Q 2021 and 3Q 2021 volume figures include weekly CLX+ voyages. 21.7% • Container volume increased 21.7% YoY – CCX volume – Volume from an extra loader – Total number of eastbound voyages increased by 6 YoY: 5 from CCX and one extra loader • Demand driven by e-commerce, garments and other goods – Sustained and elevated consumption trends and low inventory levels driving increased demand for expedited ocean services |
| 7 Third Quarter 2021 Earnings Conference Call China Service – Current Business Trends 1.00 1.10 1.20 1.30 1.40 1.50 1.60 1.70 1.80 Jan. 2020 Apr. 2020 Jul. 2020 Oct. 2020 Jan. 2021 Apr. 2021 Jul. 2021 U.S. Retail Trade Inventories/Sales (Adjusted) Source: https://www.census.gov/mtis/www/data/text/timeseries1.xlsx • October 2021 eastbound container volume increased approximately 11% YoY – Addition of CCX volume – One less CLX+ sailing this October as a result of timing • Currently in the Transpacific tradelane, experiencing supply chain congestion due to a combination of inventory restocking and ongoing elevated consumption trends – Retail and e-commerce demand remains strong – Continued challenging inventory replenishment environment in retail • We expect elevated consumption demand and inventory restocking conditions to remain largely in place at least through mid- year 2022 |

| 8 Third Quarter 2021 Earnings Conference Call Guam Service Third Quarter 2021 Performance Container Volume (FEU Basis) 3,000 3,500 4,000 4,500 5,000 5,500 6,000 Q1 Q2 Q3 Q4 2020 2021 14.6% • Container volume increased 14.6% YoY – Higher retail-related demand compared to pandemic-reduced level in year ago period • 3Q21 volume 17.0% higher than 3Q19 volume Current Business Trends • Guam economy recovering slowly as tourism remains constrained – Economic recovery trajectory remains uncertain • October 2021 westbound container volume increased approximately 11% YoY |
| 9 Third Quarter 2021 Earnings Conference Call Alaska Service Third Quarter 2021 Performance • Container volume increased 10.7% YoY – Addition of Alaska-Asia Express (AAX) seafood volume – Additional northbound sailing – Higher retail-related demand – Higher southbound volume • 3Q21 volume 12.4% higher than 3Q19 volume Container Volume (FEU Basis) 10,000 12,000 14,000 16,000 18,000 20,000 22,000 24,000 Q1 Q2 Q3 Q4 2020 2021 10.7% Note: 1Q 2020 volume figure includes volume related to TOTE’s vessel dry-docking. AAX service started in 4Q20. Current Business Trends • Improving economic trends in Alaska, but economic recovery trajectory remains uncertain • October 2021 northbound container volume was approximately flat YoY |
| 10 Third Quarter 2021 Earnings Conference Call SSAT Joint Venture Third Quarter 2021 Performance Equity in Income of Joint Venture $ 0.0 $ 2.0 $ 4.0 $ 6.0 $ 8.0 $ 10.0 $ 12.0 $ 14.0 Q1 Q2 Q3 Q4 $ in millions 2020 2021 Current Business Trends • Terminal joint venture contribution was $13.0 million, $5.3 million higher than last year – Primarily due to higher lift volume • Continue to see elevated import volume into U.S. West Coast |
| 11 Third Quarter 2021 Earnings Conference Call Matson Logistics Third Quarter 2021 Performance Operating Income $ 0.0 $ 2.0 $ 4.0 $ 6.0 $ 8.0 $ 10.0 $ 12.0 $ 14.0 $ 16.0 $ 18.0 Q1 Q2 Q3 Q4 $ in millions 2020 2021 • Operating income of $16.0 million; YoY change of $4.1 million – Higher contributions from supply chain management and transportation brokerage • Benefitted from: – Elevated goods consumption and inventory restocking – Favorable supply and demand fundamentals in core markets Current Business Trends • Some business lines continue to benefit from elevated container volumes into Southern California |
| 12 Third Quarter 2021 Earnings Conference Call Financial Results – Summary Income Statement See the Addendum for a reconciliation of GAAP to non-GAAP Financial Metrics. |
| 13 Third Quarter 2021 Earnings Conference Call Cash Generation and Uses of Cash ($ 50.0) $ 50.0 $ 150.0 $ 250.0 $ 350.0 $ 450.0 $ 550.0 $ 650.0 $ 750.0 $ 850.0 Cash Flow from Operations Paydown of Borrowings, net Maint. Capex (1) New Vessel Capex (2) Dividends Share Repurchase Other Cash Flows Net Increase in Cash $ in millions Last Twelve Months Ended September 30, 2021 $ 742.3 ($ 176.4) ($ 295.7) ($ 30.0) ($ 43.4) $ 65.5 ($ 15.6) (1) Includes Maunalei lease termination payment of $95.8 million. (2) Includes capitalized interest and owner’s items. ($ 115.7) |
| 14 Third Quarter 2021 Earnings Conference Call Financial Results – Summary Balance Sheet • Total Debt of $647.2 million(1) – $14.3 million of debt reduction in 3Q21 • Net Debt of $571.3 million(2) See the Addendum for a reconciliation of GAAP to non-GAAP Financial Metrics. (1) Total Debt is presented before any reduction for deferred loan fees as required by GAAP. (2) Net Debt is Total Debt of $647.2 million less cash and cash equivalents of $75.9 million. Debt Levels Debt Management • On July 7, 2021, terminated Maunalei operating lease and paid $95.8 million • Approximately $0.10 and $0.19 EPS accretive in 2021 and 2022, respectively |
| 15 Third Quarter 2021 Earnings Conference Call Sustainability Strategy • We believe we have a responsibility to significantly reduce our impact on climate change by lowering our greenhouse gas (GHG) emissions Short-term goal • State-of-the-art Aloha and Kanaloa Class vessels • Recycle the last of our steamships in 2021 Medium-term goal • Reduce Scope 1 GHG emissions from our owned fleet by 40% by 2030 using a 2016 baseline Long-term goal • Achieve net zero Scope 1 GHG emissions from our fleet by 2050 • We intend to report our climate risks and opportunities in accordance with the Task Force on Climate-related Financial Disclosures (TCFD) recommendations in 2022 • Safe and healthy work environment • Advance diversity, equity, and inclusion • Workforce engagement and development • Giving back to the communities we live and operate in • Committed to upholding the highest ethical standards • Board of Directors is engaged in ESG matters • Build trust and goodwill with our many stakeholders Matson has always been committed to advancing responsible, sustainable and ethical practices throughout our Company. Environmental Stewardship People and Places Corporate Integrity |

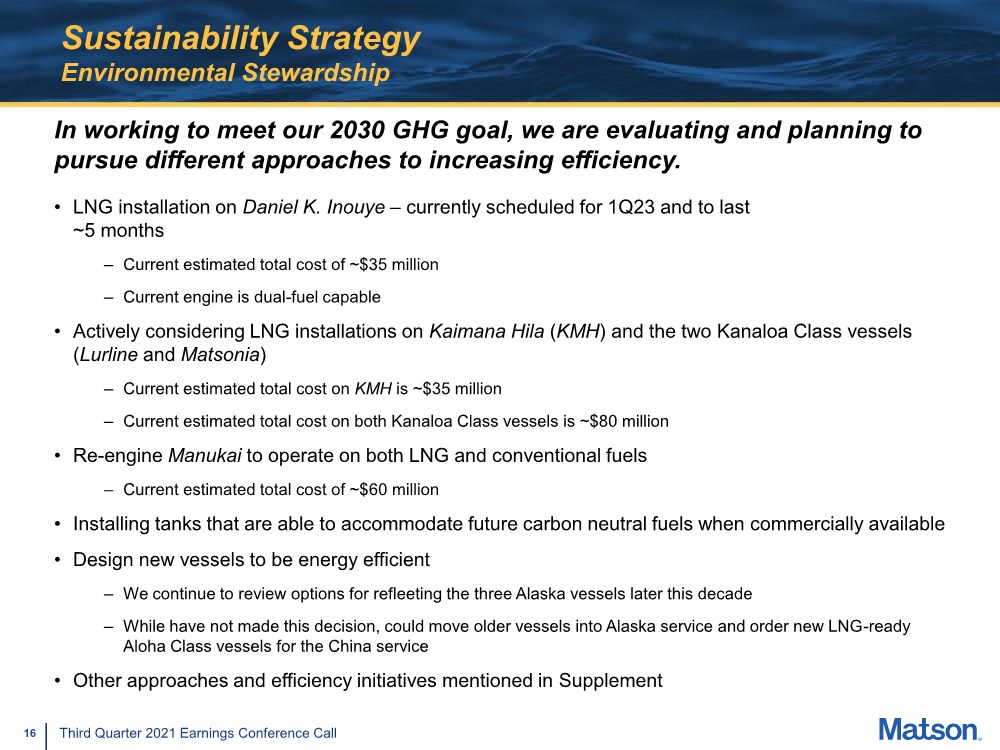
| 16 Third Quarter 2021 Earnings Conference Call Sustainability Strategy Environmental Stewardship • LNG installation on Daniel K. Inouye – currently scheduled for 1Q23 and to last ~5 months – Current estimated total cost of ~$35 million – Current engine is dual-fuel capable • Actively considering LNG installations on Kaimana Hila (KMH) and the two Kanaloa Class vessels (Lurline and Matsonia) – Current estimated total cost on KMH is ~$35 million – Current estimated total cost on both Kanaloa Class vessels is ~$80 million • Re-engine Manukai to operate on both LNG and conventional fuels – Current estimated total cost of ~$60 million • Installing tanks that are able to accommodate future carbon neutral fuels when commercially available • Design new vessels to be energy efficient – We continue to review options for refleeting the three Alaska vessels later this decade – While have not made this decision, could move older vessels into Alaska service and order new LNG-ready Aloha Class vessels for the China service • Other approaches and efficiency initiatives mentioned in Supplement In working to meet our 2030 GHG goal, we are evaluating and planning to pursue different approaches to increasing efficiency. |
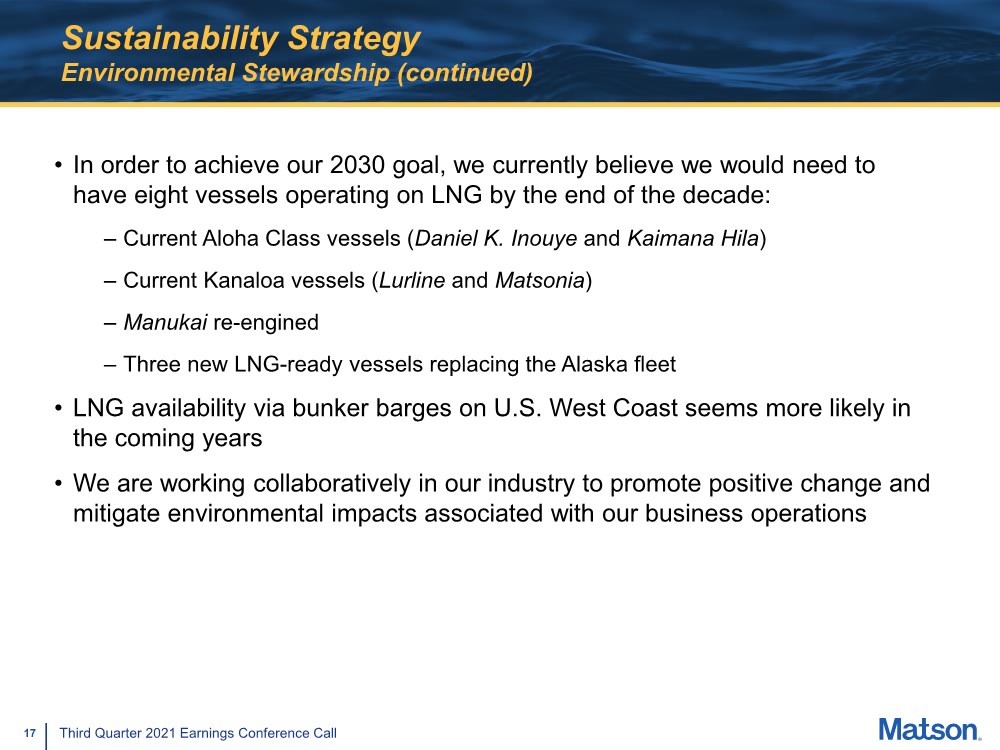
| 17 Third Quarter 2021 Earnings Conference Call Sustainability Strategy Environmental Stewardship (continued) • In order to achieve our 2030 goal, we currently believe we would need to have eight vessels operating on LNG by the end of the decade: – Current Aloha Class vessels (Daniel K. Inouye and Kaimana Hila) – Current Kanaloa vessels (Lurline and Matsonia) – Manukai re-engined – Three new LNG-ready vessels replacing the Alaska fleet • LNG availability via bunker barges on U.S. West Coast seems more likely in the coming years • We are working collaboratively in our industry to promote positive change and mitigate environmental impacts associated with our business operations |
| 18 Third Quarter 2021 Earnings Conference Call Appendix |

| 19 Third Quarter 2021 Earnings Conference Call Appendix – Non-GAAP Measures Matson reports financial results in accordance with U.S. generally accepted accounting principles (“GAAP”). The Company also considers other non-GAAP measures to evaluate performance, make day-to-day operating decisions, help investors understand our ability to incur and service debt and to make capital expenditures, and to understand period-over-period operating results separate and apart from items that may, or could, have a disproportional positive or negative impact on results in any particular period. These non-GAAP measures include, but are not limited to, Earnings Before Interest, Income Taxes, Depreciation and Amortization (“EBITDA”), and Net Debt/EBITDA. |