
PATK 8-K
Patrick Industries Inc (PATK)
8-K
2022-04-28
For: 2022-04-28
View Original
Added on
April 10, 2026
UNITED STATES
SECURITIES AND EXCHANGE COMMISSION
Washington, D.C. 20549
SECURITIES AND EXCHANGE COMMISSION
Washington, D.C. 20549
FORM
CURRENT REPORT
Pursuant To Section 13 OR 15(d) Of The Securities Exchange Act Of 1934
Date of report (Date of earliest event reported) | |||||
| (Exact name of registrant as specified in its charter) | |||||
| (State or other jurisdiction of incorporation) | (Commission File Number) | (IRS Employer Identification Number) | ||||||
| (Address of Principal Executive Offices) | (Zip Code) | ||||||||||
| Registrant’s Telephone Number, including area code | ||||||||
| (Former name or former address if changed since last report) | ||||||||
Check the appropriate box below if the Form 8-K filing is intended to simultaneously satisfy the filing obligation of the registrant under any of the following provisions (see General Instruction A.2. below):
Securities registered pursuant to Section 12(b) of the Act:
| Title of each class | Trading Symbol | Name of each exchange on which registered | ||||||
| | | |||||||
Indicate by check mark whether the registrant is an emerging growth company as defined in Rule 405 of the Securities Act of 1933 (§230.405 of this chapter) or Rule 12b-2 of the Securities Exchange Act of 1934 (§240.12b-2 of this chapter). Emerging growth company ☐
If an emerging growth company, indicate by check mark if the registrant has elected not to use the extended transition period for complying with any new or revised financial accounting standards provided pursuant to Section 13(a) of the Exchange Act. ¨
Item 2.02. Results of Operations and Financial Condition.
On April 28, 2022, the Company issued a press release announcing operating results for the first quarter ended March 27, 2022. A copy of the press release is furnished herewith as Exhibit 99.1 and incorporated herein by reference.
Item 7.01 Regulation FD Disclosure
The information referenced in this Form 8-K is furnished pursuant to Item 7.01, “Regulation FD Disclosure.” Such information, including the Exhibit attached hereto, shall not be deemed “filed” for purposes of Section 18 of the Securities Exchange Act of 1934, nor shall it be deemed incorporated by reference in any filing under the Securities Act of 1933, except as shall be expressly set forth by specific reference in such filing.
(a) Slides for Earnings Presentation as contained in Exhibit 99.2
Item 9.01 Financial Statements and Exhibits
(d) Exhibits
Exhibit 99.1 - Press Release issued April 28, 2022
Exhibit 99.2 - Slides for Earnings Presentation
Exhibit 104 - Cover Page Interactive Date File (embedded within the Inline XBRL document)
SIGNATURES
Pursuant to the requirements of the Securities Exchange Act of 1934, the Registrant has duly caused this report to be signed on its behalf by the undersigned hereunto duly authorized.
| PATRICK INDUSTRIES, INC. | ||||||||
| (Registrant) | ||||||||
| Date: April 28, 2022 | By: | /s/ Jacob R. Petkovich | ||||||
| Jacob R. Petkovich | ||||||||
| Executive Vice President - Finance, Chief Financial Officer, and Treasurer | ||||||||
 News Release
Patrick Industries, Inc. Reports First Quarter 2022 Financial Results
First Quarter 2022 Highlights (compared to First Quarter 2021 unless otherwise noted)
•Net sales of $1.3 billion increased 58%, reflecting momentum in all end markets and contribution from 2021 acquisitions
•Gross profit of $295 million increased 83%
•Gross margin of 22.0% increased 300 basis points
•Operating income of $162 million increased 136%
•Operating margin of 12.1% increased 400 basis points
•Net income of $113 million increased 137%
•Diluted earnings per share of $4.54 increased 123%, including $0.39 dilutive impact of accounting treatment for convertible notes per new standard
•Acquisition of Rockford Corporation and the Rockford Fosgate® brand
ELKHART, IN - April 28, 2022 - Patrick Industries, Inc. (NASDAQ: PATK), a leading component solutions provider for the RV, marine, manufactured housing ("MH") and industrial markets today reported financial results for the first quarter ended March 27, 2022.
Net sales in the first quarter of 2022 increased $491.7 million, or 58%, to $1.3 billion from $850.5 million in the first quarter of 2021. The increase reflects continued strong performance in our RV and marine leisure lifestyle markets as well as our MH and industrial end markets, market share gains, and the impact of acquisitions completed in 2021.
Operating income of $161.8 million increased $93.3 million, or 136%, from $68.5 million in the first quarter of 2021. Operating margin of 12.1% in the first quarter of 2022 increased 400 basis points compared to 8.1% in the same period a year ago, driven principally by the realization of productivity improvements and labor efficiencies, increased throughput and leverage of the fixed cost structure, and the contribution of acquisitions.
Net income was $112.7 million, an increase of 137% compared to $47.5 million in the first quarter of 2021. Diluted earnings per share was $4.54, an increase of 123% compared to $2.04 for the first quarter of 2021.
In the first quarter of 2022, the Company adopted a new accounting standard that requires its 1.00% convertible notes due 2023 to be presented on an "if converted" basis in the calculation of diluted earnings per share. As a result of the adoption of this standard, the Company's first quarter 2022 diluted earnings per share was reduced by $0.39. Prior year results were not affected by the new accounting standard. The Company does not intend to issue shares in settlement of convertible notes that may be converted by their holders.
"We are pleased with our first quarter performance as our team continued to execute on driving efficiencies with improved scheduling and more consistent material procurement on the back of strong production levels across all of our end markets," said Andy Nemeth, Chief Executive Officer. "Although supply chain visibility remains challenging with certain products, the dedication our team put forth over the past twelve months to coordinate our efforts across our brands and operations and provide better procurement stability are taking hold to drive improved service and reliability for our customers."
Jeff Rodino, President, said, "In March, we welcomed Rockford Corporation and the Rockford Fosgate® brand into the Patrick family, which represents our strategic expansion of our platform to the powersports market and related aftermarket. Additionally, during the quarter, we achieved substantial rewards from our investment of over $100 million in capital expenditures over the last 21 months, as our automation and
technology initiatives are helping us best leverage our labor resources, thus improving our gross and operating margins."
First Quarter 2022 Revenue by Market Sector (compared to First Quarter 2021 unless otherwise noted)
RV (61% of Revenue)
•Revenue of $820.6 million increased 64% while wholesale RV industry unit shipments increased 15%
•Content per wholesale RV unit (on a trailing twelve-month basis) increased 33% to $4,370
Marine (16% of Revenue)
•Revenue of $221.0 million increased 62% while estimated wholesale powerboat industry unit shipments remained relatively flat
•Estimated content per wholesale powerboat unit (on a trailing twelve-month basis) increased 73% to $4,113
MH (13% of Revenue)
•Revenue of $173.6 million increased 44% while estimated wholesale MH industry unit shipments increased 11%
•Estimated content per wholesale MH unit (on a trailing twelve-month basis) increased 19% to $5,501
Industrial (10% of Revenue)
•Revenue of $127.0 million increased 39% while housing starts increased 10%
Balance Sheet, Cash Flow and Capital Allocation
Cash used in operations for the first quarter of 2022 was $23.0 million, compared to cash provided by operations of $50.3 million in the first quarter of 2021, reflecting continued investment in working capital in order to meet customer needs and mitigate potential supply-chain constraints. Business acquisitions in the first quarter of 2022 totaled $131.6 million, primarily related to our acquisition of the Rockford Corporation. Capital expenditures in the first quarter of 2022 totaled $18.7 million, compared to $14.2 million in the first quarter of 2021, reflecting continued investments in infrastructure and automation initiatives to better align resources for increased scalability and to support customer growth.
In alignment with our capital allocation strategy, we returned $33.1 million to shareholders in the first quarter of 2022, including $24.8 million through opportunistic repurchases of approximately 365,600 shares and $8.3 million of dividends.
Our total debt at the end of the quarter was approximately $1.5 billion, resulting in a net total leverage ratio of 2.2x (as calculated in accordance with our credit agreement). Available liquidity, comprised of borrowing availability under our credit facility and cash on hand, was approximately $319 million.
Business Outlook and Summary
"We are continuing to leverage our resources, capacity, capital investments, and acquisition strategy to enhance our operating platform and position our business to better serve our customers," continued Mr. Nemeth. "Consumer demand remains strong despite inflation and rising interest rates, RV dealer inventories are better calibrated versus a year ago, and marine, MH, and overall housing inventories remain lean with extended channel refill runway. We remain focused on driving automation and innovation initiatives which are
2
producing the anticipated results, and we expect our financial performance to continue to benefit from these investments throughout the year. Focus, discipline, and return continue to characterize the way we look at capital allocation to drive value over the long-term horizon for our customers, team members, partners, communities and shareholders."
Conference Call Webcast
As previously announced, Patrick Industries will host an online webcast of its first quarter 2022 earnings conference call that can be accessed on the Company’s website, www.patrickind.com, under “For Investors,” on Thursday, April 28, 2022 at 10:00 a.m. Eastern time. In addition, a supplemental earnings presentation can be accessed on the Company’s website, www.patrickind.com under “For Investors.”
About Patrick Industries, Inc.
Patrick Industries (NASDAQ: PATK) is a leading component solutions provider for the RV, marine, manufactured housing and various industrial markets – including single and multi-family housing, hospitality, institutional and commercial markets. Founded in 1959, Patrick is based in Elkhart, Indiana, with over 11,000 employees across the United States.
Use of Financial Metrics
In addition to reporting financial results in accordance with U.S. GAAP, the Company also provides financial metrics, such as net leverage ratio, content per unit, net debt and available liquidity, which we believe are important measures of the Company's business performance. These metrics should not be considered alternatives to U.S. GAAP. Our computations of net leverage ratio, content per unit, net debt and available liquidity may differ from similarly titled measures used by others. We calculate net debt by subtracting cash and cash equivalents from the gross value of debt outstanding. RV wholesale unit shipments are provided by the RV Industry Association. Marine wholesale unit shipments are provided by the National Marine Manufacturers Association. MH wholesale unit shipments are provided by the Manufactured Housing Institute. Housing starts are provided by the U.S. Census Bureau. You should not consider these metrics in isolation or as substitutes for an analysis of our results as reported under U.S. GAAP.
Cautionary Statement Regarding Forward-Looking Statements
This press release contains certain statements related to future results, our intentions, beliefs and expectations or predictions for the future, which are forward-looking statements as that term is defined in the Private Securities Litigation Reform Act of 1995. These forward-looking statements involve a number of risks and uncertainties that could cause actual results to differ materially from either historical or anticipated results depending on a variety of factors. Potential factors that could impact results include: the impact of the continuing financial and operational uncertainty due to the COVID-19 pandemic, including its impact on the overall economy, our sales, customers, operations, team members, suppliers, and the countries where we have operations or from which we source products and raw materials, such as China; adverse economic and business conditions, including cyclicality and seasonality in the industries we sell our products; the deterioration of the financial condition of our customers or suppliers; the ability to adjust our production schedules up or down quickly in response to rapid changes in demand; the loss of a significant customer; changes in consumer preferences; pricing pressures due to competition; conditions in the credit market limiting the ability of consumers and wholesale customers to obtain retail and wholesale financing for RVs, manufactured homes, and marine products; the imposition of restrictions and taxes on imports of raw materials and components used in our products; information technology performance and security; any increased cost or limited availability of certain raw materials; the impact of governmental and environmental regulations, and our inability to comply with them; our level of indebtedness; the ability to remain in compliance with our credit agreement covenants; the availability and costs of labor and production facilities and the impact of labor shortages; inventory levels of retailers and manufacturers; the ability to generate cash flow or obtain financing to fund growth; future growth rates in the Company's core businesses; realization and impact of efficiency improvements and cost reductions; the successful integration of acquisitions and other
3
growth initiatives; increases in interest rates and oil and gasoline prices; the ability to retain key executive and management personnel; the disruption of business resulting from natural disasters or other unforeseen events, and adverse weather conditions impacting retail sales.
There can be no assurance that any forward-looking statement will be realized or that actual results will not be significantly different from that set forth in such forward-looking statement. Information about certain risks that could affect our business and cause actual results to differ from those expressed or implied in the forward-looking statements are contained in the section entitled “Risk Factors” in the Company’s Annual Report on Form 10-K for the year ended December 31, 2021, and in the Company's Forms 10-Q for subsequent quarterly periods, which are filed with the Securities and Exchange Commission (“SEC”) and are available on the SEC’s website at www.sec.gov. Each forward-looking statement speaks only as of the date of this press release, and we undertake no obligation to update any forward-looking statement to reflect events or circumstances occurring after the date on which it is made.
Contact:
Julie Ann Kotowski
Investor Relations
574.294.7511
4
| PATRICK INDUSTRIES, INC. | |||||||||||
| CONDENSED CONSOLIDATED STATEMENTS OF INCOME (Unaudited) | |||||||||||
| First Quarter Ended | |||||||||||
| (thousands except per share data) | March 27, 2022 | March 28, 2021 | |||||||||
| NET SALES | $ | 1,342,175 | $ | 850,483 | |||||||
| Cost of goods sold | 1,046,830 | 688,951 | |||||||||
| GROSS PROFIT | 295,345 | 161,532 | |||||||||
| Operating Expenses: | |||||||||||
| Warehouse and delivery | 41,169 | 29,913 | |||||||||
| Selling, general and administrative | 75,560 | 51,232 | |||||||||
| Amortization of intangible assets | 16,861 | 11,906 | |||||||||
| Total operating expenses | 133,590 | 93,051 | |||||||||
| OPERATING INCOME | 161,755 | 68,481 | |||||||||
| Interest expense, net | 14,886 | 11,179 | |||||||||
| Income before income taxes | 146,869 | 57,302 | |||||||||
| Income taxes | 34,196 | 9,789 | |||||||||
| NET INCOME | $ | 112,673 | $ | 47,513 | |||||||
| BASIC NET INCOME PER COMMON SHARE | $ | 5.00 | $ | 2.09 | |||||||
| DILUTED NET INCOME PER COMMON SHARE | $ | 4.54 | $ | 2.04 | |||||||
| Weighted average shares outstanding - Basic | 22,517 | 22,737 | |||||||||
| Weighted average shares outstanding - Diluted | 24,882 | 23,286 | |||||||||
5
| PATRICK INDUSTRIES, INC. | |||||||||||
| CONDENSED CONSOLIDATED BALANCE SHEET (Unaudited) | |||||||||||
| As of | |||||||||||
| (thousands) | March 27, 2022 | December 31, 2021 | |||||||||
| ASSETS | |||||||||||
| Current Assets | |||||||||||
| Cash and cash equivalents | $ | 63,846 | $ | 122,849 | |||||||
| Trade receivables, net | 354,489 | 172,392 | |||||||||
| Inventories | 698,712 | 614,356 | |||||||||
| Prepaid expenses and other | 57,358 | 64,478 | |||||||||
| Total current assets | 1,174,405 | 974,075 | |||||||||
| Property, plant and equipment, net | 328,003 | 319,493 | |||||||||
| Operating lease right-of-use assets | 170,875 | 158,183 | |||||||||
| Goodwill and intangible assets, net | 1,290,729 | 1,191,833 | |||||||||
| Other non-current assets | 7,368 | 7,147 | |||||||||
| TOTAL ASSETS | $ | 2,971,380 | $ | 2,650,731 | |||||||
| LIABILITIES AND SHAREHOLDERS’ EQUITY | |||||||||||
| Current Liabilities | |||||||||||
| Current maturities of long-term debt | $ | 7,500 | $ | 7,500 | |||||||
| Current operating lease liabilities | 42,841 | 40,301 | |||||||||
| Accounts payable | 240,694 | 203,537 | |||||||||
| Accrued liabilities | 205,280 | 181,439 | |||||||||
| Total current liabilities | 496,315 | 432,777 | |||||||||
| Long-term debt, less current maturities, net | 1,489,811 | 1,278,989 | |||||||||
| Long-term operating lease liabilities | 130,550 | 120,161 | |||||||||
| Deferred tax liabilities, net | 40,515 | 36,453 | |||||||||
| Other long-term liabilities | 14,217 | 14,794 | |||||||||
| TOTAL LIABILITIES | 2,171,408 | 1,883,174 | |||||||||
| TOTAL SHAREHOLDERS’ EQUITY | 799,972 | 767,557 | |||||||||
| TOTAL LIABILITIES AND SHAREHOLDERS’ EQUITY | $ | 2,971,380 | $ | 2,650,731 | |||||||
6
PATRICK INDUSTRIES, INC.
CONDENSED CONSOLIDATED STATEMENTS OF CASH FLOWS (Unaudited)
| Three Months Ended | |||||||||||
| (thousands) | |||||||||||
| March 27, 2022 | March 28, 2021 | ||||||||||
| CASH FLOWS FROM OPERATING ACTIVITIES | |||||||||||
| Net income | $ | 112,673 | $ | 47,513 | |||||||
| Depreciation and amortization | 30,201 | 22,521 | |||||||||
| Stock-based compensation expense | 5,111 | 4,298 | |||||||||
| Amortization of convertible notes debt discount | 449 | 1,769 | |||||||||
| Other adjustments to reconcile net income to net cash provided by operating activities | (3,804) | 1,595 | |||||||||
| Change in operating assets and liabilities, net of acquisitions of businesses | (167,669) | (27,404) | |||||||||
| Net cash (used in) provided by operating activities | (23,039) | 50,292 | |||||||||
| CASH FLOWS FROM INVESTING ACTIVITIES | |||||||||||
| Capital expenditures | (18,668) | (14,239) | |||||||||
| Business acquisitions and other investing activities | (124,451) | (30,806) | |||||||||
| Net cash used in investing activities | (143,119) | (45,045) | |||||||||
| NET CASH FLOWS PROVIDED BY (USED IN) FINANCING ACTIVITIES | 107,155 | (43,843) | |||||||||
| Decrease in cash and cash equivalents | (59,003) | (38,596) | |||||||||
| Cash and cash equivalents at beginning of year | 122,849 | 44,767 | |||||||||
| Cash and cash equivalents at end of period | $ | 63,846 | $ | 6,171 | |||||||
7
PATRICK INDUSTRIES, INC.
Net Income Per Common Share
The table below illustrates the calculation for diluted share count which shows the dilutive impact of the adoption of ASU 2020-06 on our 1.00% convertible notes due 2023 as mentioned above:
| First Quarter Ended | ||||||||||||||
| (thousands except per share data) | March 27, 2022 | March 28, 2021 | ||||||||||||
| Numerator: | ||||||||||||||
| Net income for basic per share calculation | $ | 112,673 | $ | 47,513 | ||||||||||
| Effect of interest on potentially dilutive convertible notes, net of tax | 317 | — | ||||||||||||
| Net income for dilutive per share calculation | $ | 112,990 | $ | 47,513 | ||||||||||
| Denominator: | ||||||||||||||
| Weighted average common shares outstanding - basic | 22,517 | 22,737 | ||||||||||||
| Weighted average impact of potentially dilutive convertible notes | 2,046 | — | ||||||||||||
| Weighted average impact of potentially dilutive securities | 319 | 549 | ||||||||||||
| Weighted average common shares outstanding - diluted | 24,882 | 23,286 | ||||||||||||
| Net income per common share: | ||||||||||||||
| Basic net income per common share | $ | 5.00 | $ | 2.09 | ||||||||||
| Diluted net income per common share | $ | 4.54 | $ | 2.04 | ||||||||||
8
Q1 2022 Earnings Presentation Q1 2022 Earnings Presentation April 28, 2022
Q1 2022 Earnings Presentation Forward Looking Statements This presentation contains certain statements related to future results, our intentions, beliefs and expectations or predictions for the future which are forward-looking statements as that term is defined in the Private Securities Litigation Reform Act of 1995. These forward-looking statements involve a number of risks and uncertainties that could cause actual results to differ materially from either historical or anticipated results depending on a variety of factors. These risks and uncertainties include, but are not limited to, the impact of the continuing financial and operational uncertainty due to the COVID-19 pandemic, including its impact on the overall economy, our sales, customers, operations, team members and suppliers. Further information concerning the Company and its business, including factors that potentially could materially affect the Company’s financial results, is contained in the Company’s filings with the Securities and Exchange Commission. This presentation includes market and industry data, forecasts and valuations that have been obtained from independent consultant reports, publicly available information, various industry publications and other published industry sources. Although we believe these sources are reliable, we have not independently verified the information and cannot make any representation as to the accuracy or completeness of such information. We disclaim any obligation or undertaking to disseminate any updates or revisions to any forward-looking statements contained in this presentation or to reflect any change in our expectations after the date of this presentation or any change in events, conditions or circumstances on which any statement is based. Use of Non-GAAP Financial Measures This presentation contains non-GAAP financial measures. These measures, the purposes for which management uses them, why management believes they are useful to investors, and a reconciliation to the most directly comparable GAAP financial measures can be found in the Appendix of this presentation. All references to profit measures and earnings per share on a comparable basis exclude items that affect comparability. 2
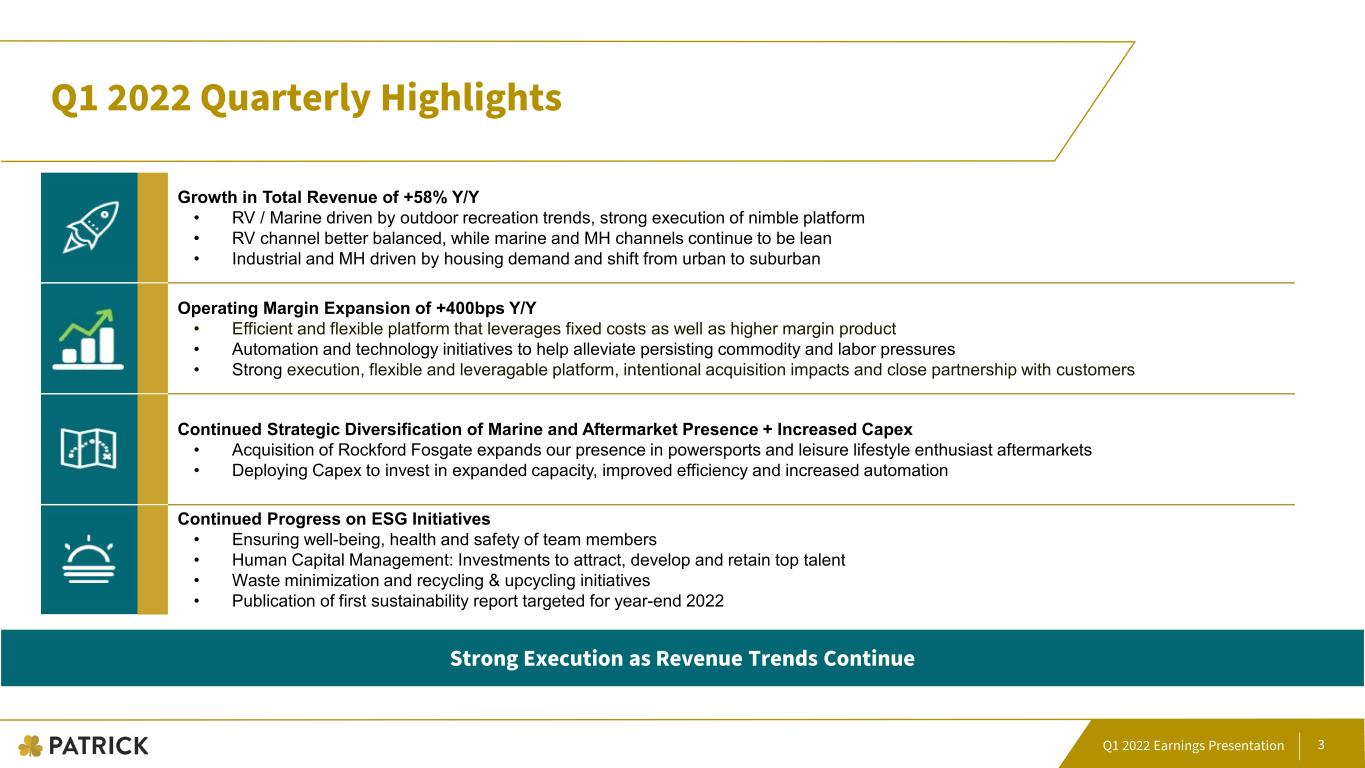
Q1 2022 Earnings Presentation Q1 2022 Quarterly Highlights Strong Execution as Revenue Trends Continue 3 Growth in Total Revenue of +58% Y/Y • RV / Marine driven by outdoor recreation trends, strong execution of nimble platform • RV channel better balanced, while marine and MH channels continue to be lean • Industrial and MH driven by housing demand and shift from urban to suburban Operating Margin Expansion of +400bps Y/Y • Efficient and flexible platform that leverages fixed costs as well as higher margin product • Automation and technology initiatives to help alleviate persisting commodity and labor pressures • Strong execution, flexible and leveragable platform, intentional acquisition impacts and close partnership with customers Continued Strategic Diversification of Marine and Aftermarket Presence + Increased Capex • Acquisition of Rockford Fosgate expands our presence in powersports and leisure lifestyle enthusiast aftermarkets • Deploying Capex to invest in expanded capacity, improved efficiency and increased automation Continued Progress on ESG Initiatives • Ensuring well-being, health and safety of team members • Human Capital Management: Investments to attract, develop and retain top talent • Waste minimization and recycling & upcycling initiatives • Publication of first sustainability report targeted for year-end 2022
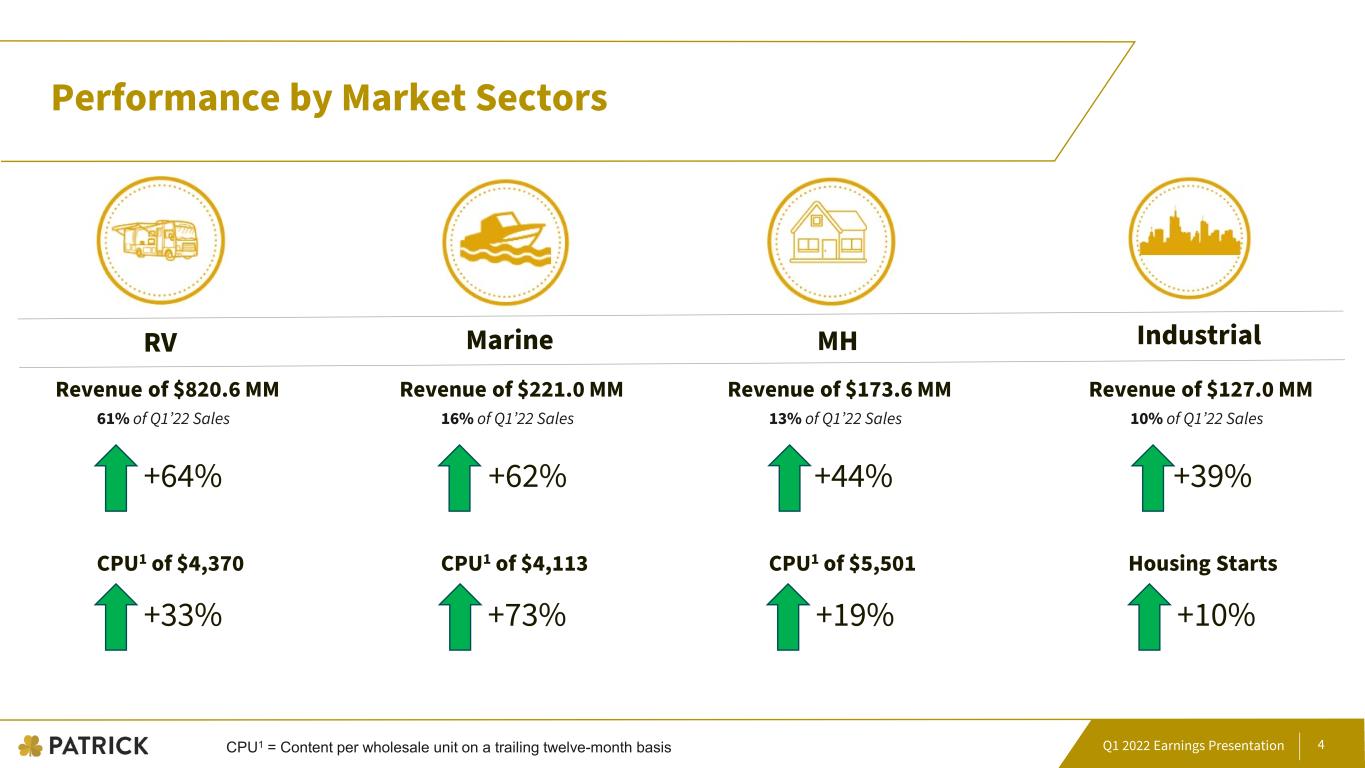
Q1 2022 Earnings Presentation Performance by Market Sectors 4 RV Marine MH Industrial 61% of Q1’22 Sales 16% of Q1’22 Sales 13% of Q1’22 Sales 10% of Q1’22 Sales +64% +62% +44% +39% Revenue of $820.6 MM Revenue of $221.0 MM Revenue of $173.6 MM Revenue of $127.0 MM CPU1 of $4,370 +33% CPU1 of $4,113 +73% CPU1 of $5,501 +19% Housing Starts +10% CPU1 = Content per wholesale unit on a trailing twelve-month basis
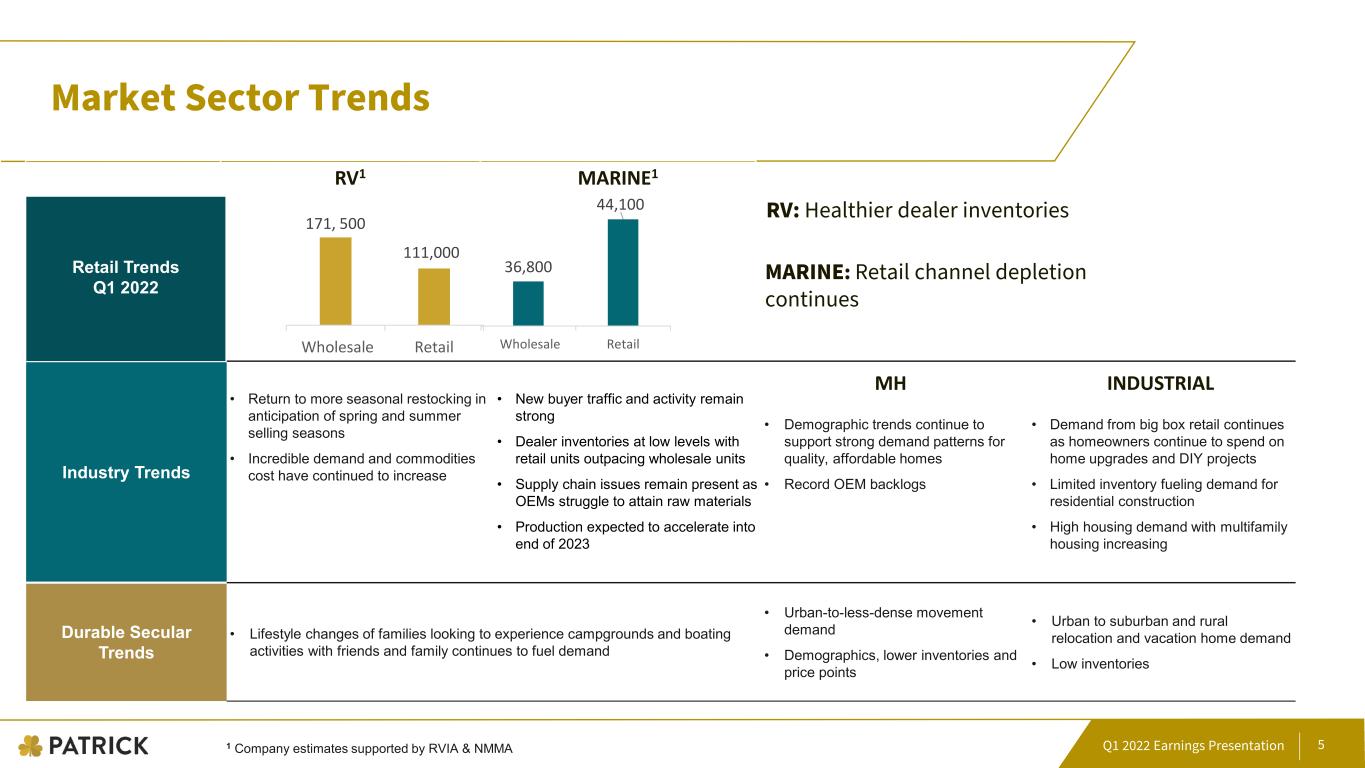
Q1 2022 Earnings Presentation Market Sector Trends 5 Industry Trends • Return to more seasonal restocking in anticipation of spring and summer selling seasons • Incredible demand and commodities cost have continued to increase • New buyer traffic and activity remain strong • Dealer inventories at low levels with retail units outpacing wholesale units • Supply chain issues remain present as OEMs struggle to attain raw materials • Production expected to accelerate into end of 2023 • Demographic trends continue to support strong demand patterns for quality, affordable homes • Record OEM backlogs • Demand from big box retail continues as homeowners continue to spend on home upgrades and DIY projects • Limited inventory fueling demand for residential construction • High housing demand with multifamily housing increasing Durable Secular Trends • Lifestyle changes of families looking to experience campgrounds and boating activities with friends and family continues to fuel demand • Urban-to-less-dense movement demand • Demographics, lower inventories and price points • Urban to suburban and rural relocation and vacation home demand • Low inventories Retail Trends Q1 2022 RV1 MARINE1 MH INDUSTRIAL RV: Healthier dealer inventories MARINE: Retail channel depletion continues 1 Company estimates supported by RVIA & NMMA 171, 500 111,000 Wholesale Retail 36,800 44,100 Wholesale Retail
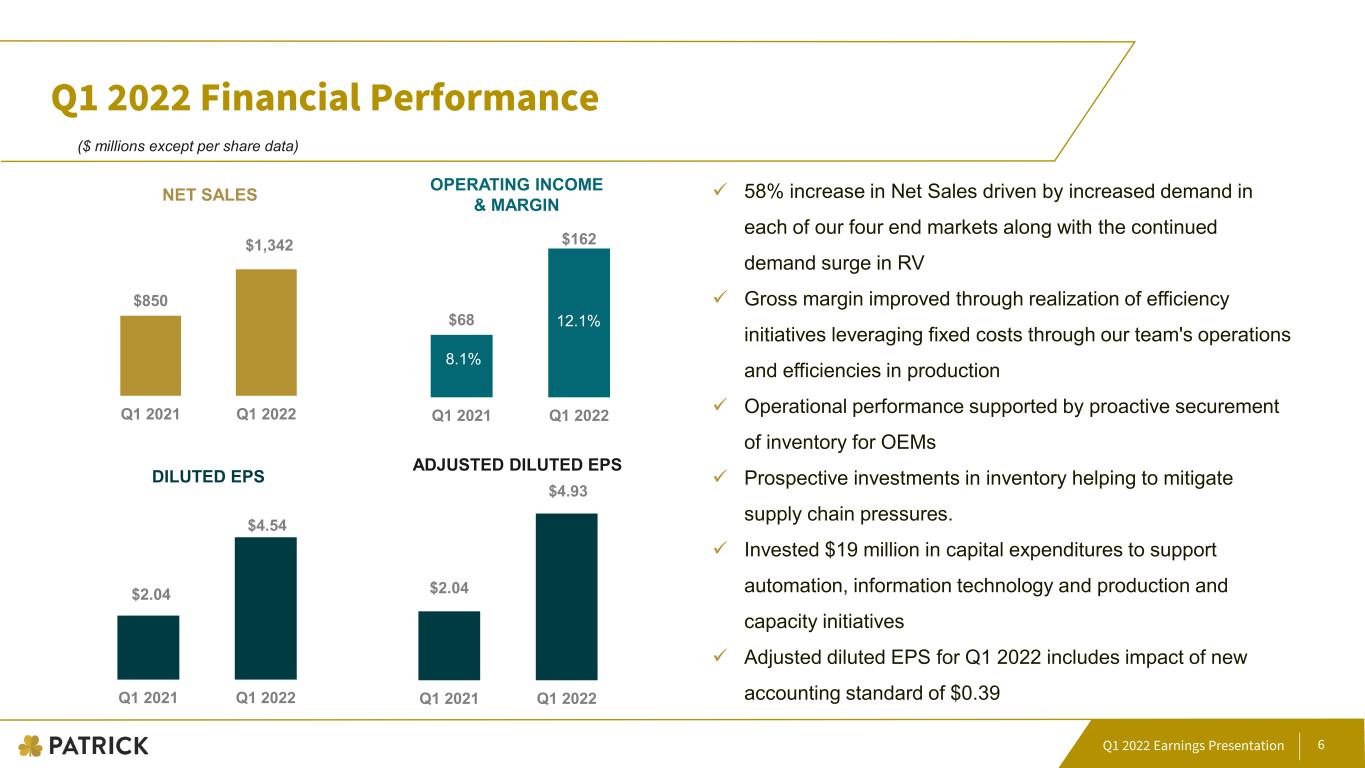
Q1 2022 Earnings Presentation Q1 2022 Financial Performance 6 $68 $162 Q1 2021 Q1 2022 $850 $1,342 Q1 2021 Q1 2022 NET SALES OPERATING INCOME & MARGIN 8.1% 12.1% 58% increase in Net Sales driven by increased demand in each of our four end markets along with the continued demand surge in RV Gross margin improved through realization of efficiency initiatives leveraging fixed costs through our team's operations and efficiencies in production Operational performance supported by proactive securement of inventory for OEMs Prospective investments in inventory helping to mitigate supply chain pressures. Invested $19 million in capital expenditures to support automation, information technology and production and capacity initiatives Adjusted diluted EPS for Q1 2022 includes impact of new accounting standard of $0.39 $2.04 $4.54 Q1 2021 Q1 2022 ($ millions except per share data) DILUTED EPS ADJUSTED DILUTED EPS $2.04 $4.93 Q1 2021 Q1 2022
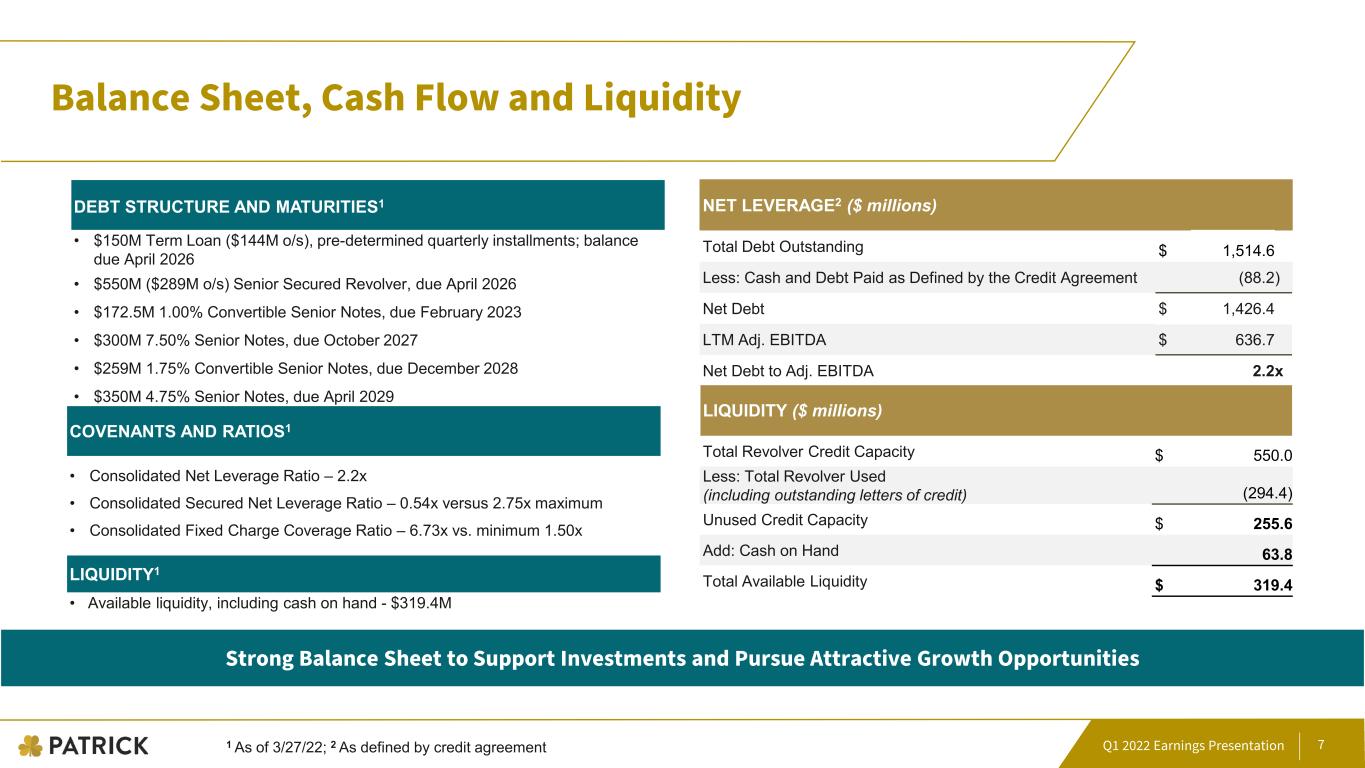
Q1 2022 Earnings Presentation Balance Sheet, Cash Flow and Liquidity 1 As of 3/27/22; 2 As defined by credit agreement Strong Balance Sheet to Support Investments and Pursue Attractive Growth Opportunities 7 DEBT STRUCTURE AND MATURITIES1 • $150M Term Loan ($144M o/s), pre-determined quarterly installments; balance due April 2026 • $550M ($289M o/s) Senior Secured Revolver, due April 2026 • $172.5M 1.00% Convertible Senior Notes, due February 2023 • $300M 7.50% Senior Notes, due October 2027 • $259M 1.75% Convertible Senior Notes, due December 2028 • $350M 4.75% Senior Notes, due April 2029 LIQUIDITY1 • Available liquidity, including cash on hand - $319.4M NET LEVERAGE2 ($ millions) Total Debt Outstanding $ 1,514.6 Less: Cash and Debt Paid as Defined by the Credit Agreement (88.2) Net Debt $ 1,426.4 LTM Adj. EBITDA $ 636.7 Net Debt to Adj. EBITDA 2.2x LIQUIDITY ($ millions) Total Revolver Credit Capacity $ 550.0 Less: Total Revolver Used (including outstanding letters of credit) (294.4) Unused Credit Capacity $ 255.6 Add: Cash on Hand 63.8 Total Available Liquidity $ 319.4 COVENANTS AND RATIOS1 • Consolidated Net Leverage Ratio – 2.2x • Consolidated Secured Net Leverage Ratio – 0.54x versus 2.75x maximum • Consolidated Fixed Charge Coverage Ratio – 6.73x vs. minimum 1.50x

Q1 2022 Earnings Presentation Appendix 8
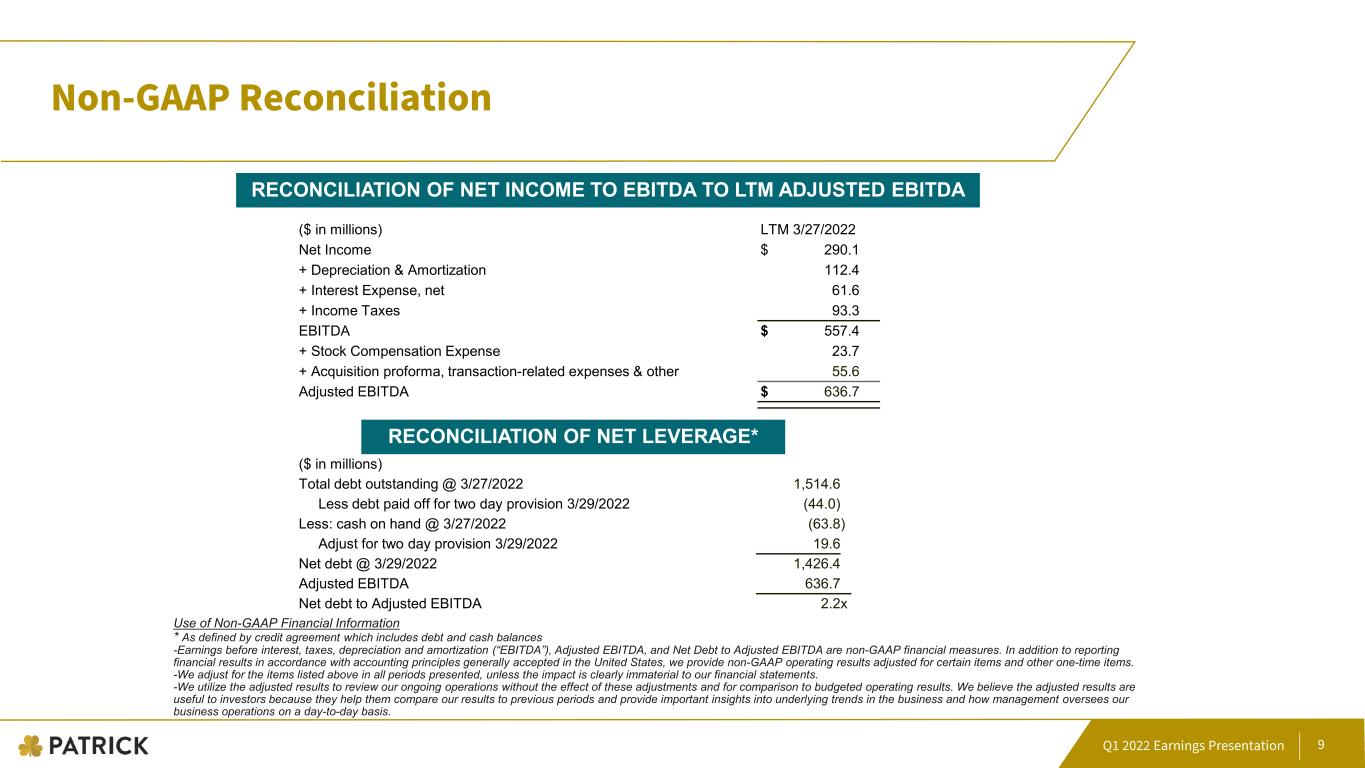
Q1 2022 Earnings Presentation Non-GAAP Reconciliation 9 RECONCILIATION OF NET INCOME TO EBITDA TO LTM ADJUSTED EBITDA ($ in millions) LTM 3/27/2022 Net Income $ 290.1 + Depreciation & Amortization 112.4 + Interest Expense, net 61.6 + Income Taxes 93.3 EBITDA $ 557.4 + Stock Compensation Expense 23.7 + Acquisition proforma, transaction-related expenses & other 55.6 Adjusted EBITDA $ 636.7 RECONCILIATION OF NET LEVERAGE* ($ in millions) Total debt outstanding @ 3/27/2022 1,514.6 Less debt paid off for two day provision 3/29/2022 (44.0) Less: cash on hand @ 3/27/2022 (63.8) Adjust for two day provision 3/29/2022 19.6 Net debt @ 3/29/2022 1,426.4 Adjusted EBITDA 636.7 Net debt to Adjusted EBITDA 2.2x Use of Non-GAAP Financial Information * As defined by credit agreement which includes debt and cash balances -Earnings before interest, taxes, depreciation and amortization (“EBITDA”), Adjusted EBITDA, and Net Debt to Adjusted EBITDA are non-GAAP financial measures. In addition to reporting financial results in accordance with accounting principles generally accepted in the United States, we provide non-GAAP operating results adjusted for certain items and other one-time items. -We adjust for the items listed above in all periods presented, unless the impact is clearly immaterial to our financial statements. -We utilize the adjusted results to review our ongoing operations without the effect of these adjustments and for comparison to budgeted operating results. We believe the adjusted results are useful to investors because they help them compare our results to previous periods and provide important insights into underlying trends in the business and how management oversees our business operations on a day-to-day basis.

Q1 2022 Earnings Presentation www.patrickind.com