
SCSC 8-K
Scansource, Inc. (SCSC)
8-K
2020-05-11
For: 2020-05-11
View Original
Added on
April 08, 2026
UNITED STATES
SECURITIES AND EXCHANGE COMMISSION
Washington, D.C. 20549
Form 8-K
CURRENT REPORT
Pursuant to Section 13 or 15(d) of the
Securities Exchange Act of 1934
Date of Report (Date of earliest event reported): May 11, 2020
(Exact name of registrant as specified in its charter)
(State or other jurisdiction of incorporation) | (Commission File Number) | (IRS Employer Identification No.) | ||
(Address of principal executive offices, including zip code)
(Registrant’s telephone number, including area code)
Title of Each Class | Trading Symbol | Name of Each Exchange on Which Registered | ||
Check the appropriate box below if the Form 8-K filing is intended to simultaneously satisfy the filing obligation of the registrant under any of the following provisions:
Written communications pursuant to Rule 425 under the Securities Act (17 CFR 230.425) | |
Soliciting material pursuant to Rule 14a-12 under the Exchange Act (17 CFR 240.14a-12) | |
Pre-commencement communications pursuant to Rule 14d-2(b) under the Exchange Act (17 CFR 240.14d-2(b)) | |
Pre-commencement communications pursuant to Rule 13e-4(c) under the Exchange Act (17 CFR 240.13e-4(c)) | |
Indicate by check mark whether the registrant is an emerging growth company as defined in Rule 405 of the Securities Act of 1933 or Rule 12b-2 of the Securities Exchange Act of 1934.
Emerging growth company | |
If an emerging growth company, indicate by check mark if the registrant has elected not to use the extended transition period for complying with any new or revised financial accounting standards provided pursuant to Section 13(a) of the Exchange Act. ☐
Item 2.02. Results of Operations and Financial Condition
On May 11, 2020, ScanSource, Inc. (the "Company") issued a press release announcing its financial results for its third quarter ended March 31, 2020. A copy of the press release and accompanying CFO commentary are attached as Exhibits 99.1 and 99.2 hereto and incorporated herein by reference and also made available through the Company’s website at www.scansource.com. An updated investor presentation will be made available on the Company's website within approximately two weeks.
The information in Item 2.02 of this Report, including the exhibits, is being furnished and shall not be deemed “filed” for purposes of Section 18 of the Securities Exchange Act of 1934 (the “Exchange Act”) or otherwise subject to the liabilities of that section, nor shall it be deemed incorporated by reference in any other filing under the Securities Act of 1933 or the Exchange Act.
Item 9.01. Financial Statements and Exhibits
(d) Exhibits
99.1 – Press release issued by ScanSource, Inc. on May 11, 2020. The information contained in the attached exhibit is unaudited and should be read in conjunction with the Company’s annual and quarterly reports filed with the Securities and Exchange Commission.
99.2 – CFO commentary for the financial results conference call held on May 11, 2020. The information contained in the attached exhibit is unaudited and should be read in conjunction with the Company’s annual and quarterly reports filed with the Securities and Exchange Commission.
Exhibit Number | Description |
99.1 | |
99.2 | |
104 | Cover Page Interactive Data File (embedded within the Inline XBRL document) |
SIGNATURES
Pursuant to the requirements of the Securities Exchange Act of 1934, the Registrant has duly caused this report to be signed on its behalf by the undersigned hereunto duly authorized.
ScanSource, Inc. | |||||||
Date: | May 11, 2020 | By: | /s/ Gerald Lyons | ||||
Name: | Gerald Lyons | ||||||
Its: | Senior Executive Vice President and Chief Financial Officer | ||||||
Exhibit 99.1
FOR IMMEDIATE RELEASE
Contact: | ||
Gerald Lyons | Mary M. Gentry | |
Executive Vice President, Chief Financial Officer | - or - | Vice President, Treasurer and Investor Relations |
ScanSource, Inc. | ScanSource, Inc. | |
(864) 286-4854 | (864) 286-4892 | |
SCANSOURCE ANNOUNCES THIRD QUARTER RESULTS
GREENVILLE, SC -- May 11, 2020 -- ScanSource, Inc. (NASDAQ: SCSC), a leading provider of technology products and solutions, today announced financial results for the third quarter ended March 31, 2020.
Quarter ended March 31, | ||||||||||
2020 | 2019 | Change | ||||||||
(in millions, except per share data) | ||||||||||
Net sales | $ | 872.5 | $ | 893.4 | (2 | )% | ||||
Non-GAAP net sales, excluding Planned Divestitures(1) | 744.6 | 752.8 | (1 | )% | ||||||
Operating income | 6.3 | 18.8 | (66 | )% | ||||||
Non-GAAP operating income(1) (2) | 14.8 | 30.6 | (52 | )% | ||||||
Net income | 1.7 | 11.7 | (85 | )% | ||||||
Non-GAAP net income(1) (2) | 9.3 | 20.6 | (55 | )% | ||||||
Diluted EPS | $ | 0.07 | $ | 0.45 | (84 | )% | ||||
Non-GAAP diluted EPS(1) (2) | $ | 0.37 | $ | 0.80 | (54 | )% | ||||
(1) A reconciliation of non-GAAP financial information to GAAP financial information is presented in the Supplementary Information (Unaudited) below. | ||||||||||
(2) Non-GAAP results exclude amortization of intangible assets related to acquisitions, change in fair value of contingent consideration, the impact of Planned Divestitures and other non-GAAP items. A reconciliation of non-GAAP to GAAP financial information is presented below. | ||||||||||
“In March, companies around the world, including ours, immediately shifted to work-from-home,” said Mike Baur, Chairman and CEO, ScanSource, Inc. “I am proud of how our ScanSource employees made the transition to work-from-home and delivered the same level of customer service. During the quarter, we saw an accelerated decline in our sales of premise-based communications products. However, we had a significant increase in sales of headsets, cameras, speakers, keyboards, displays, back-up power supplies, IP desk phones, and connectivity to support remote workers. Overall, we are pleased with our results delivering on our sales expectations.”
Quarterly Results
Net sales were $872.5 million for the third quarter of fiscal year 2020, down 2% year-over-year, principally from the negative impact of foreign currency translation. Excluding the foreign currency translation and net sales from the Planned Divestitures and acquisitions, organic net sales growth for third quarter of fiscal year 2020 totaled 0.5%. Net sales grew across most of ScanSource’s diversified technologies in North America and Brazil. In addition, the sales growth reflected accelerated growth for work-from-home solutions from the immediate move to remote workforces in March.
Operating income for the third quarter decreased to $6.3 million year-over-year, and non-GAAP operating income decreased to $14.8 million from the prior-year quarter. This decrease includes a $4.5 million expense for inventory charges following the conversion to a new inventory management system. This charge increased cost of goods sold, which lowered gross profit for the third quarter of fiscal year 2020.
On a GAAP basis, net income for the third quarter of fiscal year 2020 totaled $1.7 million, or $0.07 per diluted share, compared to net income of $11.7 million, or $0.45 per diluted share, for the prior-year quarter. Non-GAAP net income totaled $9.3 million, or $0.37 per diluted share, compared to $20.6 million, or $0.80 per diluted share, for the prior-year quarter.
1
Exhibit 99.1
As of March 31, 2020, ScanSource had cash and cash equivalents of $35 million and total debt of $321 million. In the third quarter of fiscal year 2020, the Company generated $32 million of operating cash flow.
Plan to Divest Certain Businesses Outside of US, Canada and Brazil
On August 20, 2019, ScanSource announced plans to divest its physical products distribution businesses outside of the United States, Canada and Brazil. ScanSource continues to operate and invest in its digital distribution business in these geographies. These plans are part of a strategic portfolio repositioning to align investments with higher-growth, higher-margin businesses. The Company has identified potential buyers for these businesses and is in due diligence and purchase agreement negotiations. There can be no assurance that this sale process will result in a transaction or regarding the timing of any transaction. The Planned Divestitures, comprised of physical product businesses in Europe, UK, Mexico, Colombia, Chile, Peru and the Miami-based export operations, had net sales of $127.9 million for the third quarter of fiscal year 2020 and at March 31, 2020 had working capital of $155.5 million.
COVID-19 Update
Our top priority during the COVID-19 Pandemic is protecting the health and safety of our employees. We have implemented travel restrictions and moved quickly to transition our employees, where possible, to a fully remote working environment. Nearly all office-based employees around the world are working remotely. We have taken a number of measures to ensure our teams feel secure in their jobs and have the flexibility and resources they need to stay safe and healthy. We expect higher costs from these safety measures to protect our employees. We are continuing to provide the high level of customer service our partners expect from us.
Update on Forecasts
Given the uncertainties related to the COVID-19 pandemic and the changing economic environment, we are not providing our expectations for net sales or earnings per share for the fourth quarter of fiscal year 2020.
Webcast Details and CFO Commentary
At approximately 4:15 p.m. ET today, a CFO commentary, as a supplement to this press release and the Company's conference call, will be available on ScanSource's website, www.scansource.com (Investor Relations section). ScanSource will present additional information about its financial results in a conference call today, May 11, 2020, at 5:00 p.m. ET. A webcast of the call will be available for all interested parties and can be accessed at www.scansource.com (Investor Relations section). The webcast will be available for replay for 60 days.
Safe Harbor Statement
This press release contains “forward-looking” statements, including the Company's Planned Divestitures and the impact of the COVID-19 pandemic, which involve risks and uncertainties. Any number of factors could cause actual results to differ materially from anticipated results, including, but not limited to, the impact of the COVID-19 pandemic on our operations and financial condition, the Company's ability to complete the Planned Divestitures on acceptable terms or to otherwise dispose of the operations, changes in interest and exchange rates and regulatory regimes impacting the Company's international operations, the impact of tax reform laws, the failure of acquisitions to meet the Company's expectations, the failure to manage and implement the Company's organic growth strategy, credit risks involving the Company's larger customers and suppliers, termination of the Company's relationship with key suppliers or a significant modification of the terms under which it operates with a key supplier, the decline in demand for the products and services that the Company provides, reduced prices for the products and services that the Company provides due both to competitor and customer action, changes in the Company's operating strategy, and other factors set forth in the "Risk Factors" contained in the Company's annual report on Form 10-K for the year ended June 30, 2019 and quarterly report on Form 10-Q for the quarter ended March 31, 2020, filed with the Securities and Exchange Commission. Except as may be required by law, the Company expressly disclaims any obligation to update these forward-looking statements to reflect events or circumstances after the date of this press release or to reflect the occurrence of unanticipated events.
Non-GAAP Financial Information
In addition to disclosing results that are determined in accordance with United States Generally Accepted Accounting Principles ("GAAP"), the Company also discloses certain non-GAAP financial measures, which are summarized below. Non-GAAP financial measures are used to understand and evaluate performance, including comparisons from period to period. Non-GAAP results exclude amortization of intangible assets related to acquisitions, change in fair value of contingent consideration, acquisition costs, restructuring costs and other non-GAAP adjustments.
2
Net sales on a constant currency basis, excluding Planned Divestitures and acquisitions: The Company discloses the percentage change in net sales excluding the translation impact from changes in foreign currency exchange rates between reporting periods and excluding the net sales from Planned Divestitures, as well as acquisitions prior to the first full year from the acquisition date. This measure enhances the comparability between periods to help analyze underlying trends on an organic basis.
Income Statement Non-GAAP Metrics: To evaluate current period performance on a more consistent basis with prior periods, the Company discloses non-GAAP net sales, non-GAAP gross profit, non-GAAP operating income, non-GAAP other expense, net, non-GAAP pre-tax income, non-GAAP net income and non-GAAP diluted earnings per share (non-GAAP diluted "EPS"). Non-GAAP results exclude amortization of intangible assets related to acquisitions, changes in fair value of contingent consideration, acquisition and divestiture costs, impact of Planned Divestitures and other non-GAAP adjustments. Non-GAAP metrics are useful in assessing and understanding the Company's operating performance, especially when comparing results with previous periods or forecasting performance for future periods.
Return on invested capital ("ROIC"): Management uses ROIC as a performance measurement to assess efficiency in allocating capital under the Company's control to generate returns. Management believes this metric balances the Company's operating results with asset and liability management, is not impacted by capitalization decisions and correlates with shareholder value creation. In addition, it is easily computed, communicated and understood. ROIC also provides management a measure of the Company's profitability on a basis more comparable to historical or future periods.
ROIC assists management in comparing the Company's performance over various reporting periods on a consistent basis because it removes from operating results the impact of items that do not reflect core operating performance. ROIC is calculated as adjusted EBITDA over invested capital. Adjusted earnings before interest expense, income taxes, depreciation and amortization ("Adjusted EBITDA") excludes the change in fair value of contingent consideration, in addition to other non-GAAP adjustments. Invested capital is defined as average equity plus average daily funded interest-bearing debt for the period. Management believes the calculation of ROIC provides useful information to investors and is an additional relevant comparison of the Company's performance during the year.
These non-GAAP financial measures have limitations as analytical tools, and the non-GAAP financial measures that the Company reports may not be comparable to similarly titled amounts reported by other companies. Analysis of results and outlook on a non-GAAP basis should be considered in addition to, and not in substitution for or as superior to, measurements of financial performance prepared in accordance with GAAP. A reconciliation of the Company's non-GAAP financial information to GAAP is set forth in the Supplementary Information (Unaudited) below.
About ScanSource, Inc.
ScanSource, Inc. (NASDAQ: SCSC) is at the center of the technology solution delivery channel, connecting businesses and providing solutions for their complex needs. ScanSource sells through multiple, specialized routes-to-market with digital, physical and services offerings from the world’s leading suppliers of point-of-sale (POS), payments, barcode, physical security, unified communications and collaboration, telecom and cloud services. ScanSource enables its sales partners to create, deliver and manage solutions for end-customers across almost every vertical market. Founded in 1992 and headquartered in Greenville, South Carolina, ScanSource was named one of the Best Places to Work in South Carolina and on FORTUNE magazine’s 2020 List of World’s Most Admired Companies. ScanSource ranks #643 on the Fortune 1000. For more information, visit www.scansource.com.
3
ScanSource Announces Third Quarter Results
ScanSource, Inc. and Subsidiaries | ||||||||
Condensed Consolidated Balance Sheets (Unaudited) | ||||||||
(in thousands) | ||||||||
March 31, 2020 | June 30, 2019* | |||||||
Assets | ||||||||
Current assets: | ||||||||
Cash and cash equivalents | $ | 34,596 | $ | 23,818 | ||||
Accounts receivable, less allowance of $34,119 at March 31, 2020 and $38,849 at June 30, 2019 | 618,758 | 654,983 | ||||||
Inventories | 666,458 | 697,343 | ||||||
Prepaid expenses and other current assets | 116,221 | 101,171 | ||||||
Total current assets | 1,436,033 | 1,477,315 | ||||||
Property and equipment, net | 60,891 | 63,363 | ||||||
Goodwill | 338,358 | 319,538 | ||||||
Identifiable intangible assets, net | 133,228 | 127,939 | ||||||
Deferred income taxes | 23,635 | 24,724 | ||||||
Other non-current assets | 81,656 | 54,382 | ||||||
Total assets | $ | 2,073,801 | $ | 2,067,261 | ||||
Liabilities and Shareholders' Equity | ||||||||
Current liabilities: | ||||||||
Accounts payable | $ | 608,417 | $ | 558,101 | ||||
Accrued expenses and other current liabilities | 108,086 | 91,407 | ||||||
Current portion of contingent consideration | 45,660 | 38,393 | ||||||
Income taxes payable | 989 | 4,310 | ||||||
Short-term borrowings | 143 | 4,590 | ||||||
Current portion of long-term debt | 6,901 | 4,085 | ||||||
Total current liabilities | 770,196 | 700,886 | ||||||
Deferred income taxes | 1,077 | 1,395 | ||||||
Long-term debt, net of current portion | 145,050 | 151,014 | ||||||
Borrowings under revolving credit facility | 168,502 | 200,817 | ||||||
Long-term portion of contingent consideration | — | 39,532 | ||||||
Other long-term liabilities | 91,298 | 59,488 | ||||||
Total liabilities | 1,176,123 | 1,153,132 | ||||||
Shareholders' equity: | ||||||||
Common stock | 62,314 | 64,287 | ||||||
Retained earnings | 964,538 | 939,930 | ||||||
Accumulated other comprehensive income (loss) | (129,174 | ) | (90,088 | ) | ||||
Total shareholders' equity | 897,678 | 914,129 | ||||||
Total liabilities and shareholders' equity | $ | 2,073,801 | $ | 2,067,261 | ||||
* | Derived from audited financial statements. |
4
ScanSource Announces Third Quarter Results
ScanSource, Inc. and Subsidiaries | ||||||||||||||||
Condensed Consolidated Income Statements (Unaudited) | ||||||||||||||||
(in thousands, except per share data) | ||||||||||||||||
Quarter ended March 31, | Nine months ended March 31, | |||||||||||||||
2020 | 2019 | 2020 | 2019 | |||||||||||||
Net sales | $ | 872,483 | $ | 893,357 | $ | 2,850,812 | $ | 2,912,278 | ||||||||
Cost of goods sold | 777,674 | 783,342 | 2,530,020 | 2,569,570 | ||||||||||||
Gross profit | 94,809 | 110,015 | 320,792 | 342,708 | ||||||||||||
Selling, general and administrative expenses | 78,923 | 77,688 | 244,557 | 236,569 | ||||||||||||
Depreciation expense | 3,493 | 3,417 | 10,500 | 9,954 | ||||||||||||
Intangible amortization expense | 5,486 | 5,005 | 16,079 | 14,708 | ||||||||||||
Change in fair value of contingent consideration | 618 | 5,101 | 6,266 | 11,535 | ||||||||||||
Operating income | 6,289 | 18,804 | 43,390 | 69,942 | ||||||||||||
Interest expense | 3,421 | 3,670 | 10,964 | 9,415 | ||||||||||||
Interest income | (1,080 | ) | (682 | ) | (2,629 | ) | (1,397 | ) | ||||||||
Other expense, net | 296 | 21 | 102 | 254 | ||||||||||||
Income before income taxes | 3,652 | 15,795 | 34,953 | 61,670 | ||||||||||||
Provision for income taxes | 1,939 | 4,080 | 10,345 | 15,651 | ||||||||||||
Net income | $ | 1,713 | $ | 11,715 | $ | 24,608 | $ | 46,019 | ||||||||
Per share data: | ||||||||||||||||
Net income per common share, basic | $ | 0.07 | $ | 0.46 | $ | 0.97 | $ | 1.79 | ||||||||
Weighted-average shares outstanding, basic | 25,346 | 25,704 | 25,386 | 25,647 | ||||||||||||
Net income per common share, diluted | $ | 0.07 | $ | 0.45 | $ | 0.97 | $ | 1.79 | ||||||||
Weighted-average shares outstanding, diluted | 25,363 | 25,762 | 25,444 | 25,755 | ||||||||||||
5
ScanSource Announces Third Quarter Results
ScanSource, Inc. and Subsidiaries | ||||||||||
Supplementary Information (Unaudited) | ||||||||||
Net Sales by Segment: | ||||||||||
Quarter ended March 31, | ||||||||||
2020 | 2019 | % Change | ||||||||
Worldwide Barcode, Networking & Security: | (in thousands) | |||||||||
Net sales, reported | $ | 583,642 | $ | 596,913 | (2.2 | )% | ||||
Planned Divestitures | (94,424 | ) | (100,170 | ) | ||||||
Non-GAAP net sales, excluding Planned Divestitures | 489,218 | 496,743 | (1.5 | )% | ||||||
Foreign exchange impact (a) | 3,590 | — | ||||||||
Non-GAAP net sales, constant currency excluding Planned Divestitures and acquisitions | $ | 492,808 | $ | 496,743 | (0.8 | )% | ||||
Worldwide Communications & Services: | ||||||||||
Net sales, reported | $ | 288,841 | $ | 296,444 | (2.6 | )% | ||||
Planned Divestitures | (33,451 | ) | (40,341 | ) | ||||||
Non-GAAP net sales, excluding Planned Divestitures | 255,390 | 256,103 | (0.3 | )% | ||||||
Foreign exchange impact (a) | 9,738 | — | ||||||||
Less: Acquisitions(b) | (1,677 | ) | — | |||||||
Non-GAAP net sales, constant currency excluding Planned Divestitures and acquisitions | $ | 263,451 | $ | 256,103 | 2.9 | % | ||||
Consolidated: | ||||||||||
Net sales, reported | $ | 872,483 | $ | 893,357 | (2.3 | )% | ||||
Planned Divestitures | (127,875 | ) | (140,511 | ) | ||||||
Non-GAAP net sales, excluding Planned Divestitures | 744,608 | 752,846 | (1.1 | )% | ||||||
Foreign exchange impact (a) | 13,328 | — | ||||||||
Less: Acquisitions(b) | (1,677 | ) | — | |||||||
Non-GAAP net sales, constant currency excluding Planned Divestitures and acquisitions | $ | 756,259 | $ | 752,846 | 0.5 | % | ||||
(a) Year-over-year net sales growth rate excluding the translation impact of changes in foreign currency exchange rates. Calculated by translating the net sales for the quarter ended March 31, 2020 into U.S. dollars using the average foreign exchange rates for the quarter ended March 31, 2019. | ||||||||||
(b) Reflects a revenue recognition change to a net basis for the intY acquisition. | ||||||||||
6
ScanSource Announces Third Quarter Results
ScanSource, Inc. and Subsidiaries | ||||||||||
Supplementary Information (Unaudited) | ||||||||||
Net Sales by Segment: | ||||||||||
Nine months ended March 31, | ||||||||||
2020 | 2019 | % Change | ||||||||
Worldwide Barcode, Networking & Security: | (in thousands) | |||||||||
Net sales, as reported | $ | 1,967,670 | $ | 1,953,664 | 0.7 | % | ||||
Planned Divestitures | (322,264 | ) | (340,862 | ) | ||||||
Non-GAAP net sales, excluding Planned Divestitures | 1,645,406 | 1,612,802 | 2.0 | % | ||||||
Foreign exchange impact (a) | 5,484 | — | ||||||||
Non-GAAP net sales, constant currency excluding Planned Divestitures and acquisitions | $ | 1,650,890 | $ | 1,612,802 | 2.4 | % | ||||
Worldwide Communications & Services: | ||||||||||
Net sales, as reported | $ | 883,142 | $ | 958,614 | (7.9 | )% | ||||
Planned Divestitures | (116,893 | ) | (132,905 | ) | ||||||
Non-GAAP net sales, excluding Planned Divestitures | 766,249 | 825,709 | (7.2 | )% | ||||||
Foreign exchange impact (a) | 15,169 | — | ||||||||
Less: Acquisitions(b) | (7,767 | ) | (1,062 | ) | ||||||
Non-GAAP net sales, constant currency excluding Planned Divestitures and acquisitions | $ | 773,651 | $ | 824,647 | (6.2 | )% | ||||
Consolidated: | ||||||||||
Net sales, as reported | $ | 2,850,812 | $ | 2,912,278 | (2.1 | )% | ||||
Planned Divestitures | (439,157 | ) | (473,767 | ) | ||||||
Non-GAAP net sales, excluding Planned Divestitures | 2,411,655 | 2,438,511 | (1.1 | )% | ||||||
Foreign exchange impact (a) | 20,653 | — | ||||||||
Less: Acquisitions(b) | (7,767 | ) | (1,062 | ) | ||||||
Non-GAAP net sales, constant currency excluding Planned Divestitures and acquisitions | $ | 2,424,541 | $ | 2,437,449 | (0.5 | )% | ||||
(a) Year-over-year net sales growth rate excluding the translation impact of changes in foreign currency exchange rates. Calculated by translating the net sales for the nine months ended March 31, 2020 into U.S. dollars using the average foreign exchange rates for the nine months ended March 31, 2019. | ||||||||||
(b) Reflects a revenue recognition change to a net basis for the intY acquisition. | ||||||||||
7
ScanSource Announces Third Quarter Results
ScanSource, Inc. and Subsidiaries | ||||||||||
Supplementary Information (Unaudited) | ||||||||||
Net Sales by Geography: | ||||||||||
Quarter ended March 31, | ||||||||||
2020 | 2019 | % Change | ||||||||
United States and Canada: | (in thousands) | |||||||||
Net sales, as reported | $ | 670,175 | $ | 672,155 | (0.3 | )% | ||||
Less: Acquisitions(b) | (141 | ) | — | |||||||
Non-GAAP net sales, excluding acquisitions | $ | 670,034 | $ | 672,155 | (0.3 | )% | ||||
International: | ||||||||||
Net sales, as reported | $ | 202,308 | $ | 221,202 | (8.5 | )% | ||||
Planned Divestitures | (127,875 | ) | (140,511 | ) | ||||||
Non-GAAP net sales, excluding Planned Divestitures | 74,433 | 80,691 | (7.8 | )% | ||||||
Foreign exchange impact(a) | 13,328 | — | ||||||||
Less: Acquisitions(b) | (1,536 | ) | — | |||||||
Non-GAAP net sales, constant currency excluding Planned Divestitures and acquisitions | $ | 86,225 | $ | 80,691 | 6.9 | % | ||||
Consolidated: | ||||||||||
Net sales, as reported | $ | 872,483 | $ | 893,357 | (2.3 | )% | ||||
Planned Divestitures | (127,875 | ) | (140,511 | ) | ||||||
Non-GAAP net sales, excluding Planned Divestitures | 744,608 | 752,846 | (1.1 | )% | ||||||
Foreign exchange impact(a) | 13,328 | — | ||||||||
Less: Acquisitions (b) | (1,677 | ) | — | |||||||
Non-GAAP net sales, constant currency excluding Planned Divestitures and acquisitions | $ | 756,259 | $ | 752,846 | 0.5 | % | ||||
(a) Year-over-year net sales growth rate excluding the translation impact of changes in foreign currency exchange rates. Calculated by translating the net sales for the quarter ended March 31, 2020 into U.S. dollars using the average foreign exchange rates for the quarter ended March 31, 2019. | ||||||||||
(b) Reflects a revenue recognition change to a net basis for the intY acquisition. | ||||||||||
8
ScanSource Announces Third Quarter Results
ScanSource, Inc. and Subsidiaries | ||||||||||
Supplementary Information (Unaudited) | ||||||||||
Net Sales by Geography: | ||||||||||
Nine months ended March 31, | ||||||||||
2020 | 2019 | % Change | ||||||||
United States and Canada: | (in thousands) | |||||||||
Net sales, as reported | $ | 2,173,516 | $ | 2,189,567 | (0.7 | )% | ||||
Less: Acquisitions(b) | (3,623 | ) | (1,062 | ) | ||||||
Net sales, excluding acquisitions | $ | 2,169,893 | $ | 2,188,505 | (0.9 | )% | ||||
International: | ||||||||||
Net sales, as reported | $ | 677,296 | $ | 722,711 | (6.3 | )% | ||||
Planned Divestitures | (439,157 | ) | (473,767 | ) | ||||||
Non-GAAP net sales, excluding Planned Divestitures | 238,139 | 248,944 | (4.3 | )% | ||||||
Foreign exchange impact(a) | 20,653 | — | ||||||||
Less: Acquisitions(b) | (4,144 | ) | — | |||||||
Non-GAAP net sales, constant currency excluding Planned Divestitures and acquisitions | $ | 254,648 | $ | 248,944 | 2.3 | % | ||||
Consolidated: | ||||||||||
Net sales, as reported | $ | 2,850,812 | $ | 2,912,278 | (2.1 | )% | ||||
Planned Divestitures | (439,157 | ) | (473,767 | ) | ||||||
Non-GAAP net sales, excluding Planned Divestitures | 2,411,655 | 2,438,511 | (1.1 | )% | ||||||
Foreign exchange impact(a) | 20,653 | — | ||||||||
Less: Acquisitions(b) | (7,767 | ) | (1,062 | ) | ||||||
Non-GAAP net sales, constant currency excluding Planned Divestitures and acquisitions | $ | 2,424,541 | $ | 2,437,449 | (0.5 | )% | ||||
(a) Year-over-year net sales growth rate excluding the translation impact of changes in foreign currency exchange rates. Calculated by translating the net sales for the nine months ended March 31, 2020 into U.S. dollars using the average foreign exchange rates for the nine months ended March 31, 2019. | ||||||||||
(b) Reflects a revenue recognition change to a net basis for the intY acquisition. | ||||||||||
9
ScanSource Announces Third Quarter Results
ScanSource, Inc. and Subsidiaries | |||||||||||||||||||||||||||
Supplementary Information (Unaudited) | |||||||||||||||||||||||||||
Non-GAAP Financial Information: | |||||||||||||||||||||||||||
Quarter ended March 31, 2020 | |||||||||||||||||||||||||||
Reported GAAP measure | Intangible amortization expense | Change in fair value of contingent consideration | Acquisition, divestiture and restructuring costs(a) | Tax recovery, net | Impact of Planned Divestitures | Non-GAAP measure | |||||||||||||||||||||
in thousands, except per share data | |||||||||||||||||||||||||||
Net sales | $ | 872,483 | $ | — | $ | — | $ | — | $ | — | $ | (127,875 | ) | $ | 744,608 | ||||||||||||
Gross profit | 94,809 | — | — | — | — | (10,206 | ) | 84,603 | |||||||||||||||||||
Operating income | 6,289 | 5,486 | 618 | 935 | (1,529 | ) | 3,020 | 14,819 | |||||||||||||||||||
Other expense, net | 2,637 | — | — | — | — | (759 | ) | 1,878 | |||||||||||||||||||
Pre-tax income | 3,652 | 5,486 | 618 | 935 | — | 4,571 | 15,262 | ||||||||||||||||||||
Net income | 1,713 | 4,171 | 467 | 894 | (1,224 | ) | 3,248 | 9,269 | |||||||||||||||||||
Diluted EPS | $ | 0.07 | $ | 0.16 | $ | 0.02 | $ | 0.04 | $ | (0.05 | ) | $ | 0.13 | $ | 0.37 | ||||||||||||
Quarter ended March 31, 2019 | |||||||||||||||||||||||||||
Reported GAAP measure | Intangible amortization expense | Change in fair value of contingent consideration | Acquisition, divestiture and restructuring costs(b) | Tax recovery, net | Impact of Planned Divestitures | Non-GAAP measure | |||||||||||||||||||||
in thousands, except per share data | |||||||||||||||||||||||||||
Net sales | $ | 893,357 | $ | — | $ | — | $ | — | $ | — | $ | (140,511 | ) | $ | 752,846 | ||||||||||||
Gross profit | 110,015 | — | — | — | — | (14,208 | ) | 95,807 | |||||||||||||||||||
Operating income | 18,804 | 5,005 | 5,101 | 814 | — | 898 | 30,622 | ||||||||||||||||||||
Other expense, net | 3,009 | — | — | — | — | (257 | ) | 2,752 | |||||||||||||||||||
Pre-tax income | 15,795 | 5,005 | 5,101 | 814 | — | 1,155 | 27,870 | ||||||||||||||||||||
Net income | 11,715 | 3,789 | 3,619 | 665 | — | 846 | 20,634 | ||||||||||||||||||||
Diluted EPS | $ | 0.45 | $ | 0.15 | $ | 0.14 | $ | 0.03 | $ | — | $ | 0.03 | $ | 0.80 | |||||||||||||
(a) Acquisition and divestiture costs totaled $0.8 million for the quarter ended March 31, 2020 and are generally nondeductible for tax purposes. Restructuring costs totaled $0.1 million for the quarter ended March 31, 2020. | |||||||||||||||||||||||||||
(b) Acquisition and divestiture costs totaled $0.2 million for the quarter ended March 31, 2019 and are generally nondeductible for tax purposes. Restructuring costs totaled $0.6 million for the quarter ended March 31, 2019. | |||||||||||||||||||||||||||
10
ScanSource Announces Third Quarter Results
Nine months ended March 31, 2020 | |||||||||||||||||||||||||||
Reported GAAP measure | Intangible amortization expense | Change in fair value of contingent consideration | Acquisition, divestiture and restructuring costs(a) | Tax recovery, net | Impact of Planned Divestitures | Non-GAAP measure | |||||||||||||||||||||
(in thousands, except per share data) | |||||||||||||||||||||||||||
Net sales | $ | 2,850,812 | $ | — | $ | — | $ | — | $ | — | $ | (439,157 | ) | $ | 2,411,655 | ||||||||||||
Gross profit | 320,792 | — | — | — | — | (39,073 | ) | 281,719 | |||||||||||||||||||
Operating income | 43,390 | 16,079 | 6,266 | 3,503 | (1,529 | ) | 3,156 | 70,865 | |||||||||||||||||||
Other expense, net | 8,437 | — | — | — | — | (1,137 | ) | 7,300 | |||||||||||||||||||
Pre-tax income | 34,953 | 16,079 | 6,266 | 3,503 | $ | — | 5,085 | 65,886 | |||||||||||||||||||
Net income | 24,608 | 12,206 | 4,737 | 3,308 | (1,224 | ) | 3,571 | 47,206 | |||||||||||||||||||
Diluted EPS | $ | 0.97 | $ | 0.48 | $ | 0.19 | $ | 0.13 | $ | (0.05 | ) | $ | 0.14 | $ | 1.86 | ||||||||||||
Nine months ended March 31, 2019 | |||||||||||||||||||||||||||
Reported GAAP measure | Intangible amortization expense | Change in fair value of contingent consideration | Acquisition, divestiture and restructuring costs(b) | Tax recovery, net | Impact of Planned Divestitures | Non-GAAP measure | |||||||||||||||||||||
(in thousands, except per share data) | |||||||||||||||||||||||||||
Net sales | $ | 2,912,278 | $ | — | $ | — | $ | — | $ | — | $ | (473,767 | ) | $ | 2,438,511 | ||||||||||||
Gross profit | 342,708 | — | — | — | — | (46,404 | ) | 296,304 | |||||||||||||||||||
Operating income | 69,942 | 14,708 | 11,535 | 2,907 | — | (1,253 | ) | 97,839 | |||||||||||||||||||
Other expense, net | 8,272 | — | — | — | — | (603 | ) | 7,669 | |||||||||||||||||||
Pre-tax income | 61,670 | 14,708 | 11,535 | 2,907 | — | (650 | ) | 90,170 | |||||||||||||||||||
Net income | 46,019 | 11,154 | 8,514 | 2,386 | — | 150 | 68,223 | ||||||||||||||||||||
Diluted EPS | $ | 1.79 | $ | 0.43 | $ | 0.33 | $ | 0.09 | $ | — | $ | 0.01 | $ | 2.65 | |||||||||||||
(a) Acquisition and divestiture costs totaled $2.7 million for the nine months ended March 31, 2020 and are generally nondeductible for tax purposes. Restructuring costs totaled $0.8 million for the nine months ended March 31, 2020. | |||||||||||||||||||||||||||
(b) Acquisition and divestiture costs totaled $1.0 million for the nine months ended March 31, 2019 and are generally nondeductible for tax purposes. Restructuring costs totaled $1.9 million for the nine months ended March 31, 2019. | |||||||||||||||||||||||||||
11
ScanSource Announces Third Quarter Results
ScanSource, Inc. and Subsidiaries | |||||||
Supplementary Information (Unaudited) | |||||||
(in thousands, except percentages) | |||||||
Non-GAAP Financial Information: | |||||||
Quarter ended March 31, | |||||||
2020 | 2019 | ||||||
Return on invested capital ratio (ROIC), annualized (a) | 6.1 | % | 11.4 | % | |||
Reconciliation of net income to EBITDA: | |||||||
Net income (GAAP) | $ | 1,713 | $ | 11,715 | |||
Plus: Interest expense | 3,421 | 3,670 | |||||
Plus: Income taxes | 1,939 | 4,080 | |||||
Plus: Depreciation and amortization | 9,539 | 9,363 | |||||
EBITDA (non-GAAP) | 16,612 | 28,828 | |||||
Plus: Change in fair value of contingent consideration | 618 | 5,101 | |||||
Plus: Tax recovery, net | (1,529 | ) | — | ||||
Plus: Acquisition and divestiture costs | 780 | 222 | |||||
Plus: Restructuring costs | 155 | 456 | |||||
Plus: Impact of Planned Divestitures | 3,231 | 854 | |||||
Adjusted EBITDA (numerator for ROIC) (non-GAAP) | $ | 19,867 | $ | 35,461 | |||
Invested Capital Calculation | |||||||
Equity – beginning of the quarter | $ | 927,580 | $ | 899,503 | |||
Equity – end of the quarter | 897,678 | 911,063 | |||||
Plus: Change in fair value of contingent consideration, net of tax | 467 | 3,619 | |||||
Plus: Acquisition and divestiture costs | 780 | 222 | |||||
Plus: Restructuring, net of tax | 114 | 334 | |||||
Plus: Tax recovery, net | (1,224 | ) | — | ||||
Plus: Impact of Planned Divestitures, net of tax | 3,248 | 1,181 | |||||
Average equity | 914,322 | 907,961 | |||||
Average funded debt(b) | 405,533 | 357,443 | |||||
Invested capital (denominator for ROIC) (non-GAAP) | $ | 1,319,855 | $ | 1,265,404 | |||
(a) Calculated as earnings before interest expense, income taxes, depreciation and amortization (EBITDA), plus change in fair value of contingent consideration and other adjustments, annualized and divided by invested capital for the period. Invested capital is defined as average equity plus average daily funded interest-bearing debt for the period. | |||||||
(b) Average funded debt is calculated as the average daily amounts outstanding on short-term and long-term interest-bearing debt. | |||||||
12

Exhibit 99.2 ScanSource, Inc. CFO COMMENTARY Q3 FY2020 CFO COMMENTARY Q3 FY 2020 FINANCIAL INFORMATION AND CONFERENCE CALL Q3 FY20 Results: Please see the accompanying earnings press release available at www.scansource.com in the Investor Relations section. The information NET SALES included in this CFO commentary is unaudited and should be read in conjunction with the Company’s SEC filings on Form 10-Q for the quarter ended March 31, 2020. ScanSource will present additional information about $872.5 million its financial results and outlook in a conference call on Monday, May 11, Forecast: 2020 at 5:00 pm ET. A webcast of the call is available and can be accessed $865 million to at www.scansource.com (Investor Relations section). The webcast will be $915 million available for replay for 60 days. NON-GAAP NET SALES THIRD QUARTER SUMMARY Excluding Planned Divestitures For the third quarter, net sales grew across almost all of our diversified $744.6 million technologies in North America and Brazil in local currency. This sales Forecast: growth reflected accelerated growth from work-from-home solutions for $725 million to $775 million remote workforces in March. For the quarter, we had -2.3% net sales growth (including negative impact of foreign currency translation), and GAAP DILUTED EPS organic sales grew 0.5%. Our EPS for the quarter was below our forecast $0.07 range, primarily from a $4.5 million expense for inventory charges following the conversion to a new inventory management system. These Forecast: $0.16 to $0.26 inventory charges increased our cost of goods sold, which lowered gross profit for the third quarter. For the trailing 12-months ending March 31, NON-GAAP DILUTED EPS 2020, we generated strong operating cash flow of $148 million, up from Excluding Planned Divestitures $6 million for the trailing 12-months ending March 31, 2019. $0.37 With the economic disruption due to the COVID-19 pandemic, we enter Forecast: the June quarter with uncertainty around near-term customer demand. $0.44 to $0.54 Please see Appendix for calculation of non-GAAP measures and reconciliations to GAAP measures. In August 2019, ScanSource announced plans to divest its physical product businesses outside of the United States, Canada and Brazil (“Planned Divestitures”). scansource.com 1 May 11, 2020
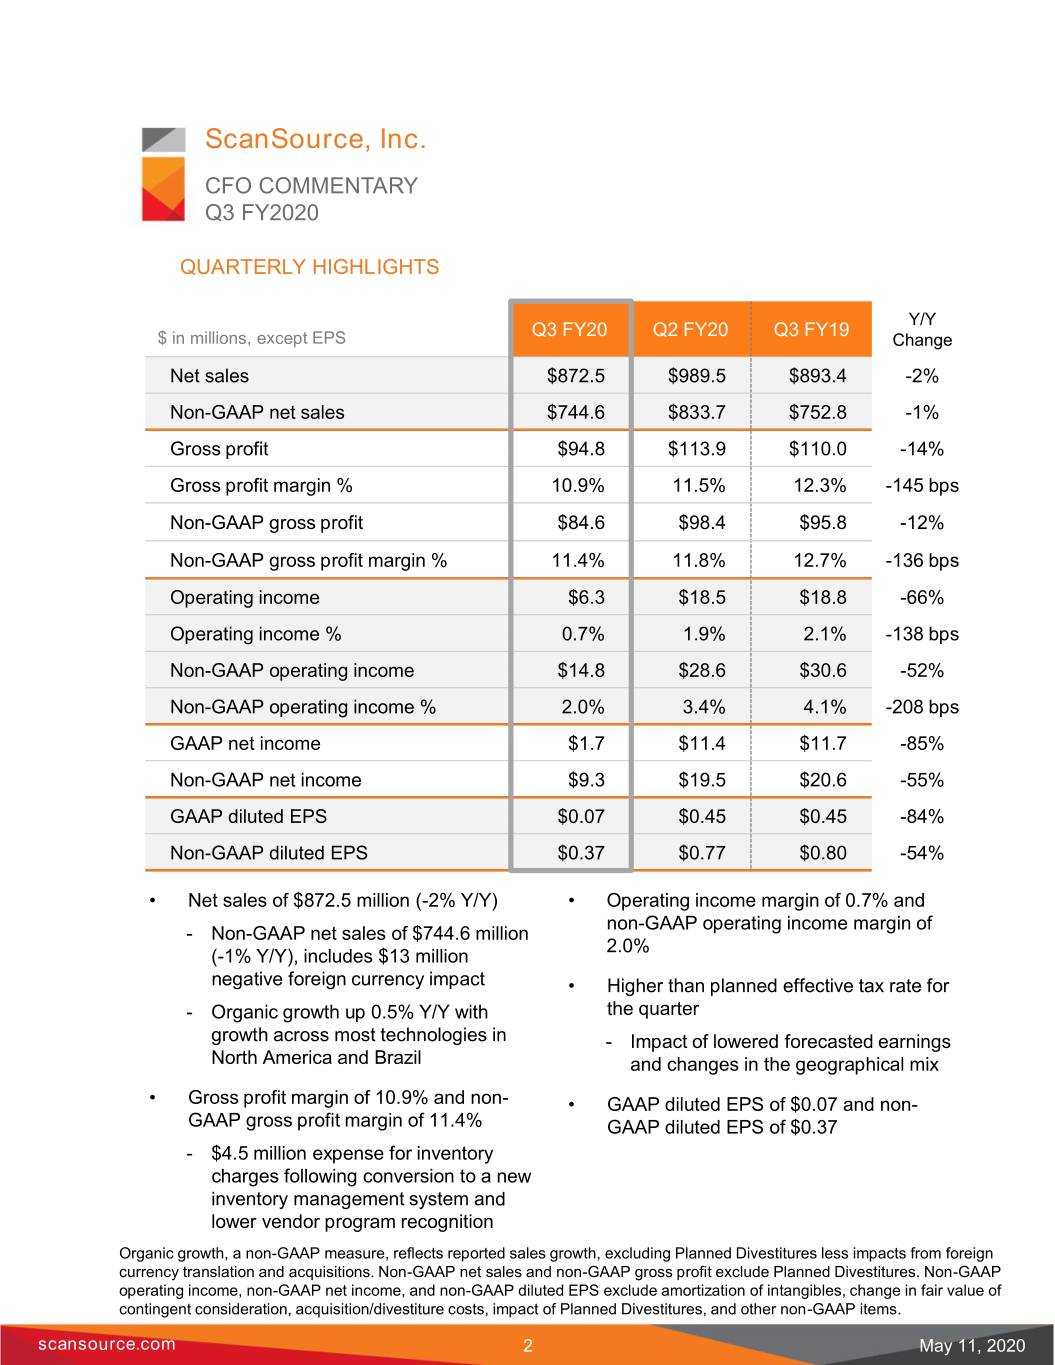
ScanSource, Inc. CFO COMMENTARY Q3 FY2020 QUARTERLY HIGHLIGHTS Y/Y Q3 FY20 Q2 FY20 Q3 FY19 $ in millions, except EPS Change Net sales $872.5 $989.5 $893.4 -2% Non-GAAP net sales $744.6 $833.7 $752.8 -1% Gross profit $94.8 $113.9 $110.0 -14% Gross profit margin % 10.9% 11.5% 12.3% -145 bps Non-GAAP gross profit $84.6 $98.4 $95.8 -12% Non-GAAP gross profit margin % 11.4% 11.8% 12.7% -136 bps Operating income $6.3 $18.5 $18.8 -66% Operating income % 0.7% 1.9% 2.1% -138 bps Non-GAAP operating income $14.8 $28.6 $30.6 -52% Non-GAAP operating income % 2.0% 3.4% 4.1% -208 bps GAAP net income $1.7 $11.4 $11.7 -85% Non-GAAP net income $9.3 $19.5 $20.6 -55% GAAP diluted EPS $0.07 $0.45 $0.45 -84% Non-GAAP diluted EPS $0.37 $0.77 $0.80 -54% • Net sales of $872.5 million (-2% Y/Y) • Operating income margin of 0.7% and non-GAAP operating income margin of - Non-GAAP net sales of $744.6 million 2.0% (-1% Y/Y), includes $13 million negative foreign currency impact • Higher than planned effective tax rate for - Organic growth up 0.5% Y/Y with the quarter growth across most technologies in - Impact of lowered forecasted earnings North America and Brazil and changes in the geographical mix • Gross profit margin of 10.9% and non- • GAAP diluted EPS of $0.07 and non- GAAP gross profit margin of 11.4% GAAP diluted EPS of $0.37 - $4.5 million expense for inventory charges following conversion to a new inventory management system and lower vendor program recognition Organic growth, a non-GAAP measure, reflects reported sales growth, excluding Planned Divestitures less impacts from foreign currency translation and acquisitions. Non-GAAP net sales and non-GAAP gross profit exclude Planned Divestitures. Non-GAAP operating income, non-GAAP net income, and non-GAAP diluted EPS exclude amortization of intangibles, change in fair value of contingent consideration, acquisition/divestiture costs, impact of Planned Divestitures, and other non-GAAP items. scansource.com 2 May 11, 2020
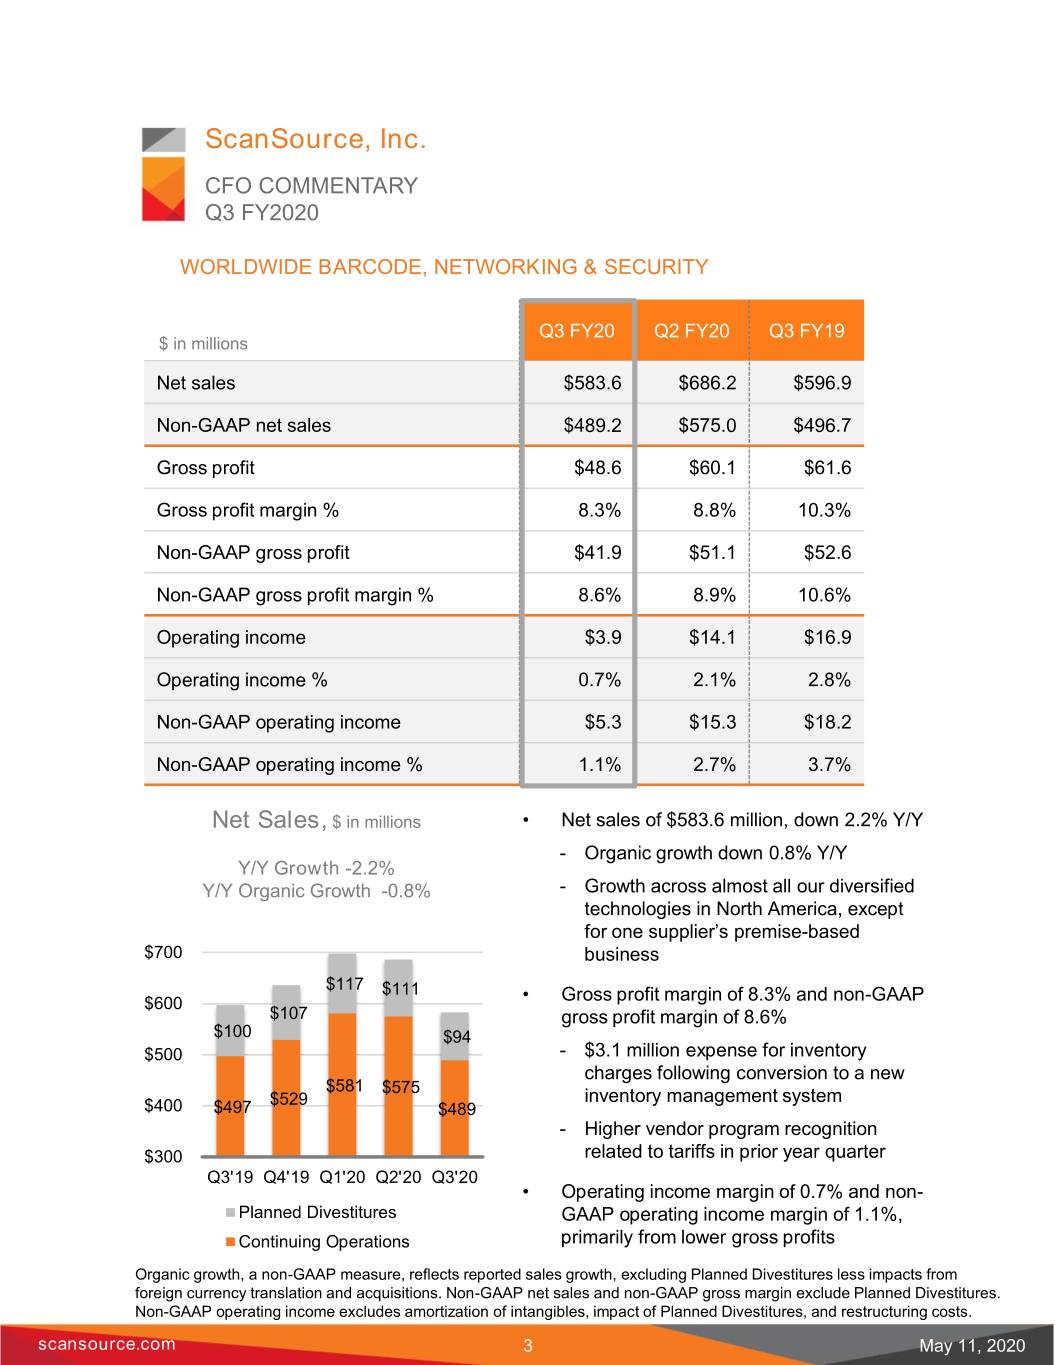
ScanSource, Inc. CFO COMMENTARY Q3 FY2020 WORLDWIDE BARCODE, NETWORKING & SECURITY Q3 FY20 Q2 FY20 Q3 FY19 $ in millions Net sales $583.6 $686.2 $596.9 Non-GAAP net sales $489.2 $575.0 $496.7 Gross profit $48.6 $60.1 $61.6 Gross profit margin % 8.3% 8.8% 10.3% Non-GAAP gross profit $41.9 $51.1 $52.6 Non-GAAP gross profit margin % 8.6% 8.9% 10.6% Operating income $3.9 $14.1 $16.9 Operating income % 0.7% 2.1% 2.8% Non-GAAP operating income $5.3 $15.3 $18.2 Non-GAAP operating income % 1.1% 2.7% 3.7% 1 Net Sales, $ in millions • Net sales of $583.6 million, down 2.2% Y/Y - Organic growth down 0.8% Y/Y Y/Y Growth -2.2% Y/Y Organic Growth -0.8% - Growth across almost all our diversified technologies in North America, except for one supplier’s premise-based $700 business $117 $111 $600 • Gross profit margin of 8.3% and non-GAAP $107 gross profit margin of 8.6% $100 $94 $500 - $3.1 million expense for inventory charges following conversion to a new $581 $575 $529 inventory management system $400 $497 $489 - Higher vendor program recognition $300 related to tariffs in prior year quarter Q3'19 Q4'19 Q1'20 Q2'20 Q3'20 • Operating income margin of 0.7% and non- Planned Divestitures GAAP operating income margin of 1.1%, Continuing Operations primarily from lower gross profits Organic growth, a non-GAAP measure, reflects reported sales growth, excluding Planned Divestitures less impacts from foreign currency translation and acquisitions. Non-GAAP net sales and non-GAAP gross margin exclude Planned Divestitures. Non-GAAP operating income excludes amortization of intangibles, impact of Planned Divestitures, and restructuring costs. scansource.com 3 May 11, 2020
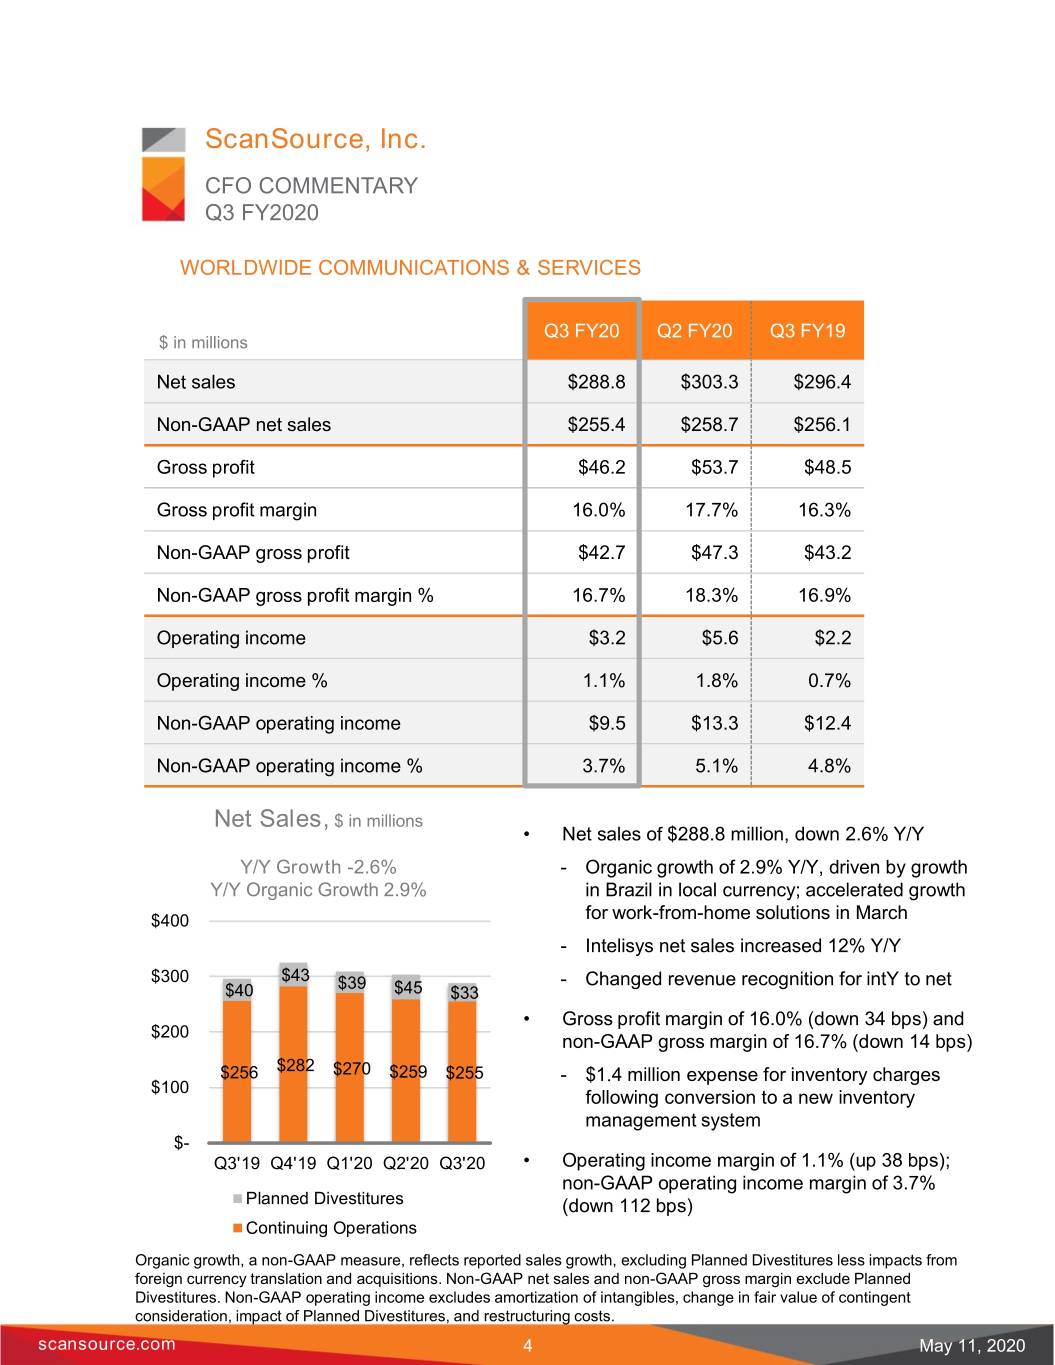
ScanSource, Inc. CFO COMMENTARY Q3 FY2020 WORLDWIDE COMMUNICATIONS & SERVICES Q3 FY20 Q2 FY20 Q3 FY19 $ in millions Net sales $288.8 $303.3 $296.4 Non-GAAP net sales $255.4 $258.7 $256.1 Gross profit $46.2 $53.7 $48.5 Gross profit margin 16.0% 17.7% 16.3% Non-GAAP gross profit $42.7 $47.3 $43.2 Non-GAAP gross profit margin % 16.7% 18.3% 16.9% Operating income $3.2 $5.6 $2.2 Operating income % 1.1% 1.8% 0.7% Non-GAAP operating income $9.5 $13.3 $12.4 Non-GAAP operating income % 3.7% 5.1% 4.8% Net Sales, $ in millions • Net sales of $288.8 million, down 2.6% Y/Y Y/Y Growth -2.6% - Organic growth of 2.9% Y/Y, driven by growth Y/Y Organic Growth 2.9% in Brazil in local currency; accelerated growth $400 for work-from-home solutions in March - Intelisys net sales increased 12% Y/Y $300 $43 $39 - Changed revenue recognition for intY to net $40 $45 $33 • Gross profit margin of 16.0% (down 34 bps) and $200 non-GAAP gross margin of 16.7% (down 14 bps) $256 $282 $270 $259 $255 - $1.4 million expense for inventory charges $100 following conversion to a new inventory management system $- Q3'19 Q4'19 Q1'20 Q2'20 Q3'20 • Operating income margin of 1.1% (up 38 bps); non-GAAP operating income margin of 3.7% Planned Divestitures (down 112 bps) Continuing Operations Organic growth, a non-GAAP measure, reflects reported sales growth, excluding Planned Divestitures less impacts from foreign currency translation and acquisitions. Non-GAAP net sales and non-GAAP gross margin exclude Planned Divestitures. Non-GAAP operating income excludes amortization of intangibles, change in fair value of contingent consideration, impact of Planned Divestitures, and restructuring costs. scansource.com 4 May 11, 2020
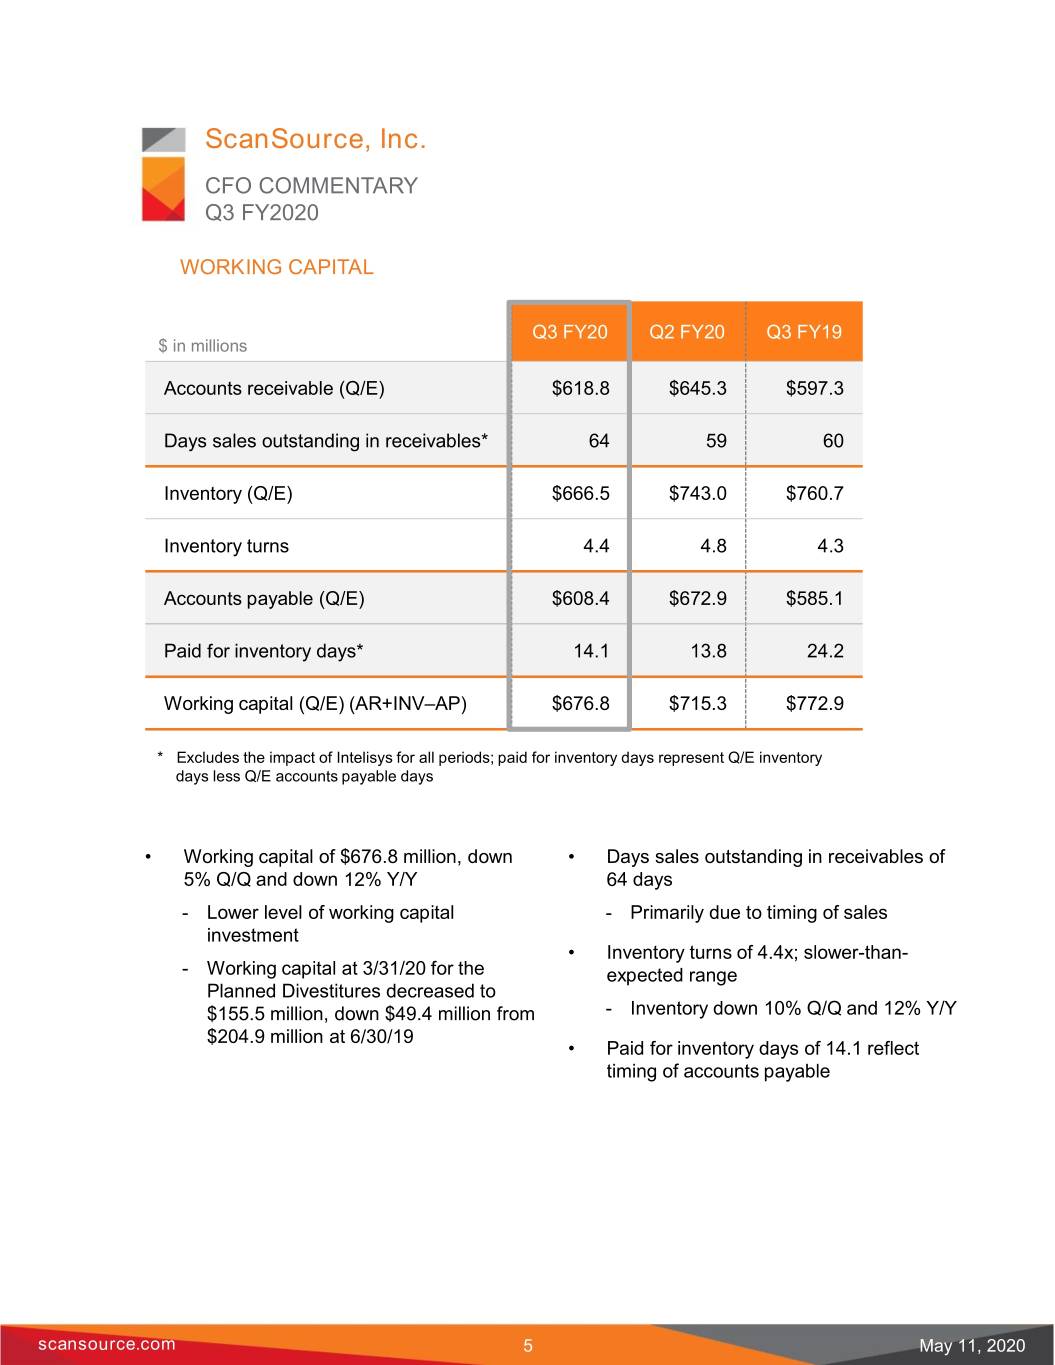
ScanSource, Inc. CFO COMMENTARY Q3 FY2020 WORKING CAPITAL Q3 FY20 Q2 FY20 Q3 FY19 $ in millions Accounts receivable (Q/E) $618.8 $645.3 $597.3 Days sales outstanding in receivables* 64 59 60 Inventory (Q/E) $666.5 $743.0 $760.7 Inventory turns 4.4 4.8 4.3 Accounts payable (Q/E) $608.4 $672.9 $585.1 Paid for inventory days* 14.1 13.8 24.2 Working capital (Q/E) (AR+INV–AP) $676.8 $715.3 $772.9 * Excludes the impact of Intelisys for all periods; paid for inventory days represent Q/E inventory days less Q/E accounts payable days • Working capital of $676.8 million, down • Days sales outstanding in receivables of 5% Q/Q and down 12% Y/Y 64 days - Lower level of working capital - Primarily due to timing of sales investment • Inventory turns of 4.4x; slower-than- - Working capital at 3/31/20 for the expected range Planned Divestitures decreased to $155.5 million, down $49.4 million from - Inventory down 10% Q/Q and 12% Y/Y $204.9 million at 6/30/19 • Paid for inventory days of 14.1 reflect timing of accounts payable scansource.com 5 May 11, 2020
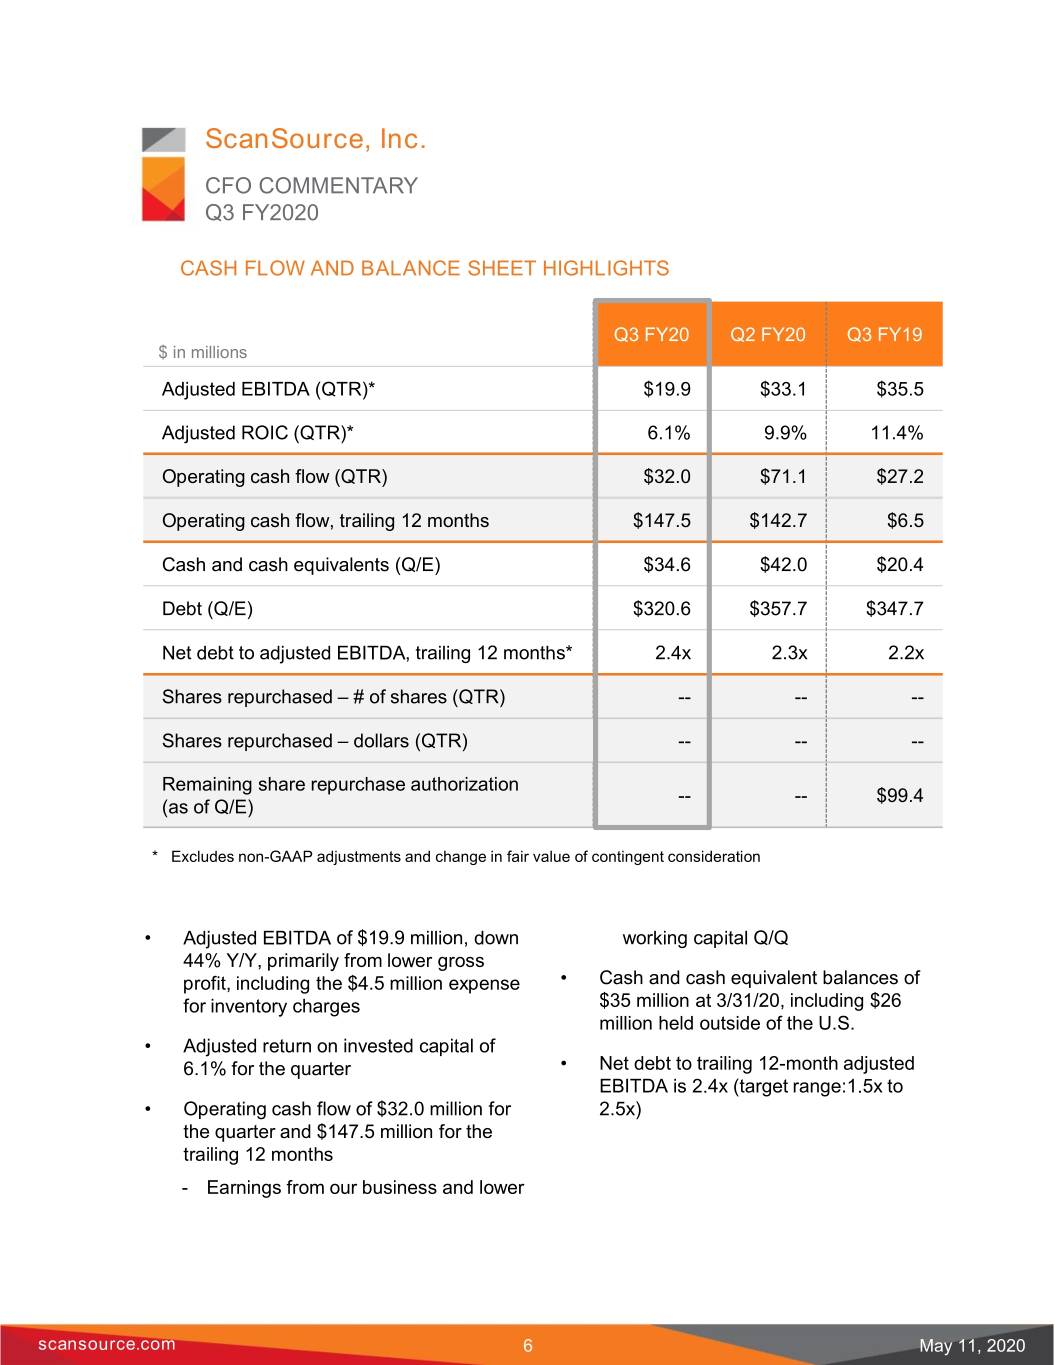
ScanSource, Inc. CFO COMMENTARY Q3 FY2020 CASH FLOW AND BALANCE SHEET HIGHLIGHTS Q3 FY20 Q2 FY20 Q3 FY19 $ in millions Adjusted EBITDA (QTR)* $19.9 $33.1 $35.5 Adjusted ROIC (QTR)* 6.1% 9.9% 11.4% Operating cash flow (QTR) $32.0 $71.1 $27.2 Operating cash flow, trailing 12 months $147.5 $142.7 $6.5 Cash and cash equivalents (Q/E) $34.6 $42.0 $20.4 Debt (Q/E) $320.6 $357.7 $347.7 Net debt to adjusted EBITDA, trailing 12 months* 2.4x 2.3x 2.2x Shares repurchased – # of shares (QTR) -- -- -- Shares repurchased – dollars (QTR) -- -- -- Remaining share repurchase authorization -- -- $99.4 (as of Q/E) * Excludes non-GAAP adjustments and change in fair value of contingent consideration • Adjusted EBITDA of $19.9 million, down working capital Q/Q 44% Y/Y, primarily from lower gross profit, including the $4.5 million expense • Cash and cash equivalent balances of for inventory charges $35 million at 3/31/20, including $26 million held outside of the U.S. • Adjusted return on invested capital of 6.1% for the quarter • Net debt to trailing 12-month adjusted EBITDA is 2.4x (target range:1.5x to • Operating cash flow of $32.0 million for 2.5x) the quarter and $147.5 million for the trailing 12 months - Earnings from our business and lower scansource.com 6 May 11, 2020

ScanSource, Inc. CFO COMMENTARY Q3 FY2020 FORWARD-LOOKING STATEMENTS This CFO Commentary contains certain Although ScanSource believes the comments that are “forward-looking” expectations in its forward-looking statements statements, including statements about are reasonable, it cannot guarantee future Planned Divestitures, impact of the COVID-19 results, levels of activity, performance or pandemic and our operating strategies that achievement. ScanSource disclaims any involve plans, strategies, economic obligation to update or revise any forward- performance and trends, projections, looking statements, whether as a result of new expectations, costs or beliefs about future information, future events, or otherwise, events and other statements that are not except as may be required by law. descriptions of historical facts. Forward- looking information is inherently subject to NON-GAAP FINANCIAL INFORMATION risks and uncertainties. In addition to disclosing results that are determined in accordance with United States Any number of factors could cause actual Generally Accepted Accounting Principles results to differ materially from anticipated or (“GAAP”), the Company also discloses certain forecasted results, including but not limited to, non-GAAP measures, including non-GAAP our ability to complete the Planned operating income, non-GAAP operating Divestitures on acceptable terms or at all, income margin, non-GAAP net income, non- changes in our operating strategy, the impact GAAP diluted EPS, non-GAAP net sales, non- of COVID-19 pandemic on our operations and GAAP gross profit, non-GAAP gross margin, financial condition, changes in interest and adjusted EBITDA, ROIC and net sales exchange rates and regulatory regimes excluding the Planned Divestitures less impacting our international operations, the impacts from foreign currency translation and impact of tax reform laws, the failure of acquisitions (organic growth). A reconciliation acquisitions to meet our expectations, the of the Company's non-GAAP financial failure to manage and implement our organic information to GAAP financial information is growth strategy, credit risks involving our provided in the Appendix and in the larger customers and vendors, termination of Company’s Form 8-K, filed with the SEC, with our relationship with key vendors or a the quarterly earnings press release for the significant modification of the terms under period indicated. which we operate with a key vendor, the decline in demand for the products and services that we provide, reduced prices for the products and services that we provide due both to competitor and customer actions, and other factors set forth in the “Risk Factors” contained in our annual report on Form 10-K for the year ended June 30, 2019 and our quarterly report on Form 10-Q for the quarter ended March 31, 2020, filed with the Securities and Exchange Commission (“SEC”). scansource.com 7 May 11, 2020
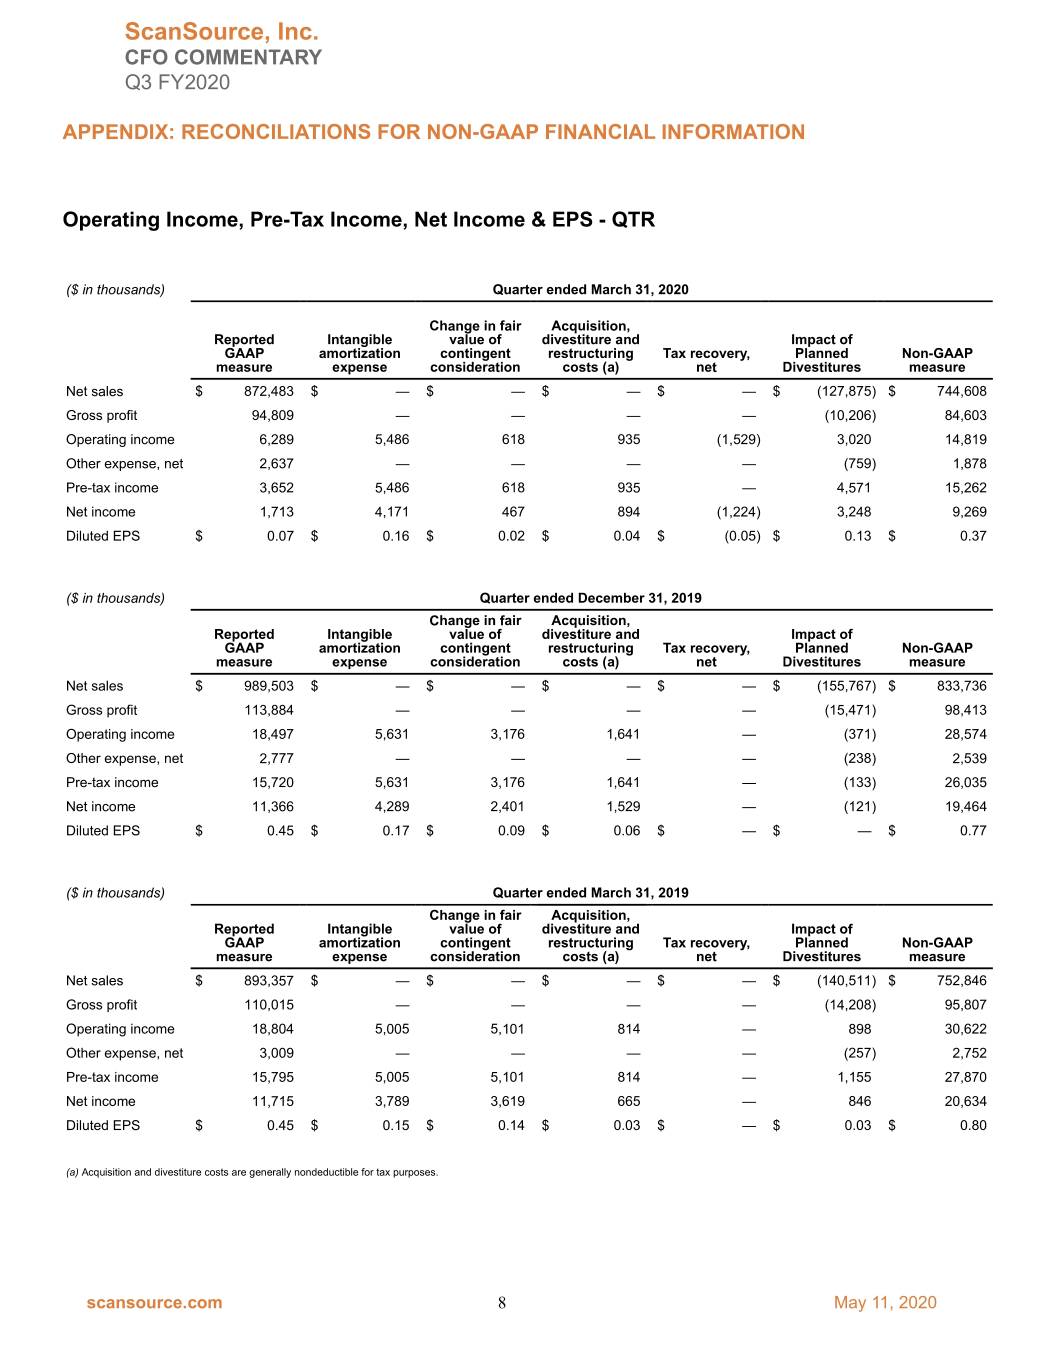
ScanSource, Inc. CFO COMMENTARY Q3 FY2020 APPENDIX: RECONCILIATIONS FOR NON-GAAP FINANCIAL INFORMATION Operating Income, Pre-Tax Income, Net Income & EPS - QTR ($ in thousands) Quarter ended March 31, 2020 Change in fair Acquisition, Reported Intangible value of divestiture and Impact of GAAP amortization contingent restructuring Tax recovery, Planned Non-GAAP measure expense consideration costs (a) net Divestitures measure Net sales $ 872,483 $ — $ — $ — $ — $ (127,875) $ 744,608 Gross profit 94,809 — — — — (10,206) 84,603 Operating income 6,289 5,486 618 935 (1,529) 3,020 14,819 Other expense, net 2,637 — — — — (759) 1,878 Pre-tax income 3,652 5,486 618 935 — 4,571 15,262 Net income 1,713 4,171 467 894 (1,224) 3,248 9,269 Diluted EPS $ 0.07 $ 0.16 $ 0.02 $ 0.04 $ (0.05) $ 0.13 $ 0.37 ($ in thousands) Quarter ended December 31, 2019 Change in fair Acquisition, Reported Intangible value of divestiture and Impact of GAAP amortization contingent restructuring Tax recovery, Planned Non-GAAP measure expense consideration costs (a) net Divestitures measure Net sales $ 989,503 $ — $ — $ — $ — $ (155,767) $ 833,736 Gross profit 113,884 — — — — (15,471) 98,413 Operating income 18,497 5,631 3,176 1,641 — (371) 28,574 Other expense, net 2,777 — — — — (238) 2,539 Pre-tax income 15,720 5,631 3,176 1,641 — (133) 26,035 Net income 11,366 4,289 2,401 1,529 — (121) 19,464 Diluted EPS $ 0.45 $ 0.17 $ 0.09 $ 0.06 $ — $ — $ 0.77 ($ in thousands) Quarter ended March 31, 2019 Change in fair Acquisition, Reported Intangible value of divestiture and Impact of GAAP amortization contingent restructuring Tax recovery, Planned Non-GAAP measure expense consideration costs (a) net Divestitures measure Net sales $ 893,357 $ — $ — $ — $ — $ (140,511) $ 752,846 Gross profit 110,015 — — — — (14,208) 95,807 Operating income 18,804 5,005 5,101 814 — 898 30,622 Other expense, net 3,009 — — — — (257) 2,752 Pre-tax income 15,795 5,005 5,101 814 — 1,155 27,870 Net income 11,715 3,789 3,619 665 — 846 20,634 Diluted EPS $ 0.45 $ 0.15 $ 0.14 $ 0.03 $ — $ 0.03 $ 0.80 (a) Acquisition and divestiture costs are generally nondeductible for tax purposes. scansource.com 8 May 11, 2020
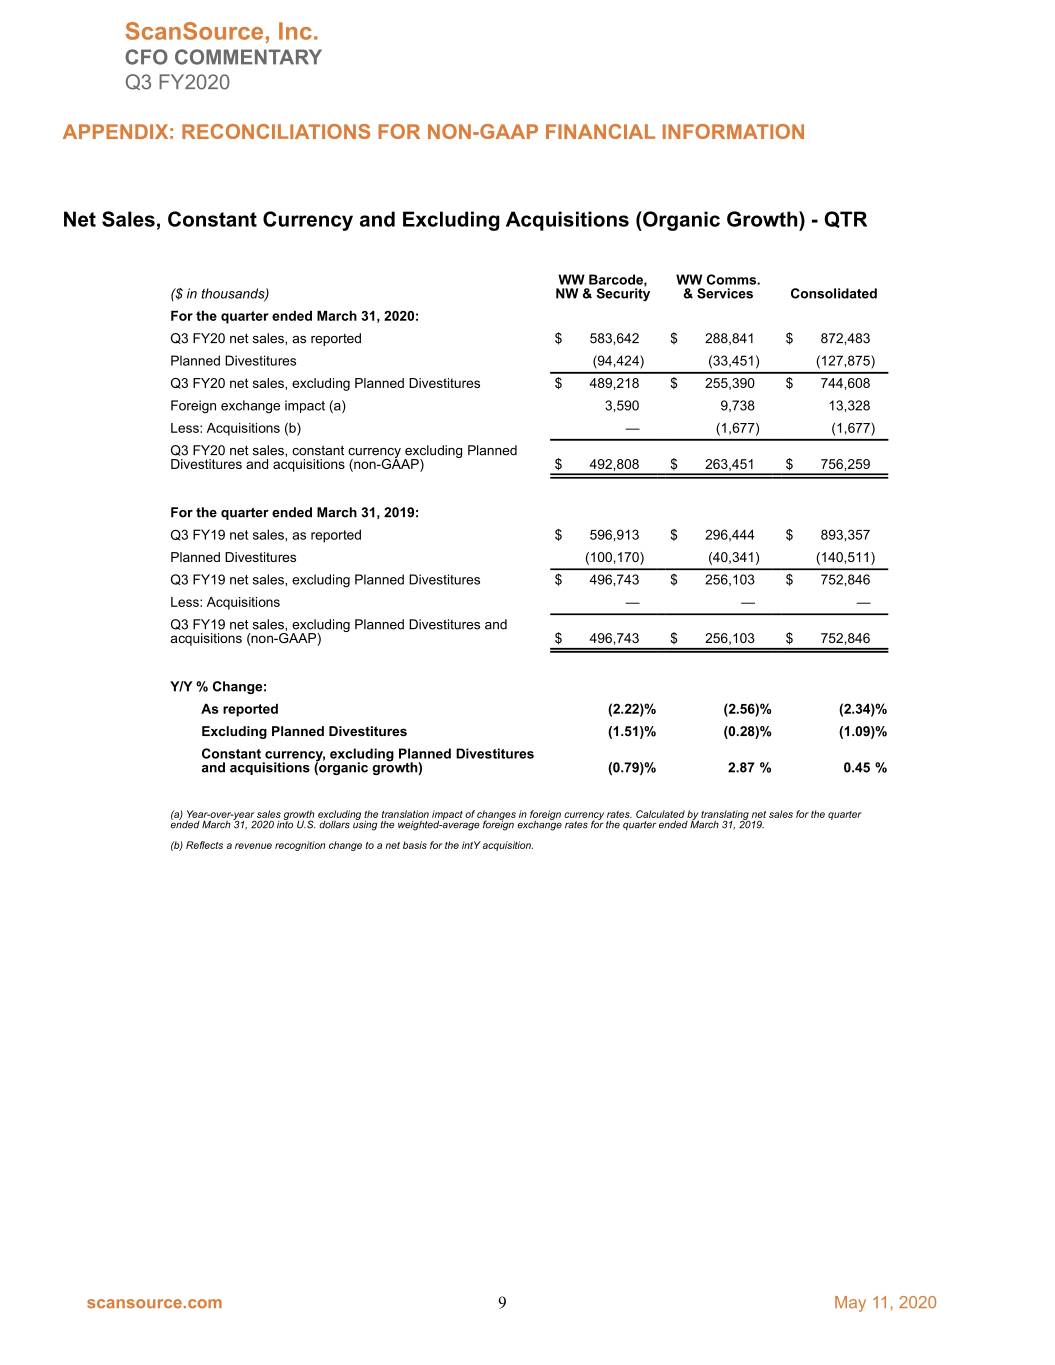
ScanSource, Inc. CFO COMMENTARY Q3 FY2020 APPENDIX: RECONCILIATIONS FOR NON-GAAP FINANCIAL INFORMATION Net Sales, Constant Currency and Excluding Acquisitions (Organic Growth) - QTR WW Barcode, WW Comms. ($ in thousands) NW & Security & Services Consolidated For the quarter ended March 31, 2020: Q3 FY20 net sales, as reported $ 583,642 $ 288,841 $ 872,483 Planned Divestitures (94,424) (33,451) (127,875) Q3 FY20 net sales, excluding Planned Divestitures $ 489,218 $ 255,390 $ 744,608 Foreign exchange impact (a) 3,590 9,738 13,328 Less: Acquisitions (b) — (1,677) (1,677) Q3 FY20 net sales, constant currency excluding Planned Divestitures and acquisitions (non-GAAP) $ 492,808 $ 263,451 $ 756,259 For the quarter ended March 31, 2019: Q3 FY19 net sales, as reported $ 596,913 $ 296,444 $ 893,357 Planned Divestitures (100,170) (40,341) (140,511) Q3 FY19 net sales, excluding Planned Divestitures $ 496,743 $ 256,103 $ 752,846 Less: Acquisitions — — — Q3 FY19 net sales, excluding Planned Divestitures and acquisitions (non-GAAP) $ 496,743 $ 256,103 $ 752,846 Y/Y % Change: As reported (2.22)% (2.56)% (2.34)% Excluding Planned Divestitures (1.51)% (0.28)% (1.09)% Constant currency, excluding Planned Divestitures and acquisitions (organic growth) (0.79)% 2.87 % 0.45 % (a) Year-over-year sales growth excluding the translation impact of changes in foreign currency rates. Calculated by translating net sales for the quarter ended March 31, 2020 into U.S. dollars using the weighted-average foreign exchange rates for the quarter ended March 31, 2019. (b) Reflects a revenue recognition change to a net basis for the intY acquisition. scansource.com 9 May 11, 2020
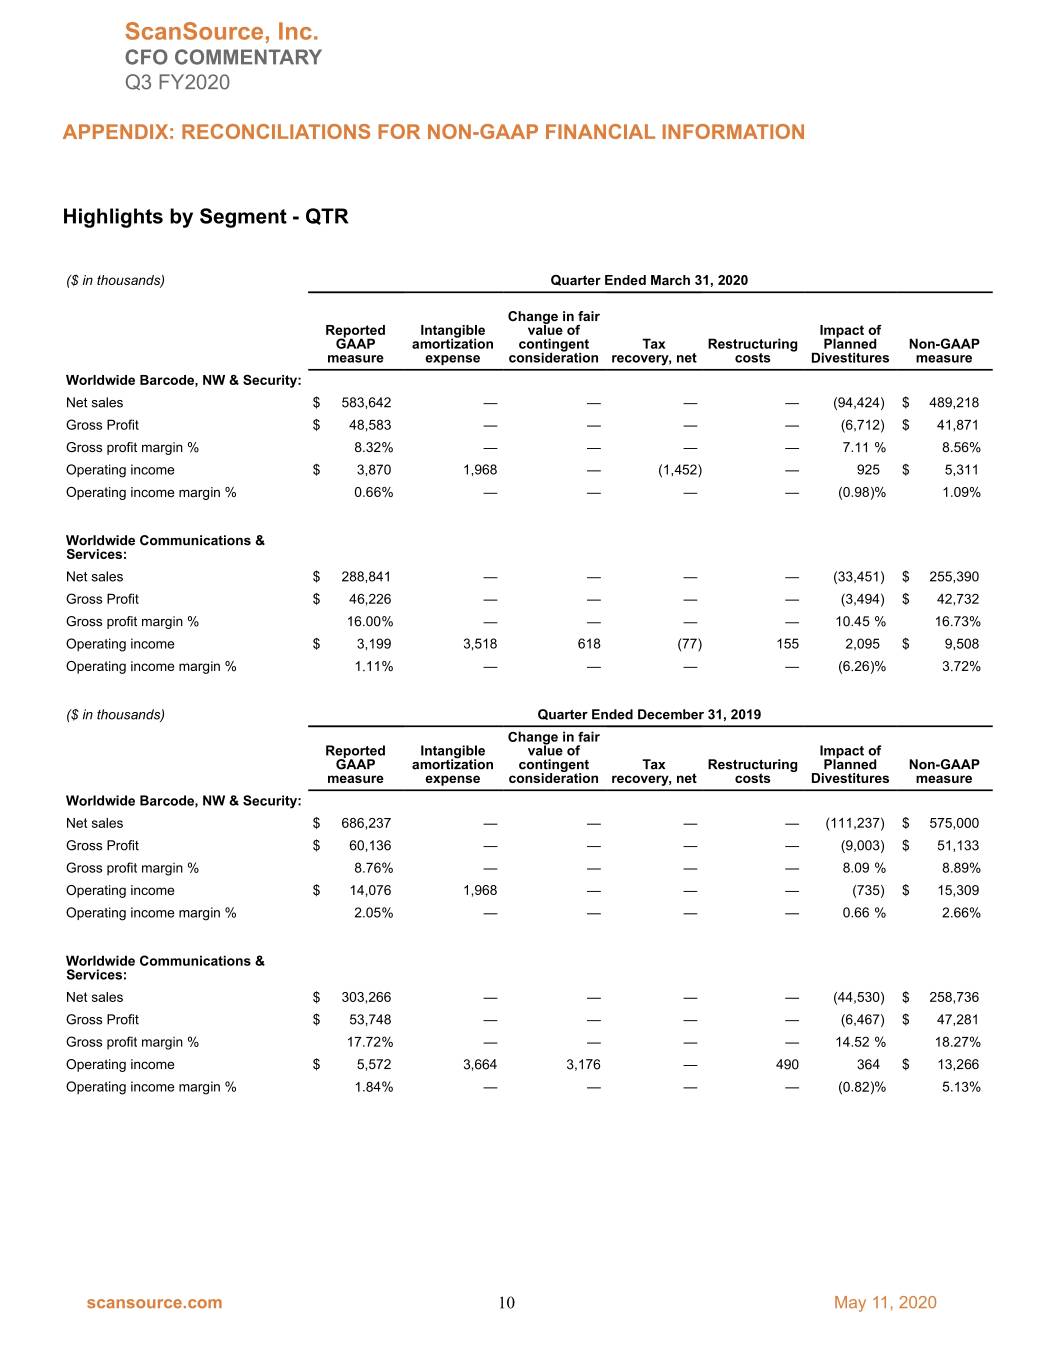
ScanSource, Inc. CFO COMMENTARY Q3 FY2020 APPENDIX: RECONCILIATIONS FOR NON-GAAP FINANCIAL INFORMATION Highlights by Segment - QTR ($ in thousands) Quarter Ended March 31, 2020 Change in fair Reported Intangible value of Impact of GAAP amortization contingent Tax Restructuring Planned Non-GAAP measure expense consideration recovery, net costs Divestitures measure Worldwide Barcode, NW & Security: Net sales $ 583,642 — — — — (94,424) $ 489,218 Gross Profit $ 48,583 — — — — (6,712) $ 41,871 Gross profit margin % 8.32% — — — — 7.11 % 8.56% Operating income $ 3,870 1,968 — (1,452) — 925 $ 5,311 Operating income margin % 0.66% — — — — (0.98)% 1.09% Worldwide Communications & Services: Net sales $ 288,841 — — — — (33,451) $ 255,390 Gross Profit $ 46,226 — — — — (3,494) $ 42,732 Gross profit margin % 16.00% — — — — 10.45 % 16.73% Operating income $ 3,199 3,518 618 (77) 155 2,095 $ 9,508 Operating income margin % 1.11% — — — — (6.26)% 3.72% ($ in thousands) Quarter Ended December 31, 2019 Change in fair Reported Intangible value of Impact of GAAP amortization contingent Tax Restructuring Planned Non-GAAP measure expense consideration recovery, net costs Divestitures measure Worldwide Barcode, NW & Security: Net sales $ 686,237 — — — — (111,237) $ 575,000 Gross Profit $ 60,136 — — — — (9,003) $ 51,133 Gross profit margin % 8.76% — — — — 8.09 % 8.89% Operating income $ 14,076 1,968 — — — (735) $ 15,309 Operating income margin % 2.05% — — — — 0.66 % 2.66% Worldwide Communications & Services: Net sales $ 303,266 — — — — (44,530) $ 258,736 Gross Profit $ 53,748 — — — — (6,467) $ 47,281 Gross profit margin % 17.72% — — — — 14.52 % 18.27% Operating income $ 5,572 3,664 3,176 — 490 364 $ 13,266 Operating income margin % 1.84% — — — — (0.82)% 5.13% scansource.com 10 May 11, 2020
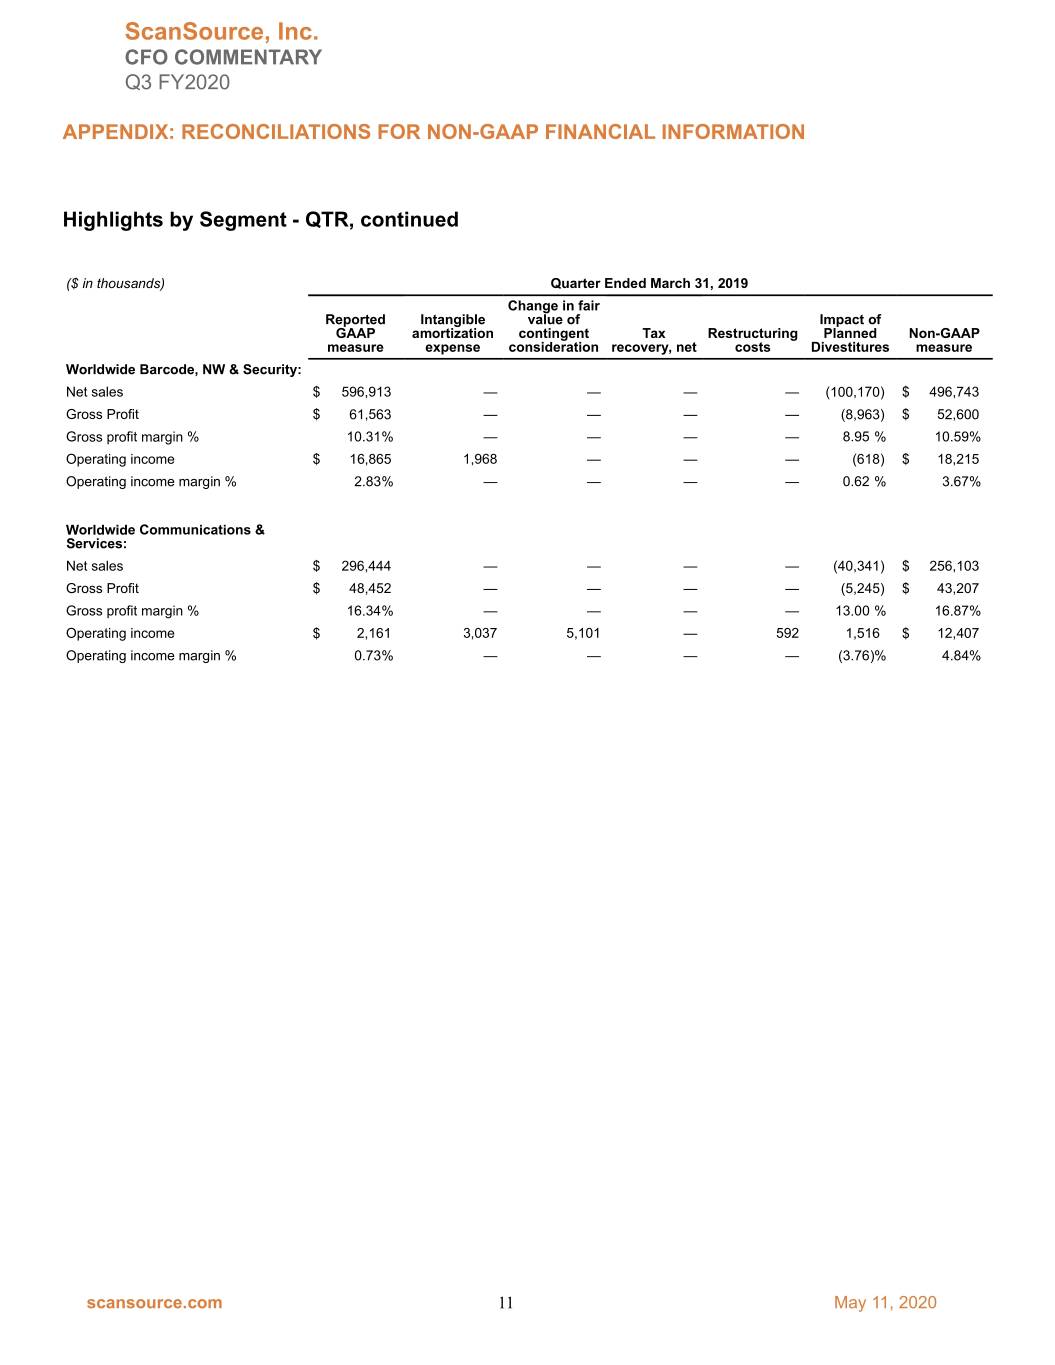
ScanSource, Inc. CFO COMMENTARY Q3 FY2020 APPENDIX: RECONCILIATIONS FOR NON-GAAP FINANCIAL INFORMATION Highlights by Segment - QTR, continued ($ in thousands) Quarter Ended March 31, 2019 Change in fair Reported Intangible value of Impact of GAAP amortization contingent Tax Restructuring Planned Non-GAAP measure expense consideration recovery, net costs Divestitures measure Worldwide Barcode, NW & Security: Net sales $ 596,913 — — — — (100,170) $ 496,743 Gross Profit $ 61,563 — — — — (8,963) $ 52,600 Gross profit margin % 10.31% — — — — 8.95 % 10.59% Operating income $ 16,865 1,968 — — — (618) $ 18,215 Operating income margin % 2.83% — — — — 0.62 % 3.67% Worldwide Communications & Services: Net sales $ 296,444 — — — — (40,341) $ 256,103 Gross Profit $ 48,452 — — — — (5,245) $ 43,207 Gross profit margin % 16.34% — — — — 13.00 % 16.87% Operating income $ 2,161 3,037 5,101 — 592 1,516 $ 12,407 Operating income margin % 0.73% — — — — (3.76)% 4.84% scansource.com 11 May 11, 2020
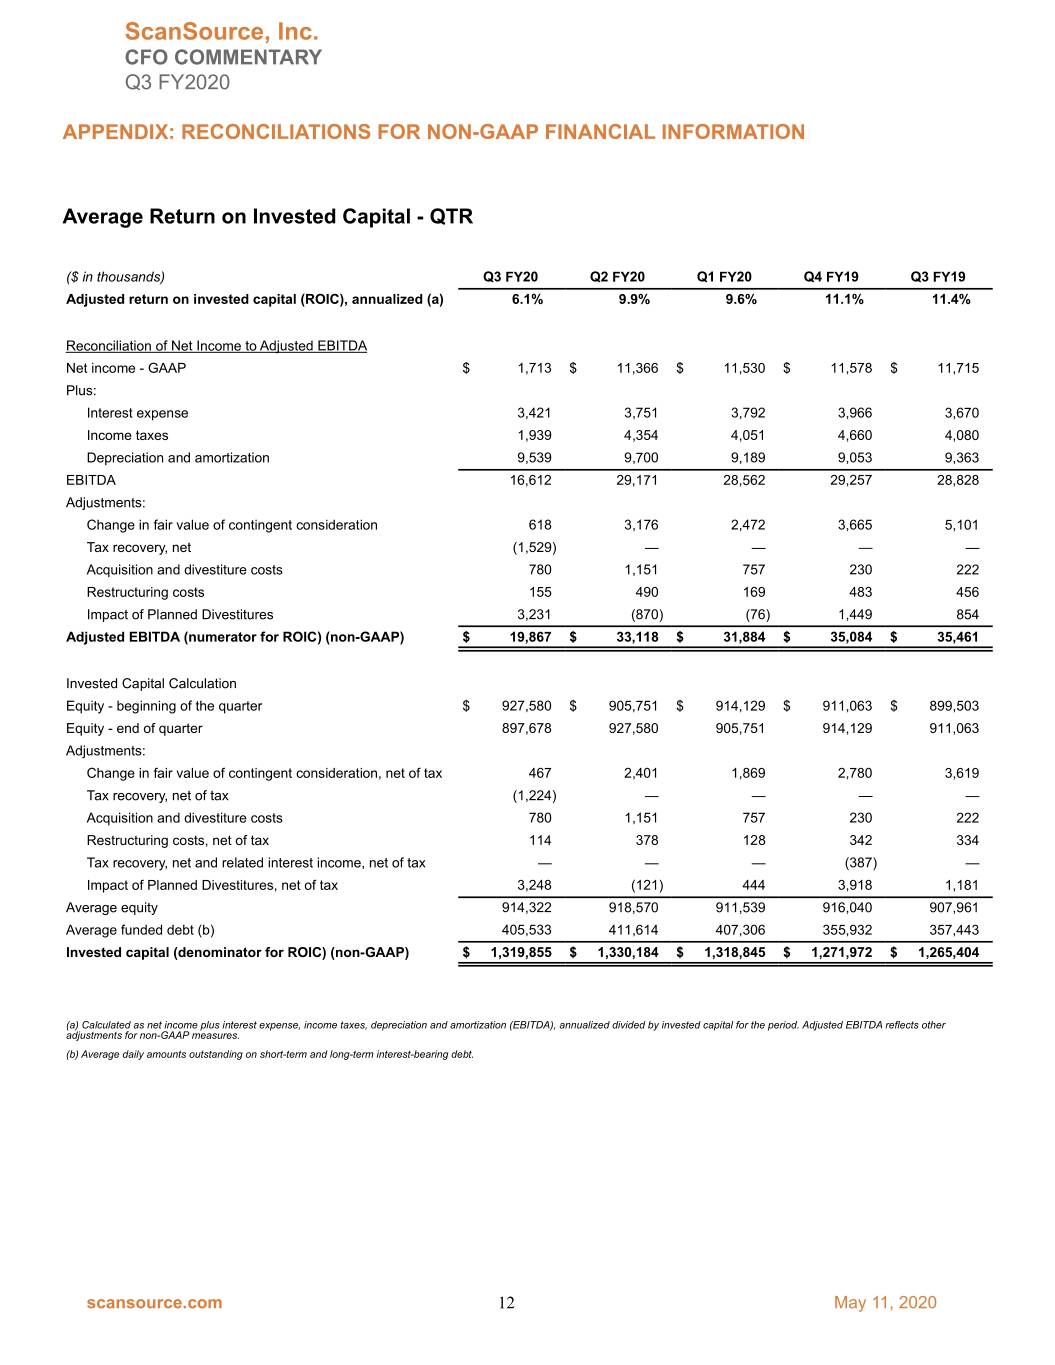
ScanSource, Inc. CFO COMMENTARY Q3 FY2020 APPENDIX: RECONCILIATIONS FOR NON-GAAP FINANCIAL INFORMATION Average Return on Invested Capital - QTR ($ in thousands) Q3 FY20 Q2 FY20 Q1 FY20 Q4 FY19 Q3 FY19 Adjusted return on invested capital (ROIC), annualized (a) 6.1% 9.9% 9.6% 11.1% 11.4% Reconciliation of Net Income to Adjusted EBITDA Net income - GAAP $ 1,713 $ 11,366 $ 11,530 $ 11,578 $ 11,715 Plus: Interest expense 3,421 3,751 3,792 3,966 3,670 Income taxes 1,939 4,354 4,051 4,660 4,080 Depreciation and amortization 9,539 9,700 9,189 9,053 9,363 EBITDA 16,612 29,171 28,562 29,257 28,828 Adjustments: Change in fair value of contingent consideration 618 3,176 2,472 3,665 5,101 Tax recovery, net (1,529) — — — — Acquisition and divestiture costs 780 1,151 757 230 222 Restructuring costs 155 490 169 483 456 Impact of Planned Divestitures 3,231 (870) (76) 1,449 854 Adjusted EBITDA (numerator for ROIC) (non-GAAP) $ 19,867 $ 33,118 $ 31,884 $ 35,084 $ 35,461 Invested Capital Calculation Equity - beginning of the quarter $ 927,580 $ 905,751 $ 914,129 $ 911,063 $ 899,503 Equity - end of quarter 897,678 927,580 905,751 914,129 911,063 Adjustments: Change in fair value of contingent consideration, net of tax 467 2,401 1,869 2,780 3,619 Tax recovery, net of tax (1,224) — — — — Acquisition and divestiture costs 780 1,151 757 230 222 Restructuring costs, net of tax 114 378 128 342 334 Tax recovery, net and related interest income, net of tax — — — (387) — Impact of Planned Divestitures, net of tax 3,248 (121) 444 3,918 1,181 Average equity 914,322 918,570 911,539 916,040 907,961 Average funded debt (b) 405,533 411,614 407,306 355,932 357,443 Invested capital (denominator for ROIC) (non-GAAP) $ 1,319,855 $ 1,330,184 $ 1,318,845 $ 1,271,972 $ 1,265,404 (a) Calculated as net income plus interest expense, income taxes, depreciation and amortization (EBITDA), annualized divided by invested capital for the period. Adjusted EBITDA reflects other adjustments for non-GAAP measures. (b) Average daily amounts outstanding on short-term and long-term interest-bearing debt. scansource.com 12 May 11, 2020
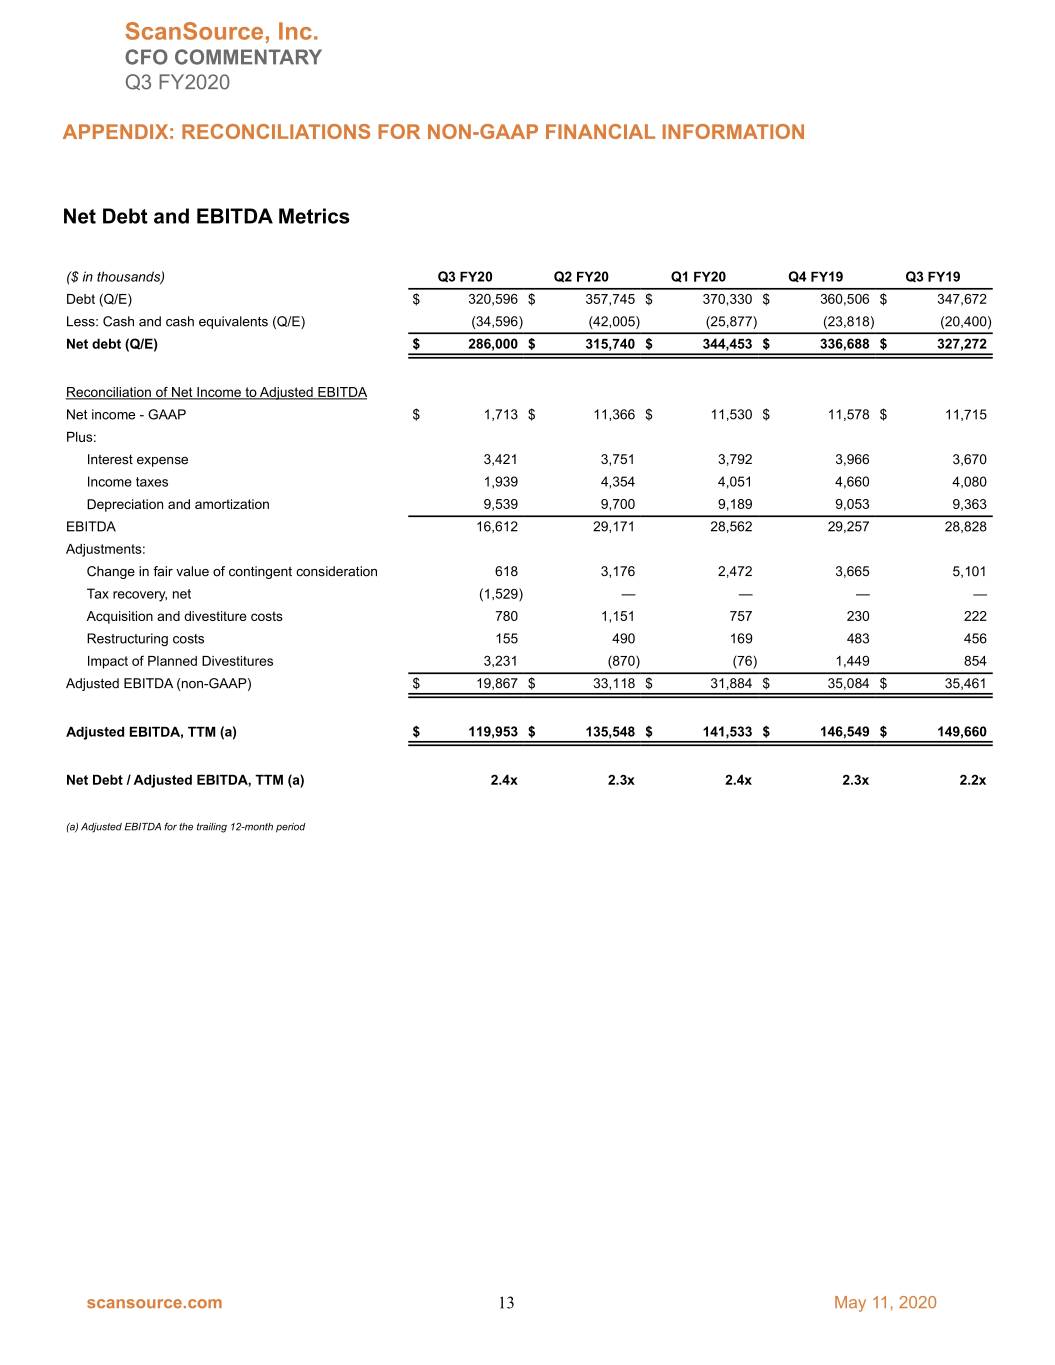
ScanSource, Inc. CFO COMMENTARY Q3 FY2020 APPENDIX: RECONCILIATIONS FOR NON-GAAP FINANCIAL INFORMATION Net Debt and EBITDA Metrics ($ in thousands) Q3 FY20 Q2 FY20 Q1 FY20 Q4 FY19 Q3 FY19 Debt (Q/E) $ 320,596 $ 357,745 $ 370,330 $ 360,506 $ 347,672 Less: Cash and cash equivalents (Q/E) (34,596) (42,005) (25,877) (23,818) (20,400) Net debt (Q/E) $ 286,000 $ 315,740 $ 344,453 $ 336,688 $ 327,272 Reconciliation of Net Income to Adjusted EBITDA Net income - GAAP $ 1,713 $ 11,366 $ 11,530 $ 11,578 $ 11,715 Plus: Interest expense 3,421 3,751 3,792 3,966 3,670 Income taxes 1,939 4,354 4,051 4,660 4,080 Depreciation and amortization 9,539 9,700 9,189 9,053 9,363 EBITDA 16,612 29,171 28,562 29,257 28,828 Adjustments: Change in fair value of contingent consideration 618 3,176 2,472 3,665 5,101 Tax recovery, net (1,529) — — — — Acquisition and divestiture costs 780 1,151 757 230 222 Restructuring costs 155 490 169 483 456 Impact of Planned Divestitures 3,231 (870) (76) 1,449 854 Adjusted EBITDA (non-GAAP) $ 19,867 $ 33,118 $ 31,884 $ 35,084 $ 35,461 Adjusted EBITDA, TTM (a) $ 119,953 $ 135,548 $ 141,533 $ 146,549 $ 149,660 Net Debt / Adjusted EBITDA, TTM (a) 2.4x 2.3x 2.4x 2.3x 2.2x (a) Adjusted EBITDA for the trailing 12-month period scansource.com 13 May 11, 2020
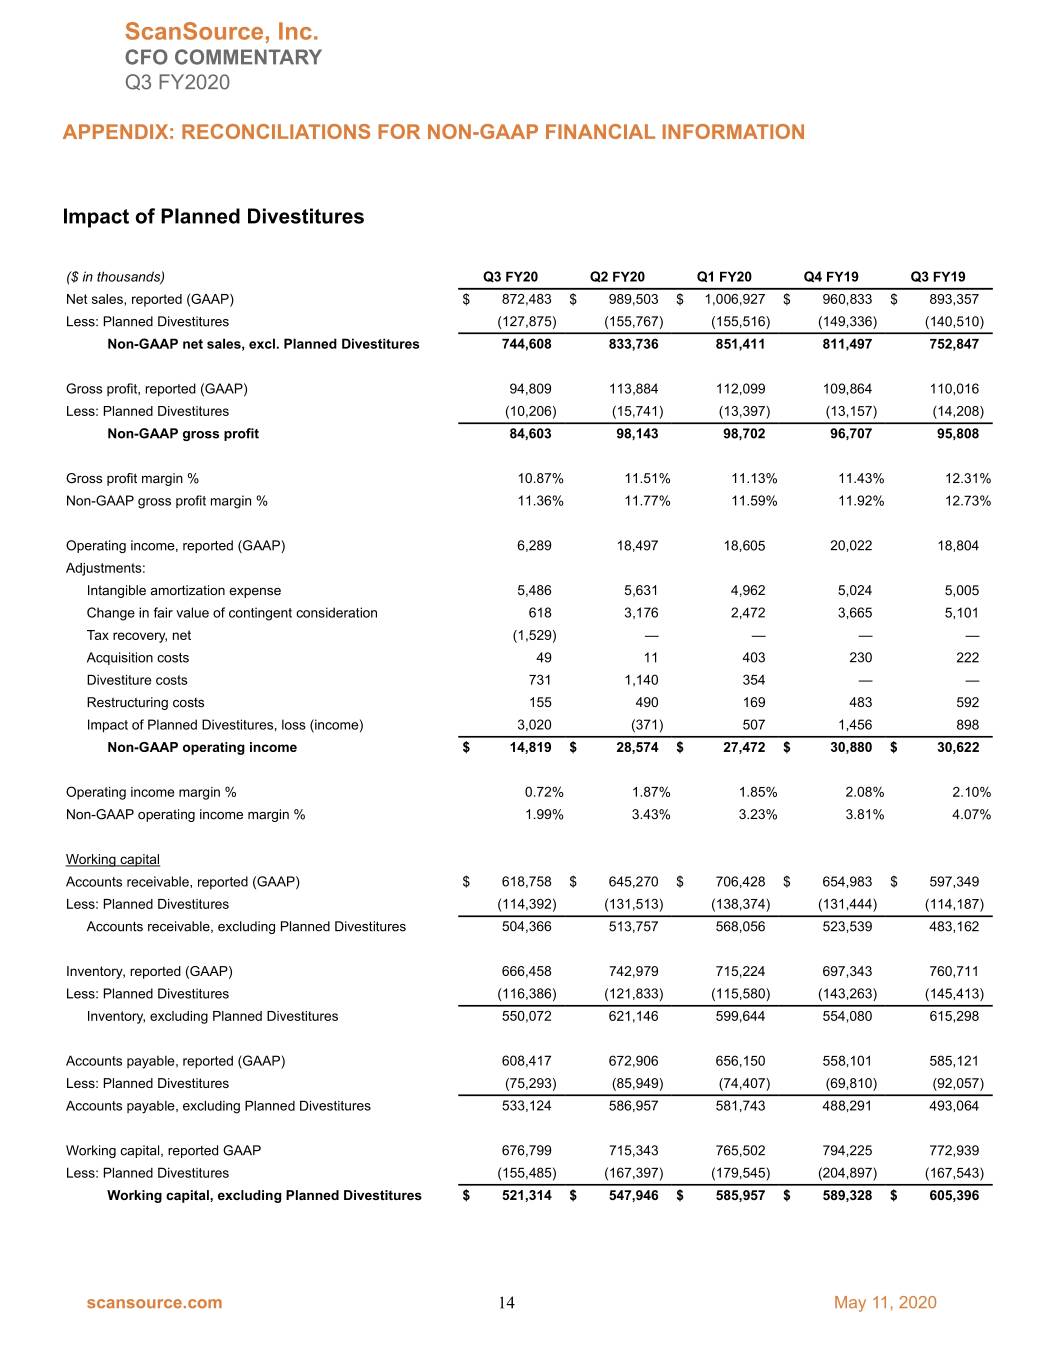
ScanSource, Inc. CFO COMMENTARY Q3 FY2020 APPENDIX: RECONCILIATIONS FOR NON-GAAP FINANCIAL INFORMATION Impact of Planned Divestitures ($ in thousands) Q3 FY20 Q2 FY20 Q1 FY20 Q4 FY19 Q3 FY19 Net sales, reported (GAAP) $ 872,483 $ 989,503 $ 1,006,927 $ 960,833 $ 893,357 Less: Planned Divestitures (127,875) (155,767) (155,516) (149,336) (140,510) Non-GAAP net sales, excl. Planned Divestitures 744,608 833,736 851,411 811,497 752,847 Gross profit, reported (GAAP) 94,809 113,884 112,099 109,864 110,016 Less: Planned Divestitures (10,206) (15,741) (13,397) (13,157) (14,208) Non-GAAP gross profit 84,603 98,143 98,702 96,707 95,808 Gross profit margin % 10.87% 11.51% 11.13% 11.43% 12.31% Non-GAAP gross profit margin % 11.36% 11.77% 11.59% 11.92% 12.73% Operating income, reported (GAAP) 6,289 18,497 18,605 20,022 18,804 Adjustments: Intangible amortization expense 5,486 5,631 4,962 5,024 5,005 Change in fair value of contingent consideration 618 3,176 2,472 3,665 5,101 Tax recovery, net (1,529) — — — — Acquisition costs 49 11 403 230 222 Divestiture costs 731 1,140 354 — — Restructuring costs 155 490 169 483 592 Impact of Planned Divestitures, loss (income) 3,020 (371) 507 1,456 898 Non-GAAP operating income $ 14,819 $ 28,574 $ 27,472 $ 30,880 $ 30,622 Operating income margin % 0.72% 1.87% 1.85% 2.08% 2.10% Non-GAAP operating income margin % 1.99% 3.43% 3.23% 3.81% 4.07% Working capital Accounts receivable, reported (GAAP) $ 618,758 $ 645,270 $ 706,428 $ 654,983 $ 597,349 Less: Planned Divestitures (114,392) (131,513) (138,374) (131,444) (114,187) Accounts receivable, excluding Planned Divestitures 504,366 513,757 568,056 523,539 483,162 Inventory, reported (GAAP) 666,458 742,979 715,224 697,343 760,711 Less: Planned Divestitures (116,386) (121,833) (115,580) (143,263) (145,413) Inventory, excluding Planned Divestitures 550,072 621,146 599,644 554,080 615,298 Accounts payable, reported (GAAP) 608,417 672,906 656,150 558,101 585,121 Less: Planned Divestitures (75,293) (85,949) (74,407) (69,810) (92,057) Accounts payable, excluding Planned Divestitures 533,124 586,957 581,743 488,291 493,064 Working capital, reported GAAP 676,799 715,343 765,502 794,225 772,939 Less: Planned Divestitures (155,485) (167,397) (179,545) (204,897) (167,543) Working capital, excluding Planned Divestitures $ 521,314 $ 547,946 $ 585,957 $ 589,328 $ 605,396 scansource.com 14 May 11, 2020