Operator
Ladies and gentlemen, welcome to the S&T Bancorp fourth quarter and full year 2025 conference After the management remarks, there will be a question and answer session. If you'd like to ask a question at that time, please press star then the number one on your telephone keypad to raise your hand and enter the queue. Now I'd like to turn the call over to Chief Financial Officer Mark Kochfer. Please go ahead.
Mark Kochfer Thank you and good afternoon everyone and thank you for participating in today's earnings call. Before beginning the presentation, I want to take time to refer you to our statement about forward-looking statements and risk factors. This statement provides the cautionary language required by the Securities Exchange Commission for forward-looking statements that may be included in this presentation. A copy of the fourth quarter full year 2025 earnings release as well as this earnings supplement slide deck can be obtained by clicking on the materials button in the lower right section of your screen. This will open up a panel on the right where you can download these items. You can also obtain a copy of these materials by visiting our Investor Relations website at stbankcorp.com. With me today are Chris McComish, S&T's CEO, and Damon Tillich, S&T's president. I would now like to turn the program over to Chris.
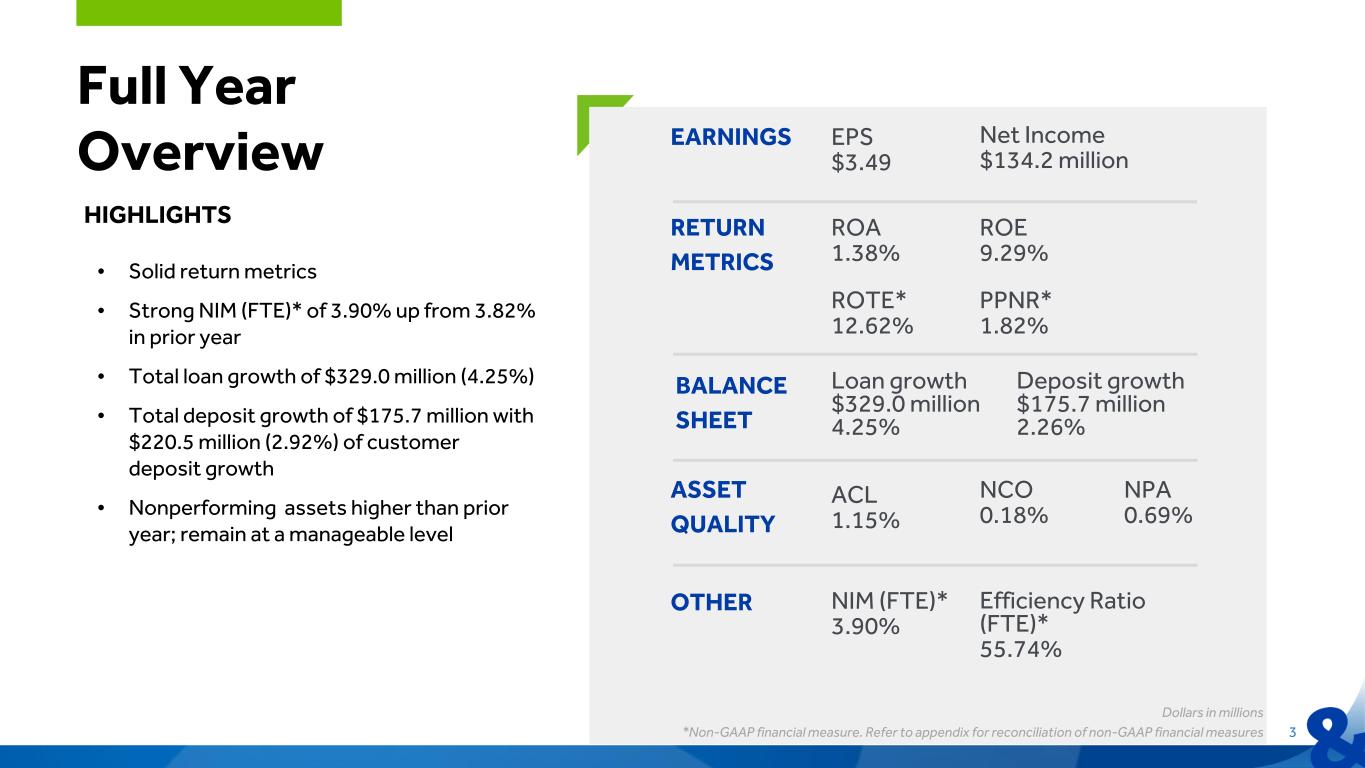
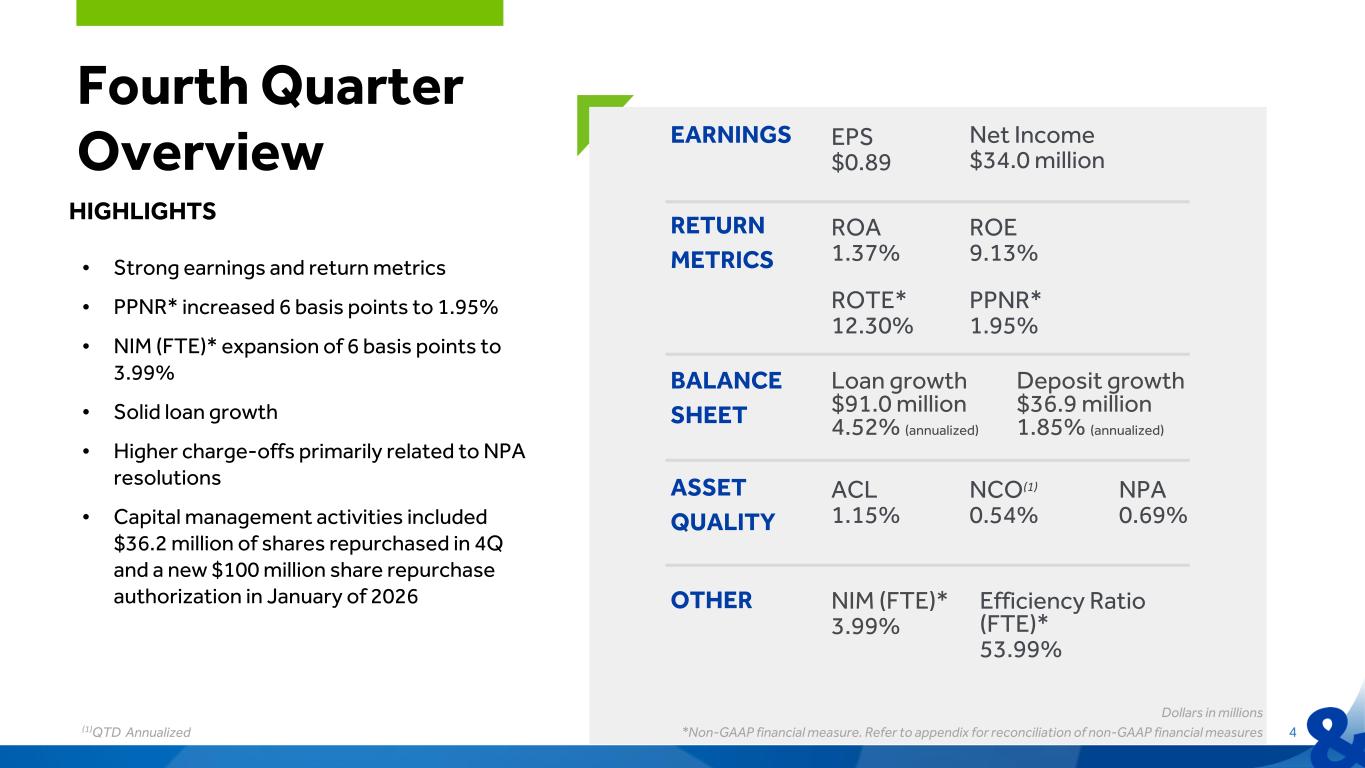
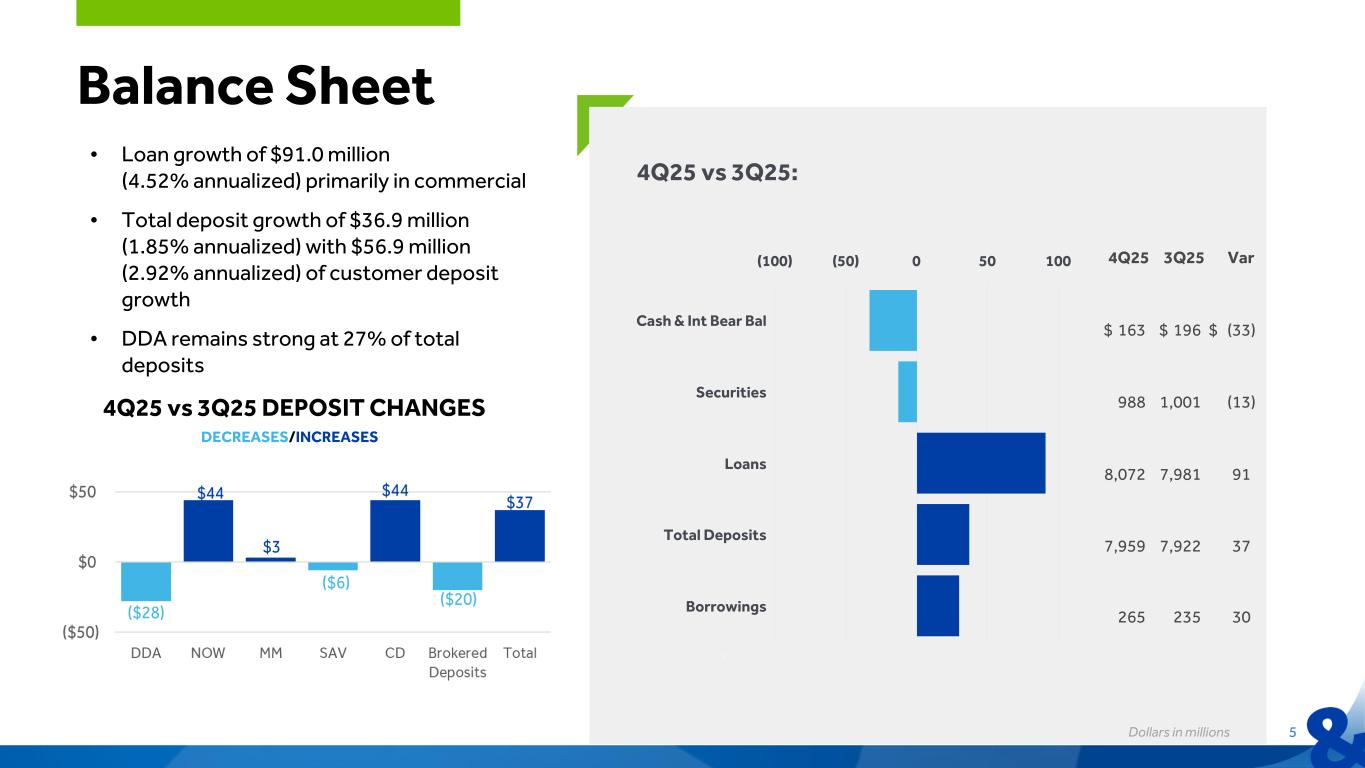
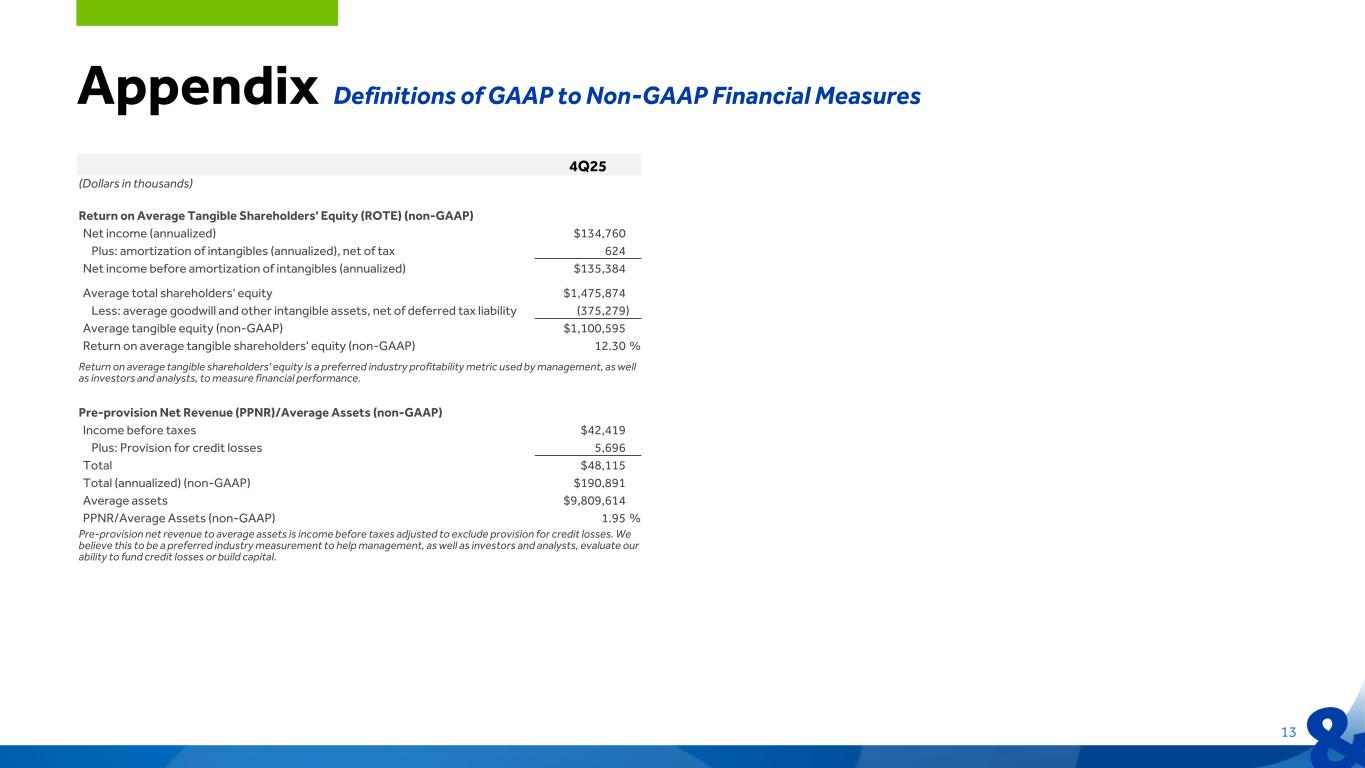
Chris? Great. Thank you, Mark, and good afternoon, everybody. Thank you for joining us on the call. I'm going to begin my comments on page three. We certainly appreciate the analysts being here, and we look forward to your your questions before we uh discuss q4 specifically i'd like to take a few minutes to discuss and wrap up 2025 overall we move forward through 2025 very well producing strong returns building record levels of capital with increased momentum while receiving external recognition from both for both our financial performance as well as our high levels of employee engagement. For the year, we produced $3.49 a share, just under $135 million of net income with a 3.9% net interest margin. Loan growth was over 4% and customer deposit growth was just under 3% while expenses were well controlled. Asset quality for the full year was well managed at 18 basis points of net charge costs while the ACL declined 16 basis points year year reflecting three straight years of overall improved asset quality you know none of these results would have happened without the commitment of almost 1300 s t employees who are some of the most engaged and talented employees in our industry for those that are on the listening on the call we thank you for your hard work and your engagement where these numbers and results are yours you should be very proud turning to the quarter our 34 million dollars net income equates to 89 cents per share down slightly from q3 our return metrics were again strong highlighted by a 1.37 roa additionally our nim rose to 3.99 of six basis points on a late quarter basis which is the best performance we've seen since q2 of 2023 as is our 1.95 ppnr up six basis points quarter over quarter. Asset quality for the quarter was mixed due to higher charge-offs associated with some NPA resolutions, while the ACL declined eight basis points due to specific reserve releases and an overall reduction in CNC assets. Dave will provide more details here in a few minutes. Moving to page four, loan growth was just under $100 million for the quarter at 4.5 percent led by commercial banking with both growth in our cni portfolio as well as our cre line of business customer deposit growth was was just under 60 million dollars at 2.9 percent and the quality of our deposit mix remains very strong with ddas representing 27 percent of total balances before i turn it over to dave and talk to provide more details on the balance sheet and credit i wanted to bring to your attention the other announcement that we made this morning announcing our new 100 million dollar share repurchase authorization that was approved by our board of directors yesterday given the robust capital levels of the company we are fortunate to be able to have an authorization of this size available to us our capital levels give us the ability to repurchase shares should the market warrant warrant it while not in any way impeding our ability to consider other opportunities, including M&A. With that, I'll turn it over to Dave, and I look forward to your questions.
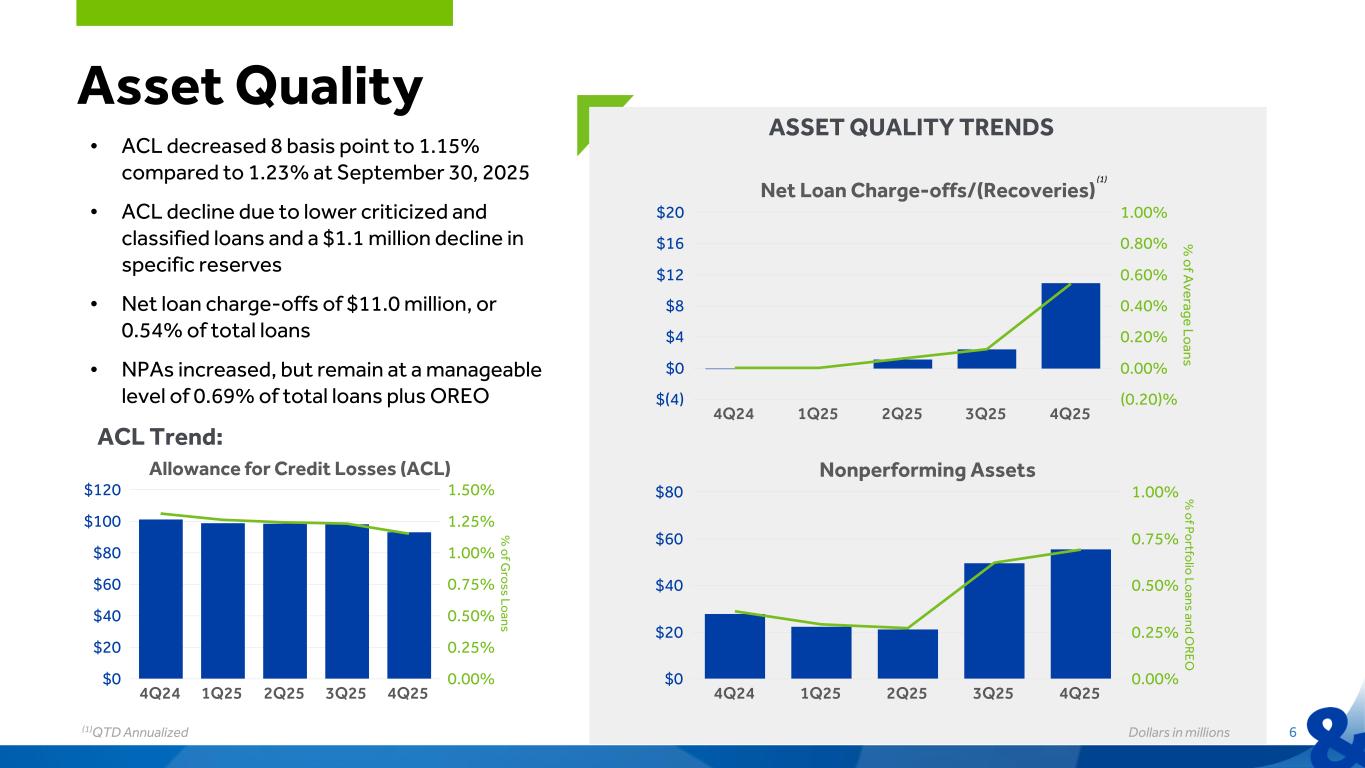
Well, thank you, Chris. And as Chris mentioned, the loan growth of the quarter was driven primarily by commercial, with C&I and CRE balances growing by $53 million and $34 million, respectively. C&I growth was a result of an increase in revolving balances and new customer acquisition. Q4 was a particularly active quarter for our asset-based lending group who onboarded several new names. Categories of C&I growth include retail, utilities, and service. CRE growth was entirely driven by construction funding in the quarter. We continue to see demand for construction facilities for multifamily, warehouse, storage, and industrial asset classes. These loans typically fund over 12 to 18 months, move to our permanent CRE portfolio, and frequently move on to non-recourse funding sources. Supporting growth in the coming quarters, our unused commercial construction commitments increased by $78 million quarter over quarter. As a result of the strong funding in Q4, our pipelines reduced slightly heading into Q1, and our focus is on rebuilding. This activity is consistent with our historical experiences. Regarding loan growth guidance for 2026, we believe that mid-single-digit growth is achievable while maintaining our asset quality profile. We expect loan growth to primarily come from C&I, where we've seen improved activity from investments we've made in team leadership and banker talent, along with CRE, where we've demonstrated a longstanding ability to develop deep customer relationships in support of growth. we are also forecasting continued consumer home equity growth that is focused focused on complementing our deposit franchise customers um if i can now direct your attention to slide six of the presentation which provides additional details on our asset quality performance in q4 starting with the allowance for credit losses we recognized a reduction relative to gross loans from 1.23 to 1.15 percent quarter over quarter primarily primarily the result of two factors first a reduction in specific reserves related to problem loan resolution second a reduction in criticized and classified loans of 30 million dollars or 13 percent in q4 this reduction in criticizing classified loans at year-end 2025 represents our third consecutive year of successfully reducing loans in these categories. And over that period, the three-year period, we've reduced total C&C loans by 50%. It is also a reflection of our focus on asset quality as a key driver of financial performance, robust portfolio management, and an aggressive approach to problem loan resolution. As a result of aggressively addressing problem loans, we were able to fully resolve loans selling 29 million dollars during the quarter. These resolutions contributed to increased charges of 11 million dollars or 54 basis points annualized in the quarter. In addition, we recognize new NPL formations that cause overall NPAs to increase by 6 million dollars from 62 to 69 basis points. We have appropriately reserved for these loans and have resolution strategies in place. Although an increase relative to Q3 and the first half of 2025, this level of NPLs remains at a very manageable level. Looking forward, we anticipate full-year 2026 asset quality results to perform similarly to what we saw in 2025, with a focus on reducing NPLs and maintaining the lower level of C&C loans that I discussed earlier in my comments. I'll now turn the call over to Mark. Hey, thanks, Dave.
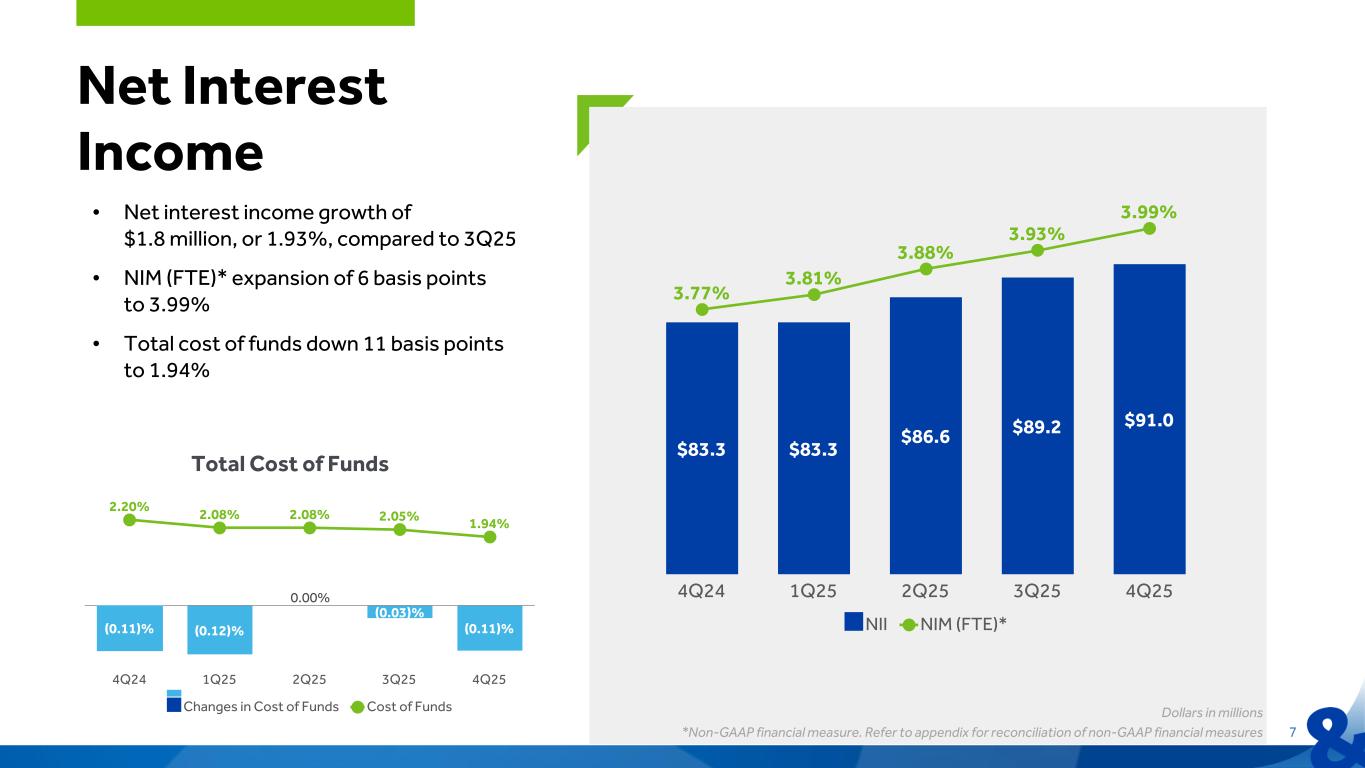
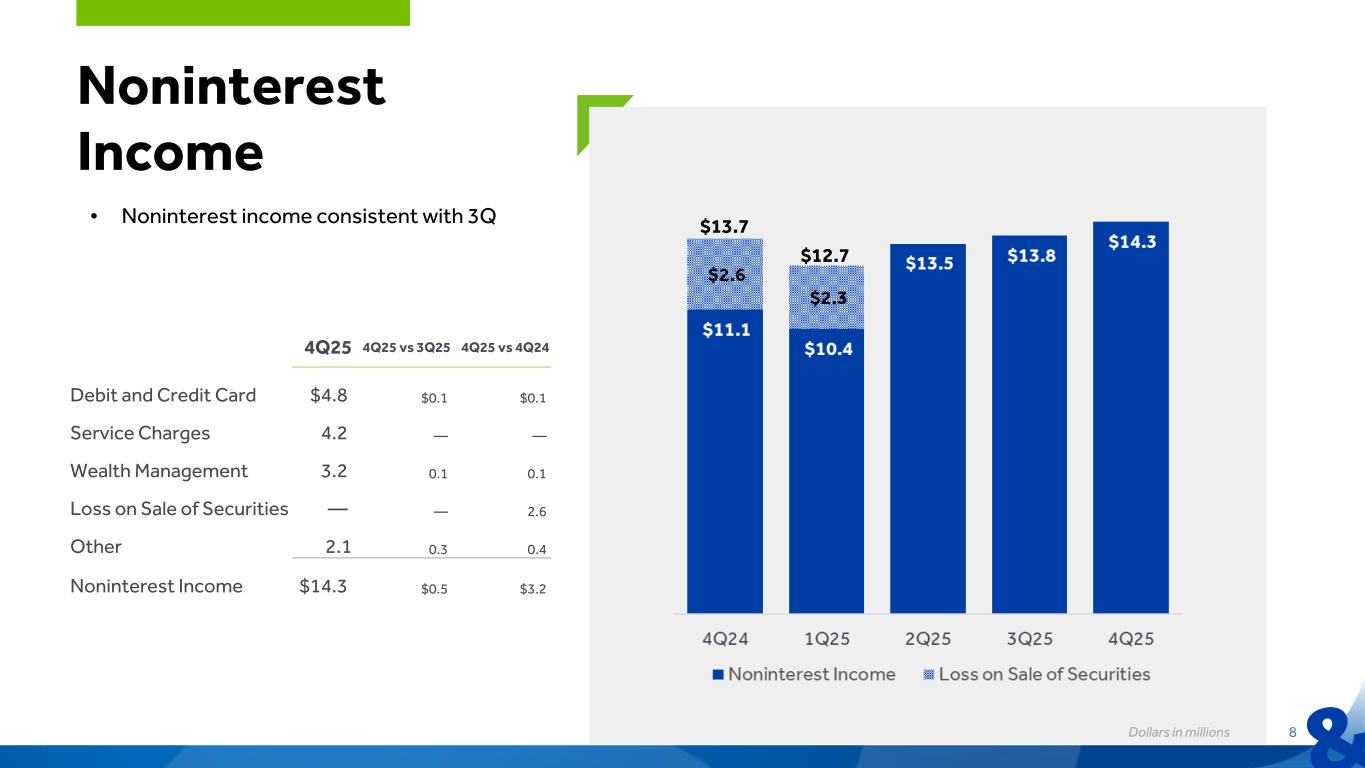
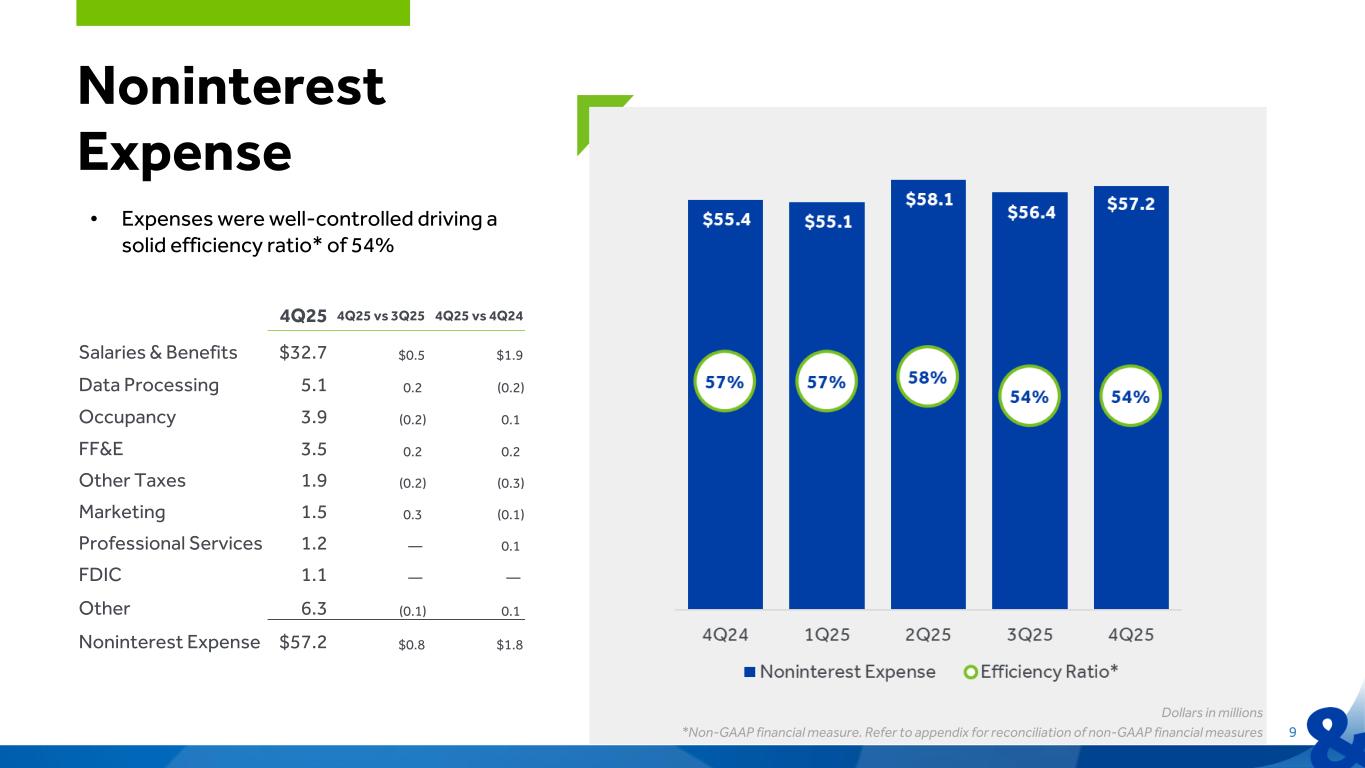
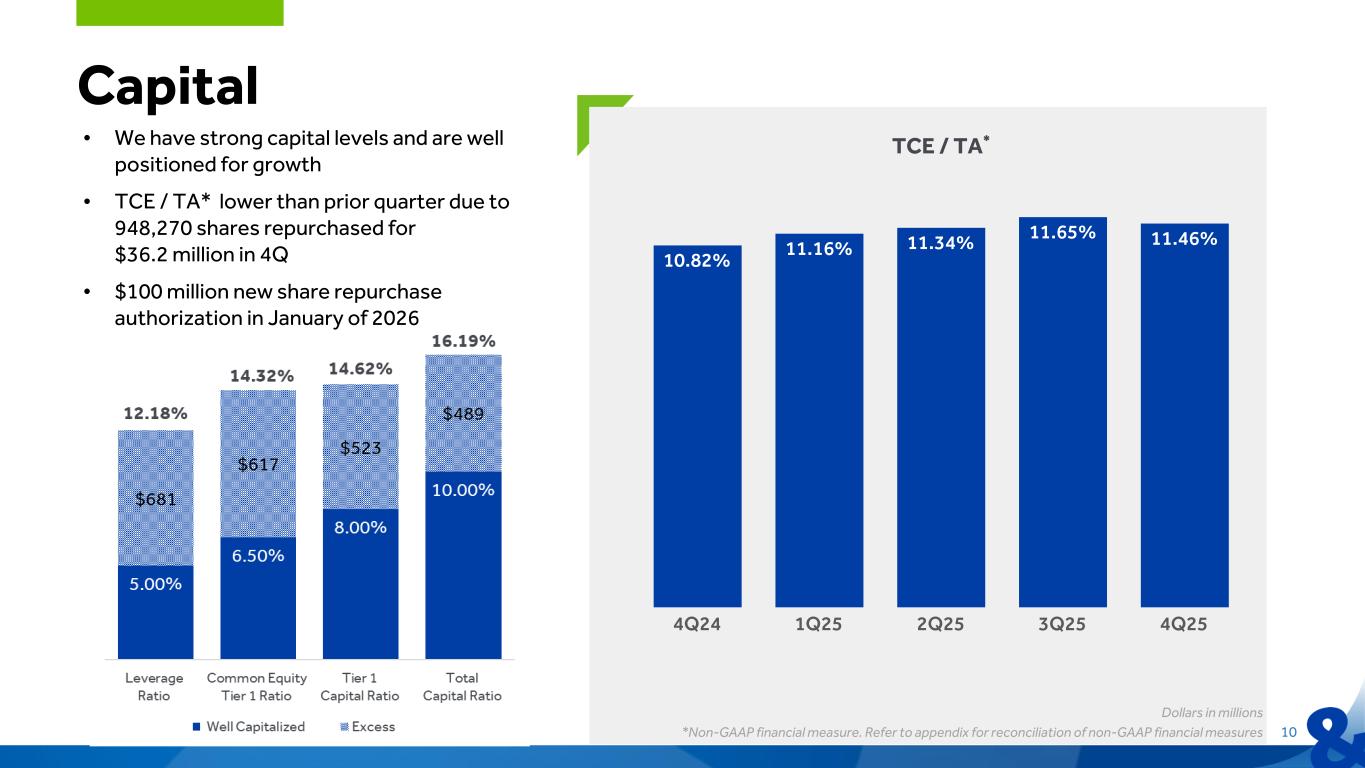
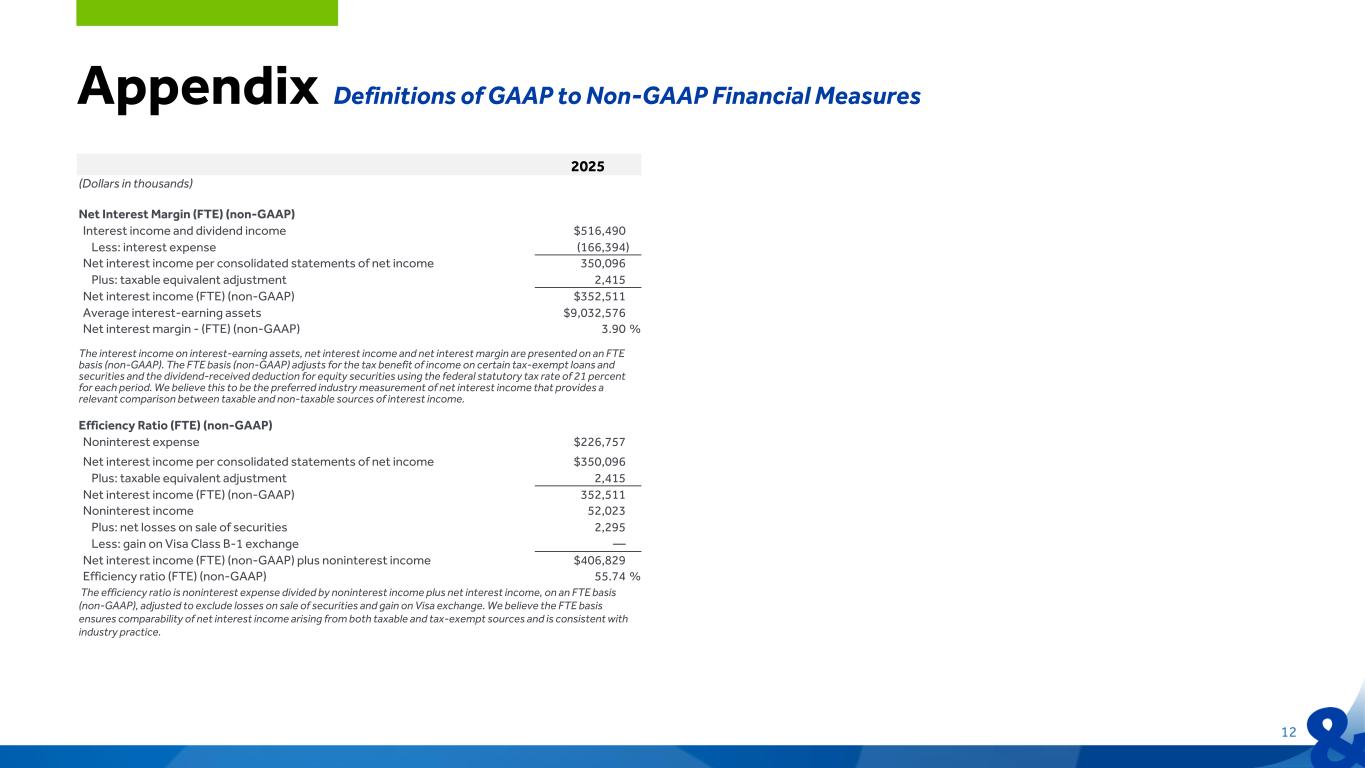
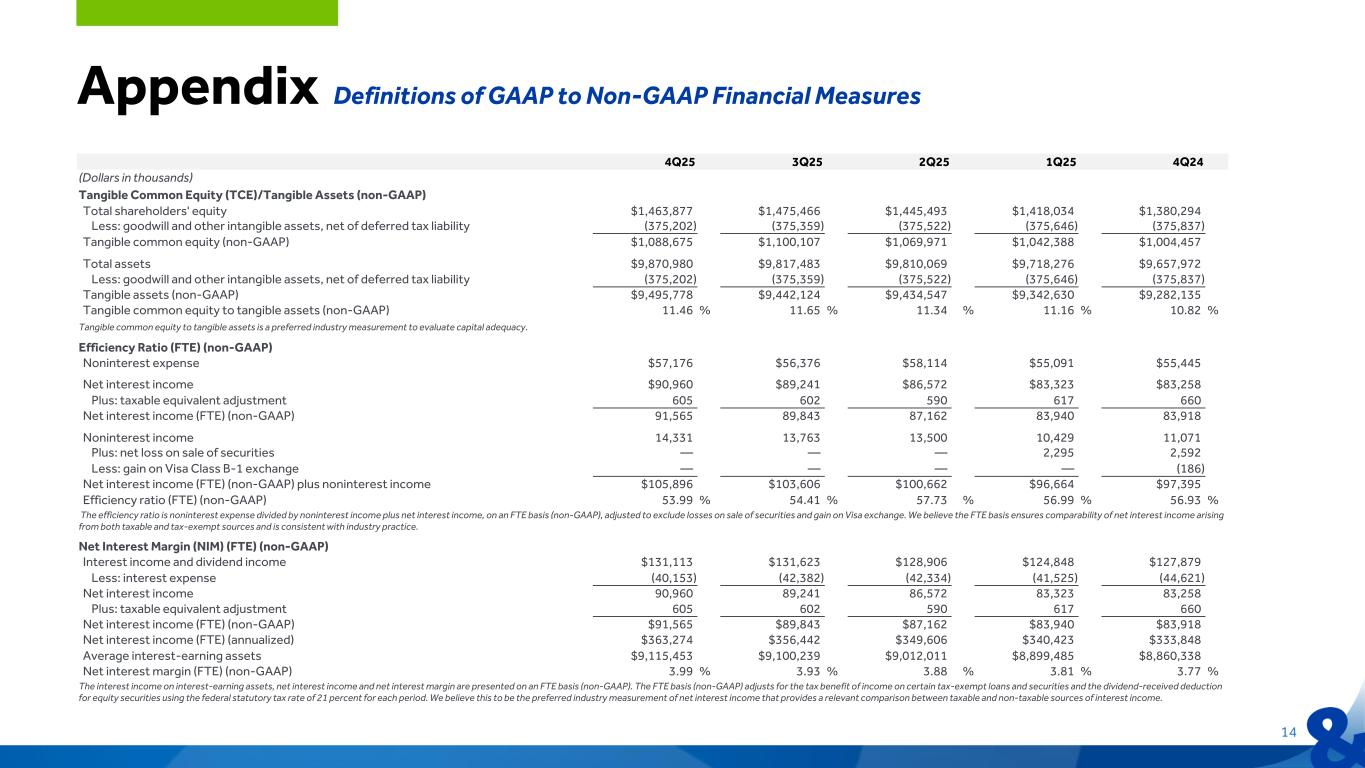
Fourth quarter net interest income improved by $1.8 million, or just under 2%, compared to the third quarter. That was mostly driven by the margin expansion of six basis points. The margin improvement came from an 11 basis point decrease in the cost of funds. That was offset by a modest decrease in earning asset yields of about three basis points. We have been able to successfully reduce exception rates and regular rates on non-maturity deposits as the Fed has reduced short-term rates. CD rates have been somewhat more sticky but are still coming down. We continue to expect that our more neutral interest rate risk position and pricing discipline will mitigate any rates down impact, both what has happened and what is expected in 2026. Tailwinds from our maturing received fixed swap portfolio, security and fixed loan repricing, and some limited CD repricing all contribute to these tailwinds. As we look into the 2026, we expect relative stability in the net interest margin in the mid to high 3.9% range, with net interest income growth coming from earning asset growth. Next slide, non-interest income increased by a half a million in fourth quarter with small improvements in our major customer fee categories. The increase in other is timing related, primarily to some letter of credit activity. Our expectations for fees in 2026 remains at approximately $13 to $14 million per quarter. Expenses were in line in Q4, up by about $800,000 compared to the third quarter. Largest variance was in salaries and benefits. Within that, medical costs were higher and also salaries due to some hirings. Marketing was impacted by the timing of some promotions. We expect to manage our 2026 knowledge expense year-over-year to around 3%, which implies a quarterly run rate of approximately $58 million. Lastly on capital, the TCE ratio decreased by 29 basis points this quarter due to the share repurchases completed in the fourth quarter. We were purchased just over 948,000 shares at an average price of $38.20 for a total of $36.2 million. Our regulatory ratios continue to be very strong with significant excess capital. Even if we complete the $100 million repurchase program announced today, we are comfortable that we will have more than sufficient capital to position as well, both for the environment and to enable us to take advantage of inorganic or organic growth opportunities. Thanks very much. At this time, I'd like to turn the call back over to the operator to provide instructions for asking questions.
Operator
The floor is now open for questions. If you have any questions, please press star then the number one on your telephone keypad to raise your hand and enter the queue. If you'd like to withdraw your question at any time, please press star one again. Please hold while we poll for questions. Your first question comes from the line of Justin Crowley with Piper Sandler. Your line is open.
Hey, good afternoon, everyone. I just want to start on loan growth for the quarter, you know, didn't really deviate from how you folks framed expectations previously, but kind of bigger picture. Curious, is there anything specific that you'd point to that's maybe holding you back from that ramping to say, you know, amid a high single digit pace, something more along those lines, maybe once discussed, you know, is that a function of the demand side of the equation or is there a desired pricing component to that? What, if anything, would you speak to there?
Justin, it's Dave Ancel. I think that it's not necessarily on the demand side. It's making sure that the asset quality of the onboarded new customers meet our criteria to maintain the lower levels of C&Cs. Some of it is we're adding to the staff, we're adding bankers. We plan on doing that throughout the year. So making sure that we have adequate coverage in in all of our markets and all of our segments. There were certainly bright spots in Q4 as I think about the CNI growth and as I mentioned the ABL activity that's relatively new so there are some tailwinds to help us grow and hopefully get to a higher rate of growth in terms of our loan.
Just as Chris the other thing I would add is we do think you know about the overall state the economy and things are picking up and positive but we you know we don't want to be out there predicting something that's dramatically higher than what you see from a from gdp growth rate standpoint or what we believe organically is available in the markets that we serve they've touched on it too um you know our desires to continue to grow teams uh and and bankers in the field we you know the our our leadership in the field knows that there are no constraints around around adding more more close to the to the team and that we'll continue to do that but we're trying to get your best guess based upon all best estimate based upon all of those factors
okay and you mentioned in terms of or both of you mentioned sort of the hiring efforts and you know maybe it's a mix but um you know how focused is that on on the cmi side of things is that kind of the top priority in terms of looking to add new talent yes i i would call that our number one priority in terms of moving ourselves forward and accelerating growth in the commercial space.
And it's not just C&I, Justin. It's both CRE and C&I. We're doing an awful lot of work in our business banking space as well to focus those teams on deposit gathering and developing new relationships. So it's across the board. In the fight for talent, we think we have a really good story to tell and we'll be able to acquire and add to the teams in order to support.
Okay that's helpful and I guess pivoting you know just one on the margin you know it's pleasantly surprised with the expansion you saw this quarter and look like some nice moves lower and deposit costs you know I think the last update you gave you're referring to some of the competitive pressures on the funding side that had been maybe a little stronger than initially expected so here's how that has been trending as we now move through the first quarter and you know i guess how that sort of informs the the mid to high three nine um guide on on margin here looking forward yeah i think with the as the feds moved uh lower you know we've seen the competitors a little bit slower than we anticipated but bring bring rates
down so we're working within that framework and are pretty confident that we can uh we can hold these levels on the NIM.
Justin, if you think about the quarter itself and when rates dropped early in Q4, I would say the competitive intensity around rates was higher than as we moved through Q4 and subsequent drop in rates. The market rates kind of went with it a little bit faster.
I think it's a little bit harder for people to cross, for example, four on CDs. you know that dip below four on uh cd that short cd rate took a little bit longer uh than we had thought would happen but now that we're okay things things seem to be moving a little bit better okay um and then maybe just uh m a um you know i know we've talked a lot about it but just curious for chris maybe an update there uh you know where things stand just sort of the the pace of conversations you're having, if there's any, or has been any shift in preference or bias as to what geography or geographies, you know, you might be leaning toward or where you're seeing the most active discussions?
No, nothing significant, Justin, that we've talked about over the past couple of months. We are, you know, active dialogue across the geographies, and we continue to make it a priority for us um but we also want to do you know do the things that we have we have most direct control over and those are the things that we're doing to execute every day so still lots of interest a lot of conversations um you know the reiterating is something i said earlier this um stock repurchase authorization that we have you know we're very fortunate to be able to you know kind of walk and chew gum at the same time that we can uh you know potentially if the market avails itself um to to the repurchase authorization that's great at the same time it doesn't inhibit
Operator
inhibit us at all from an m a standpoint okay perfect um great i appreciate everything okay thank you thank you your next question comes from the line of daniel tamayo with raymond james your line is open.
Thank you. Good afternoon. Yeah. Hey guys. Maybe we start on the, on the, on the loan growth side, but as it relates to the funding, you know, mid single digits, not guiding to better than that, but sounds like it could be a good year for loan growth, loan deposit ratio now over 100%, I believe. So just curious if you expect to be able to kind of fully fund that loan growth with deposits, or if you're going to be using alternative sources, just outlook on the deposit growth, if you will.
Yeah, sure. What we're forecasting is our ability to fund that internally through deposit growth. We saw a really strong Q4 in terms of customer deposit growth, particularly in the consumer space. It was offset a little bit by some activity with some large commercial depositors that we consider more anomalous than anything. So I think that with the focus and the investments that we've made in technology, people, campaigning, we're really focused in on driving core deposit growth and we think we can achieve a balanced loan and deposit growth trajectory.
Danny, it's Chris. If we were able to show you the team's incentive plan, you would see very clearly where the importance of deposit growth and funding our asset growth through continued expansion and customer relationships. So we know in order to maximize profitable growth, The funding needs to come from the continued growth in our already strong core deposit franchise, and that's a key focus for all of us in all lines of business.
And on the cost side, I suppose, I mean, this is kind of related to that, as well as your commentary earlier about repricing the current deposits. What do you have in terms of implied or assumed deposit betas in the margin guidance?
Well, I mean, we have maybe in our plans, we have a couple more cuts sort of built in. um i mean it's complicated because there's you know on the uh on the asset side things are moving the other way but on the deposit side um the betas are probably in the in the 30 range overall all right great um and then i guess one last one for for you chris um you talked about the m&a and you you obviously have this buyback announcement um from from a capital perspective but you know you're obviously just under 10 billion but you've been able to kind of flatten
out the the asset growth of the last few quarters um you know i'm i'm modeling in i think you talked about last quarter likely crossing 10 billion next year but is there a way or a desire uh to potentially keep that under 10 billion through through next year and and push the uh the durbin hit out of here um yeah at this point danny we're not um thinking that way we um believe that well you know our durban hit is relatively small at six to seven million dollars um there's certainly um some things that you could do you know mark and the team that could do uh but our our focus right now is to continue to grow and show some reasonable growth um you know if we end up with you know five percent loan growth for the year six percent you know in that range you're talking about 500 million dollars worth of loan growth and that would put us kind of meaningfully over the 10 billion dollars and and then we have you know the good part of 2027 to work through through that so um our our focus is to uh is to continue to execute and recognize that you know that's a potential headwind, but it's also something that we're going to, we can also celebrate because it's been talked about for too long to stay around that level.
Understood and agreed. We're all looking forward to not talking about that anymore.
Think about it, Danny, the call would be 10 minutes shorter.
I'll scratch that off my question for you.
All right, guys, that's all I have thanks a lot thank you your next question comes from the line of kelly mota with kbw the line is open hi this is charlie on for kelly thanks for taking my questions guys just to hit on asset quality quickly can you provide more color on the specific resolution of the mpas that drove kind of the the 11 million in charge off and yeah whether that relates to the the two cre and one cni credit you guys identified last quarter just Yeah, they're directly related to those previously identified and talked about credits.
We were able to bring those to resolution, recognize the charge, reduce specific reserves as a result. We also had, as I mentioned, formation in the quarter that were both C&I and CRE, and we appropriately reserved for those. and we have resolution strategies in place for those credits as well. And I want to reemphasize the importance of the progress we've made in terms of the criticizing classified reductions over the last three years. So if you think about, we talk a lot about loan pipeline and where's growth going, that CNC bucket is the pipeline for future charges and NPLs. So having reduced that by 50% over the last three years reduces the amount of problem loans coming into the funnel that could potentially lead to further deterioration or charges within our book. So that's why we feel good about being able to say, look, asset quality in 2026 is not going to perform any worse than 2025. And our focus on reducing NDAs and the feeder pipeline of C&Cs has taken hold and is really our focus.
That's helpful. Thank you. And then turning to expenses, it seems like growth is going to be expected to be strong. And you guys saw 4% expense growth this year. Is that kind of a fair run rate in the years ahead? I know you mentioned adding talent in the C&I and CRE verticals and made investments already, just if you could speak to initiatives ahead. And maybe secondly, if there's room on the efficiency ratio or is like the mid-50s a good sustainable place to operate from? Thank you.
Sure. I'll start at the last one. I think mid-50s is a place to look for the efficiency ratio to be. On the expense side, we don't think we have a lot of infrastructure built. We've invested a lot over the last few years on the staffing side for a lot of our support areas. So, the FTE growth that we expect in this year and really a couple years after that will be mostly production related. So, that limits the overall increase on the salary benefit side. So, we're working with about a 3% year-over-year expense increase.
So, you know, we were pretty confident that we could hold to that going into this year. that's great thank you i'll step back i take my questions thank you charlie your next question comes from the line of matthew breeze with stevens the line is open hey good afternoon a few more questions for me um you know first loan yields this quarter held up a bit better than what i was expecting and so i'm curious what the roll-on yields are versus roll-off today and maybe, you know, what are your, what are expectations for, you know, back book repricing in 2026?
We're still getting a little bit of positive on the fixed side, you know, and we're also getting benefit from this received swap book that we have, so that's been helping a lot to support the lack of declines on the asset side. Although that tailwind, if you will, you know, starts to to diminish as we get farther into into the into the year you know so by the end of the fourth quarter a lot of that will be will be gone the the replacement yields are not all that different on the floating side i mean they're just kind of coming off and going on but we are still picking up you know maybe maybe 25 basis points on uh other more fixed uh fixed products yet and do have you know the maturities for fixed asset repricing or fixed loan repricing in 26? The dollar amounts?
But we we have what about a billion or so that we have to replace every year. Some of that will be our prepayments and not uh and also amortizing uh loans so kind of a mix of that.
Got it okay um and then do you have the updated cost to funds either at cost deposits either at year end or more recently. One of the things I was looking at, you know, CD costs just look a little elevated here at 386. I'm assuming there's quite a bit of downside as we think about, you know, rate cuts, additional rate cuts, and the maturity schedule there, what CD costs could be a year from now.
Yeah, so they have like a monthly margin, you know from from december they get just a little bit closer and for that for that period our cds were about at a 382 and overall deposits um were about a 250. uh 250 for interest bearing yes yeah that doesn't include yeah okay okay thank you um i guess the last one for me a lot of the questions have been exhausted, but for a community bank, what are you doing or what are you using for AI tools at this point?
How are you using them? And as we look ahead, whether it's a year or five years, how do you think those tools might impact your P&L?
Yeah. Obviously, in some of these areas, things are early days, but in other areas, it's work that is really important to our company. I I think about in the area of BSA AML compliance and some of the fraud protection that occurs in our company every day relative to primarily to our deposit book and, you know, anomalies that are happening within commercial and consumer deposit relationships. So all of that information that's coming to our financial intelligence group is AI driven. And alerts are created, and it has been a big factor in our ability to find potential fraud and make sure that we're stopping things before they actually happen. And it's millions of dollars of savings that we see on a quarterly and annual basis around potential things, all coming from what you would consider some sort of AI alert. We're also thinking about generally regulatory compliance, consumer compliance, and the ability to use AI there. Within our commercial bank, the underwriting and portfolio management infrastructure that we have has increasing levels of AI support to do things like auto-spreading of financial statements. you know support will continue to mature will be support around underwriting for originations as well as portfolio management we're also using it to enhance our communication you know just this this month some of the work that we're doing in communicating to our board we're running through some ai tools to help us communicate more effectively so it's a lot of kind of some experimentation obviously there's a big level of risk management associated with it this is our information that we have to protect and we have to make sure that it's not you know not available elsewhere um so we're working on that um you know we've got a working group that thinks about these things but um you know it'll continue to evolve and it is a priority for us um you know we talked about um expense growth in the year and you know the commitment that we have is you know all fte growth people expense growth will come in uh customer facing and revenue producing roles we believe that you know back office supporting those sorts of things should be able to be held
flat and that that's kind of a forcing mechanism to make sure that we're we're looking at opportunities uh that you know from a technology standpoint how far away are we from you know the you said millions of savings, you know, how far away are we from that actually impacting guidance and your outlook?
Well, a long way. You know, again, it's still early days. And when I'm talking about millions of savings, these are, you know, broad alerts that are protecting, you know, protecting our customers from potential losses that could have occurred otherwise. So as it relates to significant increases in operating expenses, you know, we've got a ways to go, I think.
Yeah, I'll leave it there. Thank you very much for all that. Appreciate it.
Operator
Your next question comes from the line of Dave Bishop with Hofty Group. The line is open.
Yeah, thank you. Good afternoon. Hey, quick question for you. Most of my questions have been asked and answered. But in terms of origination, loan production this quarter versus payoffs, just curious maybe how those compared the fourth quarter to the second and third quarters.
Yeah, fourth quarter was robust. Originations were strong in Q4. We did have elevated payoffs in Q4 that talked about the, you know, kind of the construction cycle. A lot of those loans were refinanced out of the bank in Q4. You know, it led to some pipeline burn that we're actively rebuilding now and would hope to, you know, regain our momentum. And as we add additional bankers, incrementally add to what our experience has been over the past year or two. So we, in total, need to originate somewhere around a billion and a half to a billion seven in total new loans each year to drive a, you know, five to seven percent net loan growth number.
Got it. And in terms of the targeted banker ads this year, any geographies burning a hole in your pocket more than others that you budget out this year? Thanks.
Yeah, we're kind of agnostic relative to the geography. We know we need to add to the C&I teams. CRE, we're pretty well healed in terms of the legacy markets. But if we can find an additional banker who can help us grow, we're going to hire them. As Chris mentioned, the focus of the leads of both the commercial real estate and CNI groups, our AVL group, is to add additional bankers in order to further enhance customer acquisition. And hopefully that translates into additional loan and more specifically deposit growth. So it might be treasury management officers. It could be TRE bankers. It could be CNI bankers. We're looking to grow all facets of our commercial teams and the products that they offer.
Great. Thank you for that color.
Operator
Your next question comes from the line of Daniel Karthanas with Janie Montgomery Scott. Your line is open.
Hey, afternoon, guys. Most of my questions have been asked and answered, but maybe could you provide a little bit of color as to competitive factors on the on the deposit side given your goal to fund loan growth with uh with deposits are the markets that you operate are they are they uh behaving rationally right now or how would you kind of describe those yeah we talked a little bit about that earlier i would say that you know early in q4 as rates started coming down and that four percent um number was out there when you're talking about the cd book there was some pressure um from from competitors to what i would call keep you know hold on what i
have um and and offer you know an elevated rate um we were a little surprised that folks kind of reacted as slowly as they did and i think particularly in the month of month of october maybe even into early November. But second half of the quarter, things became more rational. We don't aggressively post and advertise aggressive rates in the market, generally speaking. We operate with what I would call a very responsive exception pricing process that kind of combines the ability for our team leaders in the field to make decisions with the proper level of oversight between Mark's teams and Dave's teams. And that has worked really well for us, both in the ability to attract new deposits as well as to retain things from a competitive standpoint. So we felt optimistic about our ability to respond, the information that we're getting uh to to make decisions around and uh and that's a big reason why we believe we should be growing deposits at least at the rate that we're great uh that's all i have for right now i'll step back okay thank you dan thank you and with no further questions in queue i would like to turn the call over to chief executive officer chris mccomish for closing remarks well listen thanks uh all for being on the call with us and uh we appreciate your your engagement and guidance be safe out there there's a lot of nasty weather coming in various parts of the midwest in particular uh but we um we look forward to a successful 2026 we're certainly very proud of 2025 and we look forward to moving forward so have a great rest of the day this concludes today's conference call, you may now disconnect.