
TFIN 8-K
Triumph Financial, Inc. (TFIN)
8-K
2025-07-16
For: 2025-07-16
View Original
Added on
April 10, 2026
UNITED STATES
SECURITIES AND EXCHANGE COMMISSION
WASHINGTON, D.C. 20549
FORM 8-K
CURRENT REPORT
PURSUANT TO SECTION 13 OR 15(D)
OF THE SECURITIES EXCHANGE ACT OF 1934
Date of Report (Date of earliest event reported): July 16, 2025
(Exact name of registrant as specified in its charter)
(State or Other Jurisdiction of Incorporation) | (Commission File Number) | (IRS Employer Identification No.) | ||||||
(Address of Principal Executive Offices) | (Zip Code) | |||||||
(214 ) 365-6900
(Registrant’s telephone number, including area code)
(Former Name or Former Address, if Changed Since Last Report)
Check the appropriate box below if the Form 8-K filing is intended to simultaneously satisfy the filing obligation of the registrant under any of the following provisions (see General Instructions A.2. below):
| Written communications pursuant to Rule 425 under the Securities Act (17 CFR 230.425) | |||||
| Soliciting material pursuant to Rule 14a-12 under the Exchange Act (17 CFR 240.14a-12) | |||||
| Pre-commencement communications pursuant to Rule 14d-2(b) under the Exchange Act (17 CFR 240.14d-2b) | |||||
| Pre-commencement communications pursuant to Rule 13e-4(c) under the Exchange Act (17 CFR 240.13e-4c) | |||||
Indicate by check mark whether the registrant is an emerging growth company as defined in Rule 405 of the Securities Act of 1933 (§230.405 of this chapter) or Rule 12b-2 of the Securities Exchange Act of 1934 (§240.12b-2 of this chapter).
Emerging growth company ☐
If an emerging growth company, indicate by check mark if the registrant has elected not to use the extended transition period for complying with any new or revised financial accounting standards provided pursuant to Section 13(a) of the Exchange Act. ¨
Securities registered pursuant to Section 12(b) of the Act:
| Title of each class | Trading Symbol(s) | Name of each exchange on which registered | ||||||||||||
Item 2.02.Results of Operations and Financial Condition
On July 16, 2025, Triumph Financial, Inc. (the “Company”) announced its financial results for the quarter ended June 30, 2025 in its letter to shareholders attached hereto as Exhibit 99.1. Exhibit 99.1 includes certain non-GAAP financial measures. A reconciliation of those measures to the most directly comparable GAAP measures is included as a table in the letter to shareholders. The information in this Item 2.02, including Exhibit 99.1, shall be considered furnished for purposes of the Securities Exchange Act of 1934, as amended (the “Exchange Act”), and shall not be deemed “filed” for any purpose.
Item 7.01.Regulation FD Disclosure
Triumph Financial, Inc. executives may, from time to time, meet with investors in various meetings. A copy of the materials that may be used in such meetings are attached hereto as Exhibit 99.2. The information in this Item 7.01, including Exhibit 99.2, shall be considered furnished for purposes of the Securities Exchange Act of 1934 and shall not be deemed “filed” for any purpose.
Forward-Looking Statements
This Current Report on Form 8-K contains forward-looking statements. Any statements about our expectations, beliefs, plans, predictions, forecasts, objectives, assumptions or future events or performance are not historical facts and may be forward-looking. You can identify forward-looking statements by the use of forward-looking terminology such as “believes,” “expects,” “could,” “may,” “will,” “should,” “seeks,” “likely,” “intends,” “plans,” “pro forma,” “projects,” “estimates” or “anticipates” or the negative of these words and phrases or similar words or phrases that are predictions of or indicate future events or trends and that do not relate solely to historical matters. You can also identify forward-looking statements by discussions of strategy, plans or intentions. Forward-looking statements involve numerous risks and uncertainties and you should not rely on them as predictions of future events. Forward-looking statements depend on assumptions, data or methods that may be incorrect or imprecise and we may not be able to realize them. We do not guarantee that the transactions and events described will happen as described (or that they will happen at all). The following factors, among others, could cause actual results and future events to differ materially from those set forth or contemplated in the forward-looking statements: business and economic conditions generally and in the bank and non-bank financial services industries, nationally and within our local market areas; our ability to mitigate our risk exposures; our ability to maintain our historical earnings trends; changes in management personnel; interest rate risk; concentration of our products and services in the transportation industry; credit risk associated with our loan portfolio; lack of seasoning in our loan portfolio; deteriorating asset quality and higher loan charge-offs; time and effort necessary to resolve nonperforming assets; inaccuracy of the assumptions and estimates we make in establishing reserves for probable loan losses and other estimates; risks related to the integration of acquired businesses, including our recent acquisition of Greenscreens, and any future acquisitions; our ability to successfully identify and address the risks associated with our possible future acquisitions, and the risks that our prior and possible future acquisitions make it more difficult for investors to evaluate our business, financial condition and results of operations, and impairs our ability to accurately forecast our future performance; lack of liquidity; fluctuations in the fair value and liquidity of the securities we hold for sale; impairment of investment securities, goodwill, other intangible assets or deferred tax assets; our risk management strategies; environmental liability associated with our lending activities; increased competition in the bank and non-bank financial services industries, nationally, regionally or locally, which may adversely affect pricing and terms; the accuracy of our financial statements and related disclosures; material weaknesses in our internal control over financial reporting; system failures or failures to prevent breaches of our network security; the institution and outcome of litigation and other legal proceedings against us or to which we become subject; changes in carry-forwards of net operating losses; changes in federal tax law or policy; the impact of recent and future legislative and regulatory changes, including changes in banking, securities and tax laws and regulations, such as the Dodd-Frank Act and their application by our regulators as well as privacy, cybersecurity, and artificial intelligence regulation and oversight; governmental monetary and fiscal policies; changes in the scope and cost of FDIC, insurance and other coverages; failure to receive regulatory approval for future acquisitions and increases in our capital requirements.
While forward-looking statements reflect our good-faith beliefs, they are not guarantees of future performance. All forward-looking statements are necessarily only estimates of future results. Accordingly, actual results may differ materially from those expressed in or contemplated by the particular forward-looking statement, and, therefore, you are cautioned not to place undue reliance on such statements. Further, any forward-looking statement speaks only as of the date on which it is made, and we undertake no obligation to update any forward-looking statement to reflect events or circumstances after the date on which the statement is made or to reflect the occurrence of unanticipated events or circumstances, except as required by applicable law. For a discussion of such risks and uncertainties, which could cause actual results to differ from those contained
in the forward-looking statements, see "Risk Factors" and the forward-looking statement disclosure contained in Triumph’s Annual Report on Form 10-K, filed with the Securities and Exchange Commission on February 11, 2025.
Item 9.01.Financial Statements and Exhibits
(d)Exhibits.
| Exhibit | Description | ||||
| 99.1 | |||||
| 99.2 | |||||
| 104 | Cover Page Interactive Data File (embedded within the Inline XBRL document) | ||||
EXHIBIT INDEX
| Exhibit | Description | ||||
| 99.1 | |||||
| 99.2 | |||||
| 104 | Cover Page Interactive Data File (embedded within the Inline XBRL document) | ||||
SIGNATURE
Pursuant to the requirements of the Securities Exchange Act of 1934, the registrant has duly caused this report to be signed on its behalf by the undersigned, hereunto duly authorized.
TRIUMPH FINANCIAL, INC. | |||||
| By: | /s/ Adam D. Nelson | ||||
| Name: Adam D. Nelson Title: Executive Vice President & General Counsel | |||||
Date: July 16, 2025
Exhibit 99.1

July 16, 2025
Fellow Shareholders,
For the second quarter, we recorded net income to common stockholders of $3.6 million, or $0.15 per diluted share. It was the textbook definition of a noisy quarter, but there were encouraging signals within the noise. Our results include certain non-core gains and recoveries detailed in the table below.
A substantial portion of the gain and recovery this quarter is attributable to settling our long-running litigation with the United States Postal Service (USPS). This litigation related to misdirected payments in our Factoring segment. Attentive investors will already be aware that we have carried a $19.4 million receivable from the USPS for nearly five years as a non-performing asset. As a result of the settlement, we have recovered the full amount of that receivable plus additional amounts that allowed us to recover our legal expenses for the litigation and a portion of other previously charged-off balances associated with the factoring customer involved in this matter. It has been a slow and expensive process, but perseverance paid off in the end.
The table below provides a summary of non-core items for the quarter:
| Broad Category | Income Statement Line Item | Segment | Description | $ Impact | ||||||||||
| Interest income | Interest income and fees | Factoring | USPS - Collection of fees | $1,213,000 | ||||||||||
| Noninterest expense | Professional Fees | Factoring | USPS - Recovery of legal expense | $7,376,000 | ||||||||||
| Credit loss expense | Credit loss expense | Factoring | USPS - ACL Recovery | $3,773,000 | ||||||||||
| Net impact of USPS settlement | $12,362,000 | |||||||||||||
| Noninterest expense | Professional Fees | Intelligence | Greenscreens transaction costs | $(3,024,000) | ||||||||||
| Noninterest expense | Professional Fees | Factoring | Other Legal Settlements | $(2,000,000) | ||||||||||
| Noninterest expense | Other & Amortization of intangibles | Corporate | New HQ termination fees and accelerated amortization. | $(2,067,000) | ||||||||||
| Net impact of other non-recurring items | $(7,091,000) | |||||||||||||
| Pre-tax operating income impact | $5,271,000 | |||||||||||||
| Income Tax Expense | Income Tax Expense | All Segments | Equity award vesting and non-deductible transaction expenses | $ | (1,100,000) | |||||||||
Unrelated to litigation with the USPS, we acquired a $23.4 million non-performing equipment finance loan at a significant discount to face value. The loan was purchased credit deteriorated (PCD) and a $10.8 million ACL was established on Day 1 resulting in a discount of $9.3 million. In accordance with our purchase plans, we charged-off the uncollectible $10.8 million, with no impact to our credit loss expense. The discount will be realized through the liquidation of collateral and could result in the accretion of some or all of that discount in future reporting periods. In plain language, we bought the loan for much less than we expect to recover, and we expect to record income over the next few quarters as we collect that discount. While some investors will not view this as core, we view this as an opportunity to make money on an excellent risk-adjusted basis. Our expertise in this sector allows us to capitalize on opportunities like this.
Key Thoughts for the Quarter
Here are a few things I think investors should note for the second quarter:
•The freight cycle is stuck; Triumph is not. Our core earnings are still below our historical averages. There are a plethora of headlines we could talk about that might herald the arrival of a stronger market for freight, but that’s
1
not my focus. We must operate within the market as it is and continually demonstrate progress. We have built the infrastructure to be truly great at a few distinct offerings I will discuss later in this letter. I can see the revenue growth coming from those efforts despite the continuing soft market conditions. In addition to that revenue growth, we have identified opportunities to improve our operational efficiency and are in the implementation stages of several of those. We will have more details to share on this topic in 3Q.
•Transportation revenue grew 15.2% for the quarter and is now 23.7% of our long-term goal. Last quarter, we highlighted annualized transportation revenues of about $206 million. As of this quarter, that revenue number has grown to $237 million, excluding revenues resulting from the impact of the USPS settlement. Adjusting for the annualized $8.0 million impact of the Greenscreens acquisition, transportation revenue was still up organically a very healthy 11.3%. I have previously defined our transportation opportunity as $1 billion+ in revenue and nothing has changed my view. To achieve that, we must continue to demonstrate revenue growth and margin improvement in our transportation businesses of Factoring, Payments and Intelligence. We are committed to this.
•We closed on the acquisition of Greenscreens. Our Intelligence segment is still developing, but has moved beyond the conceptual stage and is now generating meaningful revenue. I go into further details below, but the summary is that I believe we will see material revenue growth off our current base. Further to that, we expect to roll out some exciting announcements in 3Q.
•RXO and FaaS. As of July 21, RXO (one of the nation’s largest freight brokers) will be live on factoring-as-a-service (FaaS) platform and has become our second LoadPay distribution partner. We now have two of the largest brokers in the industry using our platform to deliver carrier financial products. This continues to be an exciting opportunity for Triumph.
•LoadPay is gaining momentum. On June 10, we opened our 2,000th LoadPay account. From the original launch of LoadPay through the end of 2Q, we put in place marketing limitations on the product. We wanted to phase the rollout in a way that allowed us to learn from carrier feedback before we did a broader launch. Despite its limited rollout, LoadPay continues to add new customers every day of the week. As of July 14, we opened our 2,729th account. It took us 58 days to go from our 1000th account to our 2000th and we expect it will take fewer days to get to 3,000 and beyond due to increased market awareness and RXO as a second channel marketing partner.
•Network engagement[1] now totals 63% of all brokered freight[2]. With the growth of our Factoring and Payments businesses and the addition of Greenscreens to our Intelligence segment, our transportation network engages with $70 billion of unique annualized volume. Our Payments Network and product platform serves 66 of the top 100 freight brokers in the United States.
A Value Chain of Five Offerings:
One comment I have heard from investors relates to the complexity of our story. It’s a fair point, especially since our transportation offerings have not evolved in a linear fashion. To our eye, the things we do in transportation are very symbiotic and create network effects. I acknowledge that it is easier for our team to see this than investors because we live it every day.
At the risk of sounding like a well-known children’s book involving a mouse and a cookie, you can think of our offerings like this:
•If you successfully provide audit services to your broker customers, many of those customers will trust you and ask you to also handle their payments (since audit is done for the purpose of payment).
•If you make payments, some broker customers (and the truckers that they pay) will ask you to provide financing for those payments.
•If you provide financing and payments, some trucker customers will ask for a digital wallet to receive those funds more efficiently.
2
•Broker customers will come to understand that the data you are auditing, paying and financing for the industry is a very reliable source of truth that would help them inform their internal pricing and rating models, so they will ask you for that.
•When you offer a data product, broker customers will also realize that you have a broad database of objective metrics on how carriers perform on certain loads, which they will want to help influence their routing guides, so they will ask for that to be added to the data product.
•And if you do all of these things well, you will develop a reputation in the industry that puts you in an enviable market position to win the audit business of another company in the industry...and the cycle repeats.
This is Triumph’s value chain. Anyone who is familiar with Michael Porter’s work recognizes this concept. A value chain reflects the primary and support activities that add value to a product or service at every step to gain competitive advantage. When I use this term, I am not exactly using it the way Porter did, but the industrial logic still holds. For example, the work we do in audit generates clean data that we can use in our Intelligence segment at minimal additional expense. This is just one of the interlinkages in the chain that create value for the end user. Our value chain has been built organically and through acquisition and is now ready for broad scale deployment and monetization.
Triumph does or aspires to do five things in transportation exceptionally well. Indeed, for a few of these, we do them on a larger scale than anyone in the industry. Biggest is not always best, but market adoption is generally a good sign of value delivery.
1.Audit: We acquired the capability to audit broker invoices through Hubtran in 2021. We now provide audit services for over half of the top 100 brokers and we audit more brokered freight volume than any known competitor. Our NextGen Audit product will lead the industry for features and stability. It leverages AI-driven workflows and deep TMS integrations to automate tasks, transforming the back office from reactive to exception based. Audit is the tool that has already been and will most be affected by strides in machine learning and artificial intelligence. In the next few years, industry models will likely be good enough to handle almost all exceptions. At that time, it will probably not be enough to just offer audit as a standalone product. To be competitive, it will have to be part of a suite of services. This suite is one of Triumph's competitive advantages.
2.Payments: We pay more U.S. truckers than anyone. We disburse about $200 million every day.[3] Making payments involves a lot more than just sending checks and processing ACH. We provide a carrier portal and call center that address many thousands of carrier inquiries and enables them to get paid more quickly and easily. Similarly, we handle factor inquiries and process tens of thousands of notices of assignment (NOAs) and letters of release (LORs) daily. We also mitigate fraud through screening and verification of payee information. A growing number of our customers use our payments product in conjunction with our audit product, but there is still much opportunity to deliver more value to customers by cross-selling audit and payments. We have a strong reputation and the confidence of the largest brokers in the industry.
3.Liquidity Solutions: These solutions are designed to address the age-old problem of liquidity needs for companies operating in transportation. This includes our (i) original factoring business, (ii) FaaS offerings, (iii) supply chain finance (SCF), and (iv) broker quickpay. No one else in the industry offers the product breadth Triumph does, nor do they have the same cost of funding. Further, in our fairly well-informed opinion, no other company has an equivalent technology platform that can support these offerings both for itself and for third parties. As of the end of 2Q, our total balance sheet exposure for all liquidity solutions was $1.4 billion. We have room to grow this on our own balance sheet and the option to syndicate it to a broader market when the need arises.
4.Digital Banking for Truckers (LoadPay): We built a digital bank account from the ground up for truckers, allowing working capital solutions that move with the hours of their business, instead of bankers' hours. In an industry that still funds through available ACH windows, we are able to instantly fund 24 hours a day, 7 days a week through LoadPay. We went live this year with one distribution partner (CHRW), added RXO in July, and will add more in the future. We also have plans to add product refinements and features to make the customer engagement stickier. Indeed, our roadmap is to do nothing less than create the industry-standard digital wallet for
3
truckers. We are targeting 5,000 – 10,000 accounts by year-end and, as of July 14, 2025, we have 2,729 accounts. This is a 251% increase over 1Q. I expect our growth to continue for the foreseeable future.
5.Our Pricing & Performance Engine: Through the acquisition of Greenscreens and the inclusion of our audit, payment and factoring data, we are creating a unique offering built on the aggregation of nearly $70 billion in unique volume. That’s a real distinction from what customers hear from other data providers – cumulative numbers are generally vanity metrics written by the marketing department and quoted by salespeople to grab attention and/or impute credibility. Our data is exclusive to actual loads that have been moved, audited to catch manipulation, and curated to ensure relevance and consistency. We take additional steps to identify and remove potential outliers, further enhancing data integrity. Here are a few of the things we offer in our Intelligence platform:
•Real-Time and Predictive Pricing: Combines historical settled freight rates, real-time market intelligence, and machine learning to provide near-term predictive price guidance for both buying and selling freight. Because we use more reliable ingredients in the input data I referenced above, our testing demonstrates that our prediction models are 2× more accurate than competitive products. Expect to hear more about this in coming quarters.
•Market Data Aggregation: Aggregates settled transaction data from across the market feeding it back into the model as high-confidence pricing insights tailoring results to an individual company’s behavior, targets, and margin requirements.
•Margin & Volume Optimization: AI-powered predictive tools empower logistics service providers to quote with confidence, win more business, and protect or increase profit margins per transaction in keeping with their specific goals.
•Performance Metrics: We are the only neutral performance management solution in the industry. Through the acquisition of ISO, we empower brokers to more effectively match capacity to their shippers’ unique service level requirements. A truckload of bottled water may be valued at roughly $6,000, therefore the broker may have relaxed requirements for carrier service levels around that load. Not all loads are like that: a load of parts for a factory may have very specific on-time delivery requirements, or a $2 million load of consumer electronics may require a known carrier with specific credentials. Our technology enables brokers to sort through the sea of capacity as necessary to meet those shipper service agreements. This objective scoring methodology works both ways, allowing the carrier to differentiate and market their service offering through their performance history as well as scoring the broker on performance metrics relevant to the carrier.
Final Thoughts on the Value Chain - What We Have Learned. Allow me to finish the section of the letter by expounding on something I have alluded to in the recent past. The last five years have brought opportunities for material growth in the organization. We set out to create a payments network in transportation, which had never been done before. We have done that and continue to scale it, but that journey has opened the door to so much more. Our Payments Network is now part of a larger ecosystem that offers tools and platform services that the market can consume in different ways for different purposes (i.e., FaaS, LoadPay, Intelligence). Broadening our platform to capture this value has been among the best moves we have made at Triumph. It wasn’t just about creating a $1 billion in revenue opportunity in transportation; it is about finding the value at the intersection of domains. This is where most of the long-term value can be found. Inherently this makes sense as it’s harder to achieve competence in multiple products than a single product or offering, but when you get it right and the products work in harmony, it creates greater customer value. It also makes your business more defensible - it’s far more difficult to displace a product suite than a single product.
We will never stop innovating, but we now have a firmer grasp on what the market wants and will pay for. It is time to execute on the roadmap in front of us and demonstrate to investors we can grow revenue faster than expenses regardless of the market conditions.
4
Summary of Transportation Revenue - Annualized Transportation Revenue, YOY and YTD
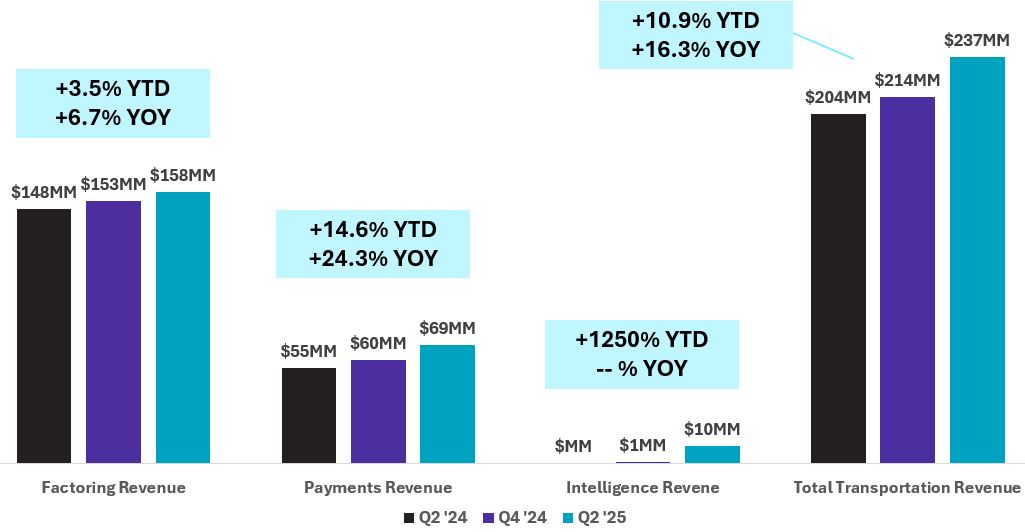
Note: Data presented in the above chart has been adjusted for the USPS settlement.
Transportation Market Update
Following the acquisition of Greenscreens and the unveiling of our Intelligence platform, we will have more to say in this section going forward. We will avoid broader economic discussions because investors can get that information from a variety of sources other than us. What we want to remind you is that whatever happens with consumer confidence, tariffs, the price of oil and a variety of other factors will have an influence on freight.
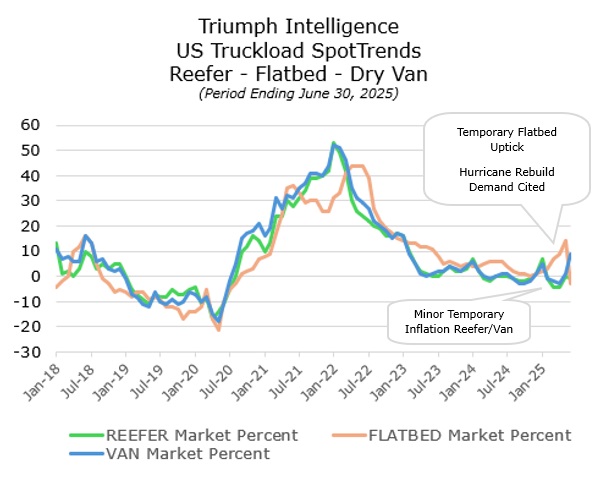
Looking forward, normal seasonal events and isolated demand spikes are expected to push rates higher in the current environment of flat demand and stable capacity. Outside of that general forecast, there were no major surprises in trucking prices or capacity amid growing uncertainty from tariff policy and executive orders of the new administration in 2Q. We have measured numerous, yet temporary, inflation episodes this year resulting from events such as weather, road checks, and regional produce seasonality. These were most notable in flatbed markets related to recent hurricane rebuilding efforts. While economic conditions are uncertain, we expect any moderate increase in demand to challenge existing capacity availability.
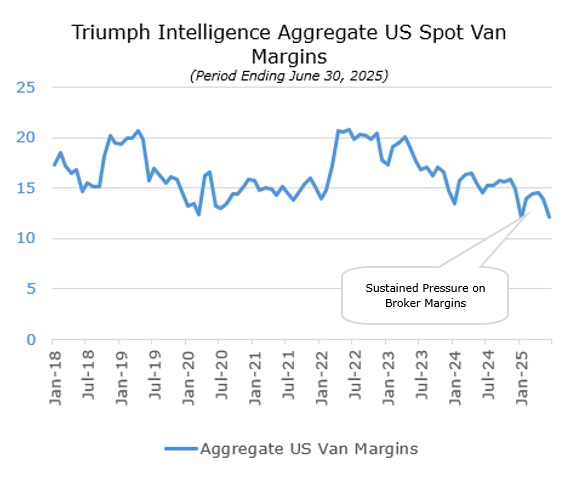
Margins reflect, in the aggregate, the difference between buy-sell rates for hundreds of brokers across the US. In addition, market percentages represent aggregate price fluctuations from a 2H 2024 baseline which are presented for dry van, reefer and flatbed as well. The following chart illustrates aggregate dry van broker margins across the Greenscreens customer base (~240 as of July 1, 2025). Since 2023, there has been fairly consistent pressure on margins.
5
The following chart illustrates benchmark price trends considering lane rates derived in 2H 2024 as the baseline. These trends offer benchmarks for lanes regardless of distance and are weighted by volume. Mild rate conditions persist since early 2023 with slight seasonal upticks. Temporary periods of inflation have occurred across all modes.
6
Payments
1.Analysis of financial and operational performance for the quarter
2.Progress and plans related to growing payments and audit revenue
3.LoadPay update
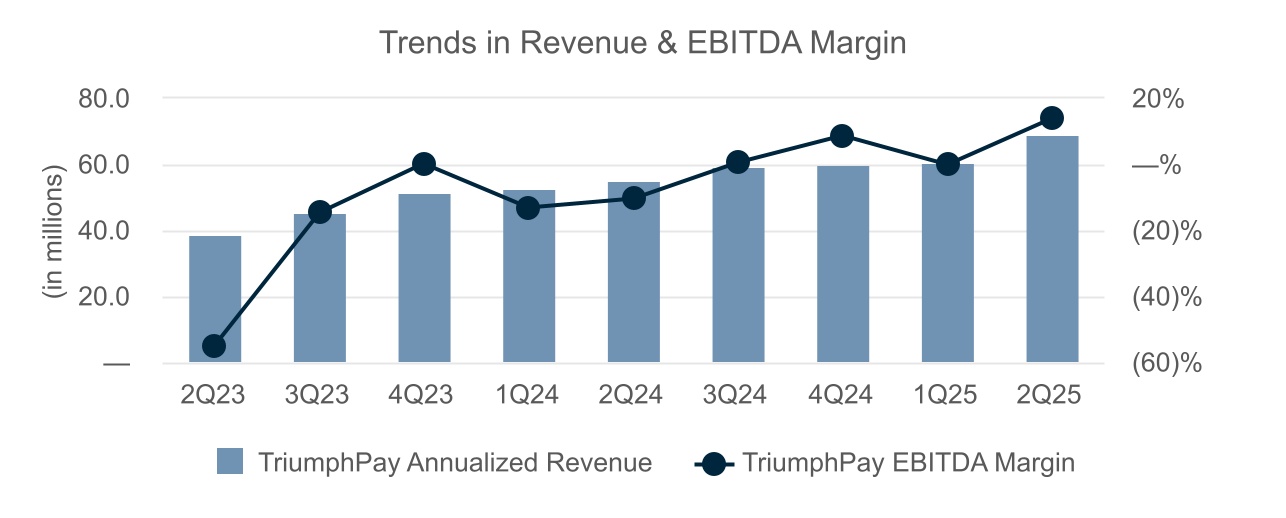
Analysis of financial and operational performance for the quarter. Revenue grew 13.5% q/o/q, and EBITDA margin for the quarter improved to 13.9%.
| June 30, 2025 | March 31, 2025 | December 31, 2024 | September 30, 2024 | June 30, 2024 | Current Quarter Q/Q | Current Year Y/Y | |||||||||||||||||||||||||||||||||||||||||||||||
| For the Qtr Ending | Change | % Change | Change | % Change | |||||||||||||||||||||||||||||||||||||||||||||||||
| Payments: | |||||||||||||||||||||||||||||||||||||||||||||||||||||
| Invoice Volume | 8,500,565 | 7,182,044 | 6,788,408 | 6,278,246 | 6,062,779 | 1,318,521 | 18.4 | % | 2,437,786 | 40.2 | % | ||||||||||||||||||||||||||||||||||||||||||
| Payment Volume | $ | 10,081,206,000 | $ | 8,777,825,000 | $ | 7,625,735,000 | $ | 7,091,493,000 | $ | 6,687,587,000 | $ | 1,303,381,000 | 14.8 | % | $ | 3,393,619,000 | 50.7 | % | |||||||||||||||||||||||||||||||||||
| Network Invoice Volume | 1,004,603 | 719,531 | 567,258 | 661,628 | 701,768 | 285,072 | 39.6 | % | 302,835 | 43.2 | % | ||||||||||||||||||||||||||||||||||||||||||
| Network Payment Volume | $ | 1,579,662,000 | $ | 1,167,464,000 | $ | 922,927,000 | $ | 1,063,228,000 | $ | 1,133,118,000 | $ | 412,198,000 | 35.3 | % | $ | 446,544,000 | 39.4 | % | |||||||||||||||||||||||||||||||||||
| Average Invoice Price | 1,186 | 1,222 | 1,123 | 1,130 | 1,103 | (36) | (2.9) | % | 83 | 7.5 | % | ||||||||||||||||||||||||||||||||||||||||||
| Network Engagement | 63.3 | % | 50.4 | % | 48.7 | % | 47.8 | % | 46.6 | % | 12.9 | % | 25.6 | % | 16.7 | % | 35.8 | % | |||||||||||||||||||||||||||||||||||
| Average Float | $ | 469,211,000 | $ | 442,901,000 | $ | 410,044,000 | $ | 363,255,000 | $ | 333,888,000 | $ | 26,310,000 | 5.9 | % | $ | 135,323,000 | 40.5 | % | |||||||||||||||||||||||||||||||||||
| Fee Revenue | $ | 8,105,000 | $ | 6,903,000 | $ | 6,704,000 | $ | 6,611,000 | $ | 6,131,000 | $ | 1,202,000 | 17.4 | % | $ | 1,974,000 | 32.2 | % | |||||||||||||||||||||||||||||||||||
| Total Revenue | $ | 17,231,000 | $ | 15,184,000 | $ | 15,031,000 | $ | 14,873,000 | $ | 13,862,000 | $ | 2,047,000 | 13.5 | % | $ | 3,369,000 | 24.3 | % | |||||||||||||||||||||||||||||||||||
| # of LoadPay Accounts | 2,367 | 778 | 192 | 65 | — | 16 | 205.7 | % | 24 | — | % | ||||||||||||||||||||||||||||||||||||||||||
| LoadPay Funding | $ | 22,212,000 | $ | 4,986,000 | $ | 777,000 | $ | 178,000 | $ | — | $ | 17,226,000 | 345.5 | % | $ | 22,212,000 | — | % | |||||||||||||||||||||||||||||||||||
| Average Interchange Fees | 1.61 | % | 1.76 | % | 1.67 | % | — | % | — | % | (0.15) | % | (8.52) | % | 1.61 | % | — | % | |||||||||||||||||||||||||||||||||||
| EBITDA margin | 13.9 | % | (0.1) | % | 8.6 | % | 0.5 | % | (10.4) | % | 14.0 | % | (14000.0) | % | 24.3 | % | (233.7) | % | |||||||||||||||||||||||||||||||||||
Network engagement in brokered freight jumped to 63% in 2Q and will continue to push higher. Some of this engagement growth during the quarter came from our Payments segment, but a material portion was in our Intelligence segment. The addition of Greenscreens added $13.4 billion of transactional volume.
We have been vigilant to eliminate double counting in our reported network engagement to demonstrate the true breadth of the network. Investors, customers and prospects deserve transparency regarding this calculation. I believe that investors should start paying attention to the depth of our network. The breadth of the network represents the percentage of unique transactions Triumph has touched once regardless of product or segment. The depth of the network is the dollar volume of all transactions in each product or segment. The depth is bound to be a larger number because we touch certain transactions in multiple products and segments. Depth in excess of breadth means we are creating value for customers and monetizing our offerings in multiple segments on a single transaction. For 2Q, annualized network engagement (breadth) was $70 billion, while depth was $100 billion.
The calculation below these metrics is as follows. For the quarter, payment volume increased by 14.8% to $40.3 billion, annualized. Our broker customers represent $35.9 billion of that. Our total broker audit volume increased slightly to $28.9 billion, and total factor audit volume, inclusive of our own factoring business, was $12.3 billion. Greenscreens total volume was $22.7 billion. While the market continues to be sluggish, we grew revenue because we are adding new customers and going deeper with existing ones.
Progress and plans related to growing payments and audit revenue. Payments revenue grew 13.5% in 2Q to an annualized rate of $68.9 million driven by new customers. Fee revenue represented ~60% of the growth and will remain our primary focus for the foreseeable future. We are focusing on three primary levers for driving accelerated payments fee revenue growth:
1.Consistently and fairly pricing existing Payments customers. As summarized last quarter, many of our Payments customers were onboarded several years ago when quickpay was our only source of revenue. Newer customers are paying a per payment fee in addition to the quickpay revenue share. In 2Q, the percentage of payments for
7
which we charged a fee increased from 24.0% to 28.5%. During the quarter, fee revenue for payments increased by $1.2 million, or an annualized $4.8 million, due to the addition of two large existing brokers going live on payments, nine new customers with subscription fees and 36 other existing customers beginning to pay subscription fees. We expect payments fee revenue growth to accelerate over the coming quarters as we bring all customers to fair, standard pricing based on the value we create for them.
2.Growing our customer base. Six net new brokers and six new shippers joined us for payments and/or audit in 2Q. Our sales pipeline is solid and suggests that we will continue to grow our customer base in the coming quarters. Audit customer attrition abated as we upgraded 10 more legacy audit customers to NextGen Audit (NGA). We are optimistic that continued enhancements will position us to further reduce attrition and regain share. This optimism is fueled by the return of a notable audit customer that we lost last year and the launch of LTL audit functionality. LTL is currently being piloted with select brokers.
3.Cross-selling NGA and Payments. Integrating payments and NGA enables us to create customer experiences that are superior to what standalone products offer, but we must do more to demonstrate this to our customers. During the quarter, we cross-sold payments or audit to eight customers, bringing the total number of brokers using both payments and audit to 168. Moreover, 100+ Greenscreens customers representing $13.4 billion in volume don’t currently consume either our payments or audit services.
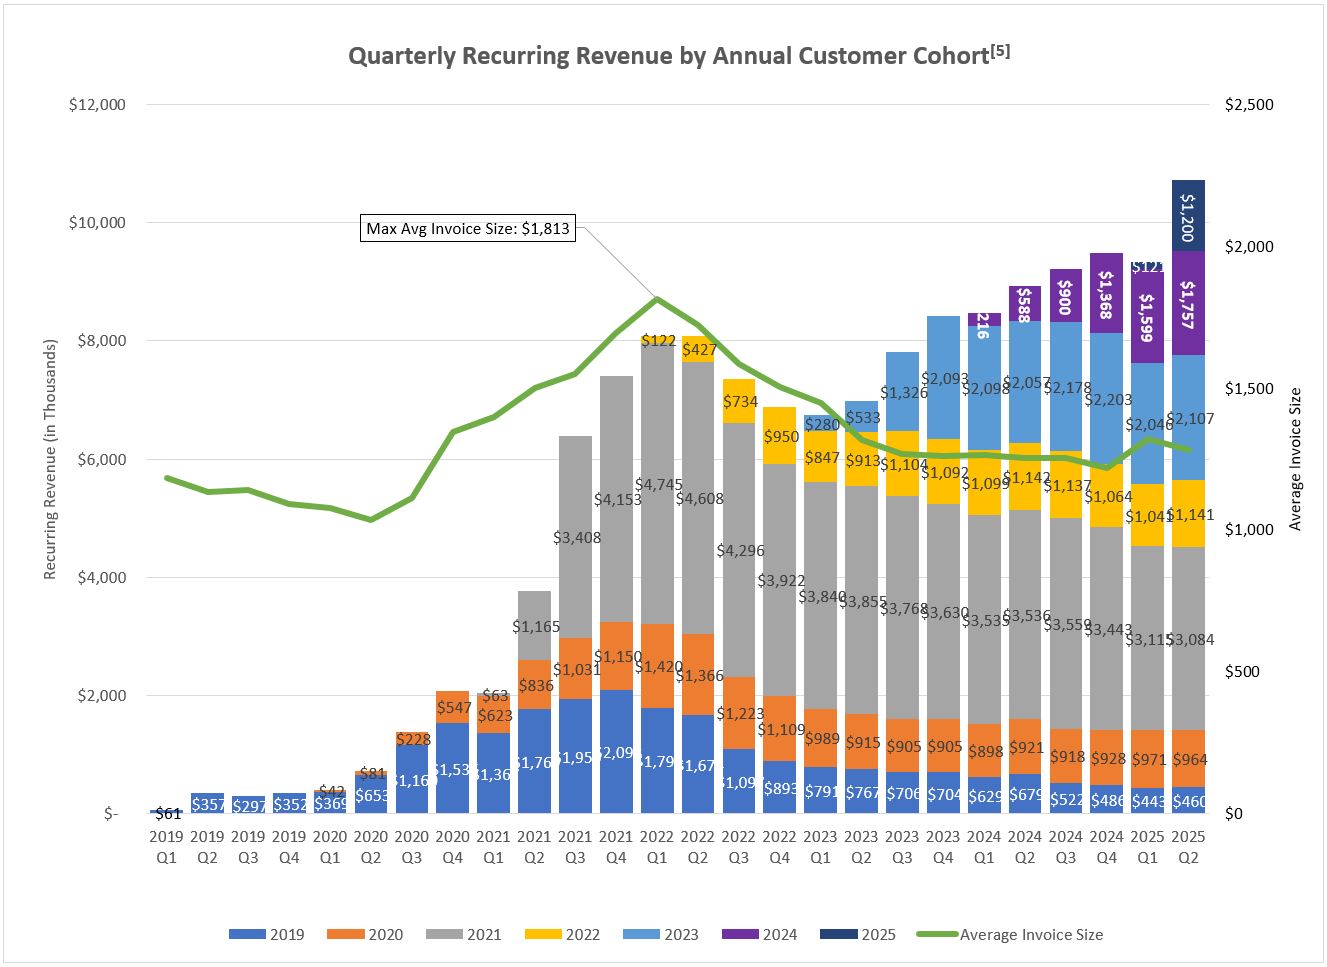
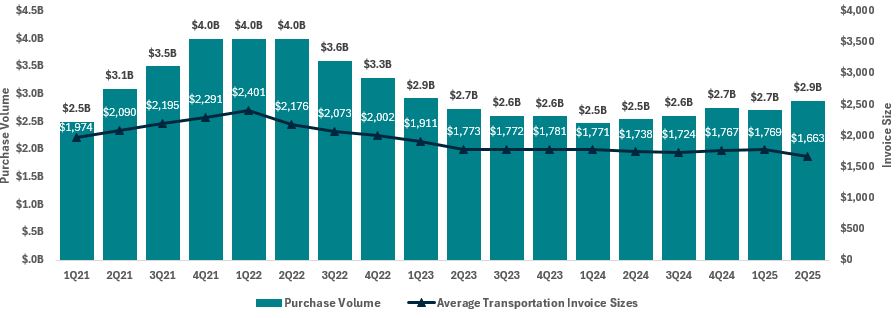
The chart below provides a visual demonstration of how we have increased revenue in our Payments segment to date. The line represents invoice sizes[4], while the bars represent revenue. The revenue bars highlight fee income that can be attributed to a specific customer in a specific year and excludes supply chain finance income and float.
8
In the chart below, we highlight the continued revenue growth and its trend over the last eight quarters against the backdrop of our payment volumes (note this is payment volume only, not Network engagement). Our 2Q revenue run rate was $68.9 million, annualized. We have generated a roughly 33.2% CAGR in revenue over the last two years.
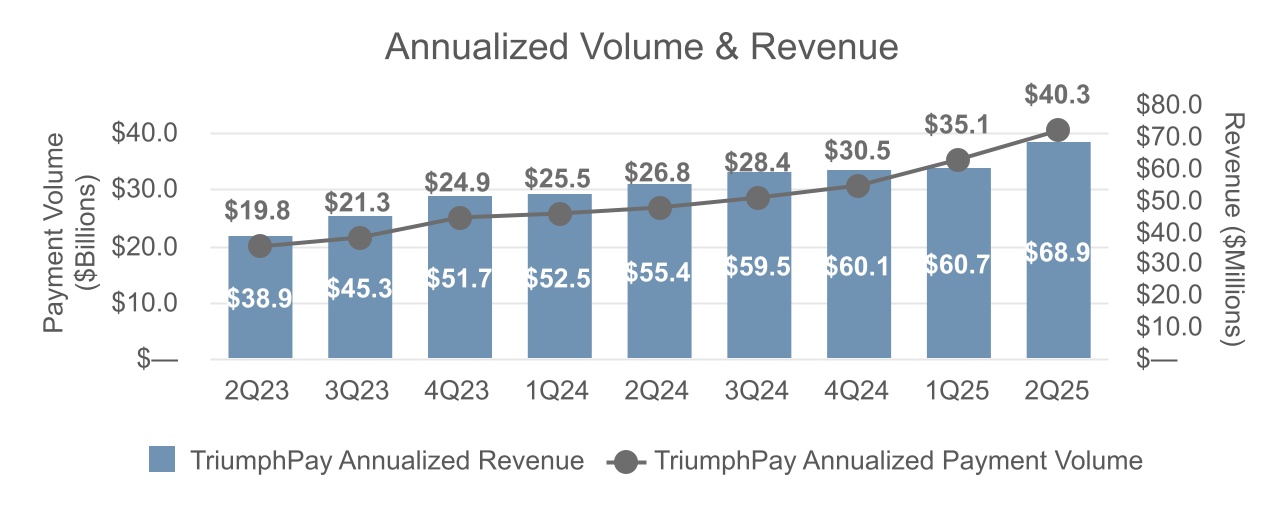
In the chart below, we highlight the trend lines in EBITDA margin relative to revenue. Margin growth is very important to us, and we expect it to continue, although there can be noise in any given quarter. 2Q EBITDA margin was 13.9%.
LoadPay update. During the quarter we reached the milestone of opening our 2,000th account on June 10th. We added new features which continue to position LoadPay as the banking product built for trucking. Our distribution partner CHRW launched LoadPay cash advances to their carriers, giving carriers the only way in the industry to have money moved instantly into a bank account while on-load. 2Q new accounts were 1,589, up from 586 in 1Q. This brings our cumulative number of accounts at the end of 2Q to 2,367. As of July 14, total LoadPay accounts numbered 2,729. Our interchange rate was 1.61% for 2Q.
Carriers can now open a LoadPay account in minutes and immediately begin transacting with over 400 freight brokers who can pay them instantly. We ended 2024 paying about $1.0 million into carriers’ LoadPay accounts. During 1Q, we paid $5.0 million into carriers’ LoadPay accounts. In 2Q, we paid $22.2 million into carrier LoadPay accounts. That is rapid growth even if the denominator is still small.
In 3Q, the team is focused on expanding LoadPay across target markets, features, and distribution partners. With product enhancements during 2Q, we are bringing LoadPay out of the beta phase. Earlier this month we kicked off launch events and are directly selling the product to more segments of the carrier market. We are also launching RXO as our second distribution partner for LoadPay. In addition to the ability to advance carriers portions of the line haul instantly into LoadPay accounts, we have added the ability for account owners to issue and manage physical and virtual expense cards
9
to help reduce fraud and ensure trucks keep moving. These features differentiate LoadPay from traditional business banking offers and gives us a strong value proposition to offer larger carriers as we pursue the 127,000+ unique carriers that Triumph makes payments to on a quarterly basis. We are still early in monetization efforts of the accounts, but we are seeing the expected returns for a program that has only been in the market for three quarters. We continue to expect to finish the year with between 5,000 and 10,000 accounts.
Factoring
1.Analysis of financial and operational performance for the quarter
2.Technology and FaaS updates
3.Factoring segment and revenue growth
Analysis of financial and operational performance for the quarter. Revenue grew 13.3% q/o/q, and operating margin improved to 48.5%. These metrics were impacted by the USPS recovery by 3.4% and 24.7%, respectively. During 2Q, our average transportation invoice price was $1,663. This is $106 lower than 1Q 2025, and $75 lower than the same period in 2024. Investors should be aware that our average invoice size in Factoring is reflective of the spot market, but it is also influenced by the ever-changing mix of our trucking customers (i.e., we added some large customers who specialize in short hauls, which have lower invoice amounts). Purchased volume increased 6.1% relative to 1Q 2025, and invoice volume increased 13.4% over the same period.
| June 30, 2025 | March 31, 2025 | December 31, 2024 | September 30, 2024 | June 30, 2024 | Current Quarter Q/Q | Current Year Y/Y | |||||||||||||||||||||||||||||||||||||||||||||||
| For the Qtr Ending | Change | % Change | Change | % Change | |||||||||||||||||||||||||||||||||||||||||||||||||
| Factoring: | |||||||||||||||||||||||||||||||||||||||||||||||||||||
| Invoice Volume | 1,697,851 | 1,497,644 | 1,524,904 | 1,480,824 | 1,432,366 | 200,207 | 13.4 | % | 265,485 | 18.5 | % | ||||||||||||||||||||||||||||||||||||||||||
| Purchased Volume | $ | 2,873,659,000 | $ | 2,707,805,000 | $ | 2,747,351,000 | $ | 2,610,177,000 | $ | 2,542,327,000 | $ | 165,854,000 | 6.1 | % | $ | 331,332,000 | 13.0 | % | |||||||||||||||||||||||||||||||||||
| Average Transportation Invoice Size | $ | 1,663 | $ | 1,769 | $ | 1,767 | $ | 1,724 | $ | 1,738 | $ | (106) | (6.0) | % | $ | (75) | (4.3) | % | |||||||||||||||||||||||||||||||||||
| Invoices / Client | 232 | 204 | 205 | 192 | 180 | 28 | 13.7 | % | 52 | 28.9 | % | ||||||||||||||||||||||||||||||||||||||||||
| Discount Rate | 1.37 | % | 1.31 | % | 1.34 | % | 1.40 | % | 1.42 | % | 0.06 | % | 4.6 | % | (0.05) | % | (3.5) | % | |||||||||||||||||||||||||||||||||||
| Avg Daily Purchases* | $ | 45,614,000 | $ | 44,390,000 | $ | 43,609,000 | $ | 40,784,000 | $ | 40,354,000 | 1,224,000 | 2.8 | % | 5,260,000 | 13.0 | % | |||||||||||||||||||||||||||||||||||||
| Operating margin | 48.46 | % | 19.24 | % | 23.67 | % | 20.99 | % | 12.48 | % | 29.22 | % | 151.9 | % | 35.98 | % | 288.3 | % | |||||||||||||||||||||||||||||||||||
*calculated using number of working days
Factoring segment operating income was $19.8 million, or $12.8 million higher than the prior quarter. This was primarily due to the impact of the settlement of the USPS litigation which impacted interest and fees by $1.2 million, legal expenses by $(7.4) million, and credit loss expense by $(3.8) million related to a recovery charged-off in a previous period. Further, operating income was also negatively impacted by a $2.0 million legal settlement unrelated to the USPS settlement. The total impact on operating income from these non-core/non-recurring items in 2Q was $10.4 million. The yield on average receivables balances was up, rising 0.65% to 13.4%. This was due in part to the USPS settlement, which impacted yield on average receivables by 0.43% and yield on net funds employed (NFE) by 0.46%. USPS related recoveries of balances charged-off in prior periods impacted current quarter charge-offs by (0.33%).
Technology and FaaS updates. As of June 30, the instant decision model is active on the entire portfolio except Supply Chain Finance (SCF). Instant decision uses our data extraction technology, risk models and machine learning to make purchasing decisions on specific invoices without human intervention. We continue to believe that we have a 30% - 45% revenue growth opportunity before adding material expense as a result of the technological investments we have made over the last few years.
In addition to the efficiency improvements from instant decision, we increased automation in our treasury function by creating tighter integrations between Factoring and Payments Network brokers for cash posting. Cash posting is the critical step in the process of matching the payments we receive from account debtors (brokers/shippers) to pay receivables purchased from our trucking customers. For example, a broker may send $100 thousand to settle 50+ invoices. To this point, our process has been for the debtor to submit a remittance document that delineates which invoices they are paying, and we leverage OCR technology to auto-match what we can in our systems. Our success rate
10
is around 40%. Now, our Factoring treasury function is fully integrated into the Payments Network and matches remittance information by that load system ID, essentially allowing a 100% match rate for integrated network debtors. Further, we continue to innovate in our call center, leveraging technology to automate workflow and processing. As a result, we have achieved a 38% reduction y/o/y in calls per customer through these additional self-service features and visibility of information within the portal.
We have continued to improve other areas of our technology, such as our “Apply Site” that has been rebuilt to be more streamlined. Apply Site is the landing page where a carrier can apply for multiple Triumph products, which has also been designed to facilitate white-labeling for our FaaS partners. By focusing on reducing friction points in the application process, we have seen a 230% increase in applicants who complete the application once they start it. This prepopulating reduces carrier effort and automatically pulls required documents, so there is less work on the applicant.
FaaS represents a strategic growth opportunity as we work to embed proven working capital solutions into the platforms our customers already use. We are actively investing in deeper platform integrations, automated underwriting, optimized onboarding, sales training and collaboration to empower our partners to effectively position and sell factoring. These efforts will improve conversion, and we are committed to transforming FaaS into a meaningful and scalable contributor to our business. As we continue to refine the model, our focus remains on building trusted partnerships, delivering a seamless customer experience, and expanding access to liquidity.
Factoring segment and revenue growth. We see sustained momentum in our Factoring segment, driven by customer acquisition, expanded volume, and deeper product adoption. In 2Q, we added 328 new customers, contributing approximately $40 million in net new accounts receivable to our portfolio. Total purchases reached $2.9 billion for the quarter, a 6.1% increase over 1Q, and $5.6 billion for the first half of 2025 - representing 11.4% year-over-year growth. This performance reflects the strength of our origination engine and our ability to scale even in a soft freight environment.
Encouragingly, 36% of these new customers came through existing customer referrals, a powerful indicator of the trust, service, and value we’ve built across our customer base. That referral-driven growth affirms the experience and results we deliver in the market. Revenue for 2Q was $40.8 million, a $4.8 million increase from the prior quarter, related in part due to $1.2 million from the USPS settlement, but mostly driven by both volume gains and our strategic transition toward more dynamic pricing models.
Over the past two years, we’ve made meaningful progress shifting our recourse portfolio toward NFE pricing. As of 2Q, 22% of our recourse customers are now operating under this structure—up from just 4% in 2022. NFE pricing isolates the cost to process from the funds employed, giving our customers better control of the funding expense while mitigating risk and enhancing yield. This approach also discourages rate shopping by aligning pricing with total capital utilization, while giving Triumph more predictable and consistent income regardless of invoice-level fluctuations.
We closed the quarter with nearly 1.7 million invoices purchased, reflecting more than 13.4% q/o/q growth and building on the momentum established in 1Q. Most of our new Factoring customers are now integrated into our LoadPay platform during on-boarding, reinforcing our Instant Funding adoption, embedded payments strategy, and increasing platform stickiness.
11
Intelligence
1.Analysis of financial and operational performance for the quarter
2.Financial impact of Greenscreens acquisition
3.Near-term development focus
Analysis of financial and operational performance for the quarter. Total revenue was $1.7 million. We will use 3Q to establish a true base line of revenue and margin so that investors can measure our performance in future periods. Our Intelligence segment closed the quarter on a $9.7 million annualized revenue run rate.
Financial impact of Greenscreens acquisition. We completed the Greenscreens acquisition on May 8, so we recorded revenue and expense for a portion of the second quarter, in addition to the non-recurring transaction costs noted on the chart at the beginning of this letter. The direct impact on the quarter included about $1.3 million in noninterest income and $1.3 million of operating expenses (primarily compensation) in the Intelligence segment.
In addition, we recorded $1.2 million of amortization expense on the intangible assets that resulted from the transaction with $830 thousand recorded in the Intelligence segment and $381 thousand recorded in the Payments segment. We expect the Greenscreens-related intangible amortization to be $1.8 million in each of the final two quarters of 2025 with 69% of that recorded in the Intelligence segment and 31% in the Payments segment.
Finally, since we funded $140 million of the acquisition price with cash we would have otherwise sold to the Federal Reserve, our net interest income in the quarter was impacted by about $900 thousand. This drag on cash was borne by the Banking segment and will be ongoing.
Near-term development focus. Aside from executing the roadmaps that were in place for ISO and Greenscreens pre-acquisition, there is significant effort being put into (i) integrating Triumph data into ISO and Greenscreens models, (ii) integrating the two products together and (iii) building new products in response to customer demand.
We are taking a very deliberate approach to integrating the Triumph data into ISO and Greenscreens. While it is true that we have a rich, clean dataset to work from, we are not in a rush to dump that into the model to produce a large headline metric for marketing purposes. We believe the better path is more measured and surgical for the reasons discussed below. Ultimately, it is about credibility - if you are going to tell the market your pricing and ratings engine is the most accurate and has the most breadth, you better be right.
For our performance product, the metrics that we focus on are (i) the number of carriers we have performance scores for, (ii) the number of data points we have on each carrier so that past performance is a strong indicator of future performance, and (iii) the accuracy of those data points given that “on-time” is calculated and assessed many different
12
ways in the industry. Our initial work gives us confidence we will be able to move the needle considerably across all three metrics.
For pricing, those key metrics are a measure of prediction accuracy when compared to what was actually paid to a carrier for that load ("mean absolute percent error" or MAPE) and lane coverage (how many unique combinations of 5-digit zip codes can we predict with high confidence). The work involved in testing these models with additional data is much more involved than it is with performance given the more advanced modeling techniques required to predict broker-specific pricing. Based on the early efforts here, we are confident that our hypothesis of being able to meaningfully improve these two key metrics with Triumph data is demonstrably correct. This is the point I made earlier in the value chain discussion - for our thesis to work, we needed to be able to prove that our Payments and Factoring segment data would augment the Greenscreens model and make its outputs more precise and increase the model's breadth of coverage. That is proving true.
In parallel to the data work above, there are also active efforts to collaborate with our customers on the most valuable ways in which our pricing and performance platforms can be brought together into one user experience and ecosystem. It is our belief that there is great value to be created for our customers at the intersection of data sets, allowing for insights and workflows that could not exist as standalone offerings. I referenced this earlier in the letter as one of our fundamental beliefs about our product offering.
We also know from our customers that there are critical needs in the market that would leverage these capabilities to solve other parts of a broker’s load lifecycle. While we are not yet prepared to elaborate on this effort for competitive reasons, we have high confidence that our work in this area will be well-received by our broker customers and will help drive upsell and cross-sell opportunities of our Intelligence products. More information about these efforts will likely become public in 3Q.
Banking
1.Analysis of financial and operational performance for the quarter
2.Credit update
Analysis of financial and operational performance for the quarter. Banking segment operating income decreased $1.2 million to $26.4 million, or 4.4%, from the prior quarter. Growth in net interest income and noninterest income ($1.4 million combined) was partially offset by higher legal expenses associated with working out classified assets. Higher mortgage warehouse volumes drove all of the growth in lending balances.
Credit update. We are pleased with the continued improvement this quarter in credit metrics. The USPS settlement improved credit related ratios as $19.4 million came out of nonaccrual loans and classified assets, but this represented less than 40% of the overall improvement as shown below.
•Total non-performing loans to total loans improved by 87 bps (39 bps related to USPS)
•Total classified assets decreased by $58.2 million ($19.4 million related to USPS)
•Past due to total loans improved by 103 bps. Due to nuances in the USPS settlement (which was entered into prior to the end of the quarter with payment of funds received post June 30 but prior to the date of this letter) the misdirected payments balance remained past due at June 30 despite no longer being non-performing or classified. Applying that settlement to past dues at quarter-end would have lowered the ratio by an additional 38 bps.
•Bank segment credit loss expense remained in line with expectations at $2.2 million.
We remain focused on continuing to improve credit quality and we are closely monitoring customers with exposure to countries or industries that could be negatively impacted by high tariffs. We are also prepared for the possibility of a broad recession, although we do not yet see evidence of a pending recession in borrower financial statements.
13
Expense Forecast & Closing Thoughts
As I noted at the beginning of the letter, this was a very noisy quarter and barring something unforeseen we anticipate 3Q expenses to be more representative of our core run rate. We project noninterest expense in 3Q, including the incremental operating expenses and intangible amortization related to the Greenscreens acquisition, to be approximately $104 million.
The transportation market is still looking for a meaningful tailwind, but our unwavering commitment to innovation and customer-centric solutions only strengthens our position. Through strategic investments in our technology platform, deep industry expertise, and a relentless pursuit of excellence in products and services, we are building an ecosystem that delivers unprecedented value to our customers. As this quarter demonstrates, we are making meaningful strides in translating that value to our shareholders.
Triumph is a unique company among banks and we celebrate our differences for the opportunities they present. I am excited about the progress, trajectory and those opportunities ahead. Thank you for your interest in what we are building.
With warm regards,
Aaron P. Graft Founder, Vice Chairman & CEO
[1] We define Network engagement as the amount of freight touched through our payments, audit, full AP automation and rate intelligence products. It is an indicator of our broker volume density in the market, the source for growing available Network transactions and data assets, and a key value driver of the Network.
[2] This reference to brokered freight is specific to domestic truckload (TL) freight only. Thus, this calculation would exclude less than truckload (LTL), parcel, etc. It would also exclude shipper volumes. Admittedly, this is a difficult percentage to calculate with precision, and it will move from year to year. That being said, we can evaluate the number of payments received in our factoring segment as a proxy for the percentage of TL freight Triumph Payments is touching and also use industry data points to make informed assumptions. In the end, this goal is not intended to be a precise measurement in the same way as we would measure earnings. It is a directional and blunt measurement of the reach of the Network.
[3] This figure combines the payments made in our payments segment as well as the invoices purchased in our factoring segment and is based on the number of business days in the quarter.
[4] Average invoice sizes in our payments segment are generally smaller than average invoice sizes in our factoring segment as a transportation factor generally will only factor long-haul trucking invoices. Less than truckload (LTL) and parcel typically are not regularly serviced by the transportation factoring industry due to their small ticket size. Our payments business pays all transportation invoices of a freight broker and, as such, includes some LTL, parcel and shorter hauls that a transportation factor normally will not service.
[5] Recurring cohort revenue is defined as quickpay revenue and fee revenue attributable to customers onboarded in the annual cohorts shown. It does not include non-recurring fees or gains, float revenue, or other supply chain finance income aside from quickpays. Average Invoice size presented excludes shipper and freight broker factoring invoices.
14
Conference Call Information
Aaron P. Graft, Vice Chairman and CEO, and Brad Voss, CFO, will review the financial results in a conference call with investors and analysts beginning at 9:30 a.m. central time on Thursday, July 17, 2025.
The live video conference option may be accessed directly through this link, https://triumph-financial-q2-2025-earnings.open-exchange.net/ or via the Company's IR website at ir.triumph.io through the News & Events, Events & Presentations links. An archive of this conference call will subsequently be available at this same location, referenced above, on the Company’s website.
About Triumph Financial
Triumph Financial, Inc. (Nasdaq: TFIN) is a financial and technology company focused on payments, factoring, intelligence and banking to modernize and simplify freight transactions. Headquartered in Dallas, Texas, its portfolio of brands includes Triumph, TBK Bank and LoadPay. ir.triumph.io
Forward-Looking Statements
This letter to shareholders contains forward-looking statements. Any statements about our expectations, beliefs, plans, predictions, forecasts, objectives, assumptions or future events or performance are not historical facts and may be forward-looking. You can identify forward-looking statements by the use of forward-looking terminology such as “believes,” “expects,” “could,” “may,” “will,” “should,” “seeks,” “likely,” “intends,” “plans,” “pro forma,” “projects,” “estimates” or “anticipates” or the negative of these words and phrases or similar words or phrases that are predictions of or indicate future events or trends and that do not relate solely to historical matters. You can also identify forward-looking statements by discussions of strategy, plans or intentions. Forward-looking statements involve numerous risks and uncertainties, and you should not rely on them as predictions of future events. Forward-looking statements depend on assumptions, data or methods that may be incorrect or imprecise and we may not be able to realize them. We do not guarantee that the transactions and events described will happen as described (or that they will happen at all). The following factors, among others, could cause actual results and future events to differ materially from those set forth or contemplated in the forward-looking statements: business and economic conditions generally and in the bank and non-bank financial services industries, nationally and within our local market areas; our ability to mitigate our risk exposures; our ability to maintain our historical earnings trends; changes in management personnel; interest rate risk; concentration of our products and services in the transportation industry; credit risk associated with our loan portfolio; lack of seasoning in our loan portfolio; deteriorating asset quality and higher loan charge-offs; time and effort necessary to resolve non-performing assets; inaccuracy of the assumptions and estimates we make in establishing reserves for probable loan losses and other estimates; risks related to the integration of acquired businesses and any future acquisitions; our ability to successfully identify and address the risks associated with our possible future acquisitions, and the risks that our prior and possible future acquisitions make it more difficult for investors to evaluate our business, financial condition and results of operations, and impairs our ability to accurately forecast our future performance; lack of liquidity; fluctuations in the fair value and liquidity of the securities we hold for sale; impairment of investment securities, goodwill, other intangible assets or deferred tax assets; our risk management strategies; environmental liability associated with our lending activities; increased competition in the bank and non-bank financial services industries, nationally, regionally or locally, which may adversely affect pricing and terms; the accuracy of our financial statements and related disclosures; material weaknesses in our internal control over financial reporting; system failures or failures to prevent breaches of our network security; the institution and outcome of litigation and other legal proceedings against us or to which we become subject; changes in carry-forwards of net operating losses; changes in federal tax law or policy; the impact of recent and future legislative and regulatory changes, including changes in banking, securities and tax laws and regulations, such as the Dodd-Frank Act and their application by our regulators as well as privacy, cybersecurity, and artificial intelligence regulation and oversight; governmental monetary and fiscal policies; changes in the scope and cost of FDIC, insurance and other coverages; failure to receive regulatory approval for future acquisitions and increases in our capital requirements.
15
While forward-looking statements reflect our good-faith beliefs, they are not guarantees of future performance. All forward-looking statements are necessarily only estimates of future results. Accordingly, actual results may differ materially from those expressed in or contemplated by the particular forward-looking statement, and, therefore, you are cautioned not to place undue reliance on such statements. Further, any forward-looking statement speaks only as of the date on which it is made, and we undertake no obligation to update any forward-looking statement to reflect events or circumstances after the date on which the statement is made or to reflect the occurrence of unanticipated events or circumstances, except as required by applicable law. For a discussion of such risks and uncertainties, which could cause actual results to differ from those contained in the forward-looking statements, see "Risk Factors" and the forward-looking statement disclosure contained in Triumph Financial’s Annual Report on Form 10-K, filed with the Securities and Exchange Commission on February 11, 2025.
Non-GAAP Financial Measures
This letter to shareholders includes certain non‐GAAP financial measures intended to supplement, not substitute for, comparable GAAP measures. Reconciliations of non‐GAAP financial measures to GAAP financial measures are provided at the end of this letter to shareholders.
16
The following table sets forth key metrics used by Triumph Financial to monitor our operations. Footnotes in this table can be found in our definitions of non-GAAP financial measures at the end of this document.
| As of and for the Three Months Ended | As of and for the Six Months Ended | ||||||||||||||||||||||||||||||||||||||||
| (Dollars in thousands) | June 30, 2025 | March 31, 2025 | December 31, 2024 | September 30, 2024 | June 30, 2024 | June 30, 2025 | June 30, 2024 | ||||||||||||||||||||||||||||||||||
| Financial Highlights: | |||||||||||||||||||||||||||||||||||||||||
| Total assets | $ | 6,494,748 | $ | 6,268,394 | $ | 5,948,975 | $ | 5,866,046 | $ | 5,783,334 | $ | 6,494,748 | $ | 5,783,334 | |||||||||||||||||||||||||||
| Loans held for investment | $ | 4,953,170 | $ | 4,666,223 | $ | 4,546,960 | $ | 4,332,967 | $ | 4,288,417 | $ | 4,953,170 | $ | 4,288,417 | |||||||||||||||||||||||||||
| Deposits | $ | 5,186,098 | $ | 4,976,750 | $ | 4,820,820 | $ | 4,706,694 | $ | 4,392,018 | $ | 5,186,098 | $ | 4,392,018 | |||||||||||||||||||||||||||
| Net income available to common stockholders | $ | 3,618 | $ | (784) | $ | 3,036 | $ | 4,546 | $ | 1,945 | $ | 2,834 | $ | 5,302 | |||||||||||||||||||||||||||
| Performance Ratios - Annualized: | |||||||||||||||||||||||||||||||||||||||||
| Return on average assets | 0.28 | % | — | % | 0.26 | % | 0.36 | % | 0.19 | % | 0.14 | % | 0.25 | % | |||||||||||||||||||||||||||
| Return on average total equity | 1.95 | % | 0.01 | % | 1.70 | % | 2.39 | % | 1.26 | % | 0.99 | % | 1.58 | % | |||||||||||||||||||||||||||
| Return on average common equity | 1.68 | % | (0.37 | %) | 1.41 | % | 2.14 | % | 0.94 | % | 0.66 | % | 1.28 | % | |||||||||||||||||||||||||||
Return on average tangible common equity (1) | 2.81 | % | (0.53 | %) | 2.01 | % | 3.07 | % | 1.35 | % | 1.02 | % | 1.84 | % | |||||||||||||||||||||||||||
| Yield on loans | 8.41 | % | 8.37 | % | 8.48 | % | 8.85 | % | 9.10 | % | 8.39 | % | 9.10 | % | |||||||||||||||||||||||||||
| Cost of interest bearing deposits | 2.22 | % | 2.14 | % | 2.17 | % | 2.20 | % | 2.34 | % | 2.18 | % | 2.17 | % | |||||||||||||||||||||||||||
| Cost of total deposits | 1.25 | % | 1.23 | % | 1.22 | % | 1.23 | % | 1.39 | % | 1.24 | % | 1.28 | % | |||||||||||||||||||||||||||
| Cost of total funds | 1.53 | % | 1.45 | % | 1.41 | % | 1.57 | % | 1.62 | % | 1.49 | % | 1.54 | % | |||||||||||||||||||||||||||
| Net interest margin | 6.43 | % | 6.49 | % | 6.65 | % | 6.81 | % | 7.07 | % | 6.46 | % | 7.18 | % | |||||||||||||||||||||||||||
| Net noninterest expense to average assets | 5.13 | % | 5.61 | % | 5.17 | % | 5.29 | % | 5.67 | % | 5.36 | % | 5.64 | % | |||||||||||||||||||||||||||
Asset Quality:(2) | |||||||||||||||||||||||||||||||||||||||||
| Past due to total loans | 2.21 | % | 3.24 | % | 3.27 | % | 2.62 | % | 2.21 | % | 2.21 | % | 2.21 | % | |||||||||||||||||||||||||||
| Non-performing loans to total loans | 1.20 | % | 2.07 | % | 2.49 | % | 2.62 | % | 1.94 | % | 1.20 | % | 1.94 | % | |||||||||||||||||||||||||||
| Non-performing assets to total assets | 1.04 | % | 1.64 | % | 2.02 | % | 2.07 | % | 1.60 | % | 1.04 | % | 1.60 | % | |||||||||||||||||||||||||||
| ACL to non-performing loans | 65.02 | % | 37.47 | % | 35.93 | % | 36.28 | % | 47.48 | % | 65.02 | % | 47.48 | % | |||||||||||||||||||||||||||
| ACL to total loans | 0.78 | % | 0.78 | % | 0.90 | % | 0.95 | % | 0.92 | % | 0.78 | % | 0.92 | % | |||||||||||||||||||||||||||
| Net charge-offs to average loans | 0.17 | % | 0.13 | % | 0.11 | % | 0.08 | % | 0.06 | % | 0.30 | % | 0.11 | % | |||||||||||||||||||||||||||
| Capital: | |||||||||||||||||||||||||||||||||||||||||
Tier 1 capital to average assets(3) | 9.46 | % | 12.04 | % | 12.03 | % | 12.21 | % | 12.38 | % | 9.46 | % | 12.38 | % | |||||||||||||||||||||||||||
Tier 1 capital to risk-weighted assets(3) | 9.98 | % | 12.90 | % | 13.06 | % | 13.57 | % | 13.45 | % | 9.98 | % | 13.45 | % | |||||||||||||||||||||||||||
Common equity tier 1 capital to risk-weighted assets(3) | 8.43 | % | 11.27 | % | 11.40 | % | 11.85 | % | 11.71 | % | 8.43 | % | 11.71 | % | |||||||||||||||||||||||||||
| Total capital to risk-weighted assets | 11.95 | % | 14.93 | % | 15.23 | % | 16.62 | % | 16.51 | % | 11.95 | % | 16.51 | % | |||||||||||||||||||||||||||
| Total equity to total assets | 14.05 | % | 14.26 | % | 14.98 | % | 15.10 | % | 15.12 | % | 14.05 | % | 15.12 | % | |||||||||||||||||||||||||||
Tangible common stockholders' equity to tangible assets(1) | 7.53 | % | 9.86 | % | 10.33 | % | 10.50 | % | 10.39 | % | 7.53 | % | 10.39 | % | |||||||||||||||||||||||||||
| Per Share Amounts: | |||||||||||||||||||||||||||||||||||||||||
| Book value per share | $ | 36.56 | $ | 36.25 | $ | 36.16 | $ | 35.95 | $ | 35.51 | $ | 36.56 | $ | 35.51 | |||||||||||||||||||||||||||
Tangible book value per share (1) | $ | 19.31 | $ | 25.32 | $ | 25.13 | $ | 25.22 | $ | 24.60 | $ | 19.31 | $ | 24.60 | |||||||||||||||||||||||||||
| Basic earnings per common share | $ | 0.15 | $ | (0.03) | $ | 0.13 | $ | 0.19 | $ | 0.08 | $ | 0.12 | $ | 0.23 | |||||||||||||||||||||||||||
| Diluted earnings per common share | $ | 0.15 | $ | (0.03) | $ | 0.13 | $ | 0.19 | $ | 0.08 | $ | 0.12 | $ | 0.22 | |||||||||||||||||||||||||||
| Shares outstanding end of period | 23,727,046 | 23,419,740 | 23,391,411 | 23,387,522 | 23,353,519 | 23,727,046 | 23,353,519 | ||||||||||||||||||||||||||||||||||
17
Unaudited consolidated balance sheet as of:
| (Dollars in thousands) | June 30, 2025 | March 31, 2025 | December 31, 2024 | September 30, 2024 | June 30, 2024 | ||||||||||||||||||||||||
| ASSETS | |||||||||||||||||||||||||||||
| Total cash and cash equivalents | $ | 282,346 | $ | 502,944 | $ | 330,117 | $ | 489,280 | $ | 500,663 | |||||||||||||||||||
| Securities - available for sale | 392,275 | 411,925 | 381,561 | 403,186 | 339,661 | ||||||||||||||||||||||||
| Securities - held to maturity, net | 1,782 | 1,731 | 1,876 | 2,121 | 2,787 | ||||||||||||||||||||||||
| Equity securities with readily determinable fair value | 4,526 | 4,512 | 4,445 | 4,583 | 4,422 | ||||||||||||||||||||||||
| Loans held for sale | 6,066 | 2,950 | 1,172 | 26 | 1,051 | ||||||||||||||||||||||||
| Loans held for investment | 4,953,170 | 4,666,223 | 4,546,960 | 4,332,967 | 4,288,417 | ||||||||||||||||||||||||
| Allowance for credit losses | (38,691) | (36,229) | (40,714) | (41,243) | (39,591) | ||||||||||||||||||||||||
| Loans, net | 4,914,479 | 4,629,994 | 4,506,246 | 4,291,724 | 4,248,826 | ||||||||||||||||||||||||
| FHLB and other restricted stock | 13,339 | 12,987 | 14,054 | 7,112 | 14,040 | ||||||||||||||||||||||||
| Premises and equipment, net | 149,120 | 150,247 | 160,737 | 156,462 | 159,588 | ||||||||||||||||||||||||
| Capitalized software, net | 43,011 | 40,869 | 37,971 | 34,481 | 30,582 | ||||||||||||||||||||||||
| Goodwill | 353,900 | 241,949 | 241,949 | 233,709 | 233,709 | ||||||||||||||||||||||||
| Intangible assets, net | 55,265 | 13,963 | 16,259 | 17,316 | 20,943 | ||||||||||||||||||||||||
| Bank-owned life insurance | 63,787 | 63,200 | 62,690 | 42,381 | 42,225 | ||||||||||||||||||||||||
| Deferred tax asset, net | 3,023 | 11,868 | 13,581 | 10,667 | 6,641 | ||||||||||||||||||||||||
| Other assets | 211,829 | 179,255 | 176,317 | 172,998 | 178,196 | ||||||||||||||||||||||||
| Total assets | $ | 6,494,748 | $ | 6,268,394 | $ | 5,948,975 | $ | 5,866,046 | $ | 5,783,334 | |||||||||||||||||||
| LIABILITIES | |||||||||||||||||||||||||||||
| Noninterest bearing deposits | $ | 2,285,327 | $ | 2,260,048 | $ | 1,964,457 | $ | 2,103,092 | $ | 1,689,531 | |||||||||||||||||||
| Interest bearing deposits | 2,900,771 | 2,716,702 | 2,856,363 | 2,603,602 | 2,702,487 | ||||||||||||||||||||||||
| Total deposits | 5,186,098 | 4,976,750 | 4,820,820 | 4,706,694 | 4,392,018 | ||||||||||||||||||||||||
| Federal Home Loan Bank advances | 180,000 | 205,000 | 30,000 | 30,000 | 280,000 | ||||||||||||||||||||||||
| Subordinated notes | 69,780 | 69,732 | 69,662 | 109,072 | 108,939 | ||||||||||||||||||||||||
| Junior subordinated debentures | 42,666 | 42,507 | 42,352 | 42,196 | 42,042 | ||||||||||||||||||||||||
| Other liabilities | 103,822 | 80,478 | 95,222 | 92,320 | 86,086 | ||||||||||||||||||||||||
| Total liabilities | 5,582,366 | 5,374,467 | 5,058,056 | 4,980,282 | 4,909,085 | ||||||||||||||||||||||||
| EQUITY | |||||||||||||||||||||||||||||
| Preferred Stock | 45,000 | 45,000 | 45,000 | 45,000 | 45,000 | ||||||||||||||||||||||||
| Common stock | 295 | 292 | 291 | 291 | 291 | ||||||||||||||||||||||||
| Additional paid-in-capital | 588,302 | 572,143 | 567,884 | 564,464 | 559,072 | ||||||||||||||||||||||||
| Treasury stock, at cost | (270,619) | (268,520) | (268,356) | (268,352) | (268,352) | ||||||||||||||||||||||||
| Retained earnings | 552,049 | 548,431 | 549,215 | 546,179 | 541,633 | ||||||||||||||||||||||||
| Accumulated other comprehensive income (loss) | (2,645) | (3,419) | (3,115) | (1,818) | (3,395) | ||||||||||||||||||||||||
| Total stockholders' equity | 912,382 | 893,927 | 890,919 | 885,764 | 874,249 | ||||||||||||||||||||||||
| Total liabilities and equity | $ | 6,494,748 | $ | 6,268,394 | $ | 5,948,975 | $ | 5,866,046 | $ | 5,783,334 | |||||||||||||||||||
18
Unaudited consolidated statement of income:
| For the Three Months Ended | For the Six Months Ended | ||||||||||||||||||||||||||||||||||||||||
| (Dollars in thousands) | June 30, 2025 | March 31, 2025 | December 31, 2024 | September 30, 2024 | June 30, 2024 | June 30, 2025 | June 30, 2024 | ||||||||||||||||||||||||||||||||||
| Interest income: | |||||||||||||||||||||||||||||||||||||||||
| Loans, including fees | $ | 54,836 | $ | 53,576 | $ | 52,493 | $ | 52,886 | $ | 54,900 | $ | 108,412 | $ | 108,452 | |||||||||||||||||||||||||||
| Factored receivables, including fees | 44,217 | 38,694 | 41,351 | 40,598 | 40,028 | 82,911 | 77,937 | ||||||||||||||||||||||||||||||||||
| Securities | 5,721 | 5,308 | 6,182 | 6,500 | 5,523 | 11,029 | 10,874 | ||||||||||||||||||||||||||||||||||
| FHLB and other restricted stock | 246 | 249 | 153 | 379 | 234 | 495 | 466 | ||||||||||||||||||||||||||||||||||
| Cash deposits | 4,181 | 4,443 | 5,299 | 7,712 | 6,330 | 8,624 | 11,233 | ||||||||||||||||||||||||||||||||||
| Total interest income | 109,201 | 102,270 | 105,478 | 108,075 | 107,015 | 211,471 | 208,962 | ||||||||||||||||||||||||||||||||||
| Interest expense: | |||||||||||||||||||||||||||||||||||||||||
| Deposits | 15,505 | 14,397 | 14,522 | 14,041 | 15,520 | 29,902 | 27,672 | ||||||||||||||||||||||||||||||||||
| Subordinated notes | 661 | 682 | 1,024 | 1,227 | 1,225 | 1,343 | 2,449 | ||||||||||||||||||||||||||||||||||
| Junior subordinated debentures | 1,035 | 994 | 1,129 | 1,172 | 1,162 | 2,029 | 2,346 | ||||||||||||||||||||||||||||||||||
| Other borrowings | 3,322 | 1,814 | 996 | 2,936 | 1,193 | 5,136 | 2,545 | ||||||||||||||||||||||||||||||||||
| Total interest expense | 20,523 | 17,887 | 17,671 | 19,376 | 19,100 | 38,410 | 35,012 | ||||||||||||||||||||||||||||||||||
| Net interest income | 88,678 | 84,383 | 87,807 | 88,699 | 87,915 | 173,061 | 173,950 | ||||||||||||||||||||||||||||||||||
| Credit loss expense (benefit) | (702) | 1,330 | 4,453 | 4,263 | 4,155 | 628 | 10,051 | ||||||||||||||||||||||||||||||||||
| Net interest income after credit loss expense (benefit) | 89,380 | 83,053 | 83,354 | 84,436 | 83,760 | 172,433 | 163,899 | ||||||||||||||||||||||||||||||||||
| Noninterest income: | |||||||||||||||||||||||||||||||||||||||||
| Service charges on deposits | 1,742 | 1,596 | 1,682 | 1,865 | 1,810 | 3,338 | 3,537 | ||||||||||||||||||||||||||||||||||
| Card income | 1,922 | 1,797 | 1,948 | 2,135 | 2,085 | 3,719 | 3,953 | ||||||||||||||||||||||||||||||||||
| Net gains (losses) on sale of securities | — | — | (1) | — | — | — | — | ||||||||||||||||||||||||||||||||||
| Net gains (losses) on sale of loans | 190 | 134 | (6) | 253 | 123 | 324 | (69) | ||||||||||||||||||||||||||||||||||
| Fee income | 12,755 | 9,114 | 9,048 | 9,129 | 8,517 | 21,869 | 17,200 | ||||||||||||||||||||||||||||||||||
| Insurance commissions | 1,282 | 1,250 | 1,338 | 1,472 | 1,505 | 2,532 | 3,073 | ||||||||||||||||||||||||||||||||||
| Other | 1,493 | 3,299 | 1,742 | 2,643 | 3,127 | 4,792 | 4,472 | ||||||||||||||||||||||||||||||||||
| Total noninterest income | 19,384 | 17,190 | 15,751 | 17,497 | 17,167 | 36,574 | 32,166 | ||||||||||||||||||||||||||||||||||
| Noninterest expense: | |||||||||||||||||||||||||||||||||||||||||
| Salaries and employee benefits | 59,882 | 58,718 | 53,943 | 55,447 | 56,005 | 118,600 | 110,190 | ||||||||||||||||||||||||||||||||||
| Occupancy, furniture and equipment | 8,139 | 8,442 | 8,112 | 8,701 | 8,565 | 16,581 | 16,201 | ||||||||||||||||||||||||||||||||||
| FDIC insurance and other regulatory assessments | 894 | 727 | 744 | 679 | 641 | 1,621 | 1,294 | ||||||||||||||||||||||||||||||||||
| Professional fees | (320) | 6,064 | 5,006 | 4,734 | 4,558 | 5,744 | 8,099 | ||||||||||||||||||||||||||||||||||
| Amortization of intangible assets | 3,400 | 2,400 | 2,799 | 3,600 | 2,869 | 5,800 | 5,593 | ||||||||||||||||||||||||||||||||||
| Advertising and promotion | 1,838 | 1,464 | 1,545 | 1,416 | 2,008 | 3,302 | 3,222 | ||||||||||||||||||||||||||||||||||
| Communications and technology | 12,315 | 12,244 | 12,299 | 12,422 | 14,307 | 24,559 | 26,201 | ||||||||||||||||||||||||||||||||||
| Software amortization | 2,865 | 1,992 | 1,831 | 1,484 | 1,357 | 4,857 | 2,531 | ||||||||||||||||||||||||||||||||||
| Travel and entertainment | 1,619 | 1,492 | 975 | 1,431 | 1,513 | 3,111 | 3,022 | ||||||||||||||||||||||||||||||||||
| Other | 10,208 | 6,630 | 6,021 | 5,732 | 5,520 | 16,838 | 11,361 | ||||||||||||||||||||||||||||||||||
| Total noninterest expense | 100,840 | 100,173 | 93,275 | 95,646 | 97,343 | 201,013 | 187,714 | ||||||||||||||||||||||||||||||||||
| Net income before income tax | 7,924 | 70 | 5,830 | 6,287 | 3,584 | 7,994 | 8,351 | ||||||||||||||||||||||||||||||||||
| Income tax expense | 3,504 | 53 | 1,992 | 940 | 837 | 3,557 | 1,446 | ||||||||||||||||||||||||||||||||||
| Net income | $ | 4,420 | $ | 17 | $ | 3,838 | $ | 5,347 | $ | 2,747 | $ | 4,437 | $ | 6,905 | |||||||||||||||||||||||||||
| Dividends on preferred stock | (802) | (801) | (802) | (801) | (802) | (1,603) | (1,603) | ||||||||||||||||||||||||||||||||||
| Net income available to common stockholders | $ | 3,618 | $ | (784) | $ | 3,036 | $ | 4,546 | $ | 1,945 | $ | 2,834 | $ | 5,302 | |||||||||||||||||||||||||||
19
Earnings per share:
| For the Three Months Ended | For the Six Months Ended | ||||||||||||||||||||||||||||||||||||||||
| (Dollars in thousands) | June 30, 2025 | March 31, 2025 | December 31, 2024 | September 30, 2024 | June 30, 2024 | June 30, 2025 | June 30, 2024 | ||||||||||||||||||||||||||||||||||
| Basic | |||||||||||||||||||||||||||||||||||||||||
| Net income (loss) to common stockholders | $ | 3,618 | $ | (784) | $ | 3,036 | $ | 4,546 | $ | 1,945 | $ | 2,834 | $ | 5,302 | |||||||||||||||||||||||||||
| Weighted average common shares outstanding | 23,590,119 | 23,362,400 | 23,339,651 | 23,330,635 | 23,274,089 | 23,476,888 | 23,237,674 | ||||||||||||||||||||||||||||||||||
| Basic earnings (loss) per common share | $ | 0.15 | $ | (0.03) | $ | 0.13 | $ | 0.19 | $ | 0.08 | $ | 0.12 | $ | 0.23 | |||||||||||||||||||||||||||
| Diluted | |||||||||||||||||||||||||||||||||||||||||
| Net income (loss) to common stockholders - diluted | $ | 3,618 | $ | (784) | $ | 3,036 | $ | 4,546 | $ | 1,945 | $ | 2,834 | $ | 5,302 | |||||||||||||||||||||||||||
| Weighted average common shares outstanding | 23,590,119 | 23,362,400 | 23,339,651 | 23,330,635 | 23,274,089 | 23,476,888 | 23,237,674 | ||||||||||||||||||||||||||||||||||
| Dilutive effects of: | |||||||||||||||||||||||||||||||||||||||||
| Assumed exercises of stock options | 54,952 | — | 106,713 | 95,472 | 86,645 | 67,878 | 86,905 | ||||||||||||||||||||||||||||||||||
| Restricted stock awards | 16,097 | — | 43,875 | 40,259 | 60,614 | 30,785 | 81,499 | ||||||||||||||||||||||||||||||||||
| Restricted stock units | 89,156 | — | 153,326 | 130,331 | 118,919 | 124,984 | 128,243 | ||||||||||||||||||||||||||||||||||
| Performance stock units - market based | 17,704 | — | 223,173 | 128,157 | 121,907 | 23,171 | 120,176 | ||||||||||||||||||||||||||||||||||
| Employee stock purchase plan | 4,627 | — | 2,711 | 470 | 2,931 | 4,299 | 2,426 | ||||||||||||||||||||||||||||||||||
| Weighted average shares outstanding - diluted | 23,772,655 | 23,362,400 | 23,869,449 | 23,725,324 | 23,665,105 | 23,728,005 | 23,656,923 | ||||||||||||||||||||||||||||||||||
| Diluted earnings (loss) per common share | $ | 0.15 | $ | (0.03) | $ | 0.13 | $ | 0.19 | $ | 0.08 | $ | 0.12 | $ | 0.22 | |||||||||||||||||||||||||||
Shares that were not considered in computing diluted earnings per common share because they were antidilutive or have not met the thresholds to be considered in the dilutive calculation are as follows:
| For the Three Months Ended | For the Six Months Ended | ||||||||||||||||||||||||||||||||||||||||
| June 30, 2025 | March 31, 2025 | December 31, 2024 | September 30, 2024 | June 30, 2024 | June 30, 2025 | June 30, 2024 | |||||||||||||||||||||||||||||||||||
| Stock options | 199,859 | 253,629 | 43,582 | 64,315 | 77,520 | 122,151 | 61,644 | ||||||||||||||||||||||||||||||||||
| Restricted stock awards | — | 48,076 | — | — | — | — | — | ||||||||||||||||||||||||||||||||||
| Restricted stock units | 5,171 | 203,812 | — | 7,500 | 7,500 | 3,750 | 7,500 | ||||||||||||||||||||||||||||||||||
| Performance stock units - market based | 56,311 | 82,020 | 23,476 | — | 55,677 | 28,313 | 27,836 | ||||||||||||||||||||||||||||||||||
| Employee stock purchase plan | — | — | — | — | — | — | — | ||||||||||||||||||||||||||||||||||
20
Loans held for investment summarized as of:
| (Dollars in thousands) | June 30, 2025 | March 31, 2025 | December 31, 2024 | September 30, 2024 | June 30, 2024 | ||||||||||||||||||||||||
| Commercial real estate | $ | 754,509 | $ | 811,244 | $ | 777,689 | $ | 762,343 | $ | 842,342 | |||||||||||||||||||
| Construction, land development, land | 221,419 | 204,021 | 203,804 | 217,148 | 216,531 | ||||||||||||||||||||||||
| 1-4 family residential properties | 172,312 | 159,105 | 154,020 | 126,103 | 128,508 | ||||||||||||||||||||||||
| Farmland | 44,069 | 47,311 | 56,366 | 57,621 | 58,495 | ||||||||||||||||||||||||
| Commercial | 1,132,269 | 1,121,740 | 1,119,245 | 1,093,477 | 1,092,280 | ||||||||||||||||||||||||
| Factored receivables | 1,401,377 | 1,350,656 | 1,204,510 | 1,201,495 | 1,207,480 | ||||||||||||||||||||||||
| Consumer | 17,520 | 7,088 | 8,000 | 6,990 | 7,596 | ||||||||||||||||||||||||
| Mortgage warehouse | 1,209,695 | 965,058 | 1,023,326 | 867,790 | 735,185 | ||||||||||||||||||||||||
| Total loans | $ | 4,953,170 | $ | 4,666,223 | $ | 4,546,960 | $ | 4,332,967 | $ | 4,288,417 | |||||||||||||||||||
Our banking loan portfolio consists of traditional community bank loans as well as commercial finance product lines focused on businesses that require specialized financial solutions and national lending product lines that further diversify our lending operations.
Banking loans held for investment are further summarized below:
| (Dollars in thousands) | June 30, 2025 | March 31, 2025 | December 31, 2024 | September 30, 2024 | June 30, 2024 | ||||||||||||||||||||||||
| Commercial real estate | $ | 754,509 | $ | 811,244 | $ | 777,689 | $ | 762,343 | $ | 842,342 | |||||||||||||||||||
| Construction, land development, land | 221,419 | 204,021 | 203,804 | 217,148 | 216,531 | ||||||||||||||||||||||||
| 1-4 family residential | 172,312 | 159,105 | 154,020 | 126,103 | 128,508 | ||||||||||||||||||||||||
| Farmland | 44,069 | 47,311 | 56,366 | 57,621 | 58,495 | ||||||||||||||||||||||||
| Commercial - General | 298,653 | 274,697 | 285,469 | 284,989 | 294,670 | ||||||||||||||||||||||||
| Commercial - Agriculture | 48,107 | 49,529 | 49,365 | 52,997 | 50,604 | ||||||||||||||||||||||||
| Commercial - Equipment | 543,062 | 529,359 | 511,855 | 488,326 | 468,661 | ||||||||||||||||||||||||
| Commercial - Asset-based lending | 192,793 | 214,000 | 205,353 | 205,476 | 203,634 | ||||||||||||||||||||||||
| Commercial - Liquid Credit | 47,061 | 53,075 | 65,053 | 59,539 | 74,711 | ||||||||||||||||||||||||
| Consumer | 17,520 | 7,088 | 8,000 | 6,990 | 7,596 | ||||||||||||||||||||||||
| Mortgage Warehouse | 1,209,695 | 965,058 | 1,023,326 | 867,790 | 735,185 | ||||||||||||||||||||||||
| Total banking loans held for investment | $ | 3,549,200 | $ | 3,314,487 | $ | 3,340,300 | $ | 3,129,322 | $ | 3,080,937 | |||||||||||||||||||
The following table presents the Company’s operating segments:
21
| (Dollars in thousands) | Total | Corporate | ||||||||||||||||||||||||||||||||||||||||||
| Three Months Ended June 30, 2025 | Banking | Factoring | Payments | Intelligence | Segments | and Other(1) | Consolidated | |||||||||||||||||||||||||||||||||||||
| Total interest income | $ | 64,851 | $ | 38,040 | $ | 6,230 | $ | — | $ | 109,121 | $ | 80 | $ | 109,201 | ||||||||||||||||||||||||||||||
| Intersegment interest allocations | 6,386 | (9,282) | 2,896 | — | — | — | — | |||||||||||||||||||||||||||||||||||||
| Total interest expense | 18,825 | 2 | — | — | 18,827 | 1,696 | 20,523 | |||||||||||||||||||||||||||||||||||||
| Net interest income (expense) | 52,412 | 28,756 | 9,126 | — | 90,294 | (1,616) | 88,678 | |||||||||||||||||||||||||||||||||||||
| Credit loss expense (benefit) | 2,219 | (2,916) | 92 | — | (605) | (97) | (702) | |||||||||||||||||||||||||||||||||||||
| Net interest income after credit loss expense | 50,193 | 31,672 | 9,034 | — | 90,899 | (1,519) | 89,380 | |||||||||||||||||||||||||||||||||||||
| Noninterest income | 7,989 | 1,811 | 7,724 | 1,724 | 19,248 | 136 | 19,384 | |||||||||||||||||||||||||||||||||||||
| Noninterest expense: | ||||||||||||||||||||||||||||||||||||||||||||
| Salaries and employee benefits | 16,001 | 13,444 | 8,711 | 3,234 | 41,390 | 18,492 | 59,882 | |||||||||||||||||||||||||||||||||||||
| Depreciation | 1,656 | 468 | 222 | 7 | 2,353 | 1,602 | 3,955 | |||||||||||||||||||||||||||||||||||||
| Other occupancy, furniture and equipment | 1,896 | 508 | 163 | 14 | 2,581 | 1,603 | 4,184 | |||||||||||||||||||||||||||||||||||||
| FDIC insurance and other regulatory assessments | 894 | — | — | — | 894 | — | 894 | |||||||||||||||||||||||||||||||||||||
| Professional fees | 1,801 | (7,272) | 240 | 2,995 | (2,236) | 1,916 | (320) | |||||||||||||||||||||||||||||||||||||
| Amortization of intangible assets | 385 | 193 | 1,418 | 946 | 2,942 | 458 | 3,400 | |||||||||||||||||||||||||||||||||||||
| Advertising and promotion | 557 | 223 | 669 | 22 | 1,471 | 367 | 1,838 | |||||||||||||||||||||||||||||||||||||
| Communications and technology | 5,257 | 2,438 | 2,455 | 278 | 10,428 | 1,887 | 12,315 | |||||||||||||||||||||||||||||||||||||
| Software amortization | — | 1,125 | 1,413 | — | 2,538 | 327 | 2,865 | |||||||||||||||||||||||||||||||||||||
| Travel and entertainment | 306 | 245 | 456 | 130 | 1,137 | 482 | 1,619 | |||||||||||||||||||||||||||||||||||||
| Other | 3,210 | 2,770 | 1,097 | 84 | 7,161 | 3,047 | 10,208 | |||||||||||||||||||||||||||||||||||||
| Total noninterest expense | 31,963 | 14,142 | 16,844 | 7,710 | 70,659 | 30,181 | 100,840 | |||||||||||||||||||||||||||||||||||||
Net intersegment noninterest income (expense)(2) | 155 | 413 | (568) | — | — | — | — | |||||||||||||||||||||||||||||||||||||
| Operating income (loss) | $ | 26,374 | $ | 19,754 | $ | (654) | $ | (5,986) | $ | 39,488 | $ | (31,564) | $ | 7,924 | ||||||||||||||||||||||||||||||
22
| (Dollars in thousands) | Total | Corporate | ||||||||||||||||||||||||||||||||||||||||||
| Three Months Ended March 31, 2025 | Banking | Factoring | Payments | Intelligence | Segments | and Other(1) | Consolidated | |||||||||||||||||||||||||||||||||||||
| Total interest income | $ | 63,493 | $ | 33,331 | $ | 5,363 | $ | — | $ | 102,187 | $ | 83 | $ | 102,270 | ||||||||||||||||||||||||||||||
| Intersegment interest allocations | 4,735 | (7,653) | 2,918 | — | — | — | — | |||||||||||||||||||||||||||||||||||||
| Total interest expense | 16,211 | — | — | — | 16,211 | 1,676 | 17,887 | |||||||||||||||||||||||||||||||||||||
| Net interest income (expense) | 52,017 | 25,678 | 8,281 | — | 85,976 | (1,593) | 84,383 | |||||||||||||||||||||||||||||||||||||
| Credit loss expense (benefit) | 507 | 560 | 118 | — | 1,185 | 145 | 1,330 | |||||||||||||||||||||||||||||||||||||
| Net interest income after credit loss expense | 51,510 | 25,118 | 8,163 | — | 84,791 | (1,738) | 83,053 | |||||||||||||||||||||||||||||||||||||
| Noninterest income | 7,003 | 1,719 | 6,531 | 395 | 15,648 | 1,542 | 17,190 | |||||||||||||||||||||||||||||||||||||
| Noninterest expense: | ||||||||||||||||||||||||||||||||||||||||||||
| Salaries and employee benefits | 16,317 | 13,222 | 9,613 | 1,484 | 40,636 | 18,082 | 58,718 | |||||||||||||||||||||||||||||||||||||
| Depreciation | 1,630 | 503 | 230 | 7 | 2,370 | 1,574 | 3,944 | |||||||||||||||||||||||||||||||||||||
| Other occupancy, furniture and equipment | 2,102 | 537 | 168 | 7 | 2,814 | 1,684 | 4,498 | |||||||||||||||||||||||||||||||||||||
| FDIC insurance and other regulatory assessments | 727 | — | — | — | 727 | — | 727 | |||||||||||||||||||||||||||||||||||||
| Professional fees | 1,065 | 1,852 | 206 | 951 | 4,074 | 1,990 | 6,064 | |||||||||||||||||||||||||||||||||||||
| Amortization of intangible assets | 385 | 193 | 1,551 | 116 | 2,245 | 155 | 2,400 | |||||||||||||||||||||||||||||||||||||
| Advertising and promotion | 511 | 254 | 381 | 30 | 1,176 | 288 | 1,464 | |||||||||||||||||||||||||||||||||||||
| Communications and technology | 5,015 | 2,274 | 2,469 | 227 | 9,985 | 2,259 | 12,244 | |||||||||||||||||||||||||||||||||||||
| Software amortization | 56 | 594 | 1,196 | 2 | 1,848 | 144 | 1,992 | |||||||||||||||||||||||||||||||||||||
| Travel and entertainment | 238 | 183 | 377 | 118 | 916 | 576 | 1,492 | |||||||||||||||||||||||||||||||||||||
| Other | 3,025 | 741 | 922 | 66 | 4,754 | 1,876 | 6,630 | |||||||||||||||||||||||||||||||||||||
| Total noninterest expense | 31,071 | 20,353 | 17,113 | 3,008 | 71,545 | 28,628 | 100,173 | |||||||||||||||||||||||||||||||||||||
Intersegment noninterest income (expense)(2) | 137 | 435 | (572) | — | — | — | — | |||||||||||||||||||||||||||||||||||||
| Operating income (loss) | $ | 27,579 | $ | 6,919 | $ | (2,991) | $ | (2,613) | $ | 28,894 | $ | (28,824) | $ | 70 | ||||||||||||||||||||||||||||||
(1) Includes revenue and expense from the Company’s holding company, which does not meet the definition of an operating segment. Also includes corporate shared service costs such as the majority of salaries and benefits expense for our executive leadership team, as well as other selling, general, and administrative shared services costs including human resources, accounting, finance, risk management and a significant amount of information technology expense.
(2) Intersegment noninterest income (expense) includes:
| (Dollars in thousands) | Banking | Factoring | Payments | |||||||||||||||||
| Three Months Ended June 30, 2025 | ||||||||||||||||||||
| Factoring revenue received from Payments | $ | — | $ | 910 | $ | (910) | ||||||||||||||
| Payments revenue received from Factoring | — | (381) | 381 | |||||||||||||||||
| Banking revenue received from Payments and Factoring | 155 | (116) | (39) | |||||||||||||||||
| Intersegment noninterest income (expense) | $ | 155 | $ | 413 | $ | (568) | ||||||||||||||
| Three Months Ended March 31, 2025 | ||||||||||||||||||||
| Factoring revenue received from Payments | $ | — | $ | 911 | $ | (911) | ||||||||||||||
| Payments revenue received from Factoring | — | (372) | 372 | |||||||||||||||||
| Banking revenue received from Payments and Factoring | 137 | (104) | (33) | |||||||||||||||||
| Intersegment noninterest income (expense) | $ | 137 | $ | 435 | $ | (572) | ||||||||||||||
23
Information pertaining to our Factoring segment, summarized as of and for the quarters ended:
| Factoring | June 30, 2025 | March 31, 2025 | December 31, 2024 | September 30, 2024 | June 30, 2024 | |||||||||||||||||||||||||||
| Factored receivable period end balance | $ | 1,174,830,000 | $ | 1,146,429,000 | $ | 1,032,842,000 | $ | 1,031,633,000 | $ | 1,035,159,000 | ||||||||||||||||||||||
| Commercial loans period end balance | $ | 2,593,000 | $ | 1,080,000 | $ | 2,150,000 | $ | 2,150,000 | $ | — | ||||||||||||||||||||||
Yield on average receivable balance(1) | 13.40 | % | 12.75 | % | 13.36 | % | 13.57 | % | 14.14 | % | ||||||||||||||||||||||
Current quarter charge-off rate(2) | (0.19 | %) | 0.11 | % | 0.26 | % | 0.07 | % | 0.15 | % | ||||||||||||||||||||||
| Factored receivables - transportation concentration | 96 | % | 97 | % | 97 | % | 97 | % | 97 | % | ||||||||||||||||||||||
| Interest income, including fees | $ | 38,040,000 | $ | 33,331,000 | $ | 35,754,000 | $ | 34,905,000 | $ | 34,307,000 | ||||||||||||||||||||||
| Noninterest income | 1,811,000 | 1,719,000 | 1,594,000 | 2,170,000 | 2,016,000 | |||||||||||||||||||||||||||
| Intersegment noninterest income | 910,000 | 911,000 | 864,000 | 864,000 | 750,000 | |||||||||||||||||||||||||||
| Factoring total revenue | 40,761,000 | 35,961,000 | 38,212,000 | 37,939,000 | 37,073,000 | |||||||||||||||||||||||||||
| Average net funds employed | 1,065,073,000 | 948,729,000 | 950,776,000 | 915,257,000 | 873,355,000 | |||||||||||||||||||||||||||
Yield on average net funds employed(1) | 15.35 | % | 15.37 | % | 15.99 | % | 16.49 | % | 17.07 | % | ||||||||||||||||||||||
| Operating income (loss) | $ | 19,754,000 | $ | 6,919,000 | $ | 9,046,000 | $ | 7,963,000 | $ | 4,627,000 | ||||||||||||||||||||||
| Factoring total revenue | $ | 40,761,000 | $ | 35,961,000 | $ | 38,212,000 | $ | 37,939,000 | $ | 37,073,000 | ||||||||||||||||||||||
Operating margin(1) | 48.46 | % | 19.24 | % | 23.67 | % | 20.99 | % | 12.48 | % | ||||||||||||||||||||||
| Accounts receivable purchased | $ | 2,873,659,000 | $ | 2,707,805,000 | $ | 2,747,351,000 | $ | 2,610,177,000 | $ | 2,542,327,000 | ||||||||||||||||||||||
| Number of invoices purchased | 1,697,851 | 1,497,644 | 1,524,904 | 1,480,824 | 1,432,366 | |||||||||||||||||||||||||||
| Average invoice size | $ | 1,693 | $ | 1,808 | $ | 1,802 | $ | 1,763 | $ | 1,775 | ||||||||||||||||||||||
| Average invoice size - transportation | $ | 1,663 | $ | 1,769 | $ | 1,767 | $ | 1,724 | $ | 1,738 | ||||||||||||||||||||||
| Average invoice size - non-transportation | $ | 3,638 | $ | 4,019 | $ | 4,867 | $ | 4,940 | $ | 4,561 | ||||||||||||||||||||||
(1)Operating margin is a non-GAAP financial measure used as a supplemental measure to evaluate the performance of our Factoring segment. For the three months ended June 30, 2025, operating income and factoring total revenue were impacted by $1.2 million of interest and fees resulting from the USPS Settlement and such settlement further impacted operating income by $7.4 million of legal expense accrual reversal and $3.8 million of recovery of factoring balances charged-off in a prior period. Operating income was also impacted by a $2.0 million legal settlement that was unrelated to the USPS Settlement. Such items had a 24.71% impact on operating margin, a 0.43% impact on yield on average receivables, and a 0.46% impact on yield on average net funds employed for the three months ended June 30, 2025.
(2)The current quarter charge-off rate for the three months ended June 30, 2025 reflects a $3.8 million recovery of factoring balances charged off in a prior period. Such recovery impacted the current quarter charge-off rate for that period by (0.33%).
24
Information pertaining to our Payments segment, summarized as of and for the quarters ended:
| Payments | June 30, 2025 | March 31, 2025 | December 31, 2024 | September 30, 2024 | June 30, 2024 | |||||||||||||||||||||||||||
| Supply chain financing factored receivables | $ | 152,054,000 | $ | 122,583,000 | $ | 107,300,000 | $ | 101,336,000 | $ | 95,163,000 | ||||||||||||||||||||||
| Quickpay and other factored receivables | 74,493,000 | 81,644,000 | 64,368,000 | 68,526,000 | 77,158,000 | |||||||||||||||||||||||||||
| Total factored receivable period end balance | $ | 226,547,000 | $ | 204,227,000 | $ | 171,668,000 | $ | 169,862,000 | $ | 172,321,000 | ||||||||||||||||||||||
| Total revenue | ||||||||||||||||||||||||||||||||
| Supply chain finance interest income | $ | 3,412,000 | $ | 2,695,000 | $ | 2,789,000 | $ | 2,897,000 | $ | 2,649,000 | ||||||||||||||||||||||
| Quickpay interest income | 2,818,000 | 2,668,000 | 2,808,000 | 2,796,000 | 3,072,000 | |||||||||||||||||||||||||||
| Intersegment interest income allocation | 2,896,000 | 2,918,000 | 2,730,000 | 2,569,000 | 2,010,000 | |||||||||||||||||||||||||||
| Total interest income | 9,126,000 | 8,281,000 | 8,327,000 | 8,262,000 | 7,731,000 | |||||||||||||||||||||||||||
| Broker noninterest income | 6,443,000 | 5,178,000 | 5,082,000 | 4,804,000 | 4,392,000 | |||||||||||||||||||||||||||
| Factor noninterest income | 993,000 | 1,233,000 | 1,346,000 | 1,339,000 | 1,296,000 | |||||||||||||||||||||||||||
| Other noninterest income | 288,000 | 120,000 | (80,000) | 179,000 | 179,000 | |||||||||||||||||||||||||||
| Intersegment noninterest income | 381,000 | 372,000 | 356,000 | 289,000 | 264,000 | |||||||||||||||||||||||||||
| Total noninterest income | 8,105,000 | 6,903,000 | 6,704,000 | 6,611,000 | 6,131,000 | |||||||||||||||||||||||||||
| $ | 17,231,000 | $ | 15,184,000 | $ | 15,031,000 | $ | 14,873,000 | $ | 13,862,000 | |||||||||||||||||||||||
| Total expense | ||||||||||||||||||||||||||||||||
| Credit loss expense (benefit) | $ | 92,000 | $ | 118,000 | $ | 2,000 | $ | (5,000) | $ | (9,000) | ||||||||||||||||||||||
| Noninterest expense | 16,844,000 | 17,113,000 | 15,820,000 | 16,598,000 | 17,070,000 | |||||||||||||||||||||||||||
| Intersegment noninterest expense | 949,000 | 944,000 | 895,000 | 893,000 | 774,000 | |||||||||||||||||||||||||||
| $ | 17,885,000 | $ | 18,175,000 | $ | 16,717,000 | $ | 17,486,000 | $ | 17,835,000 | |||||||||||||||||||||||
| Pre-tax operating income (loss) | $ | (654,000) | $ | (2,991,000) | $ | (1,686,000) | $ | (2,613,000) | $ | (3,973,000) | ||||||||||||||||||||||
| Depreciation expense | 222,000 | 230,000 | 243,000 | 253,000 | 263,000 | |||||||||||||||||||||||||||
| Software amortization expense | 1,413,000 | 1,196,000 | 1,049,000 | 743,000 | 580,000 | |||||||||||||||||||||||||||
| Intangible amortization expense | 1,418,000 | 1,551,000 | 1,687,000 | 1,687,000 | 1,687,000 | |||||||||||||||||||||||||||
Earnings (losses) before interest, taxes, depreciation, and amortization(1) | $ | 2,399,000 | $ | (14,000) | $ | 1,293,000 | $ | 70,000 | $ | (1,443,000) | ||||||||||||||||||||||
EBITDA Margin(1) | 13.9 | % | (0.1) | % | 8.6 | % | 0.5 | % | (10.4) | % | ||||||||||||||||||||||
| Number of invoices processed | 8,500,565 | 7,182,044 | 6,788,408 | 6,278,246 | 6,062,779 | |||||||||||||||||||||||||||
| Amount of payments processed | $10,081,206,000 | $8,777,825,000 | $7,625,735,000 | $7,091,493,000 | $6,687,587,000 | |||||||||||||||||||||||||||
| Network invoice volume | 1,004,603 | 719,531 | 567,258 | 661,628 | 701,768 | |||||||||||||||||||||||||||
| Network payment volume | $1,579,662,000 | $1,167,464,000 | $922,927,000 | $1,063,228,000 | $1,133,118,000 | |||||||||||||||||||||||||||
(1)Earnings (losses) before interest, taxes, depreciation, and amortization ("EBITDA") and EBITDA margin are non-GAAP financial measures used as supplemental measures to evaluate the performance of our Payments segment.
25
Deposits summarized as of:
| (Dollars in thousands) | June 30, 2025 | March 31, 2025 | December 31, 2024 | September 30, 2024 | June 30, 2024 | ||||||||||||||||||||||||
| Non-interest bearing demand | $ | 2,285,327 | $ | 2,260,048 | $ | 1,964,457 | $ | 2,103,092 | $ | 1,689,531 | |||||||||||||||||||
| Interest bearing demand | 694,005 | 731,477 | 697,949 | 700,928 | 847,387 | ||||||||||||||||||||||||
| Individual retirement accounts | 40,888 | 42,344 | 43,937 | 46,096 | 48,991 | ||||||||||||||||||||||||
| Money market | 565,781 | 610,120 | 629,610 | 606,321 | 592,667 | ||||||||||||||||||||||||
| Savings | 517,474 | 525,133 | 515,545 | 533,553 | 545,807 | ||||||||||||||||||||||||
| Certificates of deposit | 230,179 | 231,076 | 232,232 | 242,093 | 252,641 | ||||||||||||||||||||||||
| Brokered time deposits | 701,059 | 576,552 | 490,650 | 474,611 | 414,987 | ||||||||||||||||||||||||
| Other brokered deposits | 151,385 | — | 246,440 | — | 7 | ||||||||||||||||||||||||
| Total deposits | $ | 5,186,098 | $ | 4,976,750 | $ | 4,820,820 | $ | 4,706,694 | $ | 4,392,018 | |||||||||||||||||||
26
Net interest margin summarized for the three months ended:
| June 30, 2025 | March 31, 2025 | ||||||||||||||||||||||||||||||||||
| (Dollars in thousands) | Average Balance | Interest | Average Rate(4) | Average Balance | Interest | Average Rate(4) | |||||||||||||||||||||||||||||
| Interest earning assets: | |||||||||||||||||||||||||||||||||||
| Interest earning cash balances | $ | 377,775 | $ | 4,181 | 4.44 | % | $ | 402,655 | $ | 4,443 | 4.48 | % | |||||||||||||||||||||||
| Taxable securities | 409,277 | 5,705 | 5.59 | % | 379,049 | 5,292 | 5.66 | % | |||||||||||||||||||||||||||
| Tax-exempt securities | 2,535 | 16 | 2.53 | % | 2,548 | 16 | 2.55 | % | |||||||||||||||||||||||||||
| FHLB and other restricted stock | 17,687 | 246 | 5.58 | % | 13,958 | 249 | 7.23 | % | |||||||||||||||||||||||||||
Loans(1) | 4,725,240 | 99,053 | 8.41 | % | 4,471,710 | 92,270 | 8.37 | % | |||||||||||||||||||||||||||
| Total interest earning assets | $ | 5,532,514 | $ | 109,201 | 7.92 | % | $ | 5,269,920 | $ | 102,270 | 7.87 | % | |||||||||||||||||||||||
| Non-interest earning assets: | |||||||||||||||||||||||||||||||||||
| Other assets | 834,470 | 724,120 | |||||||||||||||||||||||||||||||||
| Total assets | $ | 6,366,984 | $ | 5,994,040 | |||||||||||||||||||||||||||||||
| Interest bearing liabilities: | |||||||||||||||||||||||||||||||||||
| Deposits: | |||||||||||||||||||||||||||||||||||
| Interest bearing demand | $ | 722,653 | $ | 916 | 0.51 | % | $ | 733,151 | $ | 856 | 0.47 | % | |||||||||||||||||||||||
| Individual retirement accounts | 41,694 | 131 | 1.26 | % | 43,112 | 134 | 1.26 | % | |||||||||||||||||||||||||||
| Money market | 586,420 | 3,931 | 2.69 | % | 611,244 | 3,880 | 2.57 | % | |||||||||||||||||||||||||||
| Savings | 519,067 | 1,354 | 1.05 | % | 518,690 | 1,367 | 1.07 | % | |||||||||||||||||||||||||||
| Certificates of deposit | 225,333 | 1,520 | 2.71 | % | 231,662 | 1,520 | 2.66 | % | |||||||||||||||||||||||||||
| Brokered time deposits | 614,168 | 6,618 | 4.32 | % | 569,200 | 6,419 | 4.57 | % | |||||||||||||||||||||||||||
| Other brokered deposits | 93,315 | 1,035 | 4.45 | % | 19,899 | 221 | 4.50 | % | |||||||||||||||||||||||||||
| Total interest bearing deposits | 2,802,650 | 15,505 | 2.22 | % | 2,726,958 | 14,397 | 2.14 | % | |||||||||||||||||||||||||||
| Federal Home Loan Bank advances | 298,132 | 3,322 | 4.47 | % | 164,167 | 1,814 | 4.48 | % | |||||||||||||||||||||||||||
| Subordinated notes | 69,749 | 661 | 3.80 | % | 69,693 | 682 | 3.97 | % | |||||||||||||||||||||||||||
| Junior subordinated debentures | 42,587 | 1,035 | 9.75 | % | 42,431 | 994 | 9.50 | % | |||||||||||||||||||||||||||
| Other borrowings | — | — | — | % | — | — | — | % | |||||||||||||||||||||||||||
| Total interest bearing liabilities | $ | 3,213,118 | $ | 20,523 | 2.56 | % | $ | 3,003,249 | $ | 17,887 | 2.42 | % | |||||||||||||||||||||||
| Noninterest bearing liabilities and equity: | |||||||||||||||||||||||||||||||||||
| Non-interest bearing demand deposits | 2,166,628 | 2,005,305 | |||||||||||||||||||||||||||||||||
| Other liabilities | 77,036 | 83,226 | |||||||||||||||||||||||||||||||||
| Total equity | 910,202 | 902,260 | |||||||||||||||||||||||||||||||||
| Total liabilities and equity | $ | 6,366,984 | $ | 5,994,040 | |||||||||||||||||||||||||||||||
| Net interest income | $ | 88,678 | $ | 84,383 | |||||||||||||||||||||||||||||||
Interest spread(2) | 5.36 | % | 5.45 | % | |||||||||||||||||||||||||||||||
Net interest margin(3) | 6.43 | % | 6.49 | % | |||||||||||||||||||||||||||||||
(1) Loan balance totals include respective nonaccrual assets.
(2) Net interest spread is the yield on average interest earning assets less the rate on interest bearing liabilities.
(3) Net interest margin is the ratio of net interest income to average interest earning assets.
(4) Average rates have been annualized.
27
Additional information pertaining to our loan portfolio, including loans held for investment and loans held for sale, summarized for the quarters ended:
| (Dollars in thousands) | June 30, 2025 | March 31, 2025 | December 31, 2024 | September 30, 2024 | June 30, 2024 | ||||||||||||||||||||||||
| Average Banking loans | $ | 3,381,919 | $ | 3,237,692 | $ | 3,163,999 | $ | 3,008,767 | $ | 3,035,612 | |||||||||||||||||||
| Average Factoring receivables | 1,138,792 | 1,060,482 | 1,064,772 | 1,023,570 | 976,087 | ||||||||||||||||||||||||
| Average Payments receivables | 204,529 | 173,536 | 175,218 | 167,969 | 183,970 | ||||||||||||||||||||||||
| Average total loans | $ | 4,725,240 | $ | 4,471,710 | $ | 4,403,989 | $ | 4,200,306 | $ | 4,195,669 | |||||||||||||||||||
| Banking yield | 6.50 | % | 6.71 | % | 6.60 | % | 6.99 | % | 7.27 | % | |||||||||||||||||||
| Factoring yield | 13.40 | % | 12.75 | % | 13.36 | % | 13.57 | % | 14.14 | % | |||||||||||||||||||
| Payments yield | 12.22 | % | 12.53 | % | 12.71 | % | 13.48 | % | 12.51 | % | |||||||||||||||||||
| Total loan yield | 8.41 | % | 8.37 | % | 8.48 | % | 8.85 | % | 9.10 | % | |||||||||||||||||||
Metrics and non-GAAP financial:
| As of and for the Three Months Ended | As of and for the Six Months Ended | |||||||||||||||||||||||||||||||||||||||||||
| (Dollars in thousands, except per share amounts) | June 30, 2025 | March 31, 2025 | December 31, 2024 | September 30, 2024 | June 30, 2024 | June 30, 2025 | June 30, 2024 | |||||||||||||||||||||||||||||||||||||
| Average total stockholders' equity | $ | 910,202 | $ | 902,260 | $ | 898,965 | $ | 888,435 | $ | 880,227 | $ | 906,253 | $ | 880,025 | ||||||||||||||||||||||||||||||
| Average preferred stock liquidation preference | (45,000) | (45,000) | (45,000) | (45,000) | (45,000) | (45,000) | (45,000) | |||||||||||||||||||||||||||||||||||||
| Average total common stockholders' equity | 865,202 | 857,260 | 853,965 | 843,435 | 835,227 | 861,253 | 835,025 | |||||||||||||||||||||||||||||||||||||
| Average goodwill and other intangibles | (347,894) | (257,399) | (253,415) | (253,656) | (256,552) | (302,896) | (256,327) | |||||||||||||||||||||||||||||||||||||
| Average tangible common stockholders' equity | $ | 517,308 | $ | 599,861 | $ | 600,550 | $ | 589,779 | $ | 578,675 | $ | 558,357 | $ | 578,698 | ||||||||||||||||||||||||||||||
| Net income available to common stockholders | $ | 3,618 | $ | (784) | $ | 3,036 | $ | 4,546 | $ | 1,945 | $ | 2,834 | $ | 5,302 | ||||||||||||||||||||||||||||||
| Average tangible common equity | 517,308 | 599,861 | 600,550 | 589,779 | 578,675 | 558,357 | 578,698 | |||||||||||||||||||||||||||||||||||||
| Return on average tangible common equity | 2.81 | % | (0.53 | %) | 2.01 | % | 3.07 | % | 1.35 | % | 1.02 | % | 1.84 | % | ||||||||||||||||||||||||||||||
| Net non-interest expense to average assets ratio: | ||||||||||||||||||||||||||||||||||||||||||||
| Noninterest expenses | $ | 100,840 | $ | 100,173 | $ | 93,275 | $ | 95,646 | $ | 97,343 | $ | 201,013 | $ | 187,714 | ||||||||||||||||||||||||||||||
| Noninterest income | $ | 19,384 | $ | 17,190 | $ | 15,751 | $ | 17,497 | $ | 17,167 | $ | 36,574 | $ | 32,166 | ||||||||||||||||||||||||||||||
| Net noninterest expenses | $ | 81,456 | $ | 82,983 | $ | 77,524 | $ | 78,149 | $ | 80,176 | $ | 164,439 | $ | 155,548 | ||||||||||||||||||||||||||||||
| Average total assets | $ | 6,366,984 | $ | 5,994,040 | $ | 5,966,161 | $ | 5,871,903 | $ | 5,690,767 | $ | 6,181,549 | $ | 5,545,063 | ||||||||||||||||||||||||||||||
| Net noninterest expense to average assets ratio | 5.13 | % | 5.61 | % | 5.17 | % | 5.29 | % | 5.67 | % | 5.36 | % | 5.64 | % | ||||||||||||||||||||||||||||||
| Total stockholders' equity | $ | 912,382 | $ | 893,927 | $ | 890,919 | $ | 885,764 | $ | 874,249 | $ | 912,382 | $ | 874,249 | ||||||||||||||||||||||||||||||
| Preferred stock liquidation preference | (45,000) | (45,000) | (45,000) | (45,000) | (45,000) | (45,000) | (45,000) | |||||||||||||||||||||||||||||||||||||
| Total common stockholders' equity | 867,382 | 848,927 | 845,919 | 840,764 | 829,249 | 867,382 | 829,249 | |||||||||||||||||||||||||||||||||||||
| Goodwill and other intangibles | (409,165) | (255,912) | (258,208) | (251,025) | (254,652) | (409,165) | (254,652) | |||||||||||||||||||||||||||||||||||||
| Tangible common stockholders' equity | $ | 458,217 | $ | 593,015 | $ | 587,711 | $ | 589,739 | $ | 574,597 | $ | 458,217 | $ | 574,597 | ||||||||||||||||||||||||||||||
| Common shares outstanding | 23,727,046 | 23,419,740 | 23,391,411 | 23,387,522 | 23,353,519 | 23,727,046 | 23,353,519 | |||||||||||||||||||||||||||||||||||||
| Tangible book value per share | $ | 19.31 | $ | 25.32 | $ | 25.13 | $ | 25.22 | $ | 24.60 | $ | 19.31 | $ | 24.60 | ||||||||||||||||||||||||||||||
| Total assets at end of period | $ | 6,494,748 | $ | 6,268,394 | $ | 5,948,975 | $ | 5,866,046 | $ | 5,783,334 | $ | 6,494,748 | $ | 5,783,334 | ||||||||||||||||||||||||||||||
| Goodwill and other intangibles | (409,165) | (255,912) | (258,208) | (251,025) | (254,652) | (409,165) | (254,652) | |||||||||||||||||||||||||||||||||||||
| Tangible assets at period end | $ | 6,085,583 | $ | 6,012,482 | $ | 5,690,767 | $ | 5,615,021 | $ | 5,528,682 | $ | 6,085,583 | $ | 5,528,682 | ||||||||||||||||||||||||||||||
| Tangible common stockholders' equity ratio | 7.53 | % | 9.86 | % | 10.33 | % | 10.50 | % | 10.39 | % | 7.53 | % | 10.39 | % | ||||||||||||||||||||||||||||||
1)Triumph Financial uses certain non-GAAP financial measures to provide meaningful supplemental information regarding Triumph Financial's operational performance and to enhance investors' overall understanding of such financial performance. The non-GAAP measures used by Triumph Financial include the following:
•"Tangible common stockholders' equity" is defined as common stockholders' equity less goodwill and other intangible assets.
•"Total tangible assets" is defined as total assets less goodwill and other intangible assets.
28
•"Tangible book value per share" is defined as tangible common stockholders' equity divided by total common shares outstanding. This measure is important to investors interested in changes from period-to-period in book value per share exclusive of changes in intangible assets.
•"Tangible common stockholders' equity ratio" is defined as the ratio of tangible common stockholders' equity divided by total tangible assets. We believe that this measure is important to many investors in the marketplace who are interested in relative changes from period-to period in common equity and total assets, each exclusive of changes in intangible assets.
•"Return on Average Tangible Common Equity" is defined as net income available to common stockholders divided by average tangible common stockholders' equity.
2)Asset quality ratios exclude loans held for sale, except for non-performing assets to total assets.
3)Current quarter ratios are preliminary.
Source: Triumph Financial, Inc.
###
Investor Relations:
Luke Wyse
Executive Vice President, Head of Investor Relations
214-365-6936
Media Contact:
Amanda Tavackoli
Senior Vice President, Director of Corporate Communication
214-365-6930
29
Investor Deck July 2025 WELCOME TO TRIUMPH NASDAQ: TFIN
2 Safe Harbor Statement Forward-Looking Statements This presentation contains forward-looking statements. Any statements about our expectations, beliefs, plans, predictions, forecasts, objectives, assumptions or future events or performance are not historical facts and may be forward-looking. You can identify forward-looking statements by the use of forward-looking terminology such as “believes,” “expects,” “could,” “may,” “will,” “should,” “seeks,” “likely,” “intends,” “plans,” “pro forma,” “projects,” “estimates” or “anticipates” or the negative of these words and phrases or similar words or phrases that are predictions of or indicate future events or trends and that do not relate solely to historical matters. You can also identify forward-looking statements by discussions of strategy, plans or intentions. Forward-looking statements involve numerous risks and uncertainties and you should not rely on them as predictions of future events. Forward-looking statements depend on assumptions, data or methods that may be incorrect or imprecise and we may not be able to realize them. We do not guarantee that the transactions and events described will happen as described (or that they will happen at all). The following factors, among others, could cause actual results and future events to differ materially from those set forth or contemplated in the forward-looking statements: business and economic conditions generally and in the bank and non-bank financial services industries, nationally and within our local market areas; our ability to mitigate our risk exposures; our ability to maintain our historical earnings trends; changes in management personnel; interest rate risk; concentration of our products and services in the transportation industry; credit risk associated with our loan portfolio; lack of seasoning in our loan portfolio; deteriorating asset quality and higher loan charge-offs; time and effort necessary to resolve nonperforming assets; inaccuracy of the assumptions and estimates we make in establishing reserves for probable loan losses and other estimates; risks related to the integration of acquired businesses and any future acquisitions; our ability to successfully identify and address the risks associated with our possible future acquisitions, and the risks that our prior and possible future acquisitions make it more difficult for investors to evaluate our business, financial condition and results of operations, and impairs our ability to accurately forecast our future performance; lack of liquidity; fluctuations in the fair value and liquidity of the securities we hold for sale; impairment of investment securities, goodwill, other intangible assets or deferred tax assets; our risk management strategies; environmental liability associated with our lending activities; increased competition in the bank and non-bank financial services industries, nationally, regionally or locally, which may adversely affect pricing and terms; the accuracy of our financial statements and related disclosures; material weaknesses in our internal control over financial reporting; system failures or failures to prevent breaches of our network security; the institution and outcome of litigation and other legal proceedings against us or to which we become subject; changes in carry-forwards of net operating losses; changes in federal tax law or policy; the impact of recent and future legislative and regulatory changes, including changes in banking, securities and tax laws and regulations, such as the Dodd- Frank Act and their application by our regulators; governmental monetary and fiscal policies; changes in the scope and cost of FDIC, insurance and other coverages; failure to receive regulatory approval for future acquisitions and increases in our capital requirements. While forward-looking statements reflect our good-faith beliefs, they are not guarantees of future performance. All forward-looking statements are necessarily only estimates of future results. Accordingly, actual results may differ materially from those expressed in or contemplated by the particular forward-looking statement, and, therefore, you are cautioned not to place undue reliance on such statements. Further, any forward-looking statement speaks only as of the date on which it is made, and we undertake no obligation to update any forward-looking statement to reflect events or circumstances after the date on which the statement is made or to reflect the occurrence of unanticipated events or circumstances, except as required by applicable law. For a discussion of such risks and uncertainties, which could cause actual results to differ from those contained in the forward-looking statements, see "Risk Factors" and the forward-looking statement disclosure contained in Triumph Financial’s Annual Report on Form 10-K, filed with the Securities and Exchange Commission on February 11, 2025. Non-GAAP Financial Measures This presentation may include certain non-GAAP financial measures intended to supplement, not substitute for, comparable GAAP measures. Reconciliations of non -GAAP financial measures to GAAP financial measures, if included, are provided at the end of this presentation. Unless otherwise noted, all data presented in this document is as of the quarter ending June 30, 2025. © TBK Bank, SSB, DBA Triumph
Overview
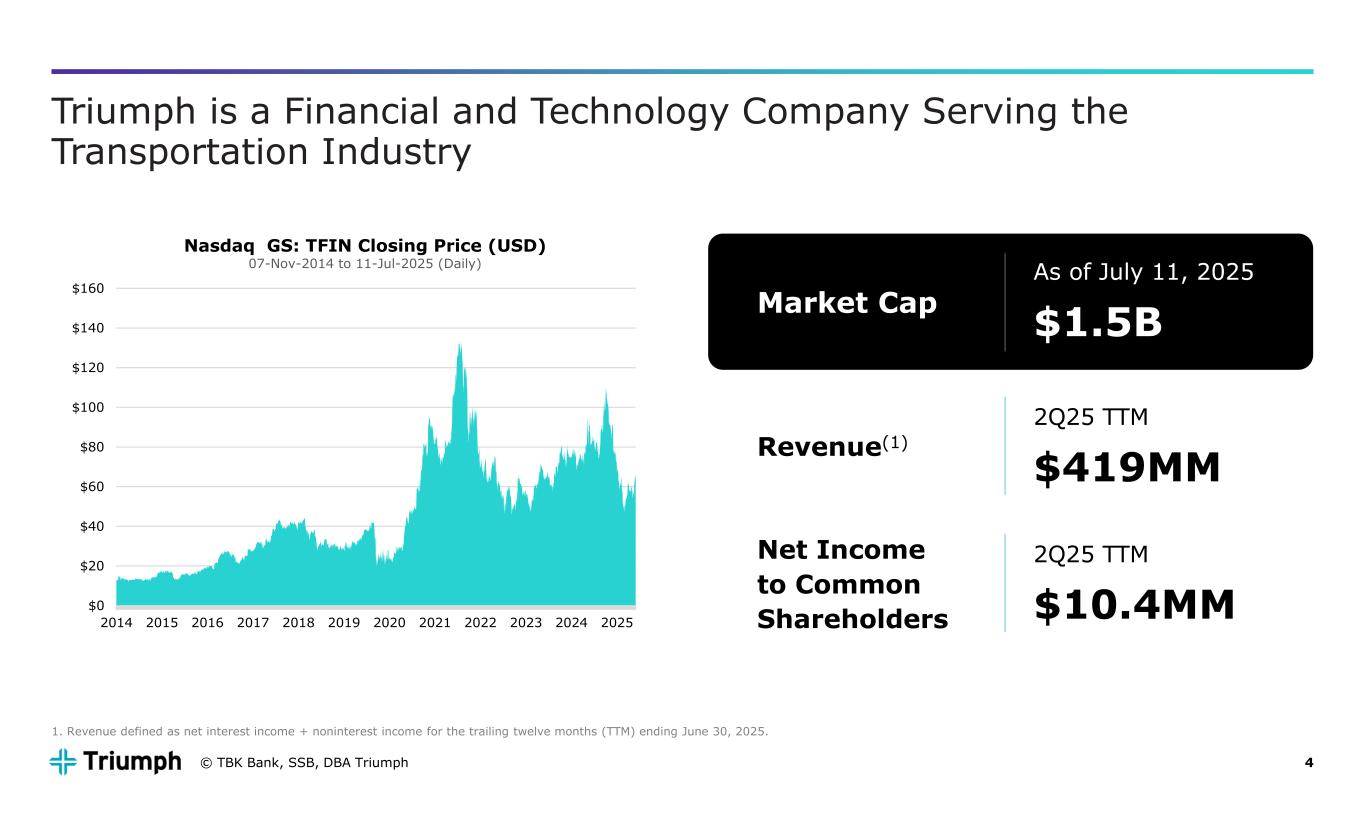
4 Triumph is a Financial and Technology Company Serving the Transportation Industry © TBK Bank, SSB, DBA Triumph Market Cap As of July 11, 2025 $1.5B Revenue(1) Net Income to Common Shareholders 2Q25 TTM $419MM 2Q25 TTM $10.4MM 1. Revenue defined as net interest income + noninterest income for the trailing twelve months (TTM) ending June 30, 2025. $0 $20 $40 $60 $80 $100 $120 $140 $160 2014 2015 2016 2017 2018 2019 2020 2021 2022 2023 2024 2025 Nasdaq GS: TFIN Closing Price (USD) 07-Nov-2014 to 11-Jul-2025 (Daily)
Positioned to Win
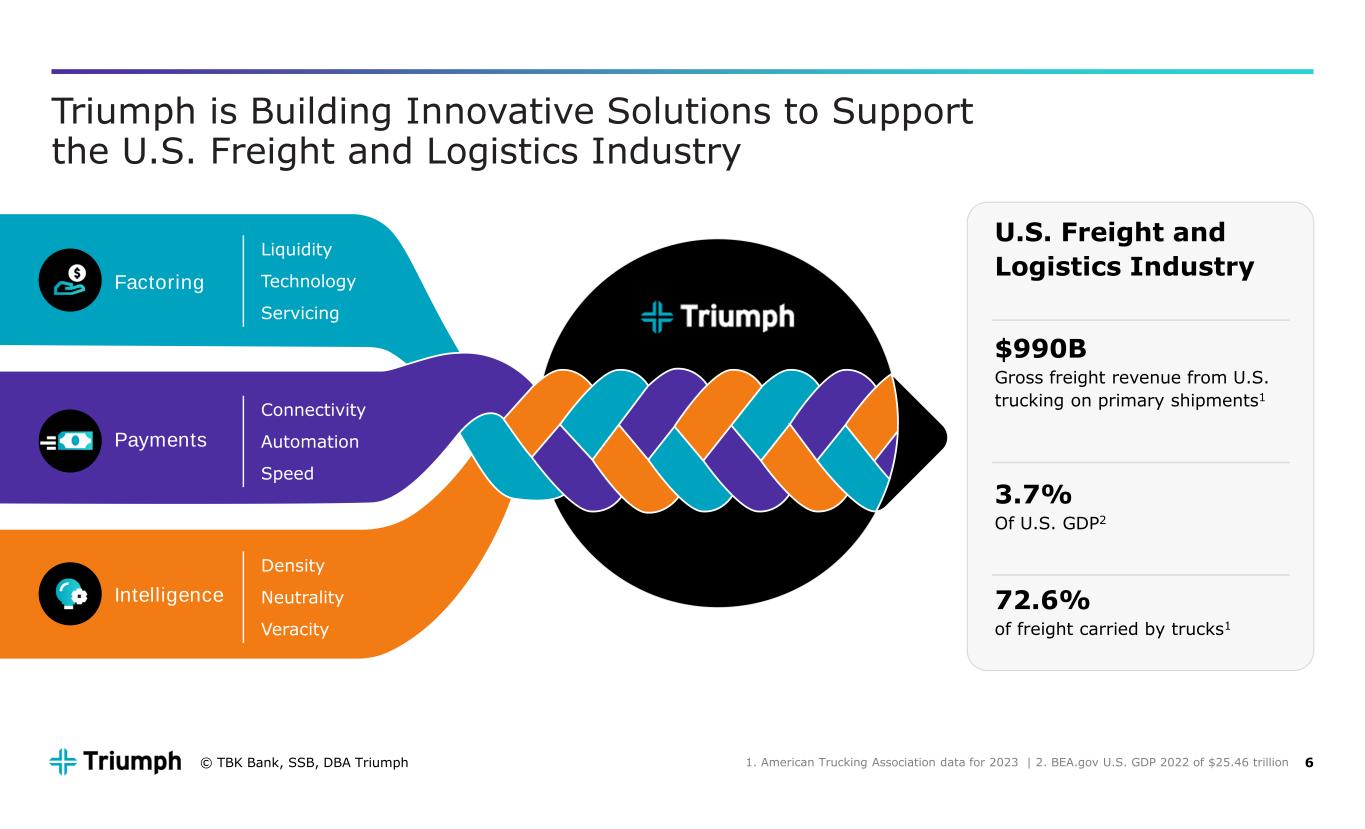
6 Triumph is Building Innovative Solutions to Support the U.S. Freight and Logistics Industry 1. American Trucking Association data for 2023 | 2. BEA.gov U.S. GDP 2022 of $25.46 trillion Factoring Payments Intelligence Liquidity Technology Servicing Connectivity Automation Speed Density Neutrality Veracity U.S. Freight and Logistics Industry $990B Gross freight revenue from U.S. trucking on primary shipments1 3.7% Of U.S. GDP2 72.6% of freight carried by trucks1 © TBK Bank, SSB, DBA Triumph
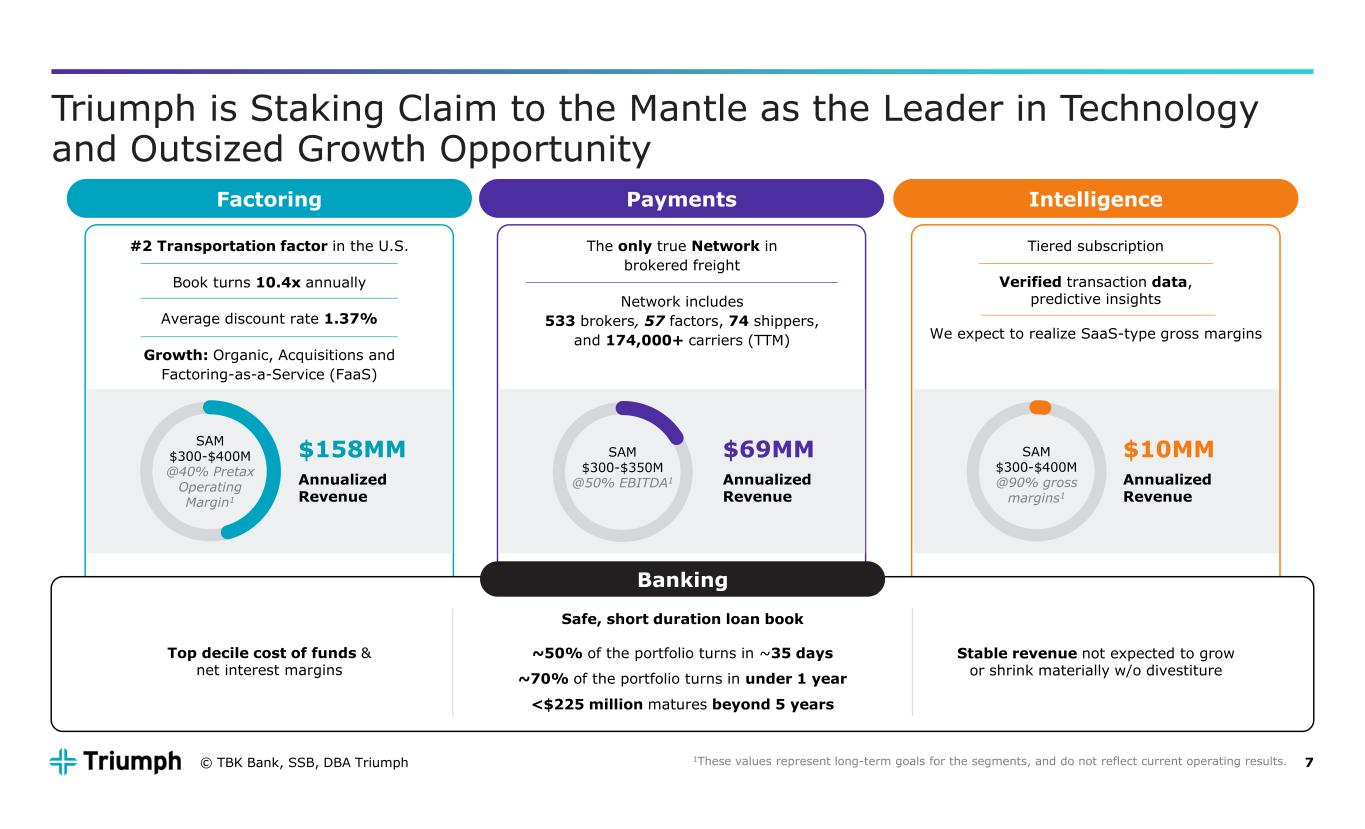
7 SAM $300-$400M @90% gross margins1 Triumph is Staking Claim to the Mantle as the Leader in Technology and Outsized Growth Opportunity The only true Network in brokered freight Network includes 533 brokers, 57 factors, 74 shippers, and 174,000+ carriers (TTM) $69MM Annualized Revenue SAM $300-$350M @50% EBITDA1 Payments IntelligenceFactoring #2 Transportation factor in the U.S. Book turns 10.4x annually Average discount rate 1.37% Growth: Organic, Acquisitions and Factoring-as-a-Service (FaaS) Tiered subscription Verified transaction data, predictive insights We expect to realize SaaS-type gross margins Banking Top decile cost of funds & net interest margins Safe, short duration loan book ~50% of the portfolio turns in ~35 days ~70% of the portfolio turns in under 1 year <$225 million matures beyond 5 years Stable revenue not expected to grow or shrink materially w/o divestiture $158MM Annualized Revenue $10MM Annualized Revenue SAM $300-$400M @40% Pretax Operating Margin1 1These values represent long-term goals for the segments, and do not reflect current operating results.© TBK Bank, SSB, DBA Triumph
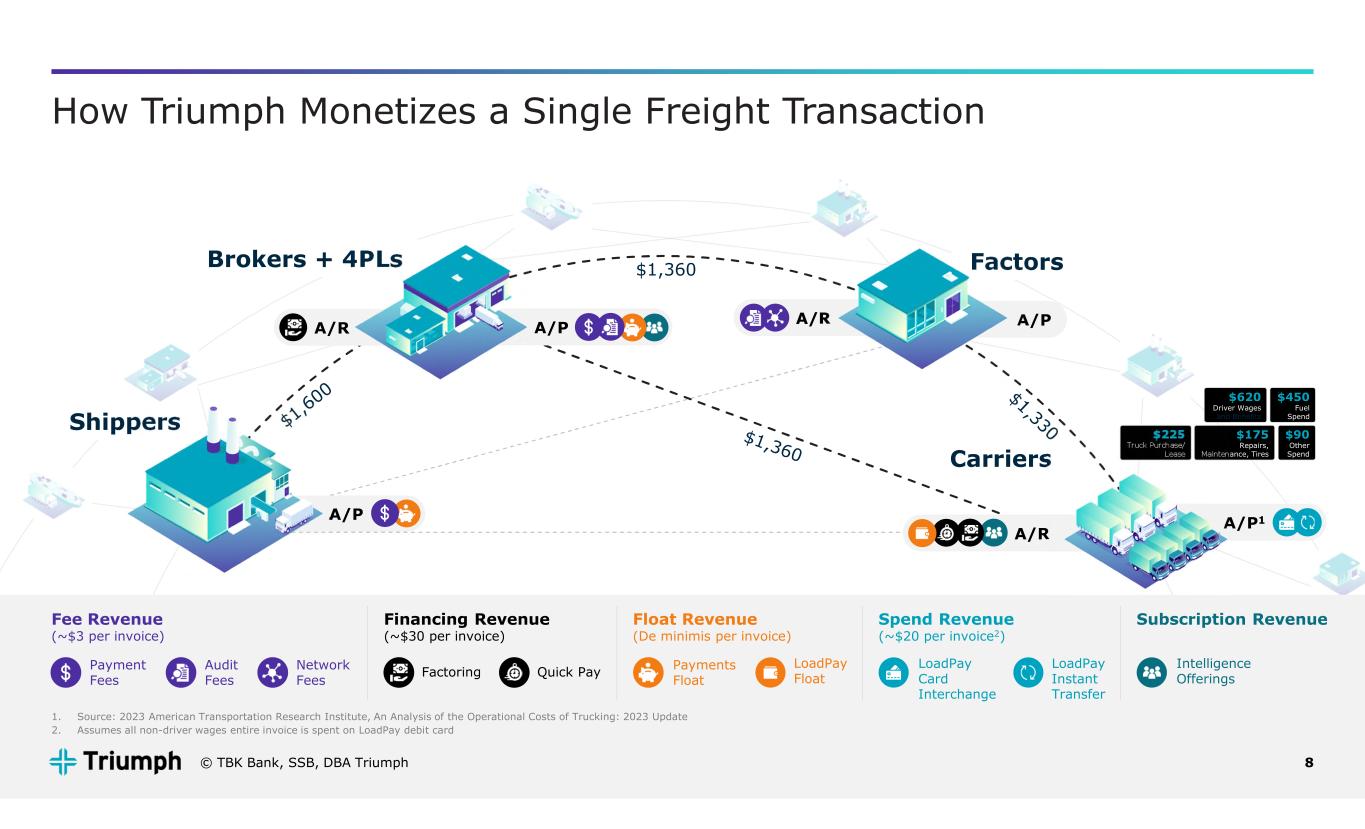
8 A/P1 How Triumph Monetizes a Single Freight Transaction $1,360 A/PA/R A/R A/P FactorsBrokers + 4PLs A/R Carriers Shippers $620 Driver Wages and Benefits $450 Fuel Spend $225 Truck Purchase/ Lease $175 Repairs, Maintenance, Tires $90 Other Spend Fee Revenue (~$3 per invoice) Financing Revenue (~$30 per invoice) Float Revenue (De minimis per invoice) Spend Revenue (~$20 per invoice2) Quick Pay Audit Fees Network Fees Payment Fees Factoring Payments Float LoadPay Card Interchange LoadPay Instant Transfer LoadPay Float Subscription Revenue Intelligence Offerings A/P 1. Source: 2023 American Transportation Research Institute, An Analysis of the Operational Costs of Trucking: 2023 Update 2. Assumes all non-driver wages entire invoice is spent on LoadPay debit card © TBK Bank, SSB, DBA Triumph
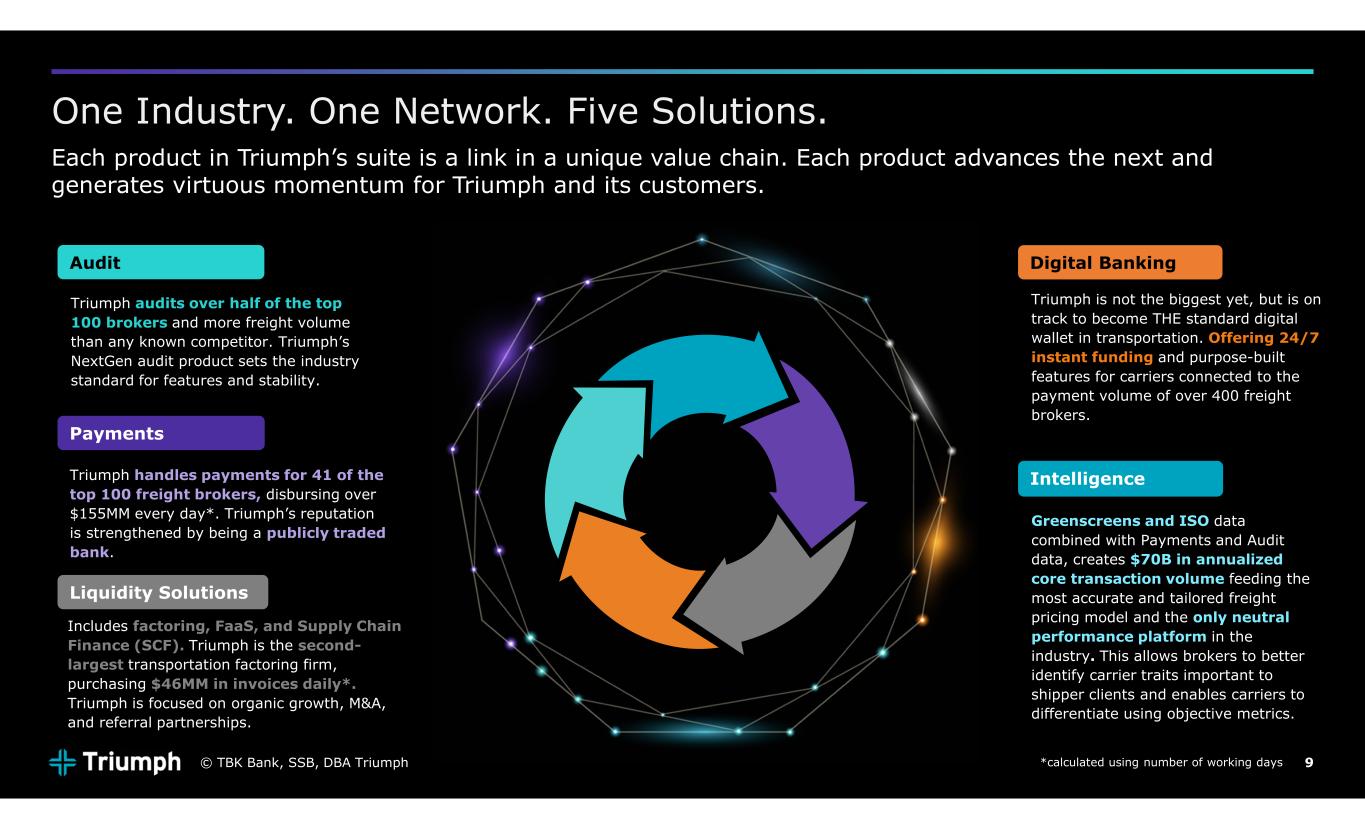
9 One Industry. One Network. Five Solutions. Each product in Triumph’s suite is a link in a unique value chain. Each product advances the next and generates virtuous momentum for Triumph and its customers. Payments Triumph handles payments for 41 of the top 100 freight brokers, disbursing over $155MM every day*. Triumph’s reputation is strengthened by being a publicly traded bank. Audit Triumph audits over half of the top 100 brokers and more freight volume than any known competitor. Triumph’s NextGen audit product sets the industry standard for features and stability. Liquidity Solutions Includes factoring, FaaS, and Supply Chain Finance (SCF). Triumph is the second- largest transportation factoring firm, purchasing $46MM in invoices daily*. Triumph is focused on organic growth, M&A, and referral partnerships. Digital Banking Triumph is not the biggest yet, but is on track to become THE standard digital wallet in transportation. Offering 24/7 instant funding and purpose-built features for carriers connected to the payment volume of over 400 freight brokers. Intelligence Greenscreens and ISO data combined with Payments and Audit data, creates $70B in annualized core transaction volume feeding the most accurate and tailored freight pricing model and the only neutral performance platform in the industry. This allows brokers to better identify carrier traits important to shipper clients and enables carriers to differentiate using objective metrics. *calculated using number of working days© TBK Bank, SSB, DBA Triumph
Factoring Payments Intelligence
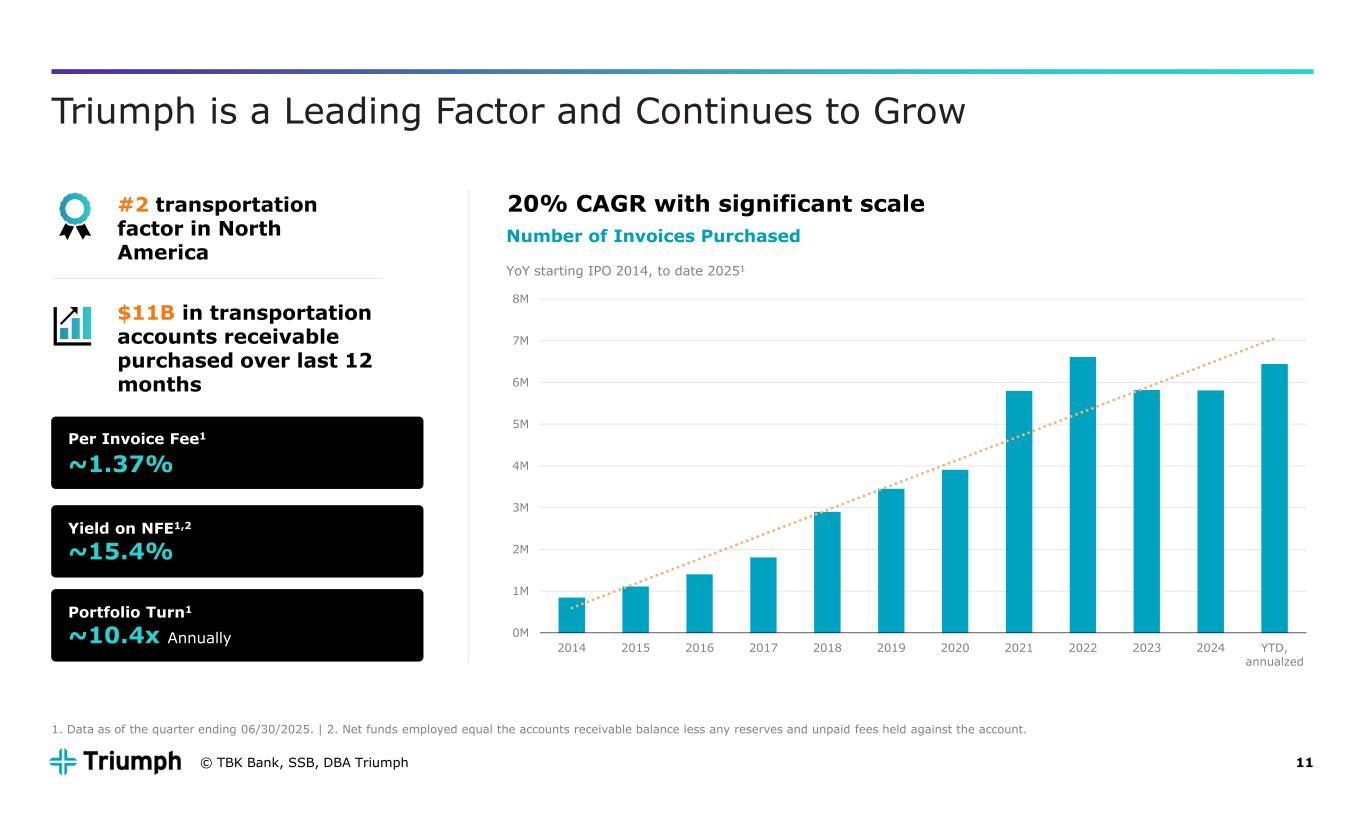
11 0M 1M 2M 3M 4M 5M 6M 7M 8M 2014 2015 2016 2017 2018 2019 2020 2021 2022 2023 2024 YTD, annualzed 20% CAGR with significant scale Triumph is a Leading Factor and Continues to Grow 1. Data as of the quarter ending 06/30/2025. | 2. Net funds employed equal the accounts receivable balance less any reserves and unpaid fees held against the account. #2 transportation factor in North America $11B in transportation accounts receivable purchased over last 12 months Per Invoice Fee1 ~1.37% Average Discount Rate Yield on NFE1,2 ~15.4% Portfolio Turn1 ~10.4x Annually Number of Invoices Purchased YoY starting IPO 2014, to date 20251 © TBK Bank, SSB, DBA Triumph
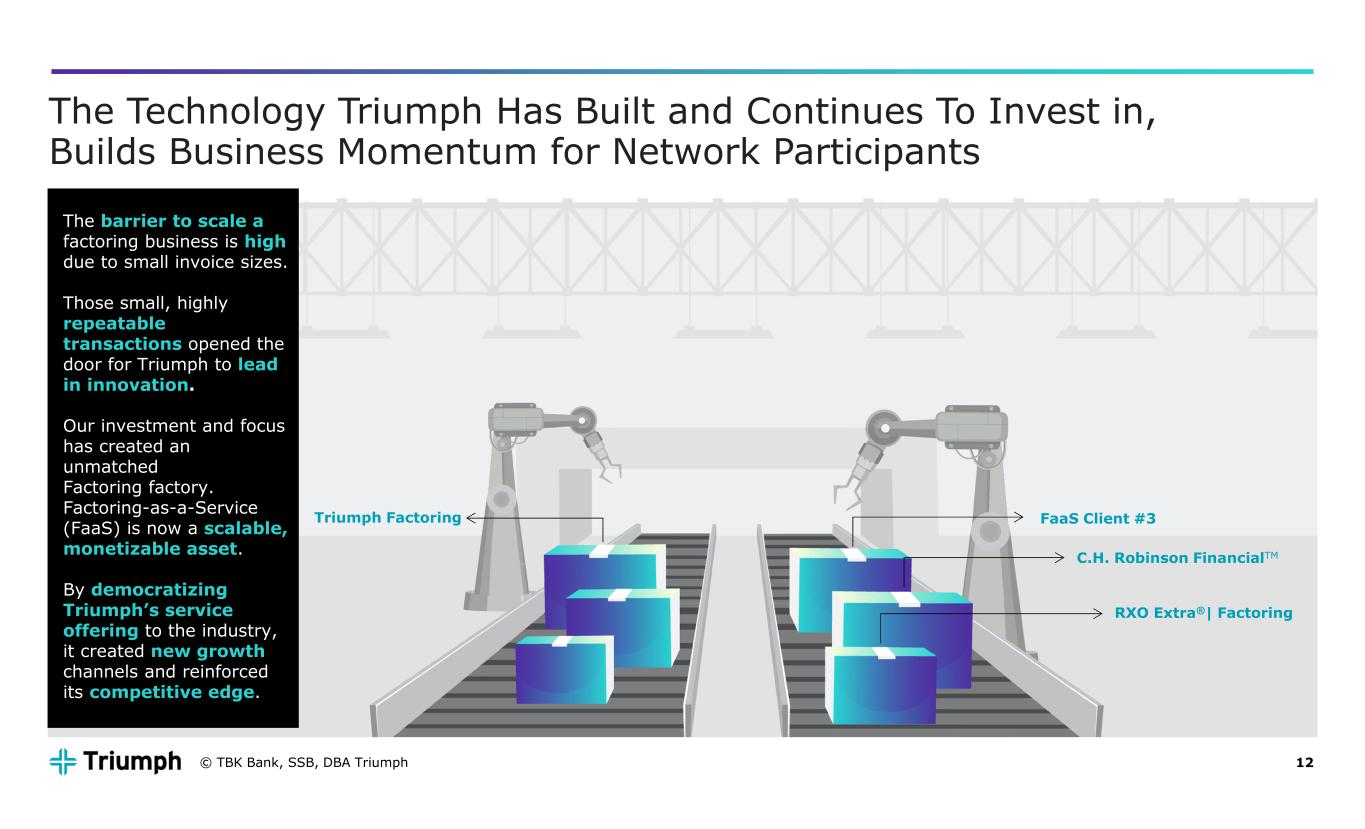
12 The Technology Triumph Has Built and Continues To Invest in, Builds Business Momentum for Network Participants The barrier to scale a factoring business is high due to small invoice sizes. Those small, highly repeatable transactions opened the door for Triumph to lead in innovation.. Our investment and focus has created an unmatched Factoring factory. Factoring-as-a-Service (FaaS) is now a scalable, monetizable asset. By democratizing Triumph’s service offering to the industry, it created new growth channels and reinforced its competitive edge. FaaS Client #3 C.H. Robinson FinancialTM RXO Extra®| Factoring Triumph Factoring © TBK Bank, SSB, DBA Triumph
Factoring Payments Intelligence
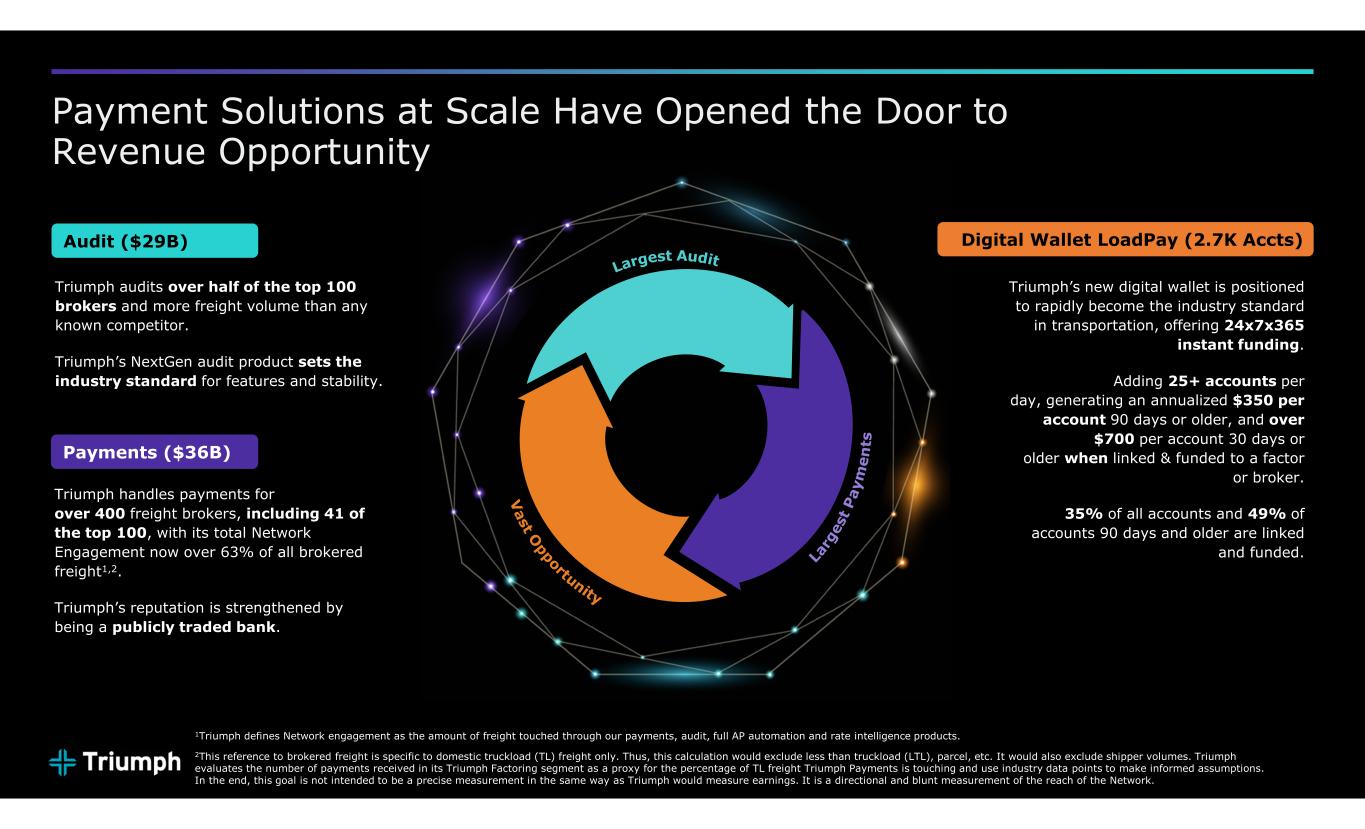
14 Payment Solutions at Scale Have Opened the Door to Revenue Opportunity 1Triumph defines Network engagement as the amount of freight touched through our payments, audit, full AP automation and rate intelligence products. 2This reference to brokered freight is specific to domestic truckload (TL) freight only. Thus, this calculation would exclude less than truckload (LTL), parcel, etc. It would also exclude shipper volumes. Triumph evaluates the number of payments received in its Triumph Factoring segment as a proxy for the percentage of TL freight Triumph Payments is touching and use industry data points to make informed assumptions. In the end, this goal is not intended to be a precise measurement in the same way as Triumph would measure earnings. It is a directional and blunt measurement of the reach of the Network. Triumph audits over half of the top 100 brokers and more freight volume than any known competitor. Triumph’s NextGen audit product sets the industry standard for features and stability. Triumph handles payments for over 400 freight brokers, including 41 of the top 100, with its total Network Engagement now over 63% of all brokered freight1,2. Triumph’s reputation is strengthened by being a publicly traded bank. Triumph’s new digital wallet is positioned to rapidly become the industry standard in transportation, offering 24x7x365 instant funding. Adding 25+ accounts per day, generating an annualized $350 per account 90 days or older, and over $700 per account 30 days or older when linked & funded to a factor or broker. 35% of all accounts and 49% of accounts 90 days and older are linked and funded. Audit ($29B) Payments ($36B) Digital Wallet LoadPay (2.7K Accts)
Factoring Payments Intelligence
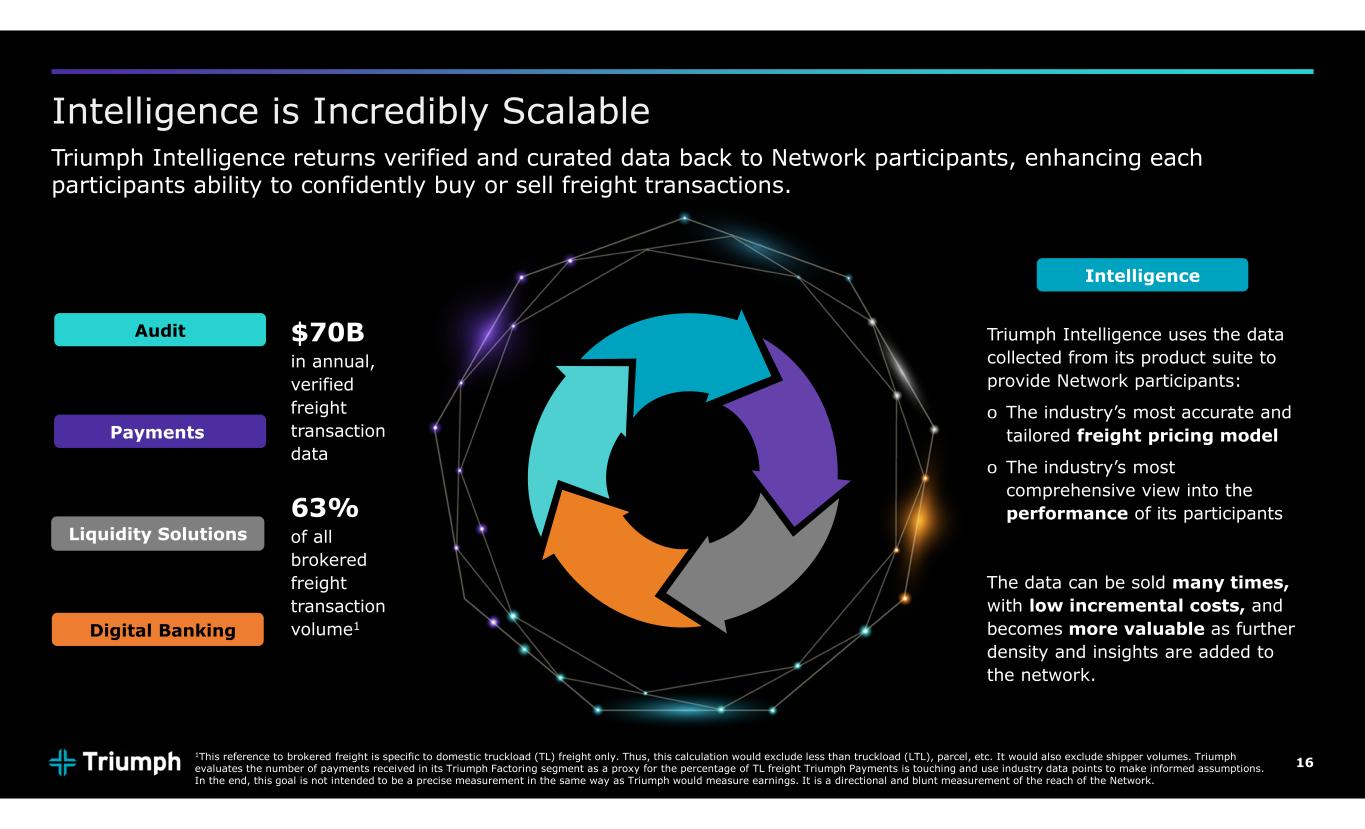
16 Intelligence is Incredibly Scalable Triumph Intelligence returns verified and curated data back to Network participants, enhancing each participants ability to confidently buy or sell freight transactions. Payments Audit Liquidity Solutions Digital Banking Intelligence $70B in annual, verified freight transaction data 63% of all brokered freight transaction volume1 Triumph Intelligence uses the data collected from its product suite to provide Network participants: o The industry’s most accurate and tailored freight pricing model o The industry’s most comprehensive view into the performance of its participants The data can be sold many times, with low incremental costs, and becomes more valuable as further density and insights are added to the network. 1This reference to brokered freight is specific to domestic truckload (TL) freight only. Thus, this calculation would exclude less than truckload (LTL), parcel, etc. It would also exclude shipper volumes. Triumph evaluates the number of payments received in its Triumph Factoring segment as a proxy for the percentage of TL freight Triumph Payments is touching and use industry data points to make informed assumptions. In the end, this goal is not intended to be a precise measurement in the same way as Triumph would measure earnings. It is a directional and blunt measurement of the reach of the Network.
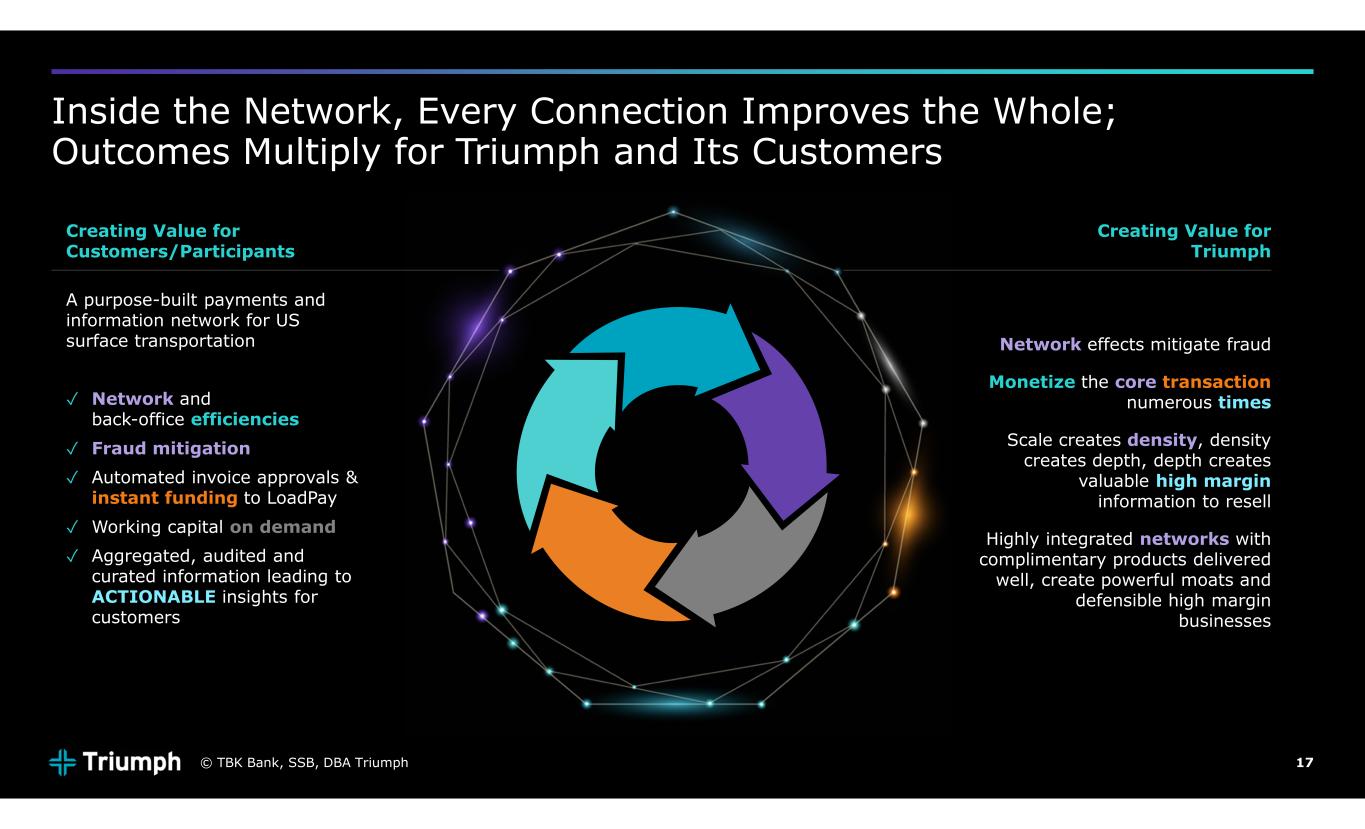
17 Inside the Network, Every Connection Improves the Whole; Outcomes Multiply for Triumph and Its Customers Creating Value for Customers/Participants A purpose-built payments and information network for US surface transportation ✓ Network and back-office efficiencies ✓ Fraud mitigation ✓ Automated invoice approvals & instant funding to LoadPay ✓ Working capital on demand ✓ Aggregated, audited and curated information leading to ACTIONABLE insights for customers Creating Value for Triumph Network effects mitigate fraud Monetize the core transaction numerous times Scale creates density, density creates depth, depth creates valuable high margin information to resell Highly integrated networks with complimentary products delivered well, create powerful moats and defensible high margin businesses © TBK Bank, SSB, DBA Triumph

Sustainable Business Practices
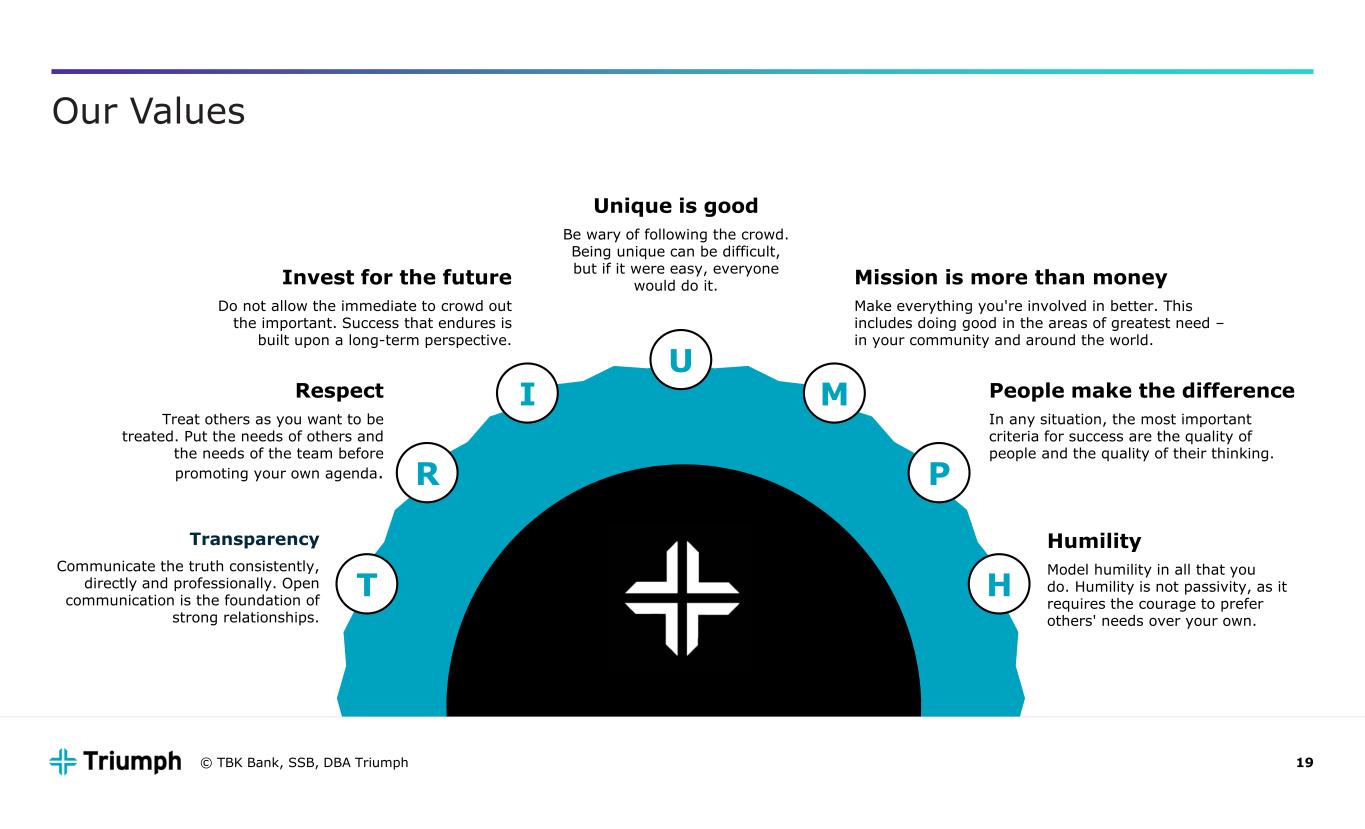
19 Our Values Transparency Communicate the truth consistently, directly and professionally. Open communication is the foundation of strong relationships. Respect Treat others as you want to be treated. Put the needs of others and the needs of the team before promoting your own agenda. Invest for the future Do not allow the immediate to crowd out the important. Success that endures is built upon a long-term perspective. Unique is good Be wary of following the crowd. Being unique can be difficult, but if it were easy, everyone would do it. Mission is more than money Make everything you're involved in better. This includes doing good in the areas of greatest need – in your community and around the world. People make the difference In any situation, the most important criteria for success are the quality of people and the quality of their thinking. Humility Model humility in all that you do. Humility is not passivity, as it requires the courage to prefer others' needs over your own. T MI R P H U © TBK Bank, SSB, DBA Triumph
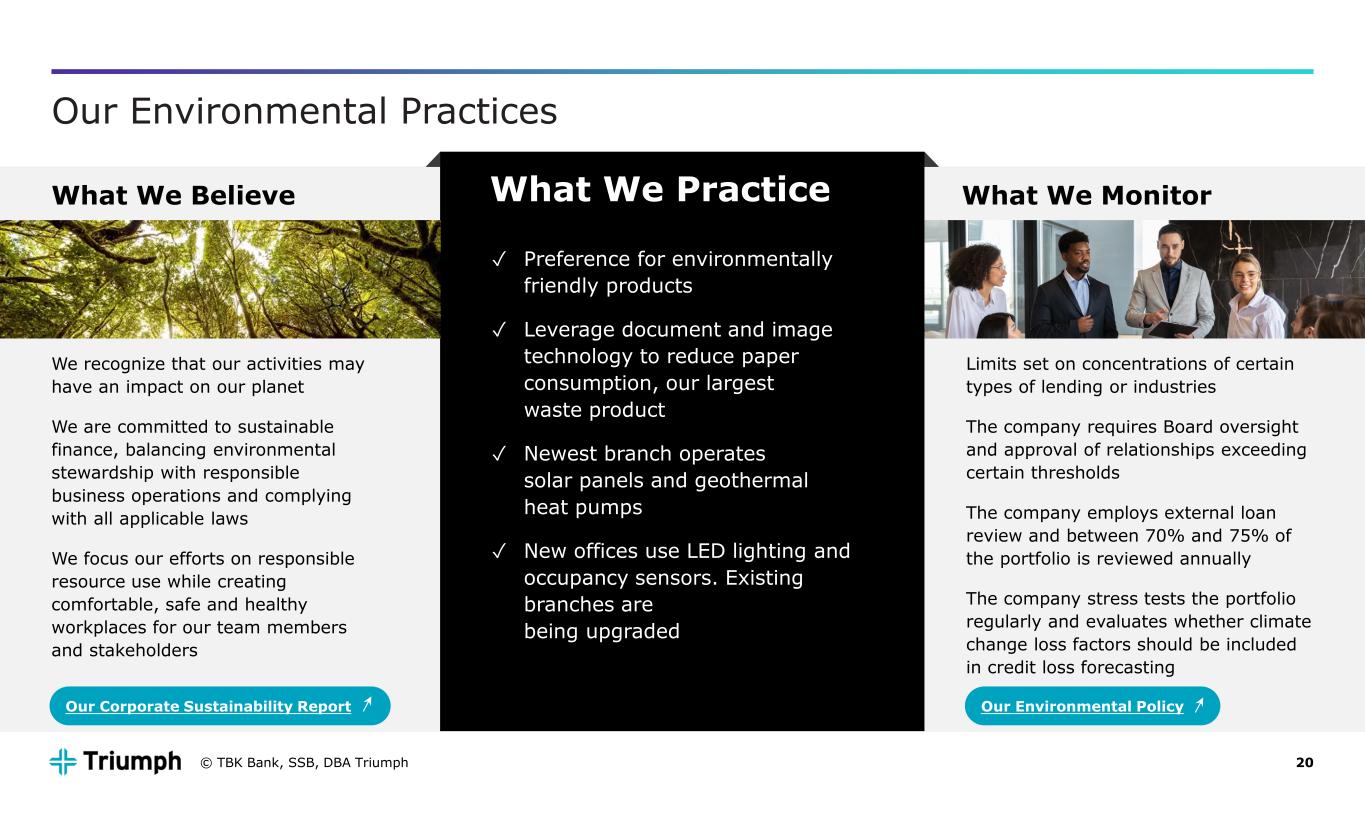
20 Our Environmental Practices What We Believe What We Monitor We recognize that our activities may have an impact on our planet We are committed to sustainable finance, balancing environmental stewardship with responsible business operations and complying with all applicable laws We focus our efforts on responsible resource use while creating comfortable, safe and healthy workplaces for our team members and stakeholders Limits set on concentrations of certain types of lending or industries The company requires Board oversight and approval of relationships exceeding certain thresholds The company employs external loan review and between 70% and 75% of the portfolio is reviewed annually The company stress tests the portfolio regularly and evaluates whether climate change loss factors should be included in credit loss forecasting Our Environmental Policy What We Practice ✓ Preference for environmentally friendly products ✓ Leverage document and image technology to reduce paper consumption, our largest waste product ✓ Newest branch operates solar panels and geothermal heat pumps ✓ New offices use LED lighting and occupancy sensors. Existing branches are being upgraded Our Corporate Sustainability Report © TBK Bank, SSB, DBA Triumph
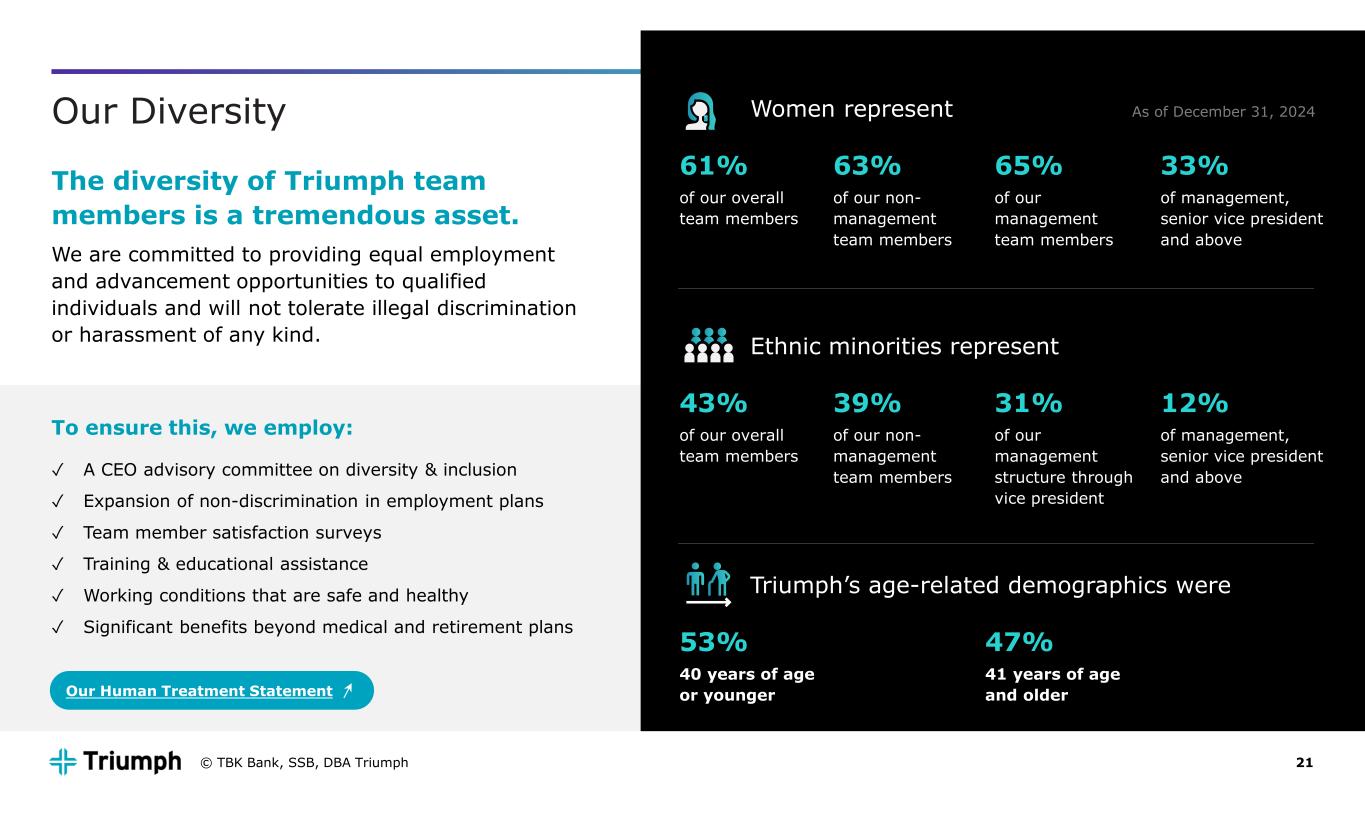
21 Our Diversity The diversity of Triumph team members is a tremendous asset. We are committed to providing equal employment and advancement opportunities to qualified individuals and will not tolerate illegal discrimination or harassment of any kind. Women represent 61% of our overall team members 63% of our non- management team members 65% of our management team members 33% of management, senior vice president and above Our Human Treatment Statement To ensure this, we employ: ✓ A CEO advisory committee on diversity & inclusion ✓ Expansion of non-discrimination in employment plans ✓ Team member satisfaction surveys ✓ Training & educational assistance ✓ Working conditions that are safe and healthy ✓ Significant benefits beyond medical and retirement plans Ethnic minorities represent 43% of our overall team members 39% of our non- management team members 31% of our management structure through vice president 12% of management, senior vice president and above Triumph’s age-related demographics were 53% 40 years of age or younger 47% 41 years of age and older As of December 31, 2024 © TBK Bank, SSB, DBA Triumph
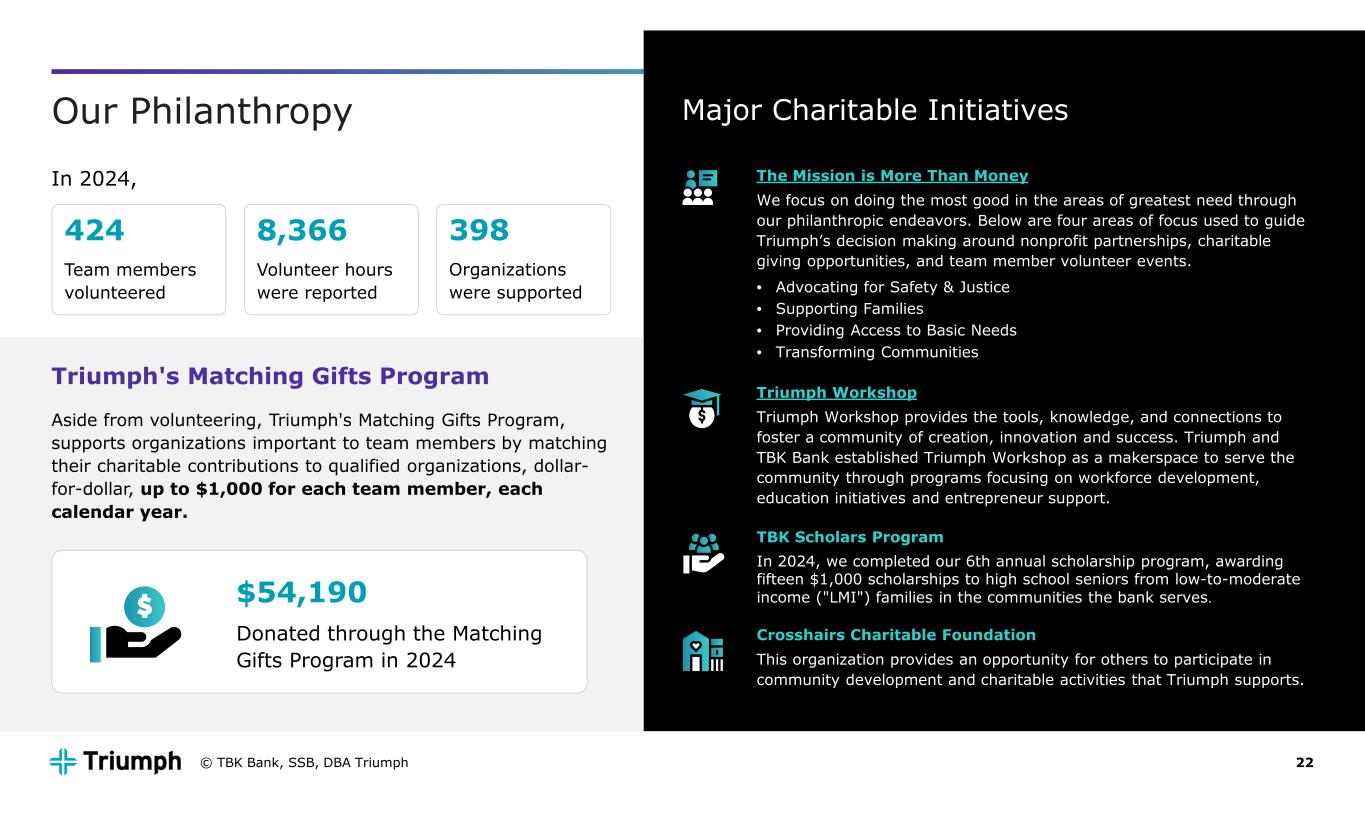
22 Our Philanthropy In 2024, Triumph's Matching Gifts Program Aside from volunteering, Triumph's Matching Gifts Program, supports organizations important to team members by matching their charitable contributions to qualified organizations, dollar- for-dollar, up to $1,000 for each team member, each calendar year. 424 Team members volunteered 8,366 Volunteer hours were reported 398 Organizations were supported $54,190 Donated through the Matching Gifts Program in 2024 Major Charitable Initiatives The Mission is More Than Money We focus on doing the most good in the areas of greatest need through our philanthropic endeavors. Below are four areas of focus used to guide Triumph’s decision making around nonprofit partnerships, charitable giving opportunities, and team member volunteer events. • Advocating for Safety & Justice • Supporting Families • Providing Access to Basic Needs • Transforming Communities Triumph Workshop Triumph Workshop provides the tools, knowledge, and connections to foster a community of creation, innovation and success. Triumph and TBK Bank established Triumph Workshop as a makerspace to serve the community through programs focusing on workforce development, education initiatives and entrepreneur support. TBK Scholars Program In 2024, we completed our 6th annual scholarship program, awarding fifteen $1,000 scholarships to high school seniors from low-to-moderate income ("LMI") families in the communities the bank serves. Crosshairs Charitable Foundation This organization provides an opportunity for others to participate in community development and charitable activities that Triumph supports. © TBK Bank, SSB, DBA Triumph
Appendix
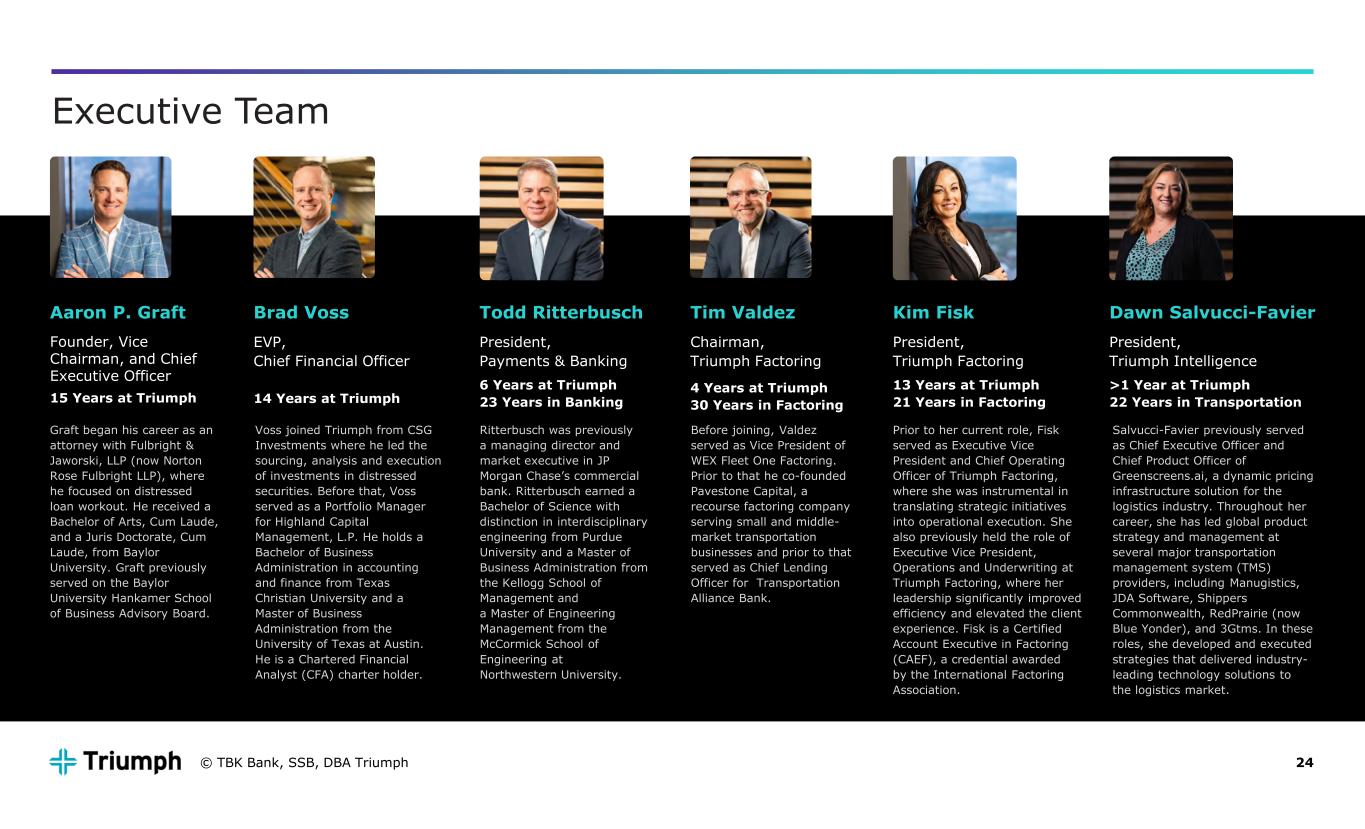
24 Executive Team Aaron P. Graft Founder, Vice Chairman, and Chief Executive Officer 15 Years at Triumph Brad Voss EVP, Chief Financial Officer 14 Years at Triumph Todd Ritterbusch President, Payments & Banking 6 Years at Triumph 23 Years in Banking Kim Fisk President, Triumph Factoring 13 Years at Triumph 21 Years in Factoring Dawn Salvucci-Favier President, Triumph Intelligence >1 Year at Triumph 22 Years in Transportation Graft began his career as an attorney with Fulbright & Jaworski, LLP (now Norton Rose Fulbright LLP), where he focused on distressed loan workout. He received a Bachelor of Arts, Cum Laude, and a Juris Doctorate, Cum Laude, from Baylor University. Graft previously served on the Baylor University Hankamer School of Business Advisory Board. Voss joined Triumph from CSG Investments where he led the sourcing, analysis and execution of investments in distressed securities. Before that, Voss served as a Portfolio Manager for Highland Capital Management, L.P. He holds a Bachelor of Business Administration in accounting and finance from Texas Christian University and a Master of Business Administration from the University of Texas at Austin. He is a Chartered Financial Analyst (CFA) charter holder. Ritterbusch was previously a managing director and market executive in JP Morgan Chase’s commercial bank. Ritterbusch earned a Bachelor of Science with distinction in interdisciplinary engineering from Purdue University and a Master of Business Administration from the Kellogg School of Management and a Master of Engineering Management from the McCormick School of Engineering at Northwestern University. Prior to her current role, Fisk served as Executive Vice President and Chief Operating Officer of Triumph Factoring, where she was instrumental in translating strategic initiatives into operational execution. She also previously held the role of Executive Vice President, Operations and Underwriting at Triumph Factoring, where her leadership significantly improved efficiency and elevated the client experience. Fisk is a Certified Account Executive in Factoring (CAEF), a credential awarded by the International Factoring Association. Salvucci-Favier previously served as Chief Executive Officer and Chief Product Officer of Greenscreens.ai, a dynamic pricing infrastructure solution for the logistics industry. Throughout her career, she has led global product strategy and management at several major transportation management system (TMS) providers, including Manugistics, JDA Software, Shippers Commonwealth, RedPrairie (now Blue Yonder), and 3Gtms. In these roles, she developed and executed strategies that delivered industry- leading technology solutions to the logistics market. Tim Valdez Chairman, Triumph Factoring 4 Years at Triumph 30 Years in Factoring Before joining, Valdez served as Vice President of WEX Fleet One Factoring. Prior to that he co-founded Pavestone Capital, a recourse factoring company serving small and middle- market transportation businesses and prior to that served as Chief Lending Officer for Transportation Alliance Bank. © TBK Bank, SSB, DBA Triumph
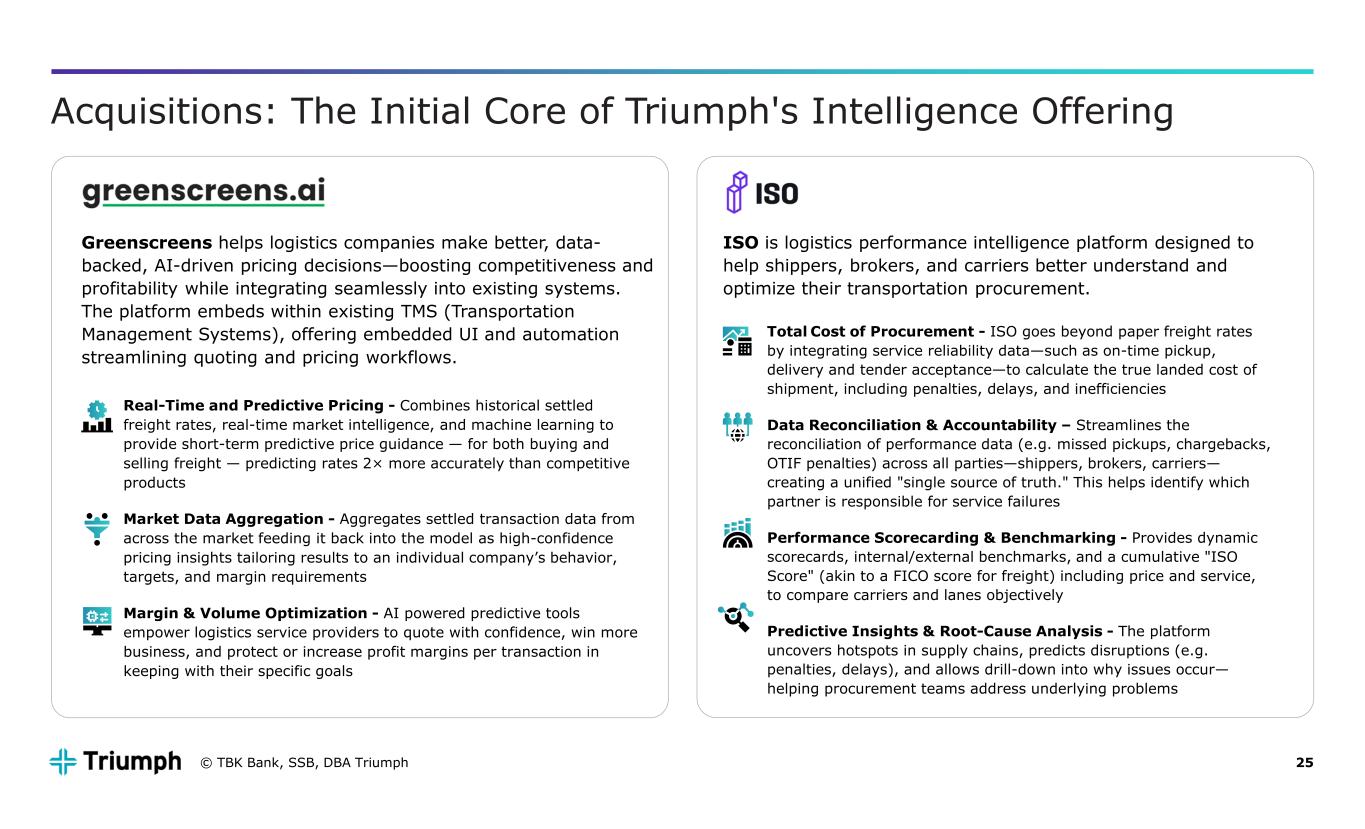
25 Acquisitions: The Initial Core of Triumph's Intelligence Offering Greenscreens helps logistics companies make better, data- backed, AI-driven pricing decisions—boosting competitiveness and profitability while integrating seamlessly into existing systems. The platform embeds within existing TMS (Transportation Management Systems), offering embedded UI and automation streamlining quoting and pricing workflows. ISO is logistics performance intelligence platform designed to help shippers, brokers, and carriers better understand and optimize their transportation procurement. Real-Time and Predictive Pricing - Combines historical settled freight rates, real-time market intelligence, and machine learning to provide short-term predictive price guidance — for both buying and selling freight — predicting rates 2× more accurately than competitive products Market Data Aggregation - Aggregates settled transaction data from across the market feeding it back into the model as high-confidence pricing insights tailoring results to an individual company’s behavior, targets, and margin requirements Margin & Volume Optimization - AI powered predictive tools empower logistics service providers to quote with confidence, win more business, and protect or increase profit margins per transaction in keeping with their specific goals Total Cost of Procurement - ISO goes beyond paper freight rates by integrating service reliability data—such as on-time pickup, delivery and tender acceptance—to calculate the true landed cost of shipment, including penalties, delays, and inefficiencies Data Reconciliation & Accountability – Streamlines the reconciliation of performance data (e.g. missed pickups, chargebacks, OTIF penalties) across all parties—shippers, brokers, carriers— creating a unified "single source of truth." This helps identify which partner is responsible for service failures Performance Scorecarding & Benchmarking - Provides dynamic scorecards, internal/external benchmarks, and a cumulative "ISO Score" (akin to a FICO score for freight) including price and service, to compare carriers and lanes objectively Predictive Insights & Root-Cause Analysis - The platform uncovers hotspots in supply chains, predicts disruptions (e.g. penalties, delays), and allows drill-down into why issues occur— helping procurement teams address underlying problems © TBK Bank, SSB, DBA Triumph
Thank you!