Operator
Good day, and welcome to the Trinity Industries First Quarter ended March 31, 2026 Results Conference Call. Operator provided instructions on the call. Please note, today's event is being recorded. Before we get started, let me remind you that today's conference call contains forward-looking statements as defined by the Private Securities Litigation Reform Act of 1995 and includes statements as to estimates, expectations, intentions and predictions of future financial performance. Statements that are not historical facts are forward-looking. Participants are directed to Trinity's Form 10-K and other SEC filings for a description of certain of the business issues and risks, a change in any of which could cause actual results or outcomes to differ materially from those expressed in the forward-looking statements. I would now like to turn the conference over to Leanne Mann, Vice President of Investor Relations. Please go ahead.
Speaker 1
Thank you, operator. Good morning, everyone. We appreciate you joining us for the company's first quarter 2026 financial results conference call. Our prepared remarks will include comments from Gene Savage, Trinity's Chief Executive Officer and President, and Eric Marchetto, the company's Chief Financial Officer. We will hold a Q&A session following the prepared remarks from our leaders. During the call today, we will reference certain non-GAAP financial metrics. The reconciliations of the non-GAAP metrics to comparable GAAP measures are provided in the appendix of the quarterly investor slides, which are accessible on our Investor Relations website at www.trin.net. These slides are under the Events & Presentations portion of the website, along with the first quarter earnings conference call materials. A replay of today's call will be available after 10:30 a.m. Eastern Time till midnight on May 7, 2026. The replay information is available under the Events and Presentations page on our Investor Relations website. It is now my pleasure to turn the call over to Gene.
Speaker 2
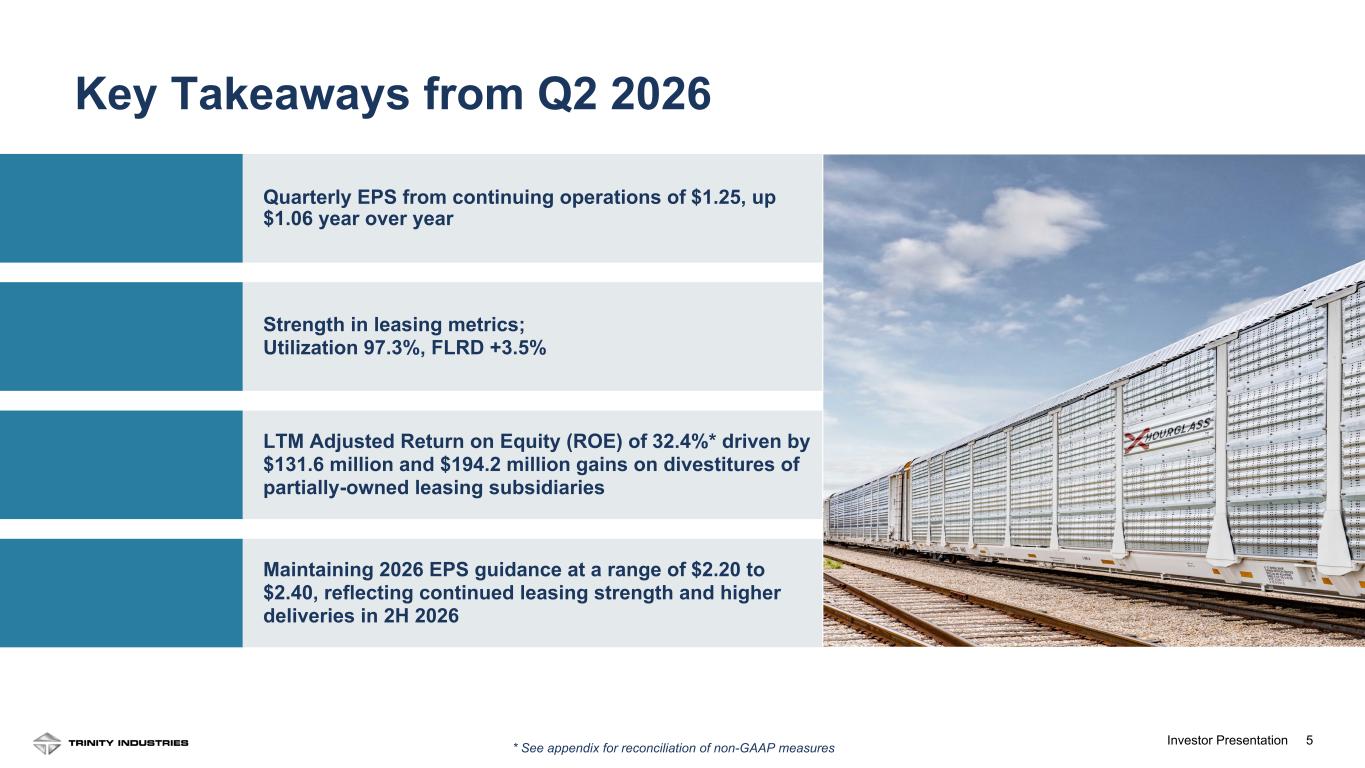
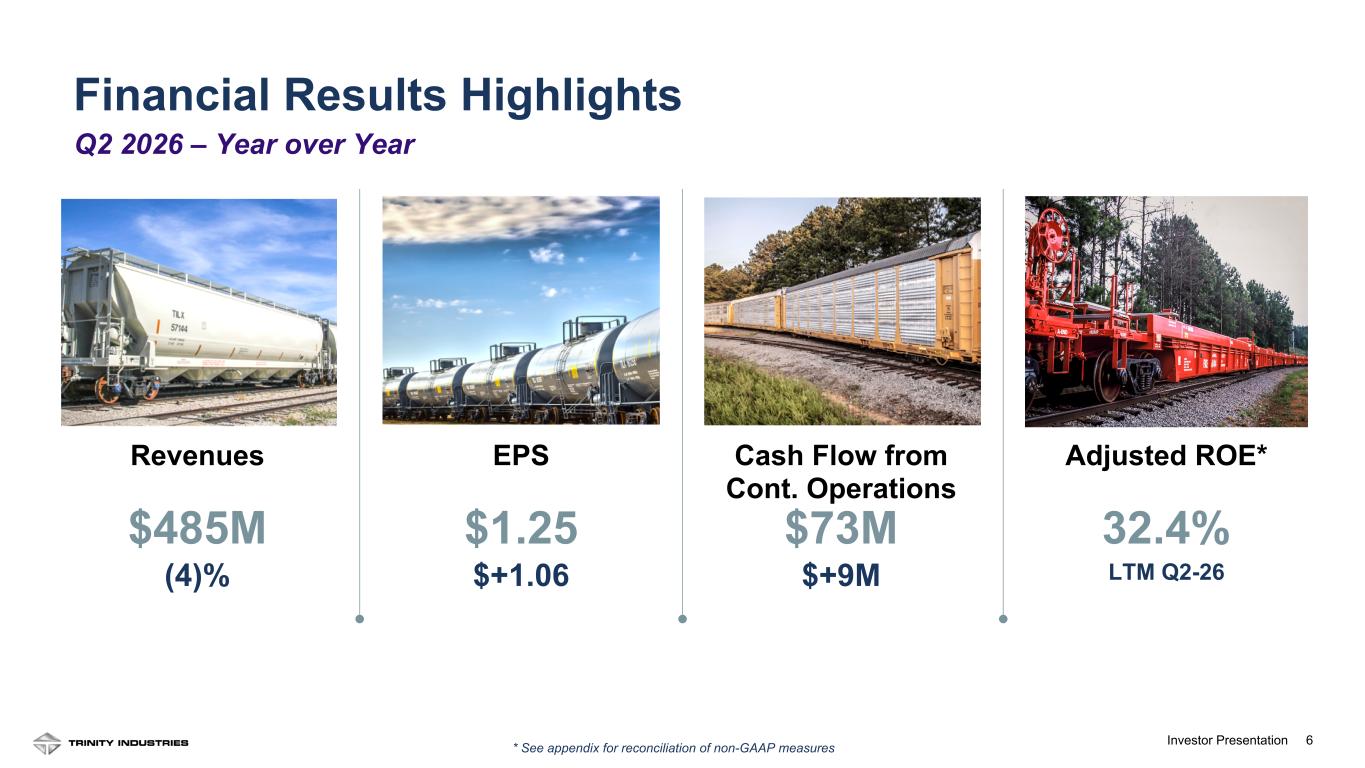
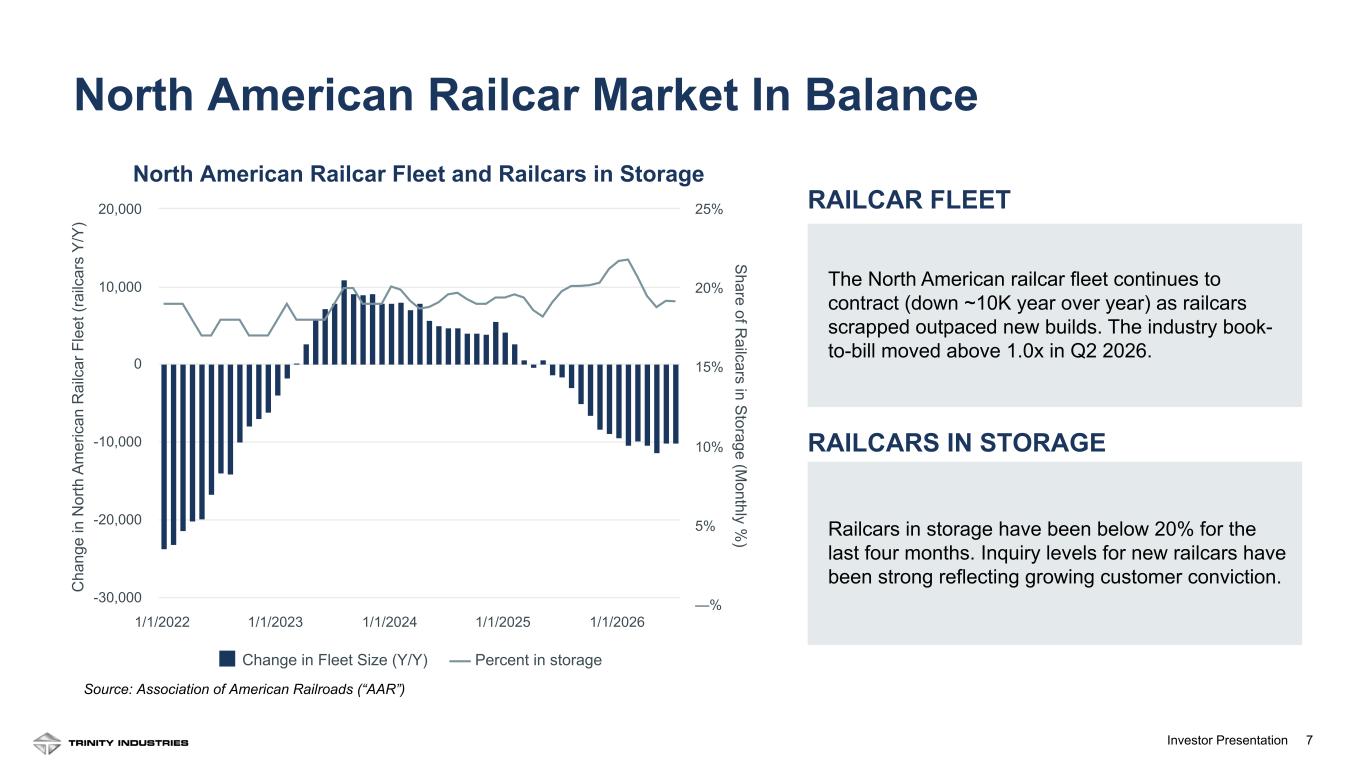
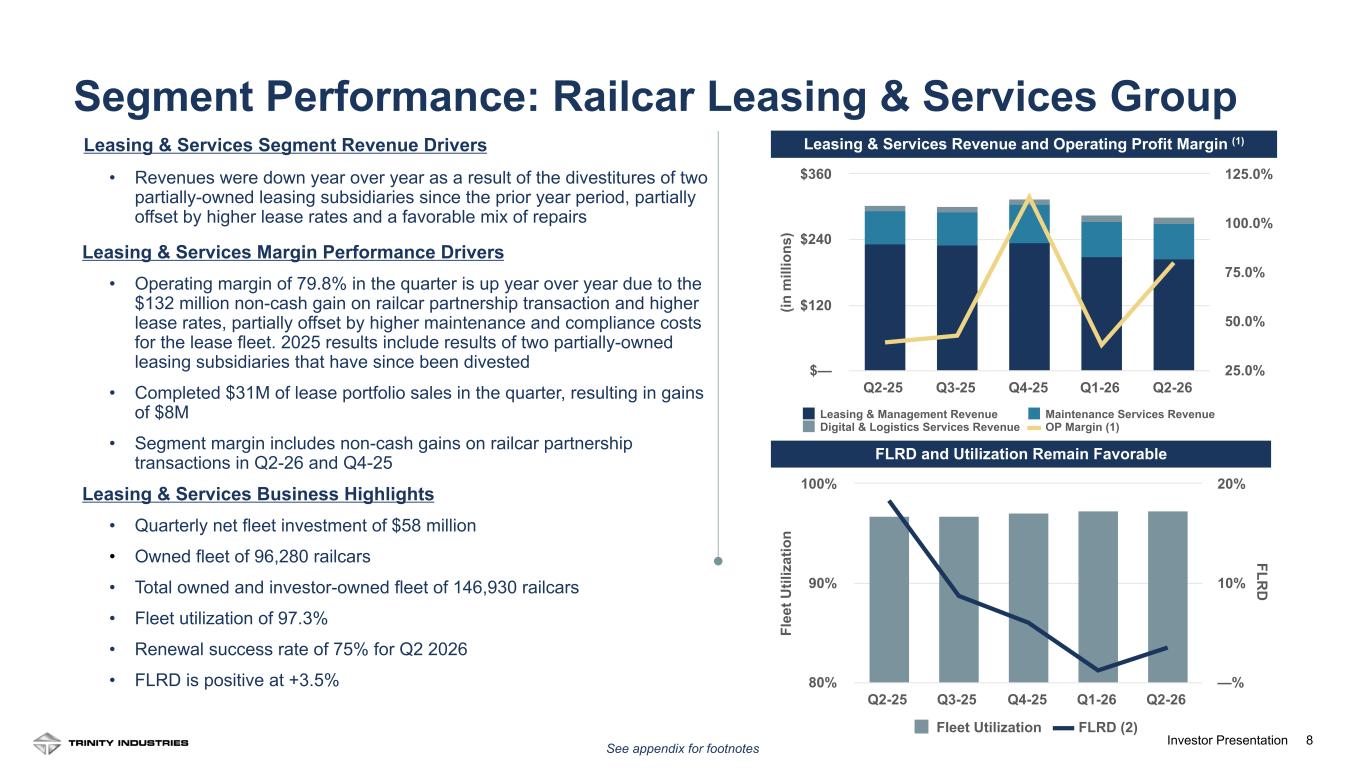
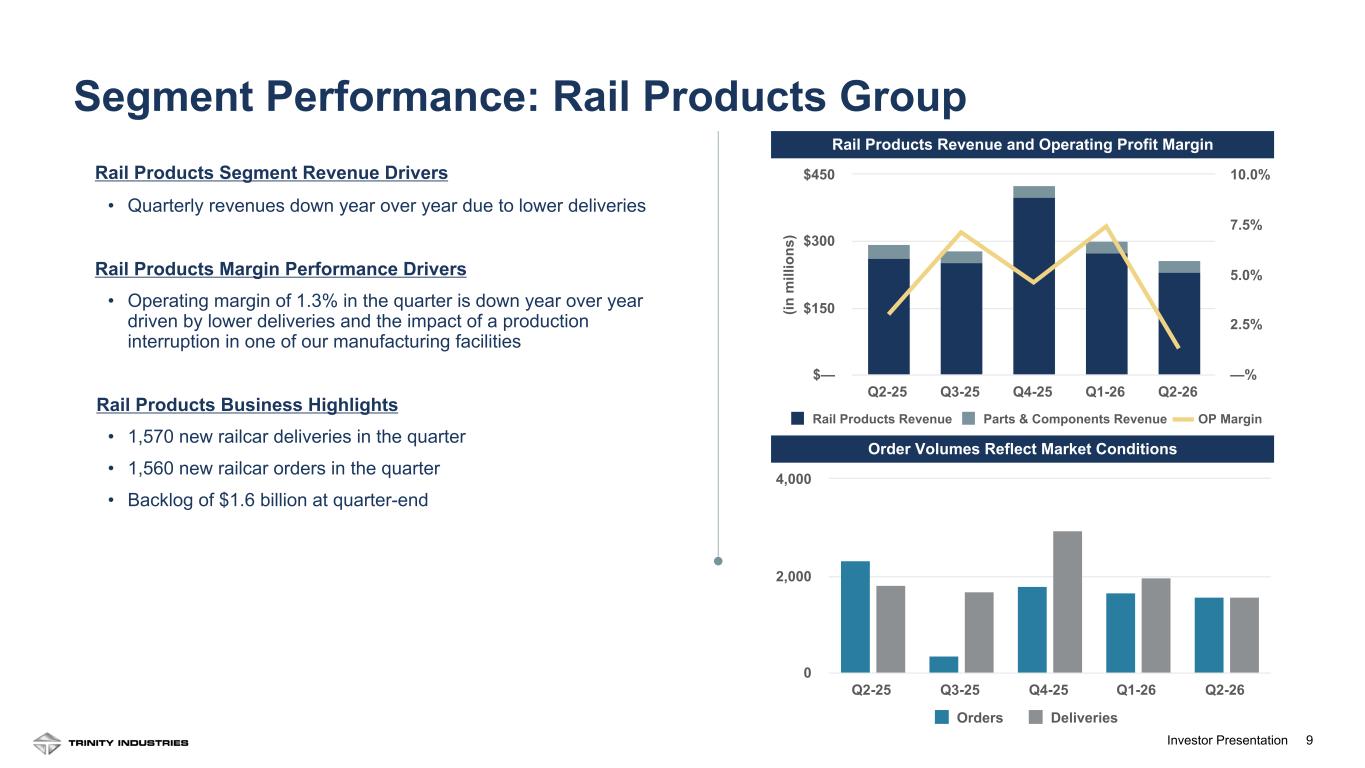
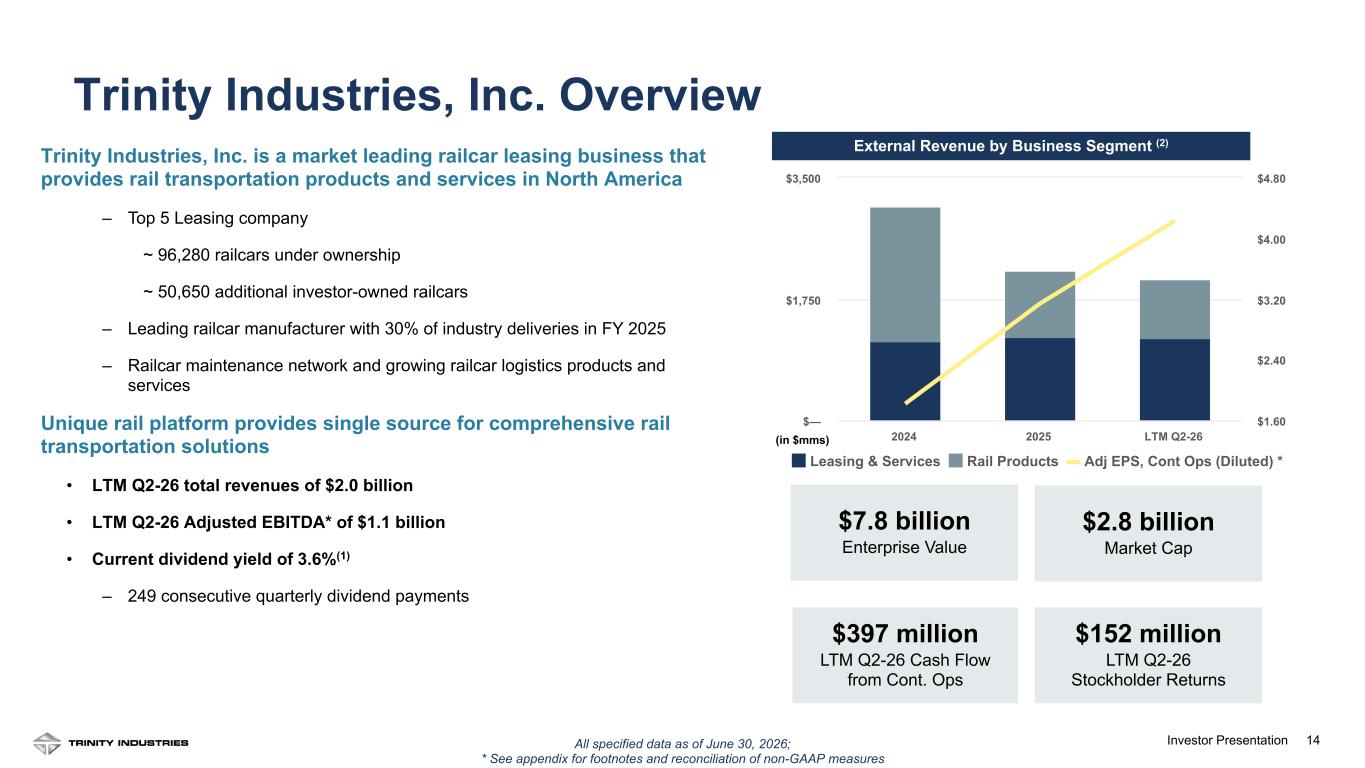
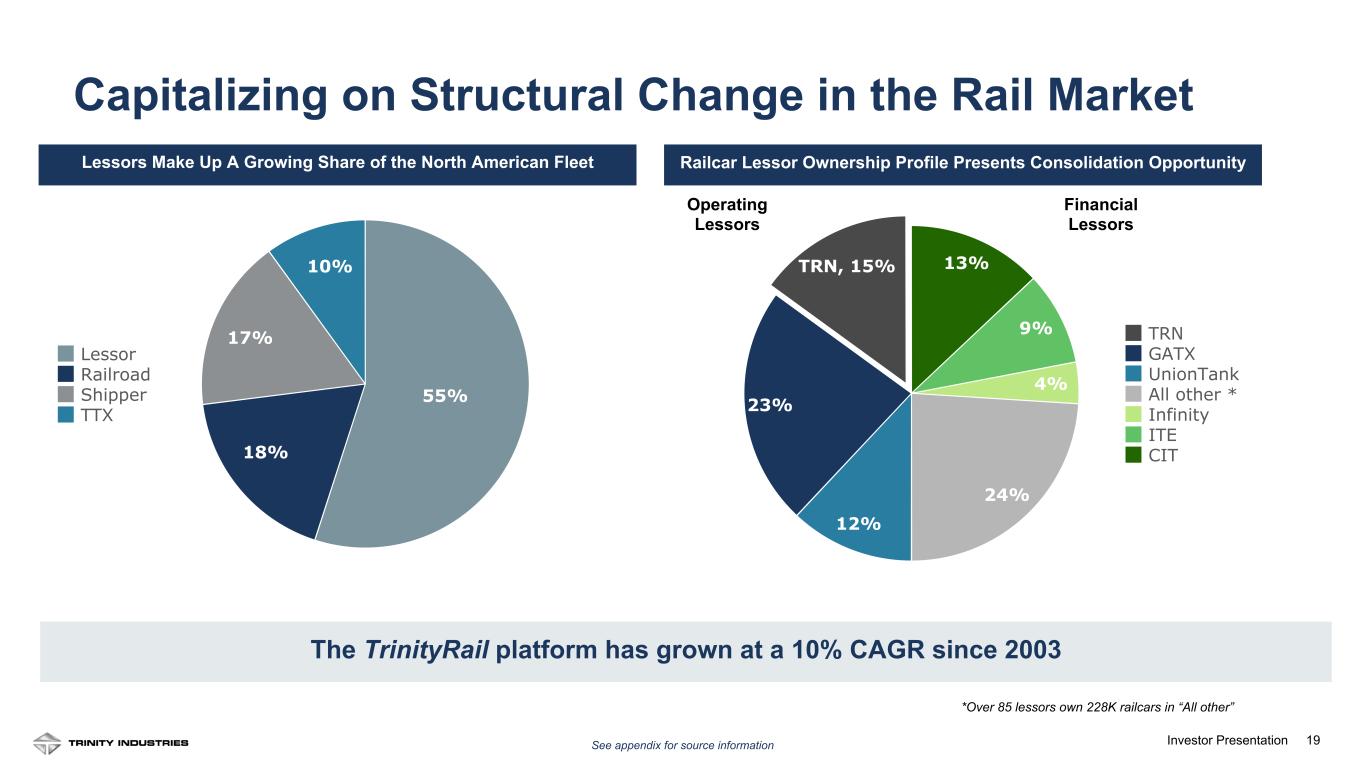
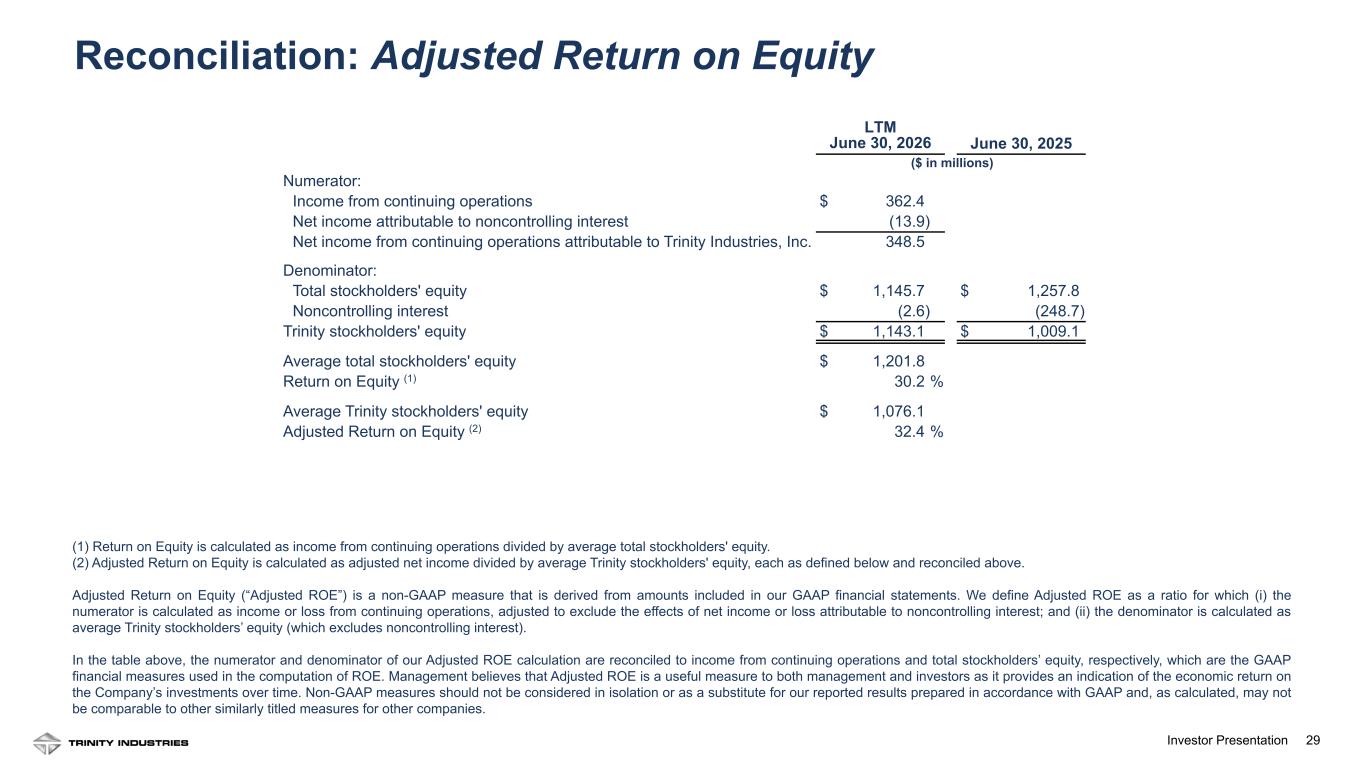
Thank you, Leanne, and good morning, everyone. We grew earnings per share year-over-year 10% in a quarter where revenue was down 16%. That's the operating leverage we've been building toward, and it shows up in a 24.6% adjusted return on equity over the last 12 months. Cash flow from continuing operations was $100 million. The business is performing the way we designed it to perform. Before I get into results, I want to recognize the team for closing a transaction after the quarter closed related to our railcar investment partnership with Napier Park. As a result of the transaction, approximately 6,100 railcars moved from our partially owned fleet to an investor-owned fleet and we took an 11.2% limited partnership interest in the Napier Park entity that owns the majority of Napier Park railcar holdings. We expect to record a noncash pretax gain of approximately $130 million in the second quarter related to this transaction. This transaction highlights the embedded value of our fleet and is another step in simplifying our balance sheet. Based on strong first quarter performance and our outlook for the balance of the year, we are raising and tightening our full year EPS guidance from a previous range of $1.85 to $2.10 to a new range of $2.20 to $2.40. At the midpoint, this represents a 16% increase in our EPS expectations. Portfolio sales are an integral part of how our leasing platform creates value, and we now expect a higher level of gain on sale activity this year than we originally planned. We expect full year gains to be in the range of $160 million to $180 million, which includes $22 million in the first quarter and approximately $130 million from the Napier Park railcar investment partnership that we will book in the second quarter. Now let me walk you through what we're seeing in the market. The rail economy is improving. Industrial production grew at an annual rate of 2.4% in the first quarter. The manufacturing PMI, a key monthly economic indicator, was above 50 for three straight months. That's the first back-to-back positive reading in over 40 months, and manufacturing has been expanding for 17 straight months. Inquiries have been trending up since the start of the year. Furthermore, cars in storage moved below 20% as the industry fleet continues to contract and carloads rose. The picture is not all plain, however: inflation is still elevated and employment has flattened. That continues to weigh on consumer-driven markets, particularly autos and intermodal, and tariff uncertainty remains. But the direction is the right one, and we're positioned for it. I'll take you through both segments, starting with leasing and services. Leasing performance: lease rates were higher, utilization was higher, and the segment delivered a 37.9% operating margin in the quarter. Revenue was down year-over-year, and the reason is structural: we closed a railcar partnership exchange in the fourth quarter, which reduced our consolidated fleet. Our own fleet ended the quarter at 101,960 railcars, down about 7% year-over-year. But the number that matters strategically is our combined owned and investor-owned fleet at 146,670 railcars, which is up 1.6% year-over-year. We are growing the platform and lease rates continue to rise. Renewal rates were 6.6% above expiring rates in the quarter. We continue to invest. Net fleet investment was $68 million in the quarter. Over the last six years, we've added more than 18,000 new builds and over 14,000 cars from the secondary market. We were active in the secondary market again this quarter, completing $83 million of lease portfolio sales. Fleet utilization improved to 97.3%. Renewal success was 60% and higher assignment activity allowed us to place cars with new customers at higher rates. The future lease rate differential, or FLRD, was a positive 1.2%. The FLRD has been positive for 19 consecutive quarters, allowing for continuing growth in lease rates and leasing revenues. The average lease rate continued to increase quarter-over-quarter and year-over-year. Rail products is where the costs showed up. We delivered 1,970 railcars at a 7.4% operating margin. On these volumes, that margin is a proof point. It reflects favorable Q1 mix but, more importantly, it reflects several years of rightsizing, automation and breakeven reduction in this business. The cost structure has changed with the remaining mix of car types to be built; we expect full year Rail Products Group margins to average 5% to 6%. We received orders for 1,660 new railcars. Both orders and deliveries remain within our usual market share range. Inquiries are accelerating, and we're ready to ramp up when increases convert to orders. Backlog stands at $1.6 billion, just under half of the industry backlog. We're not going to chase volume at the wrong price. When the market turns, we'll be there. Here's where we stand. We did what we said we'd do this quarter. Margins held up. The fleet is in good shape at 97.3% utilization. Lease rates moved in our direction, and Rail Products delivered a 7.4% operating margin on lower volumes, which is evidence that the cost work we've done over the past several years is paying off. The order book is the watch item. Inquiries are picking up and we're ready when customers are ready. I'm proud of how this team is executing, and I'm confident in where we're headed. Eric will take you through the financials and our guidance for the rest of the year.
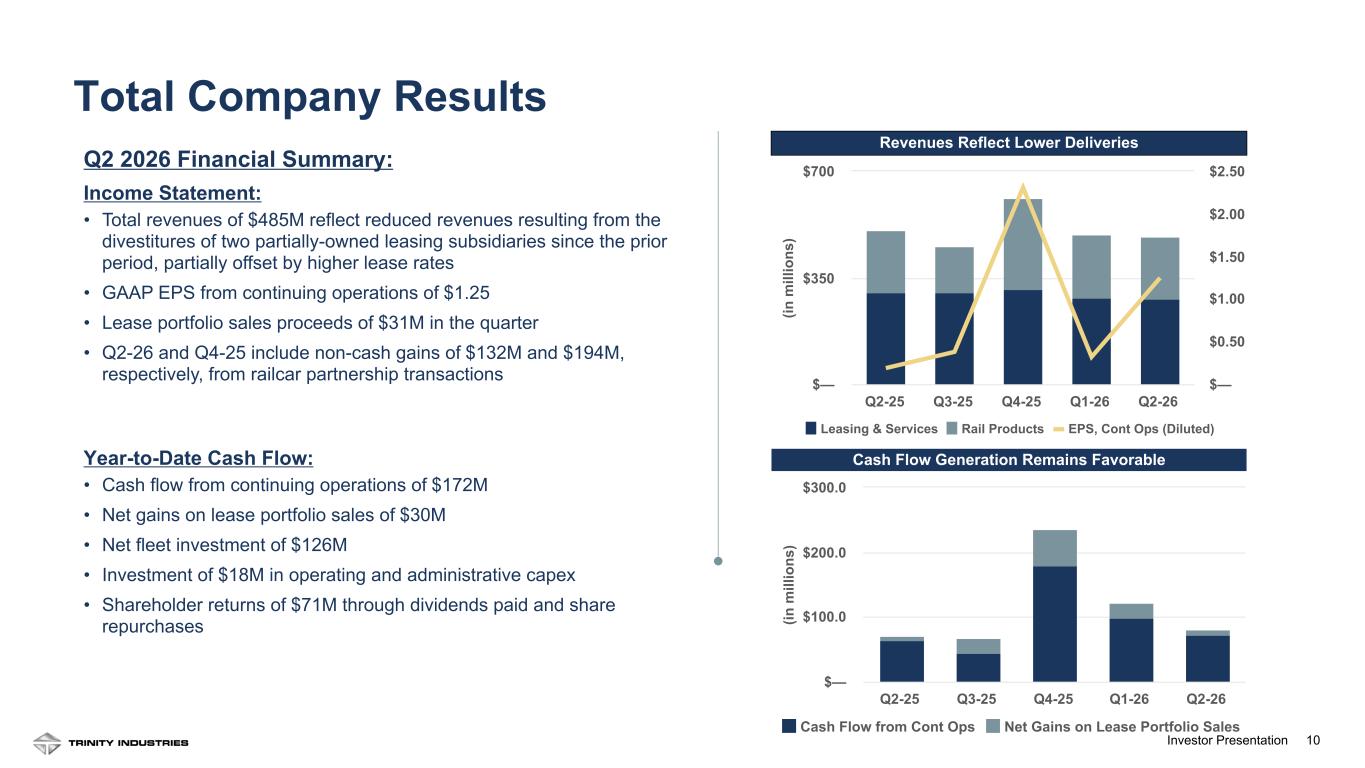
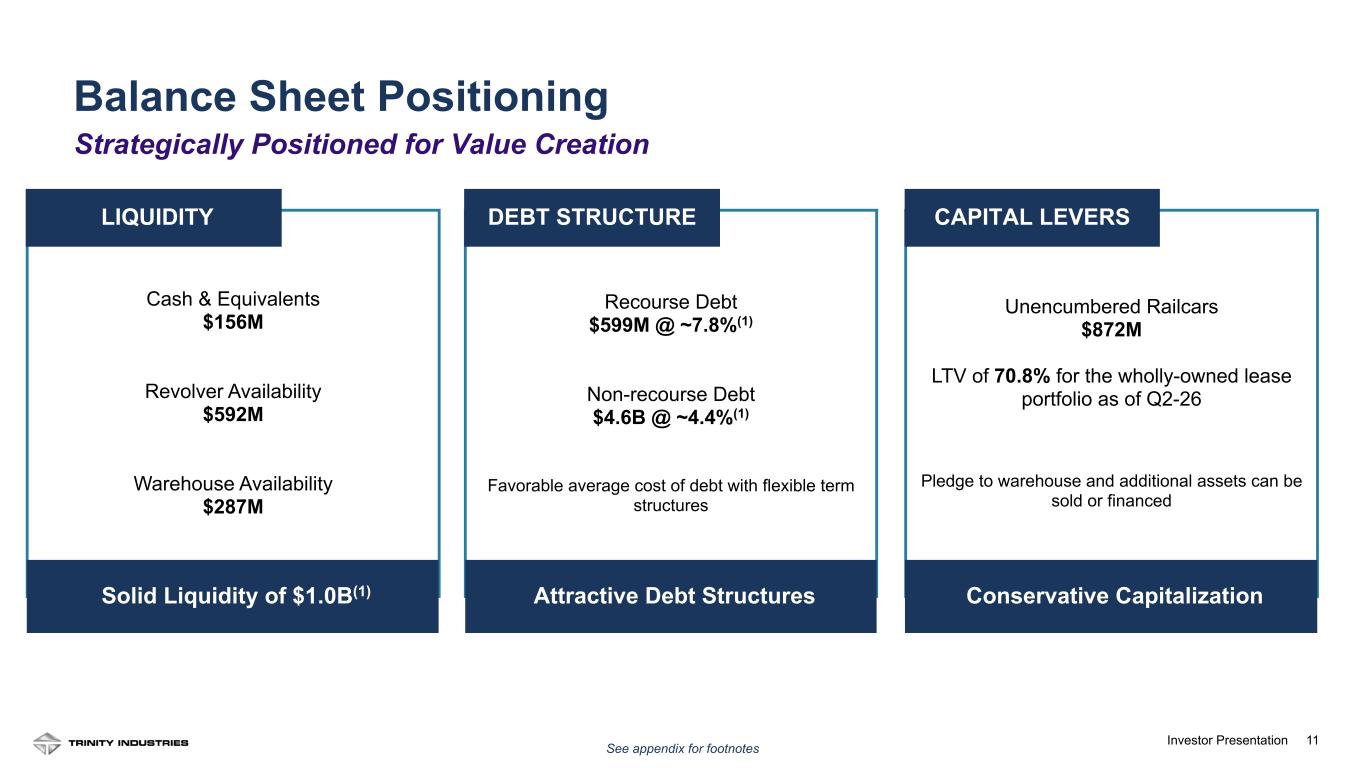
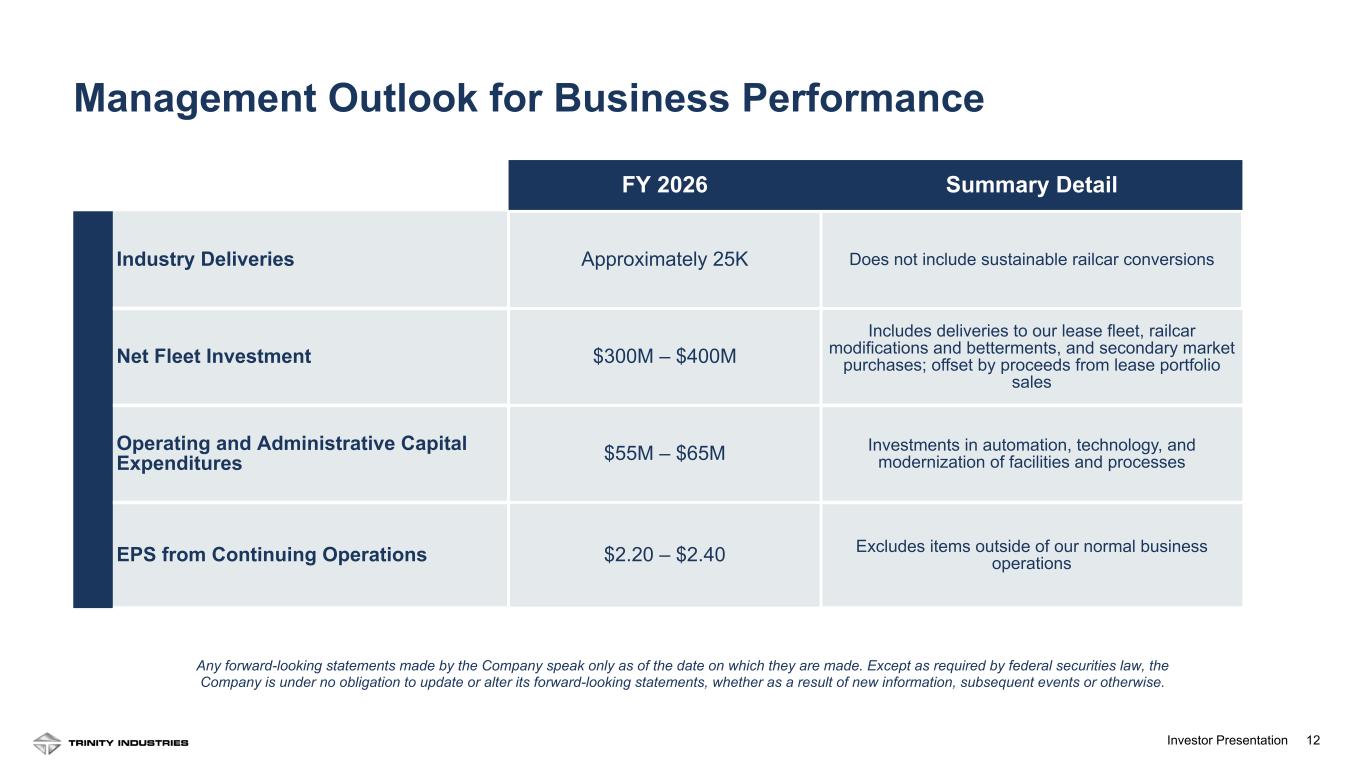
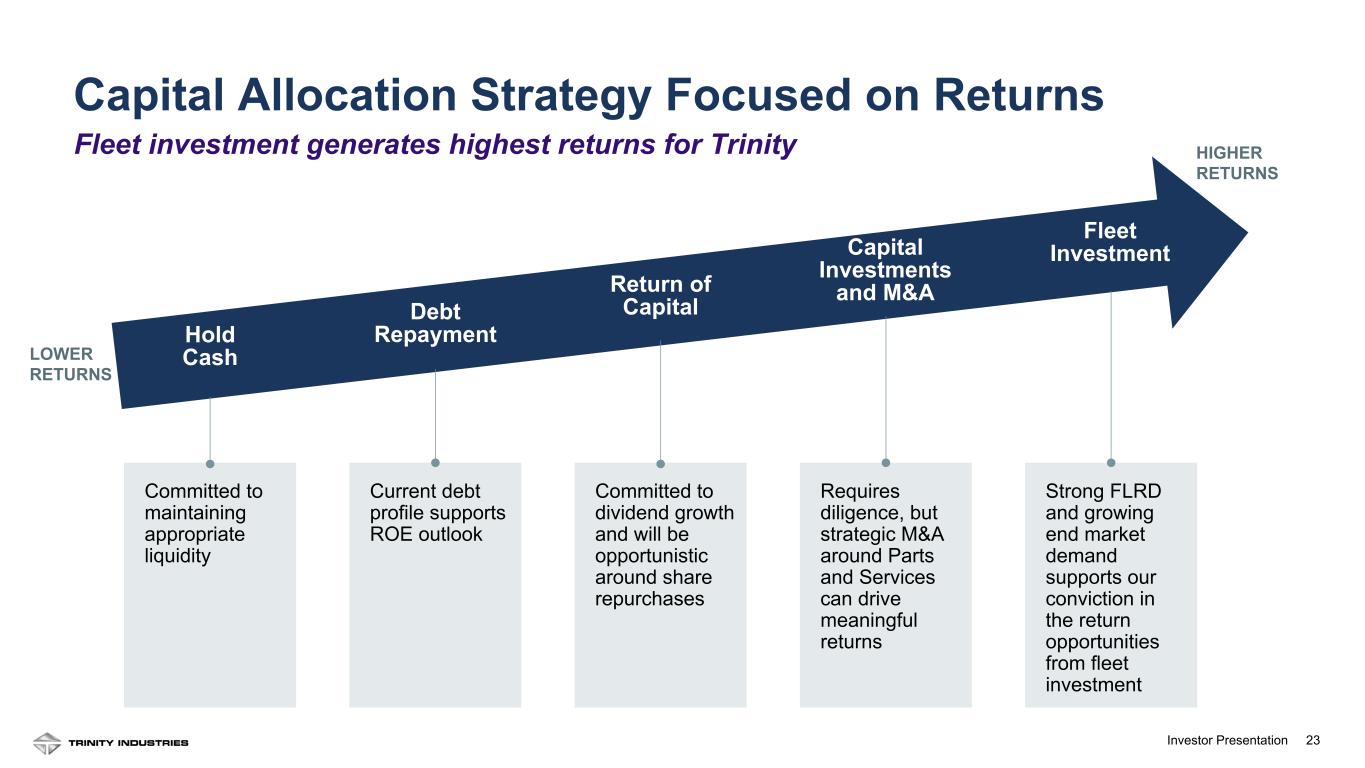
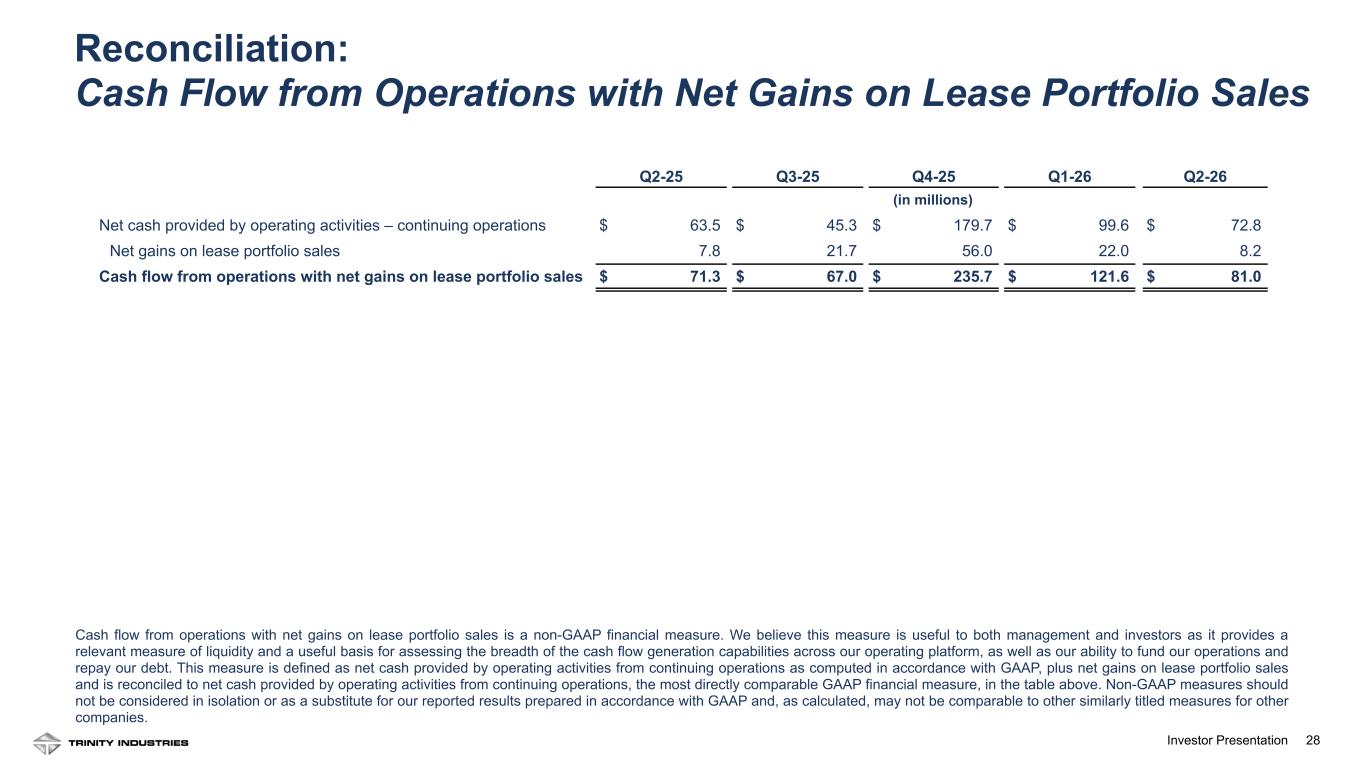
Thank you, Gene, and good morning, everyone. I will begin by discussing our first quarter financial highlights. Our operating margins expanded in both segments. Cash generation was strong at $100 million from continuing operations. Our business is generating good returns and is proving its ability to outperform the market, period. We have $1.1 billion of liquidity, and we continue to return capital to shareholders. Let me walk you through the income statement, cash flow and balance sheet, and I'll cover guidance for the rest of the year. First quarter revenues of $492 million reflected lower external deliveries in the Rail Products Group. However, as Gene mentioned, GAAP EPS from continuing operations improved as compared to last year to $0.32, which reflects higher gains on lease portfolio sales and higher lease rates, generating higher operating margins. We generated proceeds of $83 million in the quarter from lease portfolio sales and recorded a gain of $22 million. Moving to the cash flow statement: cash flow from continuing operations was $100 million and benefited from a reduction in working capital. Our total net fleet investment was $68 million in the quarter, which included new railcar additions, secondary market adds and fleet modifications and betterments. This includes $83 million of railcar sales in the secondary market. Shareholder returns were $32 million in the quarter, largely driven by our quarterly dividend payment as well as share repurchases. For the three-year period, 2024 to 2026, we set a target for our cash flow matter which adds cash flow from continuing operations and net gains on portfolio sales of $1.2 billion to $1.4 billion. With three quarters remaining in the planning period, we expect to exceed this range. There is a significant amount of cash generation, and we are constantly working to make optimal choices on how we grow our fleet and improve the returns of our business. Moving to our balance sheet: we have solid liquidity of $1.1 billion. The loan-to-value for our wholly owned fleet is 69.1%. It is worth noting that the market value of our fleet is much higher than the book value of our fleet, and our LTV is based on the net book value. The debt structure on our balance sheet gives us significant flexibility and liquidity as we execute on our capital allocation framework, demonstrated by our latest financing. After the quarter closed, we issued $481 million of ABS notes and used the proceeds to redeem $377 million in outstanding debt, generating approximately $100 million of excess cash, providing further evidence of our cash generation abilities. And now I'd like to give some updated guidance for the rest of the year. We expect industry deliveries of 25,000 railcars in 2026 and expect Trinity to maintain its historical share of deliveries. While there is still some available capacity to be sold for the end of 2026, current inquiry levels support maintaining this guidance. We are slightly lowering our expected full year net lease fleet investment to a range of $350 million to $450 million, reflecting expected higher proceeds from railcar sales. As a reminder, this is a cash metric, so this would not include the sale of railcars in the Napier Park RIV program. We are investing $55 million to $65 million in operating and administrative capital expenditures. And as Gene mentioned, we are raising our full year EPS guidance to a range of $2.20 to $2.40, a 16% increase at the midpoint. This comes from higher-than-expected gains in the railcar partnership transaction as well as higher forecasted gains from the secondary market. We expect full year gains to be in the range of $160 million to $180 million. Our first quarter demonstrates the operating leverage we've been building. The business is built to perform throughout the cycle. Our disciplined cash flow management and optimized balance sheet give us flexibility in capital allocation and working capital management. Our lease fleet utilization is high, generating consistent, predictable revenue and cash flow. In short, our platform is performing; today's results and 2026 guidance reflect our conviction in Trinity's ability to continue to generate above-market returns for our shareholders. Operator, we are now ready for our first question.
Operator
Operator provided instructions on the call. The first question comes from Harrison Bauer of Susquehanna.
Speaker 4
Maybe just to start off with the gains. I mean backing into what you did in the first quarter and what's expected from the transaction in the second quarter, there's only a range of $10 million to $30 million in terms of gains for the rest of the year in the second half and maybe excluding the deal in the second quarter. So could you just maybe walk through where you think there might be some declines in secondary market activity? Like what's maybe one of the reasons why you would expect lower gains in the second half of the year potentially?
Harrison, this is Eric. I'll take that. Yes. As you know, the gains can be a little lumpy. And certainly in the second quarter, with the Napier Park transaction, they will be a little lumpier. In terms of your point about the guidance implying a lower level of gains in the back half of the year, I'd just say it is still a very elevated number. We are really focused on our net fleet adds and our growth of our fleet. We're in the upper range of our three-year target. We did bring that target down this quarter by $100 million, which reflects a little more selling activity out of the portfolio. Most of the raise is certainly attributable to our outlook on gains going forward. Overall, the secondary market is still strong.
Speaker 4
Understood. Can you give us maybe a sense of where that transaction with Napier Park ended up relative to your initial expectations in terms of either the structure or the amount of the noncash gain that you expect?
First, on the structure. The structure is a little different than the last one. We took an 11% interest in all of the Napier assets. Both structures are noncash, but certainly, we like having that alignment of that interest in the broader portfolio. It will be a little different accounting with equity method accounting going forward, and so you won't have a minority interest. From that standpoint, it will simplify things. In terms of our expectations on our fourth quarter earnings call, we had not completed this transaction at that point. It was included in our guidance, but we certainly didn't have anything completed. Part of the raise is attributable to a higher gain with the Napier Park transaction. So it came in a little better than we expected, and that was just through our negotiations.
Speaker 4
Okay. Great. Maybe just shifting to the FLRD. Obviously, that number trended down a little bit. There's some mix — it is forward-looking, but there are some mix dynamics. Could you maybe paint a picture how you would expect or could expect earnings in the leasing segment to potentially grow even if your renewal rates tend to flatten out? You've called out some cost pressures in that business. And maybe if you can offer how you would expect the FLRD to maybe trend with gains or level of secondary market over time, if the stagnation in that number might also correlate with some general lower secondary market activity.
Speaker 2
Sure, I'll take that one. When you look at the FLRD, we stated it had been positive for 19 consecutive quarters and so that's a good trend. Utilization went up to 97.3% and cars in storage went down. Inflation is still high. Overall, the parameters are around our lease rates are still positive. We had a 6.6% uptick in the renewal rate versus expiring rate in the quarter. Our average lease rate went up quarter-over-quarter and year-over-year. So all of those are still trending in the right direction. In the first quarter, we did have a little bit of mix that affected us. If I was a betting person, I bet we're going to beat that percentage going forward. So it really comes down to the mix of cars and then what's expiring in the next four quarters. Sometimes, the mix helps us. Sometimes it brings us down a little bit. But we still see headroom for increasing the overall lease rate, especially since new car costs are continuing to be elevated, and that gives us some of that headroom.
Speaker 4
Okay. Great. And then maybe just to close for me, just shifting over — you mentioned elevated new car costs — and shifting over to the manufacturing segment. It's nice to see the results strong there in a lower delivery environment. But could you maybe give us some updated thoughts around the recent Section 232 tariffs on the full value of imported tank cars? What are the implications for your business, if there's any cost associated that are factored into your guidance at all? And maybe just with that, if you can update us on your tank car production mix, how much of it might be produced in your Longview plant versus Mexico? Any general thoughts around your tank car production and what this potential tariff might mean for your business?
Speaker 2
Sure. We've been dealing with the uncertainty of tariffs for a while now, and the team has gotten really good at looking at that. We'll continue to monitor how it may affect us and then adjust what we're doing based off of that information. Uncertainty remains, and I don't see that going away, but the team is on it and they've done a great job so far working on that. We typically don't disclose what percentage of cars are being produced where, so we're not going to do that. But we're still continuing with the 25,000 industry deliveries for the year and our portion of that in our normal range, which is somewhere between 30% and 40%. So not a lot of major changes on that.
Operator
The next question comes from Andrzej Tomczyk of Goldman Sachs.
Just kind of curious on leasing to start out. First, maybe just more broadly in the context of a potentially sticky inflation environment, particularly given higher energy prices globally more recently, how do you communicate with customers who lease railcars from you currently that asset prices are higher and are you thinking ahead to the next wave of resigning leases and expecting another positive cycle of growing lease rates and potentially reaccelerating that FLRD?
Speaker 2
Okay, Andrzej, I'll take that. As I said before, if I was a betting person, I would bet it would be above the 1.2%. It really comes down to the mix in that quarter and what is going to show. When we're looking overall at the environment, the metrics are in favor of being able to continue to raise the lease rates. Now we are lapping some rates that had already been raised during this period. During that 19 consecutive quarters of positive FLRD, we have to keep that in mind. But overall, when we look at things like agriculture and energy markets, they are really strong. If I look at some of the weaker markets in chemical, it's weaker not from carloads but from their margins. There's a little bit of weakness there and then consumer products, which we don't have a lot of cars in our fleet that are consumer-facing. So overall, when we look at our mix, we still see an opportunity to raise those rates.
Andrzej, I'd just add: the energy prices you're alluding to, I'm assuming, relate to oil and what's going on in the Middle East. While that is starting to come through in some of our supply chain costs, it probably hasn't worked all the way through yet, so that continues to be a factor. I think you're alluding to what could be the next wave of inflationary pressures. It certainly could happen; interest rates are starting to signal that as well with what treasuries are doing. The fleet remains very tight. It's in balance, and so that will start to potentially price through in the future.
Understood. And I think last call you talked about the market value of your fleet and that that's, I think, 40% to 50% above book value. Any updates to those numbers? And have you looked at that historically to determine, on average, how much the market values exceed book values, just trying to get a sense for market value versus book value this cycle and how that dynamic might be different?
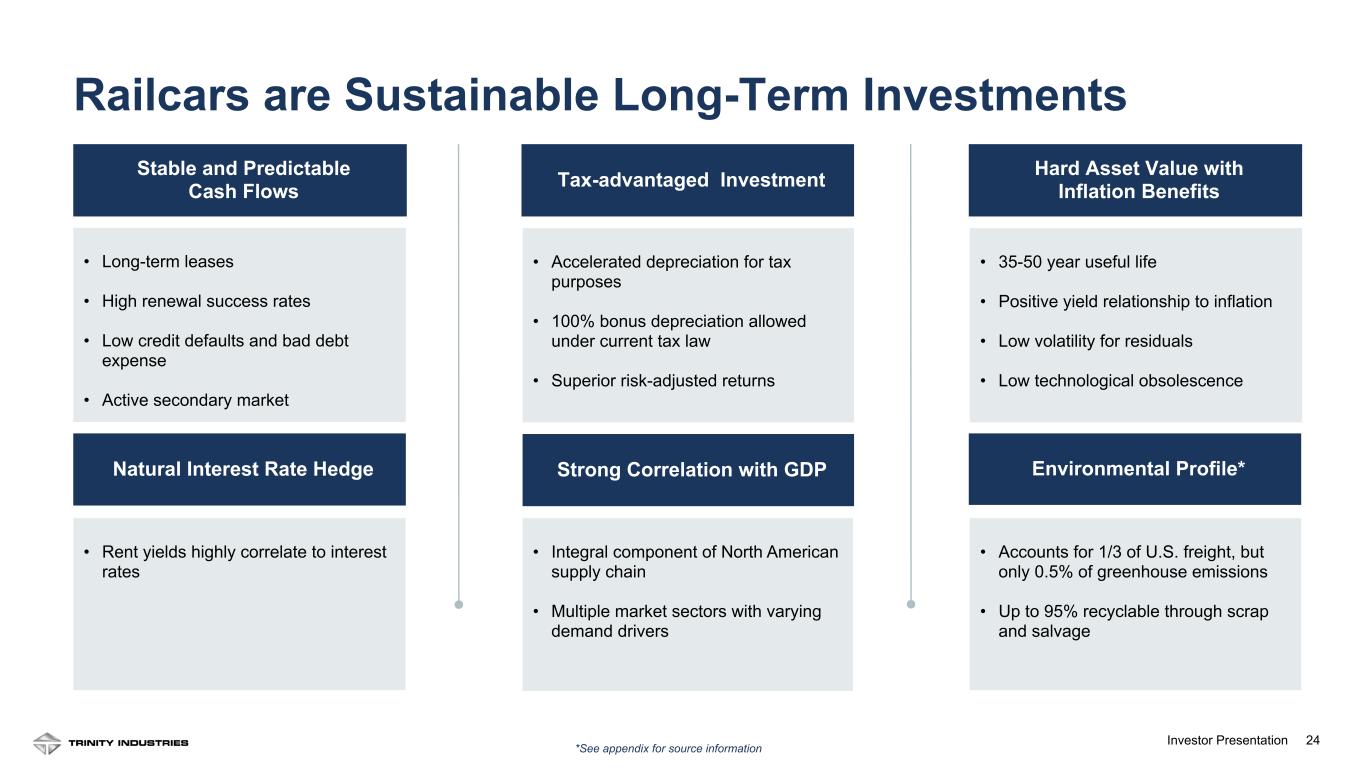
Yes, Andrzej. We talked last quarter about our estimate that market values were 35% to 45% higher than our carrying values. We have not updated that view; that is still our view. If you go back over the last four or five years, you've had more inflation in this industry than if you go back the prior five years, and so it probably has accelerated. I haven't gone back and back-tested it, but certainly it has trended higher with inflation rates. Just to mention long term, we see 3% to 4% inflation in railcar asset prices and long-term lower inflation in lease rates at 1% to 2%. That implies there is still room for lease rates to catch up to what we've seen on the asset side. Financing costs and treasury rates certainly support our view that that will happen over time.
Understood. Just on that last point on leasing, how are you thinking about the spread between lease rates and your cost of capital today? And looking forward, how is that influencing your appetite to grow the lease fleet?
I don't think our hurdle rates versus our weighted average cost of capital have changed dramatically. It certainly changes often with the volatility you've seen, especially in treasury rates. In terms of the spread over our weighted average cost of capital, we're being fairly consistent around that. It may vary by different car types, but we are certainly seeing disciplined lease pricing in the market. That has been good.
Okay. Got it. Maybe shifting gears a little bit to the manufacturing side: it did seem like a really nice margin performance there despite volumes down 36%. You improved EBIT margin 120 basis points year-over-year. Could you just talk a little bit more about the cost takeout initiatives there — what's driving that — and then also why you would still expect the 5% to 6% full year average margins given the Q1 outperformance?
Speaker 2
Sure, I'll take that one. First, on the cost initiatives: the team has done a great job for several years working on continuous improvement, reducing setup time and adding automation to our facilities. All of that comes together to help with both efficiency and overall productivity. That work continues. We're always looking to see what else we can do to help both from the safety and productivity standpoint. In Q1, we had some favorable mix and more specialty cars produced in that quarter. In Q2 through Q4, we're expecting more standard cars, so fewer specialty cars will be produced. Looking at where we're at, a 5% to 6% performance at these volumes shows a structural change in our facilities and our ability to produce. That is something I'm very happy with and something we've been working on for several years. It's lowered our breakeven cost. The Rail Products Group operations are performing very well, and when we get some volume back, I think you'll see that leverage come through.
Understood. And just on headcount in manufacturing: I know that doesn't get talked about often on the call, but could you maybe talk about where headcount is today versus, say, the peak, and then following on to that, what the lag might be to hiring and bringing new labor online relative to when you see orders and backlog start to improve?
Speaker 2
Sure. Typically, when orders or backlog come up and the production rate has to improve, we'll go to overtime first, and that's about a 20% to 30% uptick that you can get from that. The good thing we've got in our favor is that during the downturn a lot of employees said they want to come back, so when we start rehiring we'll go to those employees first. Now it doesn't mean they come in and are 100% productive right away — we'll have to go through some retraining, and there will be time to get their efficiency back up as they get used to where they're working on the line. But we think we'll have an easier time getting those employees back into the factory. We see the ability to move a little quicker than we did coming out of COVID in getting production rates up. When you look at total employment for the company several years ago, we were about 10,000 employees, and right now it's closer to 6,000 employees. A lot of that would have been in the production space in that swing. Some of that change coming out of COVID was hiring new employees who had never worked in the industry; you had to hire more to get over that efficiency and productivity gap. I think it will be less of an issue as we ramp back up for the next increase in volume.
Understood. I appreciate the color. Maybe two final questions: One, what's the earliest indicator that you guys are watching internally that would tell you demand is going to inflect either positively or negatively soon? I know ISM has been a decent indicator historically; anything specific you track? And secondly, looking ahead, the $160 million to $180 million of gains this year: is that sustainable on an annual basis if we look beyond 2026?
Speaker 2
Sure. A couple of the key metrics we're watching: utilization is one — the tightness in the market overall and cars in storage. Also, inquiry levels: they've been positive since the start of the year and have picked up. They do have to convert to orders, but in the first quarter we saw some conversion. We're having positive conversations again this quarter. We closely follow PMI and manufacturing indexes as well. All of those are good indicators that things look positive. We still have to see the order rate get up to get us back to what we thought next year might be closer to 30,000 to 35,000 industry builds. On the gains question: selling in the secondary market and buying in the secondary market are integral to the way we run our business. I would expect you to see us doing both in some form every year. When we get closer to 2027, we'll give you more guidance on what we think will happen in 2027.
Operator
That was the last question.
Speaker 2
Well, thank you for joining us today. Our first quarter results highlight the operating leverage we've been building and the progress we're making across the business. We remain focused on disciplined execution, delivering for our customers and creating value for our shareholders. Thank you for your continued interest in Trinity.
Operator
Ladies and gentlemen, the conference is now over. Thank you for choosing Chorus Call, and thank you for participating in the conference. You may now disconnect your lines. Goodbye.