Operator
Good day, and welcome to the Trinity Industries, Inc. Fourth Quarter and Full Year Ended December 31, 2025 Results Conference Call. All participants will be in listen-only mode. Should you need assistance, please signal a conference specialist by pressing star then 0 on your telephone keypad. After today's presentation, to withdraw your question, please press star then 2. Please note this event is being recorded. Before we get started, let me remind you that today's conference call contains forward-looking statements as defined by the Private Securities Litigation Reform Act of 1995 and includes statements as to estimates, expectations, intentions, and predictions of future financial performance. Statements that are not historical facts are forward-looking. Participants are directed to Trinity Industries, Inc.’s Form 10-K and other SEC filings for a description of certain of the business issues and risks, a change in any of which could cause actual results or outcomes to differ materially from those expressed in the forward-looking statements. I would now like to turn the conference over to Leigh Anne Mann, Vice President of Investor Relations. Please go ahead.
Thank you, Operator. Good morning, everyone. We appreciate you joining us for the company's fourth quarter and full year 2025 financial results conference call. Our prepared remarks will include comments from E. Jean Savage, Trinity Industries, Inc.’s Chief Executive Officer and President, and Eric R. Marchetto, the company's Chief Financial Officer. We will hold a Q&A session following the prepared remarks from our leaders. During the call today, we will reference certain non-GAAP financial metrics. The reconciliations of the non-GAAP metrics to comparable GAAP measures are provided at the appendix of the quarterly investor slides and are accessible on our Investor Relations website at www.trin.net. These slides are under the Events and Presentations portion along with the fourth quarter earnings conference call event link. A replay of today's call will be available after 10:30 a.m. Eastern Time through midnight on 02/19/2026. Replay information is available under the Events and Presentations page on our Investor Relations website. It is now my pleasure to turn the call over to E. Jean Savage.
Speaker 2
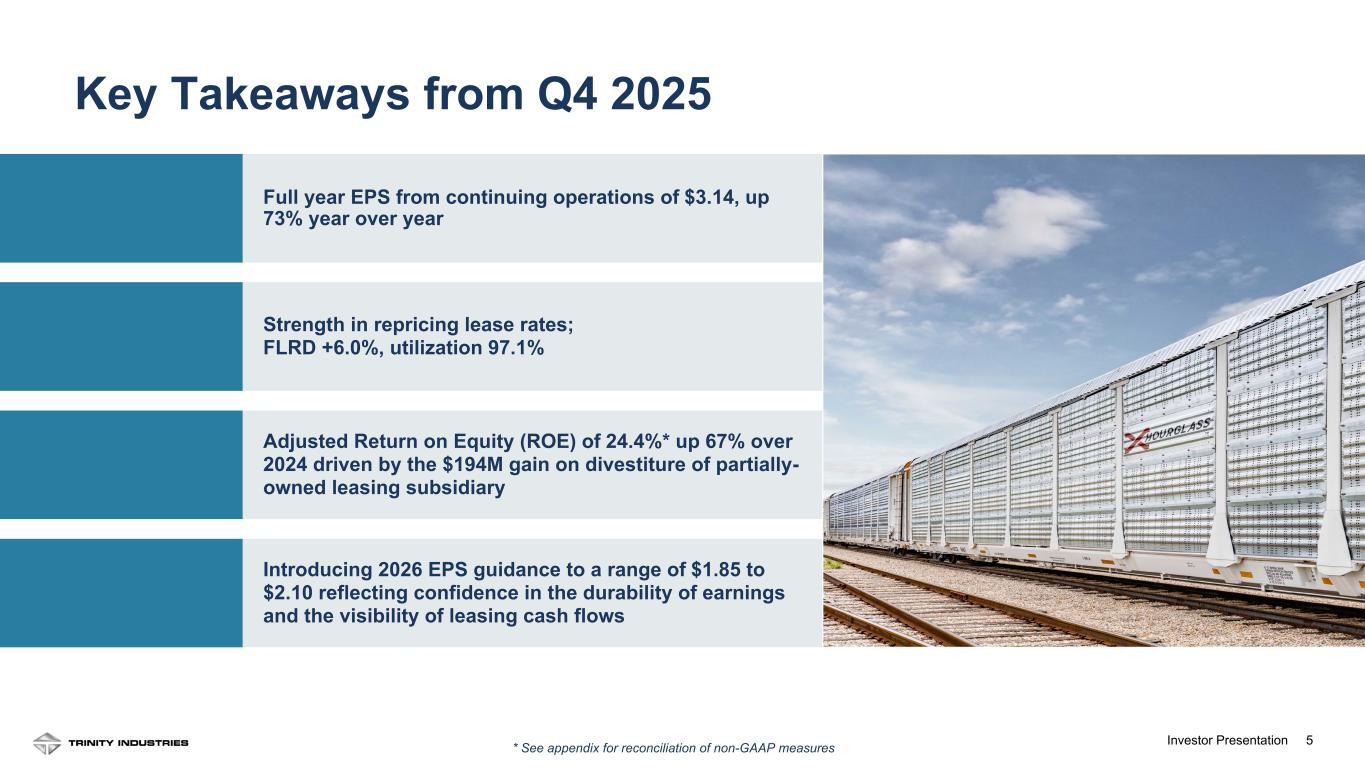
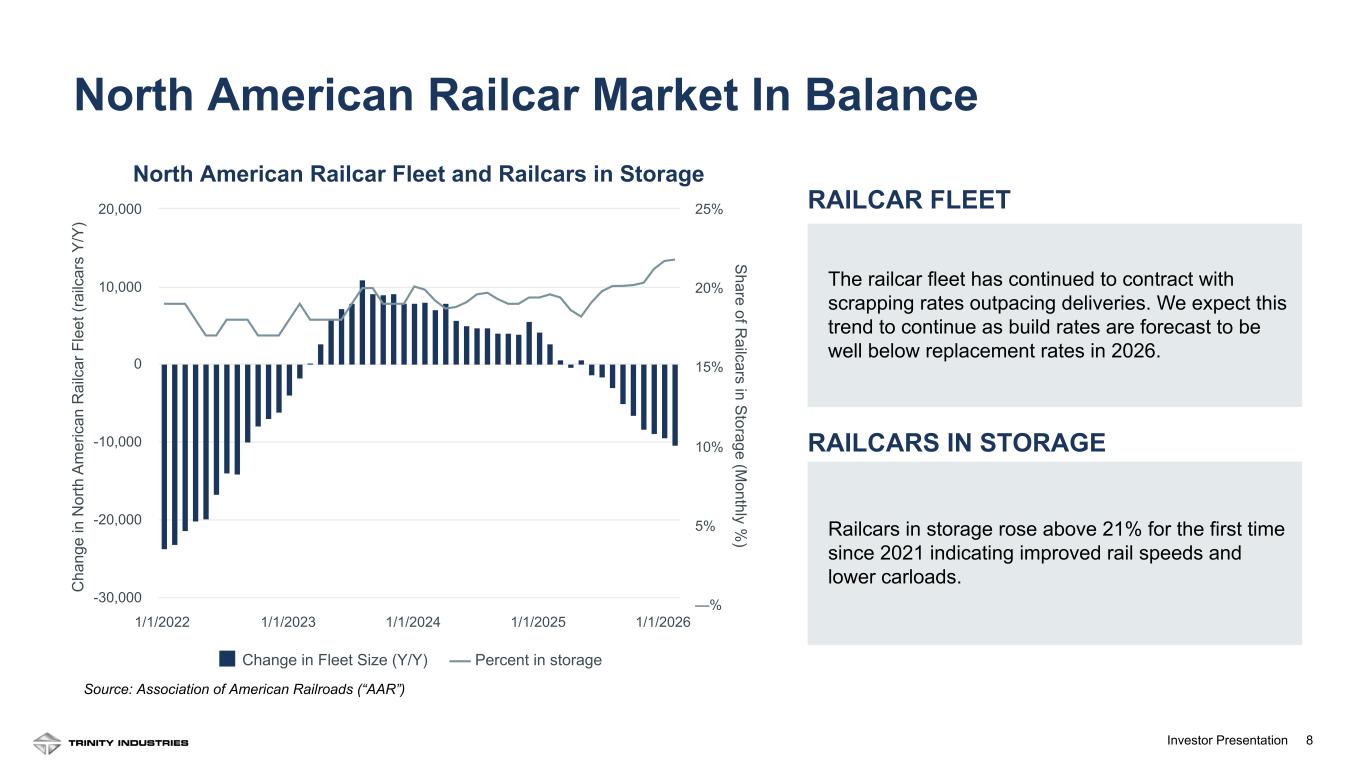
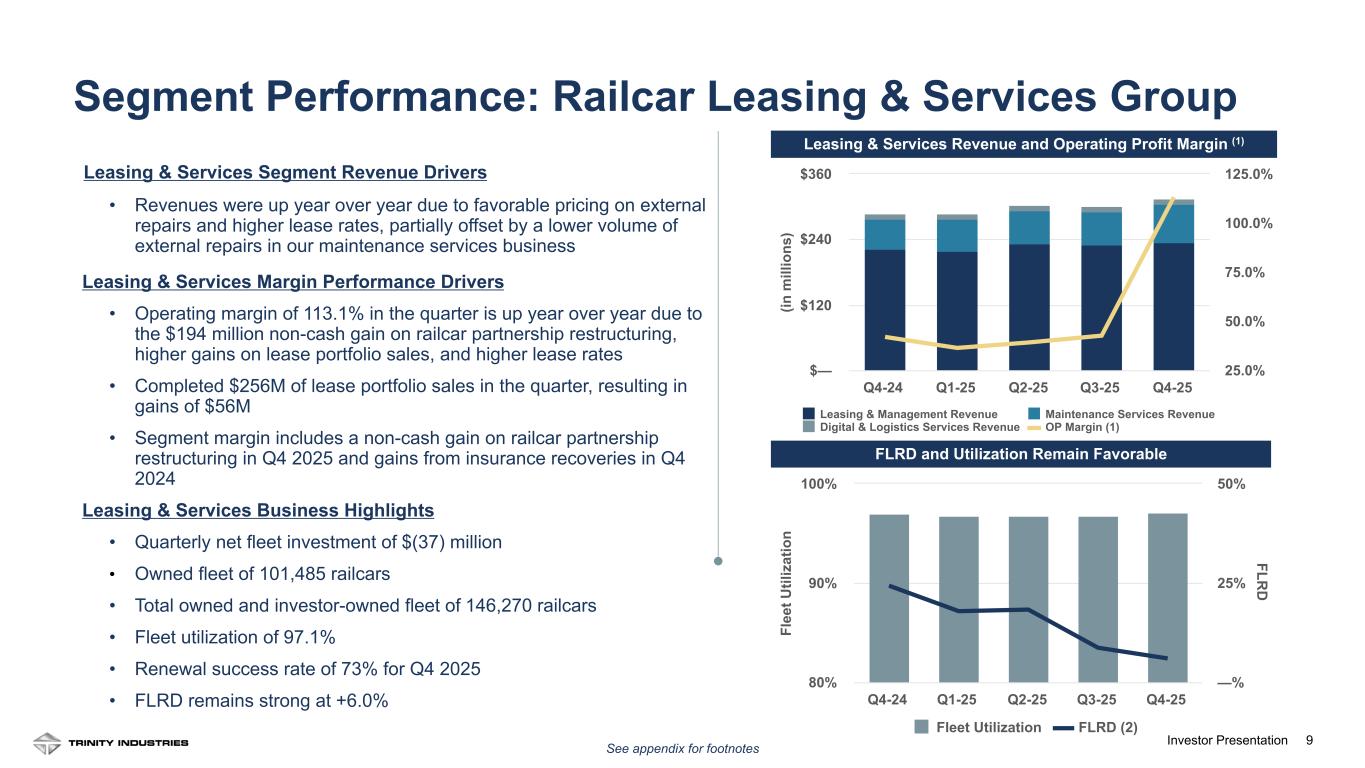
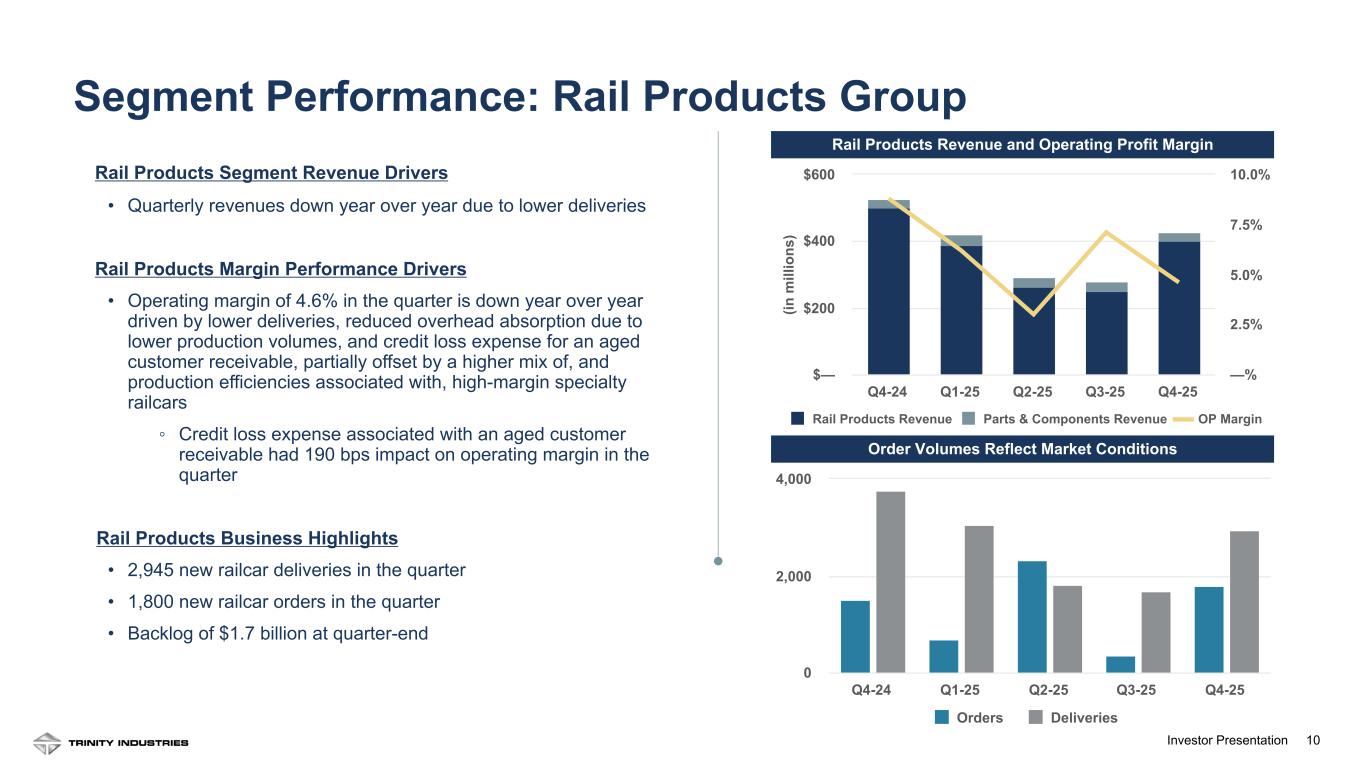
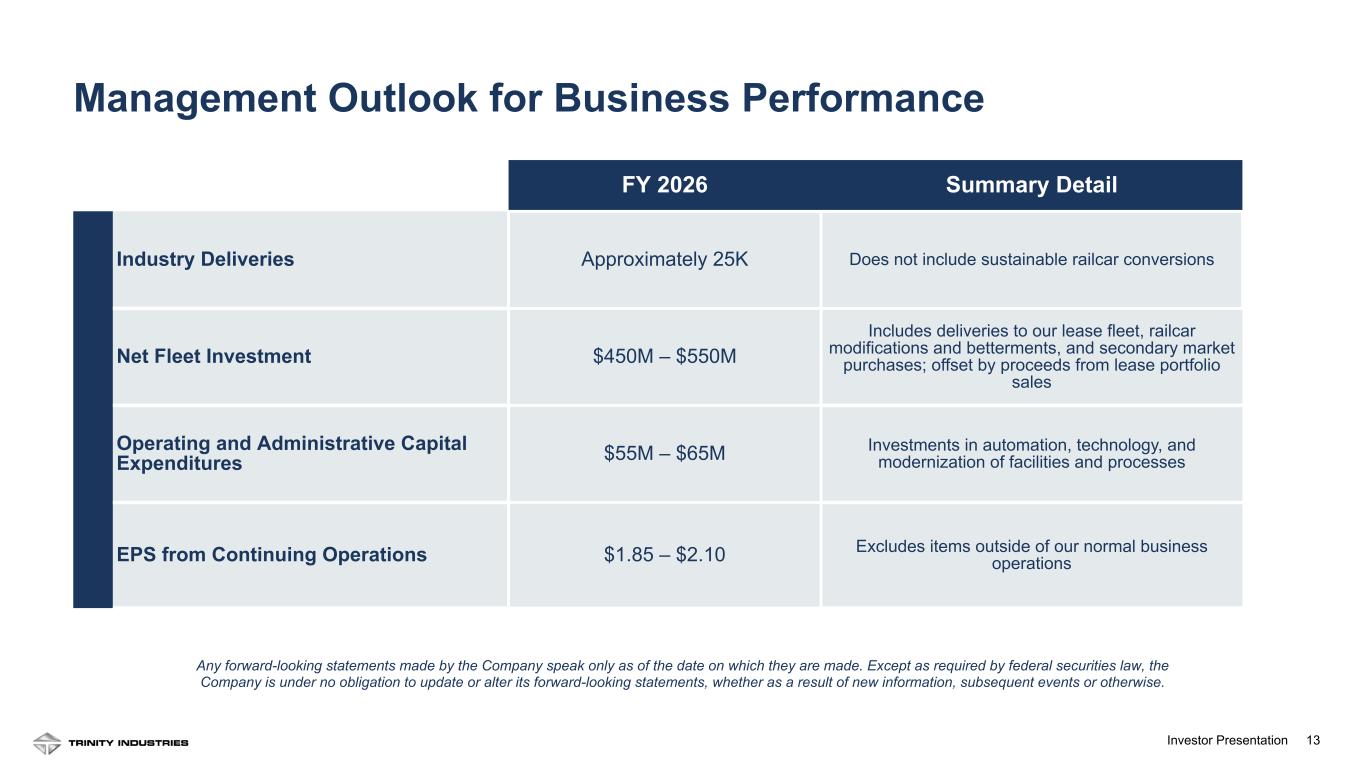
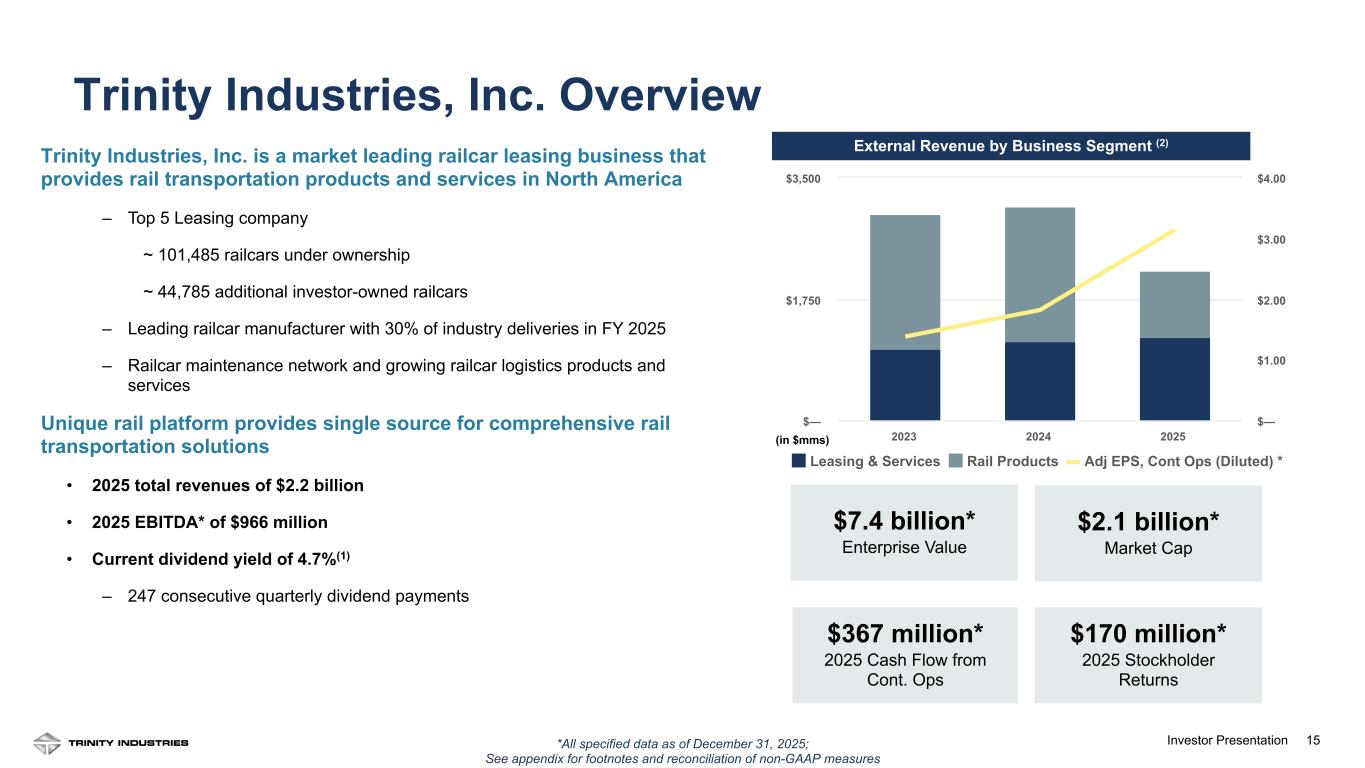
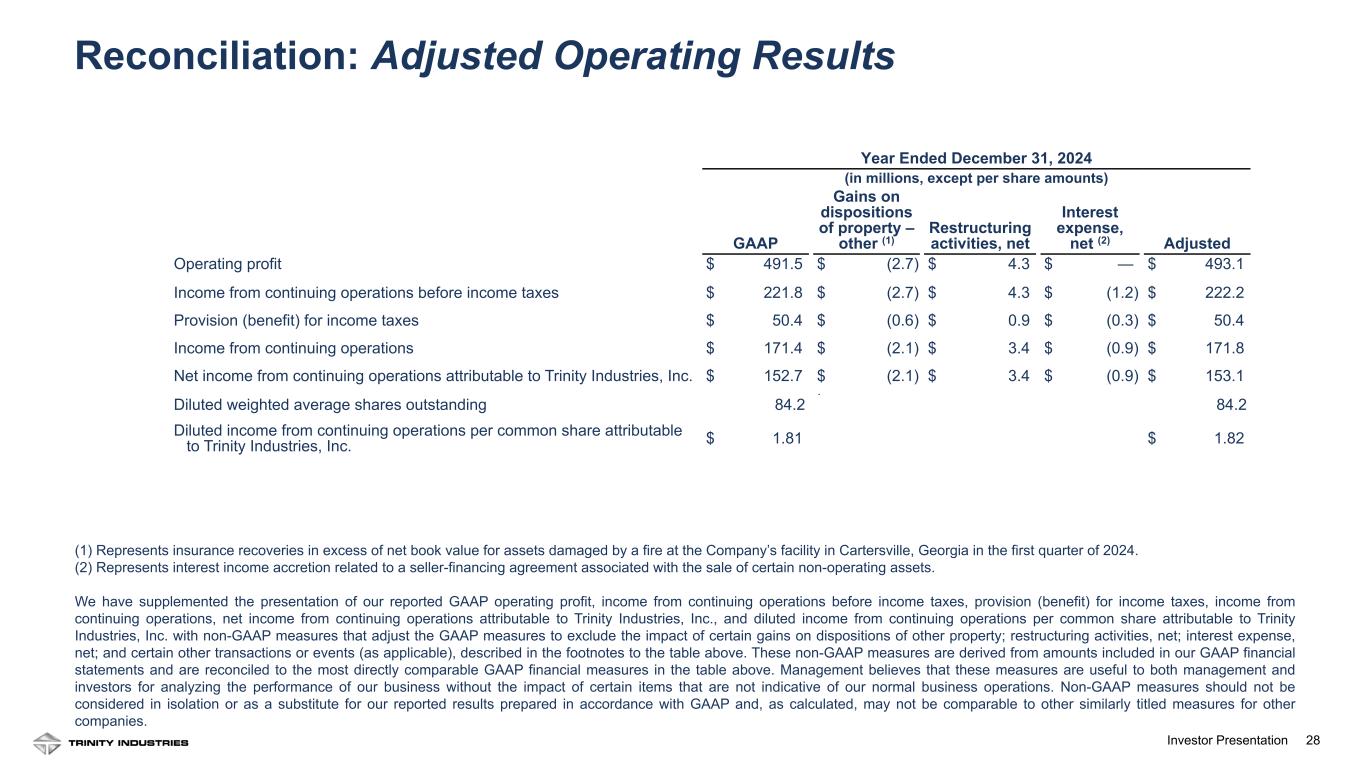
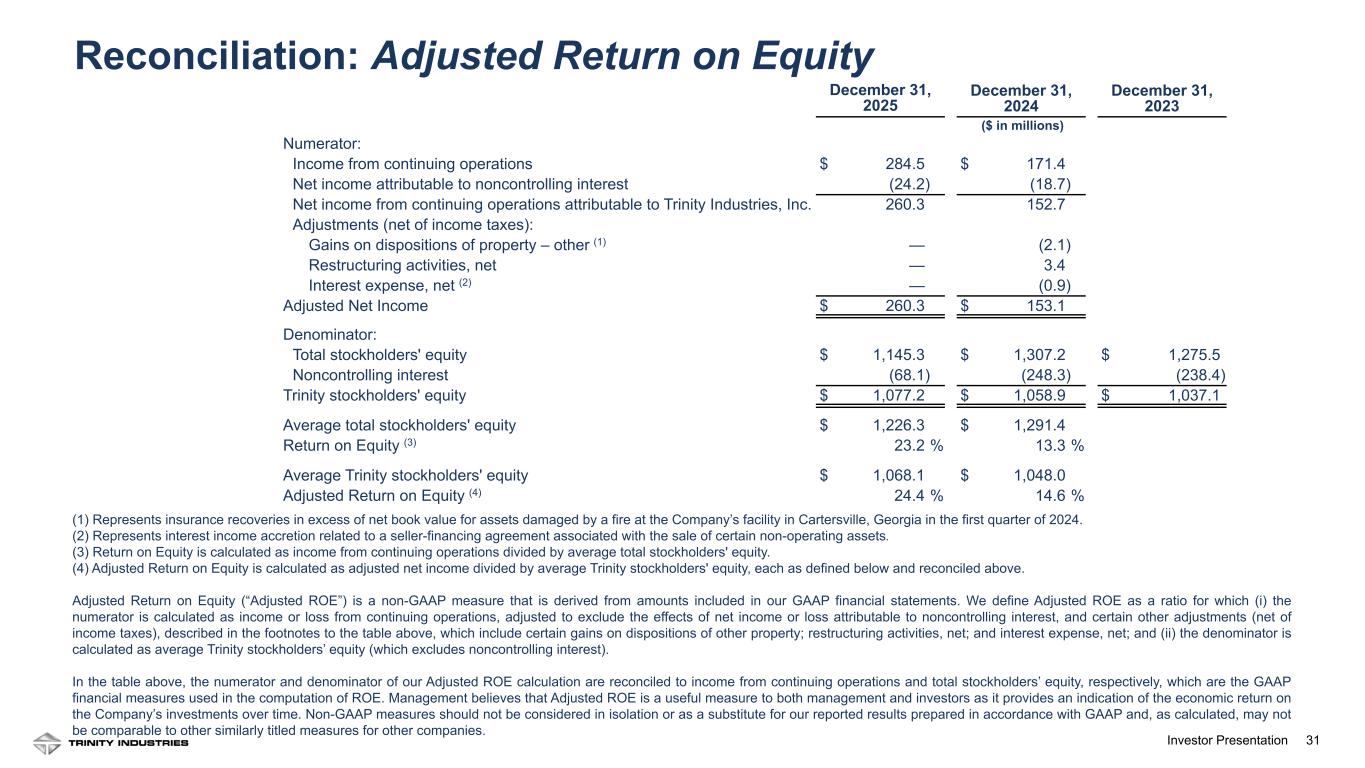
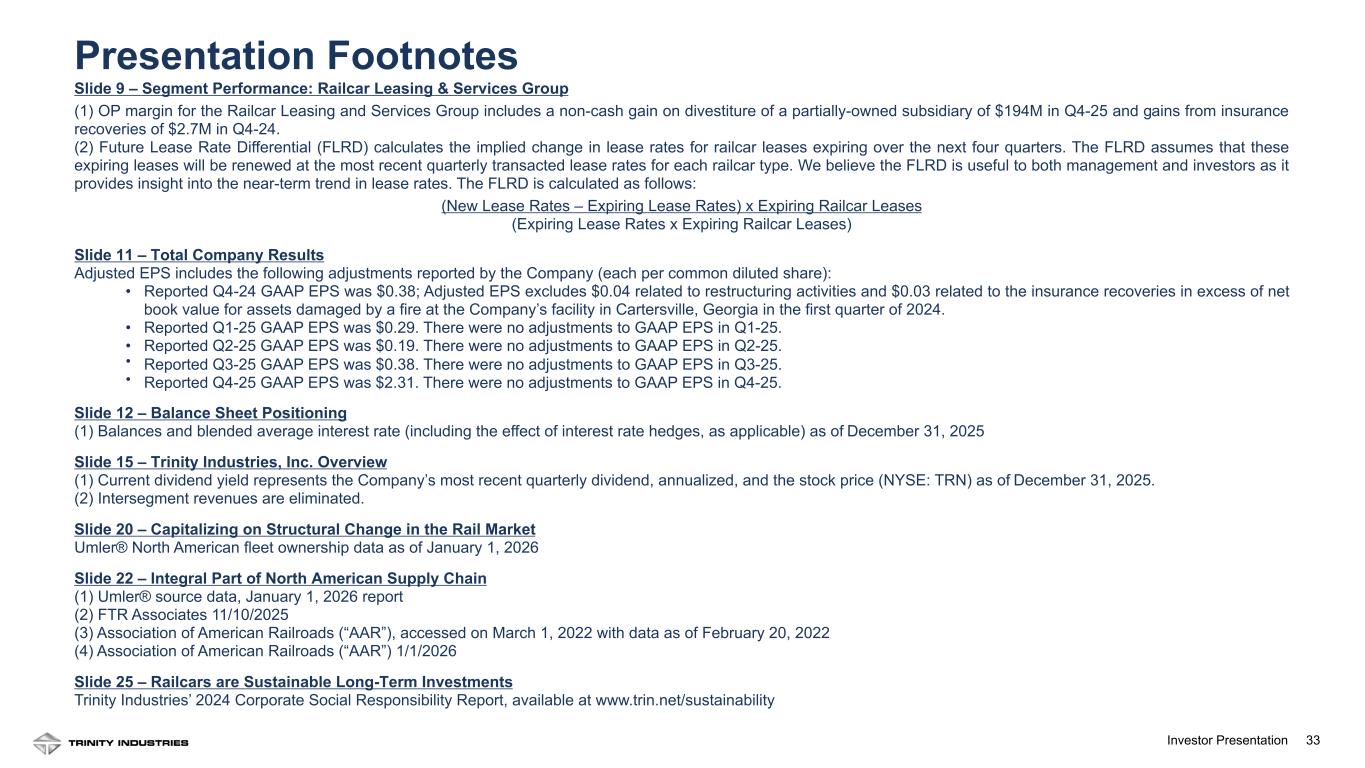
Thank you, Leigh Anne, and good morning, everyone. Our 2025 results demonstrate the durability of Trinity Industries, Inc.’s business model and the effectiveness of our strategy across the cycle. We are intentionally structured to generate resilient earnings, strong cash flow, and attractive returns in a wide range of market conditions, and this year's performance reinforces that positioning. For the full year, we delivered earnings per share of $3.14, representing a 73% year-over-year increase, and achieved an adjusted return on equity of 24.4%, up 67% from the prior year. These results reflect the strength of our leasing platform, disciplined execution in the secondary market, and resilient manufacturing performance in a low-volume environment, and a significant year-end transaction that not only enhanced earnings, but also highlighted the substantial embedded value of the railcar assets on our balance sheet. Looking ahead to 2026, we are introducing an EPS guidance range of $1.85 to $2.10. Our guidance reflects confidence in the durability of our earnings and the visibility of our leasing cash flow. Lease rates continued to trend higher, supported by healthy demand, even as the pace of growth moderates in certain railcar categories. The buying and selling of railcars is a key value driver of Trinity Industries, Inc.’s business model. We expect industry deliveries of approximately 25,000 railcars in 2026, well below replacement levels but reflective of current industry backlogs. Importantly, despite lower delivery volumes, we expect solid operating margins driven by disciplined execution and the realization of the cost actions we have implemented. Eric will walk through our expectations for 2026 in more detail shortly. I will begin with a brief market overview followed by a closer look at our fourth quarter and full year performance. The North American railcar fleet continued to rationalize in 2025 with retirements exceeding new deliveries, resulting in a net fleet contraction. In 2025, approximately 31,000 railcars were delivered, while more than 38,000 older cars were retired. At the same time, rail network fluidity has shown meaningful and sustained improvements. As efficiency has improved, railcars in storage rose above 21% for the first time since 2021, reflecting faster cycle times and the normalization of carload demand. While our 2026 delivery expectations are muted, we are optimistic about the pickup we have seen in inquiry levels and orders in the fourth quarter. We remain disciplined in our order intake while maintaining readiness to respond as demand strengthens. In 2026, agriculture, energy, and nonresidential construction end markets are showing strength. Headwinds remain in key consumer and chemical markets, like automobiles and chlor-alkali. I will now highlight segment performance for the quarter, beginning with the Railcar Leasing and Services segment, which includes leasing, maintenance, and digital and logistics services. The Leasing and Services business remains the foundation of Trinity Industries, Inc.’s earnings stability. Full year revenues increased 5.5% year over year driven by higher lease rates and net fleet growth. Net lease fleet investment totaled $350 million at the high end of our guidance range, and we used the secondary market effectively as both a buyer and a seller to strategically grow and strengthen the composition of our lease fleet. Segment operating profit increased 53% year over year supported by the railcar partnership restructuring we completed with Napier Park in December, recording a $194 million noncash gain in the segment. Additionally, we recorded $56 million in gains on railcar sales in the fourth quarter, resulting in a full year gain of $91 million. Fleet utilization remained strong at 97.1% with renewal success of 73% in the fourth quarter. While the future lease rate differential, or FLRD, moderated to 6% as renewal growth normalized, renewing rates were 27% higher than expiring rates. We believe there is still significant room for lease rate increases and remain very positive about this business. Eric will walk through the financial impact of our recently completed railcar partnership restructuring, but I did want to highlight the change in fleet composition. The transaction simplified our ownership structure, resulting in approximately 17,100 railcars removed from the partially owned railcar category. We assumed full ownership of 235 railcars. The remaining railcars moved from partially owned to investor owned, which will reduce reported revenue and operating profit, but this impact is largely offset by a corresponding reduction in minority interest. The restructuring simplified our ownership structure, increased transparency, and improved earnings while maintaining economic value. Rail Products delivered a full year operating margin of 5.2%, within guidance despite deliveries declining 46%. Cost discipline, automation, and workforce actions enabled profitability in a low-volume environment. Additionally, the headcount rationalization decisions we made in 2025 have right-sized the organization for the current reality and allow us to maintain profitability. With an aging fleet and continued net retirements, we expect demand to return over time allowing meaningful margin expansion as volumes recover. In the fourth quarter, we recorded a onetime credit loss related to a customer receivable within Rail Products. This charge was included in SG&A and reduced the Rail Products Group operating margin by 190 basis points for the quarter. This was an isolated incident and not reflective of ongoing performance. Before I hand it over to Eric and provide more details on our 2025 financial performance and 2026 guidance, I want to reiterate that Trinity Industries, Inc. is designed to perform in a wide range of demand environments. Our results and guidance clearly demonstrate that the actions we have taken over the last several years have strengthened our business and lowered the breakeven point. For example, we have been investing in AI as a core operating capability, not as a standalone technology initiative. Working with partners like Palantir and Databricks, we have embedded AI directly into our manufacturing, logistics, and financial workflows. Practically, that means we are using AI to recover and redeploy material that historically would have been scrapped, improving margin. We have extended those same models into accounts receivable, reducing disputes and accelerating collections. The cumulative impact has been improved working capital, higher productivity, and more predictable execution across the enterprise. Importantly, these are not pilot programs. They are embedded in how we run the business today, and they continue to scale. We are excited at the impact these initiatives are having on our business now and in the future. I will now turn the call over to Eric R. Marchetto, who will talk through financial results and our guidance for 2026.
Speaker 3
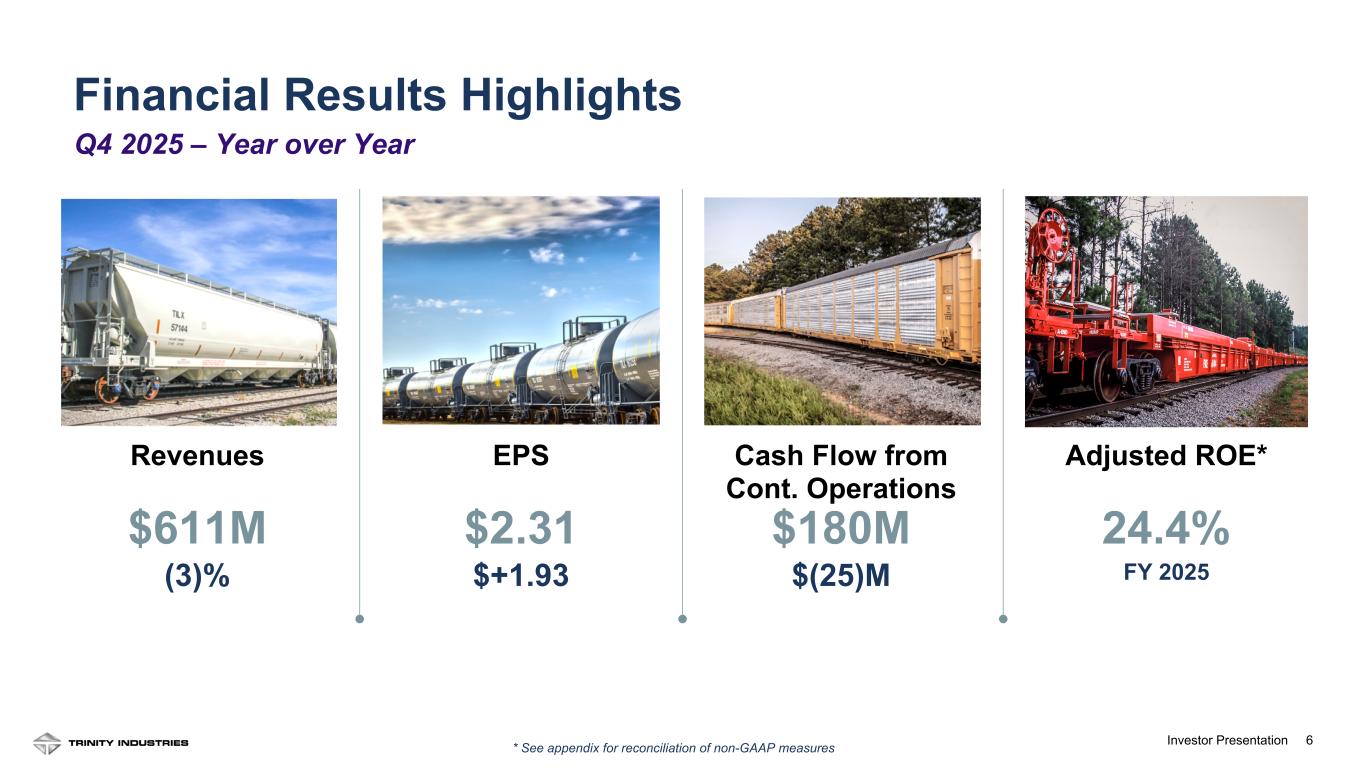
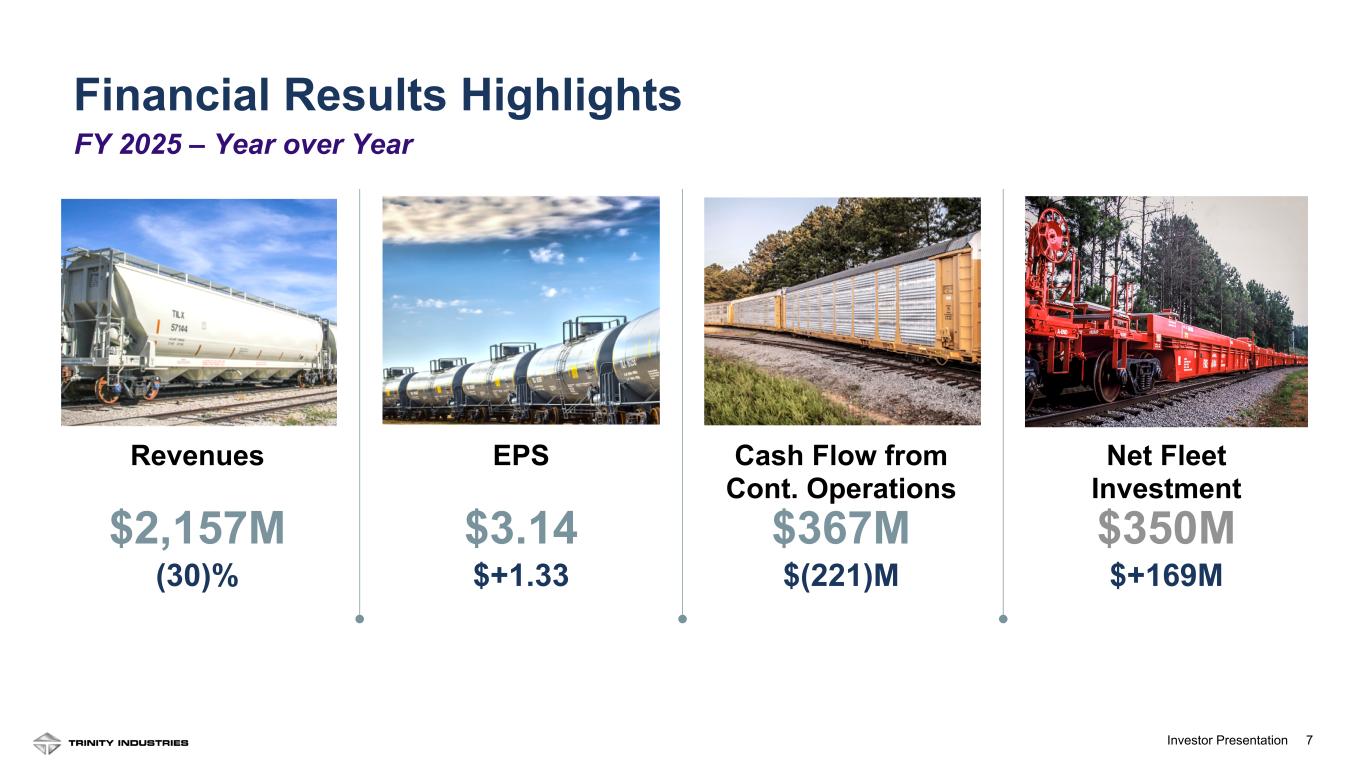
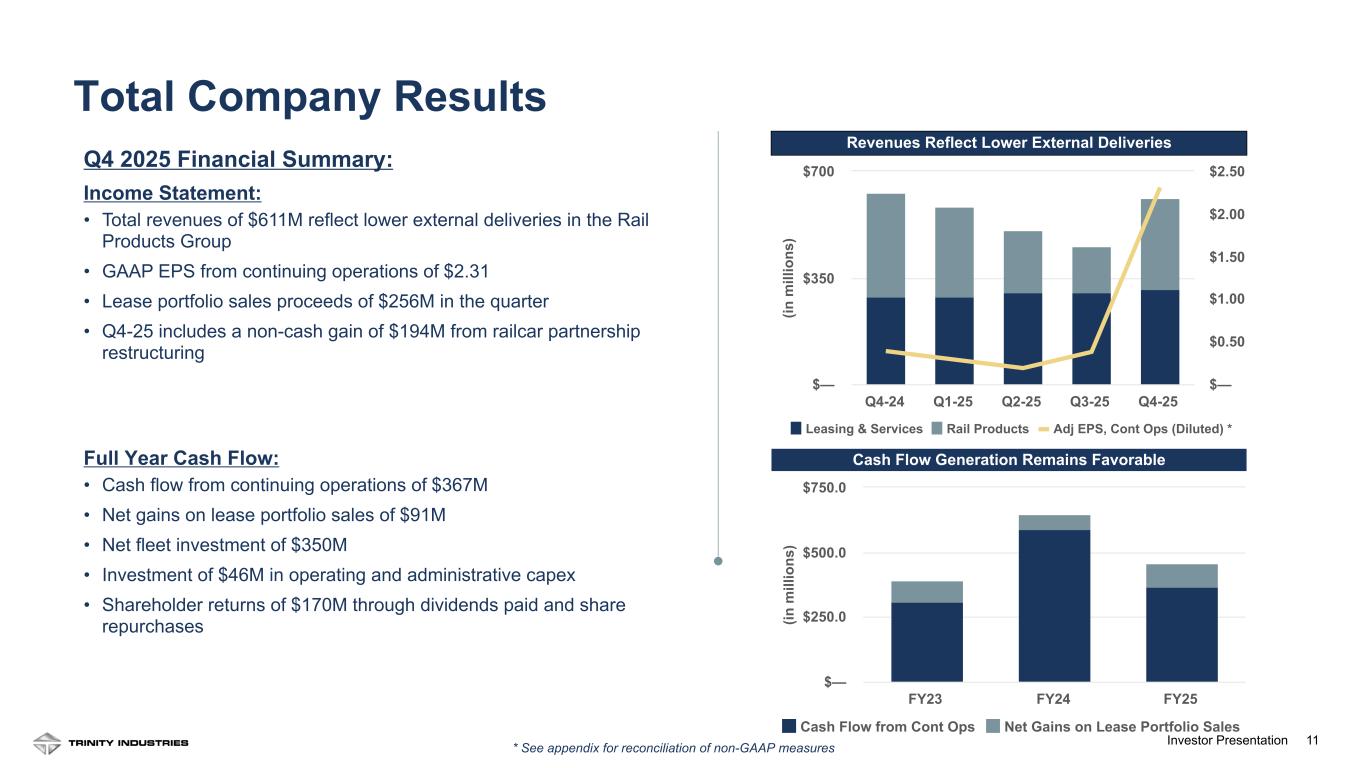
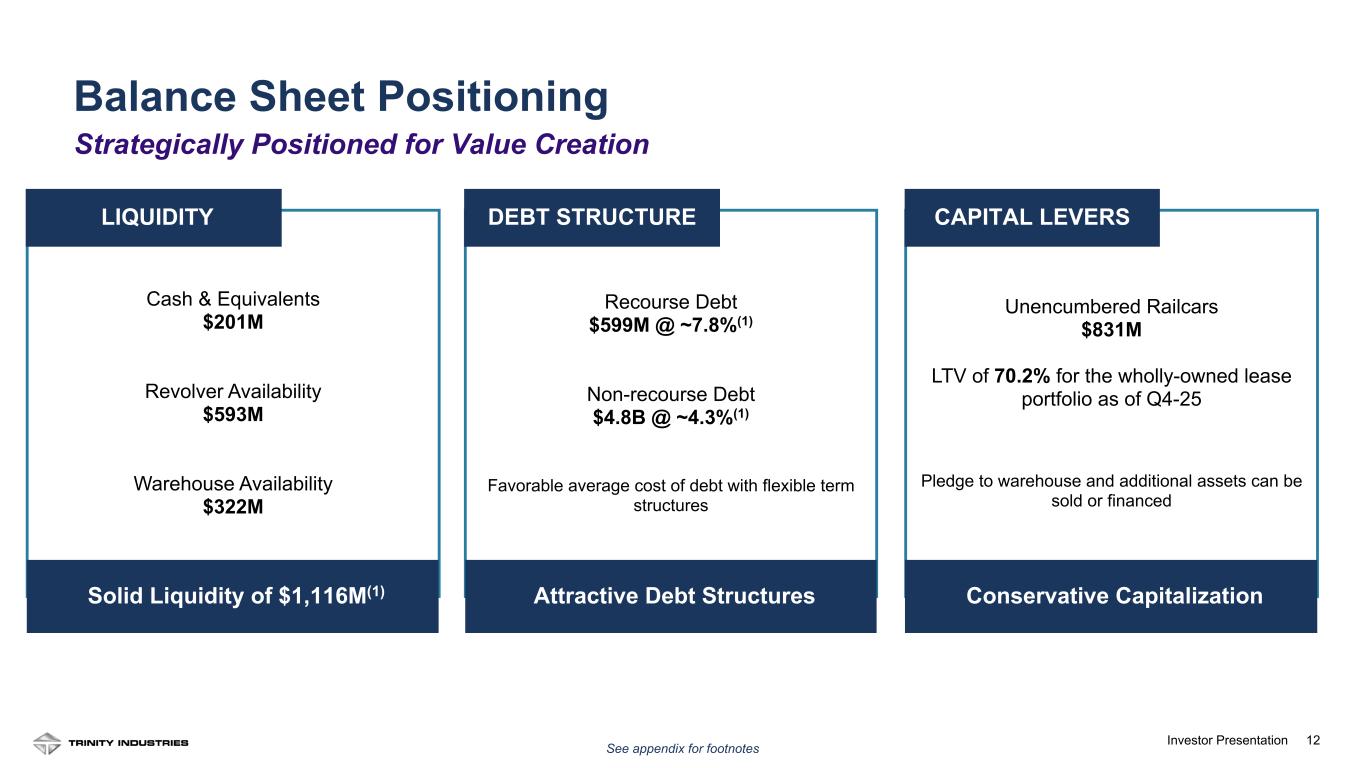
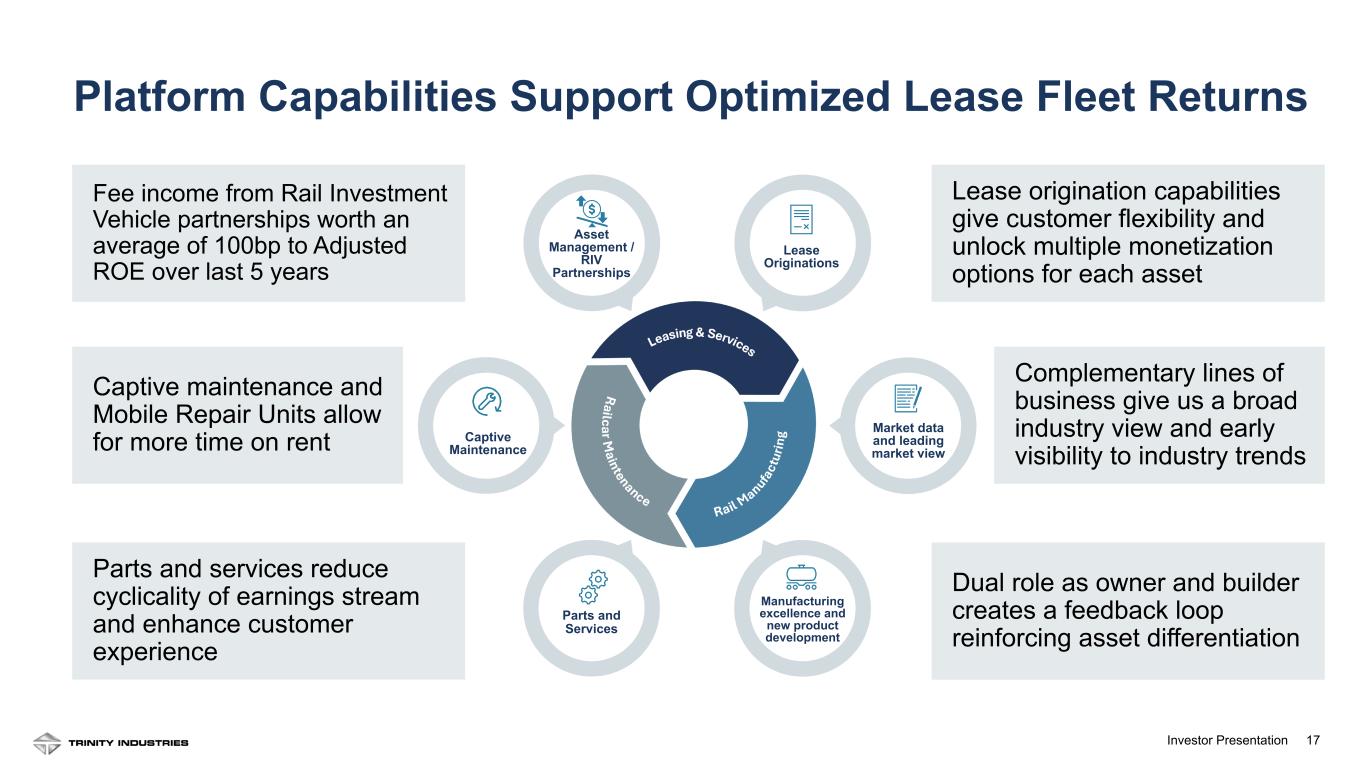
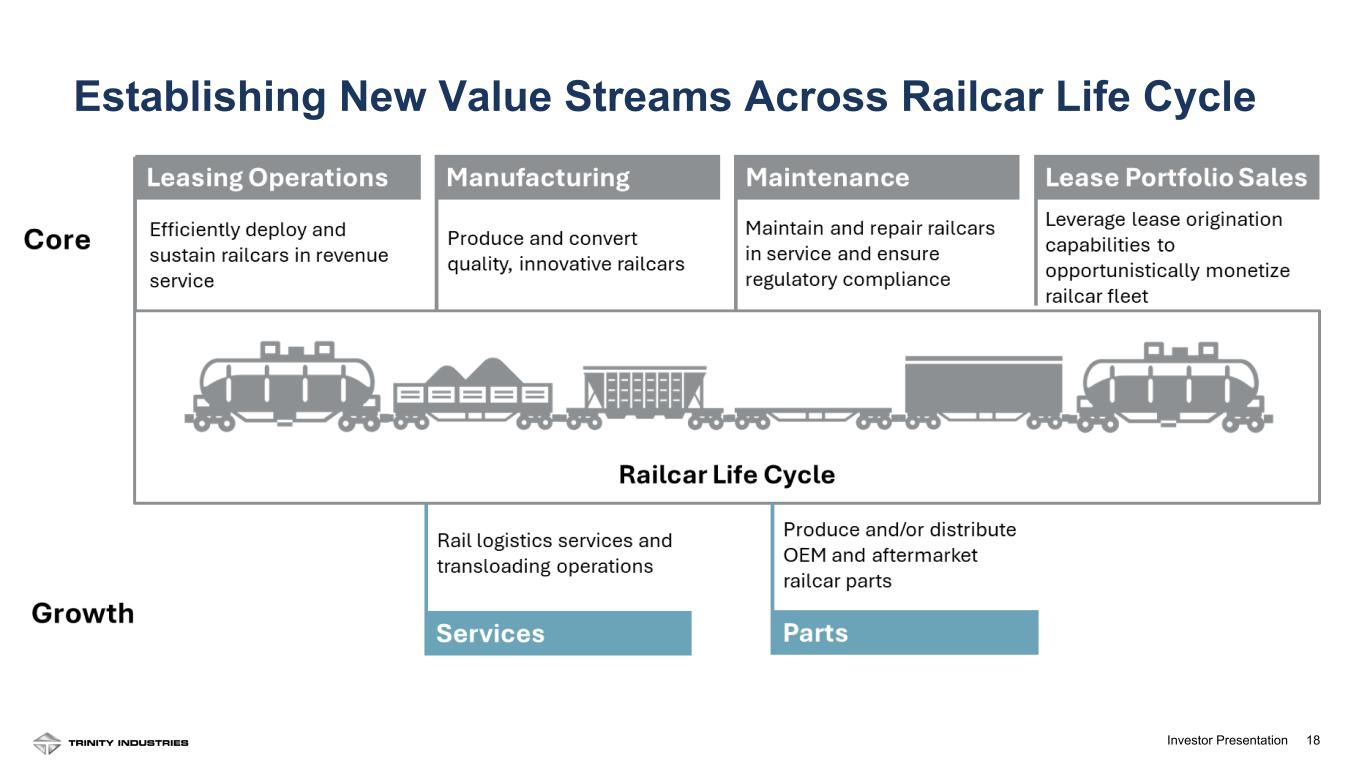
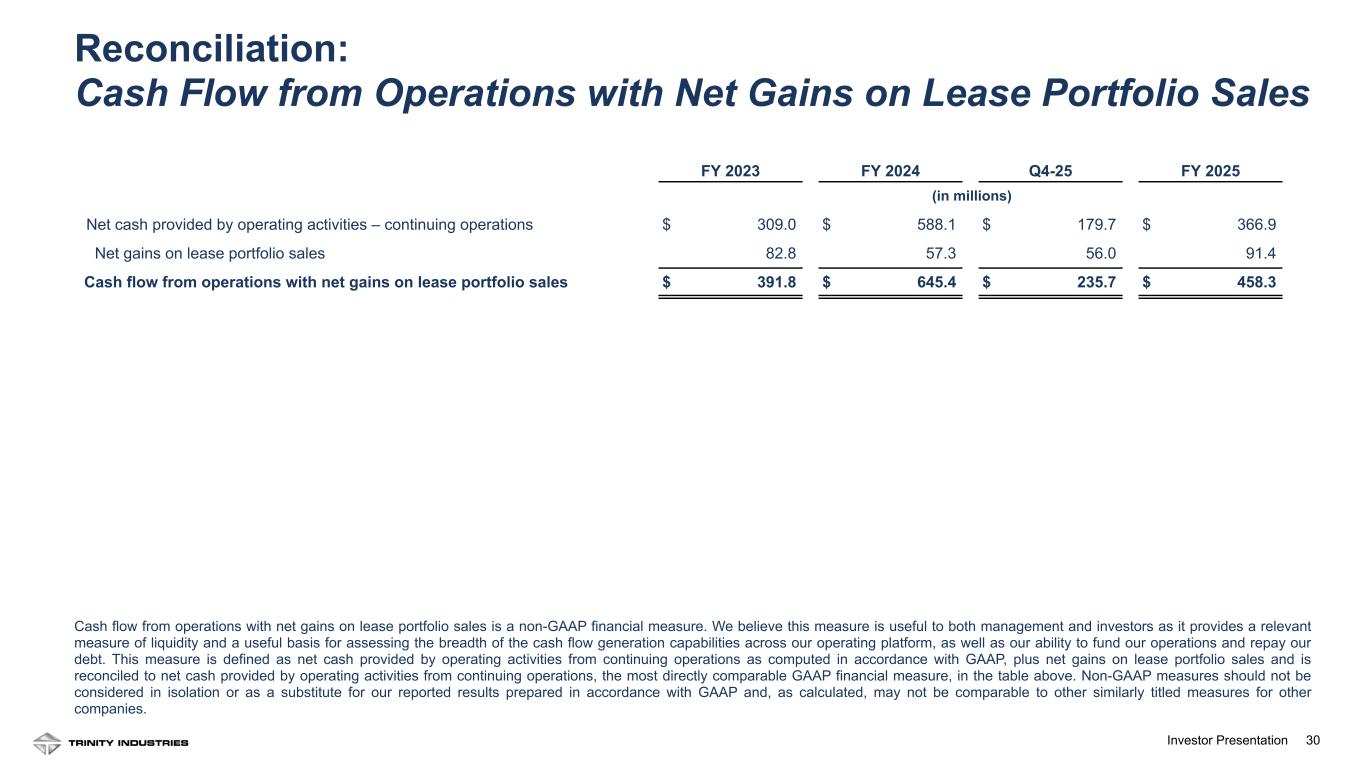
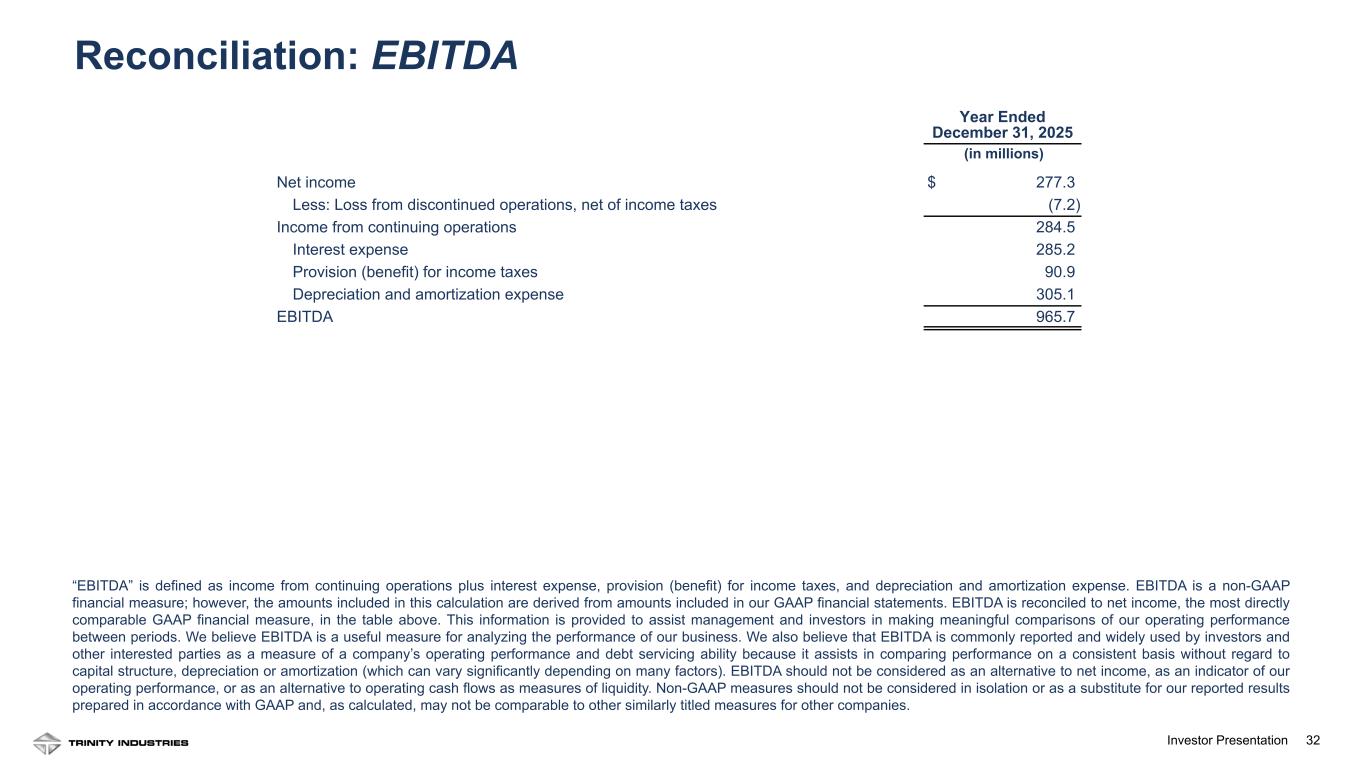
Thank you, Jean, and good morning, everyone. Before I talk through our financial statements, I want to take a moment to walk through our recent strategic railcar partnership restructuring and what it means for Trinity Industries, Inc. Prior to this transaction, approximately 23,000 railcars held in our TRIP and RIV partnership vehicles were partially owned but fully consolidated on our balance sheet and carried at cost. As part of a new fund raised by Napier Park, we began simplifying the fleet structure. We took full ownership of the TRP 2021 fleet, approximately 6,235 railcars, and Napier Park assumed full ownership of the TRIUMPH fleet, approximately 10,850 railcars. The transacted value of the TRIUMPH fleet was significantly higher than our book value, which resulted in a $194 million noncash gain on the disposition. Our railcar leasing fleet now consists of 101,000 railcars on our balance sheet, and 45,000 railcars under management as part of our railcar investment vehicles, or RIVs. Our RIV program provides servicing revenue of approximately $20 million per year, which is part of our leasing operations. The RIV program also provides scale for our platform, which enhances the unique view we have of the North American railcar market. Furthermore, this railcar partnership transaction underscores the embedded value in our assets. We have over 101,000 railcars on our balance sheet carried at a cost of $6.3 billion. We estimate that the market value of these railcars will be approximately 35% to 45% higher than the carrying value, which demonstrates the estimated 3% to 4% annual appreciation we have seen in railcar values over the last 20 years. While lease rates have increased, they have not increased at the same pace as railcar asset appreciation. We can choose to generate value from our railcars over the long term by holding them in our fleet as lease rates continue to rise or by selling them. This gives us conviction in the long-term returns of the business. Moving to the income statement. We ended the year with fourth quarter revenue of $611 million and full year revenue of $2.2 billion. This was down year over year due to lower external Rail Products deliveries. Our fourth quarter earnings per share of $2.31 reflects a strong end of the year and an impact of approximately $1.50 from the fourth quarter RIV partnership restructuring. Full year EPS of $3.14 was up 73% year over year, in line with our guidance of $3.05 to $3.20. Before the impact of the RIV partnership restructuring, our 2025 performance was above the midpoint of our previous guidance. Moving to the cash flow statement. Our full year cash flow from continuing operations was $367 million. Our full year net lease fleet investment was $350 million at the top of our guidance range, reflecting our conviction in deploying capital in our own fleet. Additionally, we returned $170 million in 2025 to our shareholders through dividends paid and share repurchases. In December, we raised our quarterly dividend to $0.31 per share, marking seven consecutive years of dividend growth with an annualized growth rate of 9%. This reflects Trinity Industries, Inc.’s commitment to returning capital to shareholders. We are ending the year with a strong balance sheet. We have liquidity of $1.1 billion through cash, revolver availability, and our warehouse. Our loan to value for the wholly owned lease fleet is 70.2%. The increase in our LTV was a result of the debt restructuring we completed in October as well as the addition of the TRP 2021 fleet to our wholly owned fleet. We are very comfortable with the leverage on our fleet and are regularly refinancing our railcars as our debt amortizes to keep our debt in an appropriate range. Our balance sheet gives us the flexibility we need to effectively deploy capital and run our business. I will now talk about our expectations for 2026. As Jean noted, we are expecting industry deliveries of about 25,000 railcars, and we expect to maintain our historical market share of those deliveries. Despite the lower level of new railcars, we expect to maintain a Rail Products segment operating margin of 5% to 6% for the full year. We expect the secondary market to remain active and anticipate gains of $120 million to $140 million in 2026. We see an opportunity to further simplify our fleet structure and contribute the remaining partially owned railcars to our managed Napier Park fleet in the second quarter. While this transaction is not complete, we have included the anticipated gains in our full year guidance. We expect Leasing and Services full year segment margins of 40% to 45%, including the impact of gains and any further railcar partnership restructuring activities. In addition to the gains, we expect higher lease rates to contribute to a higher operating margin, offset by higher fleet maintenance activity in 2026. We expect a full year net lease fleet investment of $450 million to $550 million, reflecting new lease originations, secondary market sales and purchases, and fleet modifications and sustainable conversions. We expect operating and administrative CapEx of $55 million to $65 million, which includes further investment in automation, technology, and modernization of facilities and processes. We expect slightly lower SG&A costs in 2026. We expect a full year tax rate of approximately 25% to 27% for the full year. And finally, we expect a full year EPS of $1.85 to $2.10. We have made structural changes to our business over the last few years that have improved our profitability and returns throughout the economic cycle. With our 2026 guidance, I would also like to close with an update on our three-year targets we set at our 2024 Investor Day. As you recall, we introduced three enterprise KPIs with targets over the 2024 to 2026 time frame: net lease fleet investment, cash flow from operations with net gains on lease portfolio sales, and adjusted return on equity. First, our three-year net lease fleet investment target was $750 million to $1 billion over the three years. To date, we have invested $531 million and with our 2026 guidance, we will be at the top end of this range. Second, our cash flow from operations with net gains on lease portfolio sales target was $1.2 billion to $1.4 billion over the period. To date, we have achieved $1.1 billion and with our current guidance, we expect to exceed this range. It is important to note this excludes noncash gains. Finally, we set an adjusted ROE target of 12% to 15%. We ended 2024 with an adjusted ROE of 14.6% and ended 2025 with an adjusted ROE of 24.4%, averaging 19.5% over the first two years of the planning period. These targets were introduced with the overall guidance of approximately 120,000 industry railcar deliveries over the period. Our current outlook reflects deliveries of approximately 100,000 units. Importantly, this demonstrates the strength and flexibility of our operating model. We have proactively aligned our business to match evolving market conditions while continuing to deliver on our financial commitments. As Jean noted, our 2025 results underscore the strength and resilience of our platform and our ability to deliver attractive returns in a more challenging operating environment. As we look ahead to 2026, we remain highly confident in our trajectory. With disciplined execution, continued cost rationalization, and a flexible platform, we believe we are well positioned in the market. These strengths give us the foundation to navigate uncertainty and, more importantly, the capacity to generate meaningful, sustainable value for our shareholders over the long term.
Operator
We will now begin the question and answer session. To ask a question, you may press star then 1 on your telephone keypad. If you are using a speakerphone, please pick up your handset before pressing the keys. If at any time your question has been addressed and you would like to withdraw your question, please press star then 2. At this time, we will pause momentarily to assemble our roster. The first question comes from Harrison Bowers with Susquehanna. Please go ahead.
Speaker 4
Hi, Jean, Eric. Thanks for taking my question.
Speaker 2
Maybe just to start off high level on what you are seeing in demand. Can you sort of talk about if you are seeing improving inquiry levels? And if conversion times to actual firm orders are improving at all, beginning to compress, just what the latest you are hearing from customers broadly about tariffs, broader trade clarity, and some expectations for demand as the year progresses? Thank you. Good question, Harrison. So customers are engaged, but the decision cycles are still longer than they have been in the past. It appears to be delaying orders. It is not destruction of the demand. When you look at the replacement demand fundamentals, they are still there. We have over 200,000 railcars that are over 40 years old. And when you look at current inquiry levels, they have increased, which is encouraging. But as you heard, our expectations for 2025, excuse me, 2026 are only 25,000. So we are seeing inquiry pick up. We think that may lead to a return to replacement level demand in 2027, but still expect 2026 to be a little bit lower. Thanks.
Speaker 4
And could you maybe touch on what your expectations are for improving inquiry levels in, you know, and how many incremental orders you might need to see to maybe backfill some space, you know, embed and what your guidance is for the year?
Speaker 2
Sure. So when you look at what is going on in the marketplace right now, with the lower demand, you are seeing some builders not being quite as disciplined. And so we are seeing some pressure on those margins and having to fight pretty hard. On our typically the specialty cars, we do really well, and some of the other ones. So all the work we have been doing to lower our breakeven is really playing through and what you are seeing in our Rail Products Group margin, and then for 2026, we are still calling for the 5% to 6%. But it is aggressive out there. We are still being disciplined on what we are taking in and making sure that they are good orders that make sense for us to do. When you look at what we have to fill, we still have room in the back half of the year. So we will continue to see that progress as we go through the different quarters, the first half of this year. Thanks.
Speaker 4
And could you maybe level set what you had expected margin cadence and maybe deliveries throughout the year, even if directional, just to get a sense if there is anything, if any quarters are, you know, well above or below that 5% to 6% range that you called out.
Speaker 2
Yes. So we do not give quarterly guidance, but I would expect it to be fairly even throughout the year.
Speaker 4
Great. Thank you. Can you maybe speak a little bit more to the sort of easing FLRD but also seeing the really positive renewals versus expiring, and just what maybe sequential lease rates are and how you expect for those to perform throughout the year?
Speaker 2
Sure. So the FLRD remains positive for the eighteenth consecutive quarter. And when you are looking at the renewal rates like you talked about, they are materially above expiring rates at 28.6% for the fourth quarter. And utilization improved quarter over quarter. What you are seeing from the moderation on the FLRD is really lapping prior strong repricing that we have had. But when you look at the value of these assets, we think it supports continued lease rate upside.
Speaker 3
I think you asked about quarterly and annually. Our average lease rate continues to go up quarter over quarter and year over year. So we are still seeing positive results there and expect to still have some headroom.
Speaker 4
Thanks. And maybe taking a step back on leasing. Can you maybe speak to your expectations on the potential for additional leasing consolidation, whether, you know, in the form of some of the partnership or reorganization that you have talked about, or if you would expect, you know, some further consolidation in the space, and maybe what the level of private capital of this space, just to maybe general overview on the competitive dynamics with regards to the leasing space?
Speaker 3
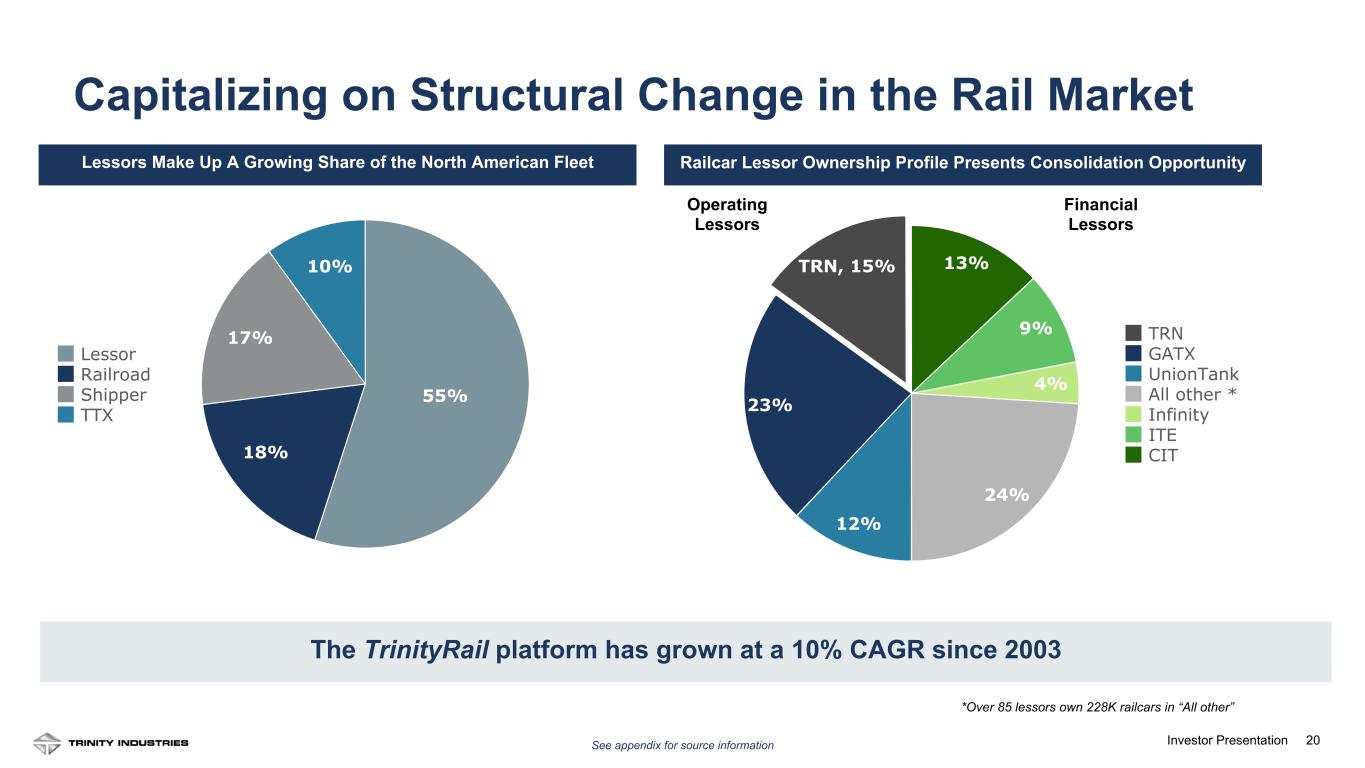
Sure. Hey, Harrison, it is Eric. I will take that one. We have seen some consolidation in the leasing space over the last few years, and that just speaks to the attractiveness of the asset class. We have seen capital looking to come into the space. As you get out and speculate on what could happen in the future, I know there is capital there that would like to do things. But it takes two. And so I am not anticipating anything in the near term. But there is still very active trading at more at the portfolio level and the asset level, and we would expect that to continue. When you talk about the partnerships, some of the private capital, you know, that there is always possibility with that, but it seems like there is still an appetite to grow from that private capital standpoint.
Speaker 4
Great. Thanks. I will hop back. I will pass it over and hop back in the queue if I have other questions. Thank you.
Operator
The next question comes from Andrzej Tomczyk with Goldman Sachs. Please go ahead.
Speaker 5
Hey, good morning, Jean, Eric, and Leigh Anne. Appreciate you taking my questions. Just wanted to start bigger picture as well. If we could just talk a little bit more about the guidance range that you laid out. Could you help translate sort of the low end versus the high end of the range relative to your expectations for customer demand through 2026? It might have been asked a little bit earlier, but I guess specific to the manufacturing deliveries, maybe what it means in terms of absolute levels of deliveries throughout the year, and then what you are expecting for ordering activity in the first half of this year in order to get to your full year targets? Thanks.
Speaker 2
Yes. So Andrzej, thanks for the call. Let me see if I can help you through that. When you look at, you know, we talked about 25,000 deliveries for the industry. We have not given any more detail on our deliveries other than it would be in our normal range of 30% to 40%. So that would imply, you know, that you can imply what you get from that from the math. When you look at just the guidance range, so that is what you are going to get from Rail Products. And also, we gave you the margin of 5% to 6% there. And so that is kind of the big piece of it. You know, when you look at the range that we provided, you know, pretty big range on the gains of $120 million to $140 million. So that is also going to provide some of the spacing between the low end and the high end.
Speaker 5
Got it. That is helpful. And I think you called out a 190 basis point margin headwind in manufacturing in the fourth quarter, if I had that right. So I just wanted to clarify that point first. And then just what we should expect sort of off of that run rate, if that is sort of an adjusted number. I think it would be closer to, like, 6.5% if I have that right for the fourth quarter for manufacturing. How do we think about, is it still just the 5% to 6% through the year, but maybe the first quarter starting off closer to the low end of that range? Or do we think relative to that adjusted number?
Speaker 3
So we did not adjust. We just called out the difference in the reserve that we took. But when you think about it, as Jean mentioned, it should be relatively smooth. We did have, as we talked about in the third quarter, on some of the specialty mix that we had, on the tank car side in the third quarter. Some of that carried through in the fourth quarter, so you got a little bit of benefit there. As we get to more of a traditional mix going forward, that is where we are, the 5% to 6%. You know, the 5% to 6% also with the volume that we are talking about that we have, we are happy with that, especially with, you know, as you mentioned, the amount of unsold space. And you talked about order cadence. I guess I did not answer that previously. But, you know, last quarter, there were industry orders were about 5,800 units. And so that is kind of what we would expect going forward in the near term to get to that 25,000 units for the year.
Speaker 5
Understood. And it seems like we have a firm grasp on sort of the volume picture for manufacturing this next year. Curious if you could help out on the sort of revenue per unit in manufacturing. Are there any sort of notes to consider around mix in 2026 from a revenue per delivery perspective?
Speaker 3
You will get a, I mean, at the lower levels, there is a little more tank car mix than freight car mix. Generally, those are a little higher unit pricing. As Jean mentioned, it is a competitive environment out there. So you have a little bit of pricing pressure on the top end. And then we are trying to take, we have our initiatives to take the cost out to preserve as much of the margin as we can at these lower volume levels. These are low volume levels that we are operating in. So every bit helps.
Speaker 5
Yep. That makes sense. Maybe just shifting to leasing. Just curious if you could dig in a little more on the initial feedback of the partnership restructuring deal that you completed in the fourth quarter, and then just the moving parts of that into 2026 regarding the level of your owned lease fleet through the year and then revenue per unit and leasing would be helpful as well. And then just on that, the moving parts, sort of the minority interest that you mentioned in 2026, maybe what level we should be thinking there or what you are baking in? Appreciate it.
Speaker 3
Yeah. Okay. I will start there. Let me just reset. Napier Park, they have been a partner of ours since 2013. They are our longest RIV partner, railcar investment vehicle partner. And as part of a new fundraise that they did, we divided these assets up in December. What we really like about it is we think it really demonstrates the value of the fleet. And recall, when you look at our fleet, our fleet for the most part, most of our assets are at manufacturing cost. And so when you apply a market value against the manufacturing cost basis, you get the types of gains that we saw in the fourth quarter. This increases our RIV program to about 45,000 railcars, so a significant piece of our fleet. As I mentioned in my script, that provides about $20 million a year in fee income, which we really like. It also provides a lot of scale for our business. 45,000 railcars that we are the lessor on, that we run through our shops. It just provides a lot of scale for our business. Also, you mentioned the minority interest. This will help simplify our balance sheet. We will have less partially owned and less minority interest that comes out. So it will be simpler from an outside perspective. As we look ahead in 2026, we see an opportunity to do something similar with the remaining partially owned assets. We are including that in our gains guidance of $120 million to $140 million. We would expect that to close in the second quarter. We do not have a price yet agreed to. We do not have a transaction structure agreed. But we do have line of sight to that happening. And Napier Park, while they have not been a buyer of assets for the last several years, with this new fund, we would see them as a potential buyer in the future of assets and kind of revive them as a buyer of assets. More to come on that. But I said a lot there. So just to kind of sum it up, it demonstrates the value of our fleet, especially when you compare market value to cost, and it is going to create opportunities for us going forward both in terms of fee income and then potential transactions down the road.
Speaker 5
That is very helpful color. Just maybe to clarify on the one point then, is it fair to say in the second quarter, we should expect more of the gains to occur relative to the full year target? Or is that still sort of—
Speaker 3
That is what I am saying. Yes. That is what I am saying.
Speaker 5
And then just one more broad question from my end to close out. Not sure how far you guys want to venture out, but however you can talk about this would be helpful. Just curious sort of your level of confidence on 2026 marking a bottom for customer ordering activity or maybe industry delivery activity. If your customers are giving any indication that that could be true. And I guess the question is what could, you know, what could cause the prolonged downturn to linger into 2027 from a risk perspective? Or is it just tough to envision that at this point, just given how long in the tooth it feels we are in this industrial slowdown or freight recession. Thanks again for the time.
Speaker 2
Yes. Thank you, Andrzej. So when you look at what we are seeing in 2026, the rail traffic had improved besides the weather that we saw. So with carloads, we are improving. That is a good thing. We just heard the manufacturing hiring. The jobs report was up. So even though we are not calling victory, we are saying we are starting to see signs that it is stabilized or bottomed out and starting to improve from there. The timing of that, your guess is as good as mine, but we really think that 2026 may be that bottom and start to come out from there for 2027.
Speaker 5
For all the time this morning. Appreciate it.
Speaker 2
Yep. Thank you.
Operator
This concludes our question and answer session. I would like to turn the conference back over to E. Jean Savage for any closing remarks.
Speaker 2
Thank you. So Trinity Industries, Inc. is structurally stronger, more resilient, and better positioned today than in prior cycles. We will remain disciplined and focused on continuing to drive improvements in our business. We are intentionally structured to generate resilient earnings and strong cash flow through disciplined lease pricing, active portfolio management, and balanced capital deployment. Thank you for joining us today on today's earnings call.
Operator
The conference has now concluded. Thank you for attending today's presentation. You may now disconnect.