Operator
Good day and welcome to the WSFS Financial Corporation 4th Quarter 2025 Earnings Call. All participants are in a listen-only mode. After the speaker's remarks, we will conduct a question and answer session. To ask a question at this time, you will need to press star, followed by the number 1 on your telephone keypad. As a reminder, this conference call is being recorded. I'd now like to turn the call over to your host for today, Mr. David Berg, Chief Financial Officer. Sir, you may begin.
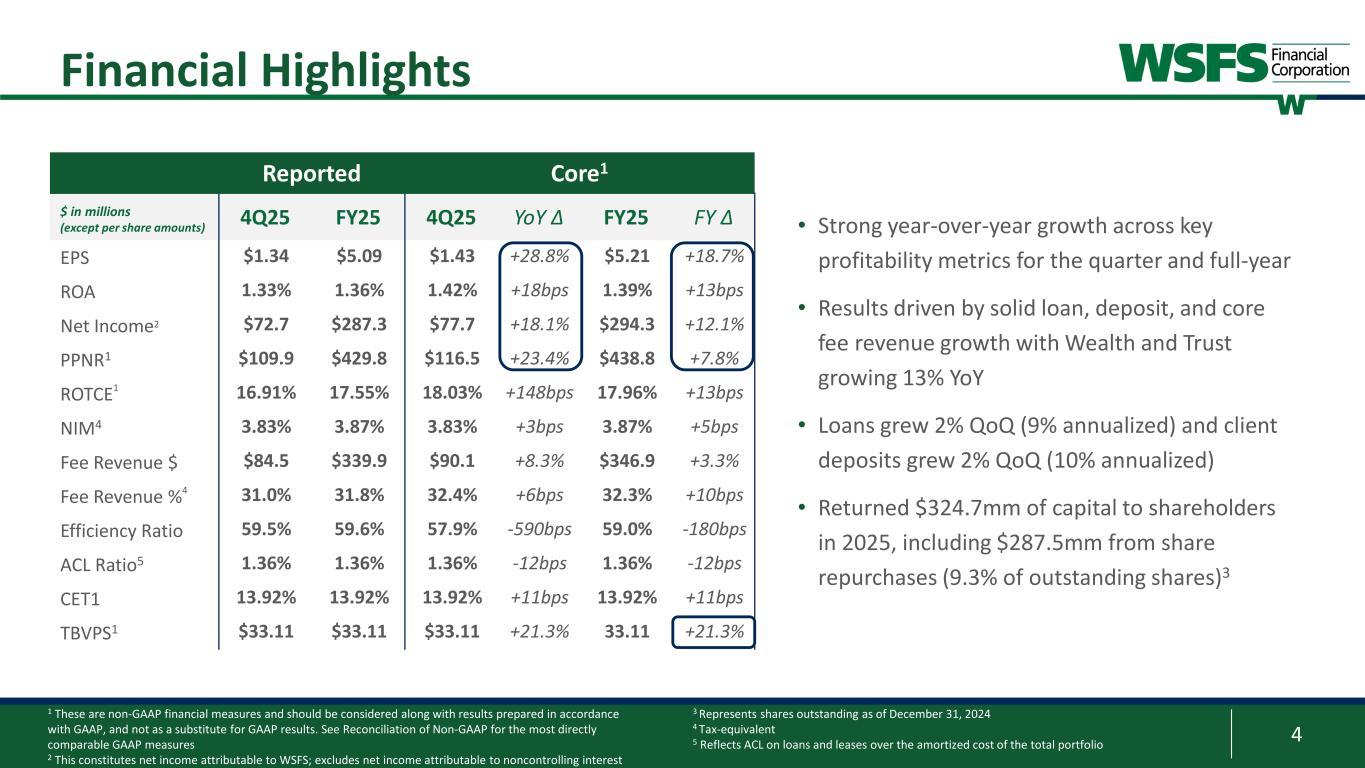
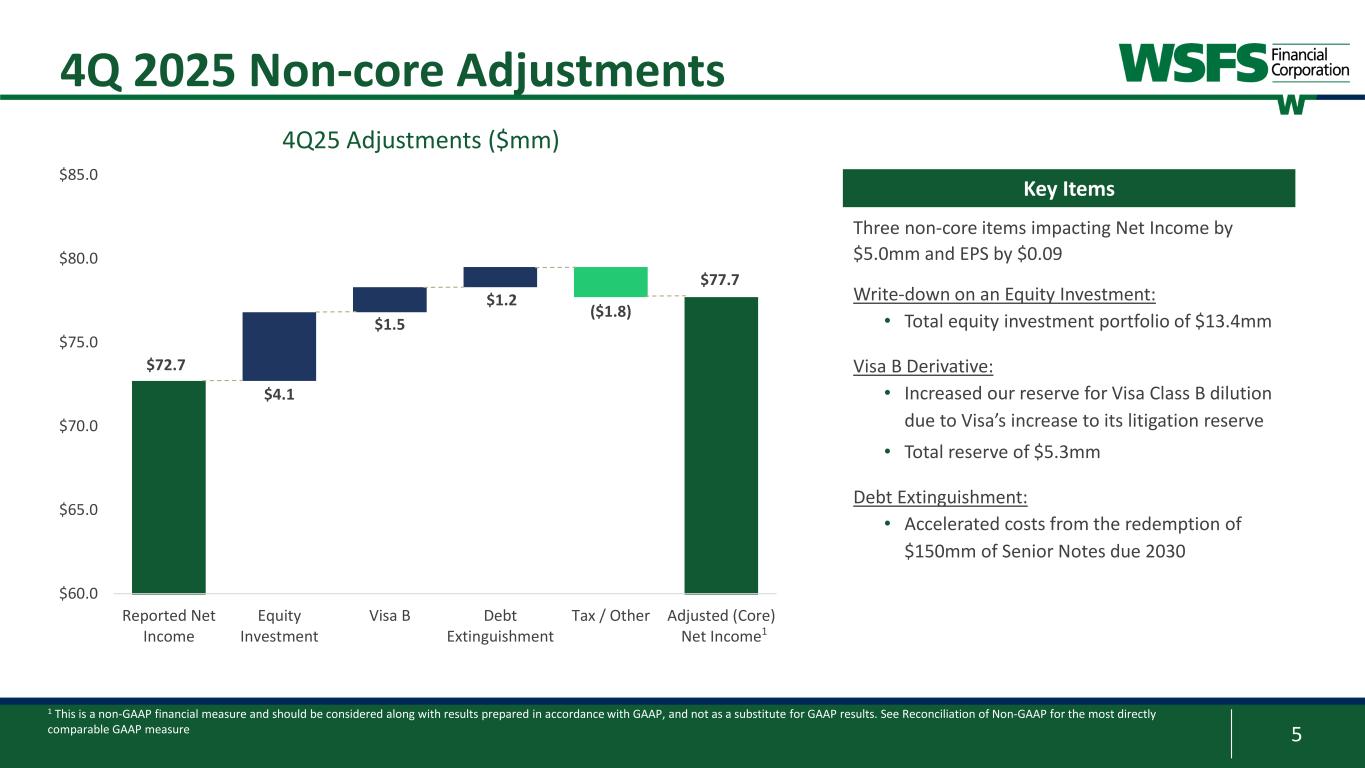
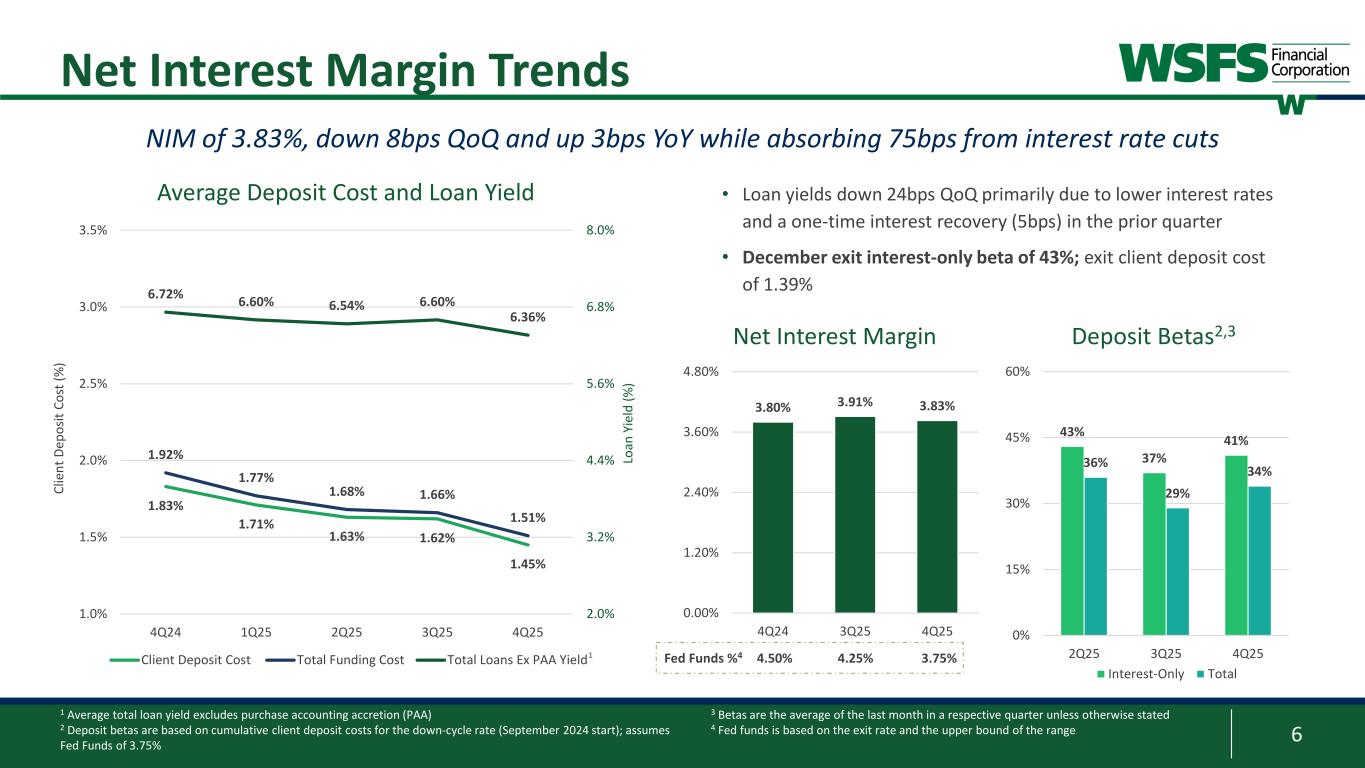
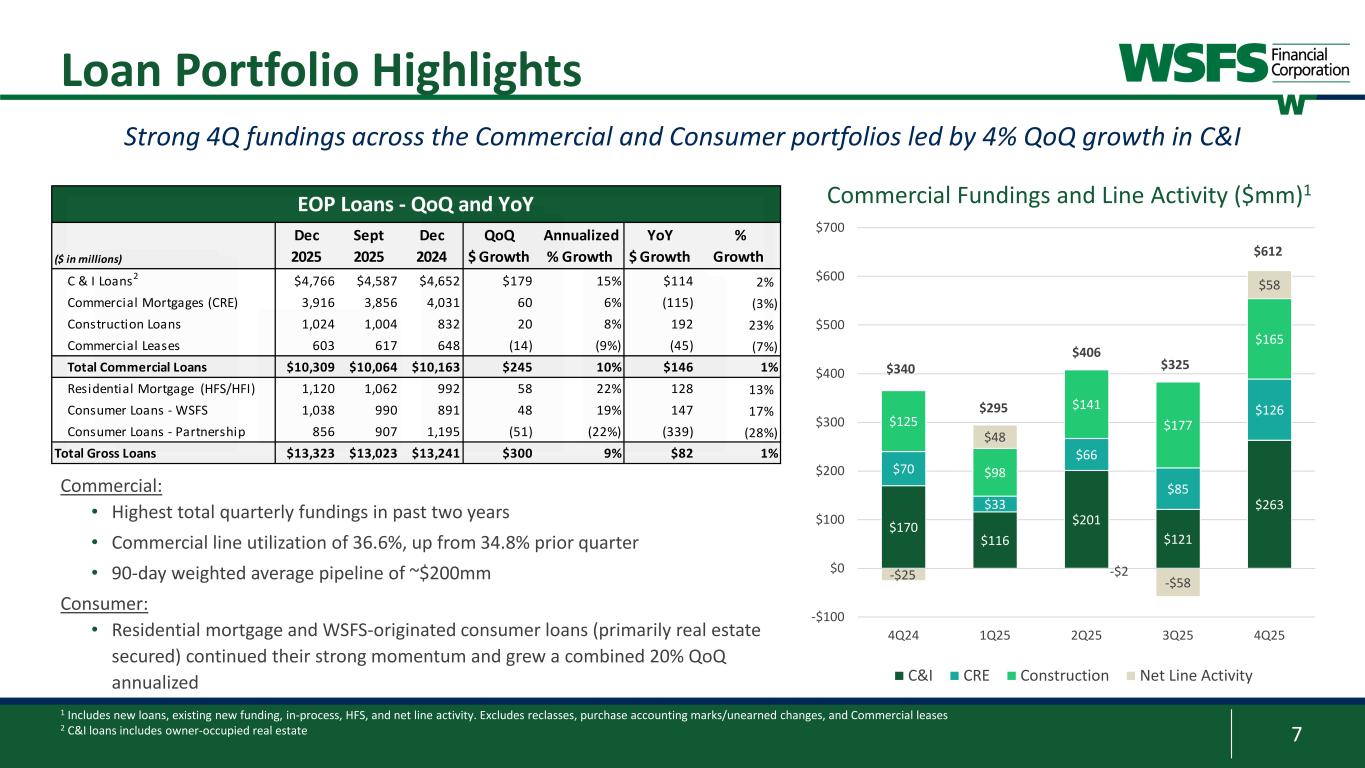
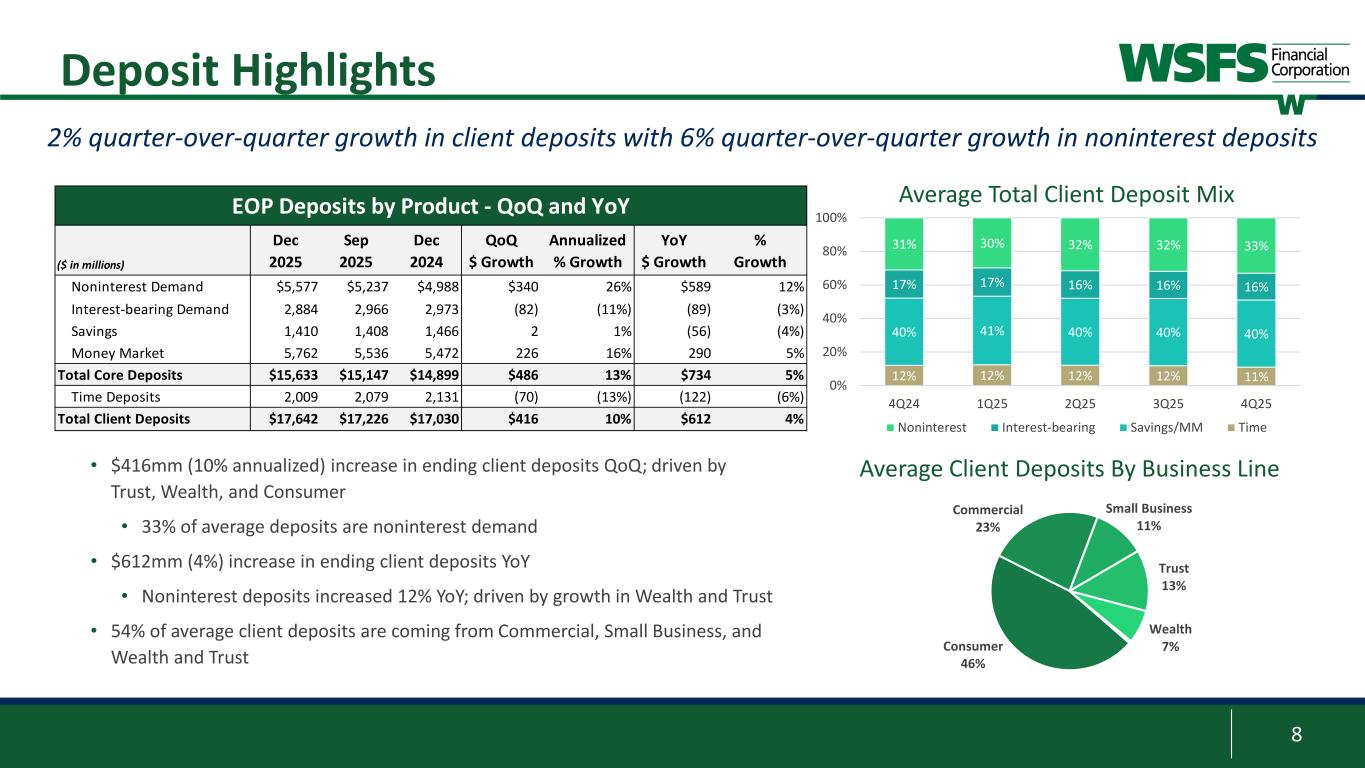
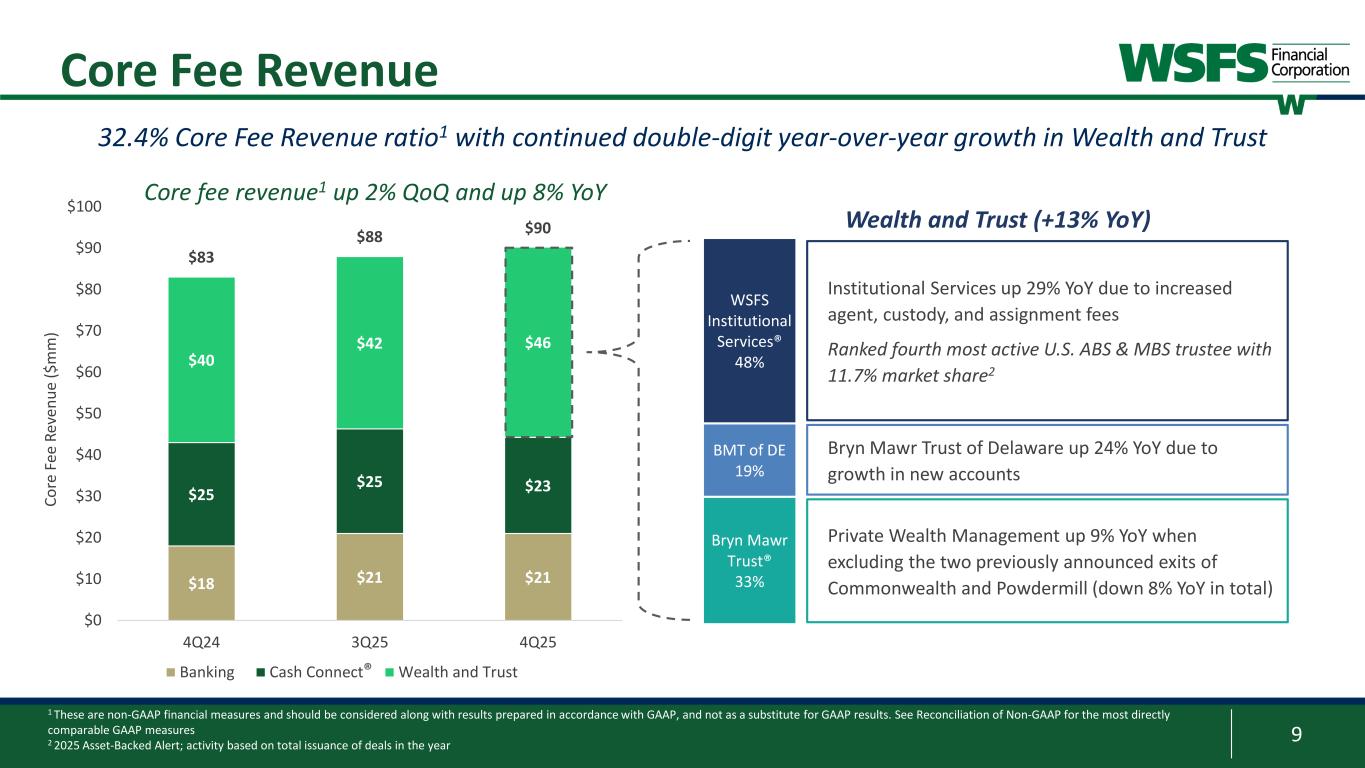
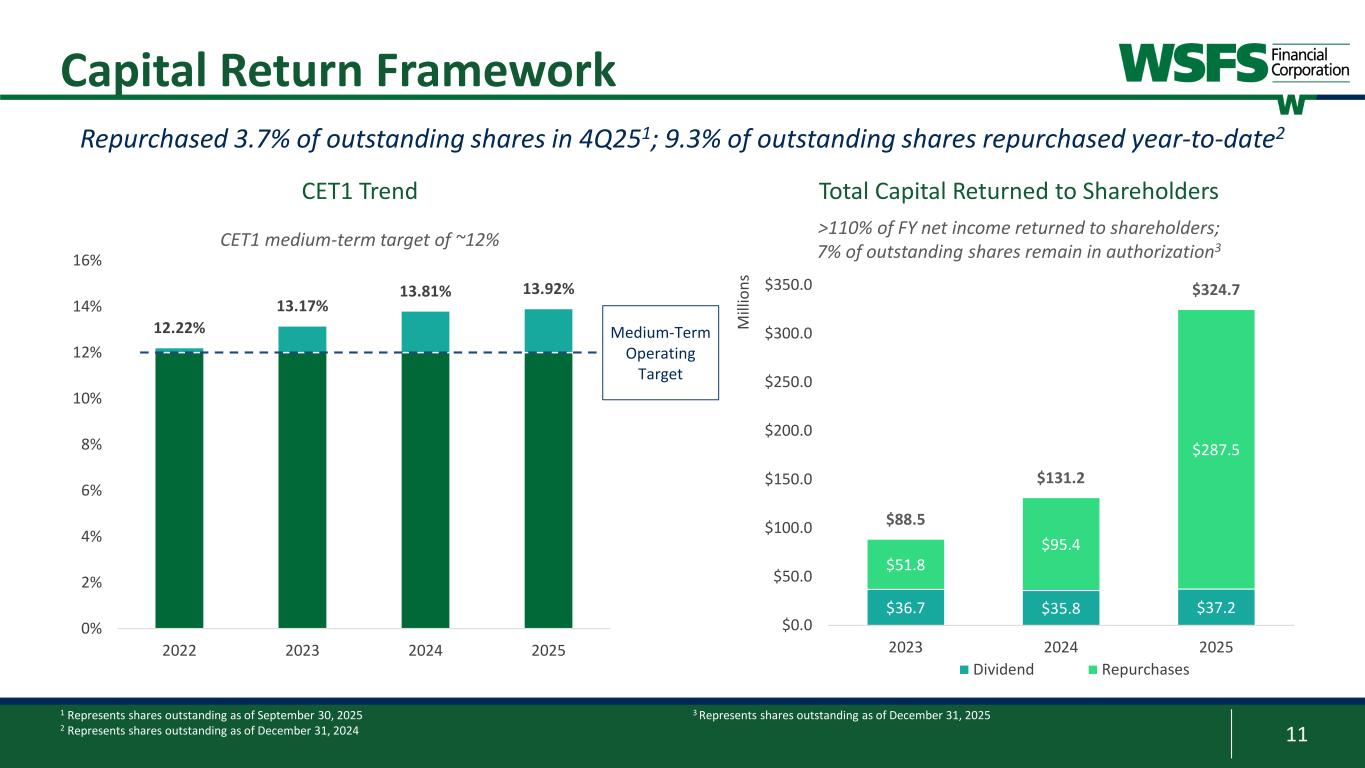
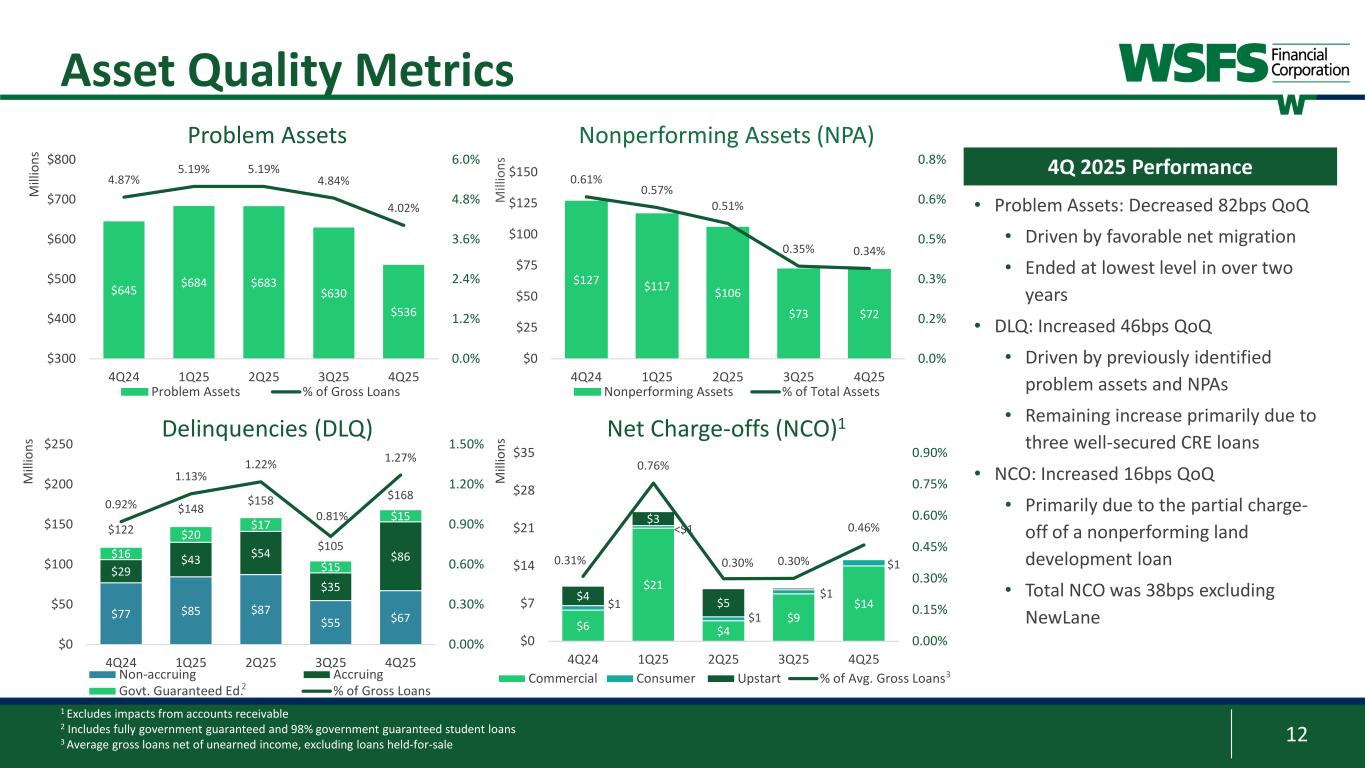
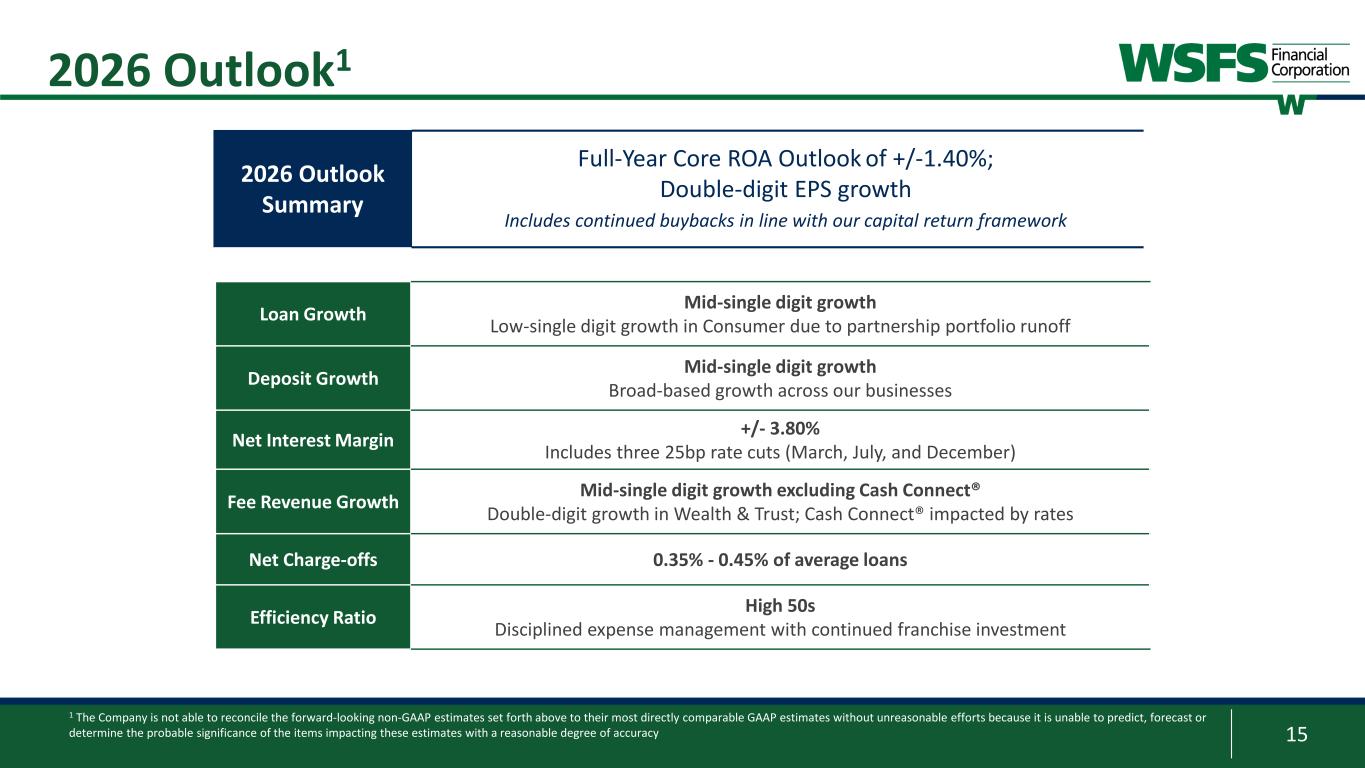
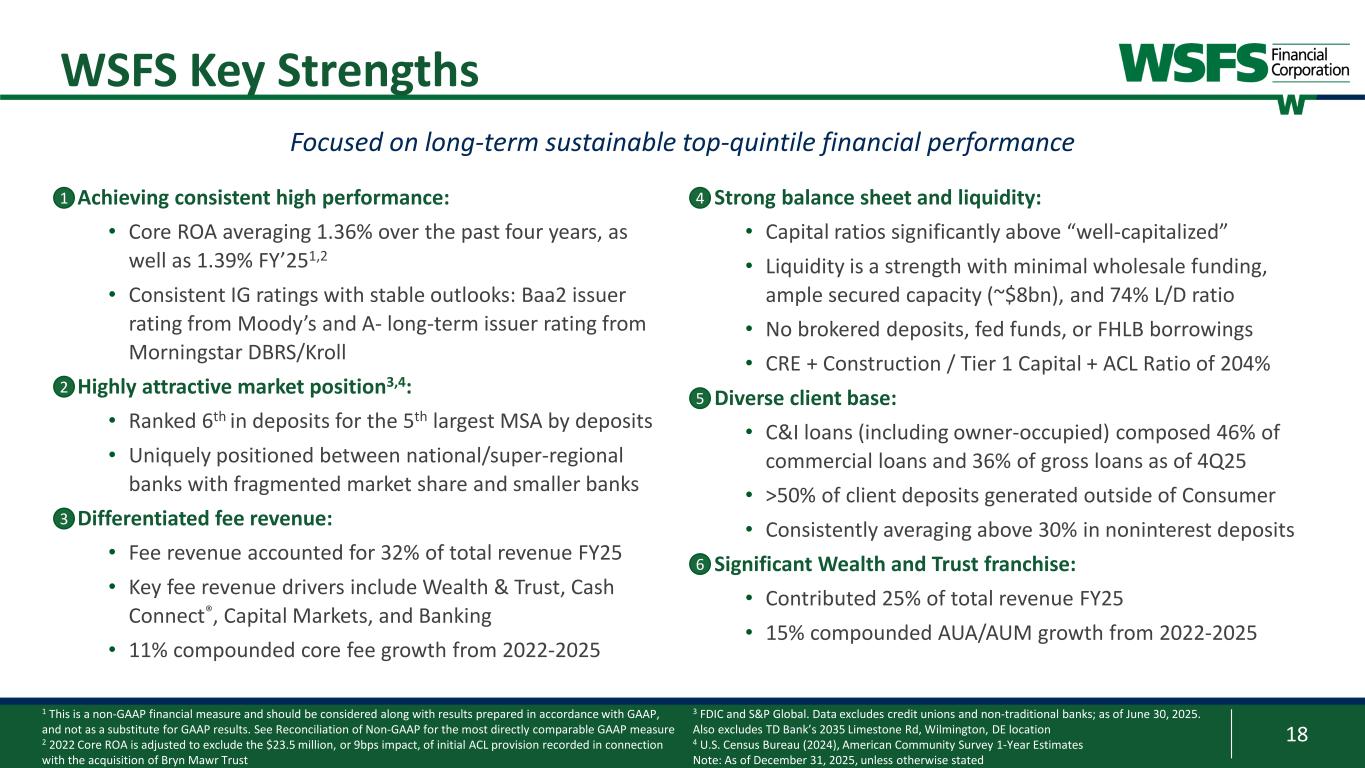
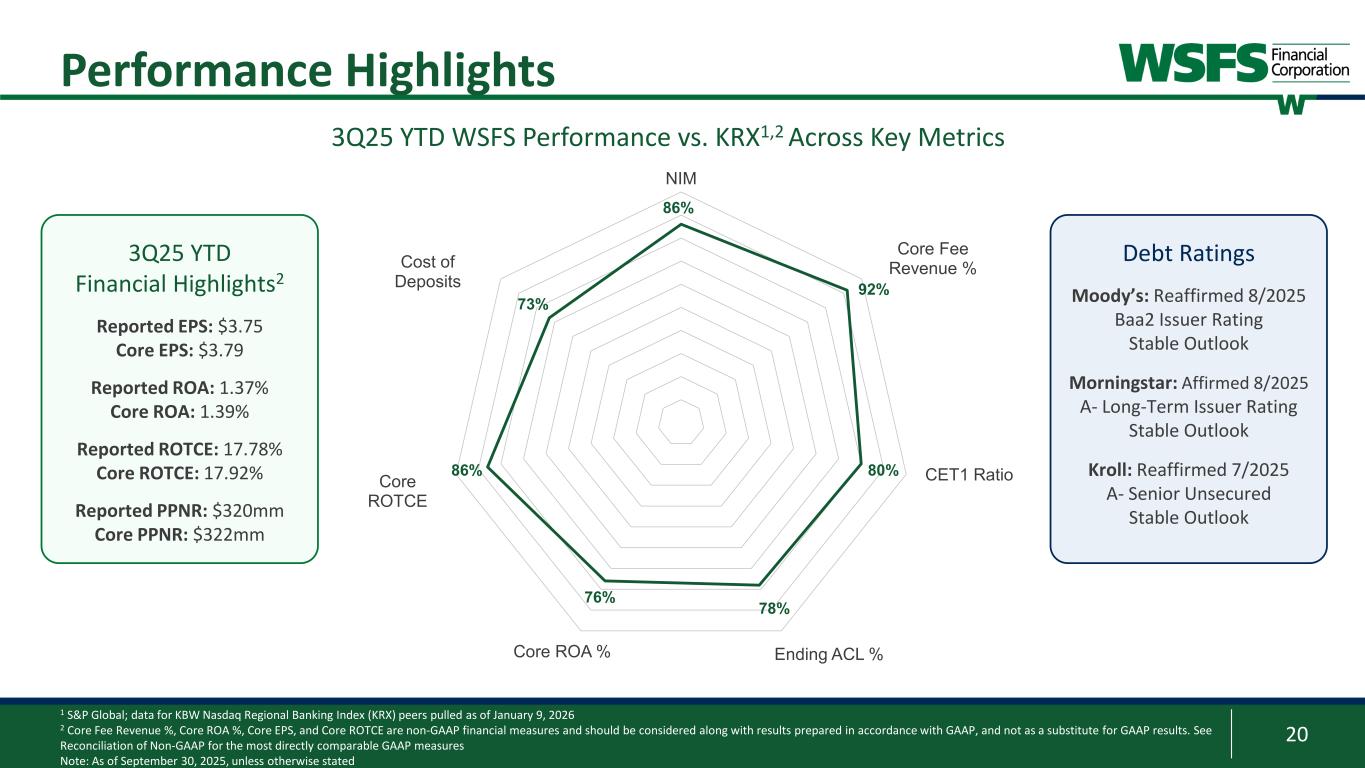
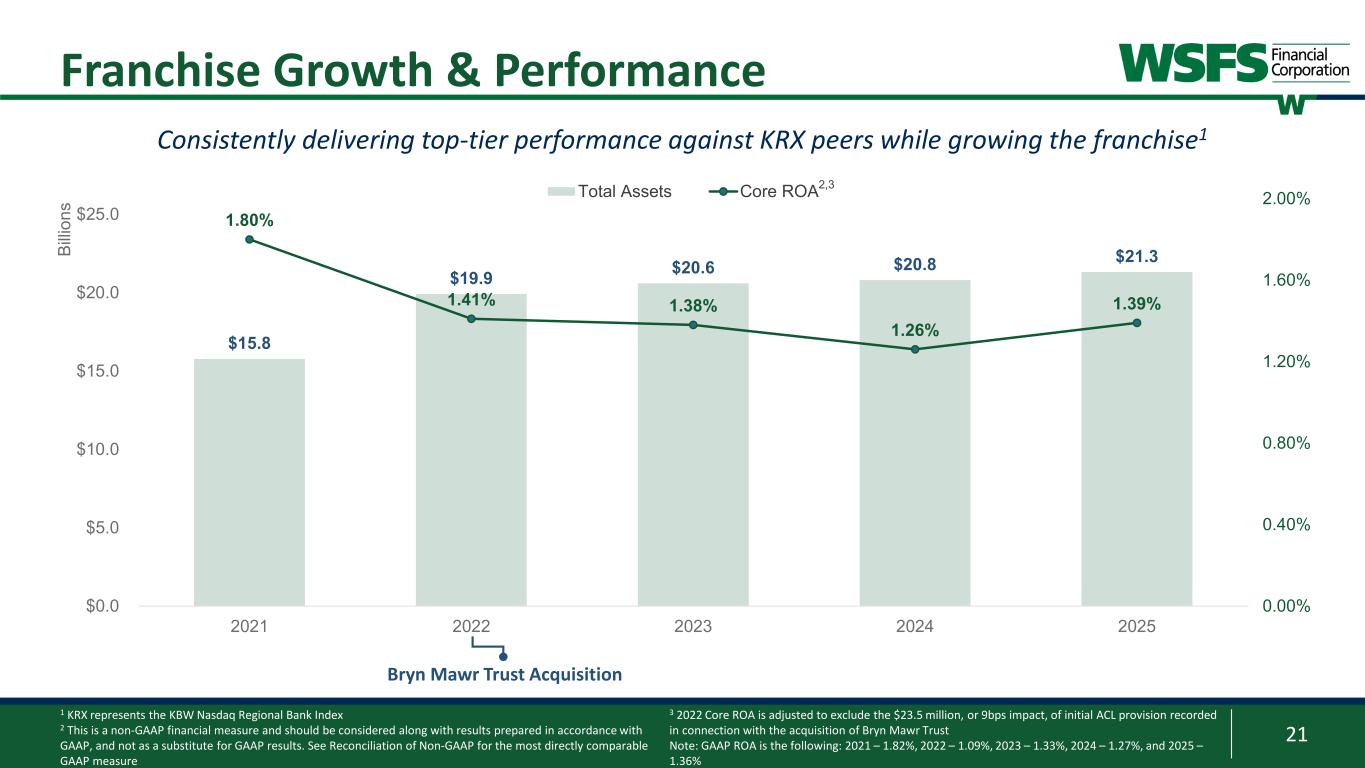
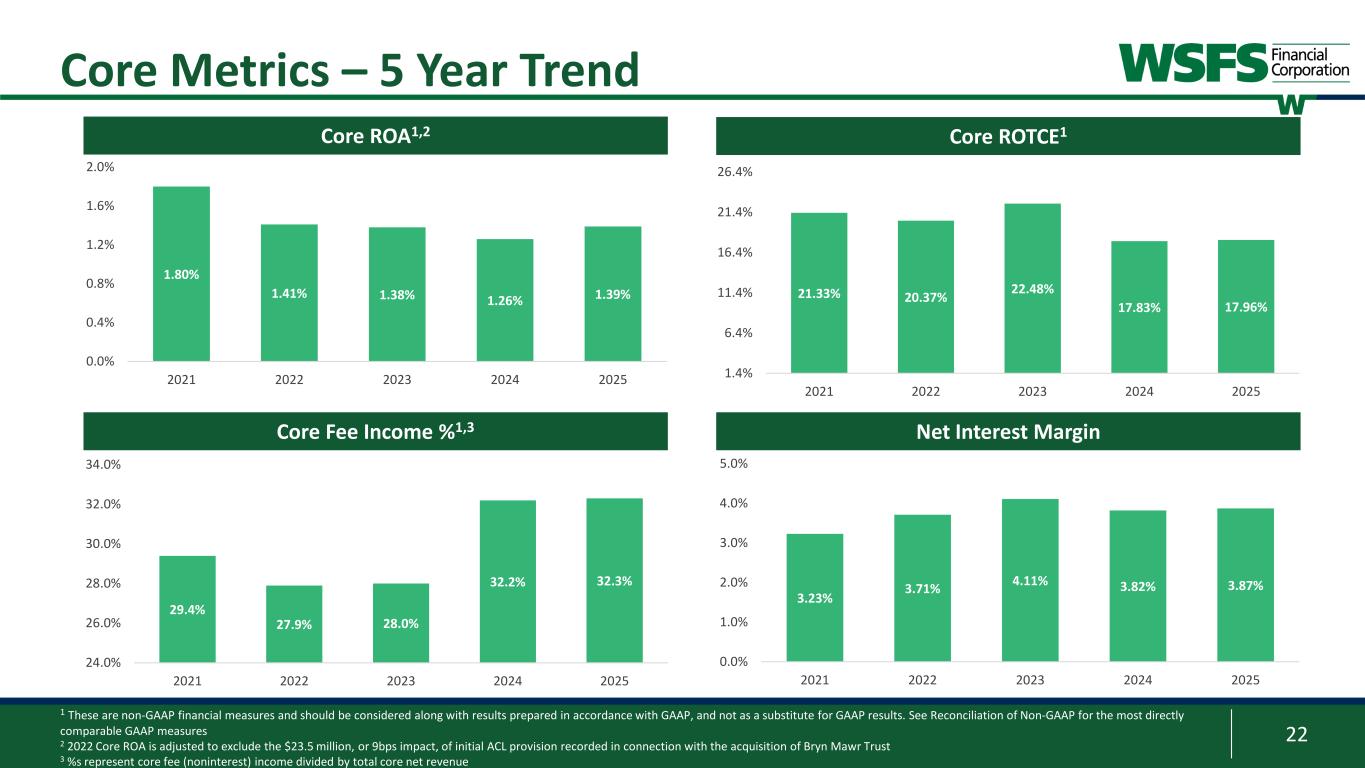
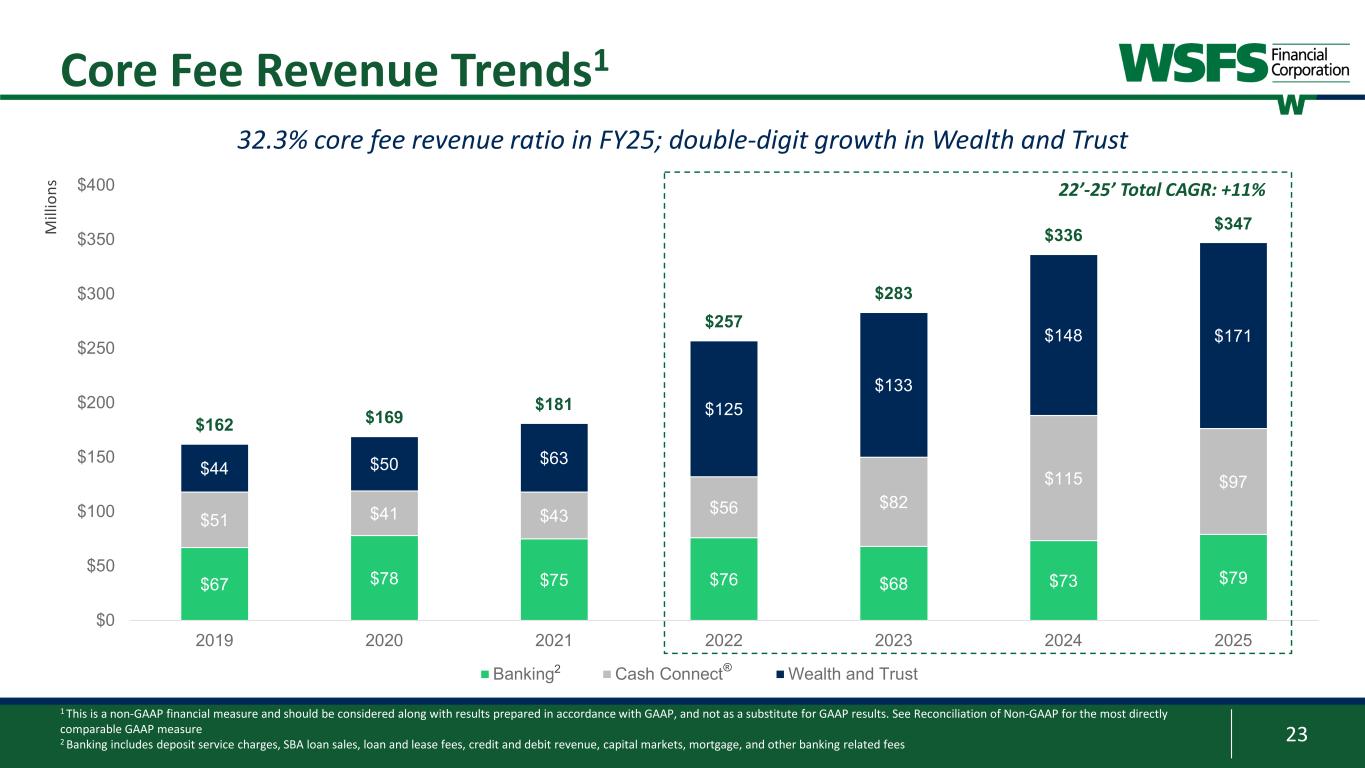
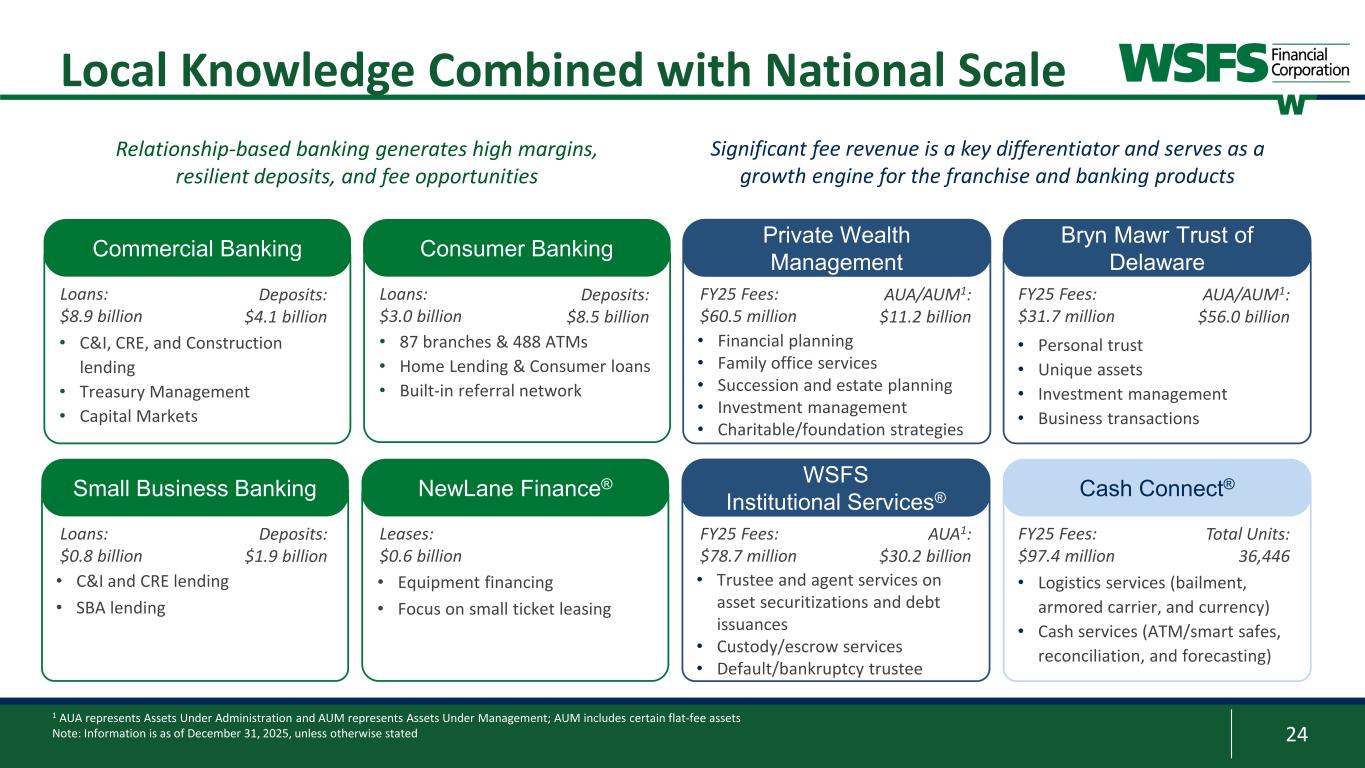
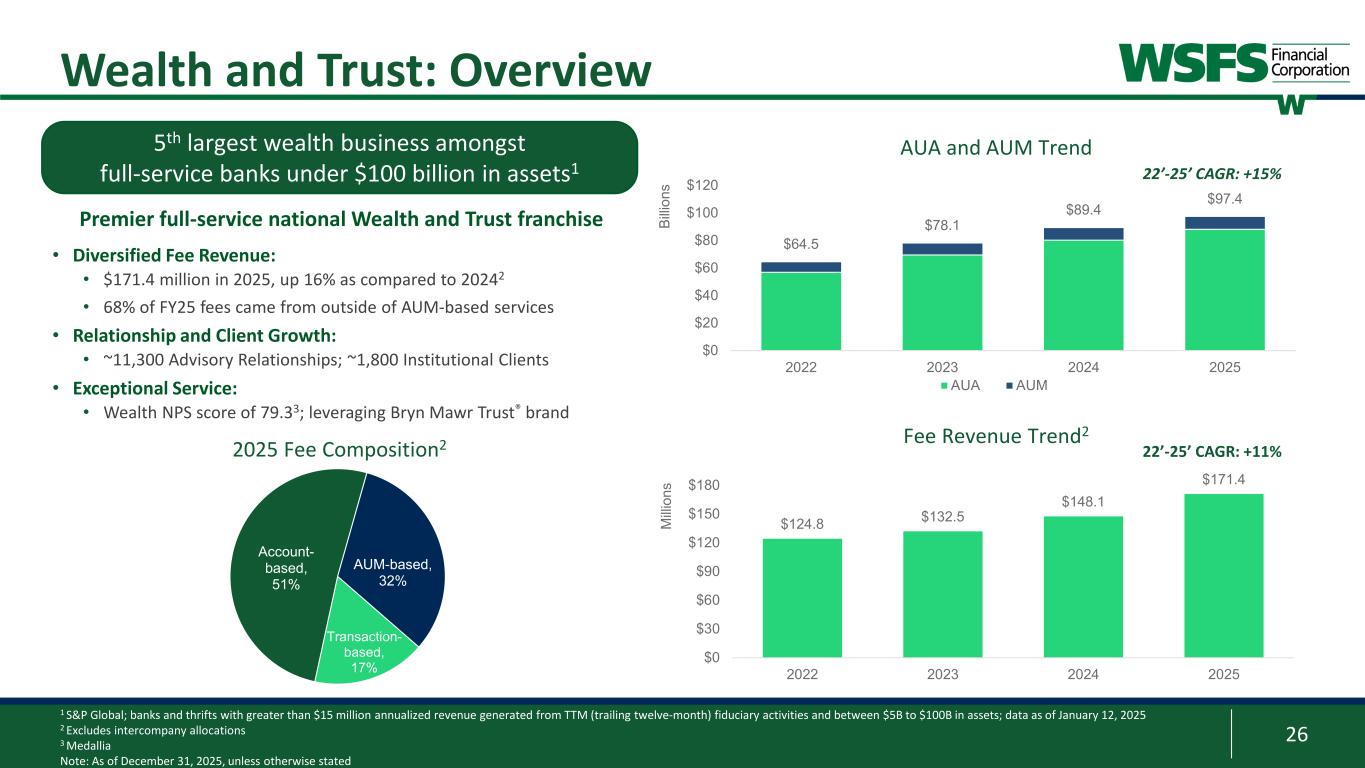
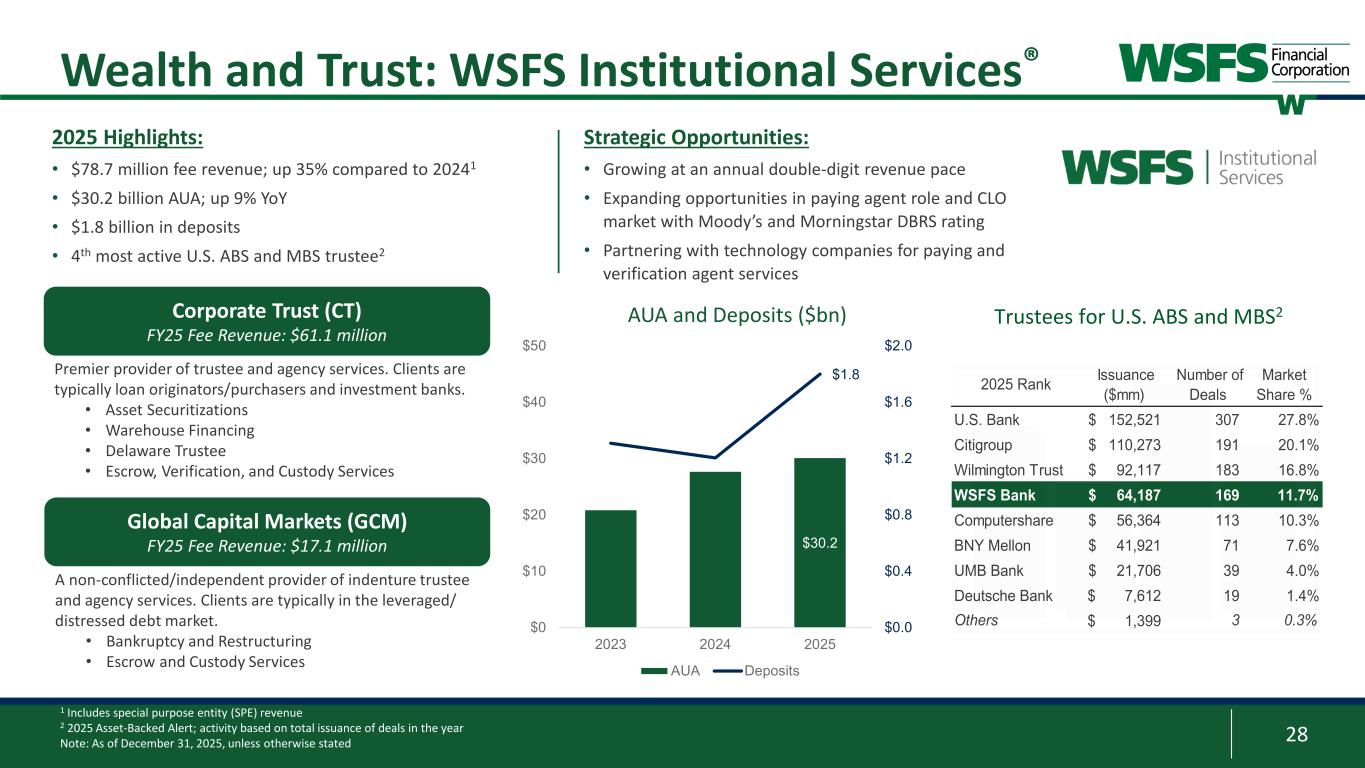
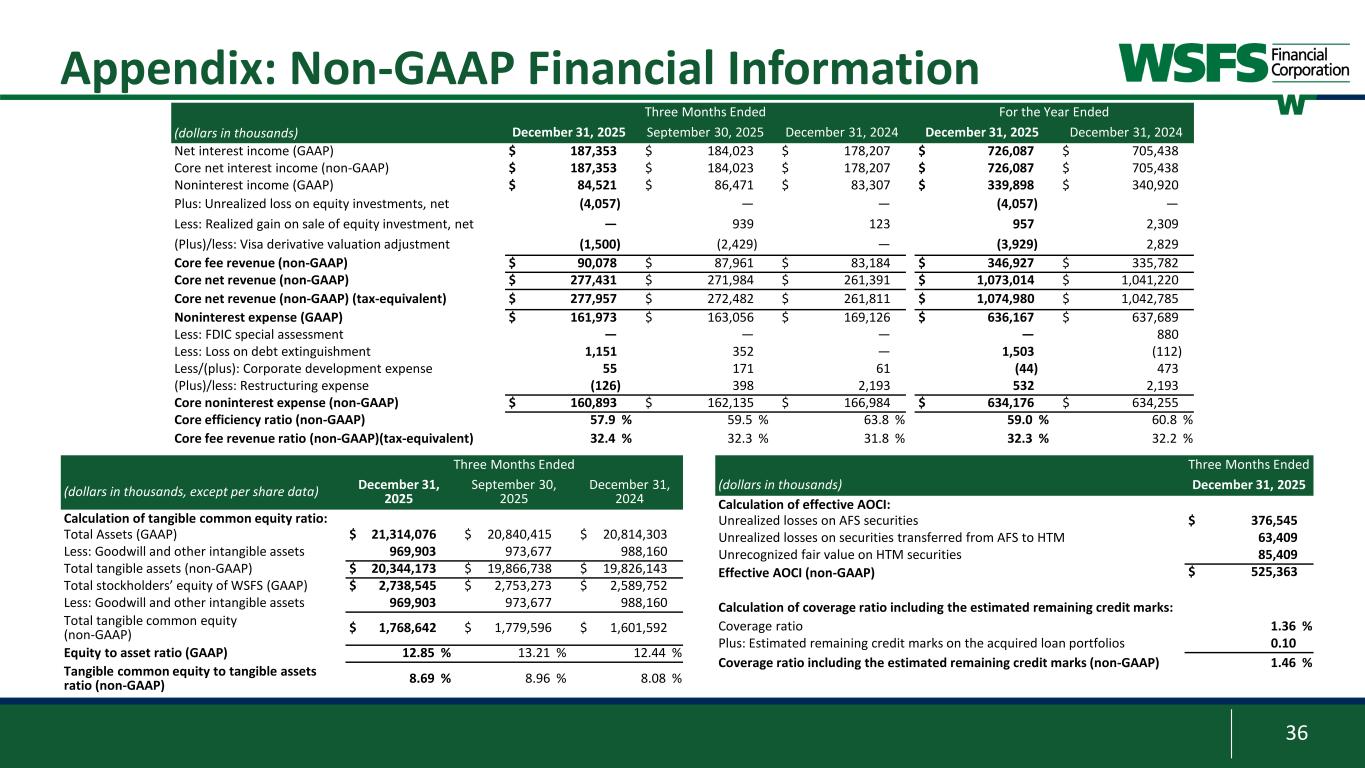
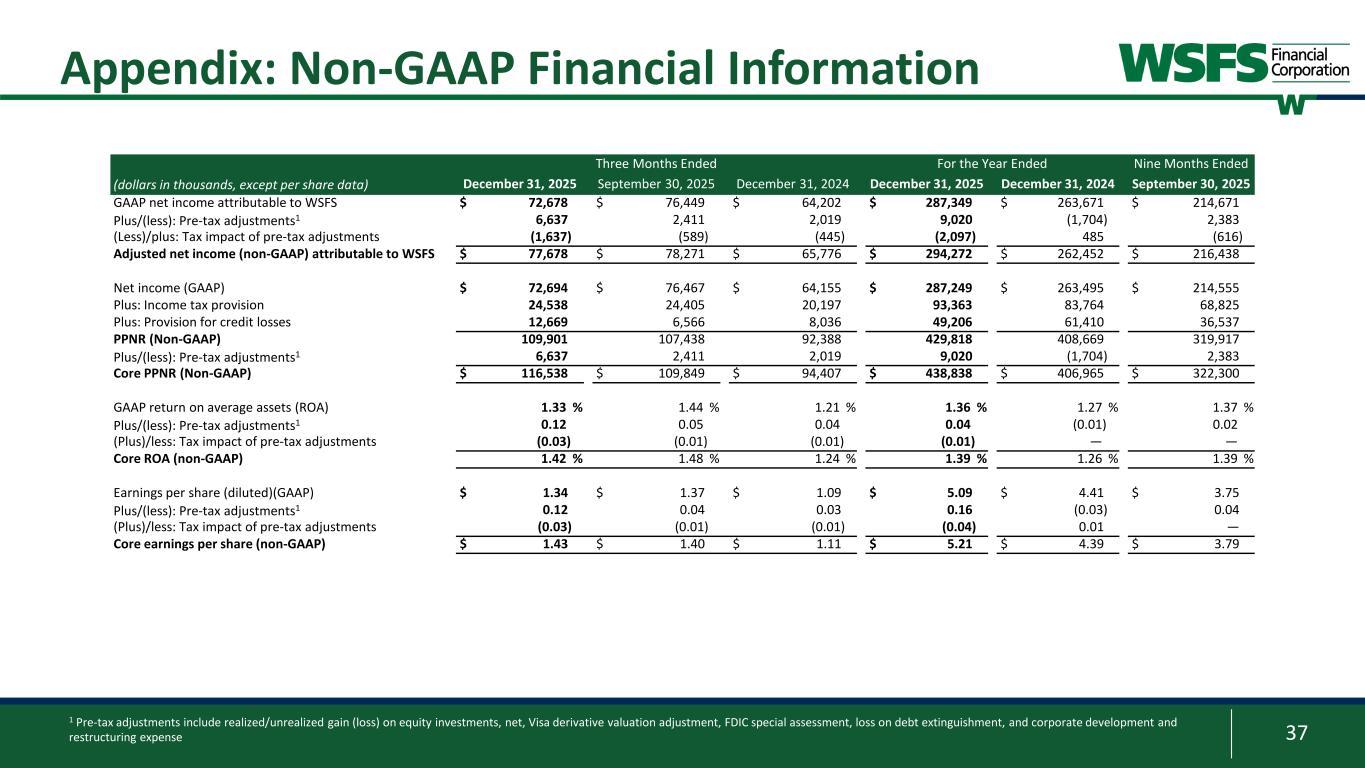
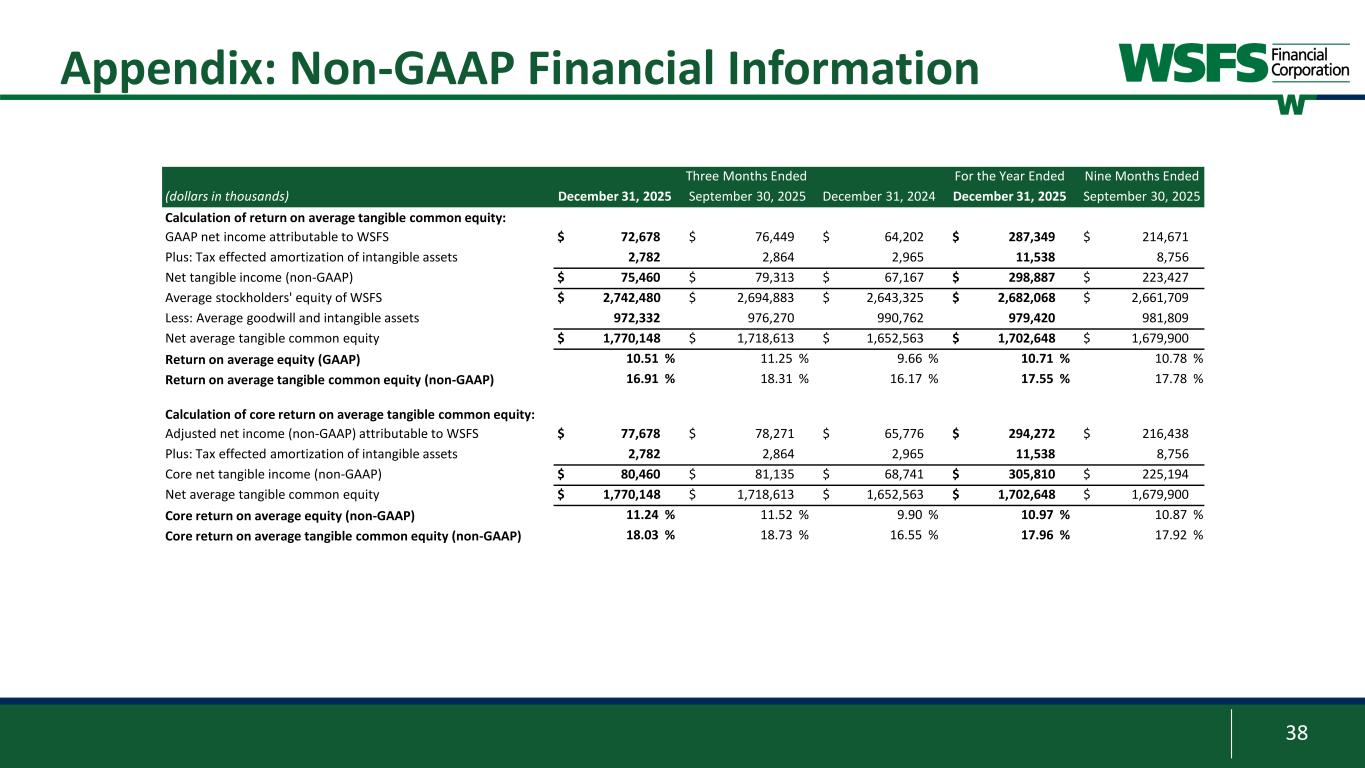
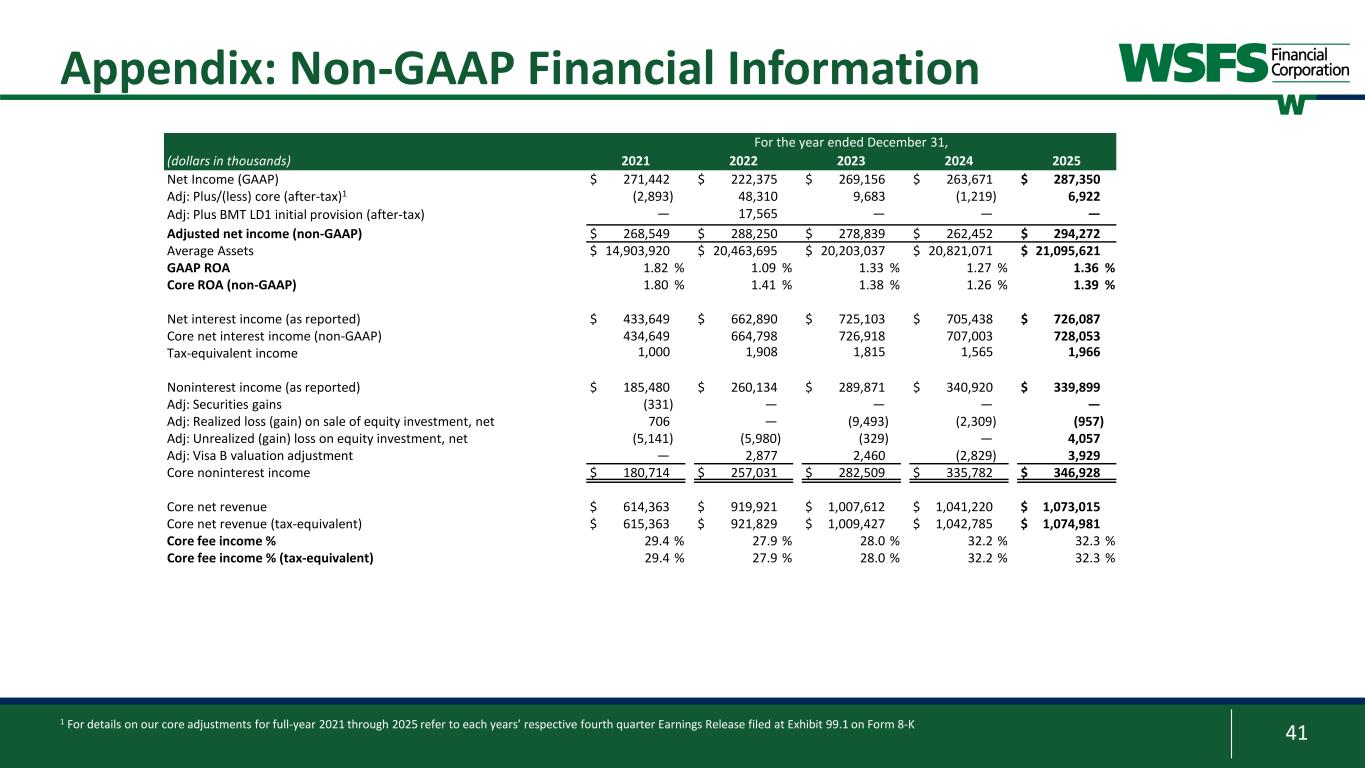
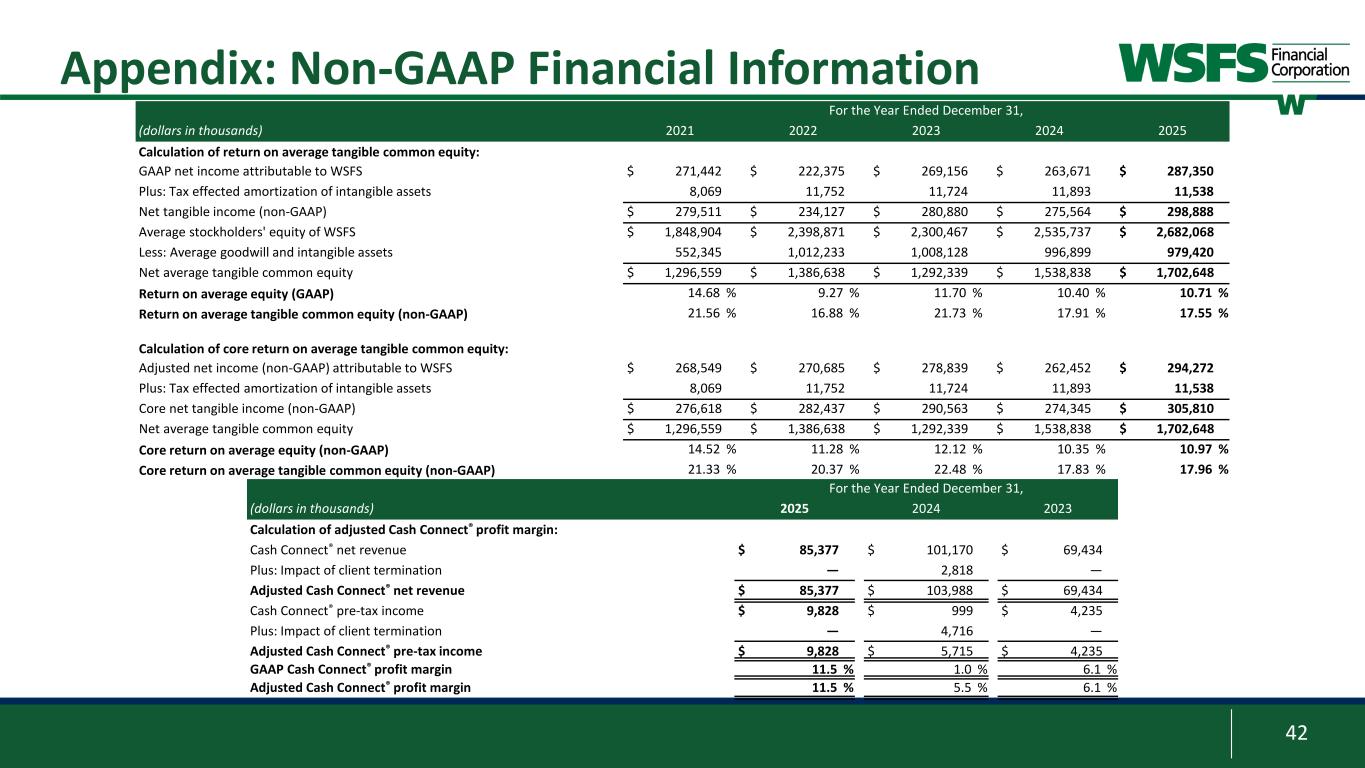
Great. Thank you very much. And good afternoon, everyone, and thank you for joining our fourth quarter 2025 earnings call. Our earnings release and earnings release supplement, which we will refer to on today's call, can be found in the investor relations section of our company website. With me on this call are Roger Levinson, Chairman, President, and CO, and our BACI, Chief Operating Officer. Prior to reviewing our financial results, I would like to read our safe harbor statement. Our discussion today will include information of our management's view of of our future expectations, plans, and prospects that constitute forward-looking statements. Actual results may differ materially from historical results or those indicated by these forward-looking statements due to risks and uncertainties including, but not limited to, the risk factors included in our annual report on Form 10-K and the most recent quarterly reports on Form 10-Q, as well as other documents were periodically filed with the Securities and Exchange Commission. All comments made during today's call are subject to the safe harbor statement. I will now turn to our financial results. Our businesses continue to perform very well in the quarter, providing strong momentum moving into 2026. For the fourth quarter, WSIS delivered a core earnings per share of $1.43, a core ROA of 1.42%, and core return on tangible common equity of 18%, which are all up meaningfully on a year-over-year basis. These results closed out a successful 2025 that included a full-year core EPS of $5.21, core ROA of 1.39%, and core return and tangible common equity of 18%. Our 4Q core EPS is up 29% over the prior year, and our 2025 full-year EPS increased 19% over the prior year. These core results for the fourth quarter exclude several non-core items which resulted in a $5 million impact to net income, as well as a $0.09% impact to EPS in the quarter. These items are outlined on page 5 of the supplement. Net interest margin was 3.83% for the quarter, down 8 basis points link quarter, driven by the rate cuts and a one-time interest recovery last quarter, which accounted for 4 basis points of the decline. Importantly, our name is up 3 basis points year over year, while absorbing 75 basis basis points of interest rate cuts since the fourth quarter of 2024. We continue to successfully reprice our deposits and our exit deposit data for December was 43%. Corfew revenue increased 2% link quarter and 8% year-over-year driven by double-digit growth in wealth and trust, capital markets, and home lending. Our wealth and trust business continues to perform very well and grew 13% year-over-year with 29% growth in WSFIS Institutional Services and 24% growth in BMT of Delaware. For the full year 2025, WSFIS Institutional Services was the fourth most active U.S. asset-backed and mortgage-backed securities trustee with nearly 12% market share, moving up two spots in the rankings relative to 2024. Total gross loans grew 2% link quarter or 9% annualized, driven by broad-based growth across our businesses. In commercial, growth was led by C&I, which delivered growth of 4% link quarter or 15% annualized. And overall, we saw the largest quarterly fundings in over two years. Our residential mortgage and WSFIS-originated consumer loans continued to build on their strong momentum and grew 5% link quarter. Total client deposits increased 2% link quarter or 10% annualized with growth across trust, private banking, and consumer. Importantly, our non-interest-bearing deposits grew 6% link quarter and now represent 32% of our total client deposits. Turning to asset quality, we saw meaningful improvement across our problem assets due to favorable net migration and payoffs and ended the year at the lowest level in over two years. Non-performing assets were essentially flat compared to the prior quarter and ended the year down approximately 40% compared to year-end 24. Delinquencies increased 46 basis points link quarter due to several previously identified non-performing and problem assets moving to delinquent status in the quarter. 14 basis points of this increase was driven by non-performing loans. The remainder is primarily comprised of two office loans and one multifamily condo loan in our footprint. One of the office loans was already resolved in January, while the other is a medical office expected to be sold in the first half of 26, which would result in a full repayment of our loan. We continue to work with the borrower on the remaining loan and believe we are well secured. Net charge-offs increased 16 basis points to 46 basis points of average loans, primarily due to the partial charge-off of a non-performing land development loan. Net charge-offs were 40 basis points for the year, excluding Upstart, which is on the midpoint of our prior outlook. During the fourth quarter, WISFUS returned $119 million of capital, including buybacks of $109 million, or 3.7% of our outstanding shares. This took our total buybacks for the year to $288 million, representing over 9% of our outstanding shares. On slide 15 of the supplement, we provided our 2026 outlook, which assumes a continued stable economy and three 25 basis point rate cuts throughout the year in March, July, and December. Overall, we expect to deliver another year of high performance and growth with a full-year core ROA of approximately 1.40% and double-digit growth in core EPS. As a reminder, we intend to maintain an elevated level of buybacks in line with our previously communicated glide path towards our capital target of 12%, while retaining discretion to adjust the pace of buybacks based on the macro environment, business performance, and potential investment opportunities. We expect mid-single-digit loan growth overall with low single-digit growth in our consumer portfolio, where we expect continued momentum of residential mortgage and other real estate-secured consumer loans, partially offset by the continued runoff of our spring EQ partnership portfolio. Building on a strong momentum in deposits in 2025, we expect continued broad-based deposit growth across our businesses in 26. Our outlook calls for deposit growth in the mid-single digits from 4Q levels. Our outlook for NIM is approximately 3.80 for the year, which incorporates the impact of the three additional interest rate cuts I mentioned. We continue to focus on deposit repricing opportunities while growing our portfolio and expect to maintain an interest-bearing deposit beta of low to mid-40s throughout the year. While the path and timing of future rate cuts remains uncertain, it's important to note that the impact of additional rate cuts on our and financial results will not be linear as we continue to manage our margins through several levers, including deposit repricing actions, our hedge program, and the securities portfolio strategy. We continue to see momentum and growth opportunities in our fee businesses, which contribute approximately a third of our total revenue. Our overall fee revenue will grow mid single digits, excluding Cash Connect. Wealth and Trust is expected to continue their strong momentum and again grow double digits in 2026. Cash Connect revenue is expected to decline due to interest rates, but will be more than offset in expenses. Our focus in Cash Connect continues to be on driving the profit margin, which has increased meaningfully in 2025. Our outlook for net charge-offs is 35 to 45 basis points of average loans for the year, consistent with our 2025 results. While we have seen strong improvement of problem loans and non-performing assets, commercial loan losses may remain uneven. Our outlook calls for an efficiency ratio in the high 50s for the year. We plan to maintain strong expense discipline, but will continue to leverage opportunities to invest in the franchise, which coupled with normal seasonality may result in some variances quarter to quarter. We're excited about the future and remain committed to delivering high performance. Thank you, and we will now open the line for questions.
Operator
As a reminder to ask a question, please press star followed by the number one on your telephone keypad. Our first question comes from Manuel Navas from Piper Sandler. Please go ahead. Your line is open.
Hi. On the low growth, can you talk a little bit about the better commercial trends and kind of what are you seeing out there in terms of sentiment? There's some better line utilization. The footings were up. Just kind of talk about what you're seeing in commercial that's driving this kind of strong originations and a good outlook.
Yep. Sure. Manuel, good afternoon. I'll start off. So in commercial, as you know, in the first half of last year, there was, you know, quite a bit of uncertainty in the economy with the tax bill pending, some of the tariffs and legislative issues that were ongoing. And I think as you heard Roger mention a couple of times in our calls in the first couple of quarters of the year that small business owners and entrepreneurs were, when faced with that kind of uncertainty, you know, we're kind of delaying some business decisions. And so what happened over the course of the year was we continued those discussions with clients. We saw that pipeline really build in the third quarter, and our pipeline reached over 300 million in the third quarter. And in the fourth quarter, when some of those things crystallized, we – the environment, you know, people felt better about making some of those decisions with the passage of the tax bill, a little bit more clarity on the legislative front. And so, you know, we saw very strong originations in fundings, and, you know, we continue to see good momentum. We're not going to see that kind of growth every single quarter, but, you know, we feel good about the momentum going forward from here.
I appreciate that. Can I switch over to capital return for a moment? This was a really strong quarter in terms of buybacks. What are kind of your parameters there? Is it just that CET1 ratio? This quarter also had return on AOCI, a little bit lower pricing, kind of book value for share growth. You hit 110% total payout, like what should be the guideposts beyond CET1 going forward?
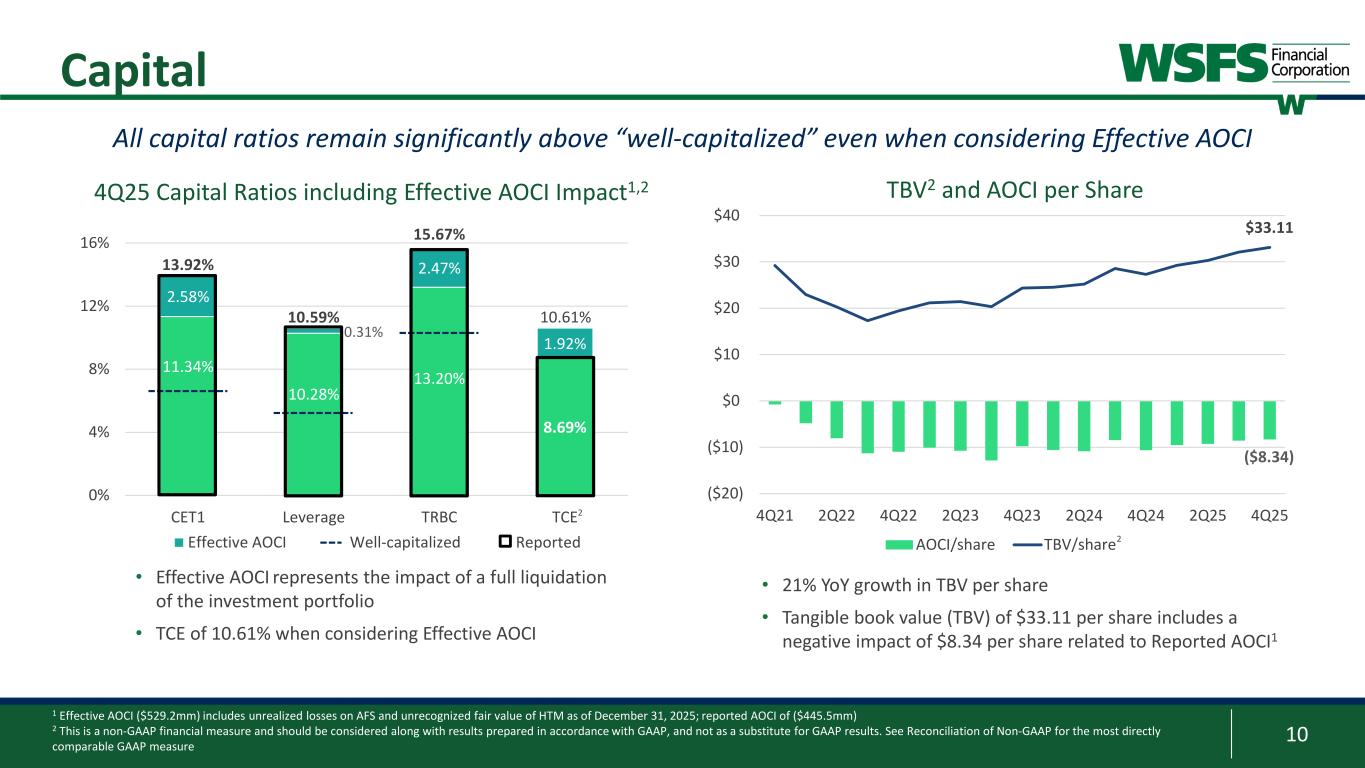
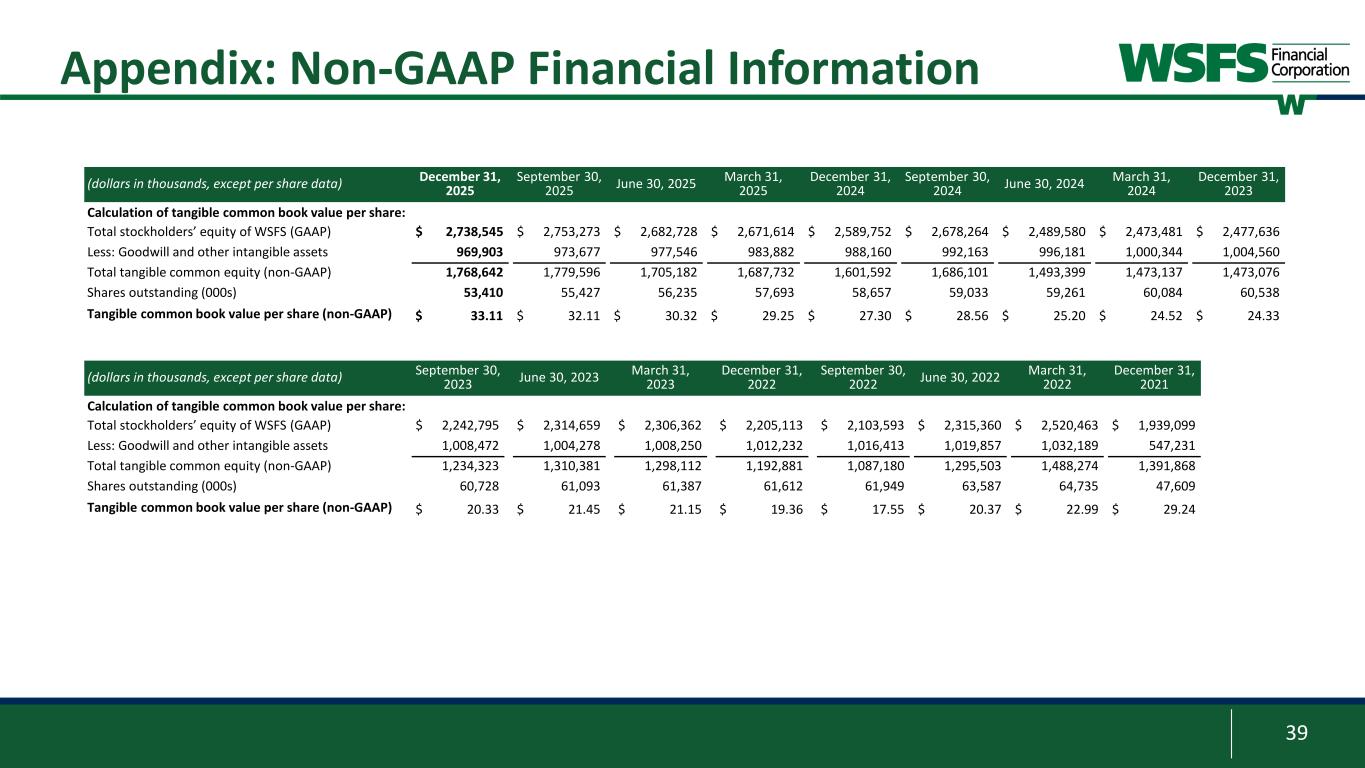
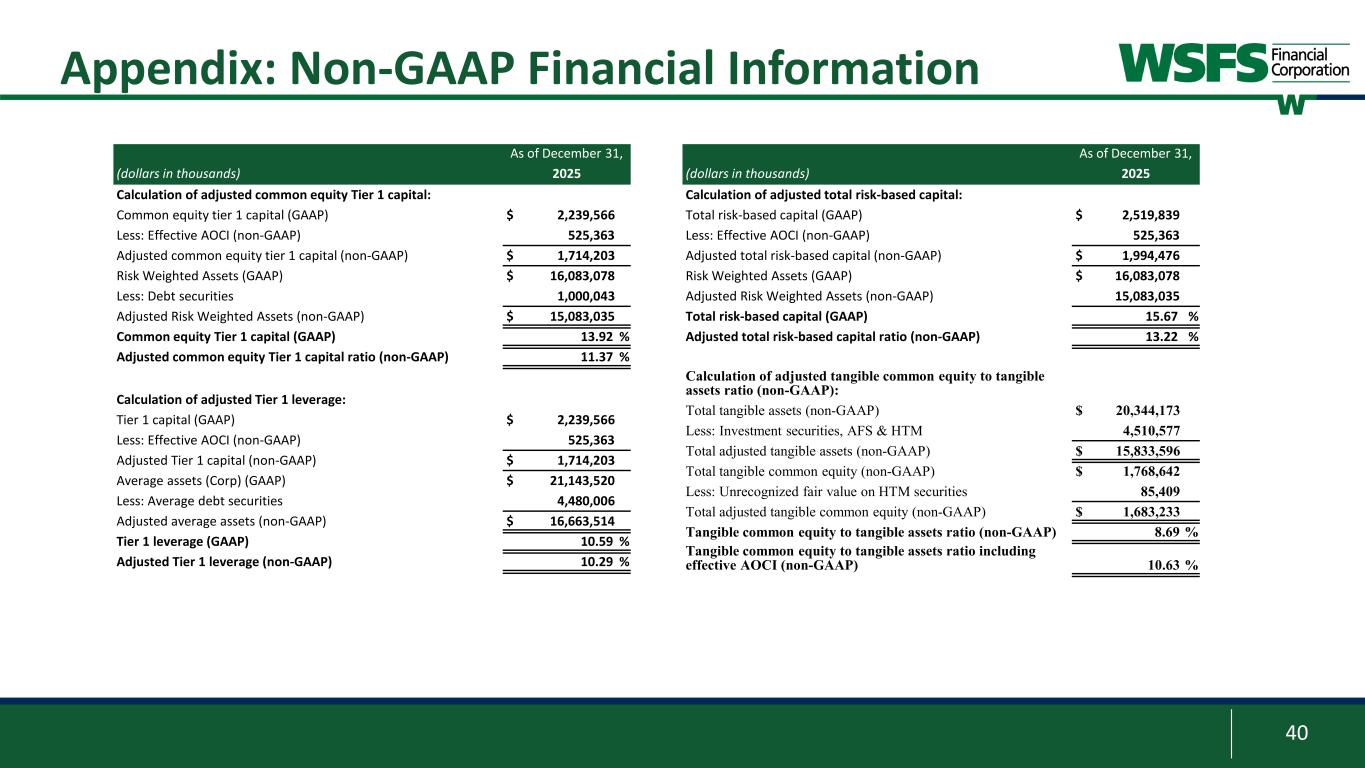
I think, Manuel, we look at all of those factors. I would say primarily CET1 and TCE, which does incorporate that AOCI volatility. And, of course, you know, if we see our price dip, we take advantage of those opportunities. But generally, you know, our approach is, as you know, the majority of our capital philosophy, our capital return philosophy is through buybacks. Our dividend is kind of in the mid-teens. So about 85% of our capital returns is through buybacks. And we are continuing on this kind of multi-year glide path to get to our capital target. And so, you know, I think we have the capacity, and you can kind of think about it as returning, you know, roughly 100% in an income a year. But I think importantly, you know, we will toggle that up and down depending on what we see. If there are investment opportunities, you know, we want to take advantage of those. And similarly, if there's some kind of stress in the economy or the market, you know, we may slow that down. So I think that's kind of a glide path. But all of the factors you mentioned are things we take into account. I appreciate that. I'll step back into the queue.
Operator
Our next question comes from Russell Gumther from Stevens. Please go ahead. Your line is open.
Hey, good afternoon, guys. Hey, Russell. Hey, David. Wanted to start on Cash Connect, if we could. So three cuts baked into the outlook. I know 4Q can tend to see some seasonally lower ATM volume. But as you look at the year ahead, what type of revenue hit are you guys anticipating here? And then within that, if you could talk just overall margin expectations, you mentioned the improvement, I think, from what was a high single-digit margin to a low double-digit one now. So just helpful to get the puts and takes, positive and negative, over the course of 26 in terms of profitability improvement here.
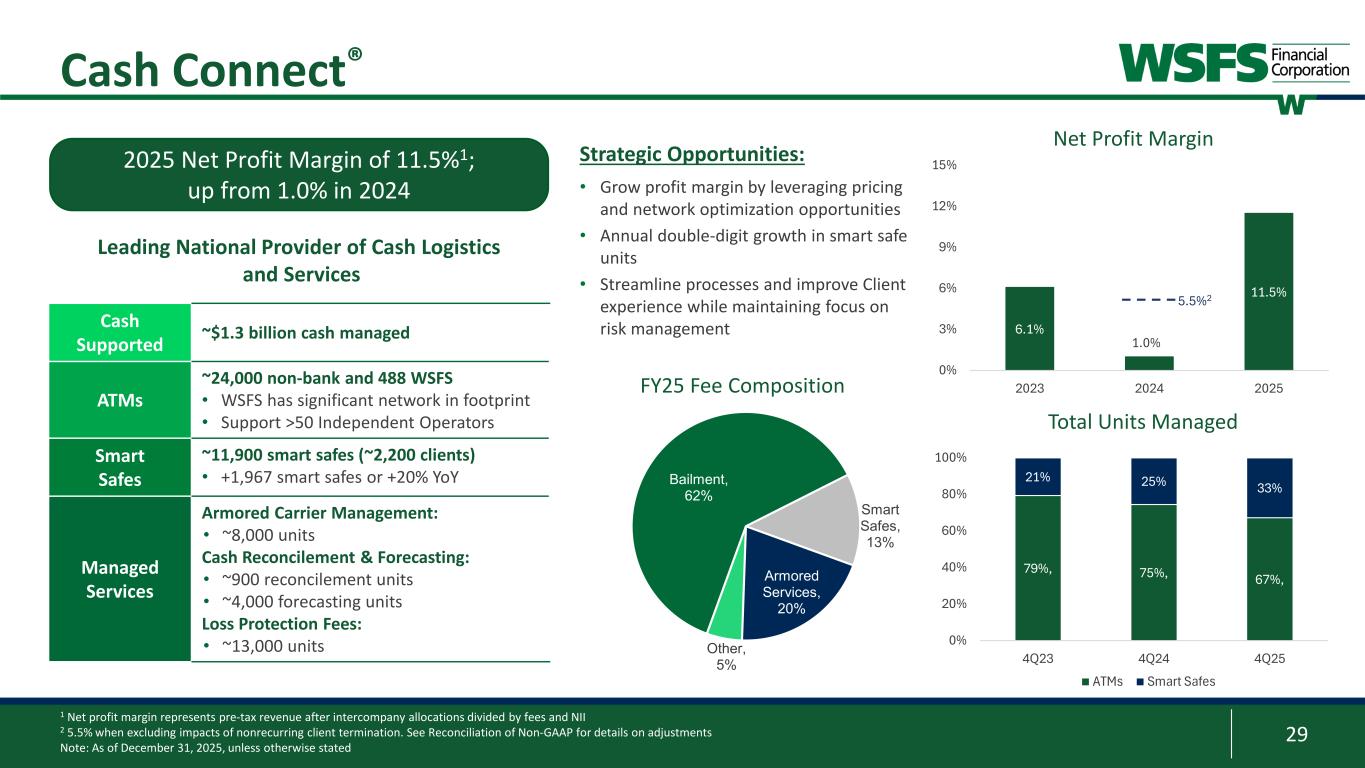
Sure, Russell. So, yeah, when you look at Cash Connect, as you mentioned, the interest rates do have an impact on the pricing, on the top line, but that's more than offsetting the expenses, so we do have a margin benefit there. I think the way to think about it is roughly about $2.5 million annual impact per 25 basis point rate cut is kind of roughly, you know, what you should think about on the top line. And so the impact of the rate cuts, like you said, about three rate cuts for the year, that's really, you know, kind of the way to think about the impact on the top line for Cash Connect. But you mentioned the margin. That's really been the story that we've been focused on because some of that macro pricing. But not only are the interest rates accretive to margin, but we've also been taking a number of other actions to continue to drive margin. And those are, number one, pricing. We've leveraged some of the scale that we have in the market to increase pricing across our products, and that's been a meaningful benefit. Number two, we've had a couple of things that we're doing around expenses, and that includes both optimizing kind of in-transit cash as well as just efficient management of expenses in the business. And the third thing that we're doing is we're taking a look at the client portfolio across that business and thinking about – and, you know, there's a page in the supplement which shows the mix of that business between smart safes and bailment. And you can see that smart safes have increased year over year from about 25 percent of total volume to about 33 percent of total units, rather. And the smart saves generally come with higher margin and higher kind of value-add product. And so as we continue to grow that business, which we think is kind of the growth vector within that business, that should also be accretive to our margins, and that's part of our strategy. So it's a combination of, you know, not just rates but all of those actions that have allowed us to drive the margin, and the goal is, you know, that we continue to drive that into the mid-single digits, you know, and hopefully higher.
Okay. That's very helpful, David. Thank you. And then just switching gears overall to expenses, you know, great to see the high 50 deficiency. But outside of the lower result we'll get, like from the Cash Connect, as we just discussed, are there areas of outright reduction that can support a lower run rate from here? Just trying to think through, you know, what's a decent core or not just for non-interest expense growth rate for WISFIN?
Yeah, Russell, I would say a couple things there. You know, our efficiency for the year this year was 59%. You know, we set high 50s, so, you know, we'd like to be in that range a little bit better next year. You know, we don't want to give a specific number because, as you know, we want to take advantage of opportunities and invest in the franchise. And so, if those opportunities exist with talent additions or technology, we want to take advantage of those opportunities. And so, that's why quarter to quarter, there may be fluctuations. But to give you a little bit of a sense of, you know, other things that we're doing on expenses, we do have a number of different productivity actions that we're taking. For example, we've been optimizing our real estate portfolio, And that's been a nice tailwind for us and will continue to be, so we're really leveraging those opportunities hard. Another one is, you know, we have divested a number of products or businesses that are not central to our strategy. Those include Upstart, earlier in the year, Powder Mill. We exited the joint venture with Commonwealth, and all those things are also taking out expenses for things that are again not central to our strategy and you know after in addition to all of that I think we having really good strong discipline around our headcount and expenses overall including particularly in the shared functions so so I mean all of those things give us confidence but importantly we want to really continue to invest in the business if those opportunities okay yeah I hear you I appreciate it and then just last one for me.
Curious as to the anticipated mix of deposit growth. So you guys are basically looking to match fund loan growth. Just wondering any willingness to flex with the below peer loan or deposit ratio around 76%, right? Just maybe fewer market rate deposits. And then I guess an adjacent question really would be just expectations around the overall size of the balance sheet. If you can touch on the investment portfolio and cash balances, how they could trend over the course of the year?
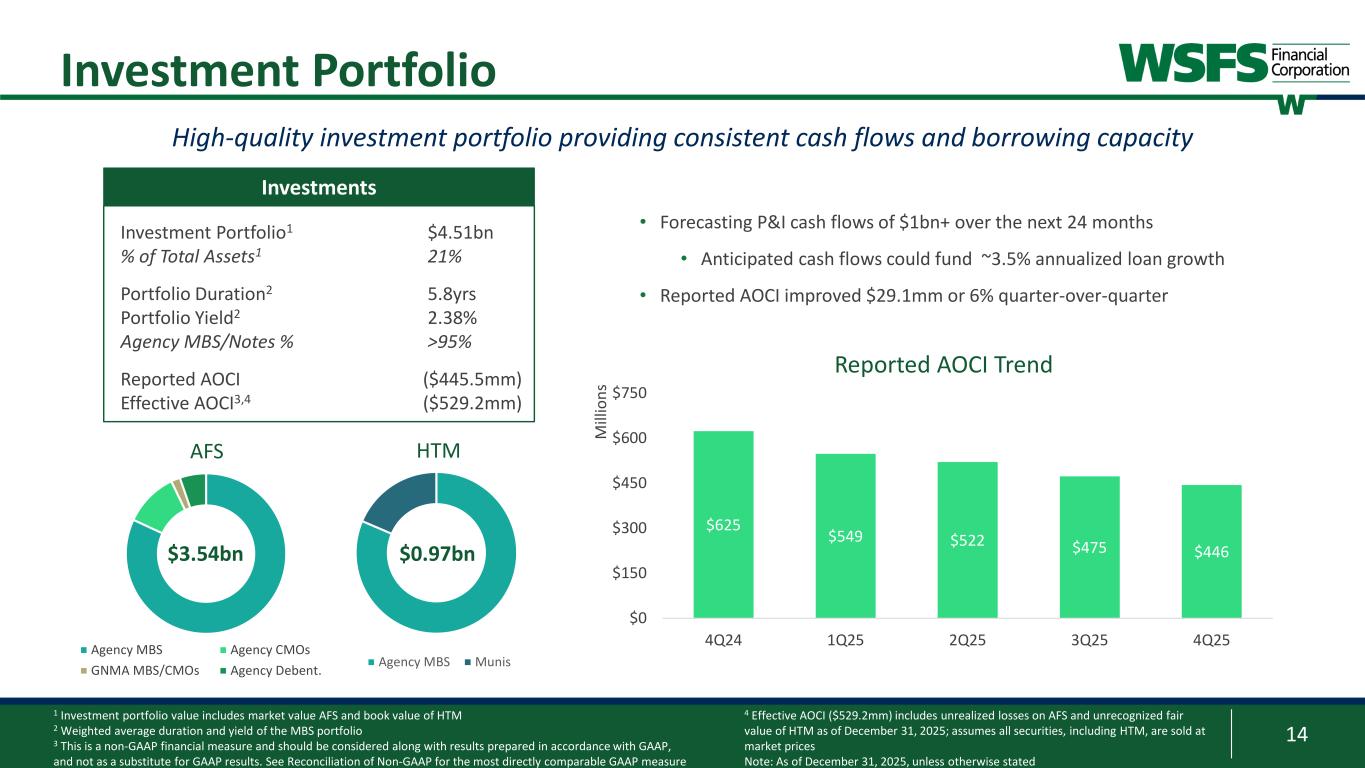
Sure. So first on deposits, so that's, you know, that's a trade-off that we do take into account. We've been running off, if you look over the course of the year, we've been reducing a little bit of our CD book, and that's been really price-driven. So it's not an intentional runoff, but we've been aggressive on pricing there, and that's really because of the strength of the deposit growth in other businesses, we were able to do that, you know, particularly for clients that are – that only have the CD relationship. So we will continue to look at opportunities to, you know, to flex pricing. But you know, as you know, a lot of our deposit growth has come from non-interest-bearing deposits, and those are clearly kind of core operating deposits that we certainly want to continue to bring in and are super creative in the long run. So I would say we are trying to be fairly aggressive on pricing while continuing to grow core clients and relationships. And on your question around securities portfolio, we have – over the course of a year, we've been bringing down our portfolio a bit. I would say over the course of the past, you know, couple of years from elevated levels, now we've reached the point where it's in the low 20s, about 21 percent, and our intention is to keep it here. So from this point forward, we're going to – anything that really that comes off the securities portfolio, we will look to reinvest it in the same type of securities that we essentially have. So agency, not taking a lot of credit at all, credit risk in any way, MBS, those type of securities, but we're going to keep it flat at this level.
Okay, excellent. Thank you very much for taking my question.
Operator
Our next question comes from Kelly Mata from KBW. Please go ahead. Your line is open.
Hey, thanks for the question.
Just at a high level, you know, you've, over the past, you know, year or so, exited a couple businesses where the risk-adjusted returns aren't there. It feels like, given your guide and outlook, you know, these headwinds are abating somewhat. Are there any, as you strategically look at your diversified businesses, are there any things that you're continuing to evaluate that you could share or kind of thresholds of profitability you look at of these kind of niche businesses and deposit and loan verticals that you have, thanks?
Yeah, I'll start off, and I'm sure Roger will weigh in as well. So, Kelly, we continue to – we have an initiative here. We call it We Look, where we continue to look at different parts of our business and think about the fit and the strategic fit of that going forward. And that's something that we continue to do. And like you said, we've done a good job of shedding some of those things. You know, at the end of the day, you know, I can't really discuss anything specific that's, you know, on the horizon right now, but it's really, I would say, part of our strategic plan and part of our ongoing strategy to always evaluate those type of things.
Yeah, Kelly, it's Roger. I would just add to what David said is I think if you look at the actions we took in 25, those were primarily decisions made, you know, and WSFIS looked very different than we are today. And because they were low-scale, low-profitability partnerships or businesses that we had, we thought it just made sense for the reasons that David said to move on from those. I don't think there's a large group of followers to that, but I do think, as David said, there's opportunities to relook at a lot of things, you know, that we're doing based on the evolution of the company, and I think this was an important year to kind of start to build some of that muscle. We've always been very disciplined, obviously, about, you know, evaluating our profitability, you know, by business line and shared service area, I think this exercise will help us continue to do that, you know, going forward. So, when you go through a period of rapid growth like we did, you know, four or five years ago, I think as you settle into your scale and you see where you're getting that higher growth, you're looking to free up capital and resources to continue to invest in those areas, and in areas where we're not seeing that to, you know, either redeploy that capital or resources. So it's an important part of our strategic plan, and we'll continue to be going forward.
Got it. That's helpful. Maybe a question on M&A, if I could. It's been several years now since your last deal. I know you've been internally focused, and clearly, you know, you've had a nice glide path with what you're doing organically. but, you know, just as we get another year out, you know, entering 2026, I'm wondering if you have any updated thoughts here given the integration and work you've done so far.
Yeah, this is, you know, Roger again. I'm sure you're referring to bank M&A, which I'll address in a second. But, you know, as David said a couple of times, we're continuing to invest, you know, very heavily in the business, whether it's the fee businesses or the banking business, and that could come through one-off lift-outs or talent or small firms, or it could come as something larger. As it relates to traditional banking, we've been clear over the last year or so that if something came along that would strengthen our position, our very strong position in greater Philly Delaware region you know we would absolutely consider that and I think you know we have demonstrated now you know our ability to execute on those you know very well but we also feel good about the organic growth and so you know we can continue to achieve our objectives as we outlined for 26 by focusing on the organic opportunity and then we'll supplement those with you you know, inorganic opportunities, you know, should they come along.
Operator
Our next question comes from Christopher Maranak from Janie Montgomery Scott. Please go ahead. Your line is open.
Yeah, hey, I wanted to look at sort of risk-adjusted returns in the loan portfolio, and, you know, particularly as Upstart is now behind you, you know, do you see those getting stronger or does the rate environment sort of limit what you can get on a risk-adjusted return?
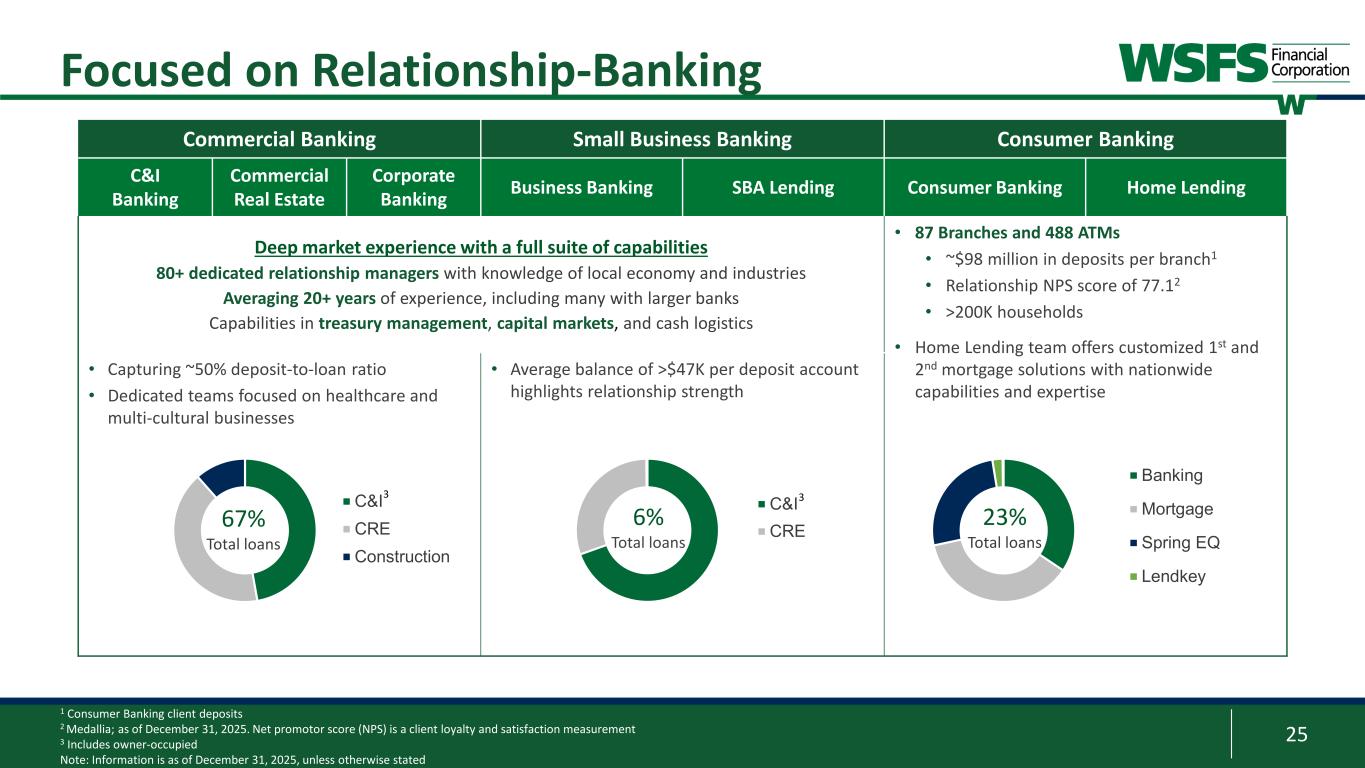
Hey, Chris, it's David. Yeah, I think, so when you look at our, you know, when you look at our loan pricing and our risk-adjusted returns, you know, it's really a combination of the different businesses that we have. Like you said, when you – if you look at the consumer business, we've divested Upstart and really most of the portfolio is now a real estate-secured portfolio. And so, you know, when we think about kind of risk-adjusted returns and going a little to the previous question, really we want to focus on things where we feel we have a competitive advantage and are able to originate better than others in the market, and that's really around the home lending product. And that really goes to risk-adjusted returns and our ability to not just grow, but also grow at the right price point. And so that's why when you think about our growth going forward, it's really on the residential side, on the home equity line side, installment line side, but kind of on that real estate secure portfolio where losses are, you know, have a very different profile than on the unsecured portfolios that we've seen. On the commercial side, you know, we continue to be, you know, the primary product is really the C&I relationship product, and that's really where we continue to see the growth. We are not the lowest price point in the market. We are, you know, we sell kind of our relationship, our ability to provide different products, our ability to provide superior customer service and that personalized touch. That's really what we think is our competitive advantage. And so, you know, we're not the lowest price point in the market, but we think we're the best service in the market and the most responsive in the market. And so that's what we're going to continue to lean on. So CNI is our primary product, but commercial real estate continues to be an important product that we're going to continue to grow with the right sponsors with whom we have relationships. and, you know, who are known in our footprint.
Hey, Chris, this is Roger. I obviously 100% agree with what David did. The other component which you'll hear us continue to talk about more is getting more out of our client relationships, particularly C&I, but across the platform by, you know, referrals throughout our franchise, especially on the wealth side. so I think it's taking that total relationship view and allocating that to you know various products is where we see an opportunity to get a little bit more overall profitability through the franchise just because of the strength of the relationship I think we've done a good job on that fun but we also feel like we're just getting started particularly on those referrals you know into wealth and vice versa.
Great. Thank you both for that. I appreciate it. And then, David, just a quick question on taxes. Is that sort of $24, $25 range still a good number to think about going forward?
Yep. Yeah, that's a good number. Yeah, the tax bill really didn't have a material impact, you know, on our business, maybe a little bit of a negative impact because some deductions are no longer allowed, charitable deductions, for example, up to a certain point. So, a small impact, but generally, that's the right range. Okay.
Very well. Thank you both. I appreciate it. Thank you, Chris.
Operator
Our next question comes from Janet Lee from TD Cowan. Please go ahead. Your line is open.
I want to step back and understand the driver behind your strong, very strong, non-interest bearing deposit growth in the quarter. I assume a lot of that has to do with wealth and trust momentum that has been growing. In terms – and aside from the deposits, the wealth and trust revenue on the fee side is also growing double digits. So I want to understand, is it a function of your overall institutional trust market increasing, or are you taking market share? I want to understand the competitive dynamics there and whether that $340 million of non-interest-bearing deposit increase in the quarter should normalize in the quarter ahead. Thank you.
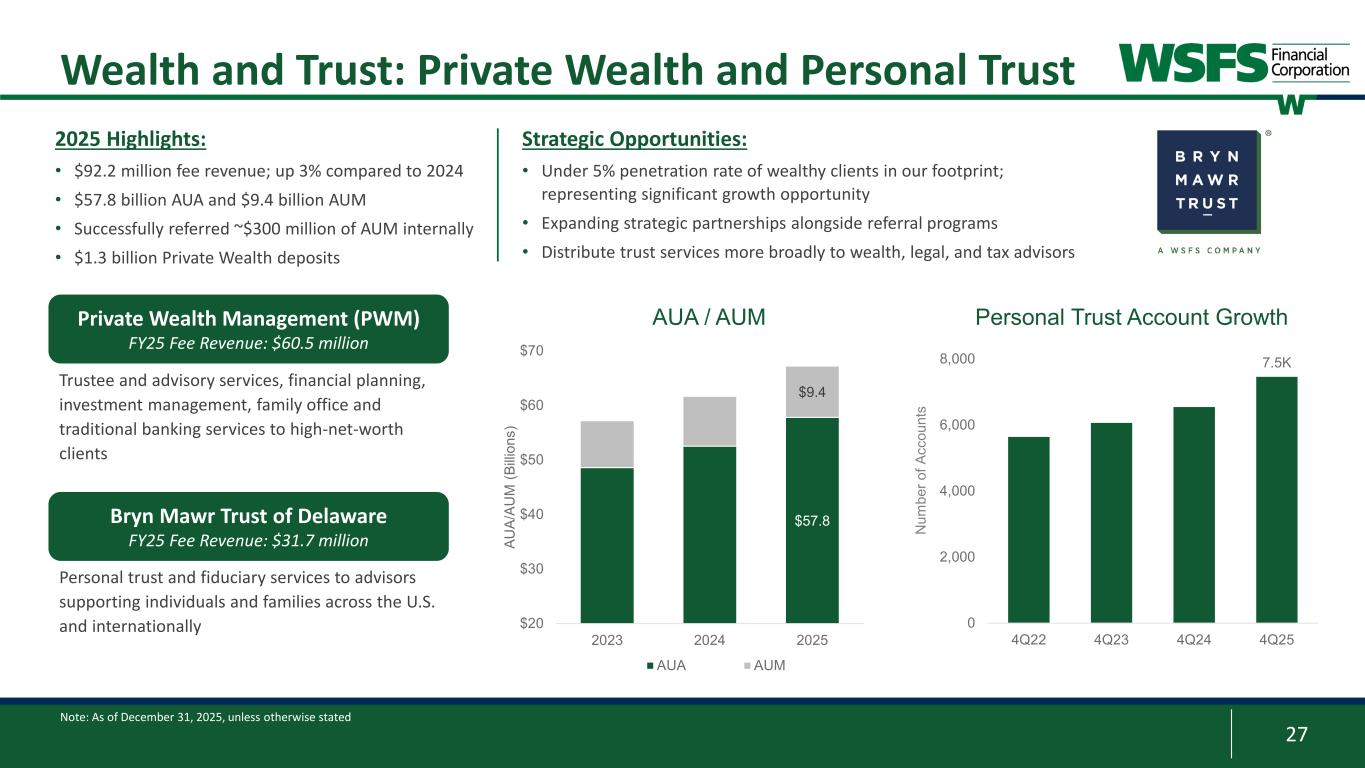
Again, it's David. Thanks for the question. So, yes, I think generally we expect that our non-interest deposit growth will be consistent with our interest-bearing deposit growth. So we want to continue to at least maintain that NIB ratio and, of course, try to grow it. So I'm not sure, you know, the growth that you saw this quarter, the 6% quarter-over-quarter growth, you know, that's probably not – we're not going to put up that kind of growth every single quarter. But generally, we want to continue to grow those at least in line with total deposits. And I would say, importantly, the growth that you've seen came from two businesses. One is trust, and two is private banking predominantly in this particular quarter. But importantly, when you look at the composition of non-interest-bearing deposits across our business, it's pretty broad-based. About 40% of that is in consumer. About 35% of that is across trust and private banking. And about 25% of that is in commercial. So every business is contributing meaningfully to that non-interest-bearing balance and, you know, really comes with the relationship growth and the relationship account growth that we have. So, again, while private banking and trust have been – and predominantly trust have been the engines this quarter, I think the composition is pretty broad across the business.
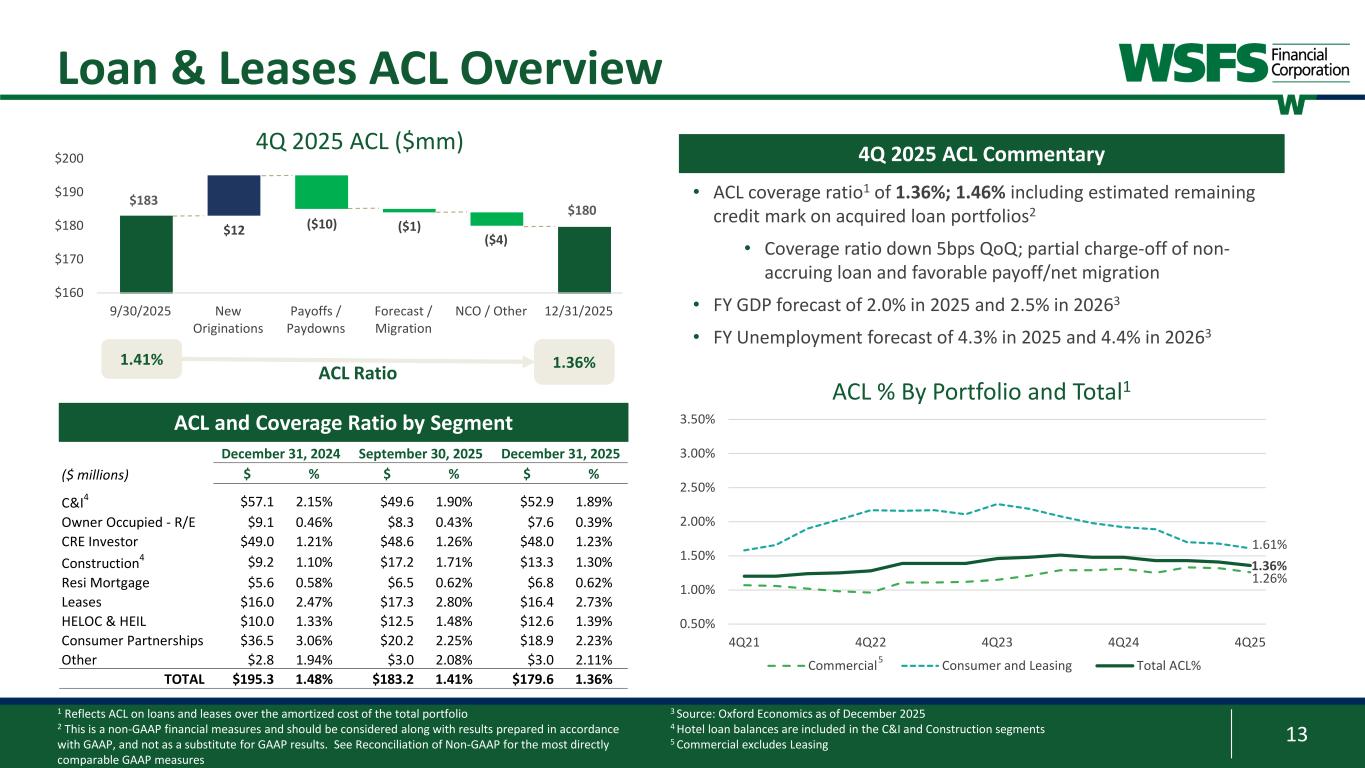
Got it. Thanks for the color. And in terms of credit, problem assets and PAs were down quarter over quarter. NCOs increased a bit. So, given the favorable migration in those problem assets which I believe you cited that at the lowest level in over two years how should we think about how do you how does this impact your expectations around where your NCO could land versus that 35 to 45 basis points guide yeah I so it's yeah so you're the you're absolutely right in terms of our problem assets and And we've had the migration, you know, we were down about 95 million.
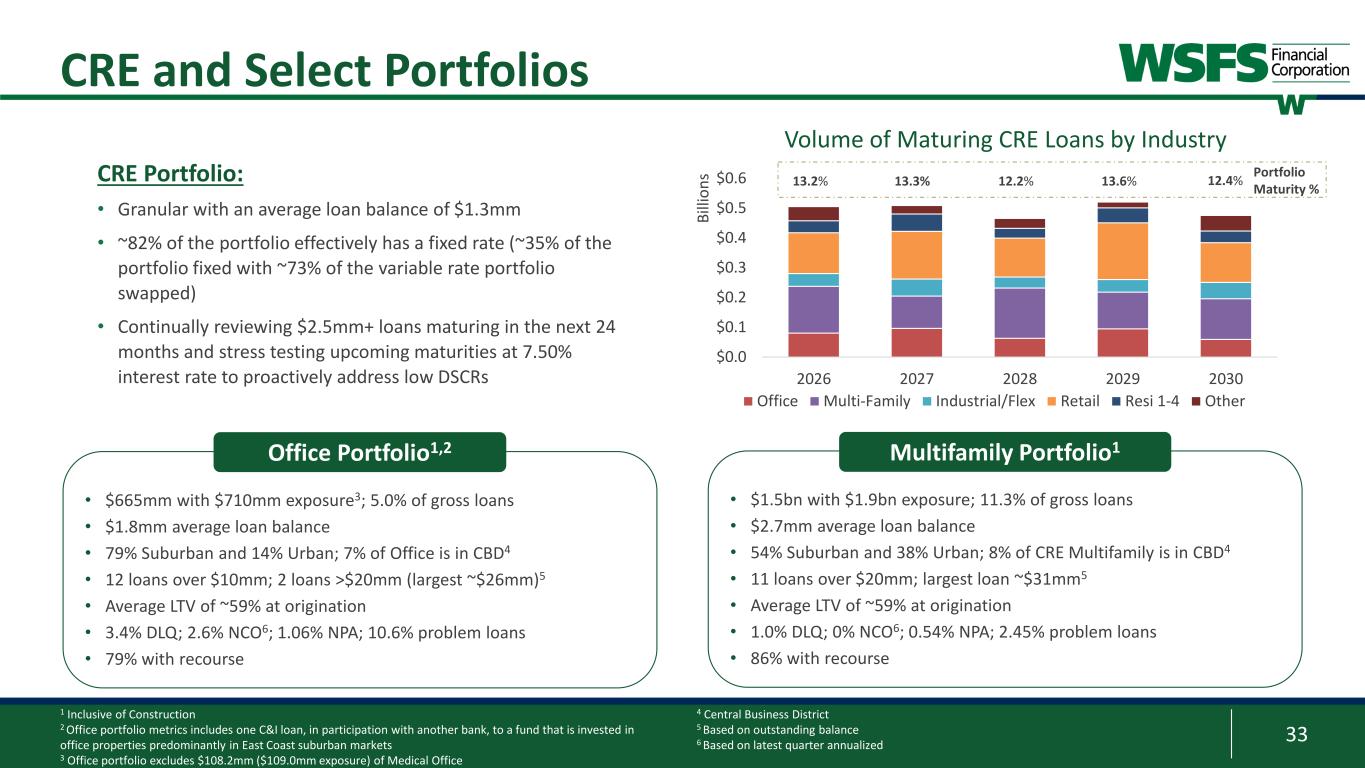
It was a combination of just migration as well as payoffs and paydowns that contributed to that. I would say in terms of our net charge off guide, you know, this year, if you exclude Upstart, we were 40 basis points, and we assume we're going to be in the same position next year. really, you know, commercial is going to continue to be uneven, and that's really kind of the message. So, you may see some fluctuations there. You know, some of the non-performing assets, you know, you may see some of those go to loss. But at the end of the day, I think we continue to feel good about our portfolio. And one of the things that differentiates us in our commercial real estate portfolio is the fact that we have a very high level of recourse. So, you know, we have – in our office portfolio, we have 80% recourse. In our multifamily portfolio, we have 86% recourse. And so those, in addition to the asset collateral, makes us feel better about the – you know, those portfolios, but they will continue to be uneven. And then on the consumer side, you know, with the divestiture of the upstart portfolio, really the majority of it is real estate secured. And so, you know, that portfolio from a net charger perspective has been low and continues to be here very well.
Operator
The question comes from Manuel Navas from Piper Sandler. Please go ahead. Your line is open.
Hey, hopping on to try to clarify something. Is the double-digit EPS growth on core or reported EPS?
It's on – it's core – it's looking at core relative to core, Manuel. Okay, great.
Quick question on the NIM with that guide. Has there been any shifts in your hedging profile and any other kind of wild cards in the NIM outlook?
No, no wild cards. As you know, our NIM, as you see, our NIM outlook is for 380. We finished, the quarter was 383. Our exit rate rate for the quarter in December was also 383, so we are – we're trying to manage the interest rate cuts that are – that we're forecasting or assuming in the outlook for next year. You know, and we do that through three ways, deposit pricing being the main one, but also the hedging program and the securities portfolio. And on the hedging program, we are – to give a quick update there, we have about 1.3 billion of hedges that are currently in the money, and with another rate cut, we would have 1.5 billion of hedges that are in the money. So that's an important tool that we use to mitigate subsequent rate cuts. And then the securities portfolio, as I mentioned earlier, we're reinvesting that now and kind of keeping it flat, and that's providing an uplift because the security portfolio is yielding – the yield in that portfolio is like 2.35, 2.4, and we're reinvesting that at about 4.3, 4.4. So that 200 basis point uplift, which is offsetting some of the interest rate impact. So all of that put together, that's why the impact for next year, you know, is a bit less than what the sensitivity would suggest. But that's, you know, those are the things we continue to manage.
And with that, you described really strong deposit growth with this outlook, And I think you talked a little bit about it in the trust business, but where do you see all that – the growth across all your other businesses? What's kind of the opportunities for deposit growth?
So, yeah, so our – you know, our outlook, our goal is really for continued mid-single digit deposit growth. As you know, in institutional services, we've continued to increase share, and we believe we're going to continue to do that. So that continues to be a growth engine. Roger mentioned the referrals that we're working on within commercial and wealth, and we think there's a huge opportunity for us around that that we haven't tapped yet. So that should power additional deposit growth as well. And again, you know, growing the CNI portfolio is also an important source of deposits for us. So the combination of all those things, I would say as well as, you know, small business, is also an important contributor of deposits that we think that growth is going to accelerate there. So, you know, we do feel good about the mix of businesses and all of them contributing. I appreciate the commentary.
Operator
Thank you. And with no further questions in queue, I would like to turn the conference back over to David Berg.
Thank you, everyone, for joining the call today. If you have any specific follow-up questions, feel free to reach out to Investor Relations or me, and have a great day.
Operator
This concludes today's conference call. Thank you for your participation. You may now disconnect.