AXTA 8-K
Axalta Coating Systems Ltd. (AXTA)
8-K
2022-10-25
For: 2022-10-25
View Original
Added on
April 12, 2026
UNITED STATES
SECURITIES AND EXCHANGE COMMISSION
WASHINGTON, D.C. 20549
FORM 8-K
CURRENT REPORT
PURSUANT TO SECTION 13 OR 15(d) OF THE
SECURITIES EXCHANGE ACT OF 1934
Date of Report (Date of earliest event reported) October 25, 2022
(Exact name of registrant as specified in its charter)
(State or other jurisdiction of incorporation) | (Commission File Number) | (IRS Employer Identification No.) | ||||||
(Address of principal executive offices) (Zip Code)
(855 ) 547-1461
(Registrant’s telephone number, including area code)
Not Applicable
(Former name or former address, if changed since last report.)
Check the appropriate box below if the Form 8-K filing is intended to simultaneously satisfy the filing obligation of the registrant under any of the following provisions (see General Instruction A.2. below):
Securities registered pursuant to Section 12(b) of the Act:
| (Title of class) | (Trading symbol) | (Exchange on which registered) | ||||||||||||
Indicate by check mark whether the registrant is an emerging growth company as defined in Rule 405 of the Securities Act of 1933 (§230.405 of this chapter) or Rule12b-2 of the Securities Exchange Act of 1934 (§240.12b-2 of this chapter).
Emerging growth company ☐
If an emerging growth company, indicate by check mark if the registrant has elected not to use the extended transition period for complying with any new or revised financial accounting standards provided pursuant to Section 13(a) of the Exchange Act. ☐
Item 2.02. Results of Operations and Financial Condition.
On October 25, 2022, Axalta Coating Systems Ltd. (“Axalta”) issued a press release and posted an earnings call presentation to its website reporting its financial results for the third quarter ended September 30, 2022. Copies of the press release and the earnings call presentation are furnished as Exhibit 99.1 and Exhibit 99.2, respectively, to this Current Report on Form 8-K and are incorporated herein by reference. The information furnished with this Item 2.02, including Exhibits 99.1 and 99.2, shall not be deemed “filed” for purposes of Section 18 of the Securities Exchange Act of 1934, as amended, or otherwise subject to the liabilities of that section, nor shall it be deemed incorporated by reference into any other filing under the Securities Act of 1933, as amended, except as expressly set forth by specific reference in such a filing.
Item 9.01. Financial Statements and Exhibits.
(d) Exhibits
| Exhibit No. | Description | |||||||
| 99.1 | ||||||||
| 99.2 | ||||||||
| 104 | Cover Page Interactive Data File (embedded within the Inline XBRL document) | |||||||
SIGNATURES
Pursuant to the requirements of the Securities Exchange Act of 1934, the registrant has duly caused this report to be signed on its behalf by the undersigned hereunto duly authorized.
| AXALTA COATING SYSTEMS LTD. | |||||||||||
| Date: | October 25, 2022 | By: | /s/ Sean M. Lannon | ||||||||
| Sean M. Lannon | |||||||||||
| Senior Vice President and Chief Financial Officer | |||||||||||
| Exhibit 99.1 | |||||||||||
| News Release |  | ||||||||||
Axalta Coating Systems 50 Applied Bank Blvd Suite 300 Glen Mills, PA 19342 USA | Investor Contact Christopher Evans D +1 484 724 4099 | ||||||||||
Immediate Release
Axalta Releases Third Quarter 2022 Results
Earnings solidly within guidance range as strong pricing and a robust volume recovery offset regional headwinds, inflationary pressure and the impacts of weaker global currencies
GLEN MILLS, PA, October 25, 2022 - Axalta Coating Systems Ltd. (NYSE:AXTA) (“Axalta”), a leading global coatings company, announced its financial results for the third quarter ended September 30, 2022.
Third Quarter 2022 Highlights:
•Net sales increased 13.8% year-over-year (20.1% ex FX) led by strong pricing and solid volume growth
•Realized 9.7% price-mix growth with contributions from every end-market; 2.5% sequential price-mix growth reflects continued pricing momentum
•Volume increased 8.8% driven largely by market recovery in both Refinish and Mobility despite impacts of the Russia - Ukraine conflict, China COVID-19 lockdowns, and Industrial EMEA slowing
•Income from operations of $123.5 million versus $124.7 million in Q3 2021; Adjusted EBIT of $148.0 million compared with $146.0 million in Q3 2021
•Diluted EPS of $0.28 versus $0.30 in Q3 2021; Adjusted diluted EPS of $0.39 flat with Q3 2021
Third Quarter 2022 Consolidated Financial Results
Third quarter net sales of $1,238.7 million increased 13.8% year-over-year, including a negative 6.3% foreign currency impact. The strong year-over-year growth was driven by 9.7% higher average price-mix, a 1.6% M&A benefit and 8.8% better volumes. Performance Coatings net sales increased 7.5% year-over-year, driven by constant currency growth of 19.9% in Refinish and 7.1% in Industrial. Mobility Coatings net sales increased 29.5% supported by a recovery in global auto production from the severe supply constraints in the prior-year period.
Income from operations for Q3 2022 totaled $123.5 million versus $124.7 million in Q3 2021. Net income to common shareholders was $62.4 million for the quarter compared with $69.1 million in Q3 2021. Diluted earnings per share was $0.28 compared with $0.30 in Q3 2021. Q3 2022 benefited from robust sales growth, including significant realized pricing gains and volume improvement; however, operating income was negatively impacted by continued variable raw material inflation, and elevated logistics, energy and labor expenses. In addition, foreign currency headwinds, the Russia-Ukraine conflict and COVID-19 lockdowns in China represented a combined ~$16 million headwind to income from operations in the quarter.
Rakesh Sachdev, Axalta’s interim CEO and President, commented, “I am pleased that we were able to report earnings within our stated guidance range despite acute currency and inflationary headwinds plus pockets of softening regional demand. Our resilient third quarter performance can be attributed to the prioritization of price to offset variable cost inflation, as well as continued market recovery in our Refinish and Light Vehicle end-markets. New customer wins across the portfolio supported volume growth and again highlighted our customers’ continued preference for our industry-leading products and services. The third quarter also represented an inflection point in our price-cost trajectory as we more than offset year-over-year variable cost inflation for the first time since the current unprecedented inflationary environment began in mid-2021. Our teams are taking the steps necessary to recapture the value provided by our products and services to our partners, but more is needed for us to return to pre-COVID levels of profitability.”
Mr. Sachdev continued, “Enhancing our profitability is among my highest near-term strategic imperatives. Successful day-to-day execution is fundamental to achieving our long-term goals, which will be realized through driving improved operational performance and productivity. We have a great leadership team ready to tackle these objectives. I believe we can accelerate a return to pre-COVID profitability on our pathway to sustained growth.”
1
Performance Coatings Results
Performance Coatings third quarter net sales were $838.0 million, an increase of 7.5% year-over-year. Constant currency net sales increased 14.4% in the period as both end-markets provided strong contributions to a 11.7% price and product mix benefit. Refinish volume growth offset lower volumes in Industrial, resulting in slightly positive year-over-year segment volumes. Foreign exchange in the third quarter was a 6.9% year-over-year headwind led by the Euro, British Pound and Chinese Renminbi.
Refinish net sales increased 12.5% to $498.7 million (19.9% ex-FX) in Q3 2022, including a 4.3% increase in volume and a 3.9% contribution from M&A, partially offset by a foreign exchange headwind of 7.4%. Refinish volume growth was very strong in the Americas and stable in China and in EMEA year-over-year. The market recovery is steadily progressing with improvement in key metrics such as office occupancy and road congestion. Refinish again drove above-market volume growth with several notable MSO wins in the quarter alongside an increase in points of distribution. Sequentially, volumes declined 4.4% consistent with seasonal factors and in line with prior expectations. Price-mix was 11.7% higher year-over-year, which more than offset the impact of continued variable cost inflation.
Industrial net sales increased 1.1% to $339.3 million (7.1% ex-FX) driven by an 11.7% increase in average price-mix, which was enabled by prioritization of a value-based selling approach of our innovative offerings. Volume declined 4.6% year-over-year with strength in the Americas being offset by significant declines in China and EMEA. Sales in China have been heavily impacted by extended COVID-19 lockdowns and by lower regional export activity. Sequentially, volume declined 7.2% in Q3 driven by worsening EMEA macroeconomic factors with a modest offset from better China activity versus a more lockdown-heavy Q2.
The Performance Coatings segment generated Adjusted EBIT of $121.8 million in the third quarter compared with $122.8 million in Q3 2021, with associated margins of 14.5% and 15.8%, respectively. The contribution from substantial sales growth was offset by the significant increase in raw material, logistics, labor and energy costs, as well as currency translation headwinds versus the prior-year period.
Mobility Coatings Results
Mobility Coatings net sales were $400.7 million in Q3 2022, an increase of 29.5% year-over-year. Constant currency net sales increased 34.6% year-over-year, driven by 29.9% higher volumes and 4.7% better price-mix.
Light Vehicle net sales increased 28.8% to $303.0 million (34.5% ex-FX) year-over-year driven by pricing gains. Light Vehicle volume increased 31.6% year-over-year and exceeded global auto production rates, which increased 27.5% year-over-year to 21 million builds in Q3 2022. New customer wins are driving the market out-performance year-to-date, particularly in China where Q3 2022 Light Vehicle volume increased 72.5% versus 31% local auto production growth. 2.9% year-over-year price-mix realization resulted from a combination of newly negotiated agreements to offset variable cost inflation and the catch-up of raw material linked index pricing in select customer contracts.
Commercial Vehicle net sales increased 31.8% to $97.7 million versus Q3 2021 (35.0% ex-FX), driven by customer wins and a recovery in global commercial vehicle production rates. Commercial Vehicle volume growth of 24.3% exceeded Class 4-8 truck market growth. Vehicle demand in this end-market remained robust in the quarter with September 2022 Class 8 order volume at historical highs.
The Mobility Coatings segment generated Adjusted EBIT of $3.6 million in Q3 2022 compared with an Adjusted EBIT loss of $2.7 million in Q3 2021, driven by better volume and improved pricing partially offset by higher variable and fixed costs.
Balance Sheet and Cash Flow Highlights
Axalta ended the third quarter with cash and cash equivalents of $517.4 million and total liquidity of over $1.0 billion. Our net debt to trailing twelve month ("LTM") Adjusted EBITDA ratio was 4.1x at quarter end versus 4.2x as of June 30, 2022, reflecting moderately higher cash balances and stronger LTM Adjusted EBITDA. Axalta ended the third quarter with an Adjusted EBITDA to interest expense coverage ratio of 5.8x. Our Q4 financial outlook implies that the net leverage ratio should decline below 4-times at year-end.
2
Third quarter total operating cash flow was $79.9 million versus $142.9 million in Q3 2021. Working capital was a larger use of cash in the period versus the prior-year period following inflationary pressures and higher physical inventory levels as of September 30, 2022. Meanwhile, accounts receivable increased reflecting stronger volumes and pricing inputs. Free cash flow totaled $50.5 million compared with $111.7 million in Q3 2021.
Sean Lannon, Axalta's Chief Financial Officer, commented, “Overall demand growth in the third quarter was robust especially within Refinish and Mobility Coatings where we continue to see recovery; yet, slower regional economic activity was evident in select geographies, namely in the EMEA and Chinese Industrial markets. In these areas, sales softened considerably beginning in Q2, and continued through Q3, driven by slower than anticipated post-COVID-19 lockdown recovery in China and EMEA macroeconomic and energy headwinds, which we expect to continue through the fourth quarter. Currently, the slowdown seems to be fairly concentrated within Industrial. We have layered in the broader geographic weakness into our Q4 outlook, which also reflects substantial FX headwinds and minimal change in the sequential quarter-over-quarter cost environment. We believe that the resiliency of our Refinish end-market, deferred demand in both Commercial Vehicle and Light Vehicle and company-wide pricing momentum are natural hedges if macros step lower.”
Q4 2022 Financial Guidance
•Net Sales: ~6%-8%, including ~(7%) foreign currency impact; Anticipate mid single-digit volume and nearly double-digit price-mix growth
•Adjusted EBIT: $120-145 million, correlating to Adjusted EBITDA of $185-210 million
•Adjusted Diluted EPS: $0.31-0.39; including a $0.04 year-over-year headwind from foreign currency and the Russia-Ukraine conflict
•Interest Expense: ~$37 million
•Diluted Shares: ~221 million
•Adjusted Tax Rate: ~22%-23%
•D&A: ~$75 million; including $23 million step-up D&A
•Expect raw material inflation in the high-teens versus Q4 2021 and flat-to-down modestly vs. Q3 2022
•Fourth quarter Free Cash Flow of $175-$225 million including ~$50 million of Capex
Conference Call Information
As previously announced, Axalta will hold a conference call to discuss its third quarter 2022 financial results on October 26, 2022 at 8:00 a.m. ET. A live webcast of the conference call will be available online at www.axalta.com/investorcall. A replay of the webcast will be posted shortly after the call and will remain accessible through October 26, 2023. The dial-in phone number for the conference call is +1-201-689-8560. For those unable to participate, a replay will be available through November 2, 2022. The replay dial-in number is +1-412-317-6671. The replay passcode is 13733068.
3
Cautionary Statement Concerning Forward-Looking Statements
This release may contain certain forward-looking statements within the meaning of the U.S. Private Securities Litigation Reform Act of 1995 regarding Axalta and its subsidiaries including our outlook and/or guidance, which includes net sales growth, currency effects, acquisition or divestment impacts, Adjusted EBIT, Adjusted diluted EPS, interest expense, income tax rate, as adjusted, free cash flow, capital expenditures, depreciation and amortization, diluted shares outstanding, and raw material inflation, the effects of COVID-19 on Axalta’s business and financial results, our and our customers’ supply chain constraints and our ability to offset the impacts of such constraints, the timing and amount of any future share repurchases, contributions from our prior acquisitions and our ability to successfully make future acquisitions. Axalta has identified some of these forward-looking statements with words such as “anticipated,” “assumptions,” “believe,” “expect,” “estimate,” “likely,” “outlook,” “project,” “will,” “guidance,” “could,” “see,” “should,” “goals,” “can”, and “potential” and the negative of these words or other comparable or similar terminology. All of these statements are based on management’s expectations as well as estimates and assumptions prepared by management that, although they believe to be reasonable, are inherently uncertain. These statements involve risks and uncertainties, including, but not limited to, economic, competitive, governmental, geopolitical and technological factors outside of Axalta’s control, including the effects of COVID-19, that may cause its business, industry, strategy, financing activities or actual results to differ materially. The impact and duration of COVID-19 on our business and operations is uncertain. Factors that will influence the impact on our business and operations include the duration and extent of COVID-19, the extent of imposed or recommended containment and mitigation measures, and the general economic consequences of COVID-19. More information on potential factors that could affect Axalta’s financial results is available in “Forward-Looking Statements,” “Risk Factors” and “Management’s Discussion and Analysis of Financial Condition and Results of Operations” within Axalta’s most recent Annual Report on Form 10-K, and in other documents that we have filed with, or furnished to, the U.S. Securities and Exchange Commission. Axalta undertakes no obligation to update or revise any of the forward-looking statements contained herein, whether as a result of new information, future events or otherwise.
4
Non-GAAP Financial Measures
The historical financial information included in this presentation includes financial information that is not presented in accordance with generally accepted accounting principles in the United States (“GAAP”), including constant currency net sales growth, income tax rate, as adjusted, EBIT, Adjusted EBIT, EBITDA, Adjusted EBITDA, Adjusted diluted EPS, free cash flow, net debt, Adjusted net income, Adjusted EBITDA to interest expense coverage ratio, net debt to Adjusted EBITDA ratio and Adjusted EBIT margin. Management uses these non-GAAP financial measures in the analysis of our financial and operating performance because they assist in the evaluation of underlying trends in our business. Adjusted EBITDA, Adjusted EBIT and Adjusted diluted EPS consist of EBITDA, EBIT and Diluted EPS, respectively, adjusted for (i) certain non-cash items included within net income, (ii) certain items Axalta does not believe are indicative of ongoing operating performance or (iii) certain nonrecurring, unusual or infrequent items that have not occurred within the last two years or we believe are not reasonably likely to recur within the next two years. We believe that making such adjustments provides investors meaningful information to understand our operating results and ability to analyze financial and business trends on a period-to-period basis. Adjusted net income shows the adjusted value of net income (loss) attributable to controlling interests after removing the items that are determined by management to be items that we do not consider indicative of our ongoing operating performance or unusual or nonrecurring in nature. Our use of the terms constant currency net sales growth, income tax rate, as adjusted, EBIT, Adjusted EBIT, EBITDA, Adjusted EBITDA, Adjusted diluted EPS, free cash flow, net debt, Adjusted net income, Adjusted EBITDA to interest expense coverage ratio, net debt to Adjusted EBITDA ratio and Adjusted EBIT margin may differ from that of others in our industry. Constant currency net sales growth, income tax rate, as adjusted, EBIT, Adjusted EBIT, EBITDA, Adjusted EBITDA, Adjusted diluted EPS, free cash flow, net debt, Adjusted net income, Adjusted EBITDA to interest expense coverage ratio, net debt to Adjusted EBITDA ratio and Adjusted EBIT margin should not be considered as alternatives to net sales, net income (loss), income (loss) before operations or any other performance measures derived in accordance with GAAP as measures of operating performance or operating cash flows or as measures of liquidity. Constant currency net sales growth, income tax rate, as adjusted, EBIT, Adjusted EBIT, EBITDA, Adjusted EBITDA, Adjusted diluted EPS, free cash flow, net debt, Adjusted net income, Adjusted EBITDA to interest expense coverage ratio, net debt to Adjusted EBITDA ratio and Adjusted EBIT margin have important limitations as analytical tools and should be considered in conjunction with, and not as substitutes for, our results as reported under GAAP. This release includes a reconciliation of certain non-GAAP financial measures with the most directly comparable financial measures calculated in accordance with GAAP. Axalta does not provide a reconciliation for non-GAAP estimates for constant currency net sales growth, Adjusted EBIT, Adjusted EBITDA, Adjusted diluted EPS, income tax rate, as adjusted, or free cash flow on a forward-looking basis because the information necessary to calculate a meaningful or accurate estimation of reconciling items is not available without unreasonable effort. For example, such reconciling items include the impact of foreign currency exchange gains or losses, gains or losses that are unusual or nonrecurring in nature, as well as discrete taxable events. We cannot estimate or project these items and they may have a substantial and unpredictable impact on our US GAAP results.
Constant Currency
Constant currency or ex-FX percentages are calculated by excluding the impact of the change in average exchange rates between the current and comparable period by currency denomination exposure of the comparable period amount.
Organic Growth
Organic growth or ex-M&A percentages are calculated by excluding the impact of recent acquisitions and divestitures.
Segment Financial Measures
The primary measure of segment operating performance is Adjusted EBIT, which is a key metric that is used by management to evaluate business performance in comparison to budgets, forecasts and prior year financial results, providing a measure that management believes reflects Axalta’s core operating performance. As we do not measure segment operating performance based on net income, a reconciliation of this non-GAAP financial measure with the most directly comparable financial measure calculated in accordance with GAAP is not available.
5
About Axalta Coating Systems
Axalta is a global leader in the coatings industry, providing customers with innovative, colorful, beautiful and sustainable coatings solutions. From light vehicles, commercial vehicles and refinish applications to electric motors, building facades and other industrial applications, our coatings are designed to prevent corrosion, increase productivity and enhance durability. With more than 150 years of experience in the coatings industry, the global team at Axalta continues to find ways to serve our more than 100,000 customers in over 140 countries better every day with the finest coatings, application systems and technology. For more information visit axalta.com and follow us @axalta on Twitter.
6
| Financial Statement Tables | ||||||||||||||||||||||||||
| AXALTA COATING SYSTEMS LTD. | ||||||||||||||||||||||||||
| Condensed Consolidated Statements of Operations (Unaudited) | ||||||||||||||||||||||||||
| (In millions, except per share data) | ||||||||||||||||||||||||||
| Three Months Ended September 30, | Nine Months Ended September 30, | |||||||||||||||||||||||||
| 2022 | 2021 | 2022 | 2021 | |||||||||||||||||||||||
| Net sales | $ | 1,238.7 | $ | 1,088.6 | $ | 3,647.7 | $ | 3,279.0 | ||||||||||||||||||
| Cost of goods sold | 876.6 | 745.3 | 2,600.4 | 2,182.6 | ||||||||||||||||||||||
| Selling, general and administrative expenses | 186.4 | 181.0 | 571.6 | 544.3 | ||||||||||||||||||||||
| Other operating charges (benefits) | 5.3 | (7.6) | 17.8 | 49.5 | ||||||||||||||||||||||
| Research and development expenses | 16.5 | 15.4 | 49.6 | 46.8 | ||||||||||||||||||||||
| Amortization of acquired intangibles | 30.4 | 29.8 | 94.9 | 88.1 | ||||||||||||||||||||||
| Income from operations | 123.5 | 124.7 | 313.4 | 367.7 | ||||||||||||||||||||||
| Interest expense, net | 35.0 | 33.8 | 101.1 | 100.7 | ||||||||||||||||||||||
| Other expense (income), net | 3.4 | (2.4) | 12.4 | (10.9) | ||||||||||||||||||||||
| Income before income taxes | 85.1 | 93.3 | 199.9 | 277.9 | ||||||||||||||||||||||
| Provision for income taxes | 21.8 | 24.4 | 51.6 | 66.9 | ||||||||||||||||||||||
| Net income | 63.3 | 68.9 | 148.3 | 211.0 | ||||||||||||||||||||||
| Less: Net income (loss) attributable to noncontrolling interests | 0.9 | (0.2) | 0.3 | 0.3 | ||||||||||||||||||||||
| Net income attributable to controlling interests | $ | 62.4 | $ | 69.1 | $ | 148.0 | $ | 210.7 | ||||||||||||||||||
| Basic net income per share | $ | 0.28 | $ | 0.30 | $ | 0.67 | $ | 0.91 | ||||||||||||||||||
| Diluted net income per share | $ | 0.28 | $ | 0.30 | $ | 0.66 | $ | 0.90 | ||||||||||||||||||
| Basic weighted average shares outstanding | 220.6 | 229.9 | 222.0 | 232.1 | ||||||||||||||||||||||
| Diluted weighted average shares outstanding | 221.2 | 230.7 | 222.6 | 233.0 | ||||||||||||||||||||||
7
| AXALTA COATING SYSTEMS LTD. | ||||||||||||||
| Condensed Consolidated Balance Sheets (Unaudited) | ||||||||||||||
| (In millions, except per share data) | ||||||||||||||
| September 30, 2022 | December 31, 2021 | |||||||||||||
| Assets | ||||||||||||||
| Current assets: | ||||||||||||||
| Cash and cash equivalents | $ | 517.4 | $ | 840.6 | ||||||||||
| Restricted cash | 9.3 | 10.6 | ||||||||||||
| Accounts and notes receivable, net | 1,106.9 | 937.5 | ||||||||||||
| Inventories | 829.4 | 669.7 | ||||||||||||
| Prepaid expenses and other current assets | 205.4 | 117.2 | ||||||||||||
| Total current assets | 2,668.4 | 2,575.6 | ||||||||||||
| Property, plant and equipment, net | 1,121.5 | 1,186.2 | ||||||||||||
| Goodwill | 1,390.4 | 1,592.7 | ||||||||||||
| Identifiable intangibles, net | 1,093.5 | 1,278.2 | ||||||||||||
| Other assets | 545.2 | 584.5 | ||||||||||||
| Total assets | $ | 6,819.0 | $ | 7,217.2 | ||||||||||
| Liabilities, Shareholders’ Equity | ||||||||||||||
| Current liabilities: | ||||||||||||||
| Accounts payable | $ | 746.6 | $ | 657.4 | ||||||||||
| Current portion of borrowings | 66.7 | 79.7 | ||||||||||||
| Other accrued liabilities | 536.4 | 597.8 | ||||||||||||
| Total current liabilities | 1,349.7 | 1,334.9 | ||||||||||||
| Long-term borrowings | 3,663.3 | 3,749.9 | ||||||||||||
| Accrued pensions | 227.3 | 269.3 | ||||||||||||
| Deferred income taxes | 139.5 | 174.7 | ||||||||||||
| Other liabilities | 119.8 | 149.7 | ||||||||||||
| Total liabilities | 5,499.6 | 5,678.5 | ||||||||||||
| Shareholders’ equity: | ||||||||||||||
| Common shares, $1.00 par, 1,000.0 shares authorized, 252.4 and 251.8 shares issued at September 30, 2022 and December 31, 2021, respectively | 252.4 | 251.8 | ||||||||||||
| Capital in excess of par | 1,526.9 | 1,515.5 | ||||||||||||
| Retained earnings | 975.2 | 827.2 | ||||||||||||
| Treasury shares, at cost, 31.8 and 24.4 shares at September 30, 2022 and December 31, 2021, respectively | (887.3) | (687.2) | ||||||||||||
| Accumulated other comprehensive loss | (593.9) | (414.4) | ||||||||||||
| Total Axalta shareholders’ equity | 1,273.3 | 1,492.9 | ||||||||||||
| Noncontrolling interests | 46.1 | 45.8 | ||||||||||||
| Total shareholders’ equity | 1,319.4 | 1,538.7 | ||||||||||||
| Total liabilities and shareholders’ equity | $ | 6,819.0 | $ | 7,217.2 | ||||||||||
8
| AXALTA COATING SYSTEMS LTD. | ||||||||||||||
| Condensed Consolidated Statements of Cash Flows (Unaudited) | ||||||||||||||
| (In millions) | ||||||||||||||
| Nine Months Ended September 30, | ||||||||||||||
| 2022 | 2021 | |||||||||||||
| Operating activities: | ||||||||||||||
| Net income | $ | 148.3 | $ | 211.0 | ||||||||||
| Adjustment to reconcile net income to cash provided by operating activities: | ||||||||||||||
| Depreciation and amortization | 229.5 | 234.7 | ||||||||||||
| Amortization of deferred financing costs and original issue discount | 7.2 | 6.7 | ||||||||||||
| Deferred income taxes | 2.8 | 9.3 | ||||||||||||
| Realized and unrealized foreign exchange losses, net | 5.5 | 9.5 | ||||||||||||
| Stock-based compensation | 14.0 | 11.7 | ||||||||||||
| Gain on sale of facility | — | (8.9) | ||||||||||||
| Interest income on swaps designated as net investment hedges | (16.1) | (14.3) | ||||||||||||
| Commercial agreement restructuring charge | 25.0 | — | ||||||||||||
| Other non-cash, net | (1.5) | 11.3 | ||||||||||||
| Changes in operating assets and liabilities: | ||||||||||||||
| Trade accounts and notes receivable | (242.4) | (168.5) | ||||||||||||
| Inventories | (220.8) | (107.8) | ||||||||||||
| Prepaid expenses and other assets | (78.9) | (64.3) | ||||||||||||
| Accounts payable | 189.7 | 88.3 | ||||||||||||
| Other accrued liabilities | (2.5) | 61.3 | ||||||||||||
| Other liabilities | (11.6) | 10.0 | ||||||||||||
| Cash provided by operating activities | 48.2 | 290.0 | ||||||||||||
| Investing activities: | ||||||||||||||
| Acquisitions, net of cash acquired | — | (647.3) | ||||||||||||
| Purchase of property, plant and equipment | (107.5) | (98.7) | ||||||||||||
| Interest proceeds on swaps designated as net investment hedges | 16.1 | 14.3 | ||||||||||||
| Settlement proceeds on swaps designated as net investment hedges | 25.0 | — | ||||||||||||
| Other investing activities, net | (1.5) | 11.8 | ||||||||||||
| Cash used for investing activities | (67.9) | (719.9) | ||||||||||||
| Financing activities: | ||||||||||||||
| Payments on short-term borrowings | (52.3) | (54.5) | ||||||||||||
| Payments on long-term borrowings | (20.5) | (20.1) | ||||||||||||
| Financing-related costs | (0.1) | (2.6) | ||||||||||||
| Purchases of common stock | (200.1) | (213.8) | ||||||||||||
| Net cash flows associated with stock-based awards | (1.7) | 12.7 | ||||||||||||
| Other financing activities, net | (0.2) | (1.2) | ||||||||||||
| Cash used for financing activities | (274.9) | (279.5) | ||||||||||||
| Decrease in cash | (294.6) | (709.4) | ||||||||||||
| Effect of exchange rate changes on cash | (29.9) | (16.5) | ||||||||||||
| Cash at beginning of period | 851.2 | 1,364.0 | ||||||||||||
| Cash at end of period | $ | 526.7 | $ | 638.1 | ||||||||||
| Cash at end of period reconciliation: | ||||||||||||||
| Cash and cash equivalents | $ | 517.4 | $ | 627.7 | ||||||||||
| Restricted cash | 9.3 | 10.4 | ||||||||||||
| Cash at end of period | $ | 526.7 | $ | 638.1 | ||||||||||
9
The following table reconciles income from operations to adjusted EBIT and segment adjusted EBIT for the periods presented (in millions):
| Three Months Ended September 30, | Nine Months Ended September 30, | |||||||||||||||||||||||||
| 2022 | 2021 | 2022 | 2021 | |||||||||||||||||||||||
| Income from operations | $ | 123.5 | $ | 124.7 | $ | 313.4 | $ | 367.7 | ||||||||||||||||||
| Other expense (income), net | 3.4 | (2.4) | 12.4 | (10.9) | ||||||||||||||||||||||
| Total | 120.1 | 127.1 | 301.0 | 378.6 | ||||||||||||||||||||||
Termination benefits and other employee related costs (a) | 5.0 | 9.6 | 10.1 | 35.1 | ||||||||||||||||||||||
Strategic review and retention costs (b) | — | 2.1 | — | 9.7 | ||||||||||||||||||||||
Acquisition and divestiture-related costs (c) | 0.2 | 9.2 | 2.8 | 10.8 | ||||||||||||||||||||||
Accelerated depreciation and site closure costs (d) | 1.1 | 0.6 | 4.2 | 1.8 | ||||||||||||||||||||||
Operational matter (e) | (0.1) | (18.7) | 0.1 | 3.9 | ||||||||||||||||||||||
Brazil indirect tax (f) | — | — | — | (8.3) | ||||||||||||||||||||||
Gain on sale of facility (g) | — | (8.9) | — | (8.9) | ||||||||||||||||||||||
Russia sanction-related impacts (h) | (1.3) | — | 4.8 | — | ||||||||||||||||||||||
Commercial agreement restructuring impacts (i) | — | — | 25.0 | — | ||||||||||||||||||||||
Other adjustments (j) | 0.4 | (0.9) | — | (0.8) | ||||||||||||||||||||||
Step-up depreciation and amortization (k) | 22.6 | 25.9 | 70.1 | 80.3 | ||||||||||||||||||||||
| Adjusted EBIT | $ | 148.0 | $ | 146.0 | $ | 418.1 | $ | 502.2 | ||||||||||||||||||
| Segment Adjusted EBIT: | ||||||||||||||||||||||||||
| Performance Coatings | $ | 121.8 | $ | 122.8 | $ | 341.6 | $ | 379.7 | ||||||||||||||||||
| Mobility Coatings | 3.6 | (2.7) | 6.4 | 42.2 | ||||||||||||||||||||||
| Total | 125.4 | 120.1 | 348.0 | 421.9 | ||||||||||||||||||||||
Step-up depreciation and amortization (k) | 22.6 | 25.9 | 70.1 | 80.3 | ||||||||||||||||||||||
| Adjusted EBIT | $ | 148.0 | $ | 146.0 | $ | 418.1 | $ | 502.2 | ||||||||||||||||||
| (a) | Represents expenses and associated changes to estimates related to employee termination benefits and other employee-related costs, which includes costs related to the transition of our CEO. Employee termination benefits are primarily associated with Axalta Way initiatives. These amounts are not considered indicative of our ongoing operating performance. | ||||
| (b) | Represents costs for legal, tax and other advisory fees pertaining to our review of strategic alternatives that was concluded in March 2020, as well as retention awards for certain employees that were earned over a period of 18-24 months, which ended in September 2021. These amounts are not considered indicative of our ongoing performance. | ||||
| (c) | Represents acquisition and divestiture-related expenses and integration activities associated with our business combinations, all of which are not considered indicative of our ongoing operating performance. The amount for the nine months ended September 30, 2022 includes $1.9 million of due diligence and other related costs associated with unconsummated merger and acquisition transactions. | ||||
| (d) | Represents incremental depreciation expense resulting from truncated useful lives of the assets impacted by our manufacturing footprint assessments and costs related to the closure of certain manufacturing sites, which we do not consider indicative of our ongoing operating performance. | ||||
| (e) | Represents expenses, changes in estimates and insurance recoveries for probable liabilities related to an operational matter in the Mobility Coatings segment, which we do not consider indicative of our ongoing operating performance. | ||||
| (f) | Represents non-recurring income related to a law change with respect to certain Brazilian indirect taxes which was recorded within other expense (income), net. | ||||
| (g) | Represents non-recurring income related to the sale of a previously closed manufacturing facility. | ||||
| (h) | Represents (benefits) expenses related to sanctions imposed on Russia in response to the conflict with Ukraine as a result of incremental reserves for accounts receivable, inventory obsolescence and business incentive payments, which we do not consider indicative of our ongoing operating performance. The benefits recorded during the three months ended September 30, 2022 are related to changes in estimated inventory obsolescence. | ||||
| (i) | Represents a forgiveness of a portion of up-front customer incentives with repayment features upon our customer completing a recapitalization and restructuring of its indebtedness and the execution of a new long-term exclusive sales agreement with us. These amounts are not considered to be indicative of our ongoing operating performance. | ||||
| (j) | Represents costs for certain non-operational or non-cash losses and (gains), unrelated to our core business and which we do not consider indicative of ongoing operations. | ||||
| (k) | Represents the incremental step-up depreciation and amortization expense associated with the acquisition of DuPont Performance Coatings by Axalta. We believe this will assist investors in performing meaningful comparisons of past, present and future operating results and better highlight the results of our ongoing operating performance. | ||||
10
The following table reconciles net income to adjusted net income for the periods presented (in millions, except per share data):
| Three Months Ended September 30, | Nine Months Ended September 30, | |||||||||||||||||||||||||
| 2022 | 2021 | 2022 | 2021 | |||||||||||||||||||||||
| Net income | $ | 63.3 | $ | 68.9 | $ | 148.3 | $ | 211.0 | ||||||||||||||||||
| Less: Net income (loss) attributable to noncontrolling interests | 0.9 | (0.2) | 0.3 | 0.3 | ||||||||||||||||||||||
| Net income attributable to controlling interests | 62.4 | 69.1 | 148.0 | 210.7 | ||||||||||||||||||||||
Termination benefits and other employee related costs (a) | 4.8 | 9.6 | 9.9 | 35.1 | ||||||||||||||||||||||
Strategic review and retention costs (b) | — | 2.1 | — | 9.7 | ||||||||||||||||||||||
Acquisition and divestiture-related costs (c) | 0.2 | 9.2 | 2.8 | 10.8 | ||||||||||||||||||||||
Accelerated depreciation and site closure costs (d) | 1.1 | 0.6 | 4.2 | 1.8 | ||||||||||||||||||||||
Operational matter (e) | (0.1) | (18.7) | 0.1 | 3.9 | ||||||||||||||||||||||
Brazil indirect tax (f) | — | — | — | (8.3) | ||||||||||||||||||||||
Gain on sale of facility (g) | — | (8.9) | — | (8.9) | ||||||||||||||||||||||
Russia sanction-related impacts (h) | (0.5) | — | 4.7 | — | ||||||||||||||||||||||
Commercial agreement restructuring impacts (i) | — | — | 25.0 | — | ||||||||||||||||||||||
Other adjustments (j) | 0.4 | (0.9) | — | (0.8) | ||||||||||||||||||||||
Step-up depreciation and amortization (k) | 22.6 | 25.9 | 70.1 | 80.3 | ||||||||||||||||||||||
| Total adjustments | 28.5 | 18.9 | 116.8 | 123.6 | ||||||||||||||||||||||
Income tax provision impacts (l) | 4.9 | (1.3) | 19.4 | 15.5 | ||||||||||||||||||||||
| Adjusted net income | $ | 86.0 | $ | 89.3 | $ | 245.4 | $ | 318.8 | ||||||||||||||||||
| Diluted adjusted net income per share | $ | 0.39 | $ | 0.39 | $ | 1.10 | $ | 1.37 | ||||||||||||||||||
| Diluted weighted average shares outstanding | 221.2 | 230.7 | 222.6 | 233.0 | ||||||||||||||||||||||
| (a) | Represents expenses and associated changes to estimates related to employee termination benefits and other employee-related costs, which includes costs related to the transition of our CEO. Employee termination benefits are primarily associated with Axalta Way initiatives. These amounts are not considered indicative of our ongoing operating performance. | ||||
| (b) | Represents costs for legal, tax and other advisory fees pertaining to our review of strategic alternatives that was concluded in March 2020, as well as retention awards for certain employees that were earned over a period of 18-24 months, which ended in September 2021. These amounts are not considered indicative of our ongoing performance. | ||||
| (c) | Represents acquisition and divestiture-related expenses and integration activities associated with our business combinations, all of which are not considered indicative of our ongoing operating performance. The amount for the nine months ended September 30, 2022 includes $1.9 million of due diligence and other related costs associated with unconsummated merger and acquisition transactions. | ||||
| (d) | Represents incremental depreciation expense resulting from truncated useful lives of the assets impacted by our manufacturing footprint assessments and costs related to the closure of certain manufacturing sites, which we do not consider indicative of our ongoing operating performance. | ||||
| (e) | Represents expenses, changes in estimates and insurance recoveries for probable liabilities related to an operational matter in the Mobility Coatings segment, which we do not consider indicative of our ongoing operating performance. | ||||
| (f) | Represents non-recurring income related to a law change with respect to certain Brazilian indirect taxes which was recorded within other expense (income), net. | ||||
| (g) | Represents non-recurring income related to the sale of a previously closed manufacturing facility. | ||||
| (h) | Represents (benefits) expenses related to sanctions imposed on Russia in response to the conflict with Ukraine as a result of incremental reserves for accounts receivable, inventory obsolescence and business incentive payments, which we do not consider indicative of our ongoing operating performance. The benefits recorded during the three months ended September 30, 2022 are related to changes in estimated inventory obsolescence. | ||||
| (i) | Represents a forgiveness of a portion of up-front customer incentives with repayment features upon our customer completing a recapitalization and restructuring of its indebtedness and the execution of a new long-term exclusive sales agreement with us. These amounts are not considered to be indicative of our ongoing operating performance. | ||||
| (j) | Represents costs for certain non-operational or non-cash losses and (gains), unrelated to our core business and which we do not consider indicative of ongoing operations. | ||||
| (k) | Represents the incremental step-up depreciation and amortization expense associated with the acquisition of DuPont Performance Coatings by Axalta. We believe this will assist investors in performing meaningful comparisons of past, present and future operating results and better highlight the results of our ongoing operating performance. | ||||
| (l) | The income tax impacts are determined using the applicable rates in the taxing jurisdictions in which expense or income occurred and includes both current and deferred income tax expense (benefit) based on the nature of the non-GAAP performance measure. Additionally, the income tax impact includes the removal of discrete income tax impacts within our effective tax rate which were expenses of $2.0 million, $7.0 million, $3.1 million and $6.9 million for the three and nine months ended September 30, 2022 and 2021, respectively. The tax adjustments for the three and nine months ended September 30, 2022 and 2021 include the deferred tax benefit ratably amortized into our adjusted income tax rate as the tax attribute related to a January 1, 2020 intra-entity transfer of certain intellectual property rights is realized. | ||||
11
The following table reconciles cash (used for) provided by operating activities to free cash flow for the periods presented (in millions):
| Three Months Ended March 31, | Three Months Ended June 30, | Three Months Ended September 30, | Nine Months Ended September 30, | |||||||||||||||||||||||||||||||||||||||||||||||
| 2022 | 2021 | 2022 | 2021 | 2022 | 2021 | 2022 | 2021 | |||||||||||||||||||||||||||||||||||||||||||
| Cash (used for) provided by operating activities | $ | (43.9) | $ | 39.6 | $ | 12.2 | $ | 107.5 | $ | 79.9 | $ | 142.9 | $ | 48.2 | 290.0 | |||||||||||||||||||||||||||||||||||
| Purchase of property, plant and equipment | (42.5) | (31.8) | (29.5) | (28.5) | (35.5) | (38.4) | (107.5) | (98.7) | ||||||||||||||||||||||||||||||||||||||||||
| Interest proceeds on swaps designated as net investment hedges | 6.2 | 3.5 | 3.8 | 3.6 | 6.1 | 7.2 | 16.1 | 14.3 | ||||||||||||||||||||||||||||||||||||||||||
| Free cash flow | $ | (80.2) | $ | 11.3 | $ | (13.5) | $ | 82.6 | $ | 50.5 | $ | 111.7 | $ | (43.2) | $ | 205.6 | ||||||||||||||||||||||||||||||||||
12
The following table reconciles net income to EBITDA and adjusted EBITDA for the periods presented (in millions):
| Three Months Ended September 30, | Twelve Months Ended September 30, 2022 | Nine Months Ended September 30, | Year Ended December 31, 2021 | |||||||||||||||||||||||||||||||||||
| 2022 | 2021 | 2022 | 2021 | |||||||||||||||||||||||||||||||||||
| Net income | $ | 63.3 | $ | 68.9 | $ | 201.7 | $ | 148.3 | $ | 211.0 | $ | 264.4 | ||||||||||||||||||||||||||
| Interest expense, net | 35.0 | 33.8 | 134.6 | 101.1 | 100.7 | 134.2 | ||||||||||||||||||||||||||||||||
| Provision for income taxes | 21.8 | 24.4 | 60.8 | 51.6 | 66.9 | 76.1 | ||||||||||||||||||||||||||||||||
Depreciation and amortization | 74.5 | 79.3 | 311.3 | 229.5 | 234.7 | 316.5 | ||||||||||||||||||||||||||||||||
EBITDA | 194.6 | 206.4 | 708.4 | 530.5 | 613.3 | 791.2 | ||||||||||||||||||||||||||||||||
Termination benefits and other employee related costs (a) | 5.0 | 9.6 | 11.4 | 9.6 | 35.1 | 36.9 | ||||||||||||||||||||||||||||||||
Strategic review and retention costs (b) | — | 2.1 | — | — | 9.7 | 9.7 | ||||||||||||||||||||||||||||||||
Acquisition and divestiture-related costs (c) | 0.2 | 9.2 | 8.3 | 2.8 | 10.8 | 16.3 | ||||||||||||||||||||||||||||||||
Site closure costs (d) | 0.4 | — | 2.7 | 2.1 | — | 0.6 | ||||||||||||||||||||||||||||||||
Foreign exchange remeasurement losses (gains) (e) | 5.8 | (1.3) | 13.3 | 13.3 | 2.3 | 2.3 | ||||||||||||||||||||||||||||||||
Long-term employee benefit plan adjustments (f) | 0.2 | (0.3) | 0.5 | 0.4 | (0.8) | (0.7) | ||||||||||||||||||||||||||||||||
Stock-based compensation (g) | 5.0 | 3.9 | 17.2 | 14.0 | 11.7 | 14.9 | ||||||||||||||||||||||||||||||||
Dividends in respect of noncontrolling interest (h) | — | — | (0.1) | (0.1) | (0.7) | (0.7) | ||||||||||||||||||||||||||||||||
Operational matter (i) | (0.1) | (18.7) | 0.6 | 0.1 | 3.9 | 4.4 | ||||||||||||||||||||||||||||||||
Brazil indirect tax (j) | — | — | — | — | (8.3) | (8.3) | ||||||||||||||||||||||||||||||||
Gain on sale of facility (k) | — | (8.9) | (10.8) | — | (8.9) | (19.7) | ||||||||||||||||||||||||||||||||
Russia sanction-related impacts (l) | (1.3) | — | 4.8 | 4.8 | — | — | ||||||||||||||||||||||||||||||||
Commercial agreement restructuring impacts (m) | — | — | 25.0 | 25.0 | — | — | ||||||||||||||||||||||||||||||||
Other adjustments (n) | 0.5 | (1.0) | 1.7 | 0.1 | (0.7) | 0.9 | ||||||||||||||||||||||||||||||||
Adjusted EBITDA | $ | 210.3 | $ | 201.0 | $ | 783.0 | $ | 602.6 | $ | 667.4 | $ | 847.8 | ||||||||||||||||||||||||||
Adjusted EBITDA to interest expense coverage ratio | 5.8 | x | ||||||||||||||||||||||||||||||||||||
| (a) | Represents expenses and associated changes to estimates related to employee termination benefits and other employee-related costs, which includes costs related to the transition of our CEO. Employee termination benefits are primarily associated with Axalta Way initiatives. These amounts are not considered indicative of our ongoing operating performance. | ||||
| (b) | Represents costs for legal, tax and other advisory fees pertaining to our review of strategic alternatives that was concluded in March 2020, as well as retention awards for certain employees that were earned over a period of 18-24 months, which ended in September 2021. These amounts are not considered indicative of our ongoing performance. | ||||
| (c) | Represents acquisition and divestiture-related expenses and integration activities associated with our business combinations, all of which are not considered indicative of our ongoing operating performance. The amount for the nine months ended September 30, 2022 includes $1.9 million of due diligence and other related costs associated with unconsummated merger and acquisition transactions. | ||||
| (d) | Represents costs related to the closure of certain manufacturing sites, which we do not consider indicative of our ongoing operating performance. | ||||
| (e) | Eliminates foreign exchange losses resulting from the remeasurement of assets and liabilities denominated in foreign currencies, net of the impacts of our foreign currency instruments used to hedge our balance sheet exposures. | ||||
| (f) | Eliminates the non-cash, non-service cost components of long-term employee benefit costs. | ||||
| (g) | Represents non-cash impacts associated with stock-based compensation. | ||||
| (h) | Represents the payment of dividends to our joint venture partners by our consolidated entities that are not 100% owned, which are reflected to show the cash operating performance of these entities on Axalta’s financial statements. | ||||
| (i) | Represents expenses, changes in estimates and insurance recoveries for probable liabilities related to an operational matter in the Mobility Coatings segment, which we do not consider indicative of our ongoing operating performance. | ||||
| (j) | Represents non-recurring income related to a law change with respect to certain Brazilian indirect taxes which was recorded within other expense (income), net. | ||||
| (k) | Represents non-recurring income related to the sale of a previously closed manufacturing facility. | ||||
| (l) | Represents (benefits) expenses related to sanctions imposed on Russia in response to the conflict with Ukraine as a result of incremental reserves for accounts receivable, inventory obsolescence and business incentive payments, which we do not consider indicative of our ongoing operating performance. The benefits recorded during the three months ended September 30, 2022 are related to changes in estimated inventory obsolescence. | ||||
| (m) | Represents a forgiveness of a portion of up-front customer incentives with repayment features upon our customer completing a recapitalization and restructuring of its indebtedness and the execution of a new long-term exclusive sales agreement with us. These amounts are not considered to be indicative of our ongoing operating performance. | ||||
| (n) | Represents costs for certain non-operational or non-cash losses and (gains), unrelated to our core business and which we do not consider indicative of ongoing operations. | ||||
13
1 Q3 2022 Financial Results October 25, 2022 Exhibit 99.2
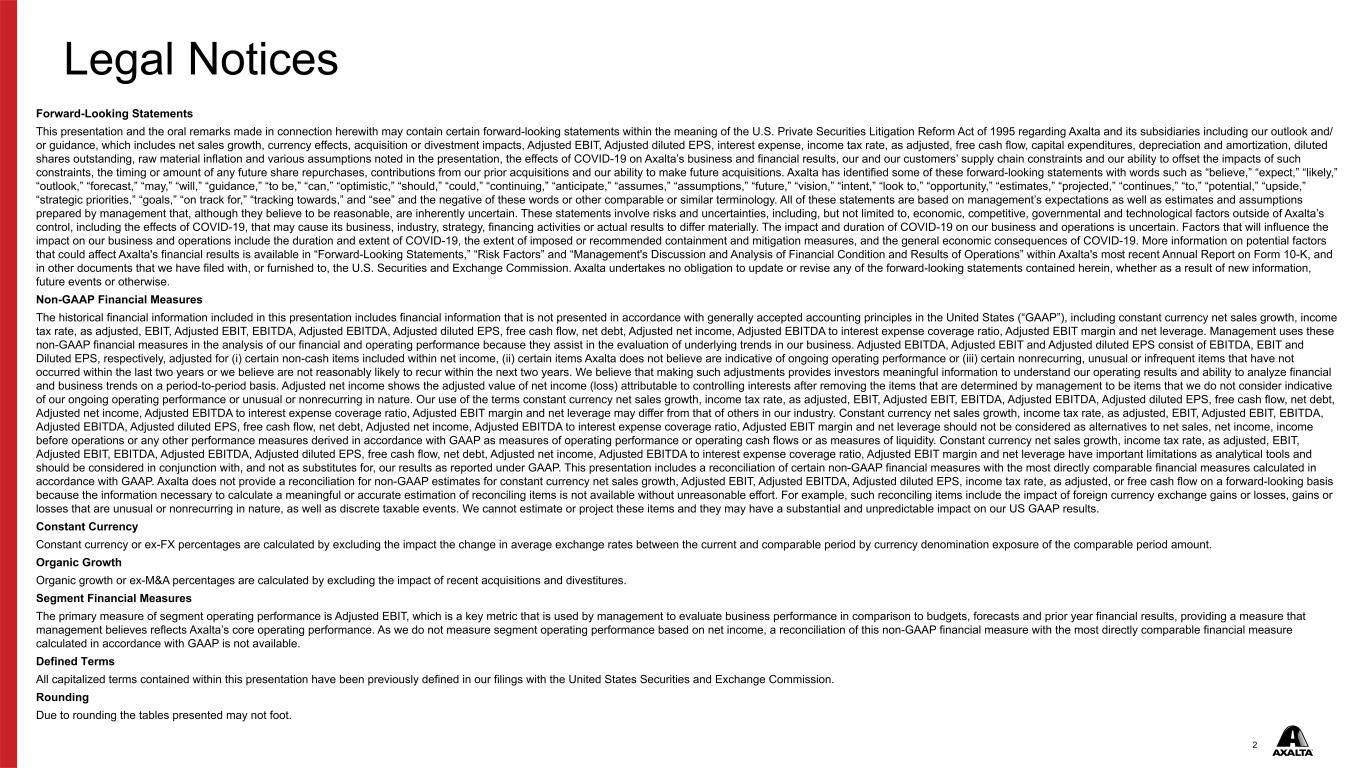
2 Legal Notices Forward-Looking Statements This presentation and the oral remarks made in connection herewith may contain certain forward-looking statements within the meaning of the U.S. Private Securities Litigation Reform Act of 1995 regarding Axalta and its subsidiaries including our outlook and/ or guidance, which includes net sales growth, currency effects, acquisition or divestment impacts, Adjusted EBIT, Adjusted diluted EPS, interest expense, income tax rate, as adjusted, free cash flow, capital expenditures, depreciation and amortization, diluted shares outstanding, raw material inflation and various assumptions noted in the presentation, the effects of COVID-19 on Axalta’s business and financial results, our and our customers’ supply chain constraints and our ability to offset the impacts of such constraints, the timing or amount of any future share repurchases, contributions from our prior acquisitions and our ability to make future acquisitions. Axalta has identified some of these forward-looking statements with words such as “believe,” “expect,” “likely,” “outlook,” “forecast,” “may,” “will,” “guidance,” “to be,” “can,” “optimistic,” “should,” “could,” “continuing,” “anticipate,” “assumes,” “assumptions,” “future,” “vision,” “intent,” “look to,” “opportunity,” “estimates,” “projected,” “continues,” “to,” “potential,” “upside,” “strategic priorities,” “goals,” “on track for,” “tracking towards,” and “see” and the negative of these words or other comparable or similar terminology. All of these statements are based on management’s expectations as well as estimates and assumptions prepared by management that, although they believe to be reasonable, are inherently uncertain. These statements involve risks and uncertainties, including, but not limited to, economic, competitive, governmental and technological factors outside of Axalta’s control, including the effects of COVID-19, that may cause its business, industry, strategy, financing activities or actual results to differ materially. The impact and duration of COVID-19 on our business and operations is uncertain. Factors that will influence the impact on our business and operations include the duration and extent of COVID-19, the extent of imposed or recommended containment and mitigation measures, and the general economic consequences of COVID-19. More information on potential factors that could affect Axalta's financial results is available in “Forward-Looking Statements,” “Risk Factors” and “Management's Discussion and Analysis of Financial Condition and Results of Operations” within Axalta's most recent Annual Report on Form 10-K, and in other documents that we have filed with, or furnished to, the U.S. Securities and Exchange Commission. Axalta undertakes no obligation to update or revise any of the forward-looking statements contained herein, whether as a result of new information, future events or otherwise. Non-GAAP Financial Measures The historical financial information included in this presentation includes financial information that is not presented in accordance with generally accepted accounting principles in the United States (“GAAP”), including constant currency net sales growth, income tax rate, as adjusted, EBIT, Adjusted EBIT, EBITDA, Adjusted EBITDA, Adjusted diluted EPS, free cash flow, net debt, Adjusted net income, Adjusted EBITDA to interest expense coverage ratio, Adjusted EBIT margin and net leverage. Management uses these non-GAAP financial measures in the analysis of our financial and operating performance because they assist in the evaluation of underlying trends in our business. Adjusted EBITDA, Adjusted EBIT and Adjusted diluted EPS consist of EBITDA, EBIT and Diluted EPS, respectively, adjusted for (i) certain non-cash items included within net income, (ii) certain items Axalta does not believe are indicative of ongoing operating performance or (iii) certain nonrecurring, unusual or infrequent items that have not occurred within the last two years or we believe are not reasonably likely to recur within the next two years. We believe that making such adjustments provides investors meaningful information to understand our operating results and ability to analyze financial and business trends on a period-to-period basis. Adjusted net income shows the adjusted value of net income (loss) attributable to controlling interests after removing the items that are determined by management to be items that we do not consider indicative of our ongoing operating performance or unusual or nonrecurring in nature. Our use of the terms constant currency net sales growth, income tax rate, as adjusted, EBIT, Adjusted EBIT, EBITDA, Adjusted EBITDA, Adjusted diluted EPS, free cash flow, net debt, Adjusted net income, Adjusted EBITDA to interest expense coverage ratio, Adjusted EBIT margin and net leverage may differ from that of others in our industry. Constant currency net sales growth, income tax rate, as adjusted, EBIT, Adjusted EBIT, EBITDA, Adjusted EBITDA, Adjusted diluted EPS, free cash flow, net debt, Adjusted net income, Adjusted EBITDA to interest expense coverage ratio, Adjusted EBIT margin and net leverage should not be considered as alternatives to net sales, net income, income before operations or any other performance measures derived in accordance with GAAP as measures of operating performance or operating cash flows or as measures of liquidity. Constant currency net sales growth, income tax rate, as adjusted, EBIT, Adjusted EBIT, EBITDA, Adjusted EBITDA, Adjusted diluted EPS, free cash flow, net debt, Adjusted net income, Adjusted EBITDA to interest expense coverage ratio, Adjusted EBIT margin and net leverage have important limitations as analytical tools and should be considered in conjunction with, and not as substitutes for, our results as reported under GAAP. This presentation includes a reconciliation of certain non-GAAP financial measures with the most directly comparable financial measures calculated in accordance with GAAP. Axalta does not provide a reconciliation for non-GAAP estimates for constant currency net sales growth, Adjusted EBIT, Adjusted EBITDA, Adjusted diluted EPS, income tax rate, as adjusted, or free cash flow on a forward-looking basis because the information necessary to calculate a meaningful or accurate estimation of reconciling items is not available without unreasonable effort. For example, such reconciling items include the impact of foreign currency exchange gains or losses, gains or losses that are unusual or nonrecurring in nature, as well as discrete taxable events. We cannot estimate or project these items and they may have a substantial and unpredictable impact on our US GAAP results. Constant Currency Constant currency or ex-FX percentages are calculated by excluding the impact the change in average exchange rates between the current and comparable period by currency denomination exposure of the comparable period amount. Organic Growth Organic growth or ex-M&A percentages are calculated by excluding the impact of recent acquisitions and divestitures. Segment Financial Measures The primary measure of segment operating performance is Adjusted EBIT, which is a key metric that is used by management to evaluate business performance in comparison to budgets, forecasts and prior year financial results, providing a measure that management believes reflects Axalta’s core operating performance. As we do not measure segment operating performance based on net income, a reconciliation of this non-GAAP financial measure with the most directly comparable financial measure calculated in accordance with GAAP is not available. Defined Terms All capitalized terms contained within this presentation have been previously defined in our filings with the United States Securities and Exchange Commission. Rounding Due to rounding the tables presented may not foot.
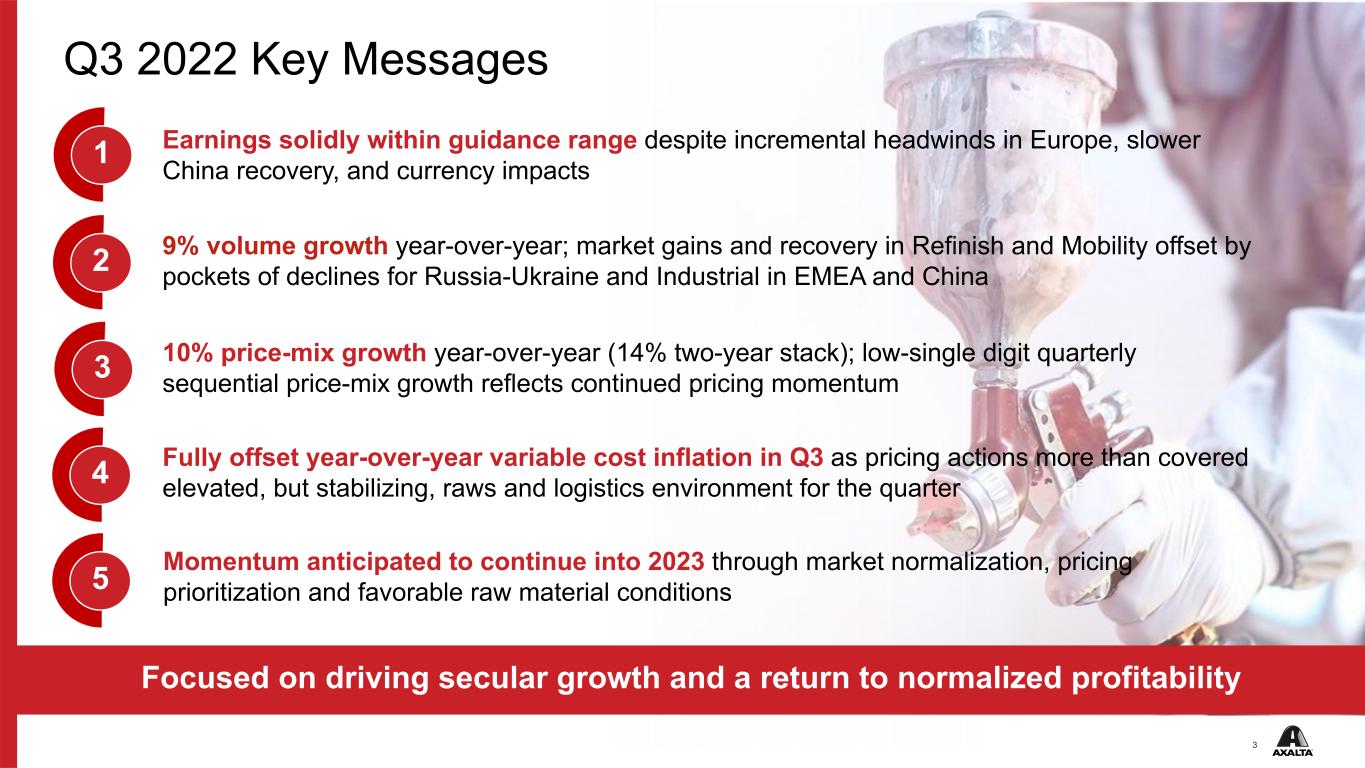
3 Q3 2022 Key Messages Focused on driving secular growth and a return to normalized profitability 10% price-mix growth year-over-year (14% two-year stack); low-single digit quarterly sequential price-mix growth reflects continued pricing momentum 1 2 3 4 Earnings solidly within guidance range despite incremental headwinds in Europe, slower China recovery, and currency impacts Fully offset year-over-year variable cost inflation in Q3 as pricing actions more than covered elevated, but stabilizing, raws and logistics environment for the quarter 9% volume growth year-over-year; market gains and recovery in Refinish and Mobility offset by pockets of declines for Russia-Ukraine and Industrial in EMEA and China 5 Momentum anticipated to continue into 2023 through market normalization, pricing prioritization and favorable raw material conditions
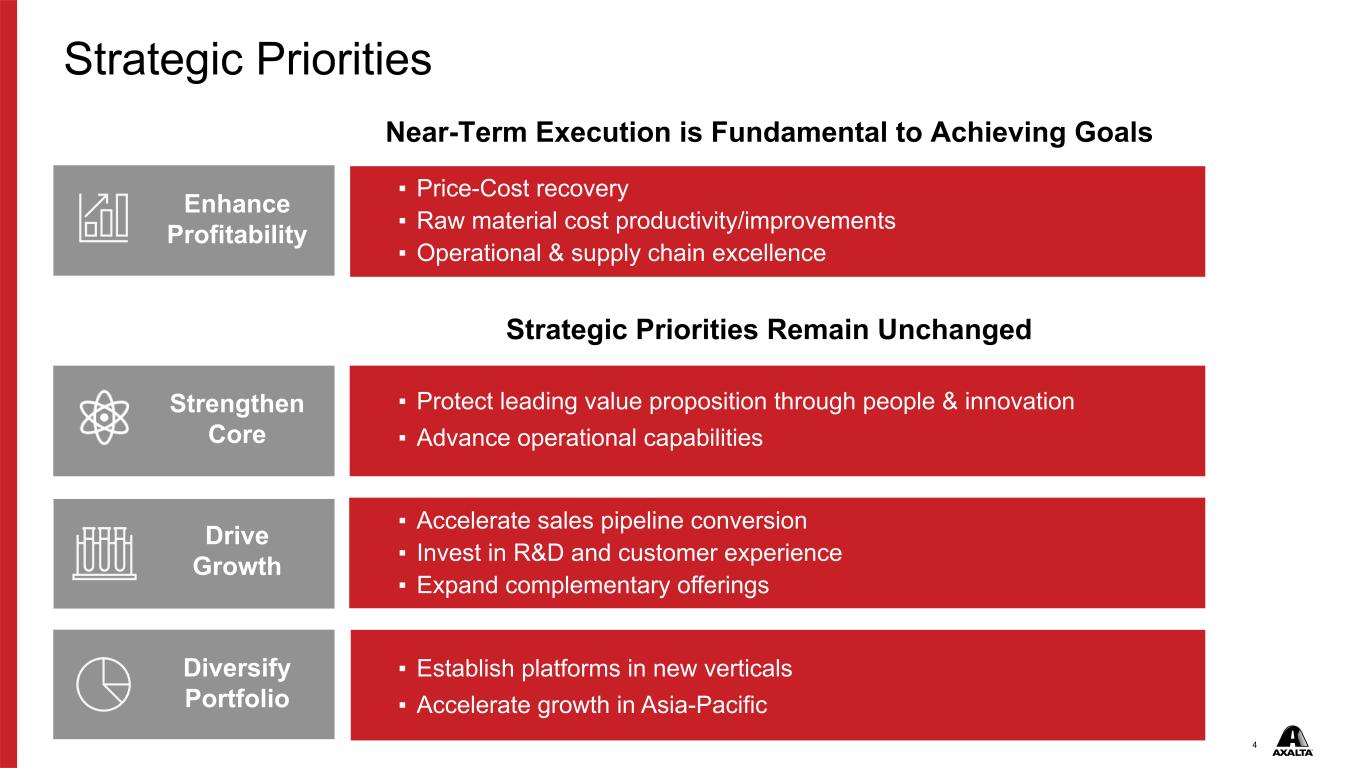
4 Near-Term Execution is Fundamental to Achieving Goals Strategic Priorities Strategic Priorities Remain Unchanged ▪ Protect leading value proposition through people & innovation ▪ Advance operational capabilities ▪ Accelerate sales pipeline conversion ▪ Invest in R&D and customer experience ▪ Expand complementary offerings ▪ Establish platforms in new verticals ▪ Accelerate growth in Asia-Pacific ▪ Price-Cost recovery ▪ Raw material cost productivity/improvements ▪ Operational & supply chain excellence Enhance Profitability Enhance Profitability Strengthen Core Drive Growth Diversify Portfolio
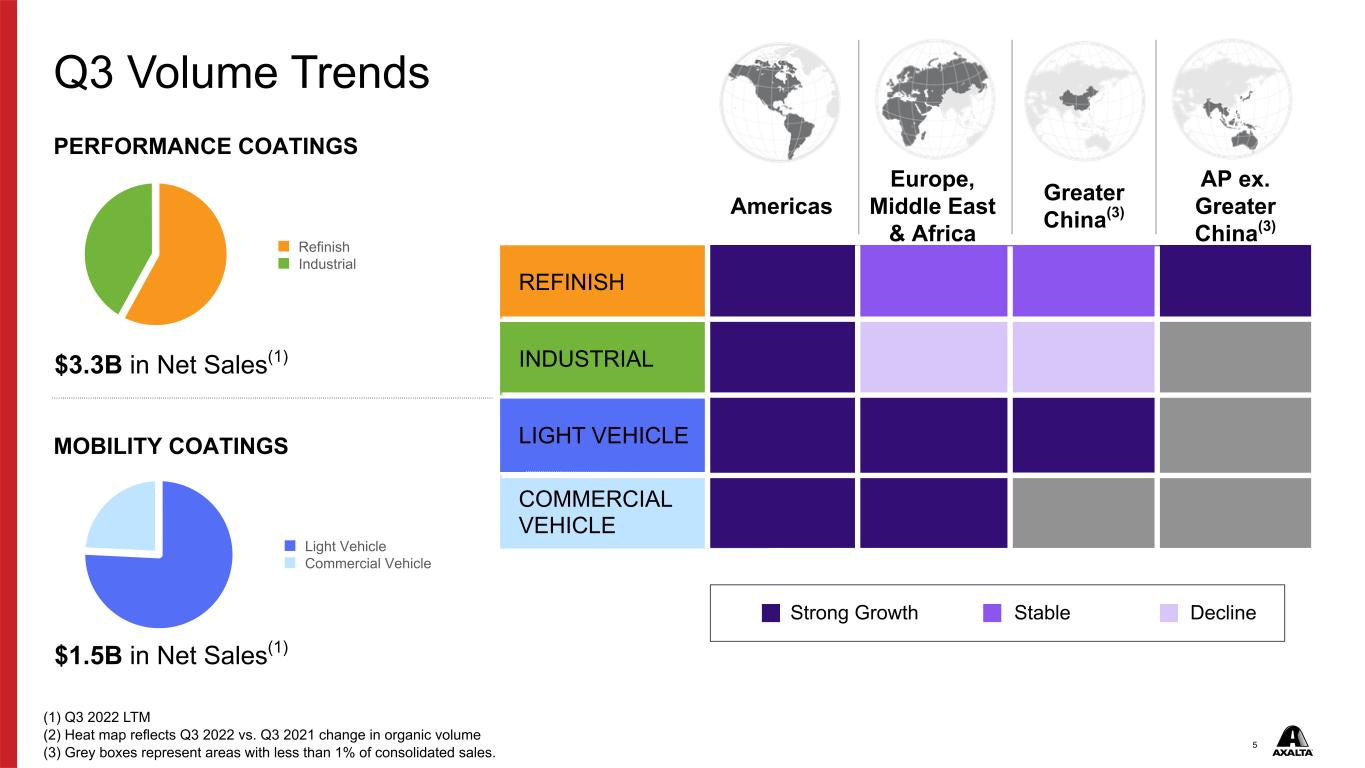
5 COMMERCIAL VEHICLE LIGHT VEHICLE INDUSTRIAL REFINISH Light Vehicle Commercial Vehicle Refinish Industrial Q3 Volume Trends PERFORMANCE COATINGS PROPRIETARY Strong Growth Stable Decline $3.3B in Net Sales(1) $1.5B in Net Sales(1) (1) Q3 2022 LTM (2) Heat map reflects Q3 2022 vs. Q3 2021 change in organic volume (3) Grey boxes represent areas with less than 1% of consolidated sales. Americas Europe, Middle East & Africa Greater China(3) AP ex. Greater China(3) 9.7% (0.3)% 1.2% 3.7% 3.9% (14.4)% (25.0)% 32.3% 17.9% 32.5% 72.5% 38.9% 27.0% 12.6% (2.7)% 78.4% MOBILITY COATINGS

6 Energy Solutions Building Products General Industrial Americas EMEA Asia Pacific Market Volume 2022E vs 2019 Volume Growth Continues to Outpace Markets ▪ AXTA volumes have increased vs. 2019 reflecting company-wide share gains despite the majority of end-market activity still below pre-COVID 2019 levels ▪ Recessionary headwinds to be balanced by deferred demand and on-going post-COVID end-market normalization ▪ See significant upside potential on future normalization of volumes in core markets Industrial(2)Refinish(2) Light Vehicle(3) Commercial Vehicle(4) (1) Full Year 2022 volume forecast compared to 2019 levels (2) Management estimates (3) Source: S&P Global industry car build forecasts (4) Global Class 8 builds ex. Eastern Europe and Asia-Pacific due to limited exposure; Source: LMC industry forecasts AXTA Volume 2022E vs 2019 2% Total Axalta(1) (8%) (11%) (5%)
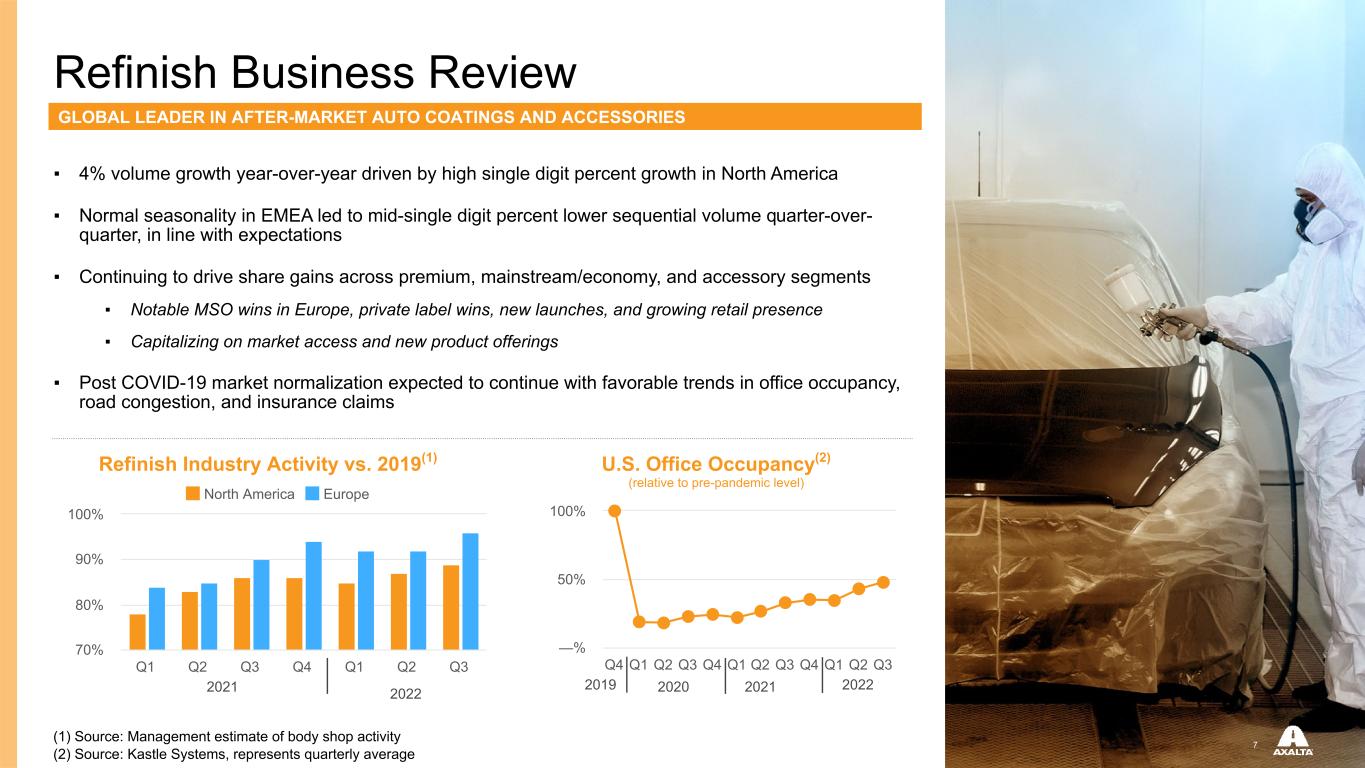
7 ▪ 4% volume growth year-over-year driven by high single digit percent growth in North America ▪ Normal seasonality in EMEA led to mid-single digit percent lower sequential volume quarter-over- quarter, in line with expectations ▪ Continuing to drive share gains across premium, mainstream/economy, and accessory segments ▪ Notable MSO wins in Europe, private label wins, new launches, and growing retail presence ▪ Capitalizing on market access and new product offerings ▪ Post COVID-19 market normalization expected to continue with favorable trends in office occupancy, road congestion, and insurance claims North America Europe Q1 Q2 Q3 Q4 Q1 Q2 Q3 70% 80% 90% 100% Refinish Business Review Q4 Q1 Q2 Q3 Q4 Q1 Q2 Q3 Q4 Q1 Q2 Q3 —% 50% 100% U.S. Office Occupancy(2) (1) Source: Management estimate of body shop activity (2) Source: Kastle Systems, represents quarterly average 2020 2021 2022 GLOBAL LEADER IN AFTER-MARKET AUTO COATINGS AND ACCESSORIES (relative to pre-pandemic level) 2019 Refinish Industry Activity vs. 2019(1) 2021 2022
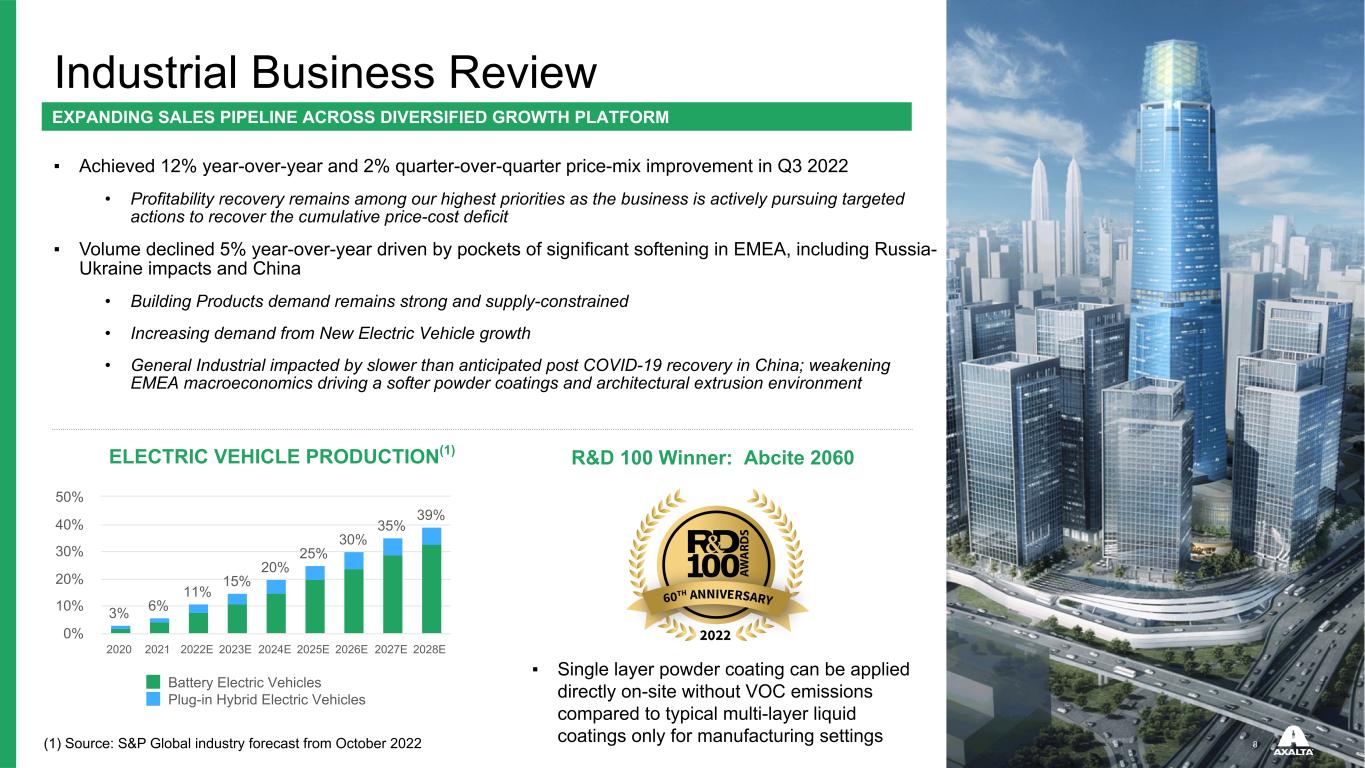
88 Industrial Business Review ▪ Achieved 12% year-over-year and 2% quarter-over-quarter price-mix improvement in Q3 2022 • Profitability recovery remains among our highest priorities as the business is actively pursuing targeted actions to recover the cumulative price-cost deficit ▪ Volume declined 5% year-over-year driven by pockets of significant softening in EMEA, including Russia- Ukraine impacts and China • Building Products demand remains strong and supply-constrained • Increasing demand from New Electric Vehicle growth • General Industrial impacted by slower than anticipated post COVID-19 recovery in China; weakening EMEA macroeconomics driving a softer powder coatings and architectural extrusion environment P M/E A EXPANDING SALES PIPELINE ACROSS DIVERSIFIED GROWTH PLATFORM (1) Source: S&P Global industry forecast from October 2022 ELECTRIC VEHICLE PRODUCTION(1) 3% 6% 11% 15% 20% 25% 30% 35% 39% Battery Electric Vehicles Plug-in Hybrid Electric Vehicles 2020 2021 2022E 2023E 2024E 2025E 2026E 2027E 2028E 0% 10% 20% 30% 40% 50% R&D 100 Winner: Abcite 2060 ▪ Single layer powder coating can be applied directly on-site without VOC emissions compared to typical multi-layer liquid coatings only for manufacturing settings
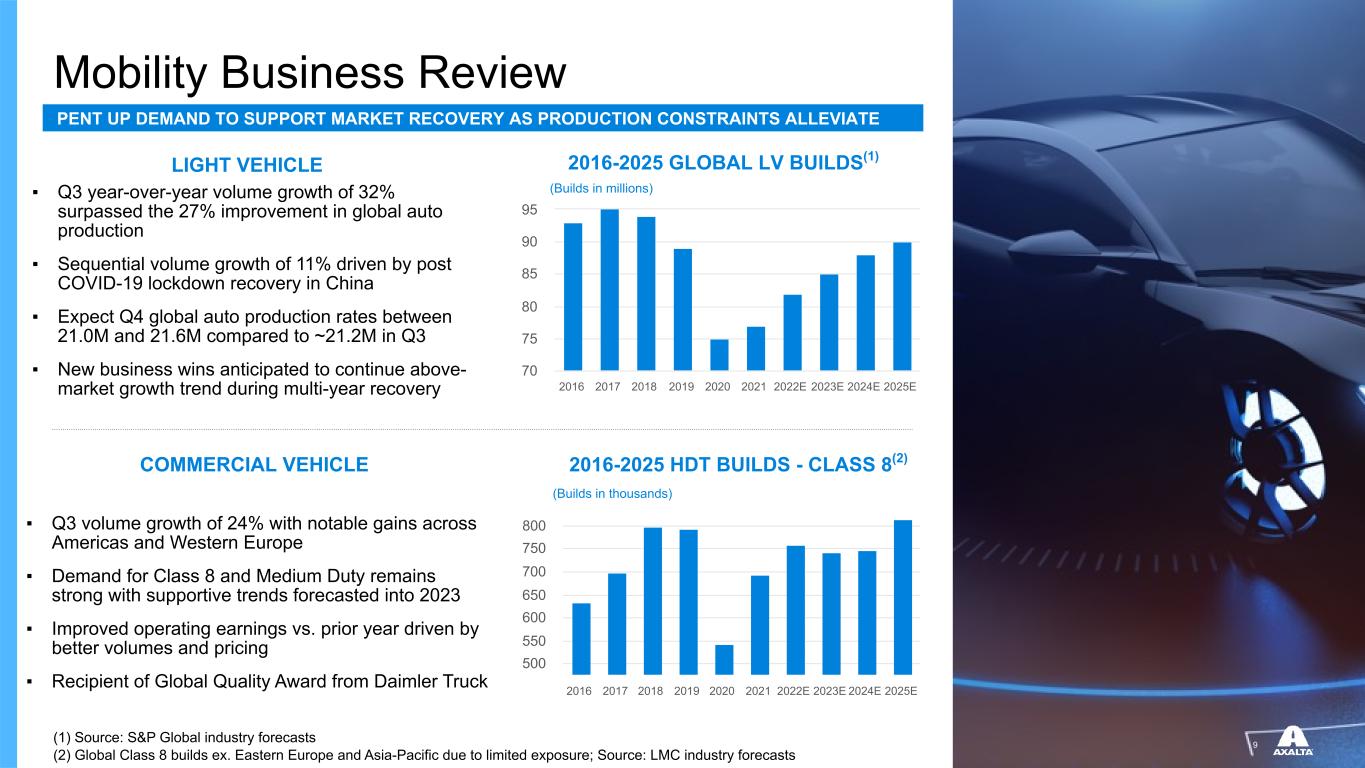
9 2016 2017 2018 2019 2020 2021 2022E 2023E 2024E 2025E 70 75 80 85 90 95 2016 2017 2018 2019 2020 2021 2022E 2023E 2024E 2025E 500 550 600 650 700 750 800 Mobility Business Review ▪ Q3 year-over-year volume growth of 32% surpassed the 27% improvement in global auto production ▪ Sequential volume growth of 11% driven by post COVID-19 lockdown recovery in China ▪ Expect Q4 global auto production rates between 21.0M and 21.6M compared to ~21.2M in Q3 ▪ New business wins anticipated to continue above- market growth trend during multi-year recovery ▪ Q3 volume growth of 24% with notable gains across Americas and Western Europe ▪ Demand for Class 8 and Medium Duty remains strong with supportive trends forecasted into 2023 ▪ Improved operating earnings vs. prior year driven by better volumes and pricing ▪ Recipient of Global Quality Award from Daimler Truck 2016-2025 HDT BUILDS - CLASS 8(2) PENT UP DEMAND TO SUPPORT MARKET RECOVERY AS PRODUCTION CONSTRAINTS ALLEVIATE (Builds in thousands) LIGHT VEHICLE COMMERCIAL VEHICLE (1) Source: S&P Global industry forecasts (2) Global Class 8 builds ex. Eastern Europe and Asia-Pacific due to limited exposure; Source: LMC industry forecasts (Builds in millions) 2016-2025 GLOBAL LV BUILDS(1)
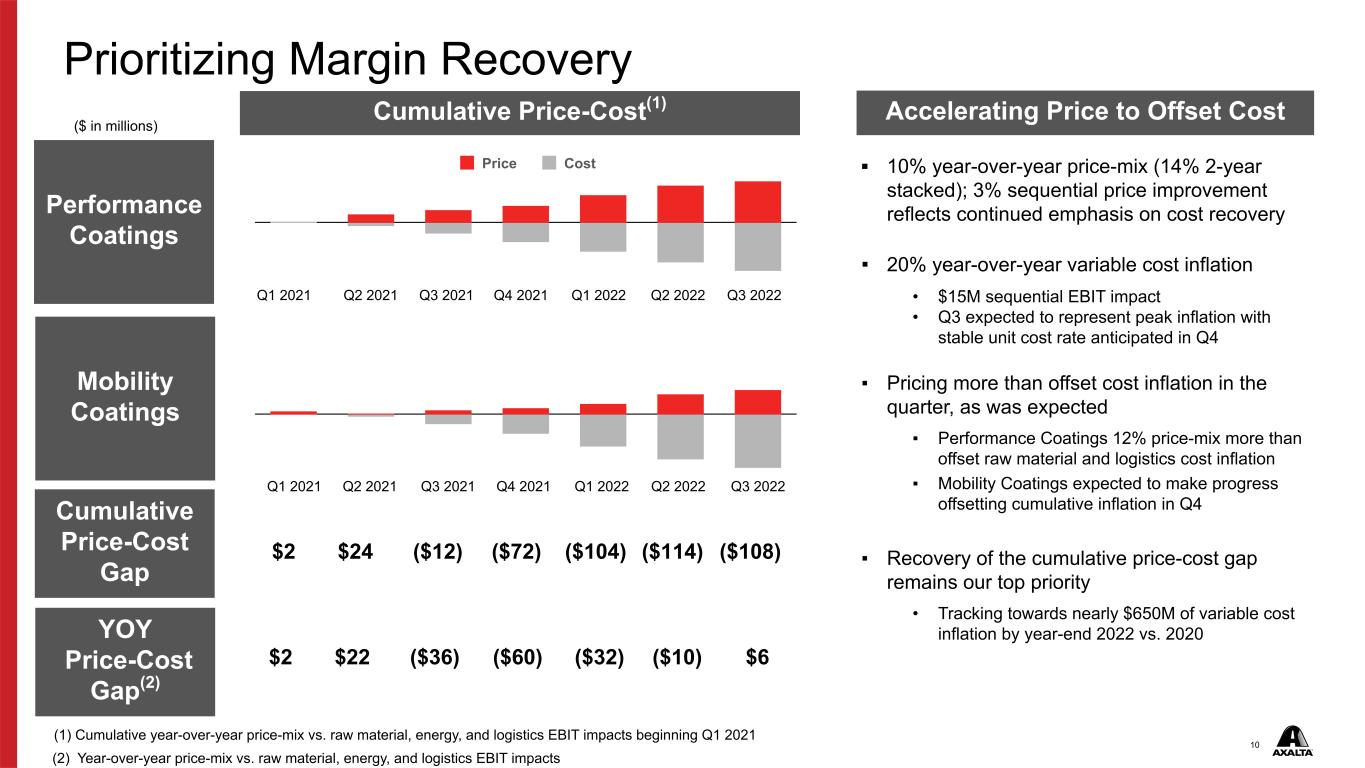
10 Price Cost Prioritizing Margin Recovery ($ in millions) (1) Cumulative year-over-year price-mix vs. raw material, energy, and logistics EBIT impacts beginning Q1 2021 $2 $24 ($12) ($72) ($104) Q1 2021 Q2 2021 Q3 2021 Q4 2021 Q1 2022 Q2 2022 ($114) Q1 2021 Q2 2021 Q3 2021 Q4 2021 Q1 2022 Q2 2022 Q3 2022 Q3 2022 ($108) ▪ 10% year-over-year price-mix (14% 2-year stacked); 3% sequential price improvement reflects continued emphasis on cost recovery ▪ 20% year-over-year variable cost inflation • $15M sequential EBIT impact • Q3 expected to represent peak inflation with stable unit cost rate anticipated in Q4 ▪ Pricing more than offset cost inflation in the quarter, as was expected ▪ Performance Coatings 12% price-mix more than offset raw material and logistics cost inflation ▪ Mobility Coatings expected to make progress offsetting cumulative inflation in Q4 ▪ Recovery of the cumulative price-cost gap remains our top priority • Tracking towards nearly $650M of variable cost inflation by year-end 2022 vs. 2020 Cumulative Price-Cost(1) Accelerating Price to Offset Cost Performance Coatings Mobility Coatings Cumulative Price-Cost Gap YOY Price-Cost Gap(2) $2 $22 ($36) ($60) ($32) ($10) $6 (2) Year-over-year price-mix vs. raw material, energy, and logistics EBIT impacts
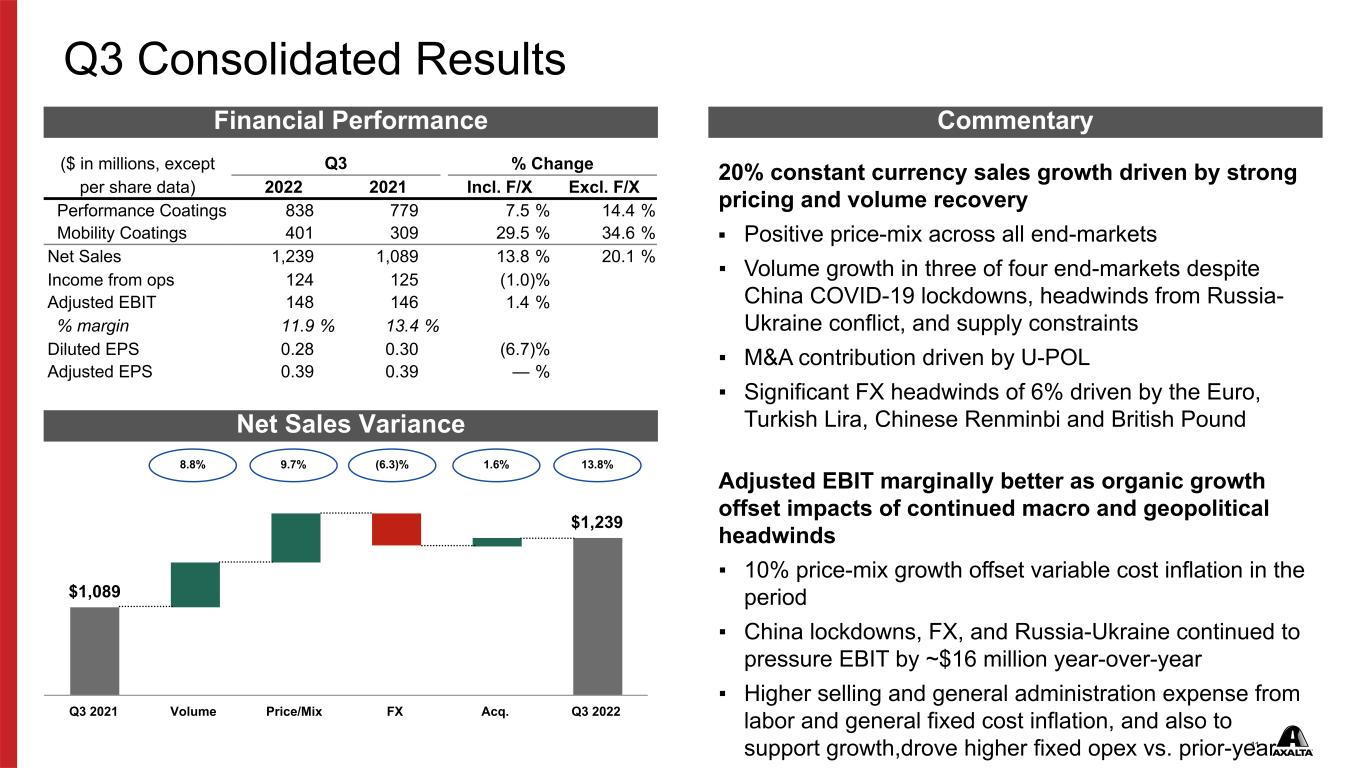
11 20% constant currency sales growth driven by strong pricing and volume recovery ▪ Positive price-mix across all end-markets ▪ Volume growth in three of four end-markets despite China COVID-19 lockdowns, headwinds from Russia- Ukraine conflict, and supply constraints ▪ M&A contribution driven by U-POL ▪ Significant FX headwinds of 6% driven by the Euro, Turkish Lira, Chinese Renminbi and British Pound Adjusted EBIT marginally better as organic growth offset impacts of continued macro and geopolitical headwinds ▪ 10% price-mix growth offset variable cost inflation in the period ▪ China lockdowns, FX, and Russia-Ukraine continued to pressure EBIT by ~$16 million year-over-year ▪ Higher selling and general administration expense from labor and general fixed cost inflation, and also to support growth,drove higher fixed opex vs. prior-year $1,089 $1,239 Q3 2021 Volume Price/Mix FX Acq. Q3 2022 Q3 Consolidated Results ($ in millions, except Q3 % Change per share data) 2022 2021 Incl. F/X Excl. F/X Performance Coatings 838 779 7.5 % 14.4 % Mobility Coatings 401 309 29.5 % 34.6 % Net Sales 1,239 1,089 13.8 % 20.1 % Income from ops 124 125 (1.0) % Adjusted EBIT 148 146 1.4 % % margin 11.9 % 13.4 % Diluted EPS 0.28 0.30 (6.7) % Adjusted EPS 0.39 0.39 — % 8.8% 9.7% (6.3)% 13.8% 1.6% Financial Performance Commentary Net Sales Variance
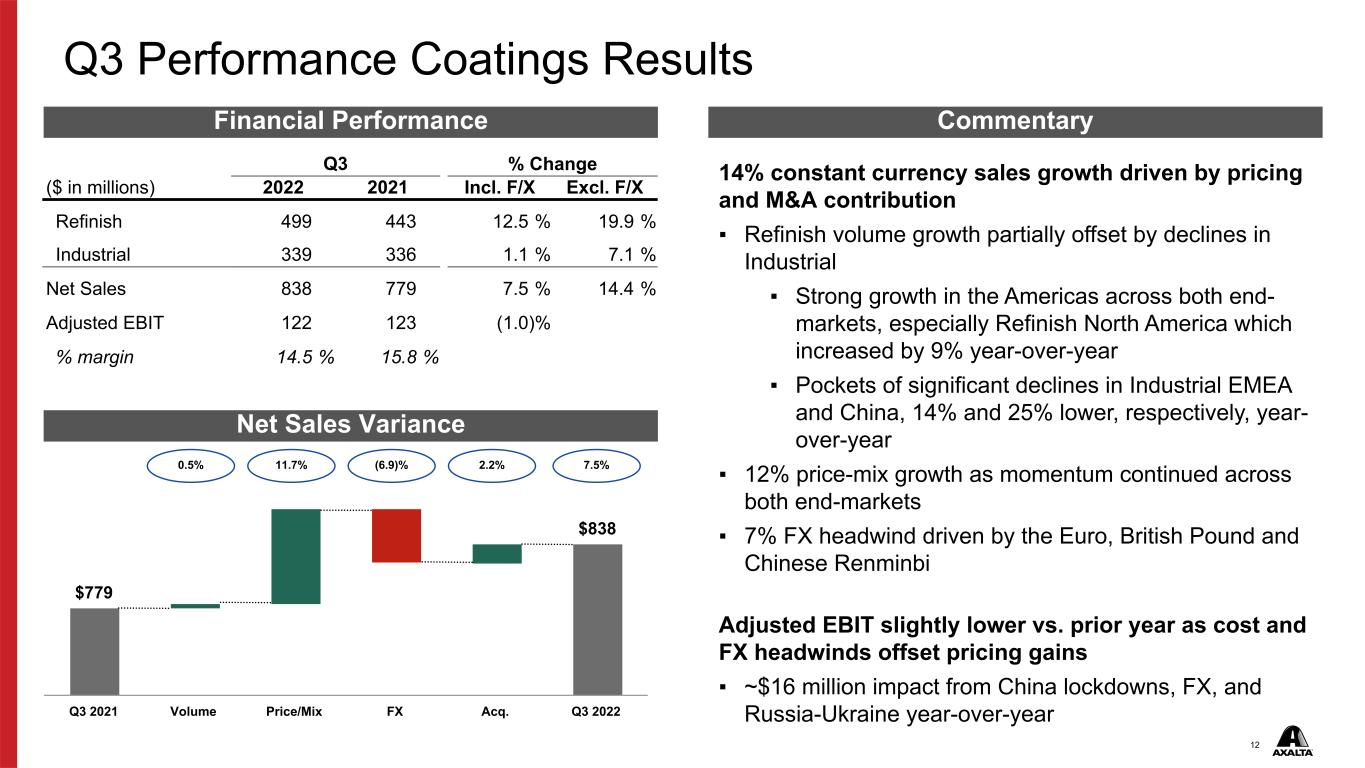
12 $779 $838 Q3 2021 Volume Price/Mix FX Acq. Q3 2022 Q3 Performance Coatings Results Q3 % Change ($ in millions) 2022 2021 Incl. F/X Excl. F/X Refinish 499 443 12.5 % 19.9 % Industrial 339 336 1.1 % 7.1 % Net Sales 838 779 7.5 % 14.4 % Adjusted EBIT 122 123 (1.0) % % margin 14.5 % 15.8 % 0.5% 11.7% (6.9)% 7.5% 14% constant currency sales growth driven by pricing and M&A contribution ▪ Refinish volume growth partially offset by declines in Industrial ▪ Strong growth in the Americas across both end- markets, especially Refinish North America which increased by 9% year-over-year ▪ Pockets of significant declines in Industrial EMEA and China, 14% and 25% lower, respectively, year- over-year ▪ 12% price-mix growth as momentum continued across both end-markets ▪ 7% FX headwind driven by the Euro, British Pound and Chinese Renminbi Adjusted EBIT slightly lower vs. prior year as cost and FX headwinds offset pricing gains ▪ ~$16 million impact from China lockdowns, FX, and Russia-Ukraine year-over-year 2.2% Financial Performance Commentary Net Sales Variance
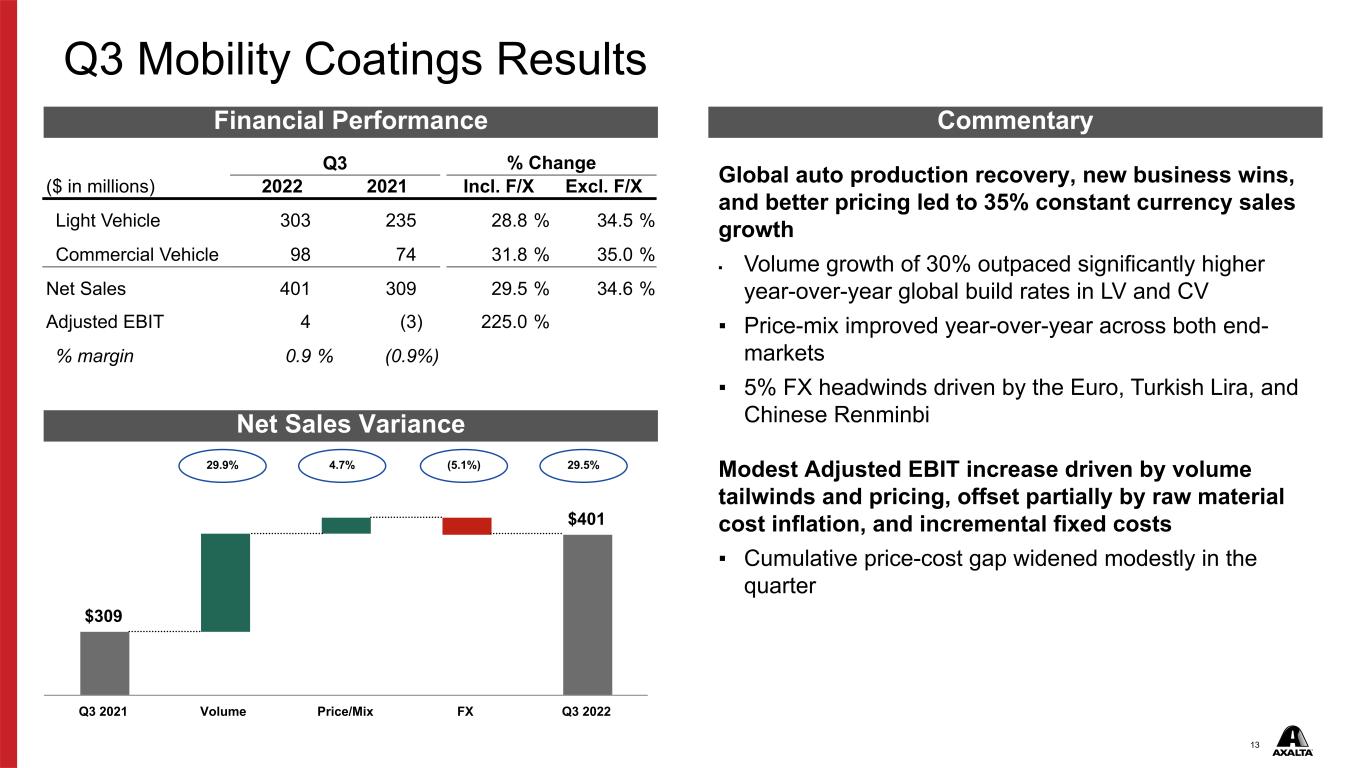
13 Global auto production recovery, new business wins, and better pricing led to 35% constant currency sales growth ▪ Volume growth of 30% outpaced significantly higher year-over-year global build rates in LV and CV ▪ Price-mix improved year-over-year across both end- markets ▪ 5% FX headwinds driven by the Euro, Turkish Lira, and Chinese Renminbi Modest Adjusted EBIT increase driven by volume tailwinds and pricing, offset partially by raw material cost inflation, and incremental fixed costs ▪ Cumulative price-cost gap widened modestly in the quarter $309 $401 Q3 2021 Volume Price/Mix FX Q3 2022 Q3 Mobility Coatings Results Q3 % Change ($ in millions) 2022 2021 Incl. F/X Excl. F/X Light Vehicle 303 235 28.8 % 34.5 % Commercial Vehicle 98 74 31.8 % 35.0 % Net Sales 401 309 29.5 % 34.6 % Adjusted EBIT 4 (3) 225.0 % % margin 0.9 % (0.9%) 29.9% 4.7% (5.1%) 29.5% Financial Performance Commentary Net Sales Variance
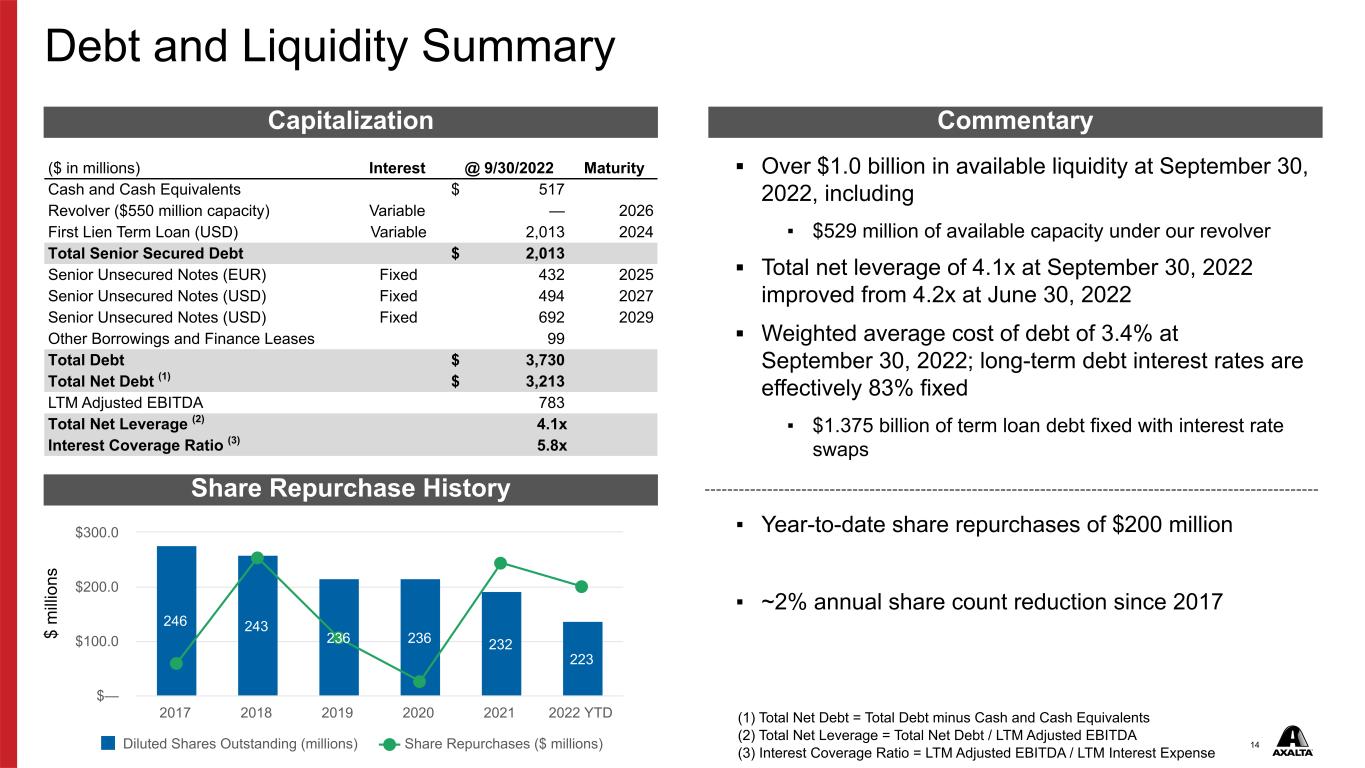
14 Debt and Liquidity Summary ($ in millions) Interest @ 9/30/2022 Maturity Cash and Cash Equivalents $ 517 Revolver ($550 million capacity) Variable — 2026 First Lien Term Loan (USD) Variable 2,013 2024 Total Senior Secured Debt $ 2,013 Senior Unsecured Notes (EUR) Fixed 432 2025 Senior Unsecured Notes (USD) Fixed 494 2027 Senior Unsecured Notes (USD) Fixed 692 2029 Other Borrowings and Finance Leases 99 Total Debt $ 3,730 Total Net Debt (1) $ 3,213 LTM Adjusted EBITDA 783 Total Net Leverage (2) 4.1x Interest Coverage Ratio (3) 5.8x Capitalization Commentary ▪ Over $1.0 billion in available liquidity at September 30, 2022, including ▪ $529 million of available capacity under our revolver ▪ Total net leverage of 4.1x at September 30, 2022 improved from 4.2x at June 30, 2022 ▪ Weighted average cost of debt of 3.4% at September 30, 2022; long-term debt interest rates are effectively 83% fixed ▪ $1.375 billion of term loan debt fixed with interest rate swaps ▪ Year-to-date share repurchases of $200 million ▪ ~2% annual share count reduction since 2017 246 243 236 236 232 223 Diluted Shares Outstanding (millions) Share Repurchases ($ millions) 2017 2018 2019 2020 2021 2022 YTD $— $100.0 $200.0 $300.0 (1) Total Net Debt = Total Debt minus Cash and Cash Equivalents (2) Total Net Leverage = Total Net Debt / LTM Adjusted EBITDA (3) Interest Coverage Ratio = LTM Adjusted EBITDA / LTM Interest Expense $ m ill io ns Share Repurchase History
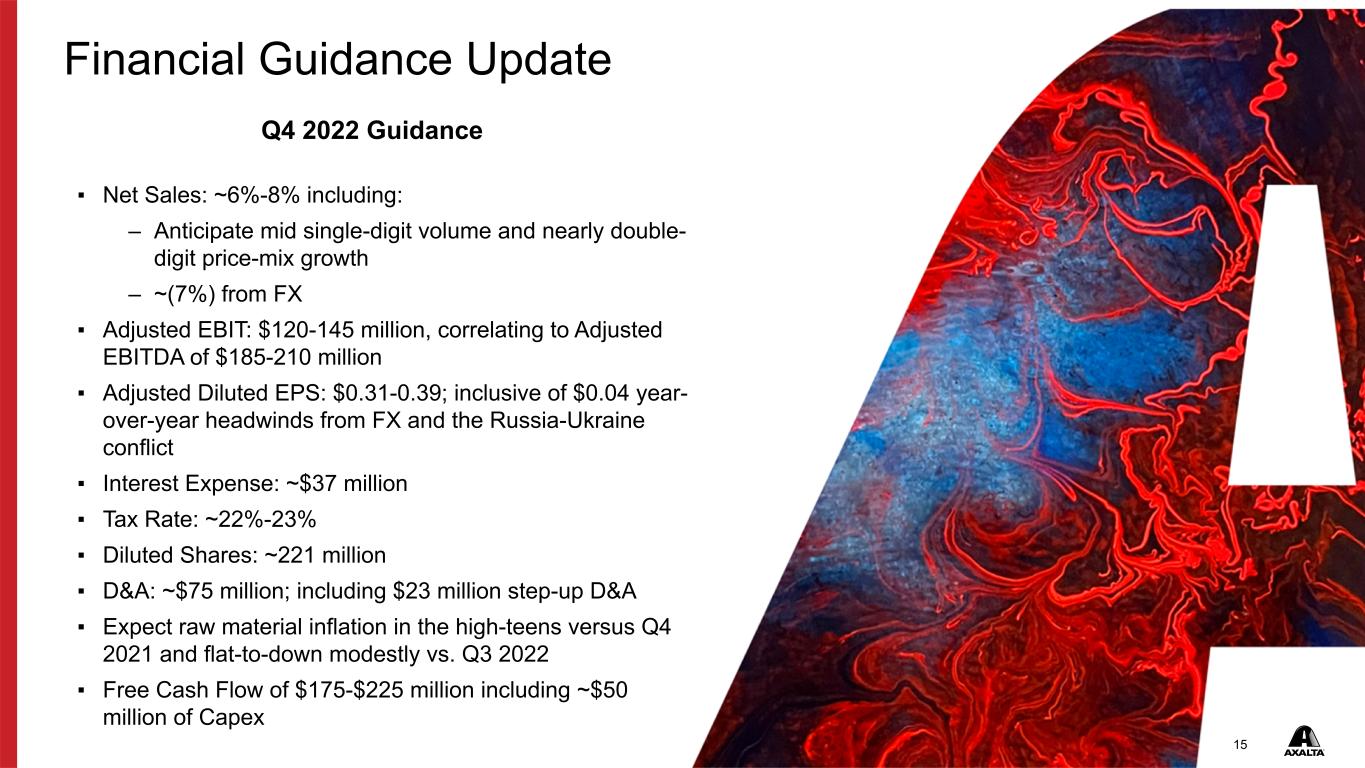
1515 Q4 2022 Guidance ▪ Net Sales: ~6%-8% including: – Anticipate mid single-digit volume and nearly double- digit price-mix growth – ~(7%) from FX ▪ Adjusted EBIT: $120-145 million, correlating to Adjusted EBITDA of $185-210 million ▪ Adjusted Diluted EPS: $0.31-0.39; inclusive of $0.04 year- over-year headwinds from FX and the Russia-Ukraine conflict ▪ Interest Expense: ~$37 million ▪ Tax Rate: ~22%-23% ▪ Diluted Shares: ~221 million ▪ D&A: ~$75 million; including $23 million step-up D&A ▪ Expect raw material inflation in the high-teens versus Q4 2021 and flat-to-down modestly vs. Q3 2022 ▪ Free Cash Flow of $175-$225 million including ~$50 million of Capex Financial Guidance Update
16 Appendix
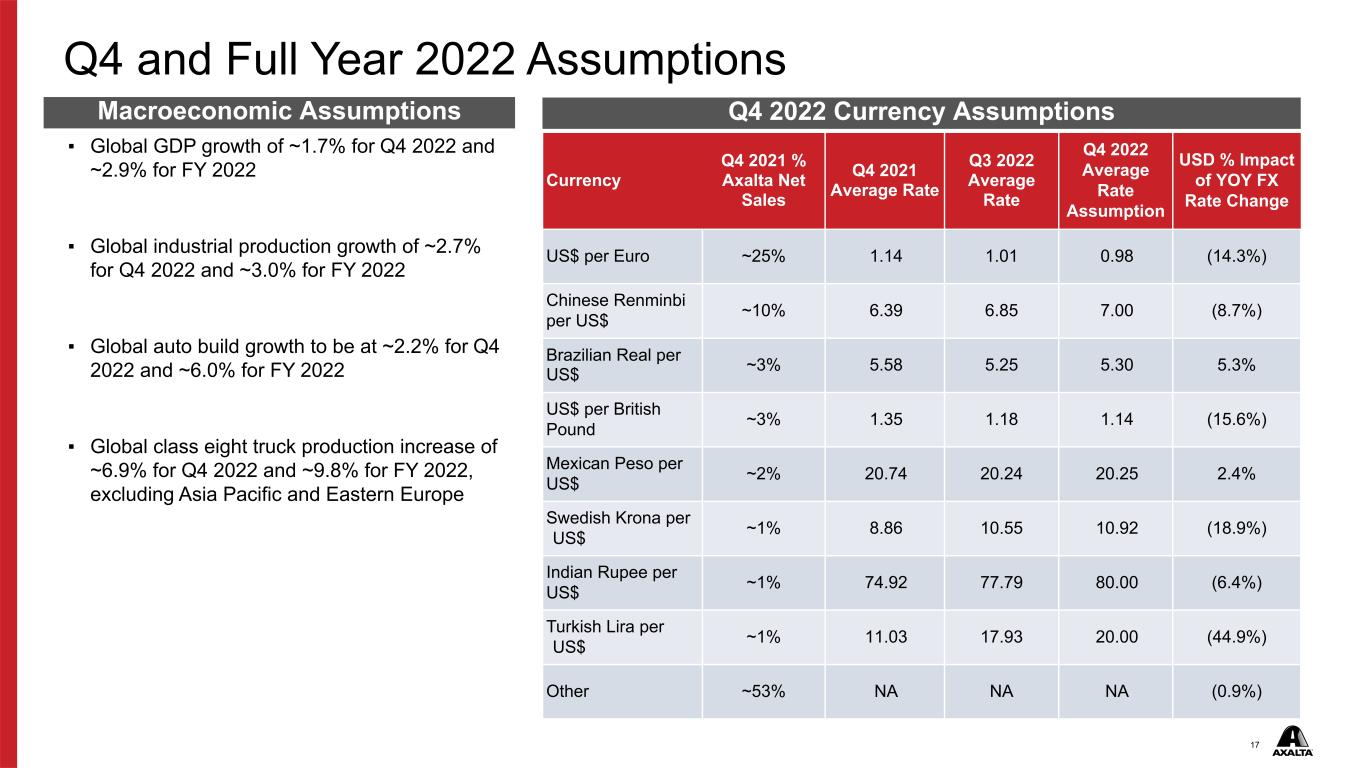
17 Q4 and Full Year 2022 Assumptions ▪ Global GDP growth of ~1.7% for Q4 2022 and ~2.9% for FY 2022 ▪ Global industrial production growth of ~2.7% for Q4 2022 and ~3.0% for FY 2022 ▪ Global auto build growth to be at ~2.2% for Q4 2022 and ~6.0% for FY 2022 ▪ Global class eight truck production increase of ~6.9% for Q4 2022 and ~9.8% for FY 2022, excluding Asia Pacific and Eastern Europe Currency Q4 2021 % Axalta Net Sales Q4 2021 Average Rate Q3 2022 Average Rate Q4 2022 Average Rate Assumption USD % Impact of YOY FX Rate Change US$ per Euro ~25% 1.14 1.01 0.98 (14.3%) Chinese Renminbi per US$ ~10% 6.39 6.85 7.00 (8.7%) Brazilian Real per US$ ~3% 5.58 5.25 5.30 5.3% US$ per British Pound ~3% 1.35 1.18 1.14 (15.6%) Mexican Peso per US$ ~2% 20.74 20.24 20.25 2.4% Swedish Krona per US$ ~1% 8.86 10.55 10.92 (18.9%) Indian Rupee per US$ ~1% 74.92 77.79 80.00 (6.4%) Turkish Lira per US$ ~1% 11.03 17.93 20.00 (44.9%) Other ~53% NA NA NA (0.9%) Macroeconomic Assumptions Q4 2022 Currency Assumptions
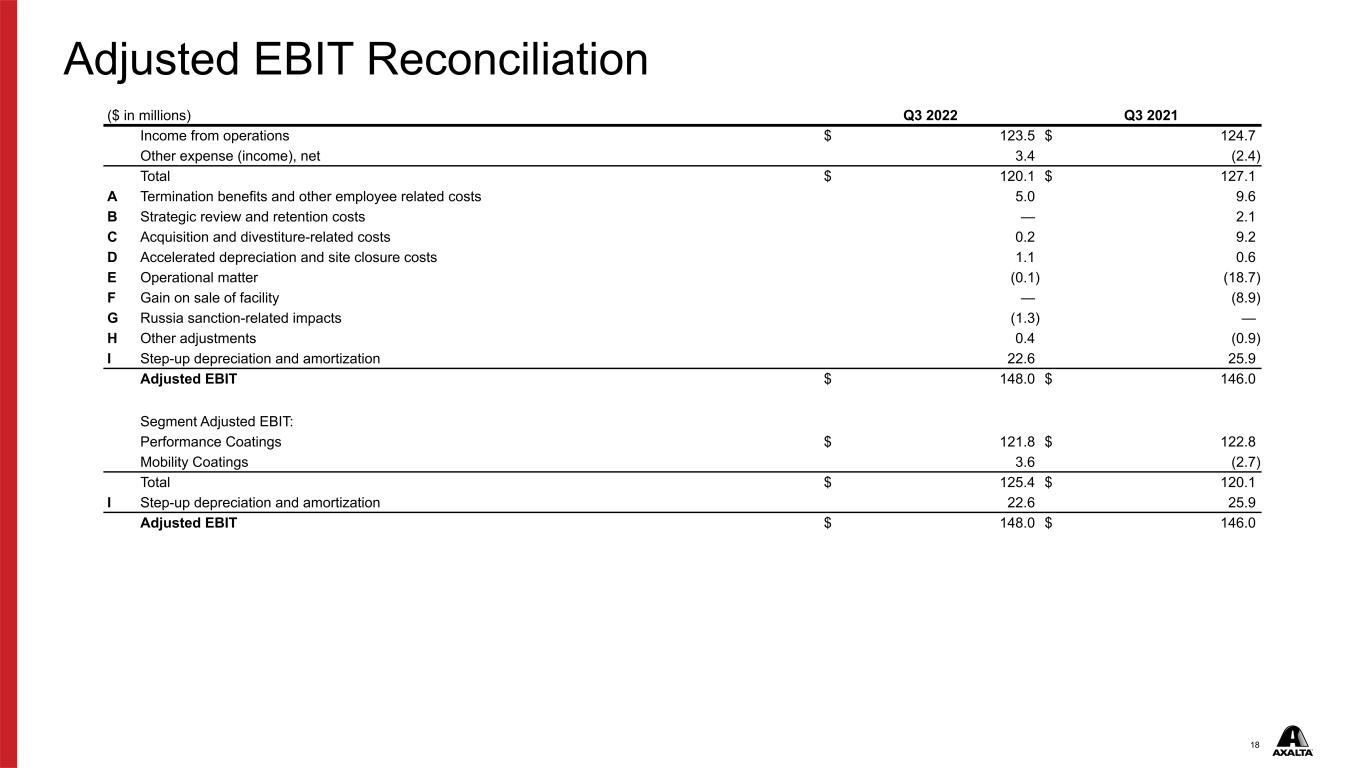
18 ($ in millions) Q3 2022 Q3 2021 Income from operations $ 123.5 $ 124.7 Other expense (income), net 3.4 (2.4) Total $ 120.1 $ 127.1 A Termination benefits and other employee related costs 5.0 9.6 B Strategic review and retention costs — 2.1 C Acquisition and divestiture-related costs 0.2 9.2 D Accelerated depreciation and site closure costs 1.1 0.6 E Operational matter (0.1) (18.7) F Gain on sale of facility — (8.9) G Russia sanction-related impacts (1.3) — H Other adjustments 0.4 (0.9) I Step-up depreciation and amortization 22.6 25.9 Adjusted EBIT $ 148.0 $ 146.0 Segment Adjusted EBIT: Performance Coatings $ 121.8 $ 122.8 Mobility Coatings 3.6 (2.7) Total $ 125.4 $ 120.1 I Step-up depreciation and amortization 22.6 25.9 Adjusted EBIT $ 148.0 $ 146.0 Adjusted EBIT Reconciliation
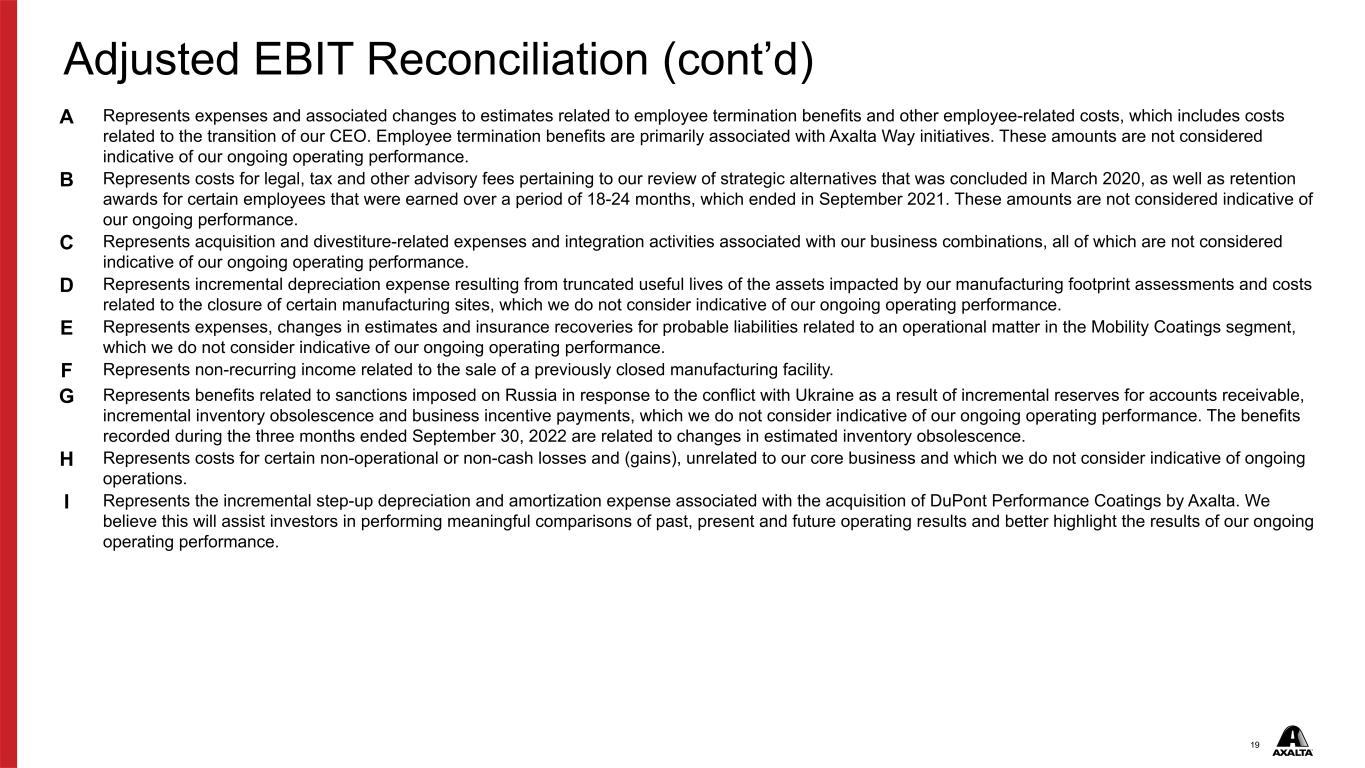
19 A Represents expenses and associated changes to estimates related to employee termination benefits and other employee-related costs, which includes costs related to the transition of our CEO. Employee termination benefits are primarily associated with Axalta Way initiatives. These amounts are not considered indicative of our ongoing operating performance. B Represents costs for legal, tax and other advisory fees pertaining to our review of strategic alternatives that was concluded in March 2020, as well as retention awards for certain employees that were earned over a period of 18-24 months, which ended in September 2021. These amounts are not considered indicative of our ongoing performance. C Represents acquisition and divestiture-related expenses and integration activities associated with our business combinations, all of which are not considered indicative of our ongoing operating performance. D Represents incremental depreciation expense resulting from truncated useful lives of the assets impacted by our manufacturing footprint assessments and costs related to the closure of certain manufacturing sites, which we do not consider indicative of our ongoing operating performance. E Represents expenses, changes in estimates and insurance recoveries for probable liabilities related to an operational matter in the Mobility Coatings segment, which we do not consider indicative of our ongoing operating performance. F Represents non-recurring income related to the sale of a previously closed manufacturing facility. G Represents benefits related to sanctions imposed on Russia in response to the conflict with Ukraine as a result of incremental reserves for accounts receivable, incremental inventory obsolescence and business incentive payments, which we do not consider indicative of our ongoing operating performance. The benefits recorded during the three months ended September 30, 2022 are related to changes in estimated inventory obsolescence. H Represents costs for certain non-operational or non-cash losses and (gains), unrelated to our core business and which we do not consider indicative of ongoing operations. I Represents the incremental step-up depreciation and amortization expense associated with the acquisition of DuPont Performance Coatings by Axalta. We believe this will assist investors in performing meaningful comparisons of past, present and future operating results and better highlight the results of our ongoing operating performance. Adjusted EBIT Reconciliation (cont’d)
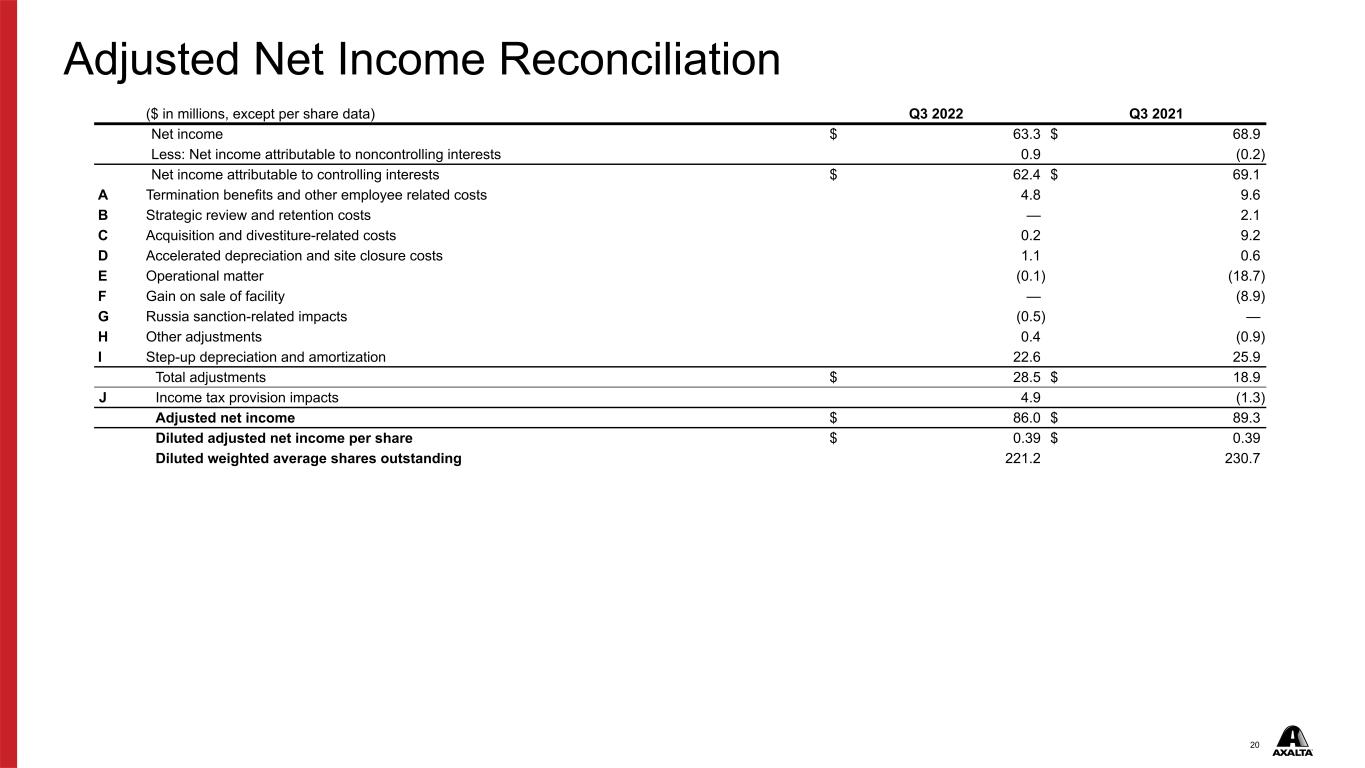
20 ($ in millions, except per share data) Q3 2022 Q3 2021 Net income $ 63.3 $ 68.9 Less: Net income attributable to noncontrolling interests 0.9 (0.2) Net income attributable to controlling interests $ 62.4 $ 69.1 A Termination benefits and other employee related costs 4.8 9.6 B Strategic review and retention costs — 2.1 C Acquisition and divestiture-related costs 0.2 9.2 D Accelerated depreciation and site closure costs 1.1 0.6 E Operational matter (0.1) (18.7) F Gain on sale of facility — (8.9) G Russia sanction-related impacts (0.5) — H Other adjustments 0.4 (0.9) I Step-up depreciation and amortization 22.6 25.9 Total adjustments $ 28.5 $ 18.9 J Income tax provision impacts 4.9 (1.3) Adjusted net income $ 86.0 $ 89.3 Diluted adjusted net income per share $ 0.39 $ 0.39 Diluted weighted average shares outstanding 221.2 230.7 Adjusted Net Income Reconciliation

21 A Represents expenses and associated changes to estimates related to employee termination benefits and other employee-related costs, which includes costs related to the transition of our CEO. Employee termination benefits are primarily associated with Axalta Way initiatives. These amounts are not considered indicative of our ongoing operating performance. B Represents costs for legal, tax and other advisory fees pertaining to our review of strategic alternatives that was concluded in March 2020, as well as retention awards for certain employees that were earned over a period of 18-24 months, which ended in September 2021. These amounts are not considered indicative of our ongoing performance. C Represents acquisition and divestiture-related expenses and integration activities associated with our business combinations, all of which are not considered indicative of our ongoing operating performance. D Represents incremental depreciation expense resulting from truncated useful lives of the assets impacted by our manufacturing footprint assessments and costs related to the closure of certain manufacturing sites, which we do not consider indicative of our ongoing operating performance. E Represents expenses, changes in estimates and insurance recoveries for probable liabilities related to an operational matter in the Mobility Coatings segment, which we do not consider indicative of our ongoing operating performance. F Represents non-recurring income related to the sale of a previously closed manufacturing facility. G Represents benefits related to sanctions imposed on Russia in response to the conflict with Ukraine as a result of incremental reserves for accounts receivable, incremental inventory obsolescence and business incentive payments, which we do not consider indicative of our ongoing operating performance. The benefits recorded during the three months ended September 30, 2022 are related to changes in estimated inventory obsolescence. H Represents costs for certain non-operational or non-cash losses and (gains), unrelated to our core business and which we do not consider indicative of ongoing operations. I Represents the incremental step-up depreciation and amortization expense associated with the acquisition of DuPont Performance Coatings by Axalta. We believe this will assist investors in performing meaningful comparisons of past, present and future operating results and better highlight the results of our ongoing operating performance. J The income tax impacts are determined using the applicable rates in the taxing jurisdictions in which expense or income occurred and includes both current and deferred income tax expense (benefit) based on the nature of the non-GAAP performance measure. Additionally, the income tax impact includes the removal of discrete income tax impacts within our effective tax rate which were expenses of $2.0 million and $3.1 million for the three months ended September 30, 2022 and 2021, respectively. The tax adjustments for the three months ended September 30, 2022 and 2021 include the deferred tax benefit ratably amortized into our adjusted income tax rate as the tax attribute related to a January 1, 2020 intra-entity transfer of certain intellectual property rights is realized. Adjusted Net Income Reconciliation (cont’d)
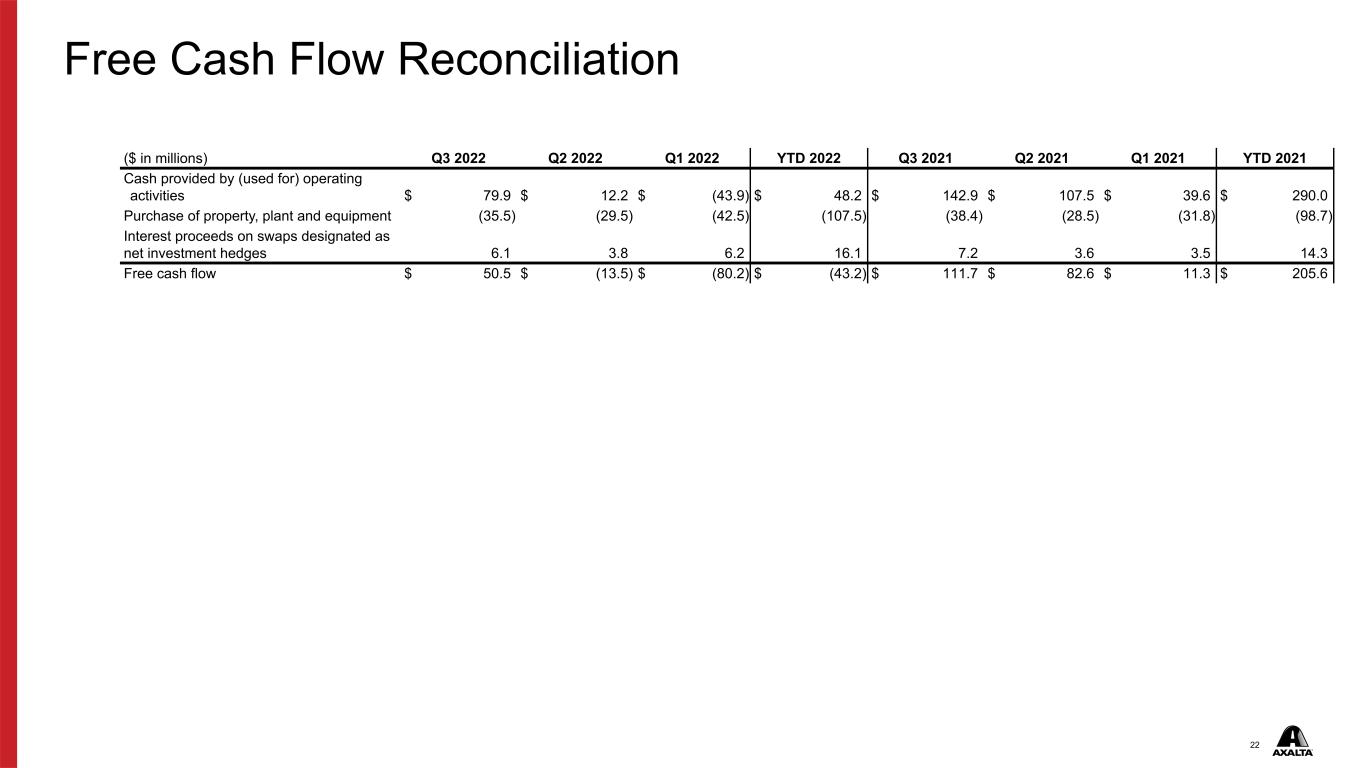
22 ($ in millions) Q3 2022 Q2 2022 Q1 2022 YTD 2022 Q3 2021 Q2 2021 Q1 2021 YTD 2021 Cash provided by (used for) operating activities $ 79.9 $ 12.2 $ (43.9) $ 48.2 $ 142.9 $ 107.5 $ 39.6 $ 290.0 Purchase of property, plant and equipment (35.5) (29.5) (42.5) (107.5) (38.4) (28.5) (31.8) (98.7) Interest proceeds on swaps designated as net investment hedges 6.1 3.8 6.2 16.1 7.2 3.6 3.5 14.3 Free cash flow $ 50.5 $ (13.5) $ (80.2) $ (43.2) $ 111.7 $ 82.6 $ 11.3 $ 205.6 Free Cash Flow Reconciliation

23 ($ in millions) LTM 9/30/2022 Q3 2022 Q2 2022 Q1 2022 Q3 2021 Q2 2021 Q1 2021 FY 2021 Net income $ 201.7 $ 63.3 $ 44.1 $ 40.9 $ 68.9 $ 126.4 $ 15.7 $ 264.4 Interest expense, net 134.6 35.0 $ 33.5 32.6 33.8 $ 33.4 33.5 134.2 Provision for income taxes 60.8 21.8 $ 18.8 11.0 24.4 $ 38.7 3.8 76.1 Depreciation and amortization 311.3 74.5 $ 77.3 77.7 79.3 $ 79.0 76.4 316.5 EBITDA $ 708.4 $ 194.6 $ 173.7 $ 162.2 $ 206.4 $ 277.5 $ 129.4 $ 791.2 A Termination benefits and other employee related costs 11.4 5.0 $ 2.7 1.9 9.6 $ 22.7 2.8 36.9 B Strategic review and retention costs — — $ — — 2.1 $ 2.2 5.4 9.7 C Acquisition and divestiture-related costs 8.3 0.2 $ 2.2 0.4 9.2 $ 1.4 0.2 16.3 D Site closure costs 2.7 0.4 $ 1.1 0.6 — $ — — 0.6 E Foreign exchange remeasurement losses 13.3 5.8 $ 4.9 2.6 (1.3) $ 1.8 1.8 2.3 F Long-term employee benefit plan adjustments 0.5 0.2 $ 0.1 0.1 (0.3) $ (0.3) (0.2) (0.7) G Stock-based compensation 17.2 5.0 $ 3.7 5.3 3.9 $ 4.2 3.6 14.9 H Dividends in respect of noncontrolling interest (0.1) — $ — (0.1) — $ — (0.7) (0.7) I Operational matter 0.6 (0.1) $ 0.1 0.1 (18.7) $ (71.8) 94.4 4.4 J Brazil indirect tax — — $ — — — $ (8.3) — (8.3) K Gain on sale of facility (10.8) — $ — — (8.9) $ — — (19.7) L Russia sanction-related impacts 4.8 (1.3) $ 0.3 5.8 — $ — — — M Commercial agreement restructuring impacts 25.0 — $ 25.0 — — $ — — — N Other adjustments 1.7 0.5 (1.1) 0.7 (1.0) 0.3 — 0.9 Total adjustments $ 74.6 $ 15.7 $ 39.0 $ 17.4 $ (5.4) $ (47.8) $ 107.3 $ 56.6 Adjusted EBITDA $ 783.0 $ 210.3 $ 212.7 $ 179.6 $ 201.0 $ 229.7 $ 236.7 $ 847.8 Adjusted EBITDA Reconciliation
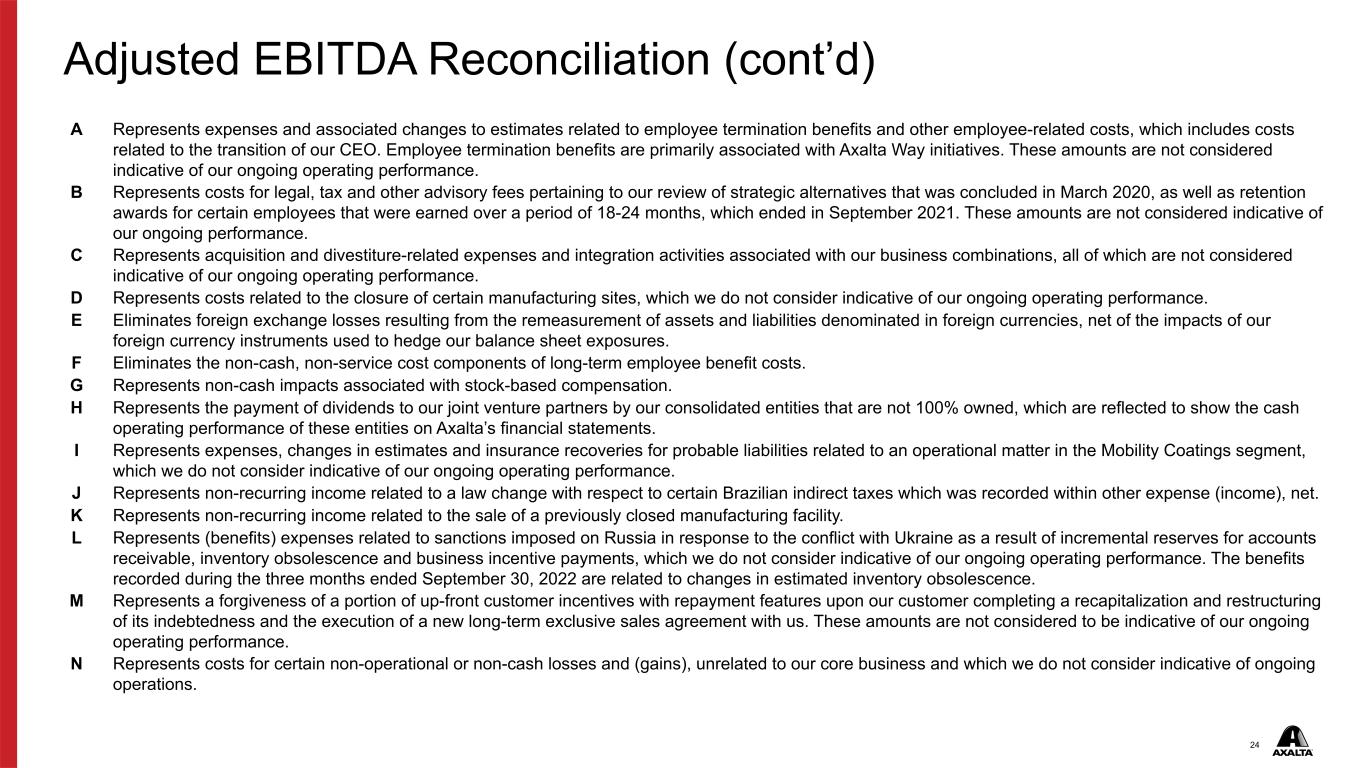
24 A Represents expenses and associated changes to estimates related to employee termination benefits and other employee-related costs, which includes costs related to the transition of our CEO. Employee termination benefits are primarily associated with Axalta Way initiatives. These amounts are not considered indicative of our ongoing operating performance. B Represents costs for legal, tax and other advisory fees pertaining to our review of strategic alternatives that was concluded in March 2020, as well as retention awards for certain employees that were earned over a period of 18-24 months, which ended in September 2021. These amounts are not considered indicative of our ongoing performance. C Represents acquisition and divestiture-related expenses and integration activities associated with our business combinations, all of which are not considered indicative of our ongoing operating performance. D Represents costs related to the closure of certain manufacturing sites, which we do not consider indicative of our ongoing operating performance. E Eliminates foreign exchange losses resulting from the remeasurement of assets and liabilities denominated in foreign currencies, net of the impacts of our foreign currency instruments used to hedge our balance sheet exposures. F Eliminates the non-cash, non-service cost components of long-term employee benefit costs. G Represents non-cash impacts associated with stock-based compensation. H Represents the payment of dividends to our joint venture partners by our consolidated entities that are not 100% owned, which are reflected to show the cash operating performance of these entities on Axalta’s financial statements. I Represents expenses, changes in estimates and insurance recoveries for probable liabilities related to an operational matter in the Mobility Coatings segment, which we do not consider indicative of our ongoing operating performance. J Represents non-recurring income related to a law change with respect to certain Brazilian indirect taxes which was recorded within other expense (income), net. K Represents non-recurring income related to the sale of a previously closed manufacturing facility. L Represents (benefits) expenses related to sanctions imposed on Russia in response to the conflict with Ukraine as a result of incremental reserves for accounts receivable, inventory obsolescence and business incentive payments, which we do not consider indicative of our ongoing operating performance. The benefits recorded during the three months ended September 30, 2022 are related to changes in estimated inventory obsolescence. M Represents a forgiveness of a portion of up-front customer incentives with repayment features upon our customer completing a recapitalization and restructuring of its indebtedness and the execution of a new long-term exclusive sales agreement with us. These amounts are not considered to be indicative of our ongoing operating performance. N Represents costs for certain non-operational or non-cash losses and (gains), unrelated to our core business and which we do not consider indicative of ongoing operations. Adjusted EBITDA Reconciliation (cont’d)