and financial results for the first quarter of fiscal year 2026, after which we will take your questions. Additional information, including the earnings release, the investor presentation that accompanies our prepared remarks, and supplemental slides may be found on our website at passwordfinancial.com. As a reminder, our comments may include forward-looking statements. Those statements are subject to risks and uncertainties that could cause actual and anticipated results to differ. The company undertakes no obligation to update any forward-looking statement. Please refer to the cautionary language in the earnings release, investor presentation, and in the company's filings with the Securities and Exchange Commission, including our most recent filings for additional information covering factors that could cause actual and anticipated results to differ materially from the forward-looking statements. Additionally, today we will be discussing certain non-GAAP financial measures on this conference call. References to non-GAAP measures are only provided to assist you in understanding the company's results and performance trends, particularly in competitive analysis. Reconciliations for such non-GAAP measures are included in the earnings release and the appendix of the investor presentation. Finally, all time periods referenced are fiscal quarters and fiscal years, and all comparisons are to the prior year period, unless otherwise noted. Now let me turn the call over to Brett Farr, our CEO.
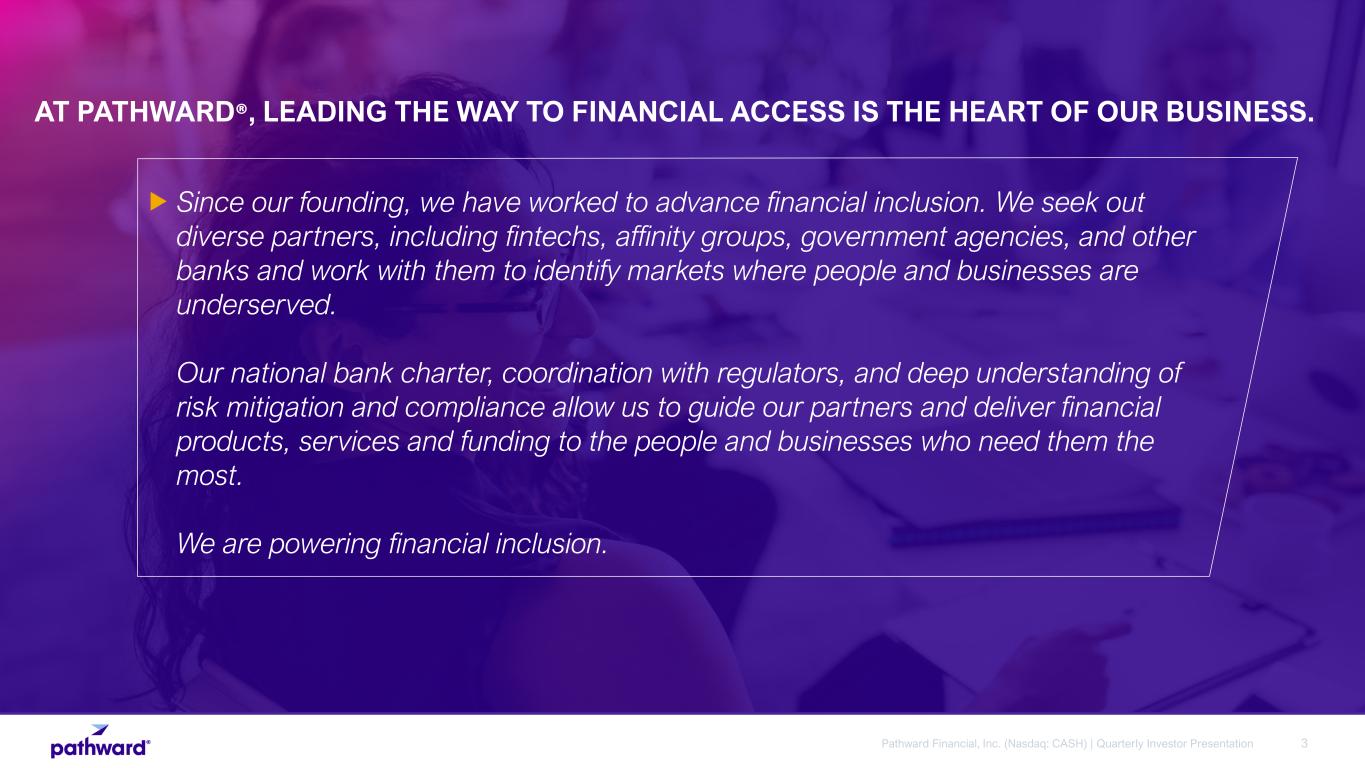
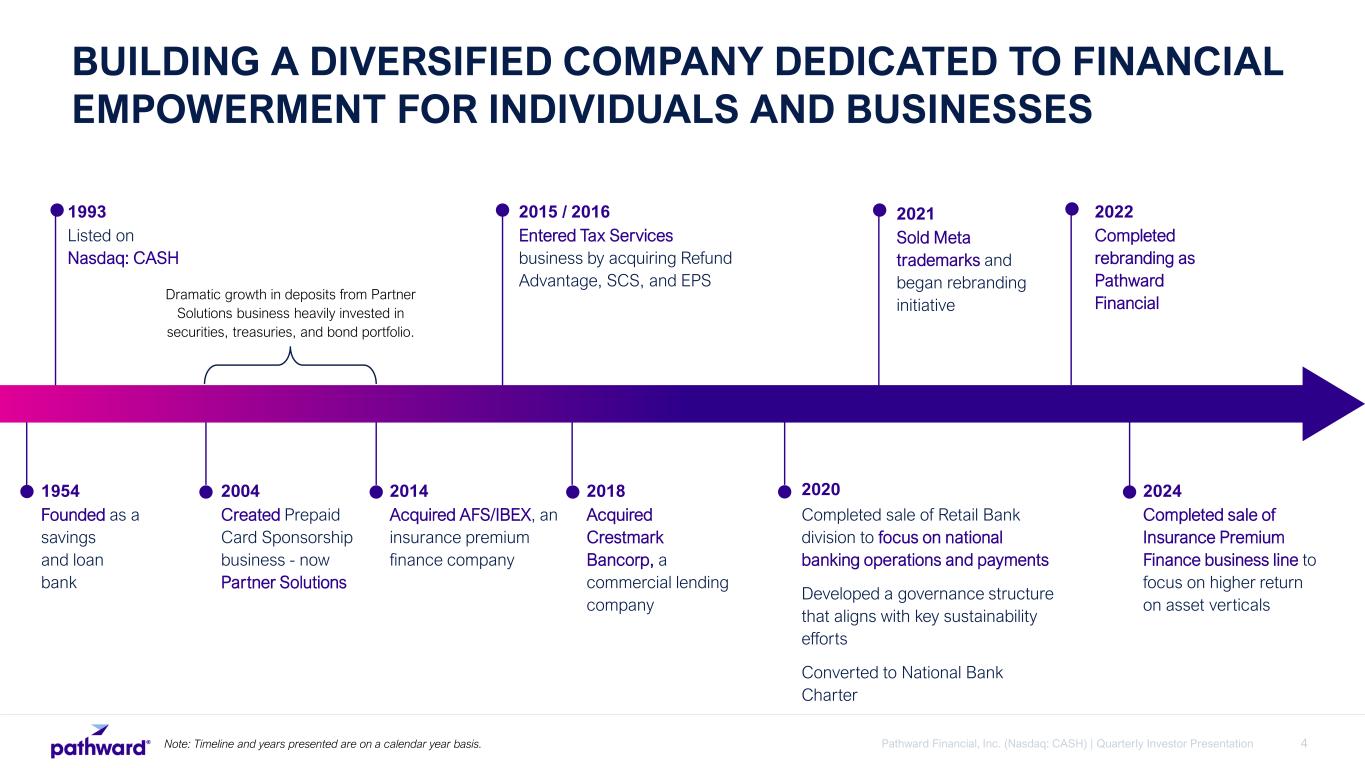
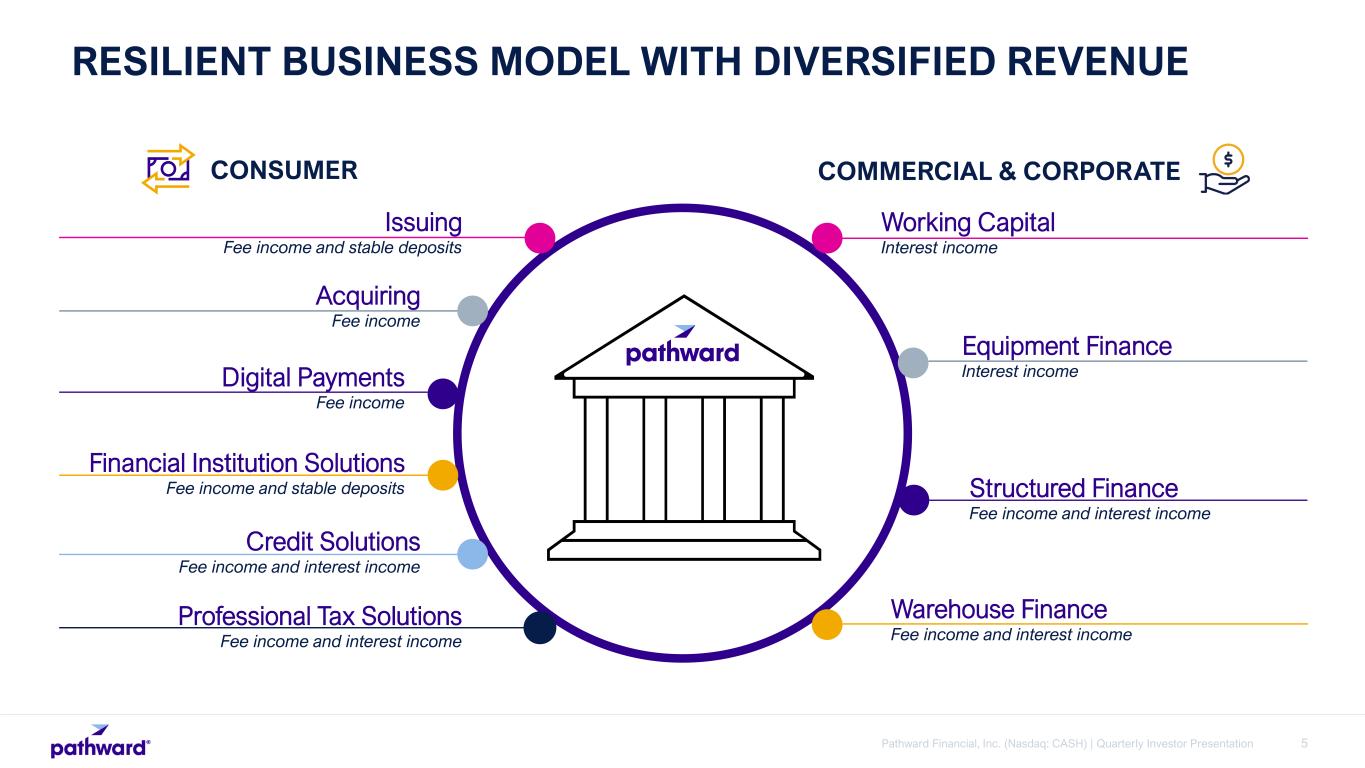
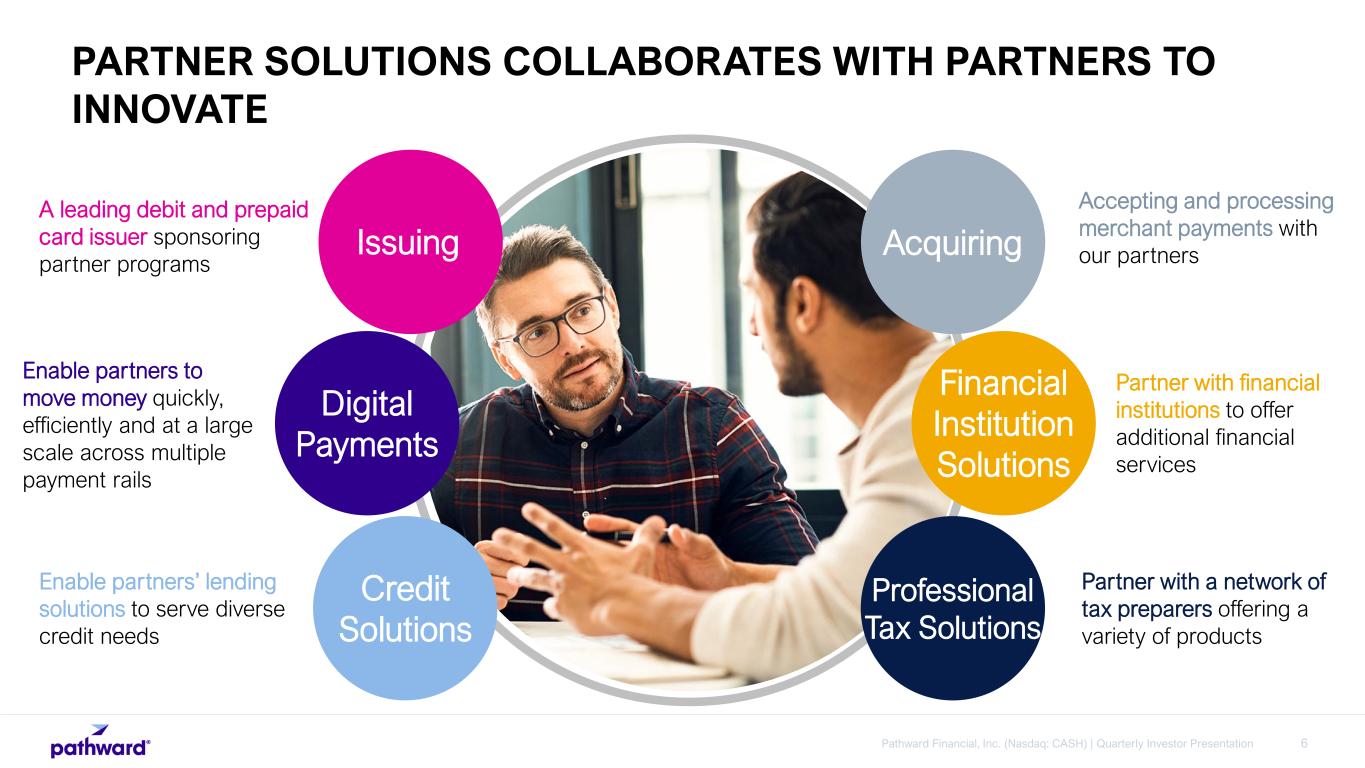
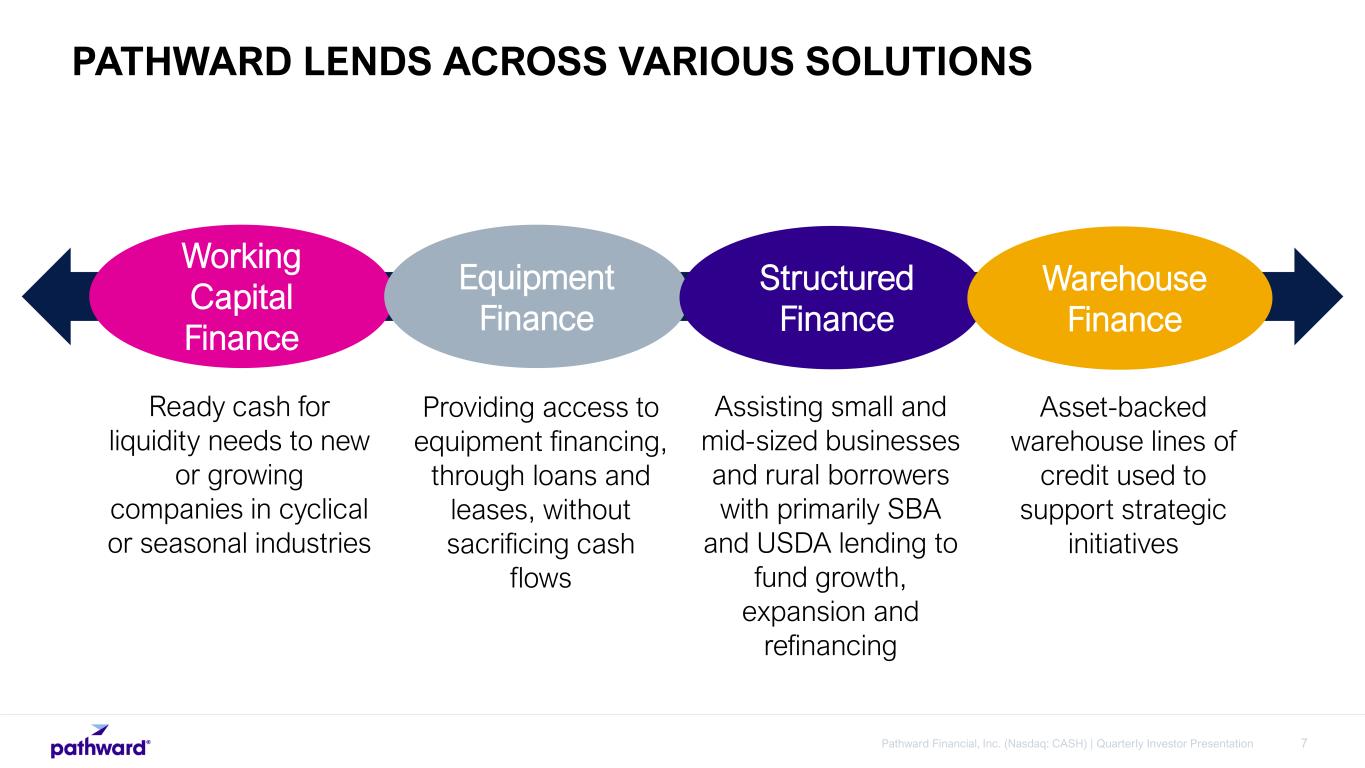
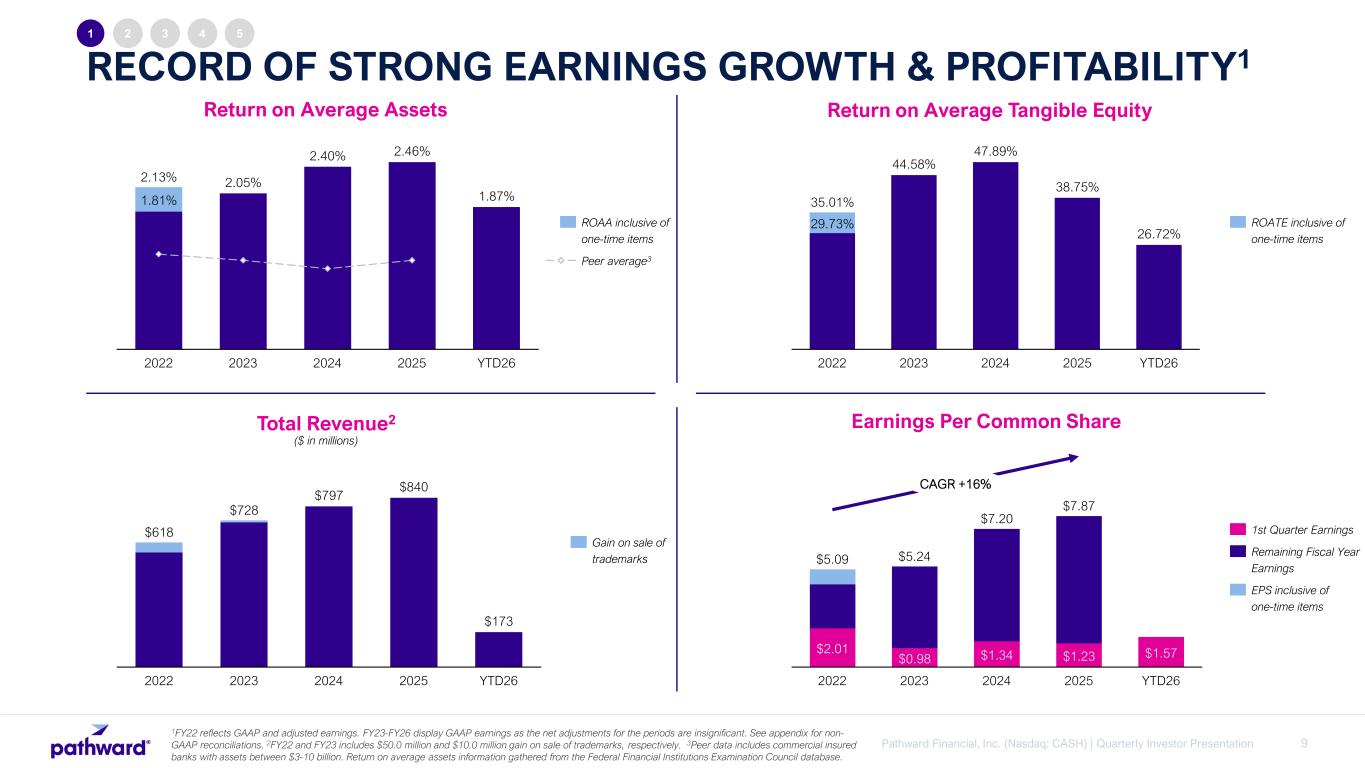
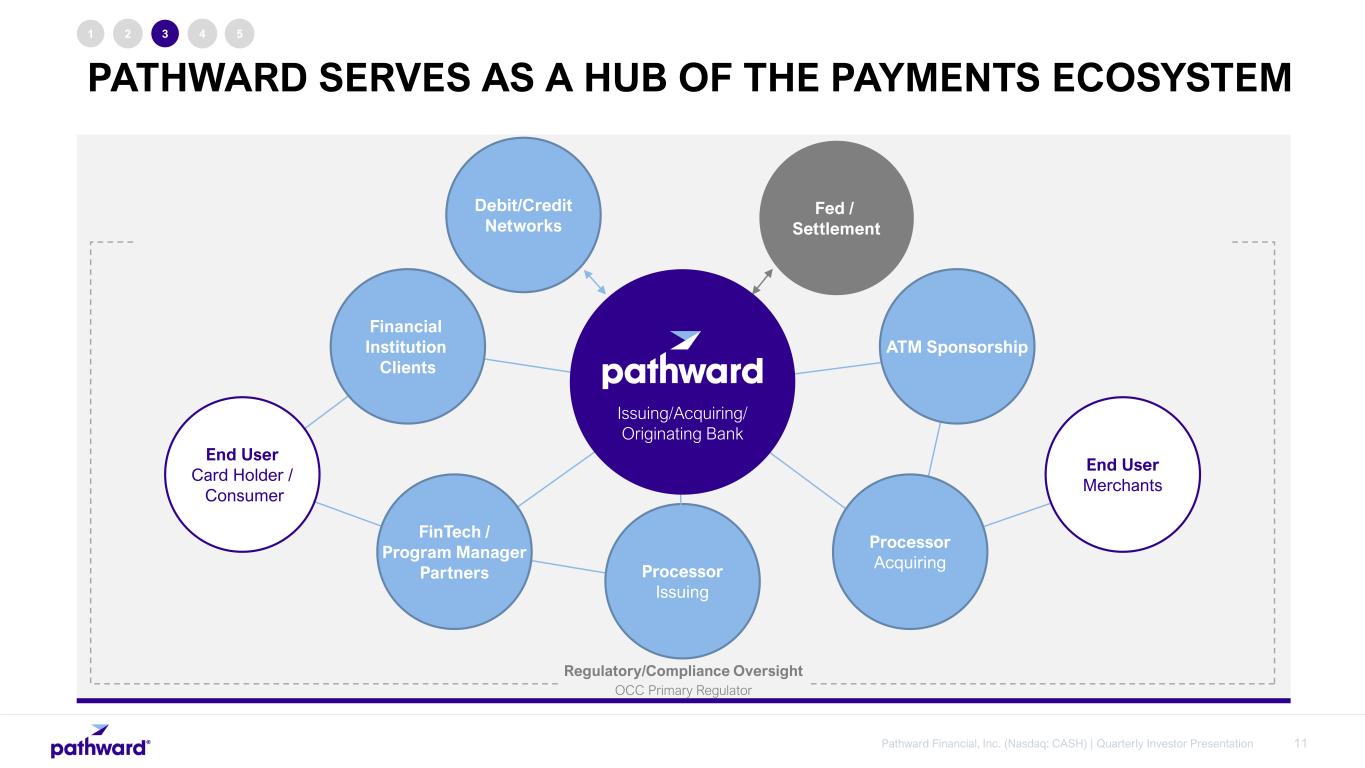
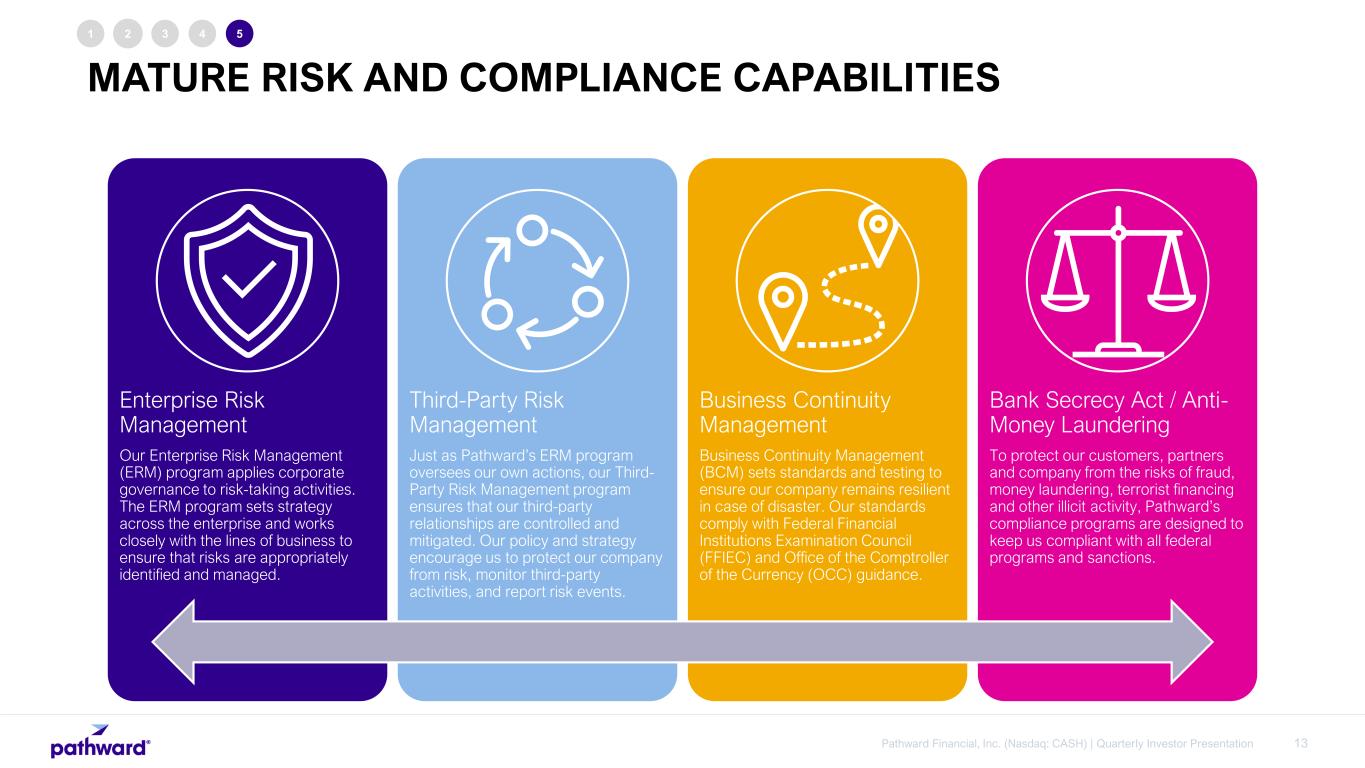
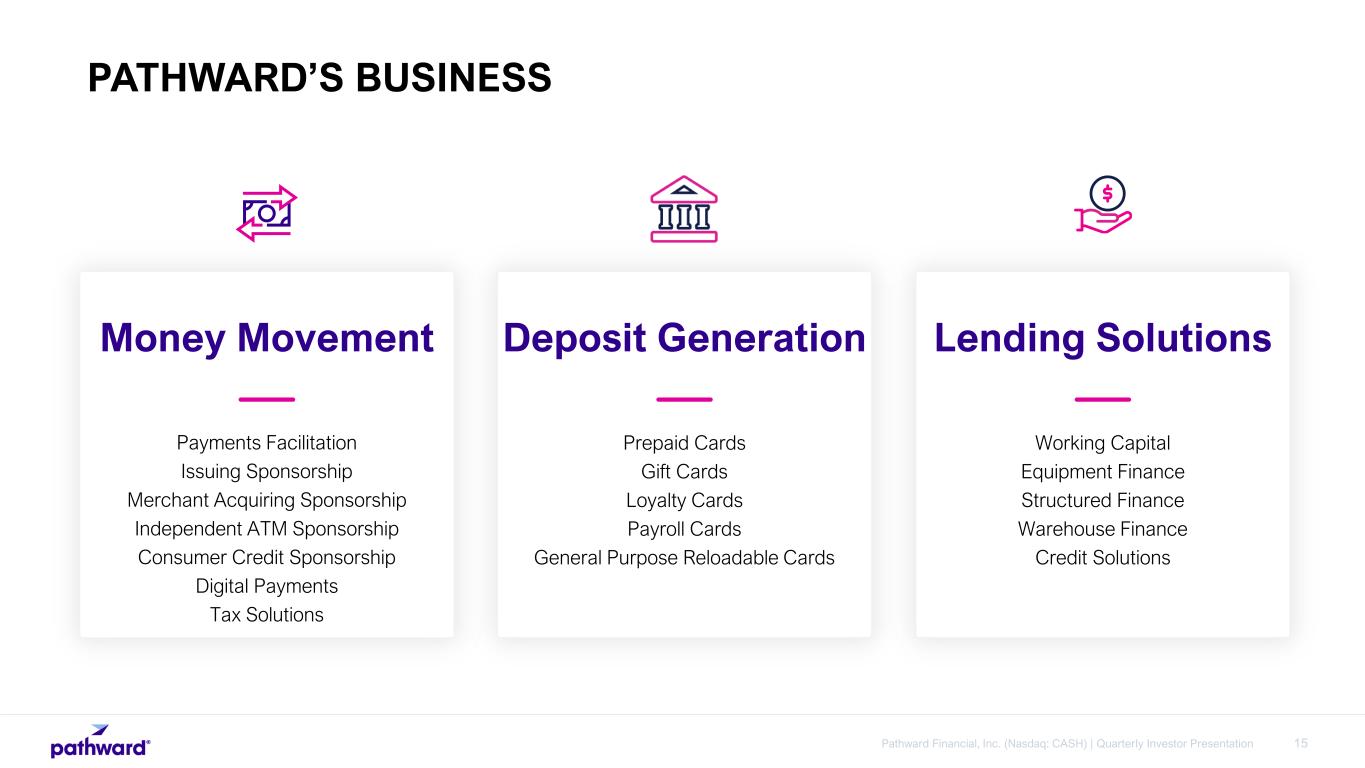
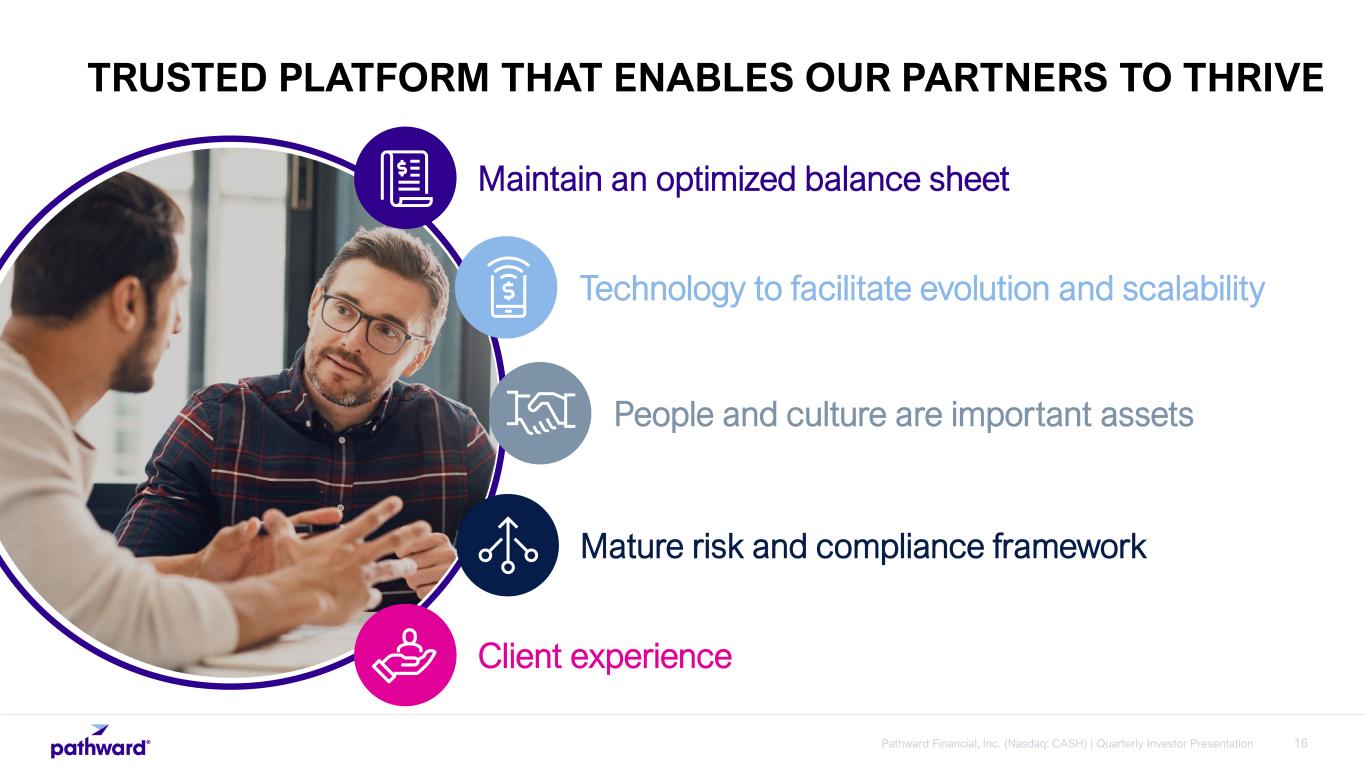
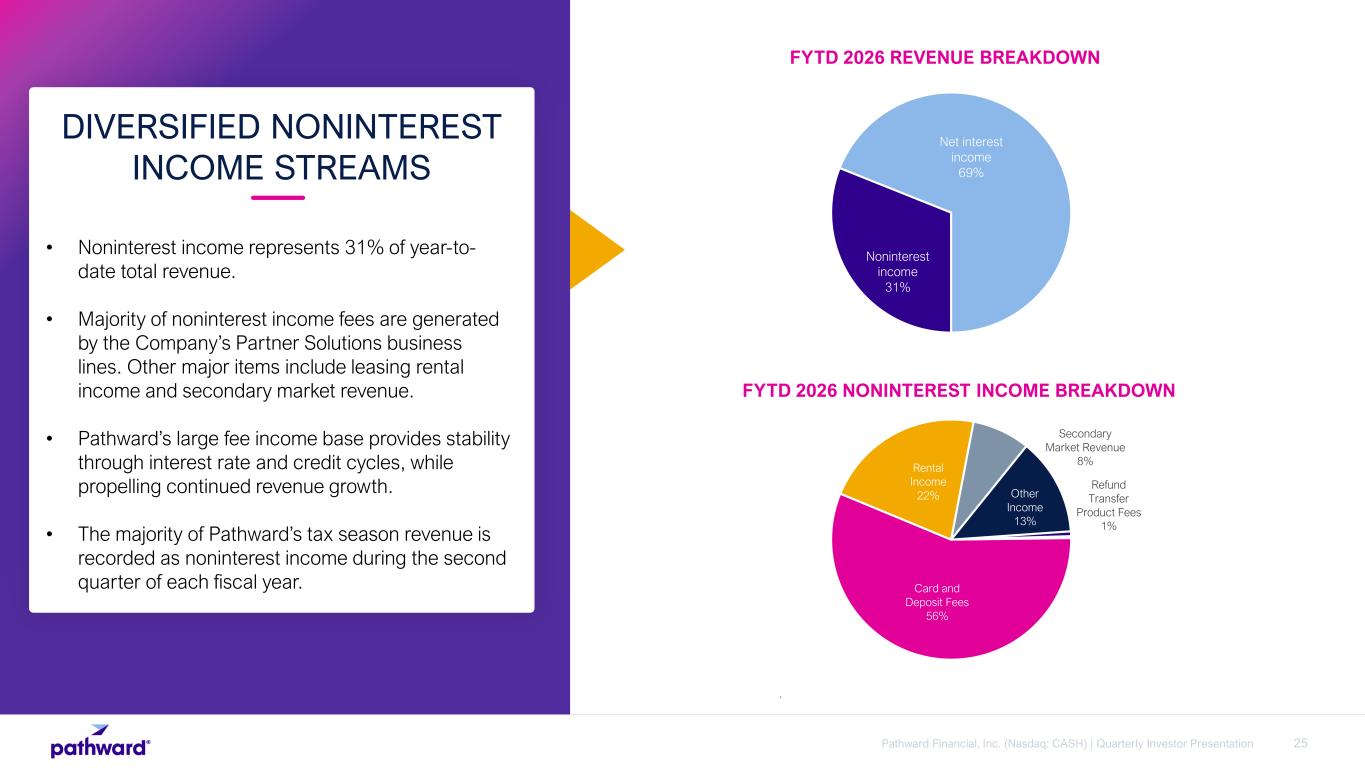
Thanks, Darby, and welcome, everyone, to our earnings conference call. We kicked off the year in a position of strength, and overall, we are pleased with the financial results the team achieved in the quarter. I want to take a moment to talk about what we do, how we do it, and why we believe PathWord is uniquely positioned as a leader in this space. Whether you are an investor, analyst, or another member of the financial community, you likely have an understanding of how a traditional bank works. Banks take deposits from individuals or corporations, lend those deposits, and move money. In this, Papert is no different. Where we differ is how we do those things. First of all, we move money. Where we differ is we work with partners and facilitate payments through issuing sponsorship, merchant acquiring sponsorship, independent ATM sponsorship, sponsorship, consumer credit sponsorship, and digital payments, assisting them with the moving of significant amounts of money relative to our size across the nation. In issuing sponsorship, we move money and facilitate payments via products such as prepaid cards, gift cards, loyalty cards, payroll cards, and general purpose reloadable cards. With over 20 years of experience in payments facilitation, Pathways Value Proposition is anchored in four principal pillars our leadership is seasoned and has deep expertise and payments and sponsorship second our combination of people processes and operating structure delivers a streamlined approach to banking and provides reliable and sustainable partner programs third we deliver partnership with a commitment that enables our partner's success and lastly a consultative governance approach rooted in our stable risk and compliance infrastructure that helps partners manage a regulatory framework that is often complex and difficult to manage second we hold deposits where we differ is that generally our issuing partnerships provide password with stable deposits as one of the most mature and experienced sponsor banks we work with our partners to help them grow and scale and co-create solutions that facilitate innovation. Because of our differences, we are able to generate significant fee income. This leads us to lending. Like other banks, we lend our deposits. However, we specialize in working with businesses that, for a multitude of reasons, may not be able to work with or borrow from a traditional bank. We provide lending products that help these businesses access funds they need to launch, operate, and grow. In some cases, we are also working through partners to originate commercial finance loans. Pathward strengths help us deliver on our purpose of financial inclusion. Our partnerships offer financial solutions that help individuals and businesses who are underserved, underrepresented, or even unbanked. Additionally, as our world grows increasingly dependent and reliant upon digital-first or digital-only solutions, Pathwork's role in fulfilling the needs of these individuals and companies both expands and increases. While at a high level we operate the same as the traditional bank, we believe it is our unique value propositions, partnerships, and position in the marketplace that allows us to help a greater variety of consumers and businesses, as well as generate results that we believe exceed those of a traditional bank this is characterized by discipline balance sheet optimization and fee income working together to generate positive performance last year our return on average assets was over two percent our return on average tangible equity was over 38 percent and roughly 40 percent of our revenue came from non-interest income our business model optimizes our long-term strategy, being the trusted platform that enables our partners to thrive. Our 2026 goals are off to a great start. As part of our commitment to the client experience, we announced the rollout of an evolved operating model last month. We firmly believe this model better aligns with our partners by supporting their growth and scalability and creating a more seamless experience. Each of the respective leaders have strong relevant industry backgrounds and a solid commitment to password culture. We believe this decision ultimately positions our clients for greater success and revenue enablement and the company for increased innovation and growth. Building upon the progress we've made over the last few years, we believe revenue growth will come from three main areas during the fiscal year. It's important to note that we have prioritized areas that are not dependent on growing our balance sheet in order to grow revenue. First, we have additional capacity to optimize the balance sheet through the continued rotation from securities to loans, increasing net interest income without growing the overall asset size. As we continue to optimize, we are also looking at the yields of each asset, and we intend to continue to favor areas where we believe we have a competitive advantage to deliver a higher risk-adjusted return or optionality. This leads of the secondary of revenue growth fee income from balance sheet velocity our business model supports the ability to originate and sell loans thereby generating additional revenue by utilizing velocity for both commercial and consumer loans our balance sheet can remain steady while generating both interest income and non-interest income for the business finally in 2025 we announced multiple contracts for products such as merchant acquiring sponsorship which has little impact to balance sheet that generates non-interest income money movement specifically issuing sponsorship was how password entered into sponsor banking and is still the core of our business with our partners searching for a bank that can provide multiple products outside of issuing offering multi-threaded solutions across a breadth of banking needs is an important differentiator finally tax season has begun and we are one step ahead with over 11 more enrolled tax offices than at this point last year. We do look forward to a number of possible benefits. First, that has to do with the change in tax code for 2025. We believe this change has the potential to drive more consumers into the tax preparation offices that we serve. Second, we exited last year's season with renewed agreements across all of our tax software partners. And finally, we continue to make technology improvements throughout the year for greater efficiencies when compared to years past and look forward to reaping those benefits in 2026. As an industry leader in tax-related financial products, we pride ourselves in offering one of the most comprehensive product mixes in the tax industry, including products and services like refund transfers, refund advances, ERO loans, and facilitating refunds on prepaid cards. We feel confident that we will be able to deliver on our goals and look forward to providing a more robust tax update next quarter. Now I'd like to turn it over to Greg, who will take you through
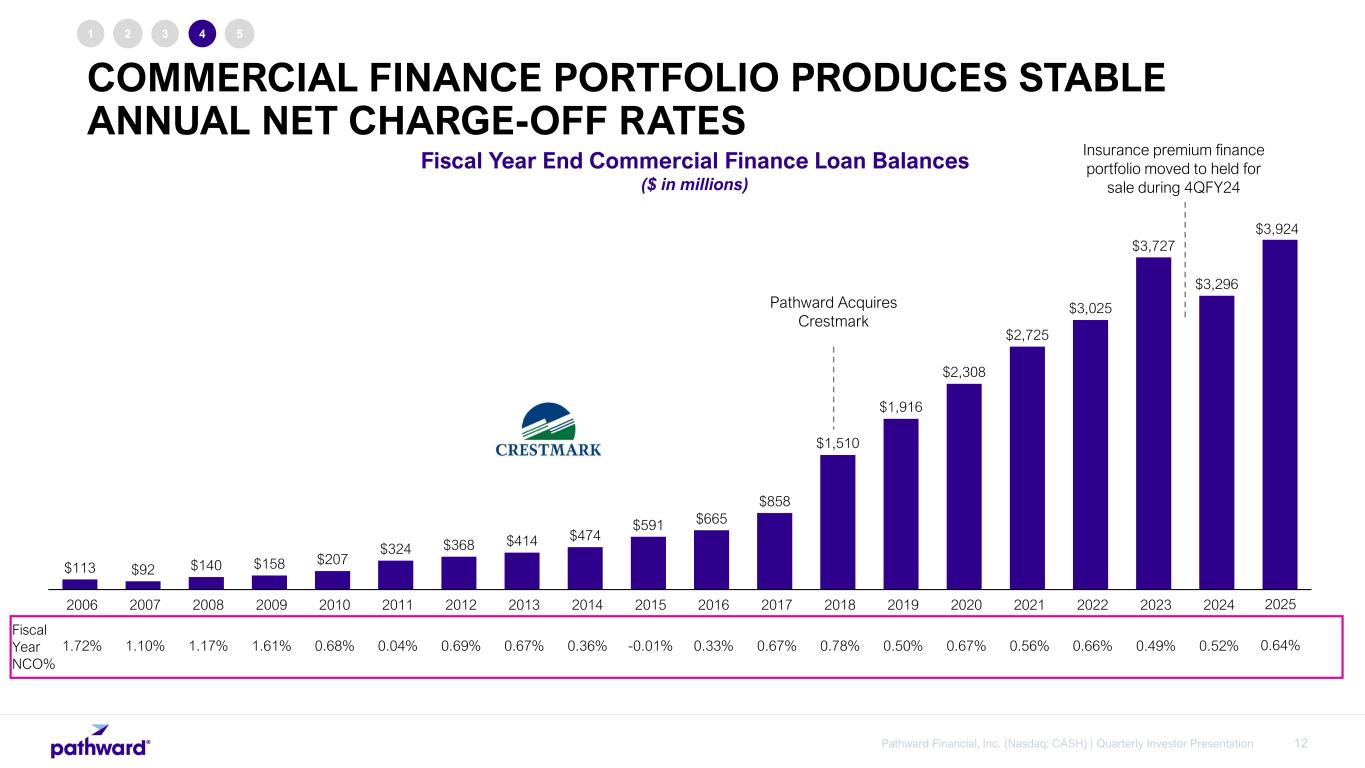
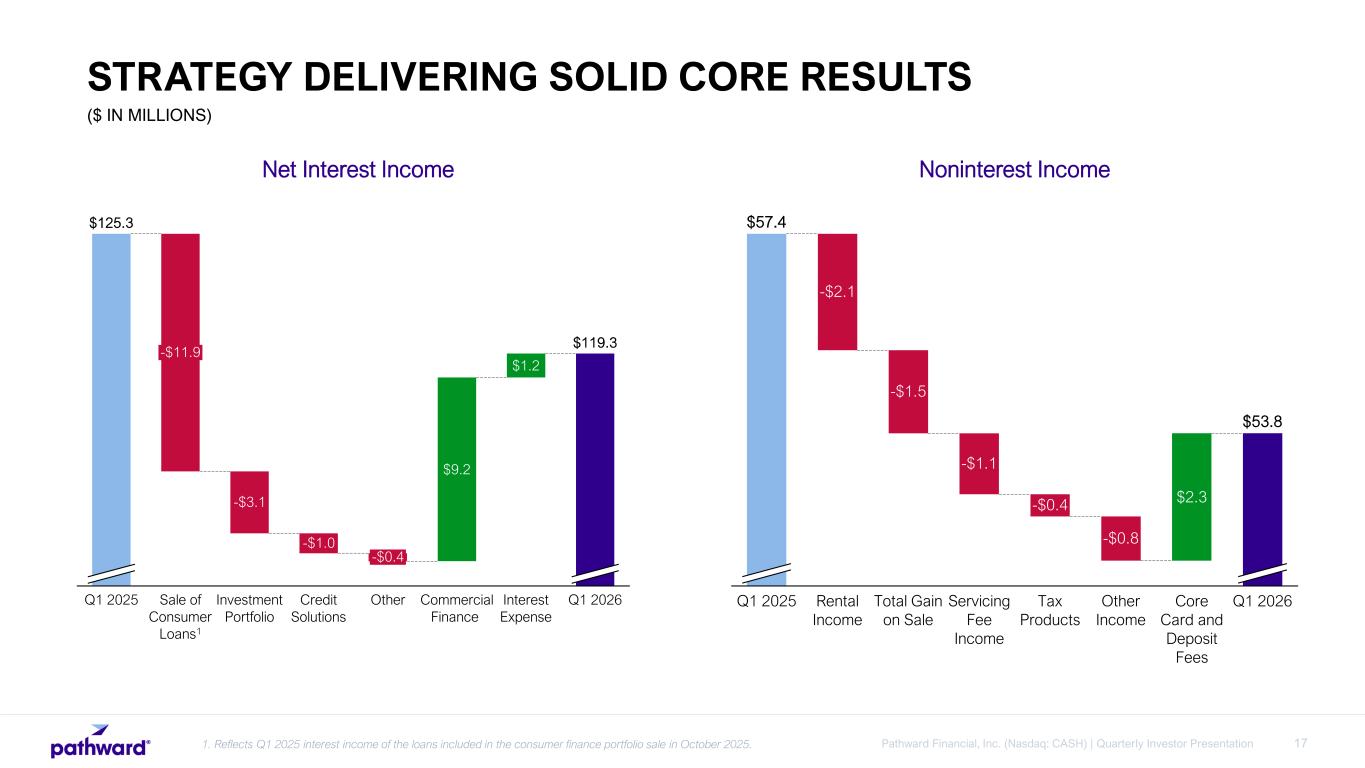
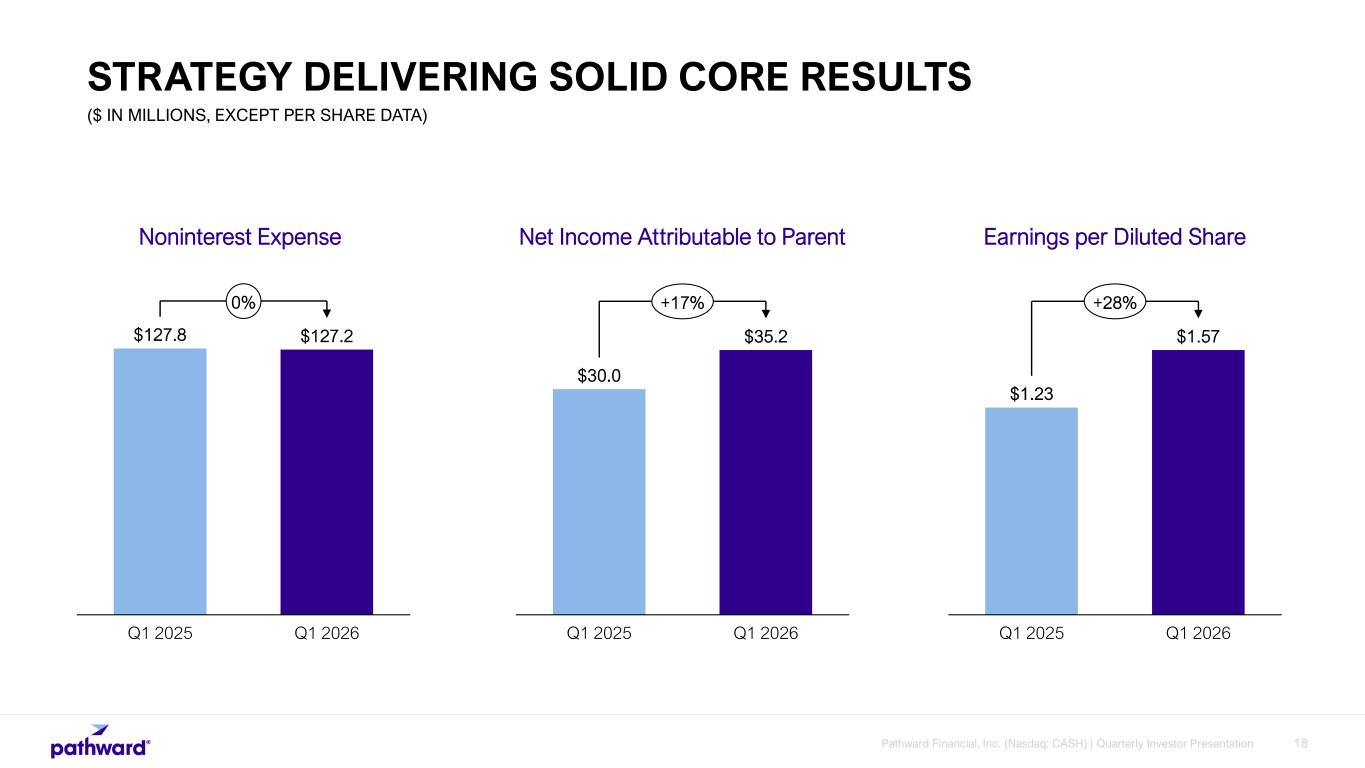
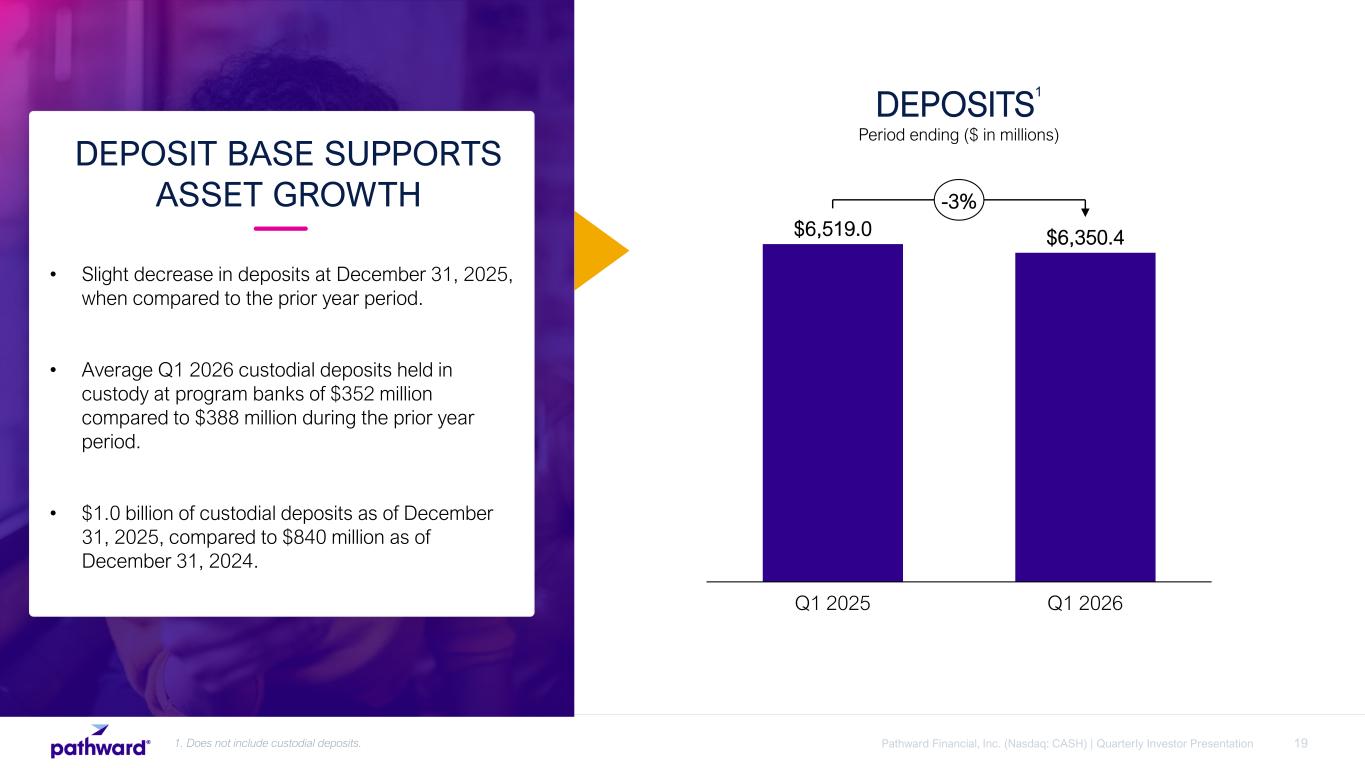
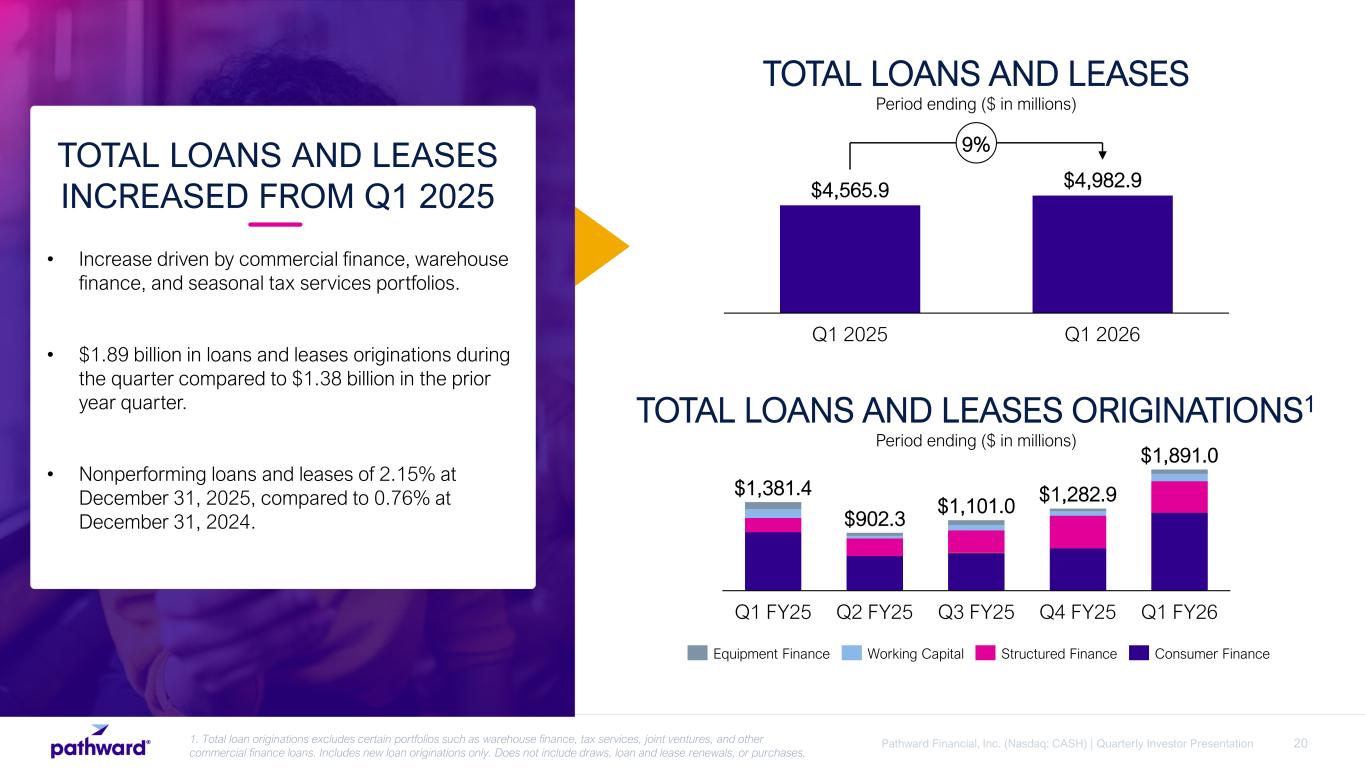
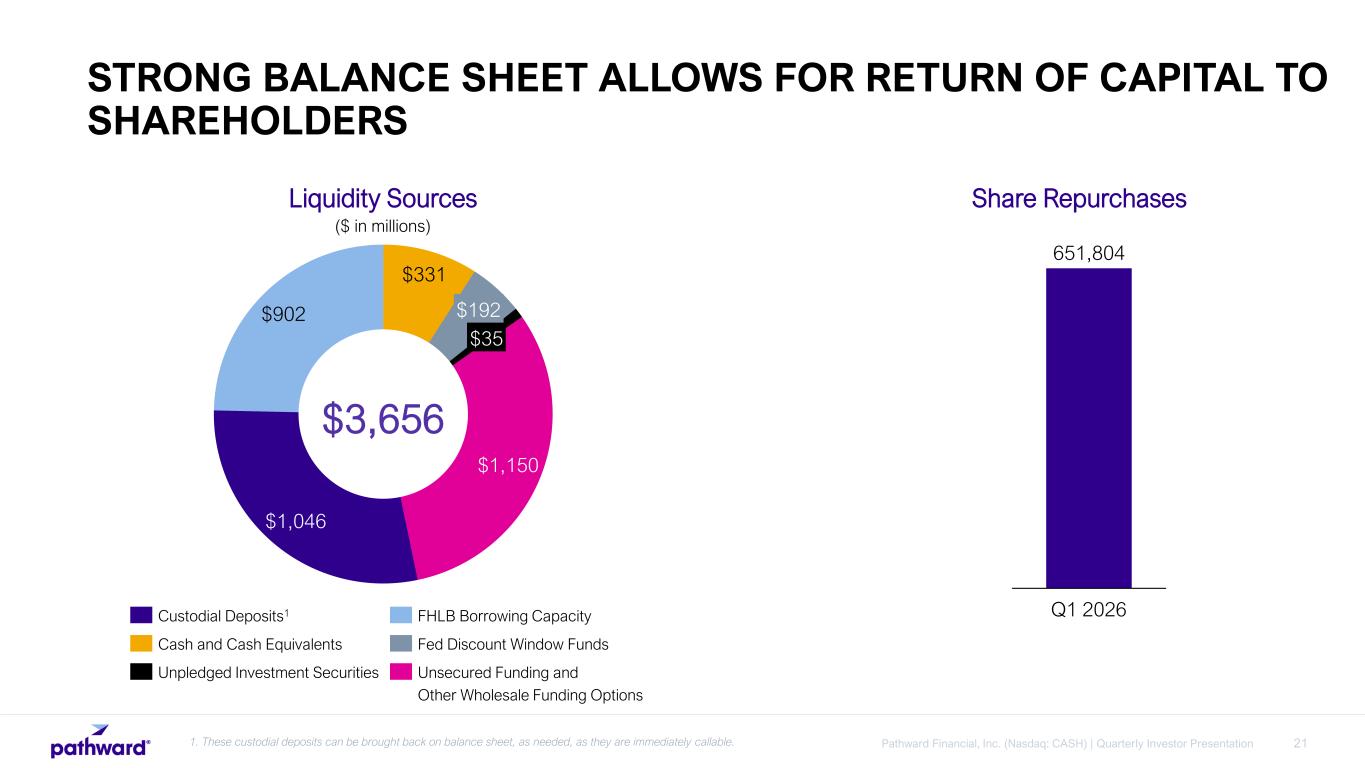
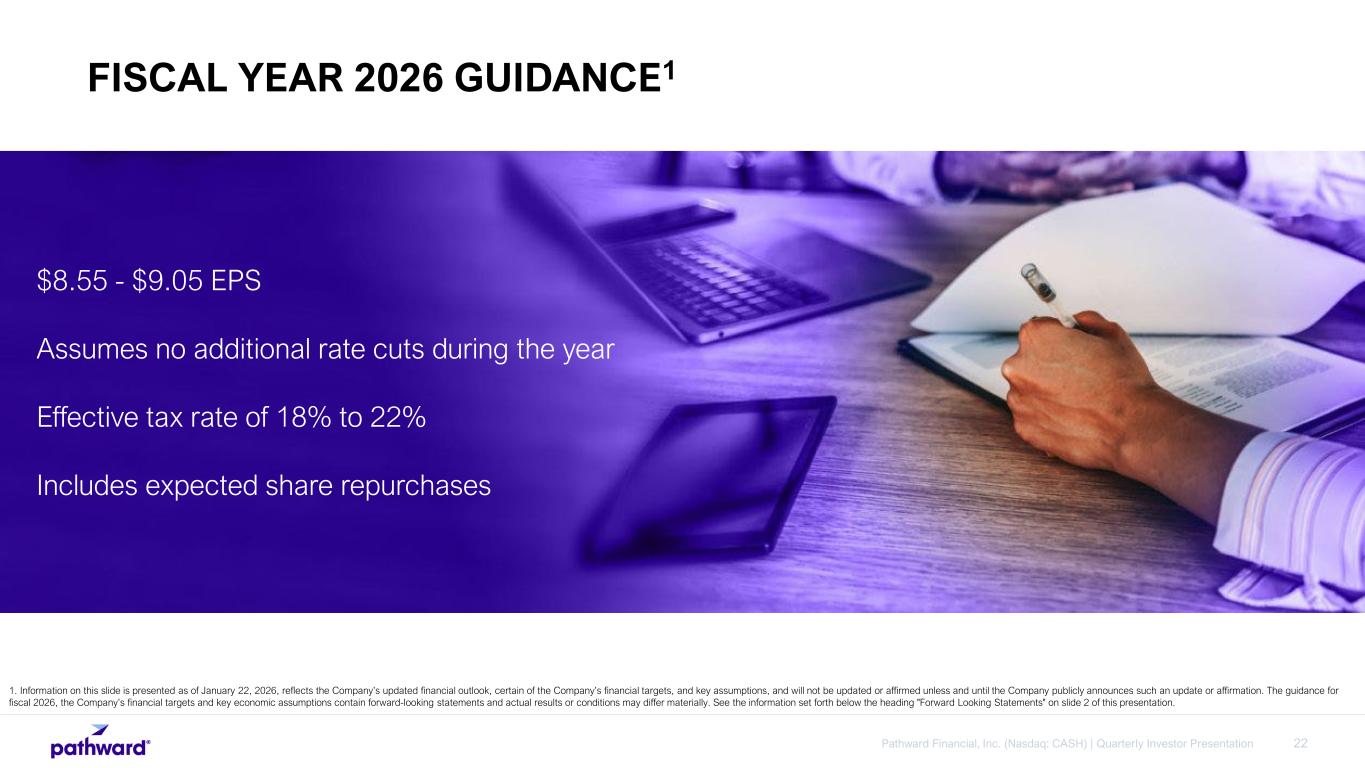
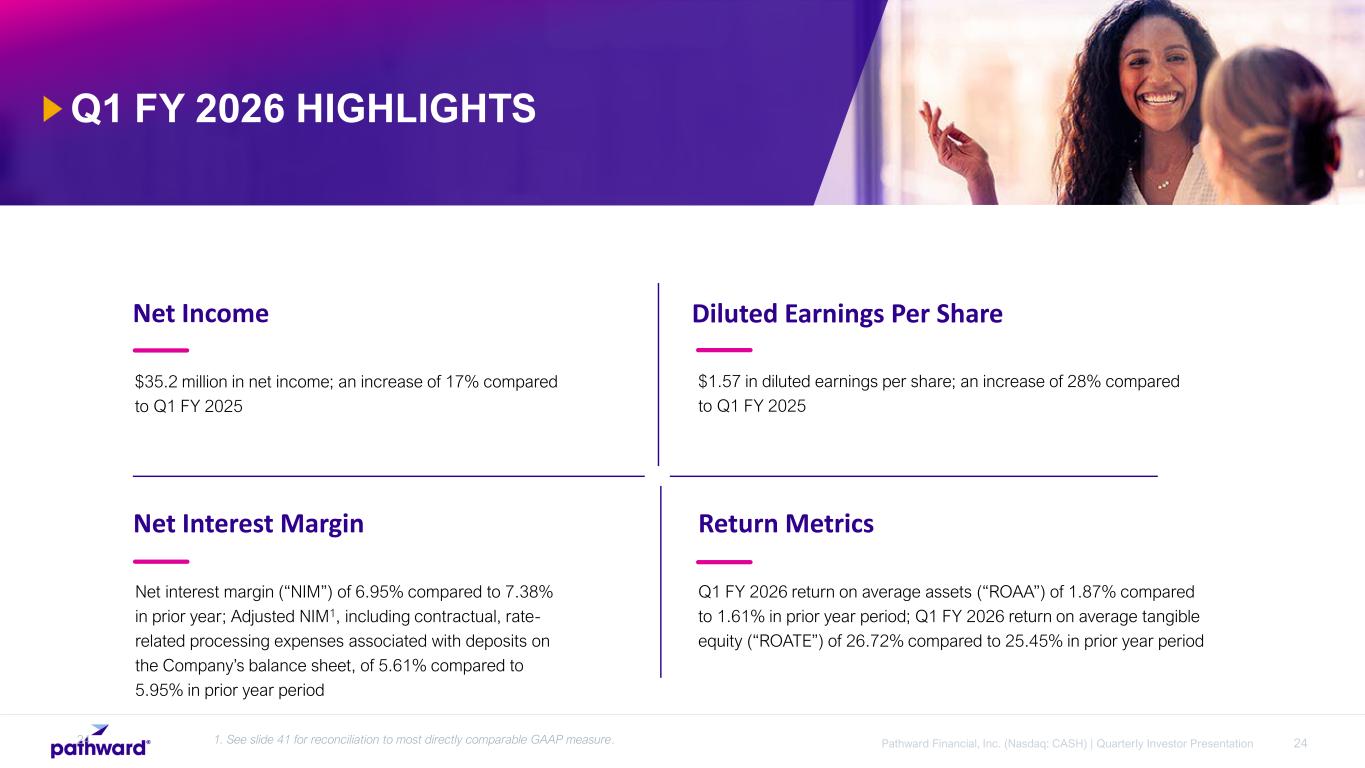
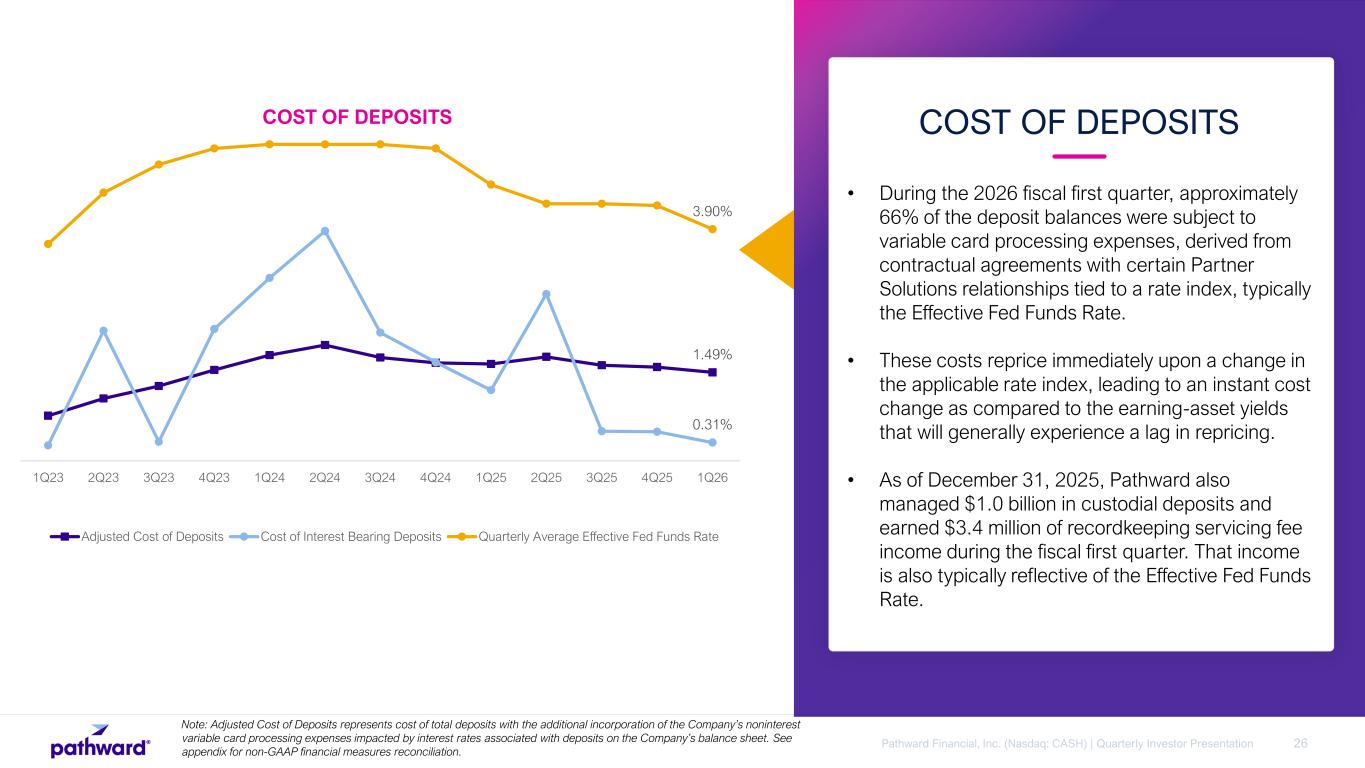
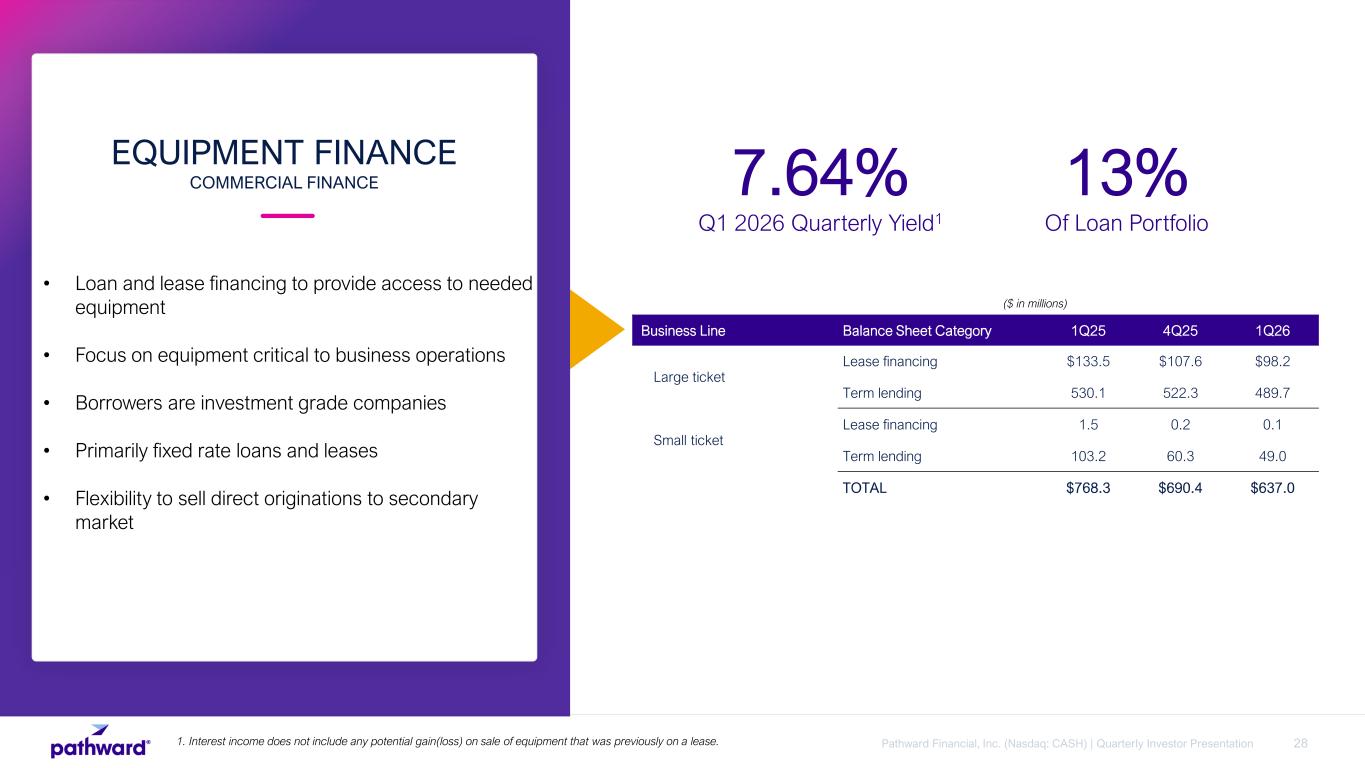
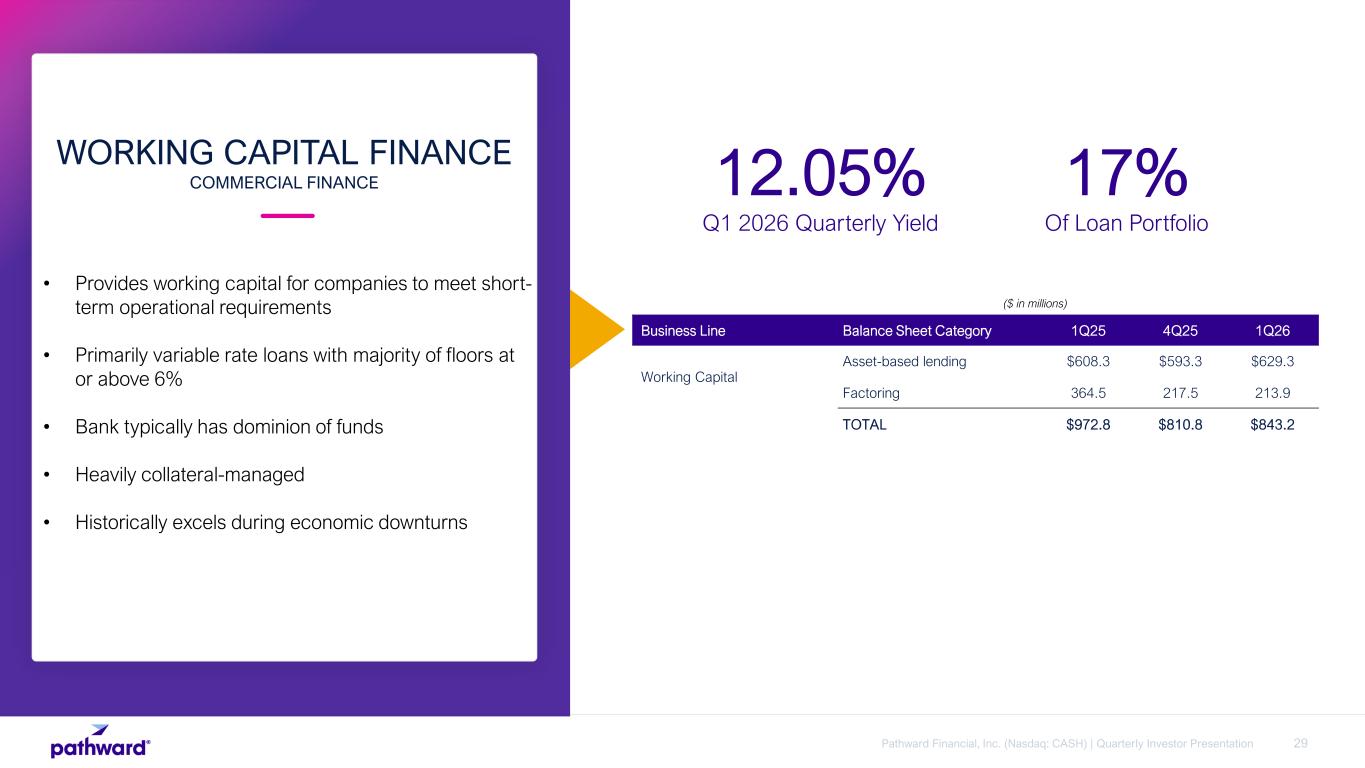
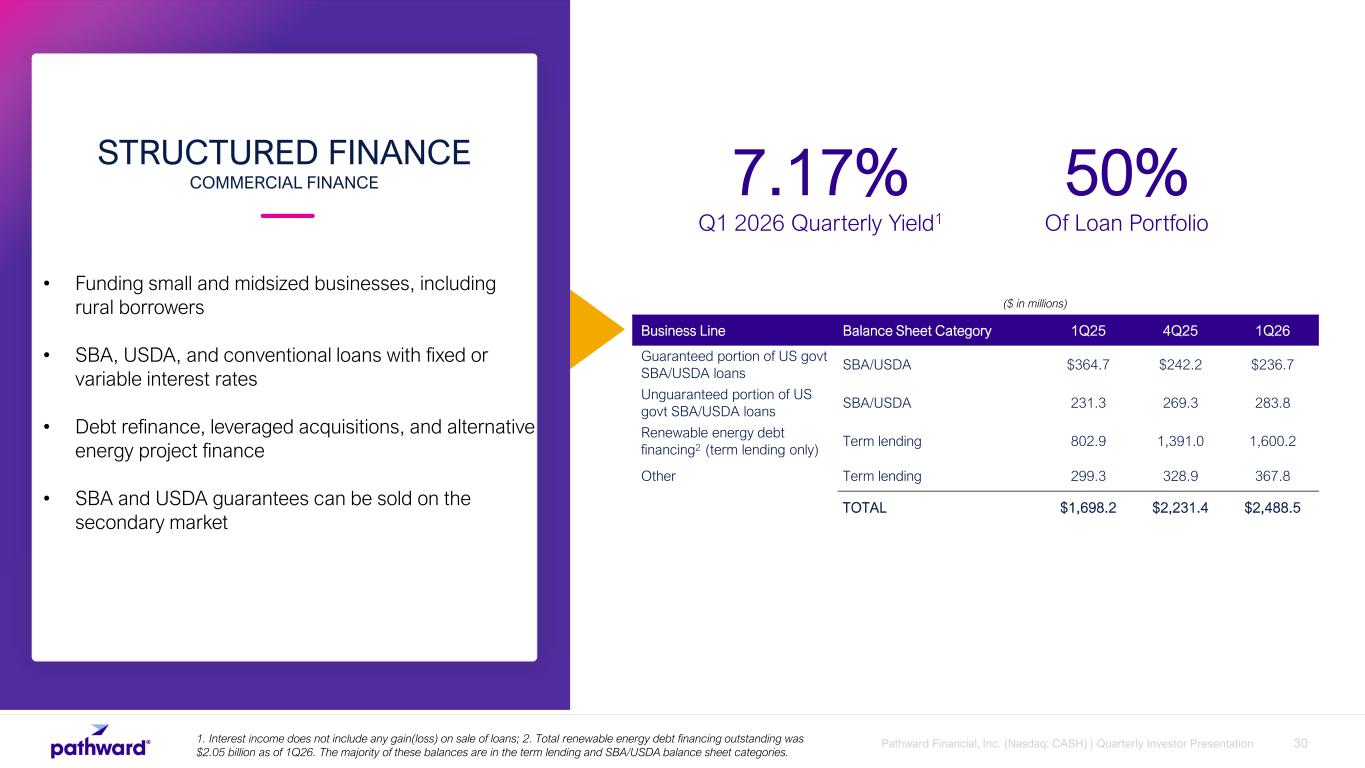
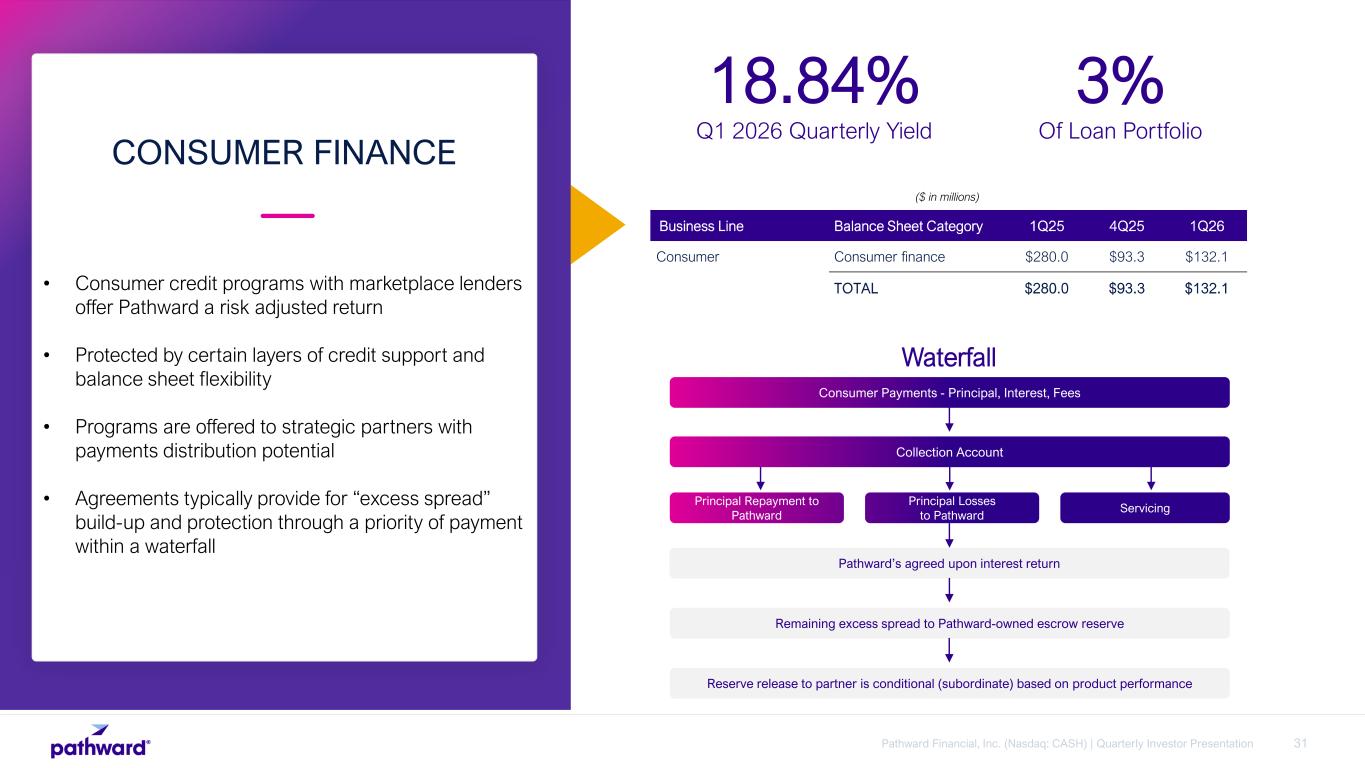
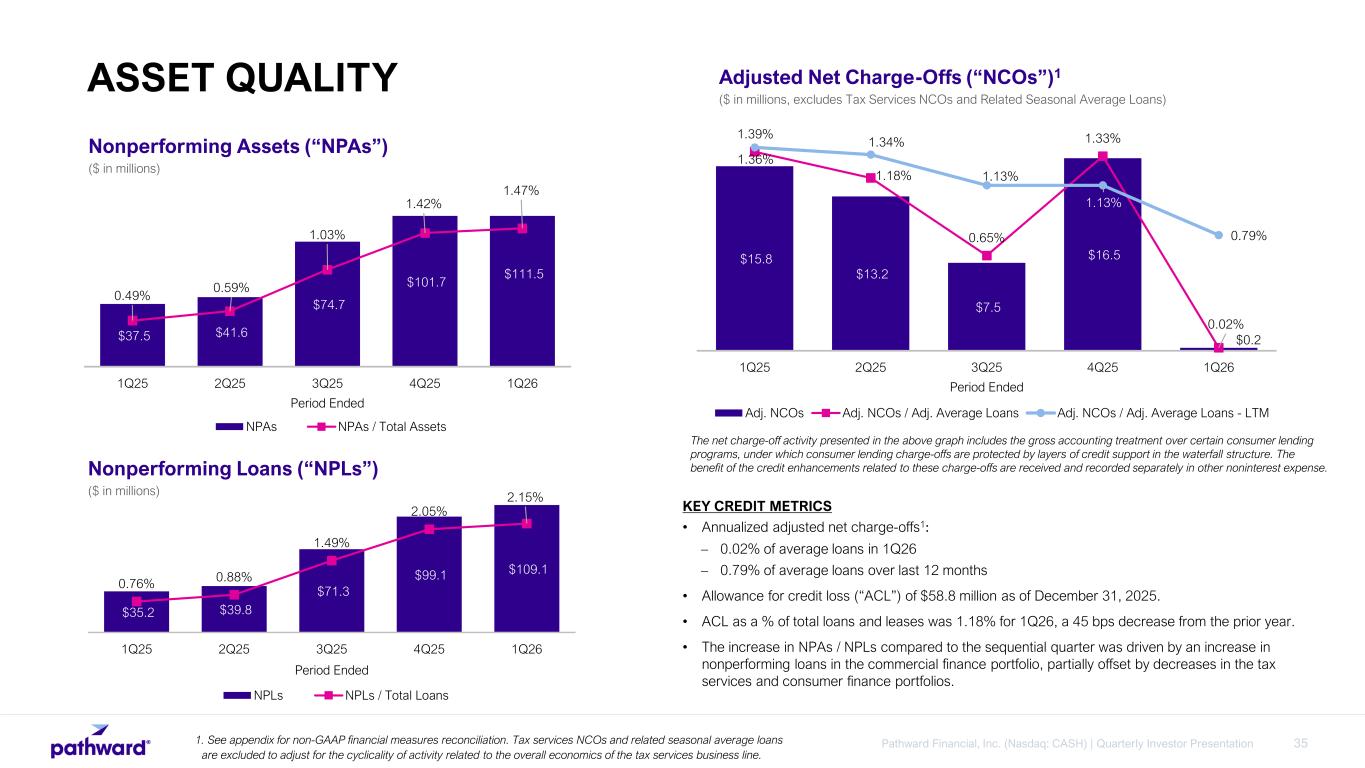
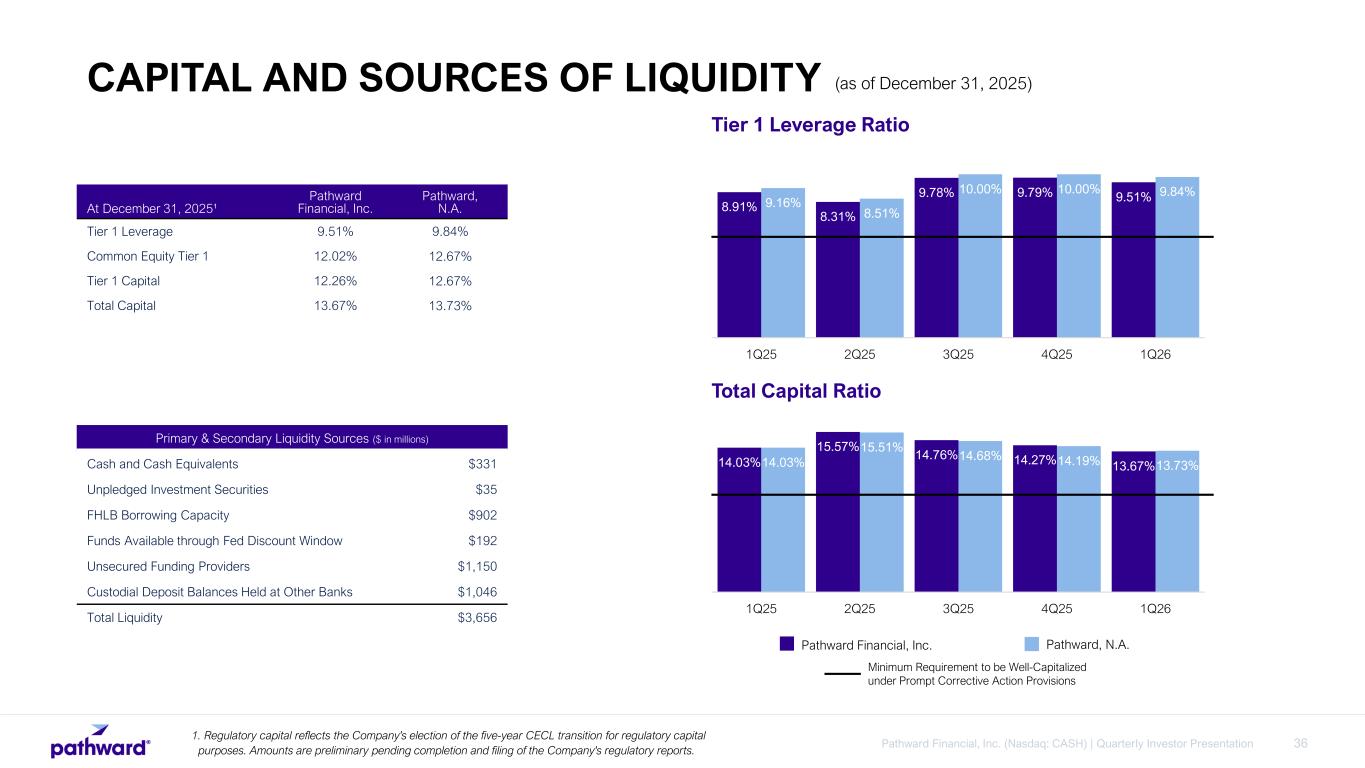
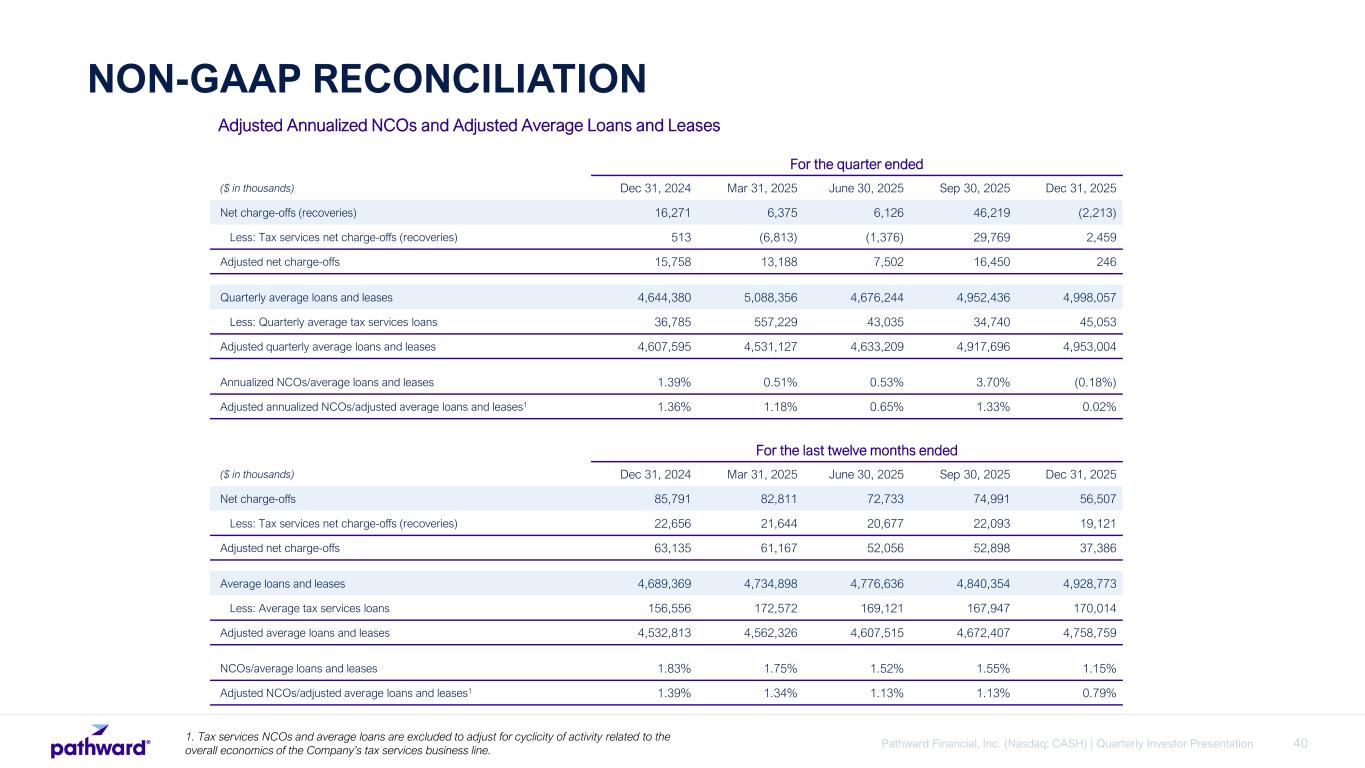
the financials. Thank you, Brett. We were pleased with our results in the quarter, which are marked by solid growth in our core business, growing interest income and commercial finance with a lower provision, increasing core card and deposit C income, and flat expenses. Let me start with the sale of the consumer finance portfolio we mentioned on last quarter's call, which had an impact on several income statement line items including an 11.9 million dollar reduction to net interest income this amount is largely offset by reduced provision and lower other expenses so while optically it appears that these income statement line items are lower year over year the net impact is quite muted similarly net interest margin has been reduced by this gross up amount while the offsetting line items were in areas that do not impact NIM. Within net interest income, contribution from commercial finance increased $9.2 million in the quarter due to higher balances and slightly higher yields given our continued focus on optimization. Provision for credit losses was lower than last year, in part due to a recovery from a commercial finance loan that moved into non-performing during the first quarter of last year. Given our approach to collateral management and monitoring, we are often able to work out or resolve loans that have moved into non-performing status, recovering most, if not all, of the funds. It may take us a few quarters, but this is why we focus more on annualized net charge-offs than non-performing loan volumes. I highlight this because, as we have mentioned previously, this is the nature of our business and an example of why we are comfortable with our credit trends. We reported solid results and non-interest income particularly in core card and deposit fees if you remove the impact of servicing fees on custodial deposits which decreased as expected by about a million dollars we saw good growth in that line this reflects some of the new partners we announced in fiscal 2025 beginning to show up in our revenue numbers due to the government shutdown we fell just shy of our goal range for secondary market revenues but we believe this is just a timing impact and we expect to make that up in subsequent quarters. Finally, we saw a decrease in rental income due to lower balances and operating leases. However, this is largely offset in non-interest expenses in the form of lower operating lease equipment depreciation. Non-interest expenses were well managed during the quarter, coming in slightly better when compared to last year. We saw lower rate-related card processing fees primarily due to a lower rate environment. This led to net income of $35.2 million and earnings per diluted share of $1.57, showing significant increases of 17% and 28% respectively when compared to last year. In addition, annualized performance metrics were also strong for the first quarter, keeping in mind our normal seasonality with return on average assets of 1.87% and a return on average tangible equity of 26.7% compared to 1.61% and 25.5% respectively during the same quarter last year. Deposit sales on the company's balance sheet at December 31st totaled $6.4 billion, which was a $170 million decrease versus a year ago. This was primarily driven by having $200 million more in custodial deposits at the end of the first quarter when compared to last year. Average deposits on the company's balance sheet during the quarter were around $90 million higher than last year's quarter. Average custodial deposits during the quarter decreased slightly when compared to last year. During the quarter, we saw favorable deposit balances at multiple partners due to a strong holiday season and continued partner growth. Loans and leases at December 31st were $5 billion, compared to $4.6 billion last year. The primary driver of the increase was a $531 million increase in commercial finance loans, partially offset by a $148 million decrease in consumer finance loans. Additionally, during the quarter, we originated $1.9 billion in loans, with $678 million in commercial finance and $1.2 billion in consumer finance. We are quite pleased by the growth in consumer originations, which was driven in part by the new contract we announced last year. This loan production is the engine behind our balance sheet optimization strategy, which includes balance sheet velocity. Our non-performing loans ticked up slightly when compared to last quarter. We continue to monitor loans we discussed on the prior quarter earnings call. As we indicated then, these loans are in different verticals and we do not believe represent a systemic portfolio issue. We continue to believe that there is a path forward to resolving these loans in due course over the next several quarters. To reiterate an additional appointment made last quarter, when you compare our historic NCLs to NCOs, we do not believe there's a correlation between them. As I mentioned earlier, because we take a collateralized approach to underwriting and credit management, we generally focus on our annualized net charge offs since we have risk mitigation techniques designed to address past due and non-performing loans built into our lending process. This quarter is a good example of what we are describing. Our total NCOs as a percentage of average loans, when excluding tax services loans, was two bits on an annualized basis. In commercial finance, our net charge-offs were actually a net recovery for the quarter, and our trailing 12-month net charge-offs are at 39 basis points. Our allowance for credit loss ratio on commercial finance was 116 basis points in the quarter, a slight improvement when compared to 118 basis points for the same quarter last year. Our liquidity remains strong with $3.7 billion available, and we're extremely pleased with our position at this point in the year. During the quarter, we repurchased approximately 652,000 shares at an average price of $72.07. This leaves 4.3 million shares still available for repurchase under the current stock repurchase program. We are increasing our fiscal year 2026 guidance to an EPS range of $8.55 to $9.05, which includes the following assumptions. No additional rate cuts during the year, an effective tax rate of 18-22%, and expected share repurchases. This concludes our prepared remarks. Operator, please open the line for questions. Thank you. We will now begin the question
Operator
and answer session. If you would like to ask a question, please press star followed by one on your telephone keypad. If for any reason at all you would like to remove that question, please press star followed by two. Again, to ask a question, please press star one. The first question comes from Tim Switzer with KBW. You may proceed.
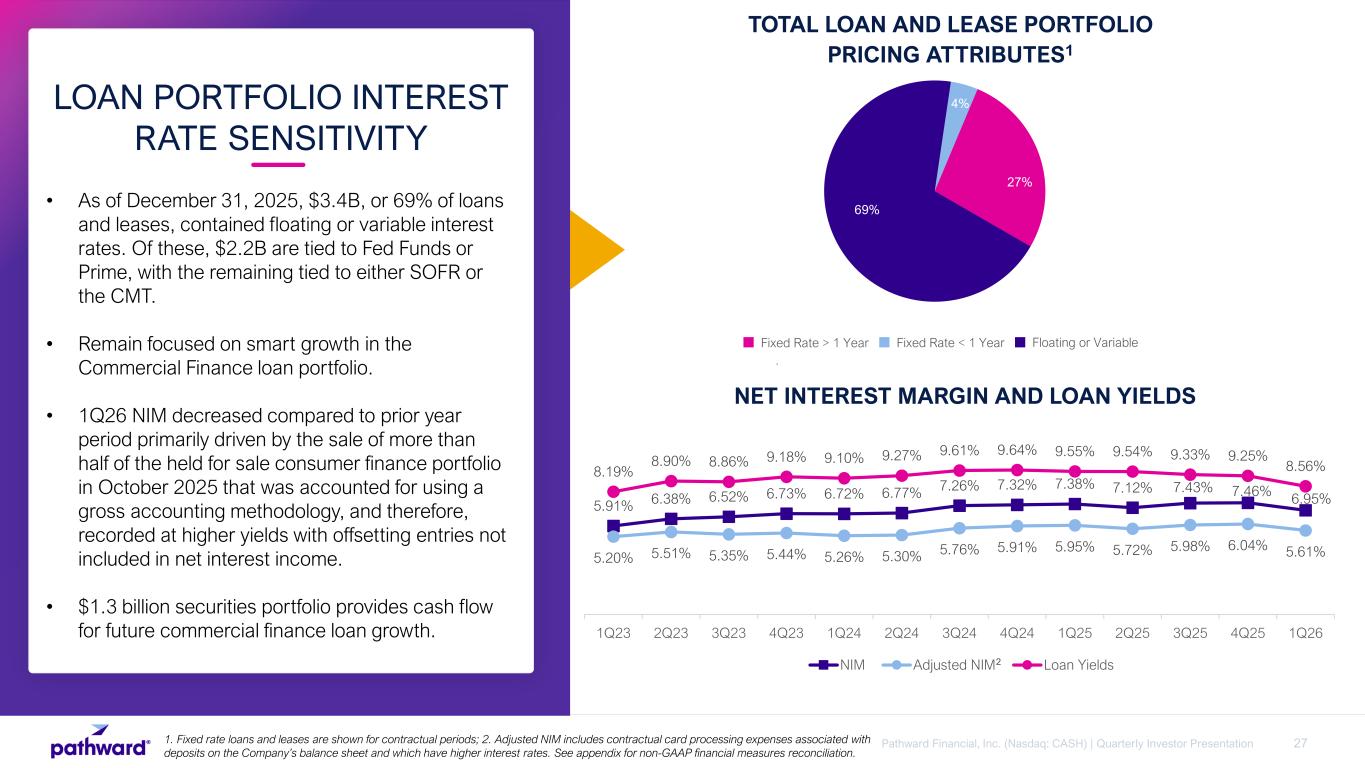
TIM SWITZER, Hey, good afternoon. Thanks for taking my question. TIM SWITZER, Hey, Tim. trajectory a lot of moving parts this quarter which makes sense and i think guys did a good job of laying it out um but you know if we think about the adjusted nim um what is the right way to think about the jumping off point for q2 and then how do we think about this trajectory over the course of the year um within your guide assuming no rate cuts yeah let me give you a
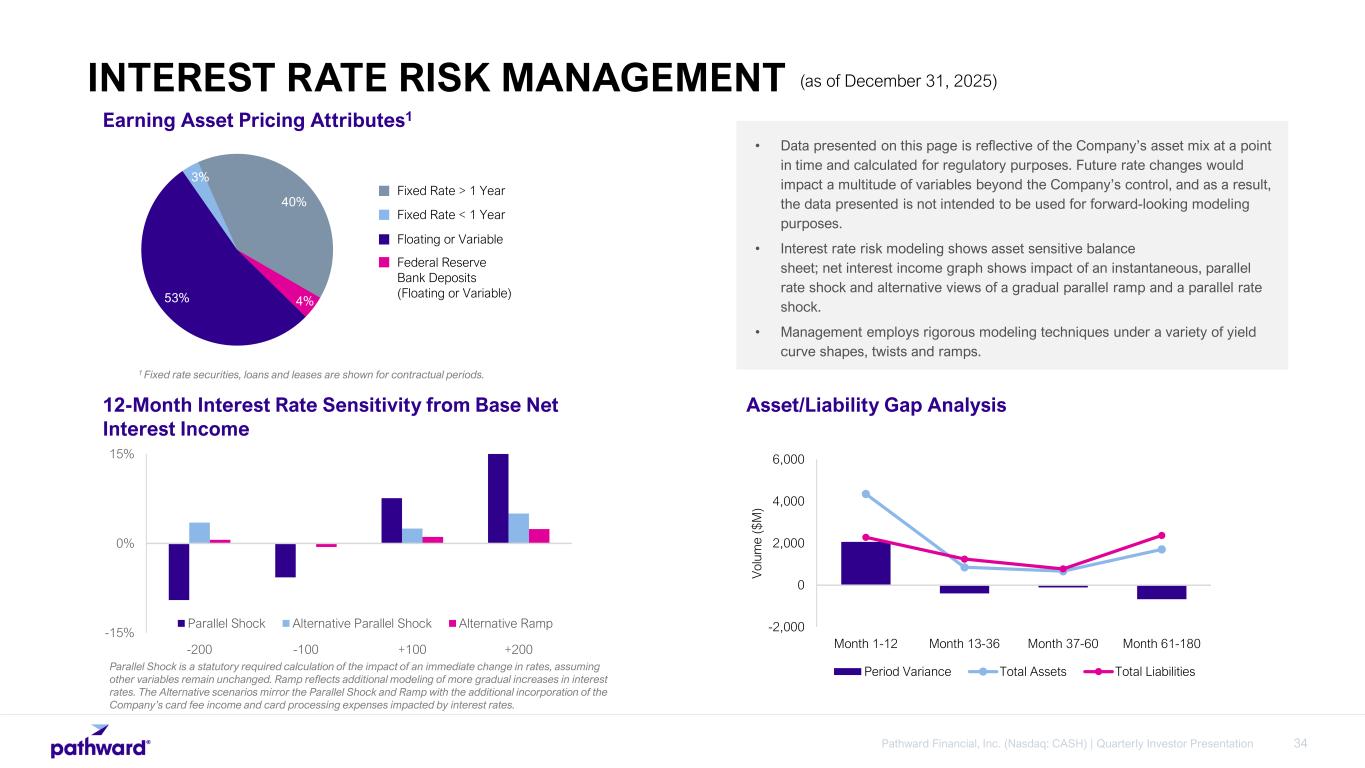
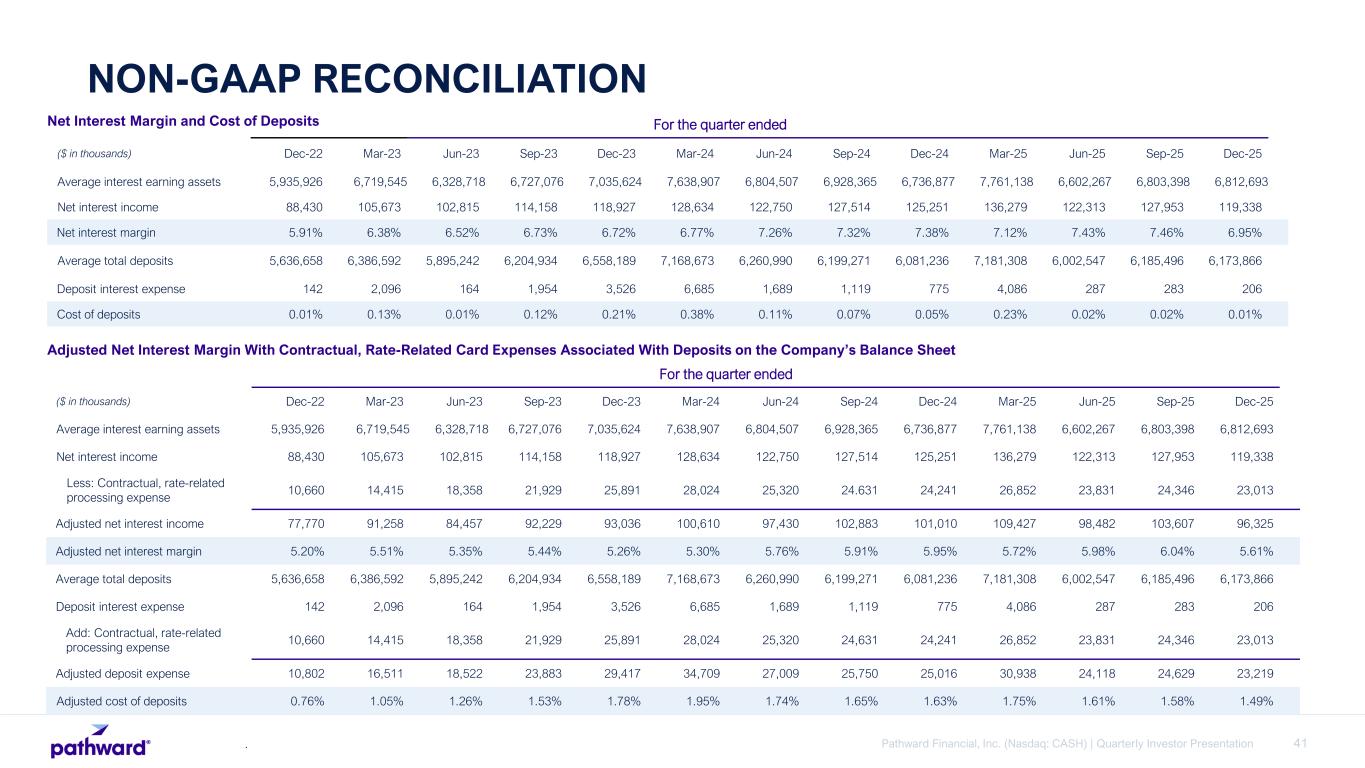
couple of data points first, Tim, that it might help frame the conversation. I think what's given it, you know, a bit harder to look at this core is obviously the gross up we've had on the consumer loans, which are part of that calc, even though the offset's someplace else. So if you strip out all of the impact of the net income and net interest income related to the grossed up HFI consumer loans, you would have had an adjusted NIM of 5.11% a year ago. Last quarter would have been 5.31% and this quarter would have been 5.49%. So you can tell both linked quarter and prior year where the trajectory has been up. As it relates to just interest rate sensitivity in the portfolio though, the story remains the same candidly. Every incremental 25 basis point overnight rate cut continues to have a very de minimis impact on us. We are still very sensitive to the middle part of curve which means that with the steepening we've seen over the last four to six weeks and just where the outlook is the forward curve is on the middle part of the curve i think that 531 is the launch point for the second quarter and again as long as the macroeconomic environment stays you know muted and middle part of the curve is elevated we still have some tailwinds so i think we're flat up from that point okay got it very helpful um and i appreciate all the color
you provided on the credit outlook and the charge-offs. Are you able to quantify what that recovery was that you recorded this quarter within that charge-off? No, I think you'll see the chart
in the earnings release. It just has more of the aggregate number, so it's within that roll forward
on the ACL, Tim. Gotcha. Okay, thanks. Yep. Then another question I had, maybe a little more philosophical, but there's been a lot of discussion lately about fintechs wanting to obtain their own bank charters. I think there was a few more, or not fintechs, but there were a few ILCs announced earlier today. And most of the discussion in the past world has been, you know, how it could be a threat with partners no longer needing a bank sponsor. So could you respond to that? And could you also maybe outline how there might be some
opportunities here um if any yeah so brett how you doing tim um so i i think the way you think about this is is yeah we're in a clearly a more relaxed regulatory environment as relates to getting these charters on it takes a lot of time to build the scale to be able to do the kinds of things that we do even if you've got a lot of dollars behind you and so yes there will be some of the happening, but I think sort of the history longer term has been people that have bought bank charters have often given them back because they realized what they had. Now that's not going to happen under current administration, but it will happen under other administrations as we look forward. We have some partners that have gotten those and then came to us and did additional transactions with us and talked about more because there's very narrow things they can do within those charters and we can do a whole lot more don't forget we have a multi-threaded approach with our partners and that is to offer many different kinds of products and some of these charters are not really going to allow that to happen so a not seeing it b i think it's going to be a long time before it creates any competitive pressure and i also think these things go in cycles and so just uh think about it through the cycle is the way we should think about this kind
of competition got it yeah that all makes sense um and sort of related to this um you know some of the fintechs going to obtain you know more often the custody charter are stablecoin or other digital asset companies and brett you gave a great overview of the business earlier and talked about some of the opportunities i don't think you mentioned digital assets at all is that an area um you guys want to play in and you know what kind of role do you think passwords can play
yeah so there's all kinds of things that we can do um we're already doing some things in the crypto space in terms of onboarding and offboarding to fiat currency etc uh to be clear we don't have hold any of those digital assets today uh but we're looking at all those things now my my sort of personal view is is that this is first a b2b use case and there's a lot of cool things there and we're talking to partners and other material players about ways we can play in that space my view right now is it'll be an additional rail among many rails and we'll continue to work on that and as our partners pull for it and as use cases come forward we'll engage in it because it's definitely part of the future great yeah thanks for all the color
Operator
Thank you. Our next question comes from Joe Yajunas with Raymond James. You may proceed.
Good afternoon. Hey, Joe. Hey, Joe.
So, in your prepared remarks, you talked about, you know, a lot of the new partner announcements in 2025, and it looks like they're really just starting to impact the P&L. You know, I was wondering if you could unpack the amount of kind of embedded growth from this cohort of partners that hasn't yet showed up in your financials yeah i mean i'd be happy to and
as you you recall from last quarter i mean these kind of span the gamut from you know merchant acquiring might have been an issuing deal or two in there and one up in the credit solution space and each of those has a different uh path to time to revenue and we're obviously uh uh onboarding all of all that entire cohort as rapidly as we can and then each of those programs need to build right but once each of those programs is launched and live i would expect contribution to a full 12-month run rate on the card fee line to be somewhere in the middle to high single digits and that's just based upon those programs and i think as we talked about last quarter we are still actively working on multi-threaded approaches with many of those that we've announced too so that cohort alone again mid to high single digits and we're seeing what we can how we can scale from
there. Yeah Joe this is Brett. I mean we're uh we're getting very enthusiastic about the pull through on these partners and others we're talking both uh existing and future. Um you know we went through a period of time where there was some crazy pricing and structures in this particular industry and we chose to abstain but that's long been washed out and these things are picking up and we've we've often said to you takes a little time for the programs to build uh this quarter you're you're seeing it and you know we're there's a reason we're saying what we're saying about guidance we're seeing it happen and we'll continue to think about that through the rest of the year as we go on this is uh this is an upbeat time for us and that's what we're thinking about these
partners and others we're talking about perfect and i'm going to get to your updated guidance in a moment i just want kind of wanted to pick out something you just said there so you just talked about the washout of the irrational pricing and you're starting to see some normalization from partners what does your current partner pipeline look like today and should we expect a similar number of announcements you know in the calendar year or fiscal year ahead
i mean the the the part of your first part of your question is easy to answer is the pipeline's never been more full we're very excited about it etc um you don't know until they're done right so as we can and we kind of publicly agree to talk about it publicly we will let you know about those things but uh this is i mean these kinds of things are only increasing not decreasing and there's been a lot of sense that has been brought into this marketplace so we're going to get lots of swings at it and we're winning some of those swings and we're going to keep going so pipeline
is as big as it's ever been that's great to hear and then kind of going back to your guide so you raised the midpoint by a pretty substantial amount can you help us think of the puts and picks you know in relation to the updated outlook and what would need to happen for you to reach the top end
versus the bottom end of the new ranges i think part of it is we've talked about these new partners that have come on and we're seeing the benefits but as you begin working with a new partner you kind of learn what's the trajectory. You have sort of a funnel of opportunity and some get to the higher end of it, some get to the lower end. We are now confident on that funnel to do what we did. And so as we go through the course of the year and we continue to monitor those new partners coming on and feel solid that it's actually going to happen, it's not just a hope, we'll continue to talk about where we are in that funnel. Yeah, and I think the other thing
is tax season too, right? I mean, as we think about our guide, we clearly think to a multitude of different scenarios across our businesses. And I think Brett took through some of the positives on the tax business here heading into tax season here, and we're really enthusiastic about it. But I agree with Brett. I mean, the two factors that are going to push us to the higher end of that guide, one is the timing on just the pull through on those partners we talked about, the ones we've already announced. The other is going to be the success of the tax season. We're really enthusiastic about it. But until you get into tax season, you start to see the numbers, you know, you've got to temper expectations a little bit but we're really really enthusiastic heading into it
yeah one other thing don't miss the secondary market income topic this time the government shut down uh slowed us down a little bit i think this was in greg's comments uh and you know we expect that to come right back through because that was a temporary thing uh and so we had that to look forward to as well and that's part of what we're saying yep so it sounds like the two biggest
swing factors are you know somewhat out of your control with depending on partner ramp and you know the uh volume that goes through the tax offices is that fair to say yeah i mean i i think
out of our control would be more like there's a range of possibilities and we'll continue to manage those and hope for the upper side of it but uh you don't know till you know and and what
we don't want to do is over commit that's fair um and then just kind of one last one for me here so new loan originations you know increased pretty meaningfully in the quarter you know i understand part of that was due to some of the new relationships um you know on the consumer side do you have a sense for what new originations will look like in 2016 and should we expect kind of the held-for-sale balances to increase in tandem with that, or would the velocity kind of coming through the balance sheet increase just to kind of mitigate that upward movement?
Well, let's unpack that a little bit. I mean, in the quarter, we certainly saw the uptick on the consumer side, and as you know, those are by and large largely held for sale at this point and turned pretty quick. I'm optimistic that as the existing partners ramp and scale that that volume is going to continue to certainly on a year-over-year basis scale versus where it was and I think scale from what we're seeing in this quarter. So again that's all balance sheet velocity and that will largely come through as a fee income. You know there's some some of those programs do have interest income as part of them but the majority of the economics come through is on the fee side. You know we haven't touched it on the commercial finance side. They also had a really good quarter on the production side and when I think about the balance of the year that's also a pipeline that's really full, particularly when you think across USDA, SBA, working capital, and with the balance sheet optimization work that we've been doing, for those three verticals in particular, but particularly USDA, SBA, it's about optionality. So I think we're really enthusiastic about that pipeline too, and the optionality it provides us either to continue to hold on balance sheet, or as we see fit, kind of sell into the markets and drive some secondary market revenues, but over the balance of the year, I would actually expect commercial finance to start generating and, you know, numbers that are meaningful enough that we're going to start talking about them.
I appreciate that. And then just actually one more for me on credit, I understand that you went over your prepared remarks, you know, NPAs, NPL ratios ticked up, NCOs are basically zero. Is there anything that you currently see in the portfolio that you find incrementally different versus three months ago?
No, I mean, again, these things that we have that are non-performing loans are in various different sub-asset classes. There's no pattern, system, or anything like that. And, you know, we're serious about our conversation that, you know, our historical past and our belief is there's not going to be a relationship between NCOs and, you know, non-performing loans because we do a different kind of lending that is very much collateral managed. So there's nothing in
there systematic. Okay, I suspect as much. I appreciate you taking my questions.
Operator
Thank you. Thanks, Joe. We appreciate it. Thank you. As a quick reminder, if you'd like to ask a question, please press star 1 on your telephone keypad. There are no more questions remaining at this time. I'll pass it back over to the team for closing remarks. All right. Well, thank you very
much for joining today. Have a good evening. This concludes today's conference call. Thank
Operator
you for your participation. You may now disconnect your line.