Operator
Good morning, ladies and gentlemen. And welcome to the EastGroup Properties, Inc. First Quarter 2025 Earnings Conference Call and Webcast. At this time, all lines are in listen-only mode. Following the presentation, we will conduct a question and answer session. If at any time during this call you require immediate assistance, please press star zero for the operator. This call is being recorded on Thursday, April 24, 2025. I would now like to turn the conference over to Marshall Loeb. Please go ahead.
Good morning, and thanks for calling in for our first quarter 2025 conference call. As always, we appreciate your interest. Brent Wood, our CFO, is also on the call. Since we will make forward-looking statements, we ask that you listen to the following disclaimer.
Please note that our conference call today will contain financial measures such as PNOI and FFO, which are non-GAAP measures as defined in Regulation G. Please refer to our most recent financial supplement and to our earnings press release, both available on the investor page of our website, and to our periodic reports furnished or filed with the SEC for definitions and further information regarding our use of these non-GAAP financial measures, and a reconciliation of them to our GAAP results. Please also note that some statements during this call are forward-looking statements as defined in and within the safe harbor under the Securities Act of 1933, the Securities Exchange Act of 1934, and the Private Securities Litigation Reform Act of 1995. Forward-looking statements in the earnings press release, along with our remarks, are made as of today and reflect our current views about the company's plans, intentions, expectations, strategies, and prospects, based on the information currently available to the company and on assumptions it has made. We undertake no duty to update such statements or remarks whether as a result of new information, future or actual events, or otherwise. Such statements involve known and unknown risks, uncertainties, and other factors that may cause actual results to differ materially. Please see our SEC filings, including our most recent annual report on Form 10-K for more detail about these risks.
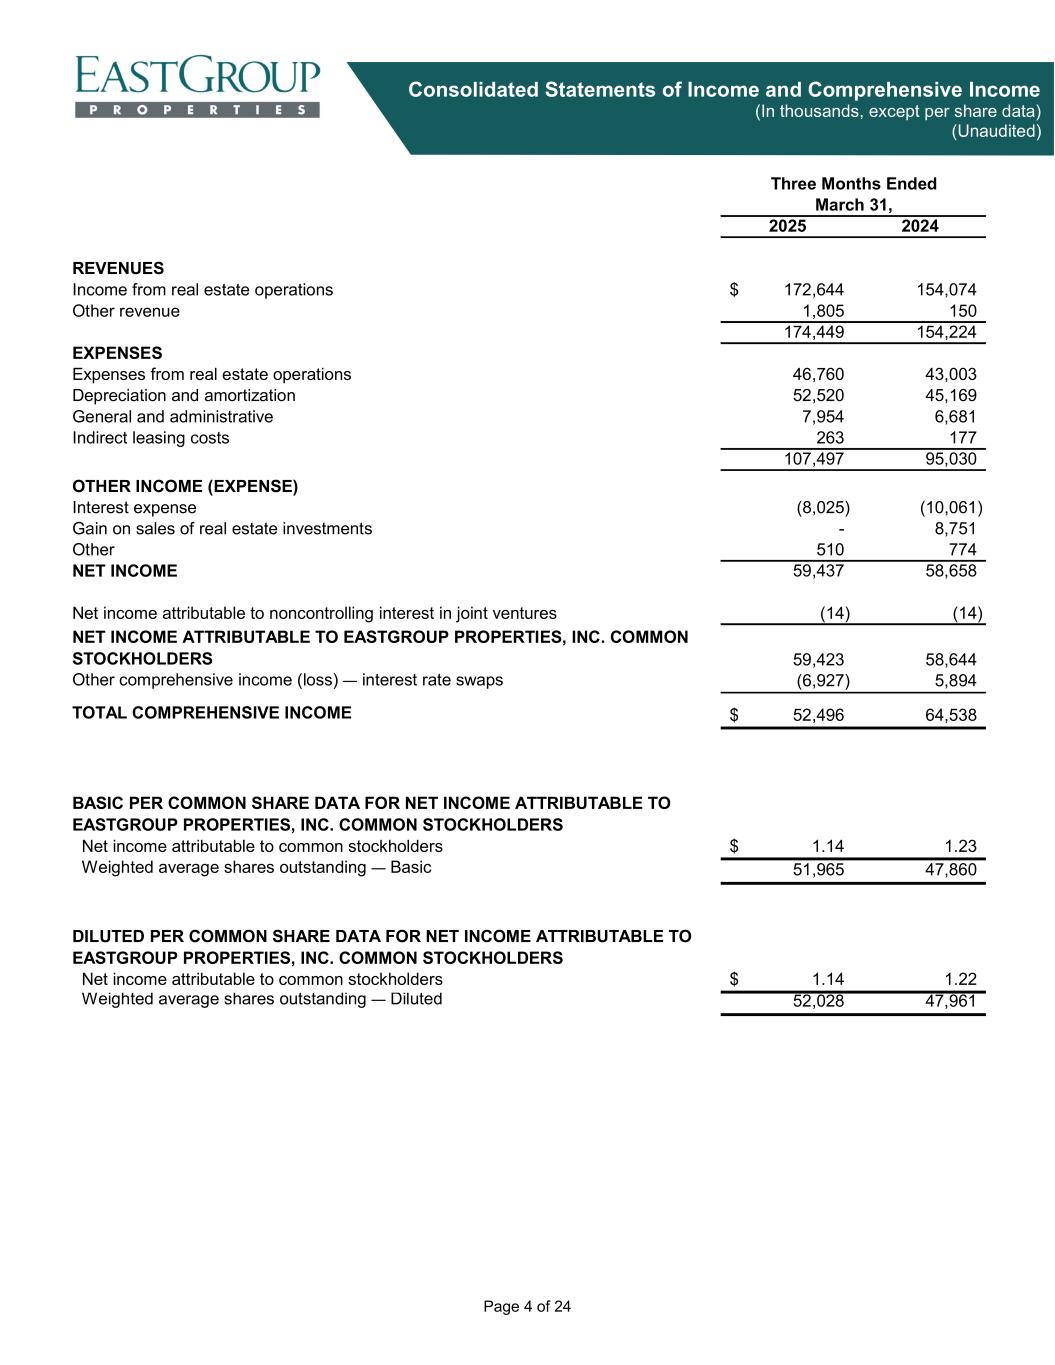
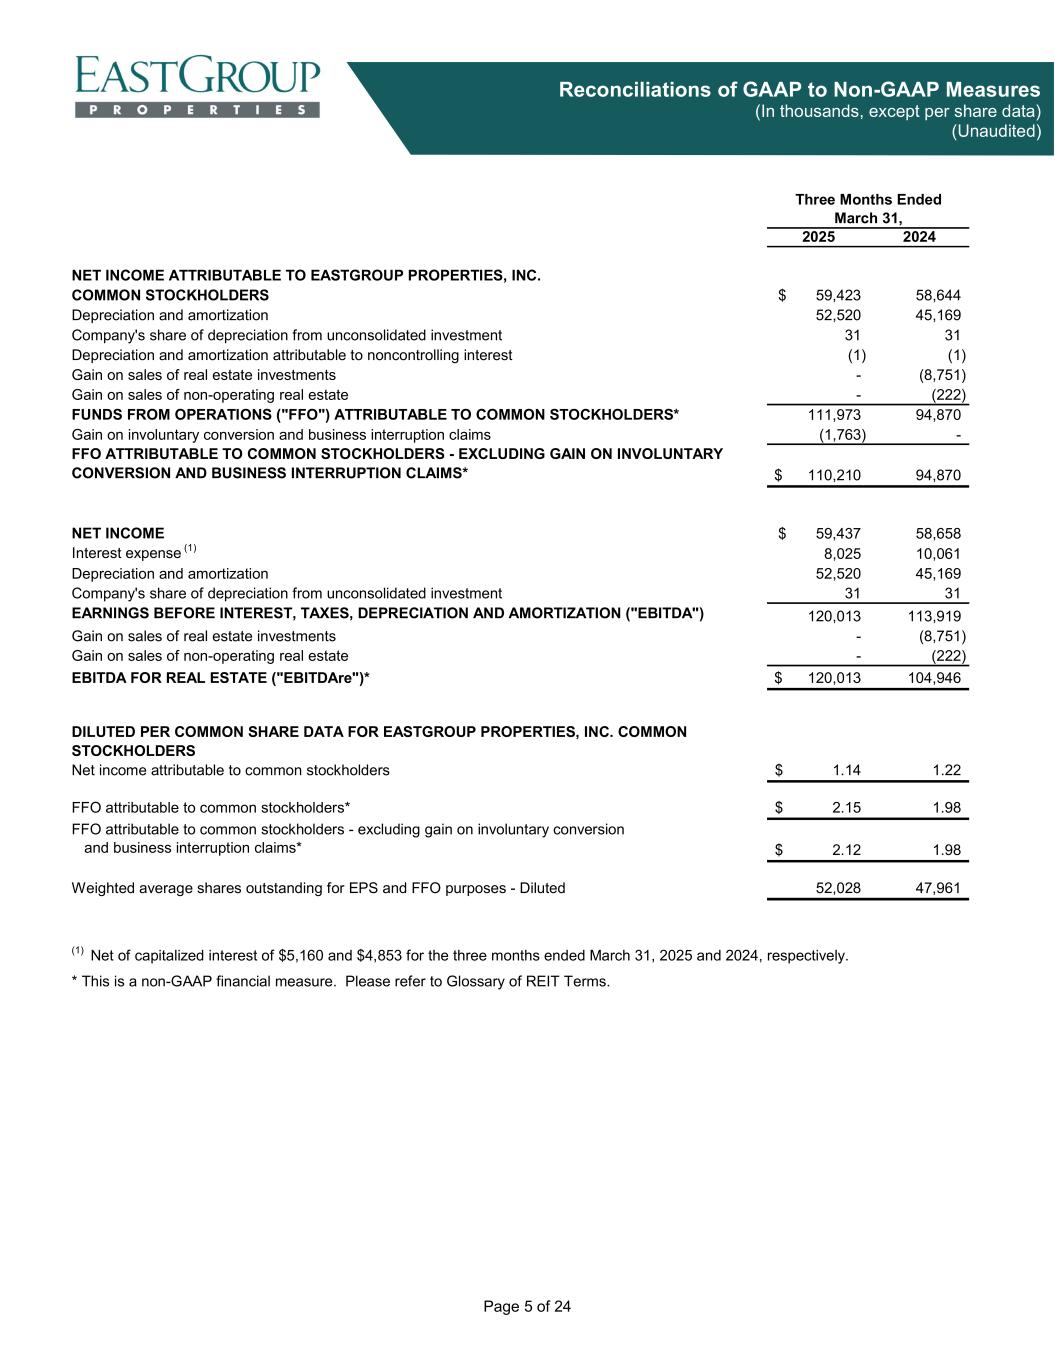
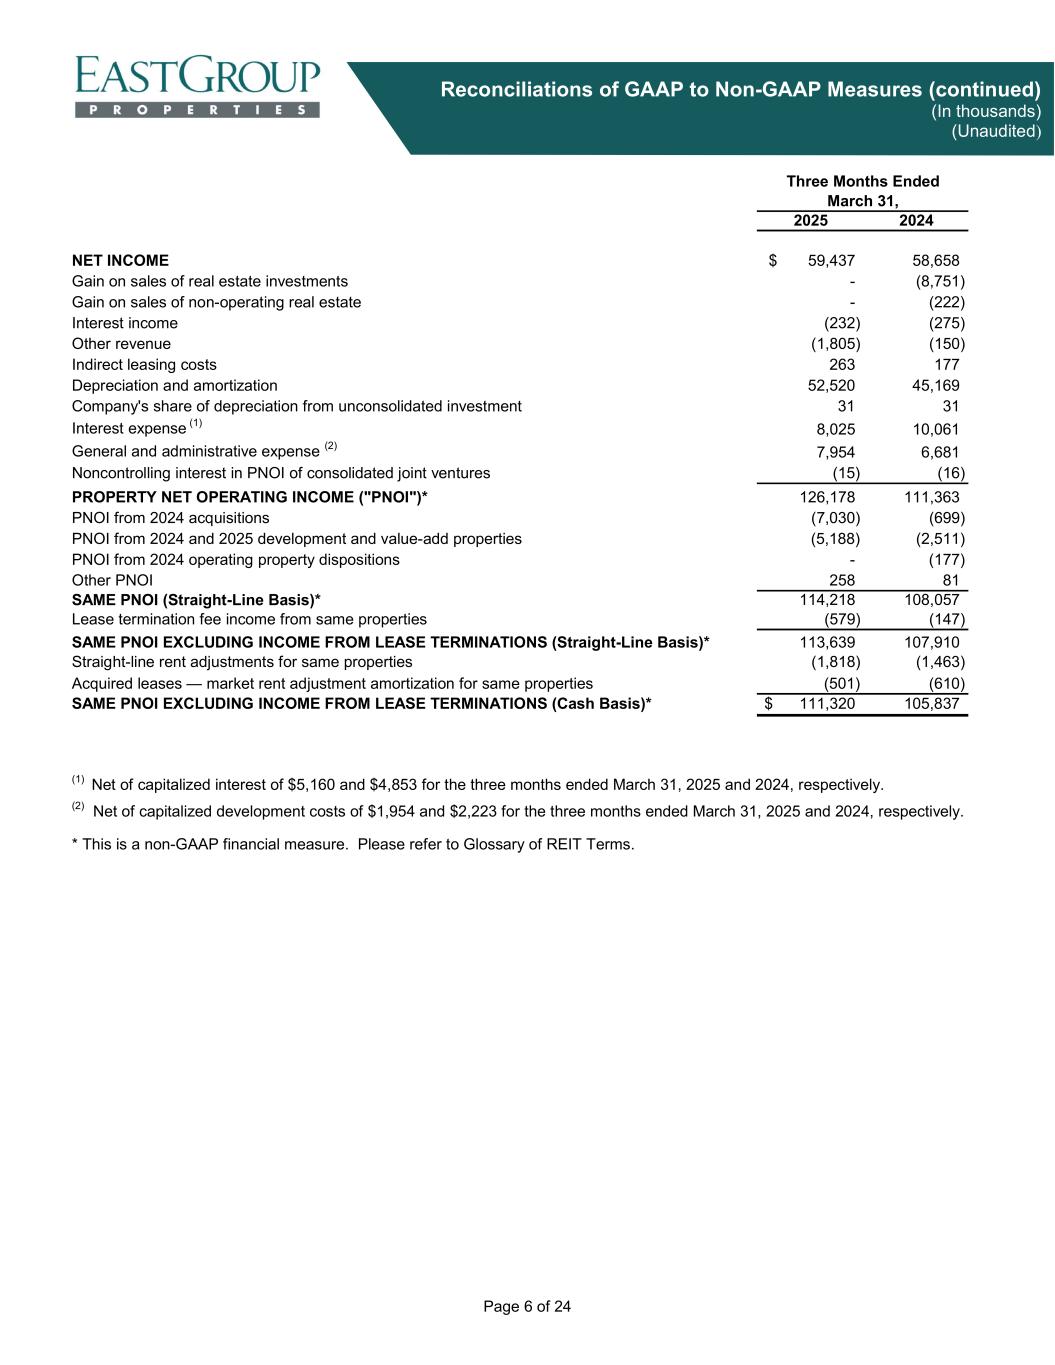
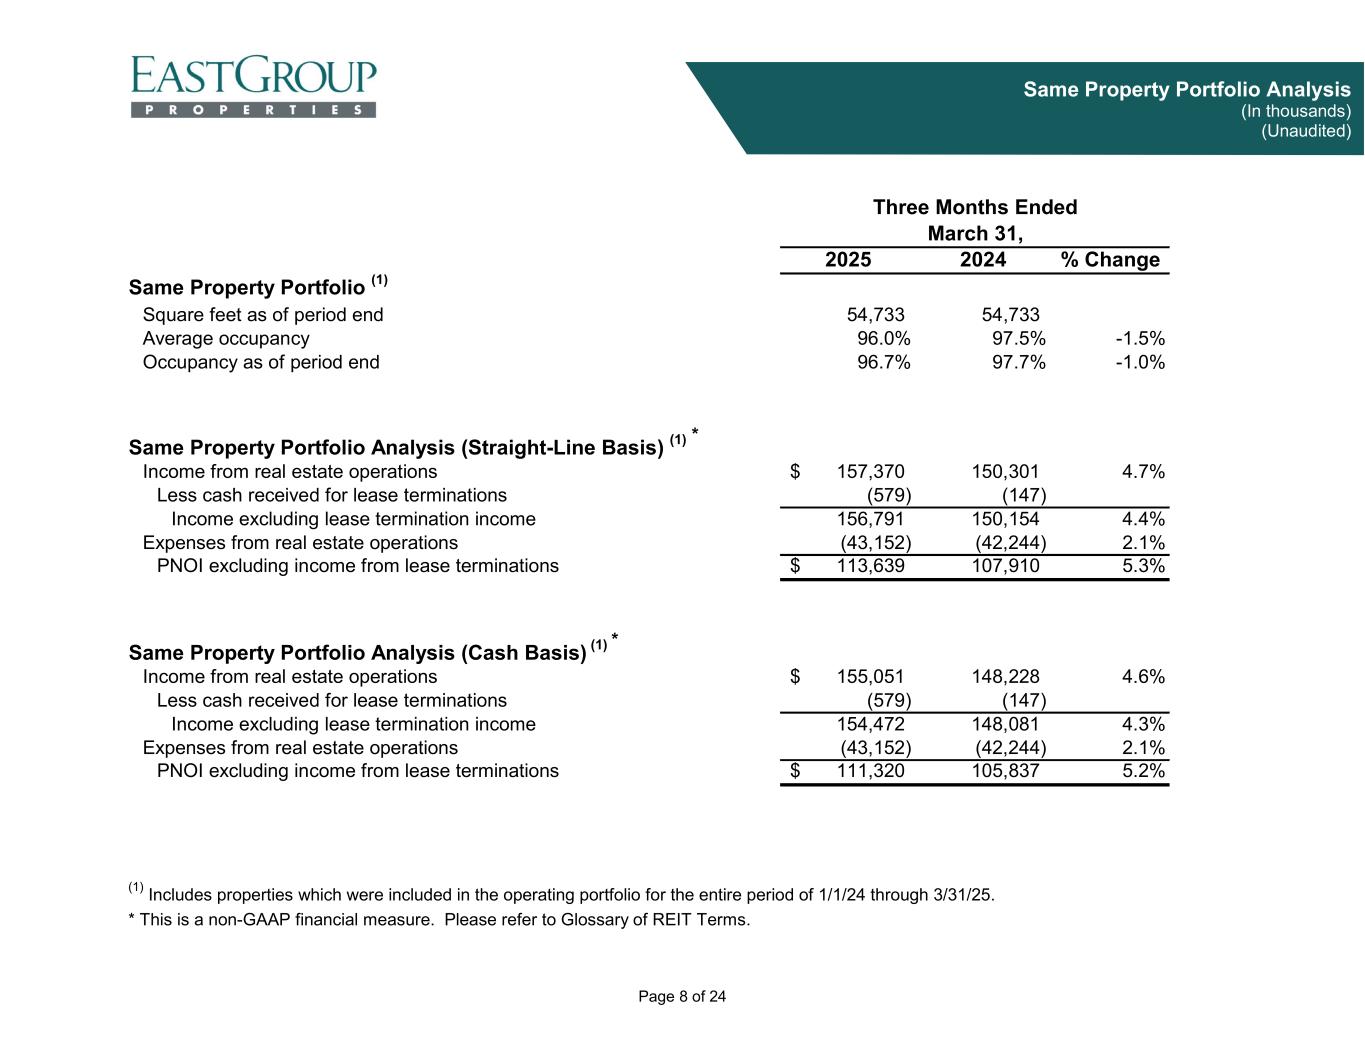
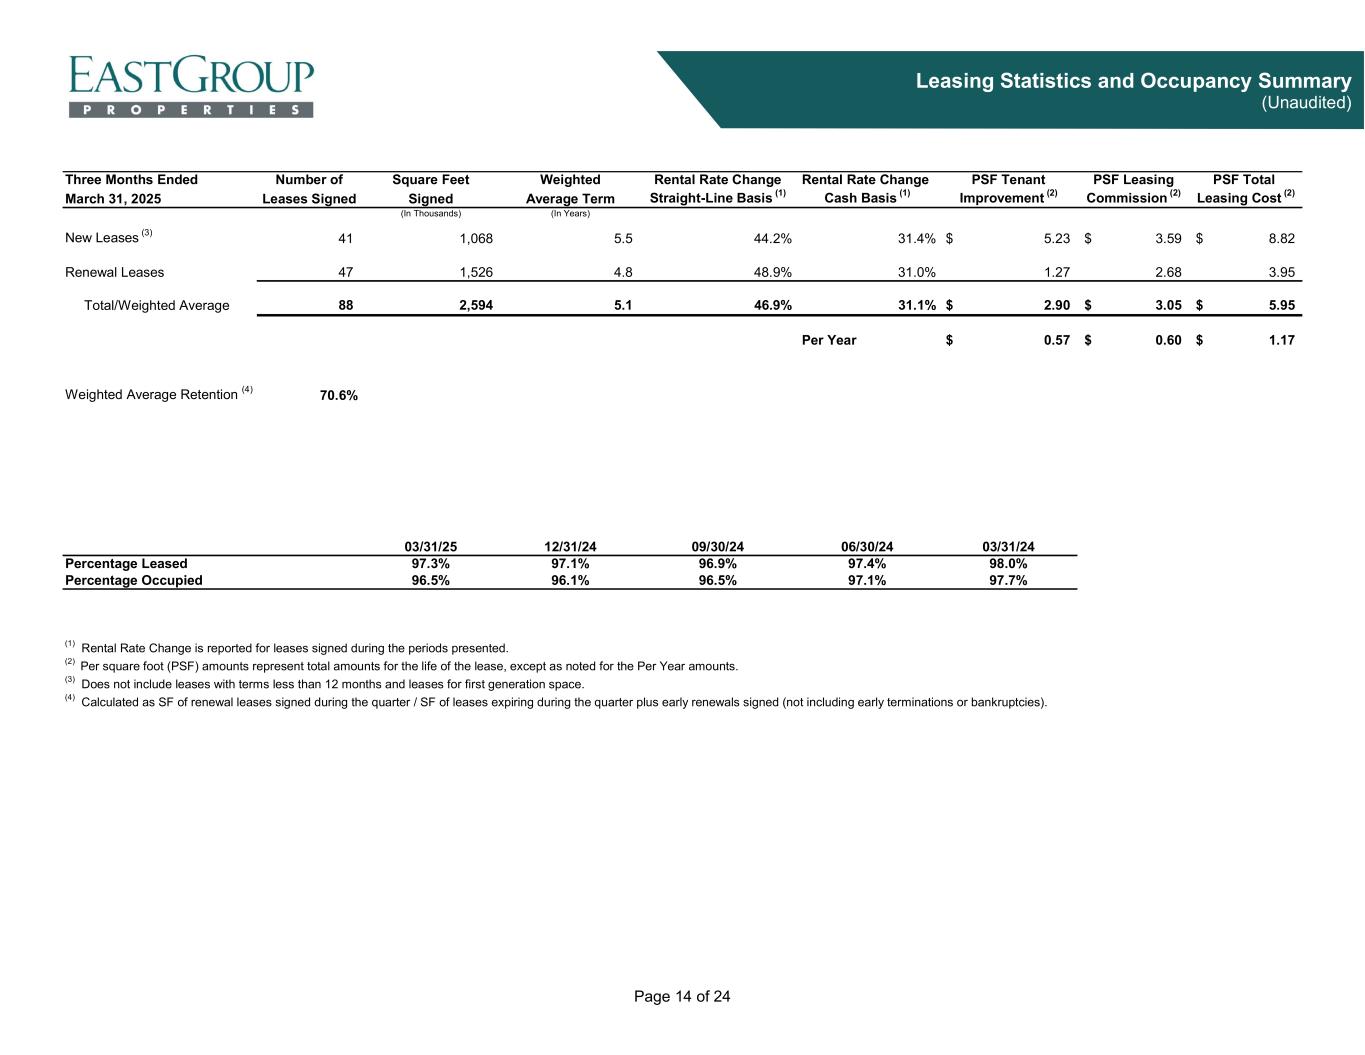
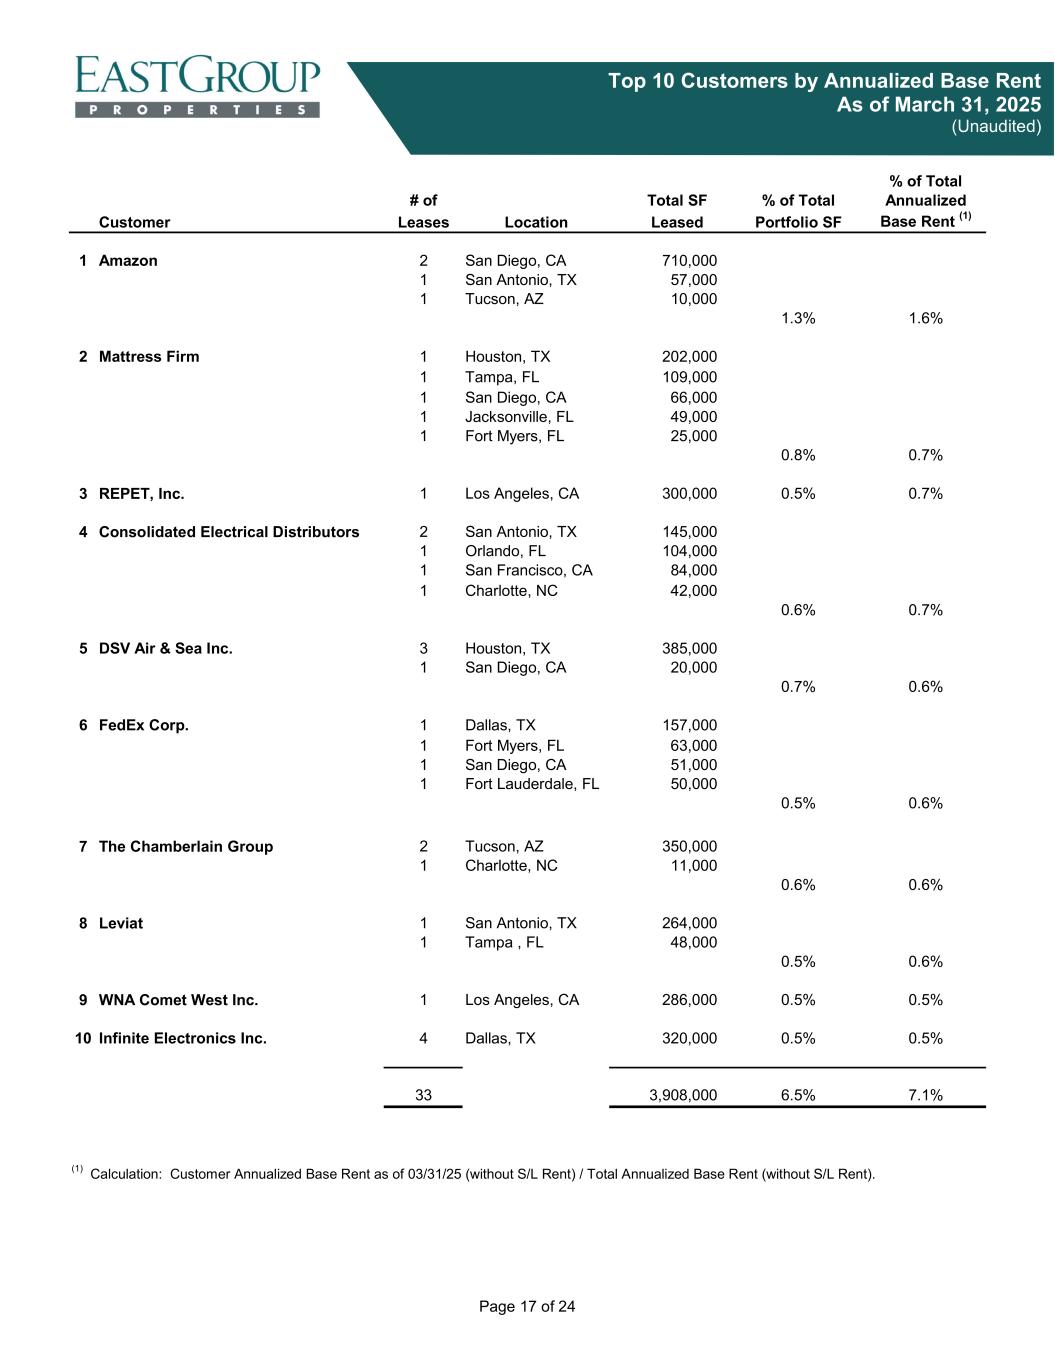
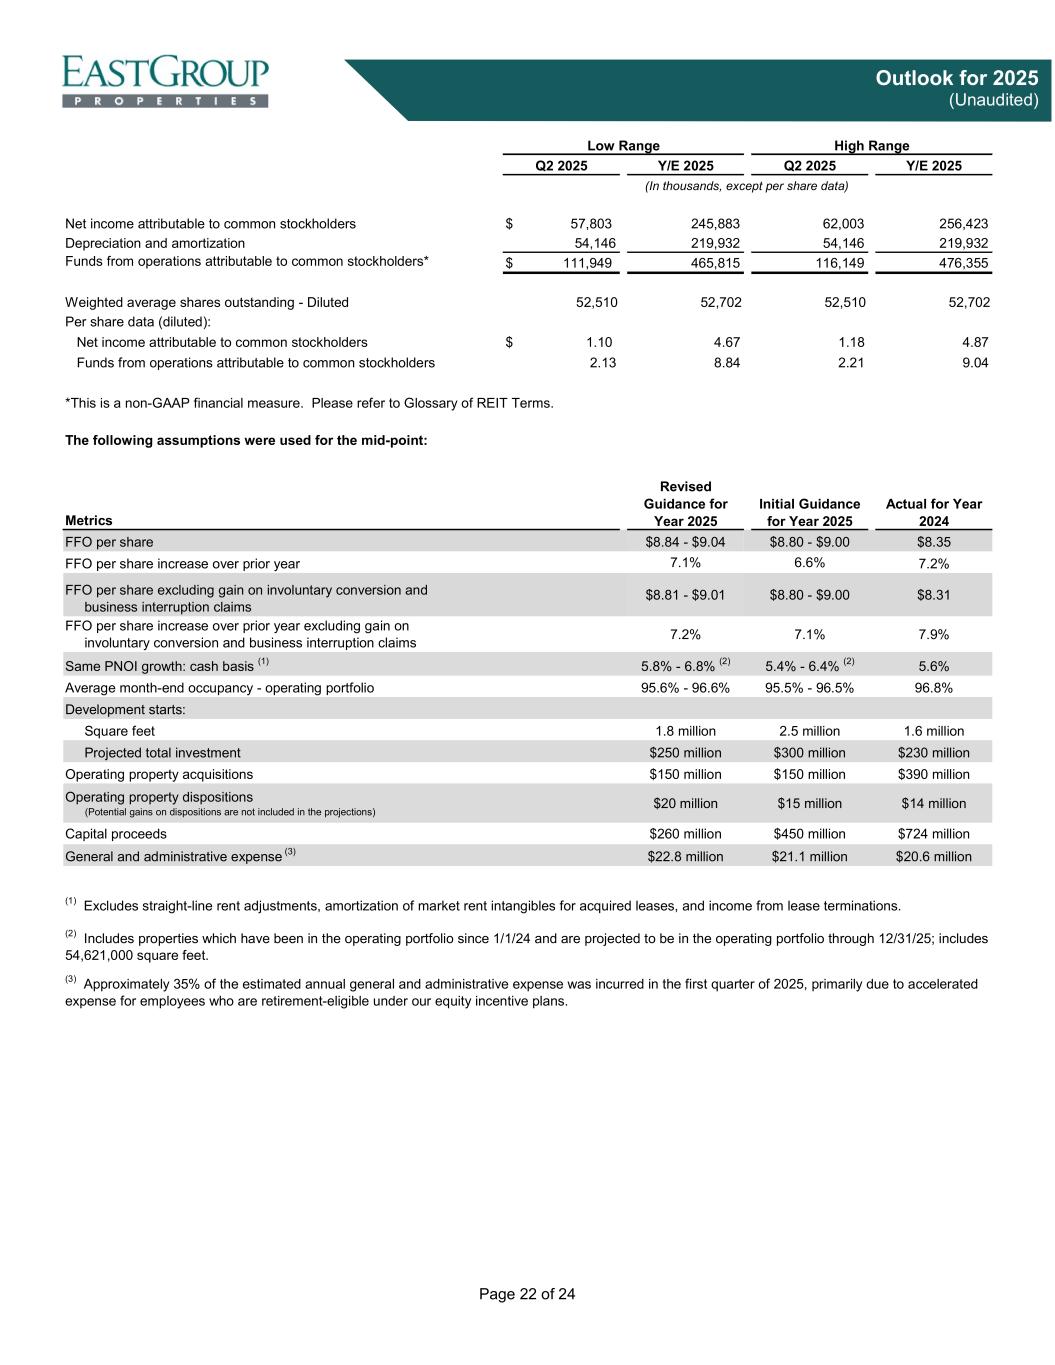
Thanks, Casey. Good morning. I'll start by thanking our team. They've worked hard and we've made solid progress on several of our 2025 goals. I'm proud of the results achieved. Our first quarter results demonstrate the quality of the portfolio we built and the resiliency of the industrial market. Some of the results include funds from operations, excluding involuntary conversions, which were $2.12 a share, up 7.1% for the quarter over the prior year, and now for over a decade, our quarterly FFO per share has exceeded the FFO per share reported in the same quarter in the prior year, truly a long-term trend. Quarter-end leasing was 97.3% with occupancy at 96.5%. Average quarterly occupancy was 95.8%, which, although historically strong, is down 170 basis points from the first quarter of 2024. Quarterly releasing spreads were 47% GAAP and 31% cash. Cash same-store NOI rose 5.2% for the quarter despite lower occupancy. And finally, we have the most diversified rent roll in our sector, with our top ten tenants falling to 7.1% of rents, down 70 basis points from a year ago. We view our geographic and revenue diversity as strategic paths to stabilize future earnings regardless of the economic environment. In summary, we're pleased with how 2025 began. The tariff discussions dramatically raised market uncertainty in terms of severity, duration, or even the likelihood of any downturn. To address the uncertainty, we're focusing on a couple of things. First, we're focused on leasing to maintain occupancy and making the best quick leasing decisions we can. Secondly, we're grateful our balance sheet, including outstanding forward equity agreements, positions us well. We've raised our threshold for new investments and development starts until there's better economic visibility. And from another perspective, uncertainty typically allows opportunistic investments, making balance sheet flexibility all the more valuable. In terms of the portfolio square feet leased, the past two quarters were two of our top three historically. That momentum speaks highly in terms of the quality of our team, our properties, and our markets. The leasing market was improving and then trade talks created uncertainty. It's too early to tell the widespread tenant reaction. As we've stated before, our development starts are pulled by market demand within our parks. Based on economic uncertainty, we're reforecasting 2025 starts to $250 million. We're projecting the majority of the starts in the second half of the year. We made solid progress on development leasing year to date. However, expectations are for slower, deliberate decision-making in the near term. Our emphasis is on expectations as our active prospects thankfully remain active prospects. In terms of starts, we'll ultimately follow demand on the ground to dictate the pace. Longer term, the continued decline in the supply pipeline is promising. Starts were historically low again this first quarter. We expect the uncertainty to further delay new plan starts. The combination of limited availability and new modern facilities, along with higher development costs, will put upward pressure on rents as demand strengthens. And as demand improves, our goal is to capitalize earlier than our private peers on development opportunities based on the combination of our team's experience, our balance sheet strength, existing tenant expansion needs, and the land and permits we have in hand. Brent will now speak to several topics including assumptions within our updated 2025 guidance.
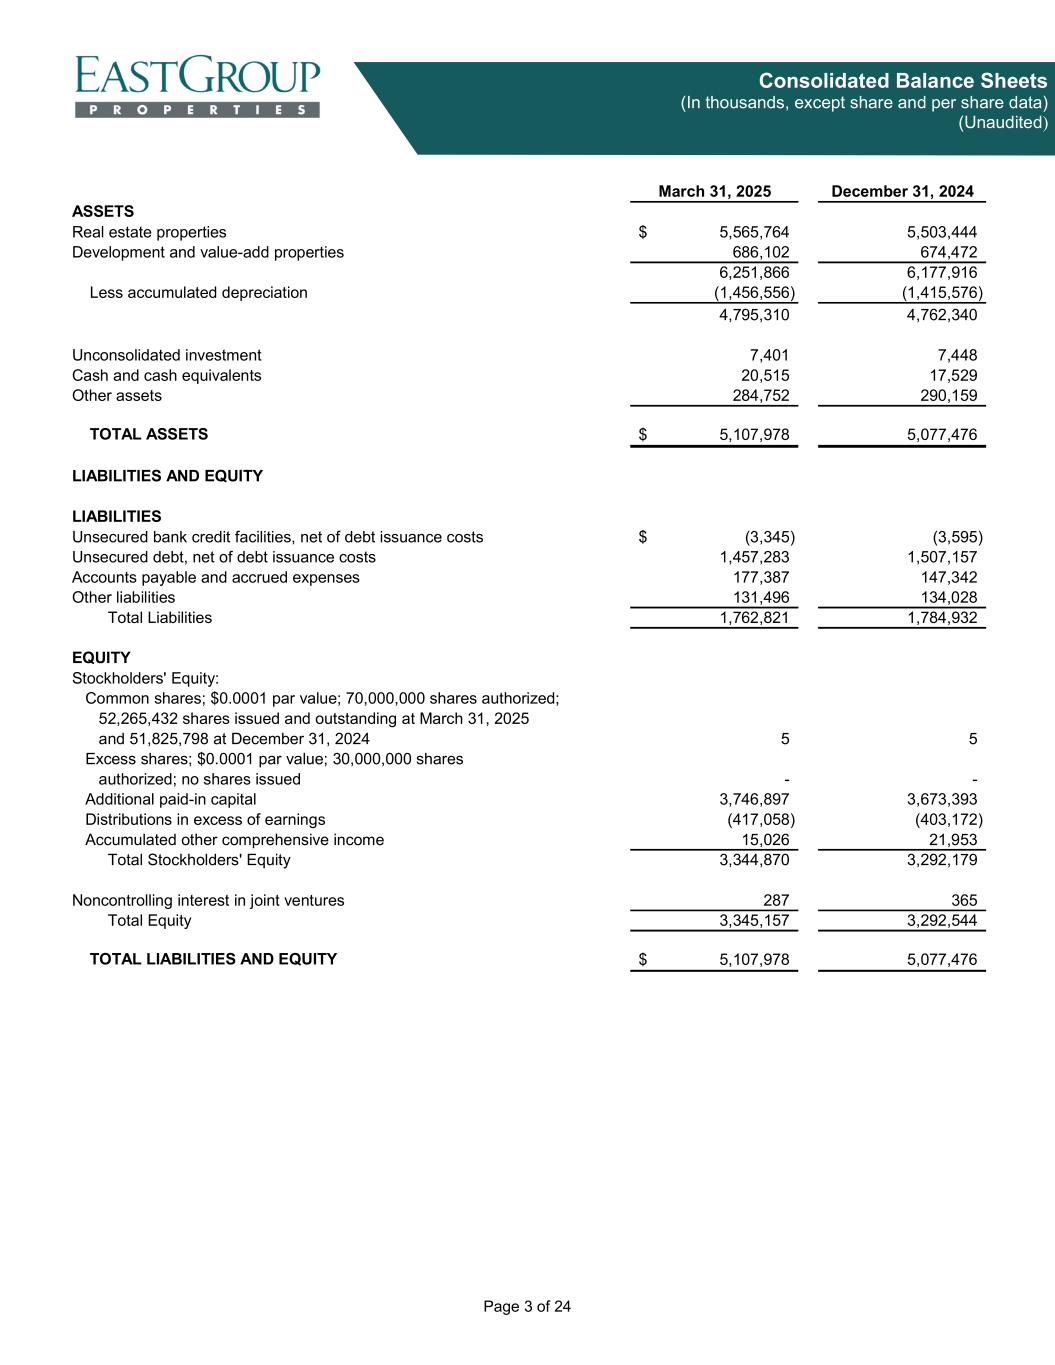
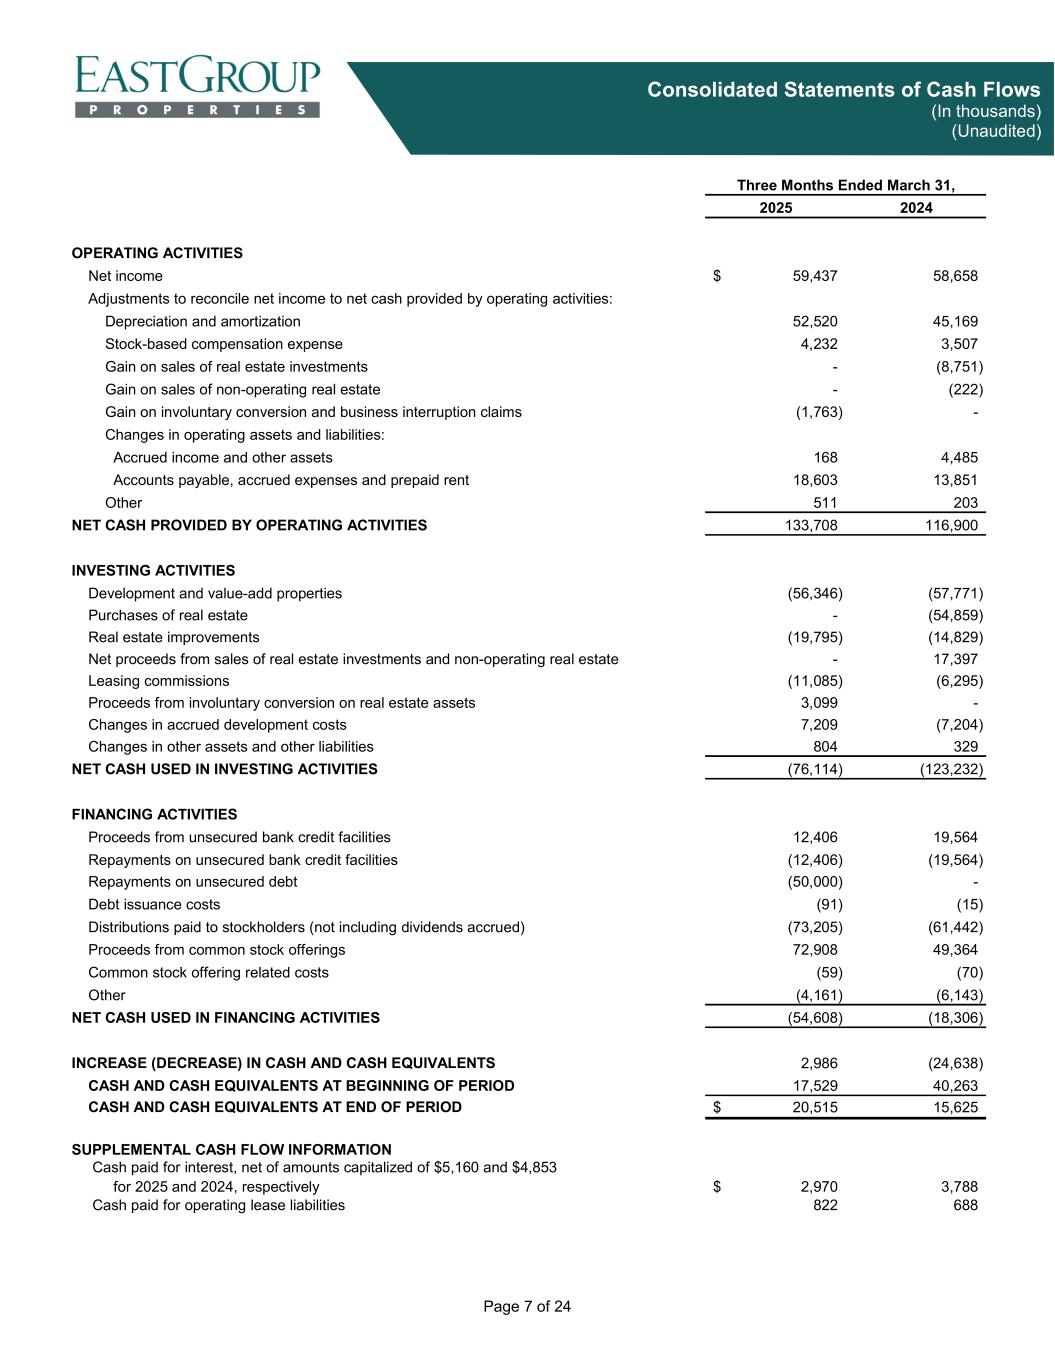
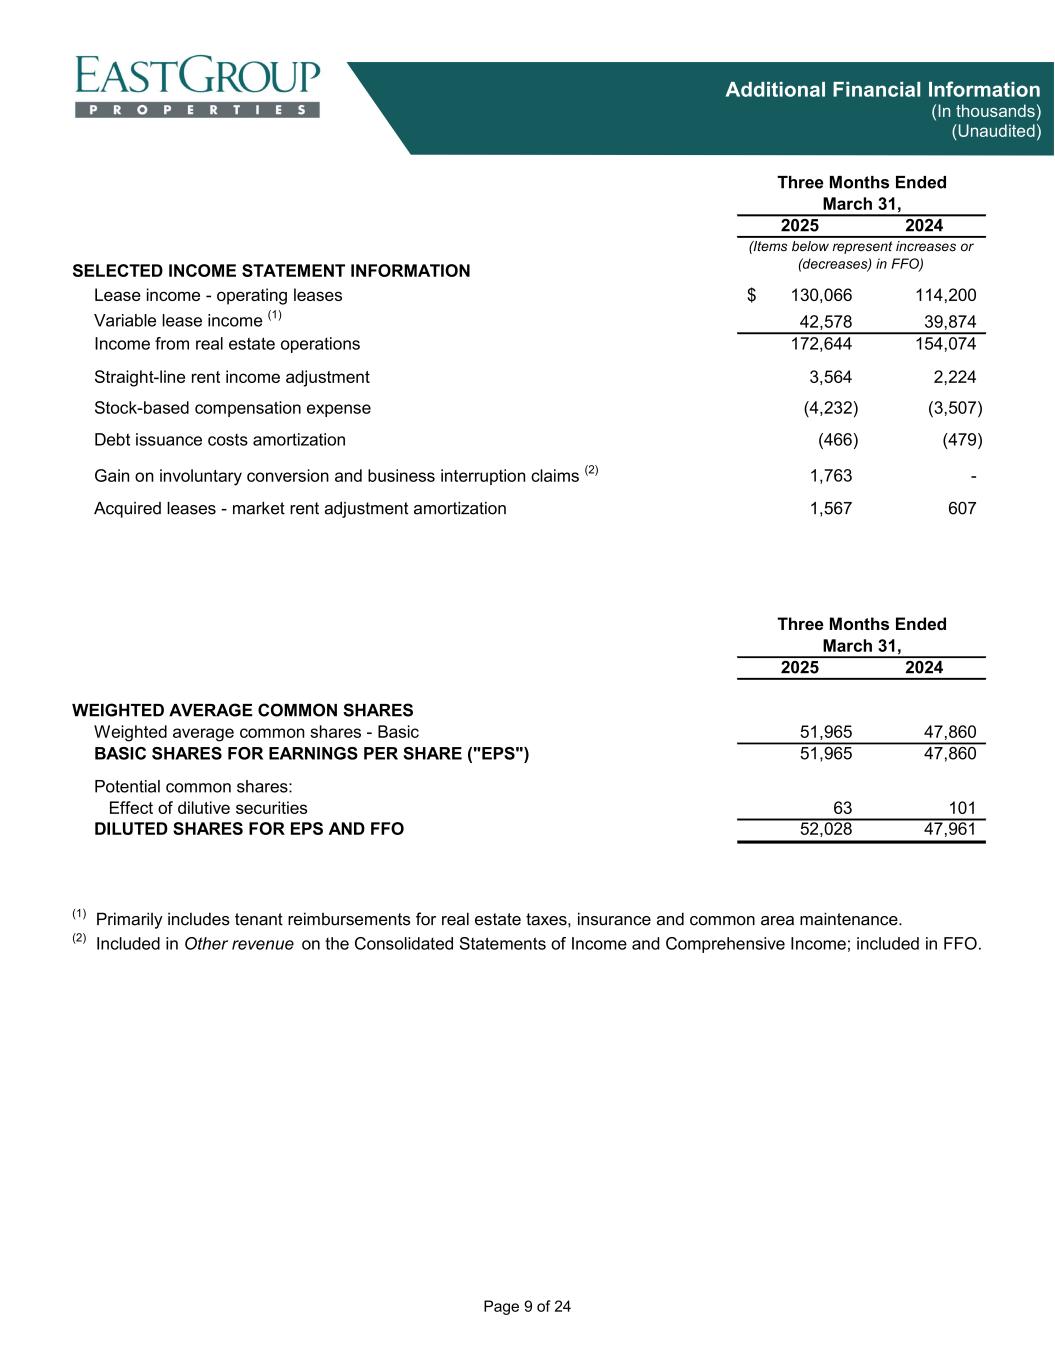
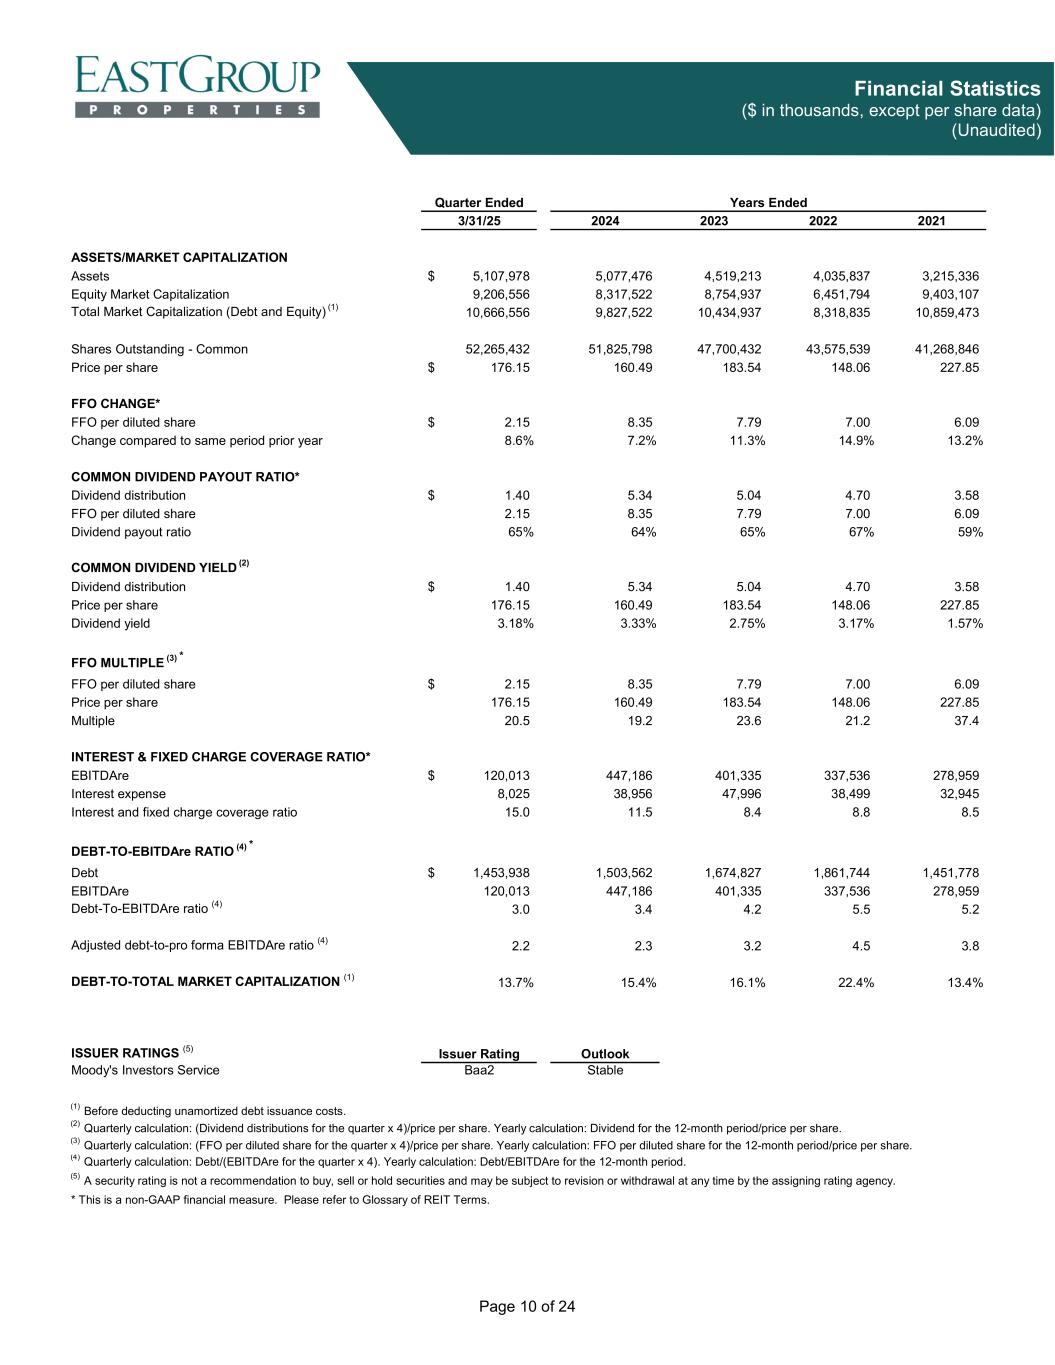
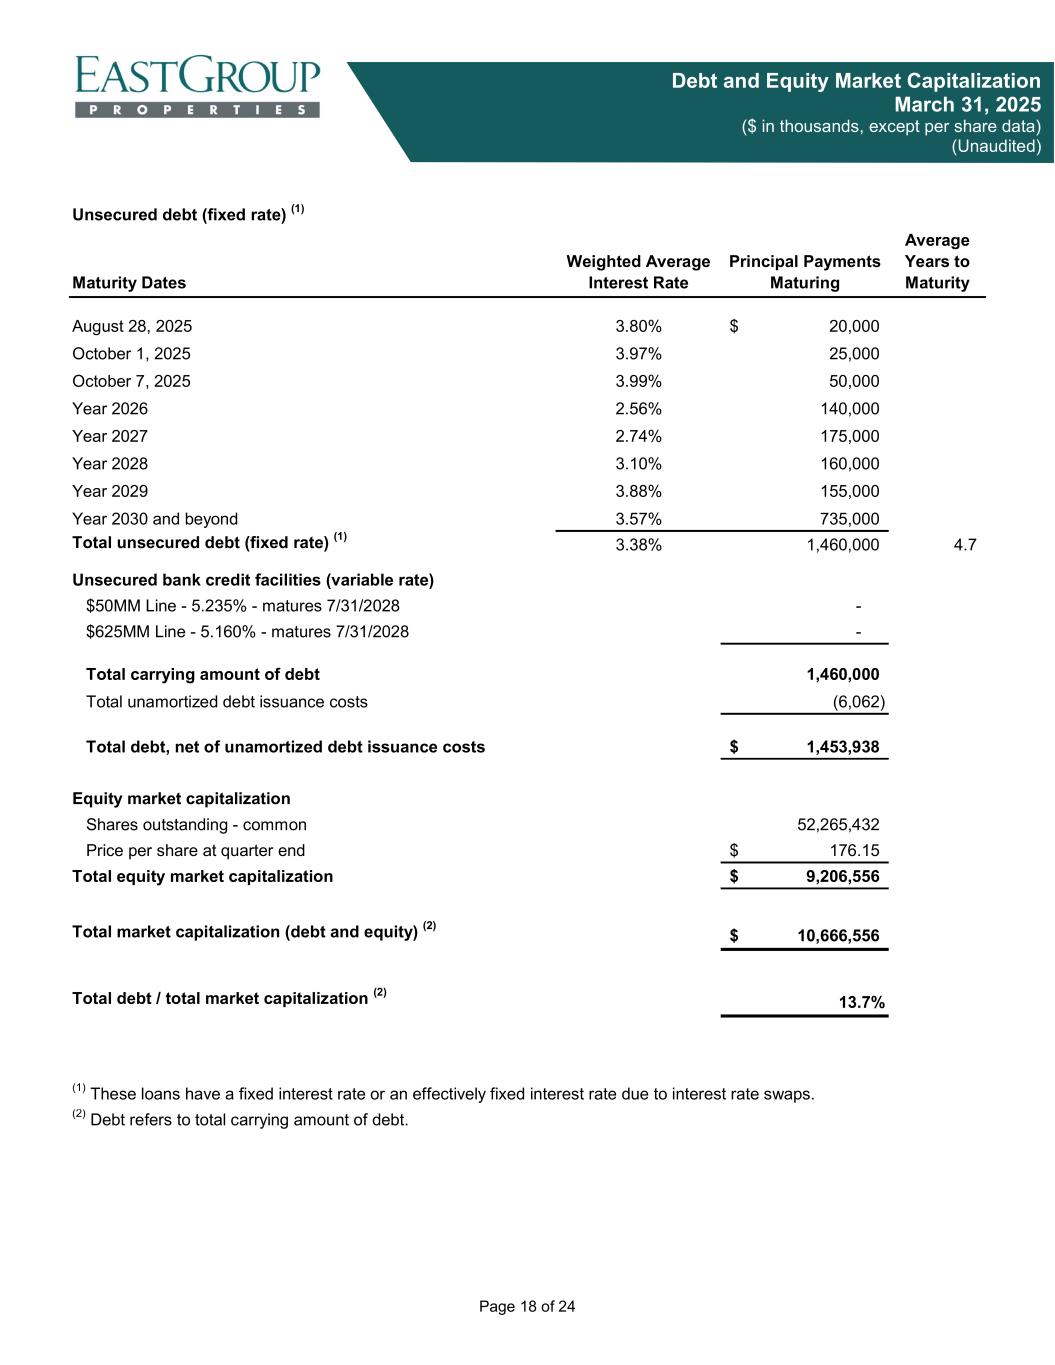
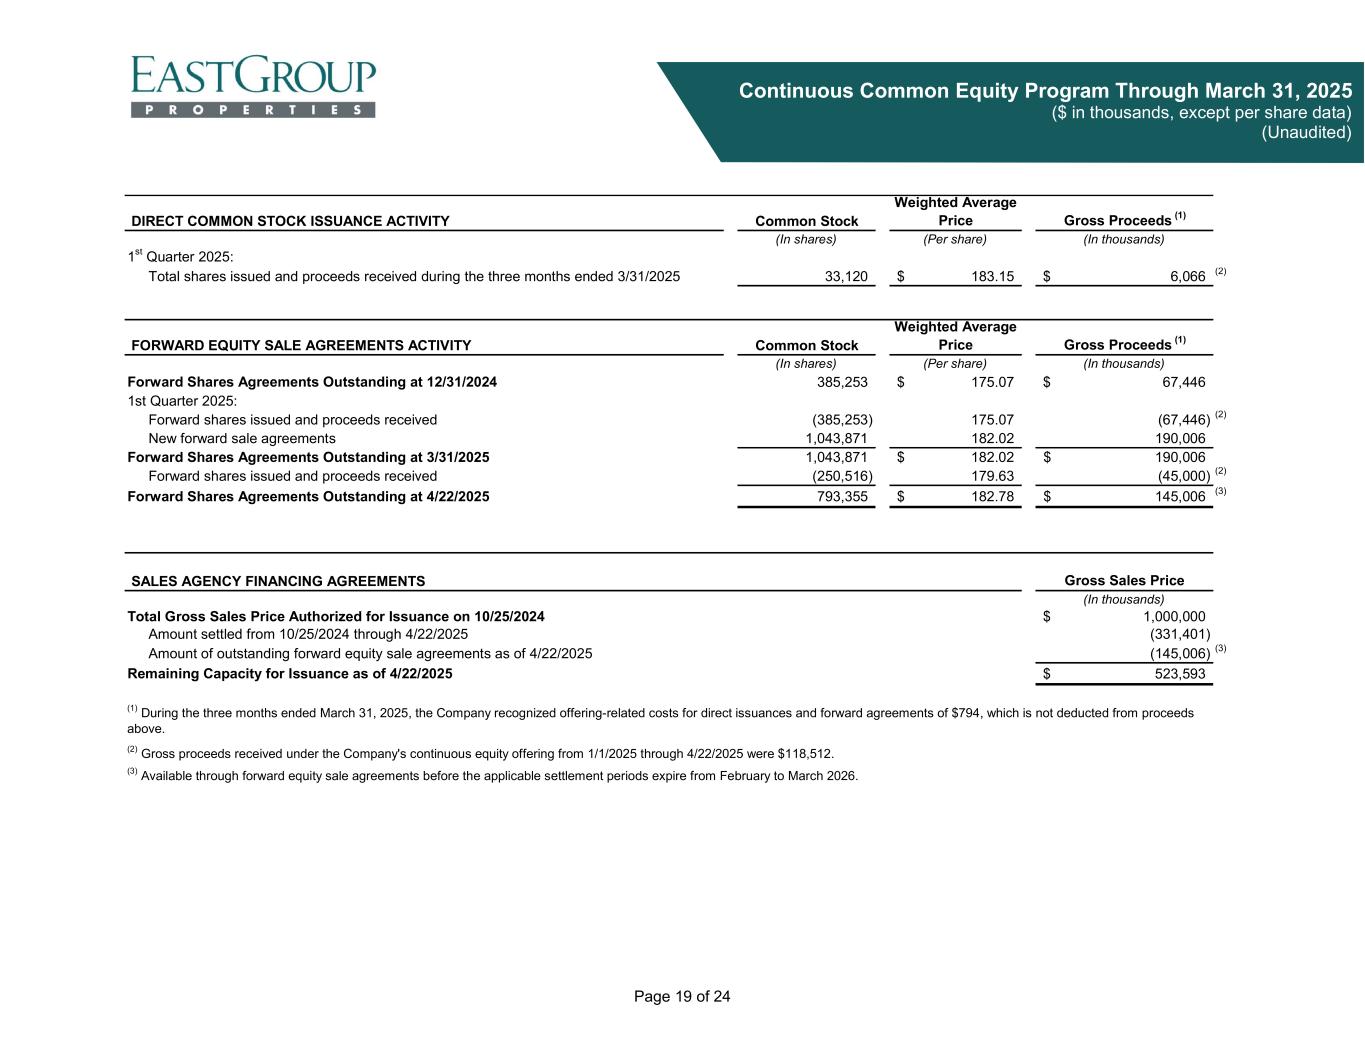
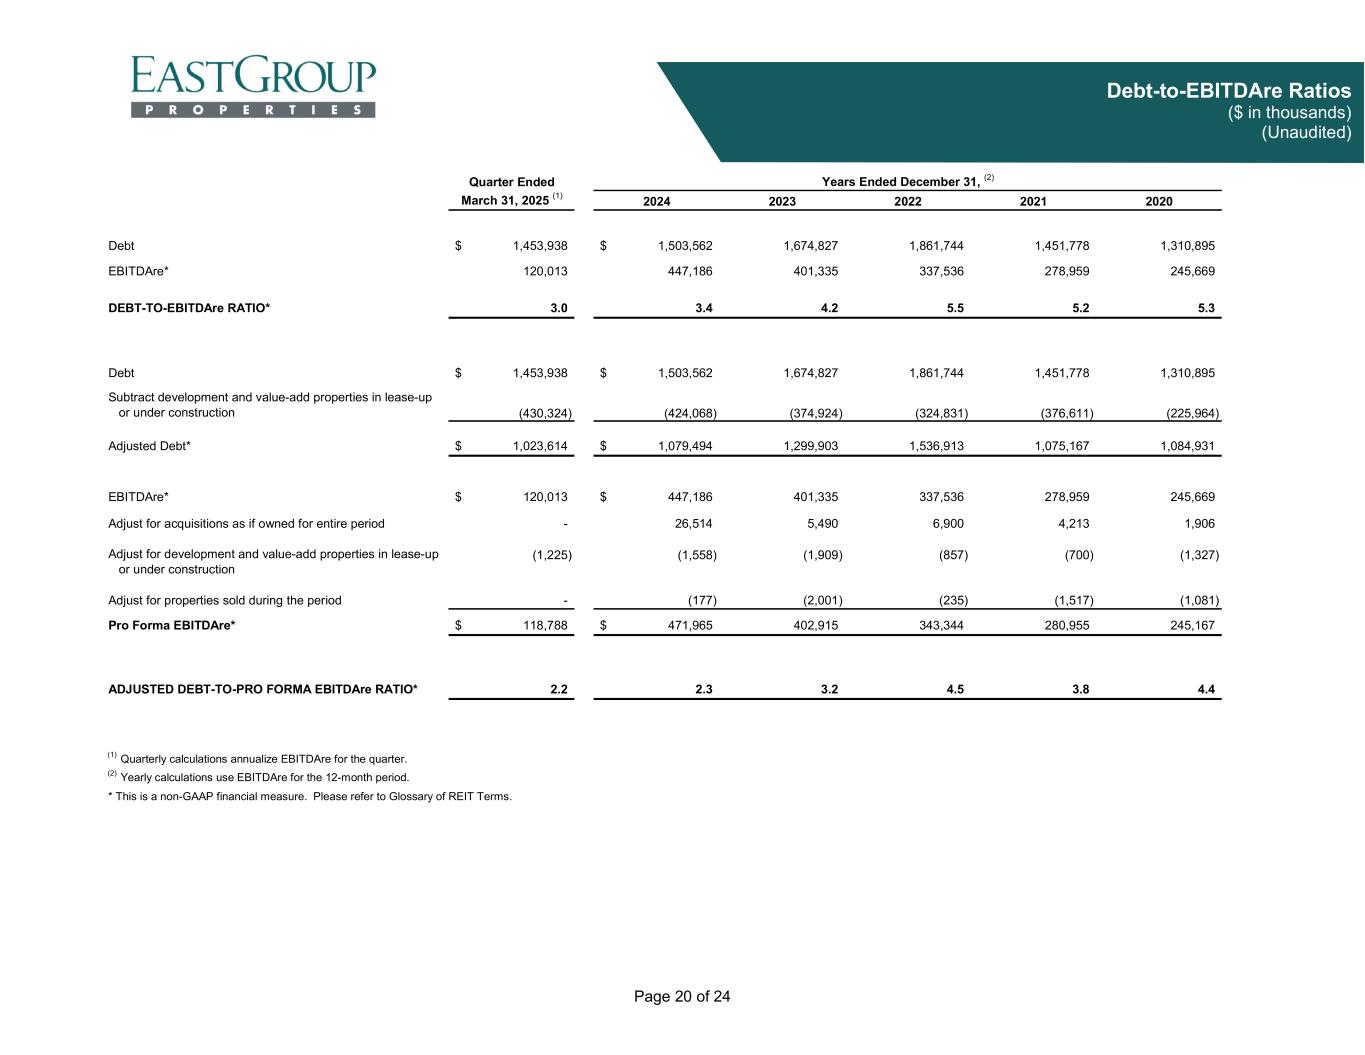
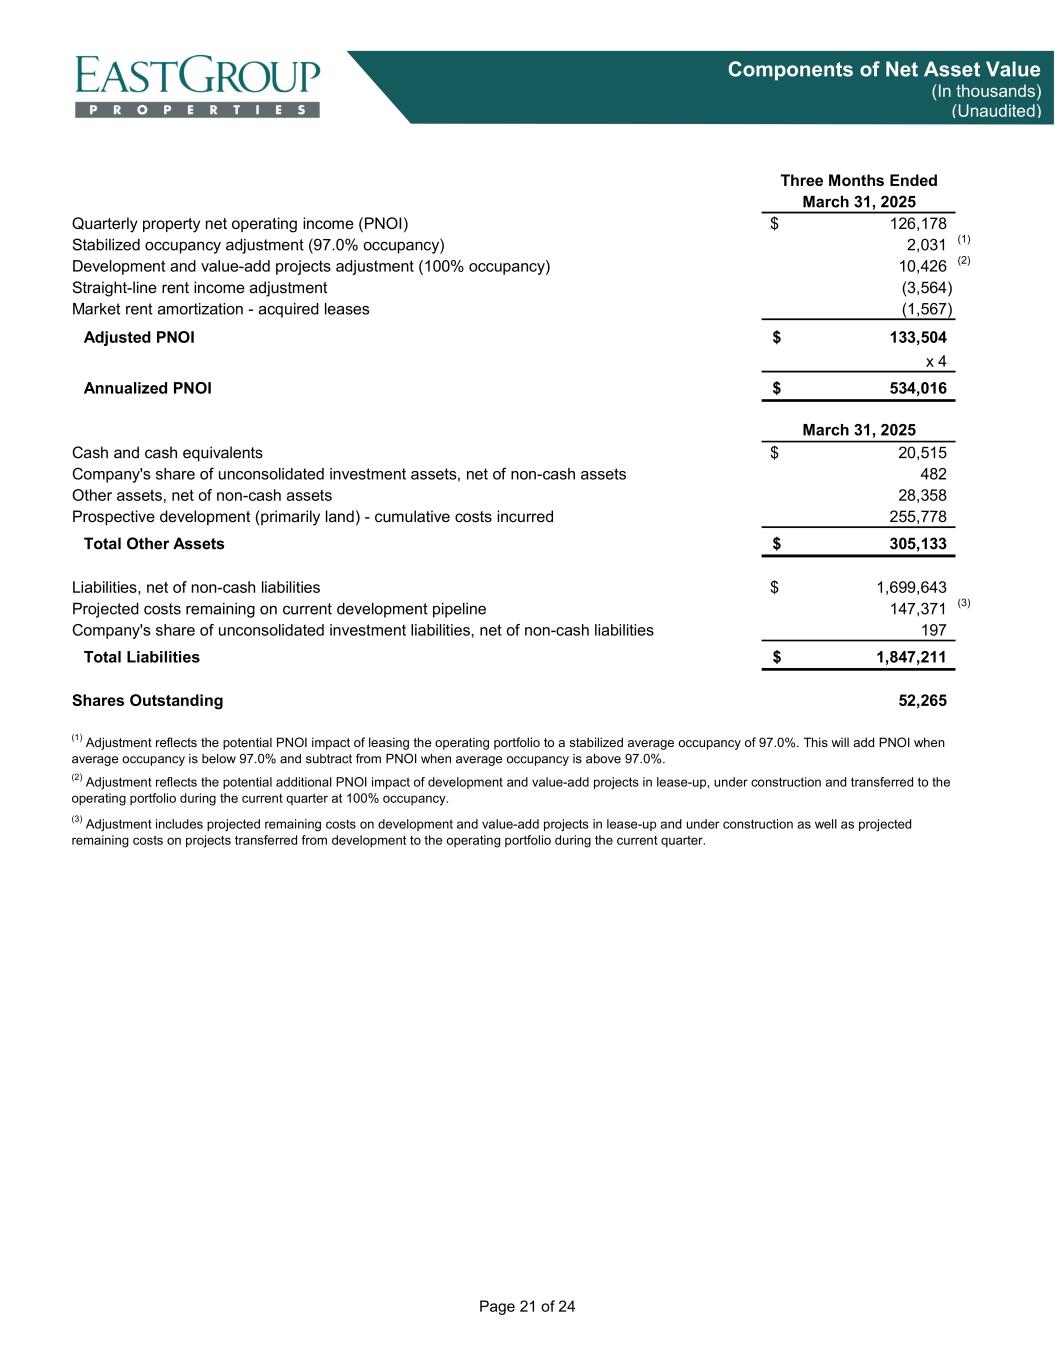
Good morning. Our first quarter results reflect the terrific execution of our team, the solid overall performance of our portfolio, and the continued success of our time-tested strategy. FFO per share for the quarter exceeded the midpoint of our guidance range at $2.12 per share compared to $1.98 for the same quarter last year, an increase of 7.1% excluding involuntary conversion gains. As a reminder, we typically incur about a third of our annual G&A expense in the first quarter primarily due to the accelerated expense of newly granted equity-based compensation for retirement-eligible employees which totaled approximately $2.5 million during the quarter. From a capital perspective, we were opportunistic in accessing equity markets. During the quarter, we directly issued common shares for gross proceeds of $6 million, settled forward shares agreements for gross proceeds of $67 million with an additional settlement of $45 million after quarter-end. Collectively, those shares issued in the first quarter were initiated at an average price of $176 per share. As of today, we have $145 million in outstanding forward agreements at an average weighted price of $183 per share and full capacity of our $675 million credit facilities. In January, we refinanced a $100 million unsecured term loan reducing the credit spread by 30 basis points resulting in savings of approximately $1.5 million over the remaining five years of term. In March, we repaid a $50 million unsecured term loan and only have $95 million of debt maturing for the remainder of the year. Although capital markets are fluid, our balance sheet remains flexible and strong with record financial metrics. Our debt to total market capitalization was 13.7%, unadjusted debt to EBITDA ratio increased to 3 times, and our interest and fixed charge coverage increased to 15 times. Looking forward, we estimate FFO guidance for the second quarter to be in the range of $2.13 to $2.21 per share and $8.81 to $9.01 for the year, excluding involuntary conversion gains, which is up slightly from our prior guidance. Those midpoints represent increases of 5.9% and 7.2% compared to the prior year. Our revised guidance increases the midpoint for cash same-store growth by 40 basis points and increases average occupancy by 10 basis points. Considering the uncertainty in the markets and the volatility in our share price, we reduced development starts by $50 million and reduced our capital proceeds by $190 million. This assumes that we do not raise any additional external capital and utilize our revolving facilities. G&A increased due to less overhead capitalization as a result of reducing development starts, and an increase in accounting for equity-based compensation. Our tenant collections remain healthy and bad debt as a percentage of revenue was lower in the first quarter compared to 2024. We continue to estimate uncollectible rents to be in the 40 to 50 basis point range of revenues, a little ahead of our historic run rate. Closing, we are pleased with the start of the year, especially considering the macro uncertainty related to tariffs, and a prolonged higher interest rate environment. And as we have in both good and uncertain times in the past, we will rely on our financial strength, the experience of our team, and the quality and location of our multi-tenant portfolio to lead us into the future. Now Marshall will make final comments.
Thanks, Brent. In closing, I'm excited about the start to the year. Our management team has worked through numerous periods of uncertainty before, and we'll navigate our way through this term as well. Regardless of the environment, our goals are to drive FFO growth per share and raise portfolio quality. If we can do those, we'll continue creating NAV growth for our shareholders. And stepping back from the near term, I like our positioning as our portfolio benefits from several long-term positive secular trends, such as population migration, near-shoring and onshoring trends, evolving logistics chains, and historically lower shallow bay market vacancies. We also have a proven management team with a long-term public track record. Our portfolio quality in terms of buildings and markets improves each quarter. Our balance sheet is stronger than it's ever been. We're upgrading our diversity both in our tenant space as well as our geography. We'd now like to open up the call for questions.
Operator
Thank you. Ladies and gentlemen, we will now begin the question and answer session. Should you wish to decline from the polling process, please press the star followed by the number two. If you are using a speakerphone, please lift the handset before pressing any keys. We are limiting this session to one question only per participant. One moment please for your first question. Your first question is from Blaine Heck from Wells Fargo. Please go ahead.
Speaker 3
Hey. Great. Good morning. Can you just touch a little bit more about the pace of leasing you're seeing thus far in the second quarter, whether you're seeing a notable pullback in that, you know, any more apparent in specific markets or if there are any that are more insulated. And related to that, you know, how quickly you think leasing could return to normalized levels or better given pent-up demand, once trade agreements start to materialize?
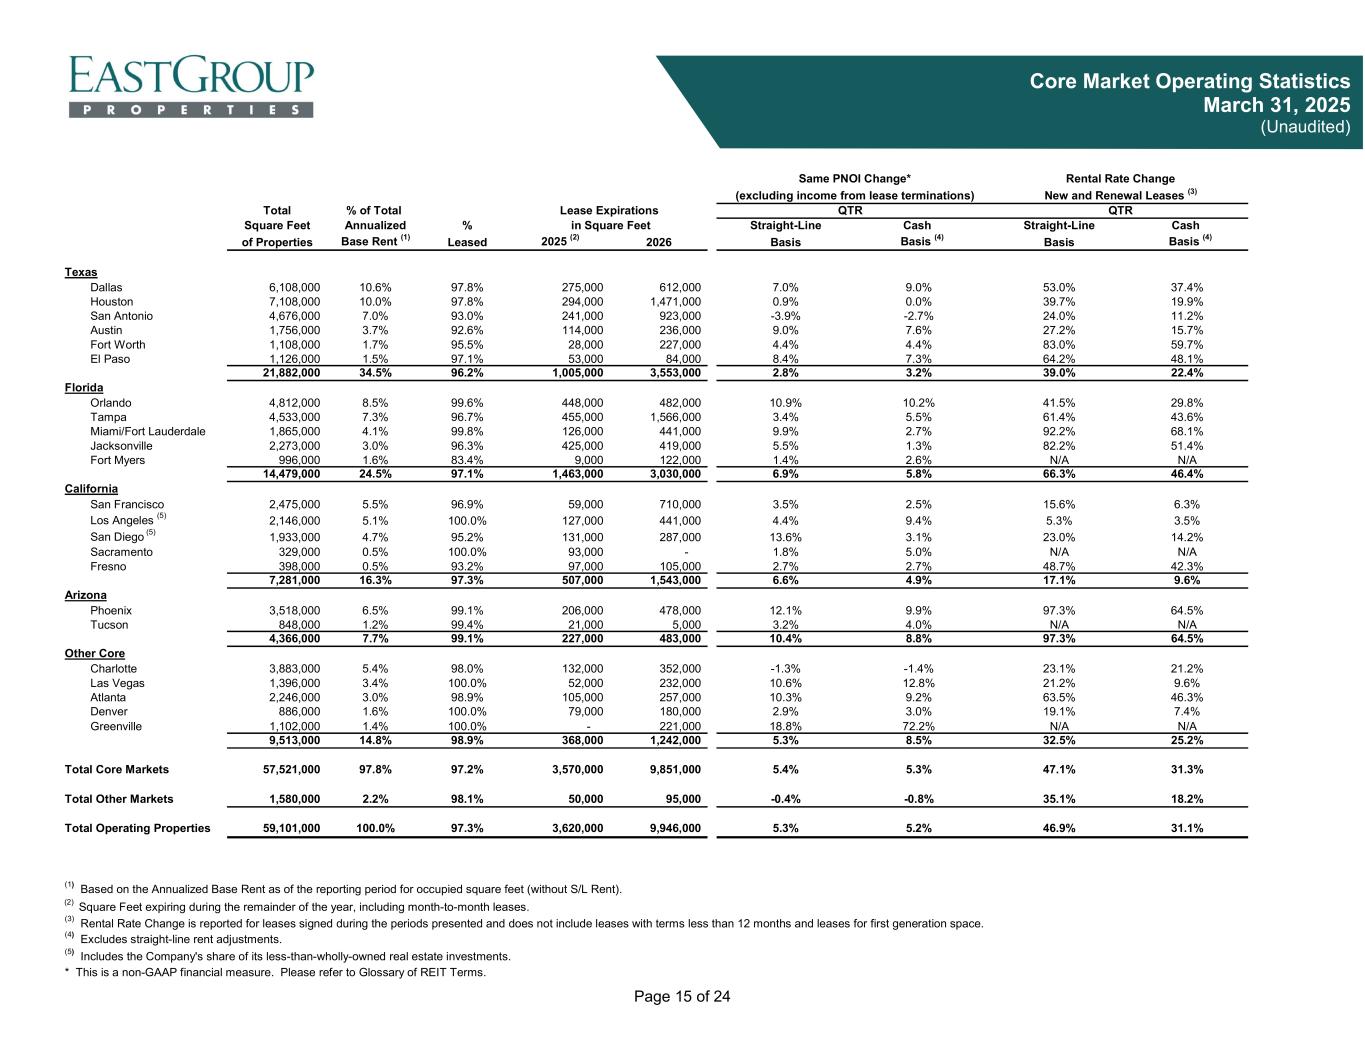
Hi. Good morning, Blaine. It's Marshall. I'll take a start at that. We've been really pleased with our leasing volume. I think from the industrial, if I go back just a moment, our fourth quarter was our best quarter ever in terms of square footage leased. And our first quarter was our third best quarter ever. So really, as kind of post-election as some of our peers have talked, things seem to feel like there was maybe at least you know, for better or worse, you had an election behind you and you had some things like that, and we had a lot of volume and as you said, supply has really been falling now for ten quarters. It's you know, certain markets, it's as low as it's been in eight to ten years in terms of what's in the construction pipeline. So we're excited about that longer term. In terms of leasing volume, I know it's been you know, it was early this month. It's really been awfully soon to tell I haven't we haven't really seen leasing volume. There's what in a really specific one market and even one building where we've had one, I believe, was just before kind of tariffs were announced at our Dominguez building. It's near the it's in Carson, California near the ports of LA and Long Beach. Where we've had two different leases out on that building and both prospects neither has gone away, but in both cases, they put things on hold. Until there was a little more certainty. And I get that they were Asian related, port related users. I like that our buildings by and large, but for the vast majority, serve consumer. We want to be as near that consumer as we can be and not port related. So our leasing volumes have really not shifted. We're happy with where we sit at the end of April, but it's still kind of a wait and see. But to date, if you talk to our teams in the field, absent California and specifically, LA Orange County, which is not new. That market's been struggling for a little bit. That's where we felt it. The other markets still feel, knock on wood, pretty solid. Probably the further east you go in our portfolio, the better the leasing volume has been. The Carolinas, Atlanta, Florida have been a little bit ahead of some of our other regions. But it's not to say Texas is bad. It's just not quite the pace seen in the eastern region of late.
Speaker 3
Great. Thank you.
Operator
Your next question is from Sameer Kunal from Bank of America. Please go ahead.
Speaker 4
Hey. Good morning, everybody. Marshall, one of the comments you mentioned even in the press release and even kind of your opening remarks was that you're working to complete leases as quickly as possible, right, given sort of the macro environment. Talked a little bit about the urgency. Maybe expand on that to just mean, are you willing to be a little bit more flexible with tenants in terms of their demands? I mean, are you what are you giving up on your end to kind of get the leases through? Just you know, is it lower rents to gain the occupancy? Maybe help us through think through that. Thanks.
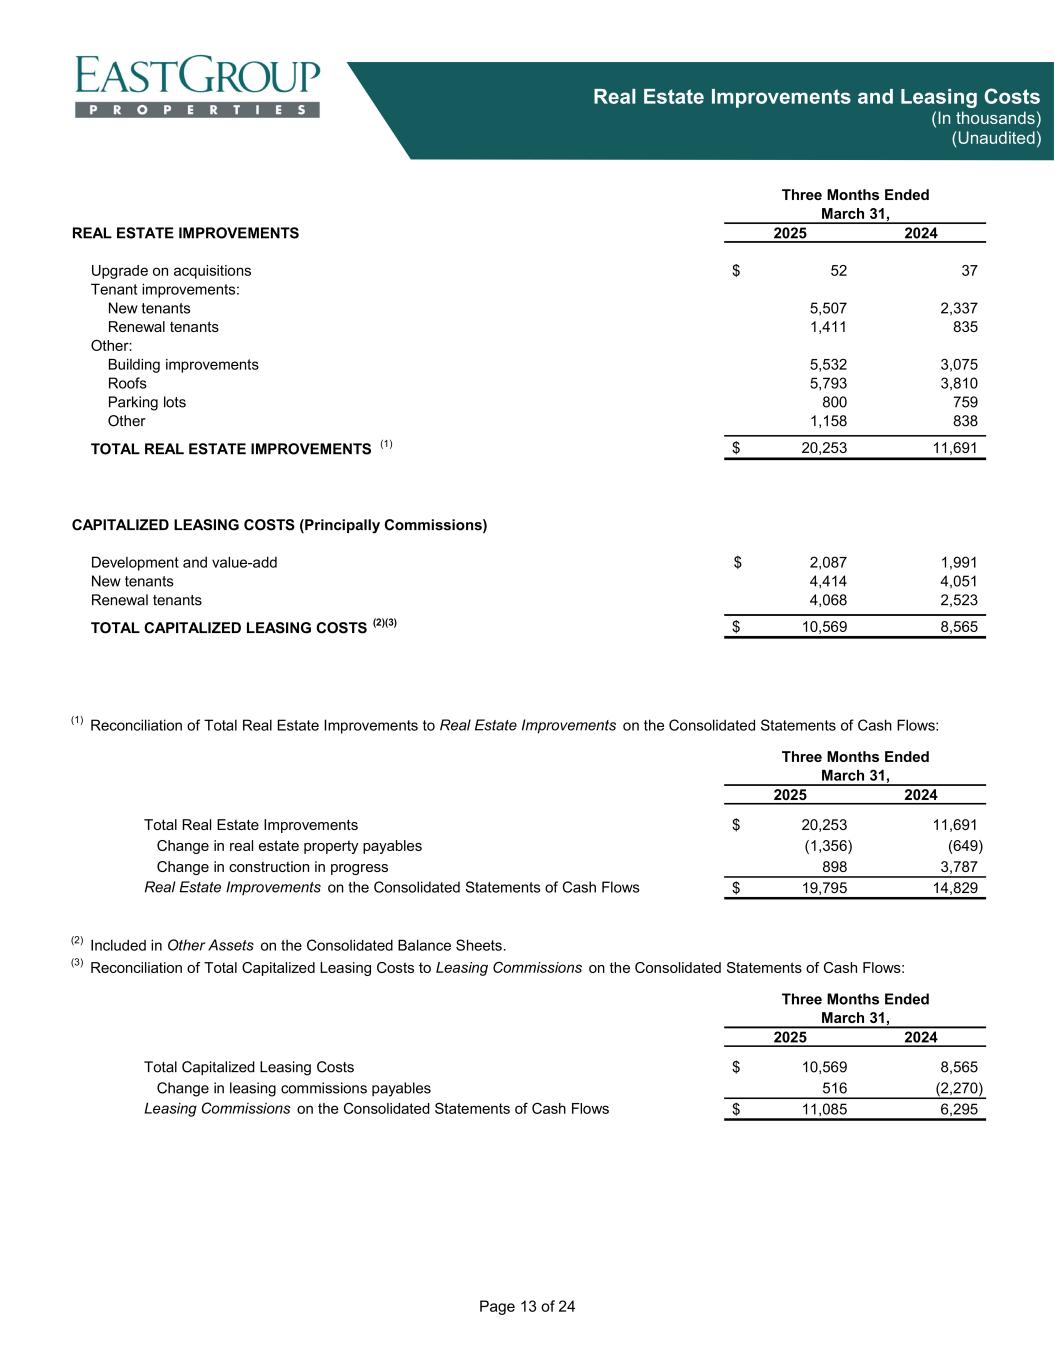
Sure. No. Good question and good morning. And it's good to see you with a new business card. Congrats on the new role, Sameer. And then in terms of leasing, maybe a little bit as I expand on it. We you know, our the two leases we've been out, for example, in Los Angeles on this building, that the terms are pretty similar, and our leasing attorneys that we use are usually pretty prompt, but we've said, let's try to move as quickly as we can in responding to their counsel's comments, getting permits, getting everything we can, because it feels like you're one new cycle away from someone saying we're going to put things on hold. So thankfully, today, that hasn't been the economics, and we I think we've always wanted to be fast on our lease on leasing, but we've said in this environment, probably there's even more of an emphasis. Let's try to turn the lease comments as quickly. Let's get proposals out as quickly as we can because you're you know, things were going great through March and they haven't certainly haven't turned, but there's a lot of reasons where people could put things on hold. And that's what we said. Okay. Let's let's take the burden hand. Let's get the deal done as quickly as we can. I think in terms of credit and things like that, we've held our standard. We haven't really thrown in more tenant improvements and things like that. That said, I would say you always have to realize I want to say just your market, but your submarket and what your competition is. I think in Los Angeles, we would probably stretch a little more just that that market still has negative absorption. Compared to Dallas, Houston, Orlando, Charlotte. There we would probably stretch a little more to make a deal. We don't want to make a bad deal and the beauty of in the industrial product, unlike some other sectors, our tenant improvements really are usually average about a dollar per square foot per year of term, and the majority of that sixty percent of that's commission. So that's where I like that our TI numbers are so much lower than other product types, and we're trying to be careful and get letters of credit and things like that. So so far, we haven't it it's been more about timing than terms, a long-winded way of saying.
Speaker 4
Thank you, Marshall. Thank you for the comments as well.
Operator
Your next question is from Craig Mailman from Citi. Please go ahead.
Speaker 5
The Dominguez building, I know you guys put that in the redevelopment this quarter. Just kind of curious, was that always the plan to put in redevelopment after Starship left? Or was that because of some of the kind of commentary you were getting from some potential tenants there. And you know, just what's embedded in guidance for the backfill of that building. I know you guys came in know, a couple quarters ahead on cons. Just kind of curious. What is embedded from a timing perspective for Starship?
Sure. Good morning, Craig. I guess a little bit just the history on that building and that'll kind of lead me into the redevelopment. We acquired this building in it was in '96. And we were fortunate enough to have the same tenant in it. Through the end of 2020. So it got dated and because it was a customs warehouse, port related, heavy tenant, active tenant use, maybe a better way to say it. We had it scheduled for a redevelopment in 2021, if you remember, that was kind of when LA went bonkers right as, you know, several months into COVID. Before we could start the redevelopments, Starship said we'll take it as is, and we were able to negotiate minimal tenant improvements and a pretty big rent bop. And then when they went bankrupt or really got into trouble kind of starting last mid last year and then the bankruptcy. So we're putting in a the sprinkler system is not more than you know, not ASFR. We're it's, again, an active use, but we've had an asphalt truck court. So we're replacing that with concrete, really modernizing the building. Motion sensor lighting, building a second office component, which really all of our buildings have so that it can be a multi-tenant building. So that would describe it as really thirty years of deferred TI that we're kind of now we have a chance to do. The good problem is it's always been leased. And then really our definition, which you may have seen the press release us and some of our peers in terms of redevelopment, all that, call it, rounding eight million that we're putting into the building, is thankfully more than twenty per well in excess of twenty percent of our base in it after thirty years. So that threw it into the redevelopment. So hopefully, we can you know, look, we've got several prospects. The activity has been good on this building. It's actually been better in the last, call it, ninety days than it's been at any point in terms of releasing it, we've just probably I won't say celebrated too early, but when you think when you have a lease out and you're going back in and forth with attorneys' comments, but that's where both of the tenants and I get it. They're both importing from, you know, Asia. Have said we're going to wait two or three months, and look, I guess they'll I'm hoping they're waiting for headlines. And as soon as they're comfortable with the environment, we've got several active prospects on the space that we can get it get at least that said, we won't be able to finish the improvements to the building. We don't have a truck court today. It'll be probably July time frame when we think we can finish all the improvements. And then we've I think in our budget, we've got it being leased several months after that. So we've kind of like cons, the big cons space. We thought we were getting ahead of this year's budget, but it's too early to tell on this one. I think we since it's in redevelopment, it's usually twelve months after you know, we finished development or this the first redevelopment we've done in about a decade, I've we're talking earlier internally, and hopefully, we can beat that year, and we'll pull it back in the operating portfolio. And that's that's been contemplated in our original budget. That we've had this pent-up need to really modernize this building. And so in our original budget, we had had it planned as a redevelopment. We had it planned in twenty-one, and then we planned it again in twenty-five.
And just to be clear, Craig, if we got this question some so in our original first guidance back in February, the Dominguez was not we did not have that included in the same store. So it was not something we changed last guide to this guide in terms of how we were looking at that. So it didn't have a we had a forty basis point increase in our same store guide this time, but that was not any part of it in terms of how we're handling that. And as Marshall said, from a guidance standpoint, we're showing a you know, a tenant maybe occupied that building in fourth quarter. So we're not showing anything imminent there. Although we're marketing the space and they've got prospects, but from a budget standpoint, we're not showing anything happening there at all. Late in the year.
Operator
Your next question is from Alexander Goldfarb from Piper Sandler. Please go ahead.
Speaker 6
Hey. Good morning down there. So a question for you, Marshall. You guys talked about delaying the development starts until later in the year, which, you know, obviously reduces the overall amount you've spent to start. But your comments on the leasing environment apart from LA seem pretty healthy. So my question is, what's really going on that's causing you to pull back on development starts? And from a tenant perspective, it doesn't sound like there's any real fear about tariffs. It sounds like the businesses are just sort of operating in whatever tariffs are going to happen people just feel like they're going to manage it okay. Is that sort of the general takeaway, or is this you know, people want to see actual tariffs in place before they start adjusting their plans. I'm just trying to understand your comments on the overall healthy leasing environment apart from LA versus your, you know, pulling back on development when it would seem that your hand is strengthening there as your merchant builders have pulled back dramatically.
Good morning, Alex. And third question, I would I would say expectations. You know, you're right. Four months end of the year, things have gone you know, as budgeted or a little ahead. So we're we've we've we've better off than we thought we would be and ultimately on our starts this year, I hope our kind of our new number, $250 million turns out to be low. We'll go this fast as prospects lease space, kind of in good or bad markets. We'll go as quickly as we can get the next building going. So but it was more with the uncertainty of tariffs, uncertainty of has the likelihood of a recession increased and things like that that you see in the news, we thought, alright. Our starts were probably could be one or two buildings to get that to that $50 million, one or two three projects. There's a good more than more chance that some of those get delayed than there was when our original budget. So in the field, we've not seen the pullback and we may not. It either it could get resolved. It may not happen, but kind of expectations are that I think a number of prospects will the corporate will say, let's put decisions on hold for thirty, ninety days, kind of like what happened to us in LA, and that could end up more likely than not that with nothing that no nothing specific identified that say three of our developments get pushed into maybe first quarter of next year, then fourth quarter this year, But we'll go ultimately, we'll go as fast as the market allows. But it was really more just expectations than anything factual today.
Operator
Your next question is from John Kim from BMO Capital Markets. Please go ahead.
Speaker 7
Thank you. You talked about LA being weak. I wanted to ask about leasing spreads you had this quarter, which were five percent on a GAAP basis, I realized it might be a small sample size, but it does seem low in light of market lengths that have increased around thirty percent over the last five years. So I was wondering if you're just being defensive ultra defensive in that market and if this will be representative of these spreads going forward in this market.
Yeah. I don't good morning, John. I don't think it's representative. I think about of certainly Los Angeles. You're right. It's a we're about five percent of our NOI in LA and just didn't have many leases roll first quarter. So there is more embedded growth in our portfolio than that shows. That said, I would say Los Angeles is one of the few markets we're in where we've seen rents go backwards, and where absorption is still negative. I think the numbers I saw were about for LA not inland empire, but LA, negative two million square feet of absorption and that was the ninth consecutive quarter. So that's really aberration to us where Dallas and Atlanta have know, multiple years of positive net absorption. So that market to me doesn't feel like it's found its footing yet, but five percent is abnormally low and I would expect as the year plays out that number will grow more in line with what you said, you know, kind of depending on where how new their how recent the leases that rolls that will do a little bit better on our release and spreads in Los Angeles than first quarter, and it's really it's just kind of a statistically odd sample set.
Speaker 7
Great. Thank you.
Operator
Your next question is from Vikram Malhotra from Mizuho House Securities. Please go ahead.
Speaker 8
Morning. Thanks for the question. So I just want to follow-up on development. You know, couple of parts to it just one, can you give us a sense of, like, what you actually need to lease up this year to kind of hit the middle of the guide or even maybe the low end of the guide? Related to development. One of your peers talked a lot about built to suit activity picking up versus last year. And I'm wondering what you're seeing in your markets on build to suit. And then just finally on that development, you mentioned higher yields or higher under or or changing underwriting. Do you mind just giving us more color there? Thanks.
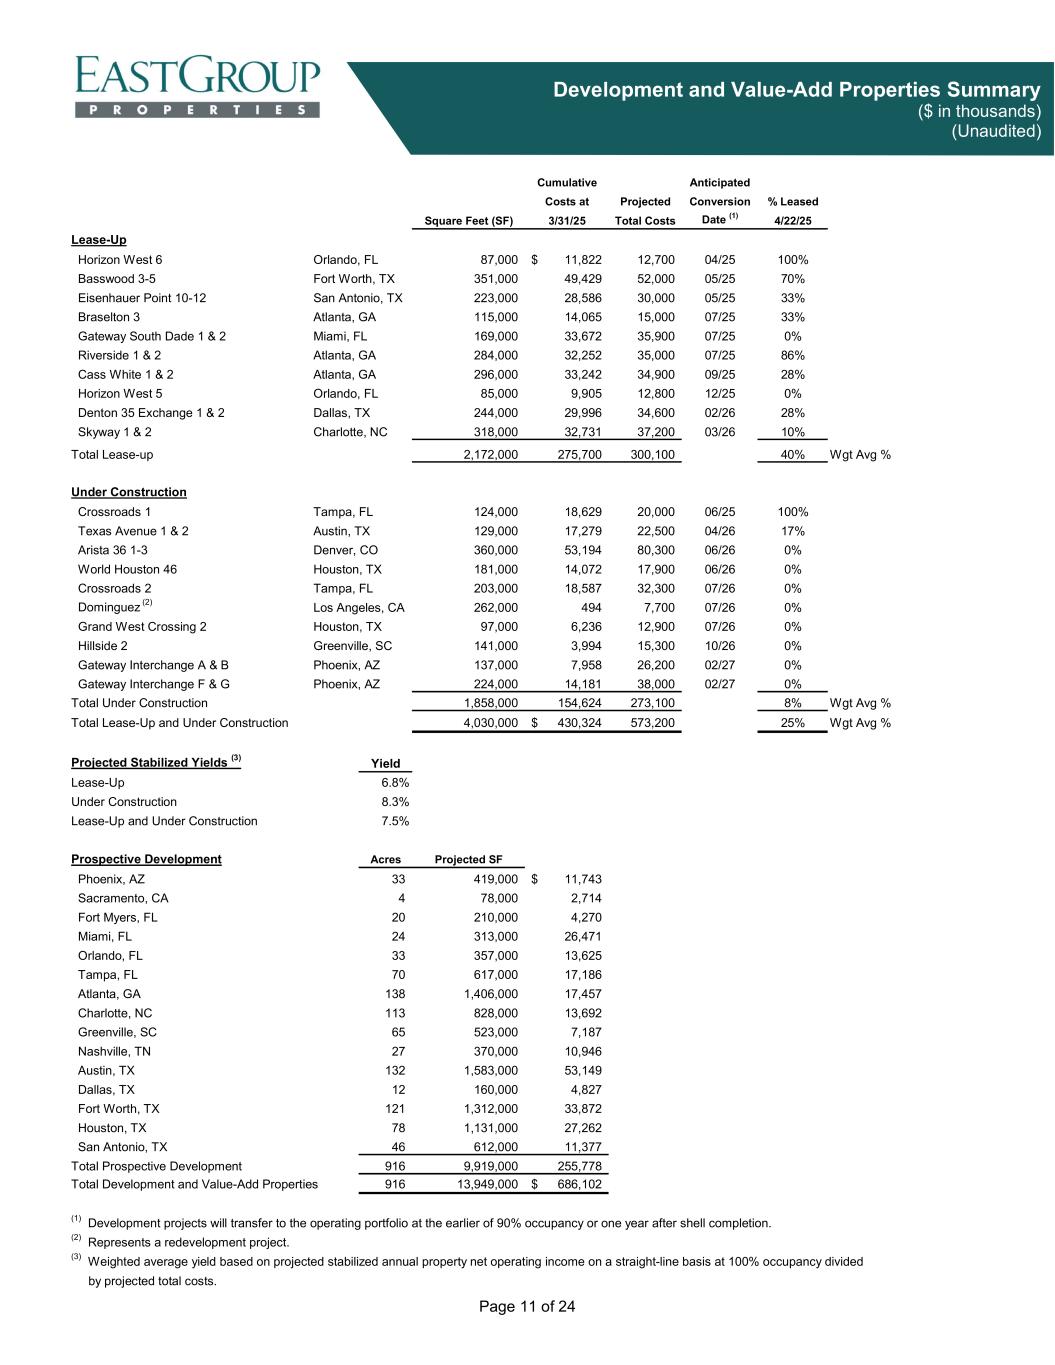
Yeah. Hey. I'll jump in. Vikram, on the first part. It from a from a guide standpoint of development, really, as Marshall mentioned, not only did we take the development start number down a little bit, we also pushed the starts back in the year. And really more just from a point of being conservative more so as Marshall said, if we can do it faster we will. We're not we're not making an arbitrary, you know, assessment of we're just going to delay. It was just more of the uncertainty of just pushing that back some. To that vein, our lease up of projects too, we we pulled that back and pushed that back a little later in the year as well. So we have de minimis, almost no FFO or or leasing income projected second and third quarter. And what we do have projected in the year is embedded in fourth quarter. So to your point of what we kind of have to take to for that to have impact, into lowers from the midpoint, it would it would have to be something that would drag through the year and prevent us from getting, you know, tenants in a few spaces by fourth quarter. So we hope that proves to be a conservative approach. But that's just what we, you know, where we stand at the moment. So we did saw soften both of those, and then I'll maybe let Marshall talk about the build a suit activity or from that standpoint. Really for us, you know, as we always have bigger with our buildings and multi-tenant style development parks, you know, build to suits are great when you can get them, but when you're building a hundred, hundred and fifty thousand square foot building designed for two to four or five tenants, you know, build a suits for us or more you know, less frequent and certainly we can have those opportunities you like to remove the leasing risk. But for us, it's not something we're seeing an increase in interest in relative to the product type we offer.
Operator
Your next question is from Ronald Kamdem from Morgan Stanley. Please go ahead.
Speaker 9
Great. Just a two quick two-parter. Just staying on the development, just any sort of quick indication of how much construction costs have gone up and which parts and which pieces of it. And what magnitude. And then the follow-up is just, you know, we've heard you know, more utilization of space from 3PLs. Curious if you're seeing that as well. And any other sort of tenant bases that are taking use it utilizing their space more in this environment. Thanks.
Hey, Ron. Good morning. It's Marshall. Yep. We're you know, much more concerned about development demand than thankfully, construction costs have come down about ten to twelve percent in the last year. And speaking with our construction team, so far, they're the anticipations we we don't really use lumber. So that won't be a factor. That's one of the items that could potentially go up. What we've heard is rebar, which I wish we'll use that in the concrete, maybe up about ten percent. And storefronts where we'll have the aluminum storefront. So I think the flip side of that, which will help industrial developers is the construction pipeline is so low and that's really across all product types, what we're hearing is that general contractors and the subs are so hungry for business and there's there's labor availability that there wasn't at the peak. So I think what impact we'll get from tariffs will be, knock on wood, pretty minimal is the feedback we're hearing. Roofing materials are largely US based. Things like that. So I think our concern are much more about you know, the numerator, the demand side than the denominator side in terms of the impacts, you know, and I don't I think in terms of utilization, probably the bigger the space, the more the tenants can invest in ultimately invest in the space, and and utilize it. Ours is oftentimes just such a fast throughput kind of like that last mile delivery. So I don't know that our tenants specifically are utilizing it's been a ten up demand that because of the economic uncertainty, a lot of our conversations over the last twelve to eighteen months have been we'd like to expand and I'm trying to get corporate to give me approval. So that's probably in itself led to more intense utilization of their space, but what we're excited about if we can get that kind of clear runway like we had in fourth quarter and first quarter, you saw the leasing volume on how well our type buildings were kind of leasing the ten development leases. That we've gotten signed year to date including several of those were April second. So we're happy to see that volume. And I think it's there. We just need a little bit of a stable economy and our model works really well is what the last two quarters have shown us.
Speaker 9
Helpful. Thank you.
Operator
Your next question is from Todd Thomas from KeyBanc Capital Markets. Please go ahead.
Speaker 10
Yeah. Hi. Thanks. Marshall, you mentioned in your prepared remarks that you raised your threshold for new investments. And, Brent, you touched on some of the changes you made to the outlook related to development starts, but curious if you can talk about acquisitions and provide an update around how you're thinking about return thresholds for acquisitions. And can you comment on whether you've seen any change in sellers' willingness to transact or any deals, you know, pulled from the market or any fallout related to some of the uncertainty here over the last, you know, few weeks?
Yeah. Hey. Good morning, Todd. On acquisitions, kind of I guess, it's again, it's only been a few weeks, but what we've done there were a couple projects. One, we were kind of in the last you know, rounding third on an acquisition. We hadn't been awarded it, but we were one of I think two or three. We were very open with the seller that given the change in capital markets that we were valuing it differently. So we ultimately, which we never do, resubmitted our third offer at a probably a fifty to seventy-five. I'm trying to do it from memory. Fifty or so basis points higher yield. That went ahead and went through. We were the only public bidder at that point. I don't want to violate our confidentiality agreement, but that one didn't retrade. But we pulled back on a couple of acquisitions. We maintained our acquisition guidance in terms of volume at $150 million for the year, but we moved it to later in the year, really, and our thoughts were our own cost of capital you know, has moved higher and our ability to issue equity that window closed. So we want to be very careful with our own capital. I'm glad we have the Brent and the team had the equity forwards raised and our line of credit has nothing on it, but our access to capital suddenly changed in early April, and we want to be very prudent in how we use it. So we backed away from a couple of acquisitions. I hope I don't regret them later in the year, but at the time, we thought it was the right thing to do. One acquisition, I just heard that seller's expectations so two things we've heard. One was a twenty-five basis point increase in the cap rate they were expecting, which we didn't view that as enough to really pull us back into the bidding process on it, and we'll see where it ultimately and both of these were new and late multitenant, at least, kind of EastGroup type properties. Projects, and existing markets. And then I have heard from the brokers that there's several sellers that may shelve their listing and come back to market later. So I thought, look, uncertainty is usually when we found our best opportunities. And it may not help this year's budget, but patience is usually rewarded. So we've just said, let's wait for both of these were good investments, but they weren't compelling enough given the environment. So that's what we've kind of said. Let's be a little more comfortable before we break ground on the next development and be a little more enthusiastic about our net. Not that we weren't enthusiastic, but we didn't think either of these were steals. We were just paying market for good properties long term. So we backed it. We backed away from a couple of things, and I've not really seen in the market it play out. One went through as priced, One, I'm hearing, is moving back up twenty-five basis points. We'll see if the brokers call us back at an even better price next week. We'll see.
Operator
Your next question is from Omotayo Okusanya from Deutsche Bank. Please go ahead.
Speaker 11
Yes. Good morning, everyone. So just wanted to stick on this topic of tariffs. And the belief that maybe that kind of drives more manufacturing to happen within the US. Kind of curious just you know, the whole idea of onshoring how you kind of think about that, whether you think that can actually be a reality this time around. Versus in the last Trump administration where it was also potentially discussed, but we just didn't see a lot of onshoring activity.
Good morning, Omotayo. Know, one, the questions I'm qualified to answering questions I'm not. Look, I think the administration's goal is clearly to have more US-based manufacturing. I hope that happens. If it does, it's good news for EastGroup in a couple ways. One, it'll be a slow-moving train to build the factory and get the production in, but we've certainly seen it in places like Austin with Tesla, a lot of the green energy. Some of this we're servicing in Dallas, one of the semiconductor plants that are new. Where it'll where I say it'll help us probably in twofold. There's a good chance those manufacturing plants will be in a Sunbelt market. They'll probably be in the Carolinas, in Georgia, Texas, Arizona. It'll probably more likelihood than in New England, you know, typically or that's where they haven't gone to California, things like that. And we'll pick up the supplier. We won't have the plant, but there's a good chance we'll have the supplier to the plant. So I hope that's true. And then the other thing that may be more likely than potentially onshoring, it seems like and again, this is outside of my well, outside my expertise, but that if you think who will be the trading partner that ultimately lose, stands to lose the most would be China, and that's been the trend, the China plus one manufacturing. I think Mexico will be a net winner of that, and we're certainly running from San Diego through Arizona and Texas. Have a like those markets in and of themselves. Phoenix is a good market. That also happens to be near Mexico. Same with Dallas and Austin. So I like that we're I think if we have near shoring, we'll be a beneficiary in those markets. And they'll be fine with or without it. But I think the know, I think it's coming. I think it'll just be it it's been coming. It's just been a slower play. We've seen El Paso there for several years where we were you know, experiencing doubling of rents on our release and El Paso slowed down a little bit, but we were doubling rents in El Paso for two or three years for the first time. And fifteen or twenty years. Ever, as Brent just said.
Operator
Your next question is from Mike Mueller from JPMorgan. Please go ahead.
Speaker 12
Oh, hey. Quick question on development. Are there any specific characteristics of the developments that you essentially took out of your start guidance versus the ones where you think you'll move ahead with sooner?
Hey, Mike. Good morning. No. Nothing. It was more nothing specific. It was know, if you ask the field, probably development starts will be pretty similar to what they thought. Our original budget. It was more like, especially if it's wrong, I won't pull Brandon. It was more our own unease over you know, where the economy was heading and that we've said, alright, look, it's probably going to probably not going to this cloudiness won't speed up development. It'll slow it down. So without any specific markets, we said, alright. Maybe I could see maybe three projects around fifty million getting kicked down the can, you know, time wise a little bit. But not that they won't happen. They just may happen 2026 rather than 2025. But, you know, if the tariff discussions get resolved more quickly, they could they could easily see us moving back to three hundred. The optimist in me could see us easily moving back to three hundred or above wherever the market kind of as much as it lets us do.
Speaker 12
Got it. So high-level change as opposed to just on the ground project changes.
Operator
Your next question is from Rich Anderson from Wedbush. Please go ahead.
Speaker 13
Thanks. Good morning. So, Marshall, you said, at the outset, active prospects remain active. Which is good, but perhaps hesitant. I'm wondering if you guys can draw any similarities to times of the past about how to manage the current situation? Because it seems to me if the concern is a recession, it doesn't it doesn't appear like there's a building block for a deep recession to take place. So if there's this pull forward of demand scenario that, like you seen in the early stages of the pandemic, are there similarities in terms of the cadence of how things might go from here that are guiding your decision tree? You know, you mentioned reducing development, but you could turn that on pretty quickly in this space and in your world. So I'm just wondering, how much you're looking at past periods to guide you in the future. That would be my question. Thanks.
Good morning, Rich. Thanks. I think this one is a little different to me, and that when I think of COVID and the GFC or even way back when the tech bubble and some things, those were to me, years in the making and weren't very quick fixes. This one feels you know, sudden suddenly hit and man-made. And so it could maybe go away just as quickly if they announce trade agreements with a number of countries this could dissipate more quickly than the subprime mortgage crisis or some things like that. It and we're not I'm grateful we're very tenant diversified and close to the consumer, and that we've in other meetings, we've reminded people, look, we've been in markets like Houston and Jack you know, thirty years, but we're not near the port. We may have missed some opportunities not being at the port, but we've always wanted to be near the consumer. So if it does affect us, it'll affect us more in the more than global trade. That'll be a recession. I like your optimism that you don't that the fundamentals aren't there, and you're right. Our active prospects, when I talk to the teams in the field, tariffs don't often come up in our conversations unless they've been watching our stock price or reading the Wall Street Journal, thankfully, today. So there's that dichotomy. This one does feel a little different, but we've said really, this year, we've talked to our own board about capital market. It's going to be the world seems so much more volatile. So when the window's there, let's either raise the equity or let's make sure we get the lease signed before the next tweet comes out or something and people's it does feel like when things get bad, they get bad in a hurry, and they get they improve gradually and get bad in a hurry. So we've said, let's don't. Let's get the lease signed. If you're comfortable with it, we don't have to negotiate, you know, to the nth degree of everything. Done is better than perfect sometimes. So that's kind of where we typically are, but that's what we've really emphasized with the team here in the last since April second. Done's better than perfect.
Yeah. I would just add to that, Rich. It's kind of like a to use an analogy, kind of like a good recipe. You don't in markets like this, you don't doctor it. You just if you have a good recipe, you just execute it. And we've had a long track record of doing that. So as Marshall said, in this, you're just heightened awareness of executing what you do. Again, a long track record of doing what we do. And as Marshall mentioned earlier, a lot of times in uncertainty, it can, you know, create maybe even opportunity to get something disjointed and something breaks loose from someone else and say you keep your eyes open for those opportunities as well. But we've got a long track record of and a great balance sheet to handle whatever comes our way. But I think it's just heightened awareness of executing and kind of sticking to the blocking and tackling of your core business, which we've had you know, a long track record of doing.
Speaker 13
Great. Thanks, everyone. Appreciate it.
Operator
Your next question is from Michael Carroll from RBC Capital Markets. Please go ahead.
Speaker 14
Thanks. Marshall, I wanted to follow-up in your comments regarding the acquisition market and how you changed your underwriting or looked at an asset differently that caused you to increase the cap rates by fifty basis points, I mean, can you provide us some details on how are you looking at that acquisition differently? I mean, did you change your cash flow assumptions, or did you just increase your return hurdles just given the market uncertainty? I guess, how specifically are you looking at that differently now?
Yeah. That was and, again, right or wrong, it was a newer asset, existing market leased, credit you know, I'll credit the sellers. They had a good price on the market. It was more our own access to capital, you know, we've been able to use Brent and the team our ATM fairly regularly. We knew that window was closed. We thought uncertainty as Brent mentioned leads to offer and we felt like this was a good but not a great investment. So we said, alright. What makes it a great investment? And maybe very creative? We thought fifty, sixty basis points, a little bit lower price per square foot. Long term and a little better yield mark to market going forward. And again, the market we blinked maybe, but the market didn't. It hasn't closed yet. But the market went forward. But it was really thinking, well, let's be not that we're not always mindful of how we use our cap but when that window is closed, we and also closed for the world for a little bit, that let's have that flexibility. There may be some opportunities coming. And this was a good but not great opportunity, and we've kind of you know, backed into in a quick manner where do we think where do you feel like this becomes a compelling investment, not just a good investment?
Operator
Your next question comes from Michael Griffin from Evercore ISI. Please go ahead.
Speaker 15
Great. Thanks. You know, just kind of curious your thoughts on sort of the tenant health environment. And, you know, I realize that you have a very diversified tenant base, but, you know, I imagine that, you know, if there are cost pressures on some of those maybe small and medium businesses that could be occupancy your facility, you know, they could really feel maybe more of a squeeze on margins. So you give us a sense, you know, are you monitoring anything there? You know, is there anything we should kind of keep in mind from that tenant health perspective, particularly for that cohort of tenancy.
Yeah. And, Griff, welcome aboard. Good to have you good to have you following us. We appreciate it. Yeah. Our tenant collections, I mentioned, sort of in the prepared remarks, begin remains healthy. You know, that said, we're still looking to be in that. I think as I mentioned in the comments, that forty to fifty basis points of uncollectible rent relative to our overall revenues, that's just slightly ahead of sort of our historical average, a little bit below where we were for 2024. So first quarter was kind of, you know, running the way it has been lately. And as of now, we're not projecting much of a change in that. You know, someone asked me the other day about rent you know, about tenant health since April second, and, like, we haven't even had another rent check come due yet. Like, literally, May's rent didn't even do yet. So, you know, it's early. And to the extent that it might impact, we'll see our portfolio and our tenant base you know, us being in the high growth markets near the rooftops we've tended to move more with the overall economy of the local metropolitan area and less with if container traffic slows coming in and out of Asia or somewhere else. So that would be to say, I think it would take more of a trickle through process and for the consumer ultimately to get hurt for it then to feel more into our portfolio if that were to happen. But the tenant health's good. Our you know, California last year was about eighty percent of our bad debt. In the first quarter, that was fifty percent. So still, you know, a more proportionate share relative to the group. But that said, just seven tenants comprised almost ninety percent of the bad debt in first quarter. So it still is a manageable figure, and again, just maybe slight uptick from historical averages, but you know, first quarter was kind of the same cadence that we had experienced last year. So, you know, as of now, that's until we're until we see something different on the ground, that's what we've dialed in and that's what we're anticipating.
Speaker 15
Great. Thanks so much.
Operator
Your next question is from Vince Tibone from Green Street. Please go ahead.
Speaker 16
Hi. Thanks for taking the question. Can you discuss just how much additional development leasing that has not yet occurred is included within FFO guidance? Like, how many, you know, cents is kind of in speculative, if you will, from you know, just the additional stabilization of the lease-up pipeline.
Yeah. It's as I mentioned earlier, we've not put an exact number out there because again the leasing is fluid and one of the reasons we're Marshall mentioned, we've signed three leases since we even prepared the budget. You know, obviously, the budget gets prepared in advance of the documents going out. And so some of that has already been made its way through, but it's more fourth quarter weighted. You know, hesitant to give a range, but it's more in that, I would say, five to six cent range total for the year in terms of spec amount that we would need to accomplish again back end weighted. And some of that has taken place, so that's not a like I say, that assigned assumptions are. But we did take that number down relative to what it was our last original guide in February. So we pushed it back and took it down. And just to put that in context, that's a pretty low figure for this time of year for us given that we typically do just strictly spec development. And so that figure is lower than it would be in a typical if we were ginning along at a little higher, you know, development pace.
Speaker 16
No. That's really helpful. I appreciate the color. Thank you.
Operator
Your next question is from Nick Thillman from Baird. Please go ahead.
Speaker 17
Hey, good morning out there. Maybe just two quick ones. Brent, first, on bad debt as percent revenue for the first quarter, what's the exact number on that?
The exact number for those sitting on the edge of their seats here, let's say I've got it was 0.49%. And we're showing about 0.45 and we've got dialed in for the year about 0.45. So I mentioned, we're kind of depending on quarter. And you know, the first quarter was obviously actual, then the other three quarters are more not tenants placeholders. And, like, say, I think we're showing I said, forty, fifty basis points, and literally, I think forty-five is what we're showing for the average for the year.
Speaker 17
So that's helpful. And then just last one kind of on development yields. Obviously, in the supplemental numbers kind of went up. You commented a little bit on construction costs in certain markets coming down a little bit, but maybe talk about market rent growth dynamics you're kind of seeing in each of the markets. And what's driving sort of the yields between the cost versus just rate growth?
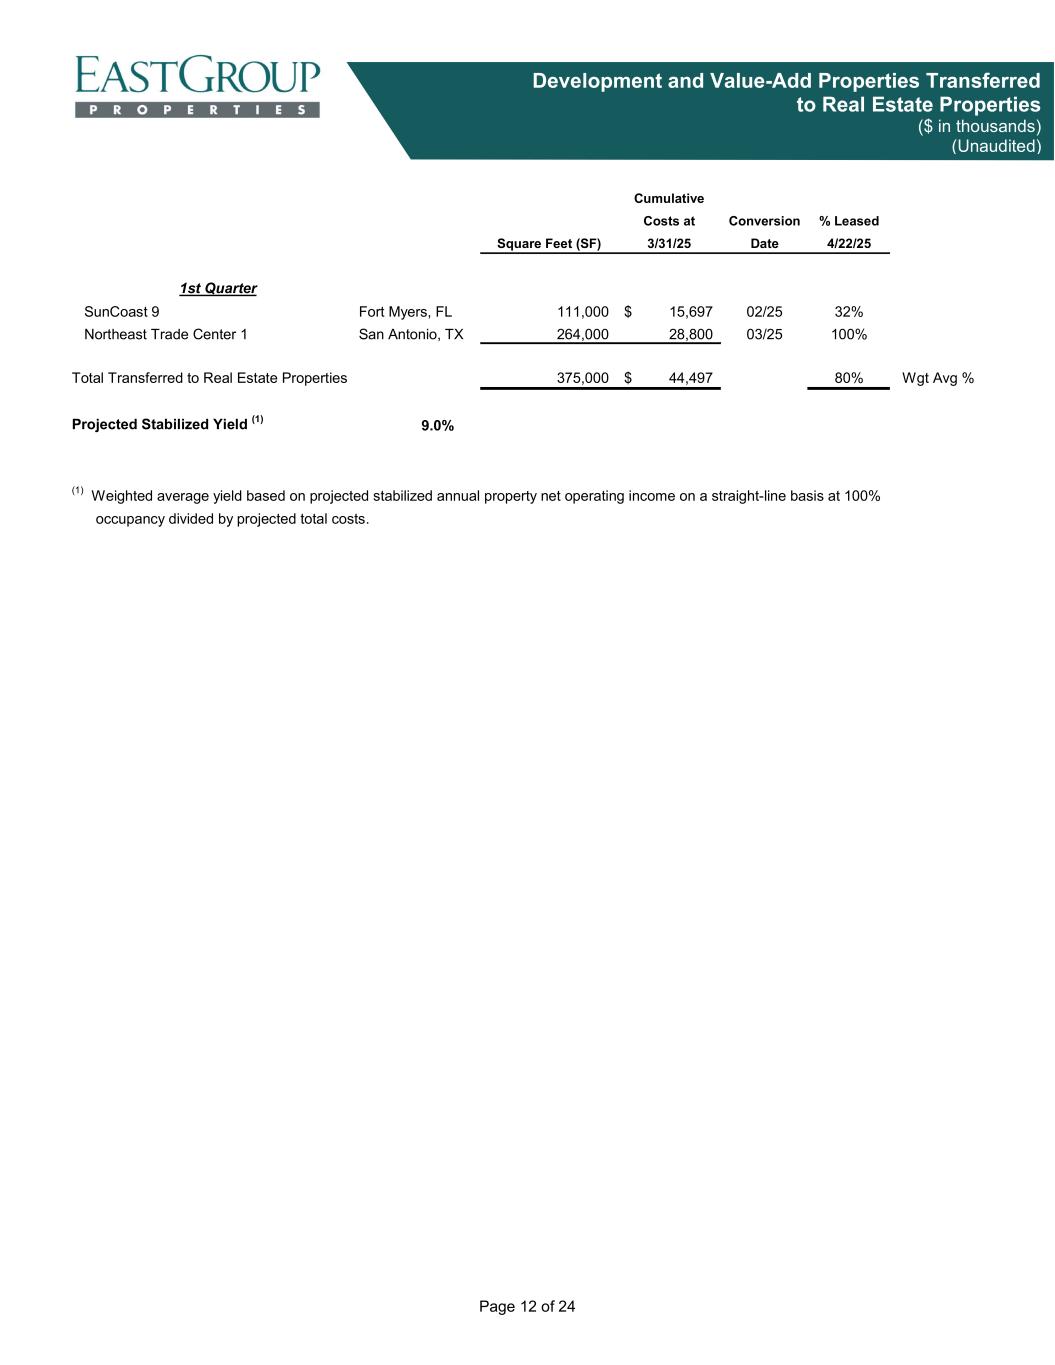
Yeah. We've we were happy, like well, I guess, so that Good morning, Michael. That's the developments that we've delivered, we were actually at a nine percent, which was a good bit above what we had underwritten. One of those, the larger of the two, was a prelease in San Antonio, so we were happy. We had a good land purchase. We had no carry because it got leased, and it was a was a one of a prelease or build to suit for that tenant. So happy to get those yields. They went up. It's really been more rent growth, and I would say you know, we were feeling pretty good about rent growth. It's awfully new now, but I'd say absent Southern California, probably inflationary. But and the optimist in me when I look at how low the vacancy rate is so we're about three percent vacant within EastGroup's portfolio, and our market. Usually, where there's kind of rule of thumb where there's vacancy in a market, the bigger the space the higher the vacancy rate. Our ninety-two percent of our rents come from tenants under or maybe a couple of stats, ninety-two percent of our rents come from tenants two hundred thousand feet and below, and seventy-five percent of our revenues come from tenants under a hundred thousand feet. And that's where there's just such a low vacancy rate. It won't take a lot of stable demand to work through call it the four percent market vacancy, and there's just an empty pipeline that we think we'll have a real jump, especially on our private peers. To get back into the development game, and you can we can deliver a building in eight or nine months. So that's where we really get excited is when things do turn and I've been predicting the turn way too early so far, but that I think we'll have a good runway of development coming out and that'll that'll push rents and ramp up our development pretty quickly when and if we get there. We were certainly moving there the last six months, and we'll just see how this plays out in this near term. But so far, still so good so far.
Speaker 17
Very helpful. Appreciate it.
Operator
Your next question is from Brendan Lynch from Barclays. Please go ahead.
Speaker 18
Great. Thanks for taking my question. Marshall, you talked a bit about tenant diversity and low correlation of rent from individual tenants. How should we think about the correlation between customers serving similar end markets and how they will perform if we enter a recession?
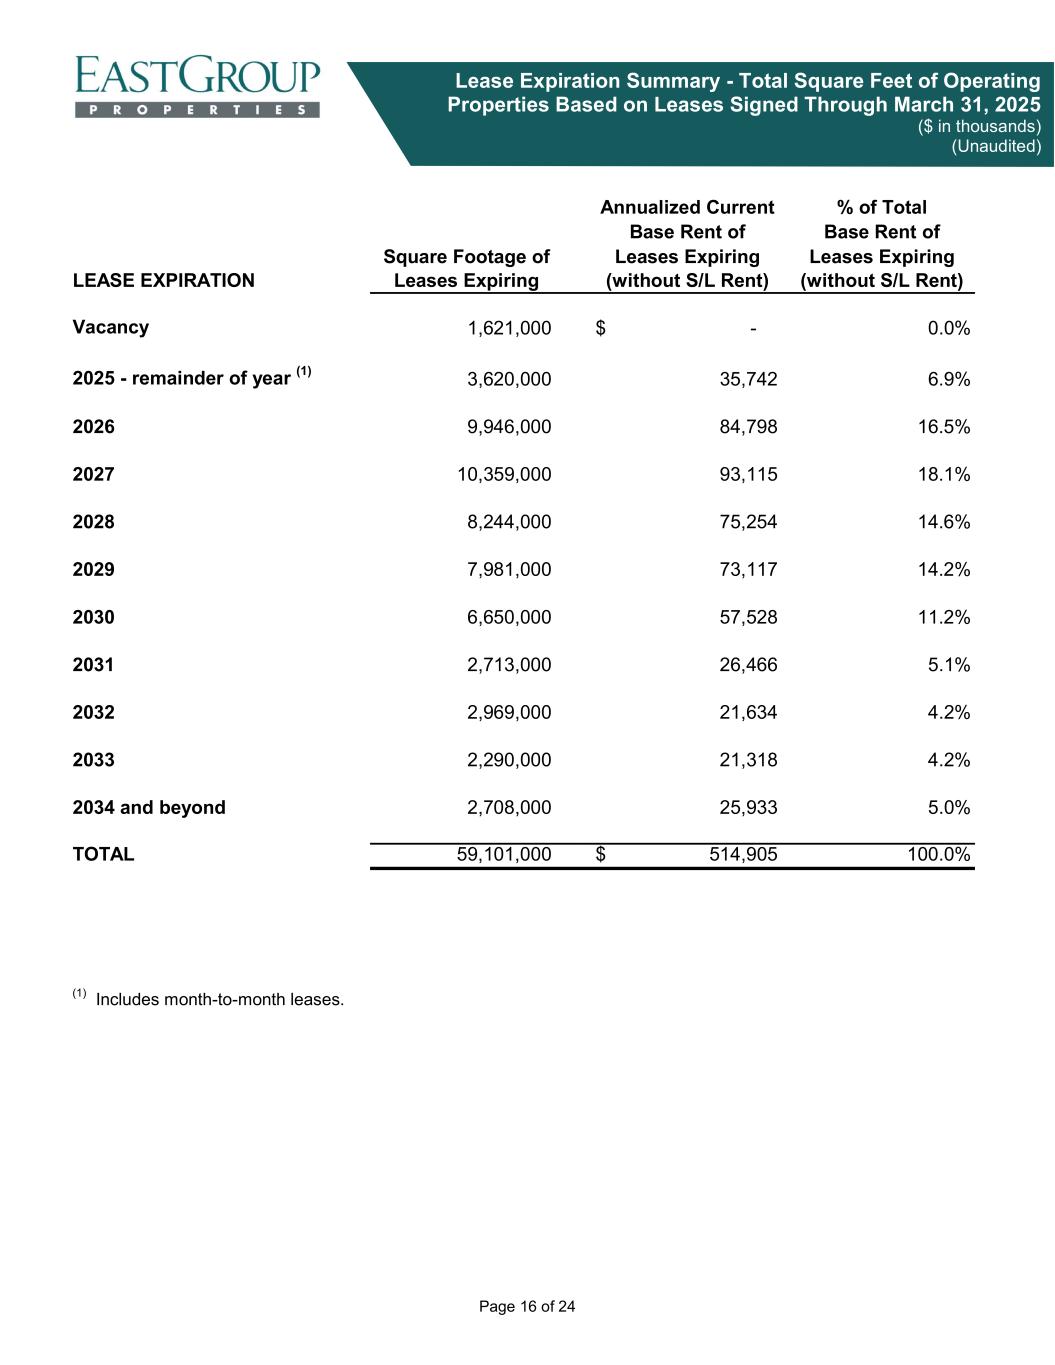
Yeah. I mean, I think that's our fear is really of not you know, just the as a recession and where it shakes out things that make me feel better, what we've said, I like our kind of defensive positioning that thankfully, in a growing market with a growing e-commerce component that you're that just those two in themselves are going to lead to more demand. And I we also see within our tenant base kind of our tenants or that customer, part of their strategy is the faster and faster you can deliver whether it's goods or services, that's where the market is going. So it's pushing all of our tenants to have that you know, kind of hub and spoke last mile delivery. So we like that. In terms of just being a little more insulated than say port related, things like that. But I do think you know, I like that we're down below six percent of our leases rolling for the balance of the year. We're ninety surrounded. We're around where we ended the quarter still around ninety-seven percent leased. So we feel pretty good about that. And as Brent mentioned earlier, bankruptcies, but it is that if the if the we're really consumer dependent, and if the consumer starts to really falter, it will our balance sheet safe, but I'll worry out of fourteen hundred tenants. How many of them get pulled under that.
Speaker 18
Great. Thank you for the call.
Operator
Your next question is from Alexander Goldfarb from Piper Sandler. Please go ahead.
Speaker 6
Hey. Thanks for taking the follow-up. Just Marshall, just you know, not necessarily your real-time leasing discussions, but just tenant conversations in general. As people contemplate all the different tariff headlines and reports that we're all reading, what are the tenants really saying about how they're thinking about their business? Meaning, are they concerned about simply cost going up or are tenants you know, more concerned that their actual business you know, may you know, close or cut down or I'm just trying to understand. Obviously, there's nervousness over is there a recession or not. But if you're trying to think through about the ramifications what is really their biggest concern? Is it more the cost of operating or that their actual business may be diminished.
I don't think it's as so far, thankfully, not. The tariff discussions are much more related. I've kid it. So the closer to New York you are, the more tariffs are in a conversation. That it's been much more capital markets Wall Street than in our tenant conversations. And it's been more about does the space work, what tenant improvements, negotiating terms. I was, you know, reading a list. A couple of your peers mentioned our Tampa example, our Tampa occupancy went down, and it's a handful of tenants. But when you look at what happened, there was it it wasn't nothing was tariff related. It one company got bought, one shut down US operations, things like that. It really wasn't it it was not related. It's really making sure their business model works and sometimes it's getting the right amount of square footage where they're debating how much square footage do we need, and that in this environment, that's what I've heard some of the brokers say that, you know, the tenant rep brokers, every time we meet, the tenant tells me they need twenty thousand, fifty thousand, you know, it's a moving target finding the right space. So it's been more that related than my costs are going to go up as a result of tariffs.
Speaker 6
That's helpful. That is. That is. Thank you.
Operator
Your next question is from Blaine Heck from Wells Fargo. Please go ahead.
Speaker 3
Great. Thanks for taking the follow-up. Several of your peers ran a stress test analysis on their operating metrics to indicate whether, you know, a significant deterioration in fundamentals could still result in earnings within the guidance range. It does seem like you guys are in a more stable position than peers thus far, but I'm curious as to whether you went through a similar exercise. And if so, which metrics were stressed and by how much and kind of what the end result was?
Yeah. We did. Blaine, we looked at that. Looked at occupancy. We looked at what if no more development leasing during the year? What if we don't have any more development starts? What if bad debt were to double? But then you get into does that happen today? Does that happen August one? Does that happen? And we kind of as we were doing that, it kind of reminded us why we're not big on IRR models, the more you played with the different components, the more you played with them in dire situations, the worst the result were. So we looked at it. We feel, you know, again, we feel good about where we are. Obviously, we not only reiterated guidance, we actually bumped it a cent after a strong first quarter. So, you know, don't really want to put numbers to it because it's so many variables and obviously, like I say, even looking at something like bad debt or occupancy. Okay. Not only do you lose two hundred basis points, but at what point do you begin to lose it? You know, as we sit here in April, we're one third of the year, and we haven't lost it. So we looked at it, and it would take some serious stress to push us out of the low end of the range. Let's just put it that way. And a third end of the year, you know, we're not seeing or feeling that at the moment. And as you mentioned, we're, I think, a little bit more slightly insulated from that with our business type and reminder to our balance sheet, you know, we're in a position where we hope to do things as we've talked about today, but we don't have to do anything. And we're in a very good position. So we stress tested it and more for our own internal you know, I would also mention that we continually stress test our cash flow as well. And it's not just happenstance that we had a good draw on the forward and our revolver available. We've always been looking at our needs for capital, and we've always looked twelve months out and to make sure if the even in good times, if the world stopped tomorrow and we couldn't raise another external dollar, we want to make sure that we've got our immediate cash needs taken care of for an extended period. And so we've always stress tested.
Operator
There are no further questions at this time. Please proceed with closing remarks.
Thank you everyone for your time and your interest in EastGroup Properties, Inc. We hope we got your questions. If not, we're certainly a phone call or an email away. And look forward to hopefully, there's a couple of conferences coming up here in the next month, six weeks. We see you there. So thanks for your time. Have a great day. Thank you.
Operator
Ladies and gentlemen, this concludes your conference call for today. Thank you for participating and ask that you please disconnect your lines.