Operator
Good morning, everyone, and welcome to the FB Financial Corporation's second quarter 2026 Earnings Conference Call. At this time, all participants are in a listen-only mode. Following the prepared remarks, we will open the call to questions. Please note that today's conference call is being recorded. At this time, I would like to turn the call over to Rachel Dureski, Financial Management Associate for FB Financial. Please go ahead.
Thank you and good morning, everyone. We appreciate you joining us today for FB Financial's second quarter 2026 earnings conference call. Joining me on the call this morning is Chris Holmes, President and Chief Executive Officer, and Michael Matit, Chief Financial and Operating Officer. Before we begin, I'd like to remind listeners that during today's call, management may make forward-looking statements regarding the company's plans, expectations, and outlook. These statements are subject to risks and uncertainties, and actual results may differ materially from those discussed. Additional information regarding these risks and uncertainties, including risk factors that could cause actual results to differ, can be found in our earnings release, our most recent annual report on Form 10 , and our subsequent filings with the Securities and Exchange Commission. FE Financial undertakes no obligation to update any forward-looking statements except as required by law. In addition, today's discussion may include references to certain non-GAAP financial measures. Reconciliations of these measures to the most directly comparable GAAP measures are available on our second quarter 2026 financial supplement posted to the investor relations section of our website at www.firstbankonline.com and on the SEC's website at www.sec.gov. With that, I'll turn the call over to Mr. Chris Holmes.
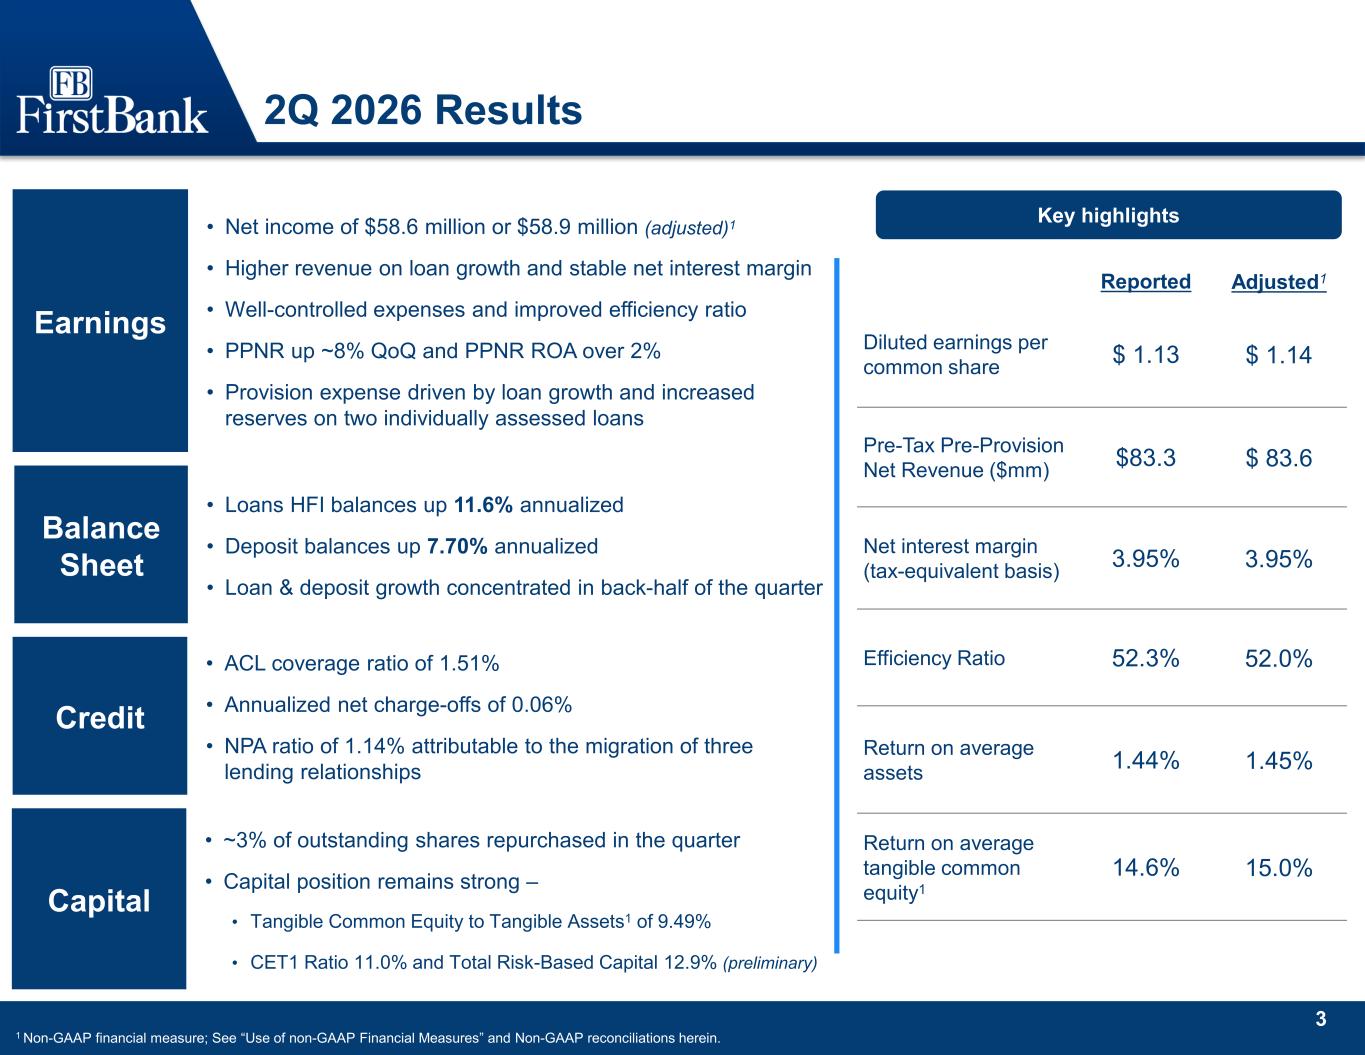
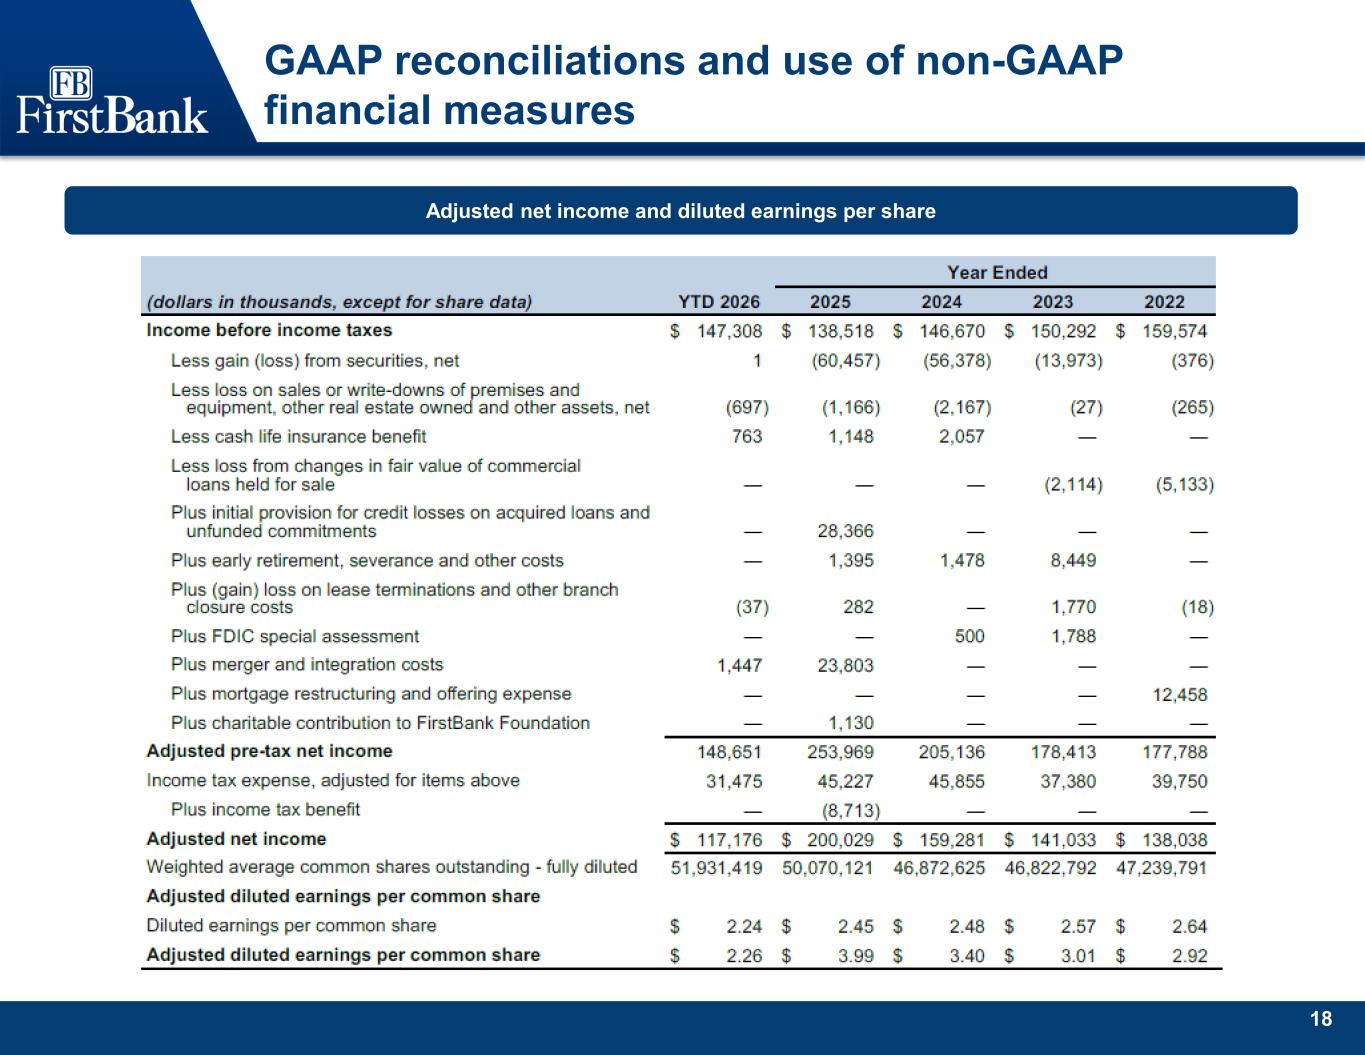
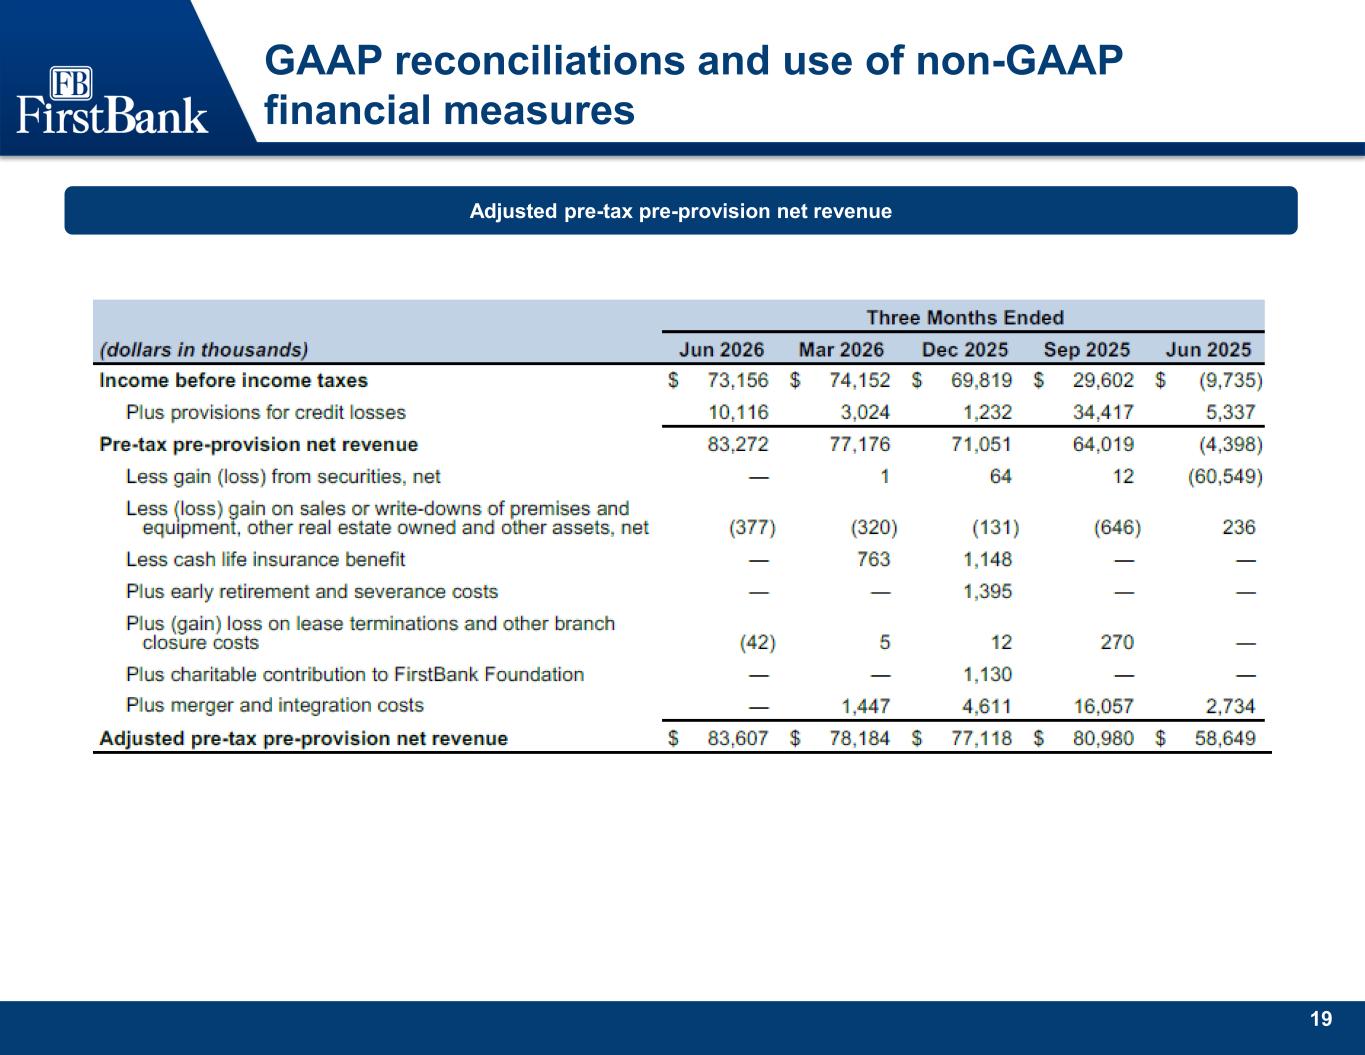
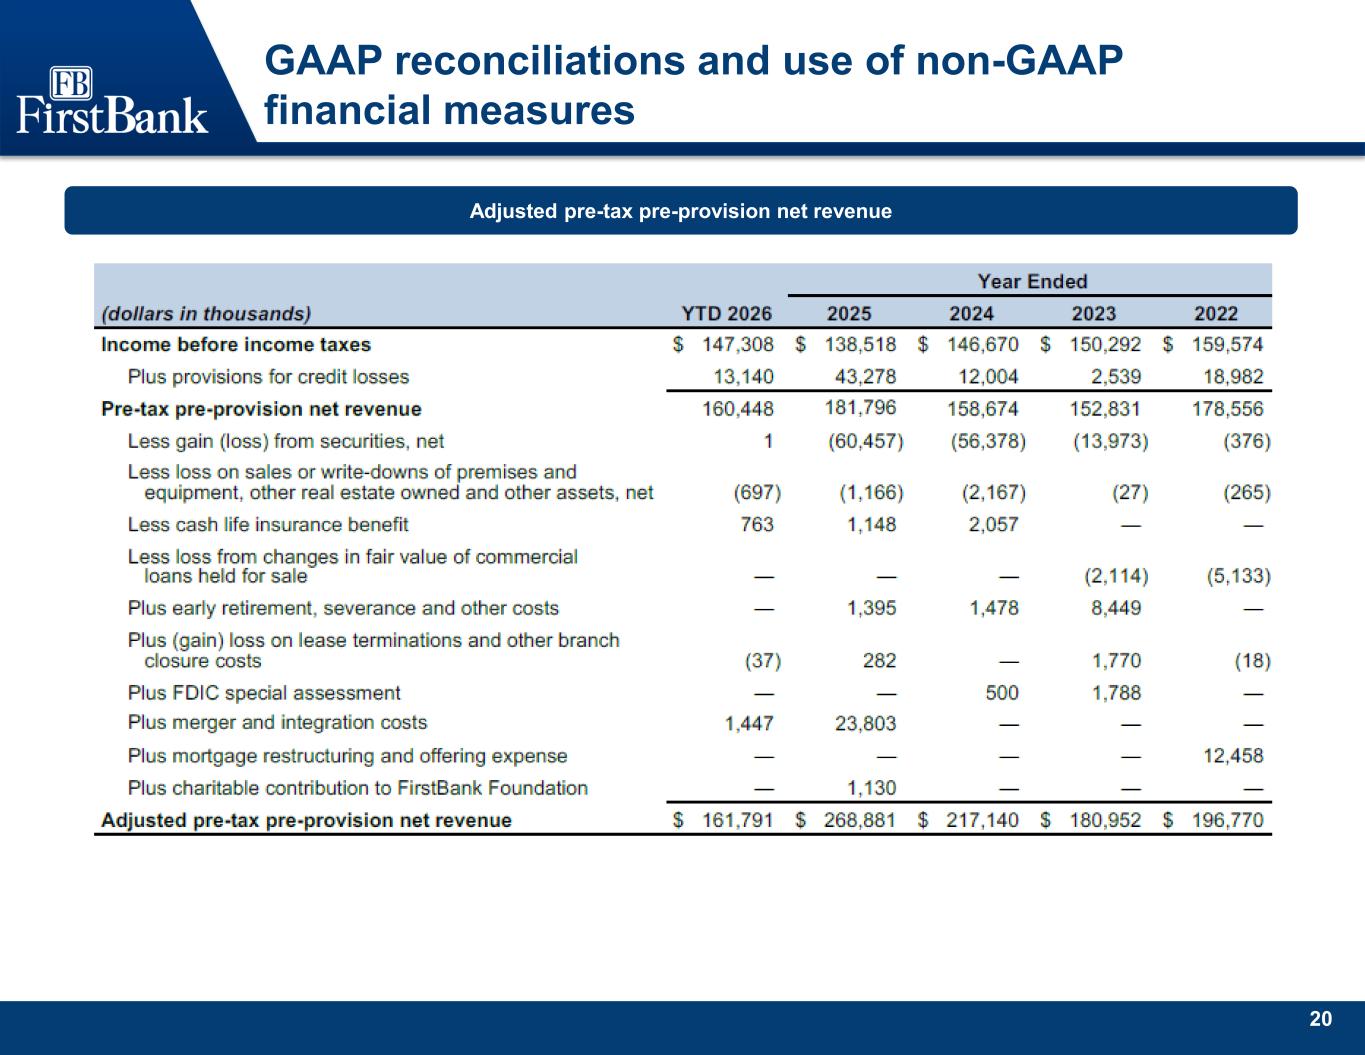
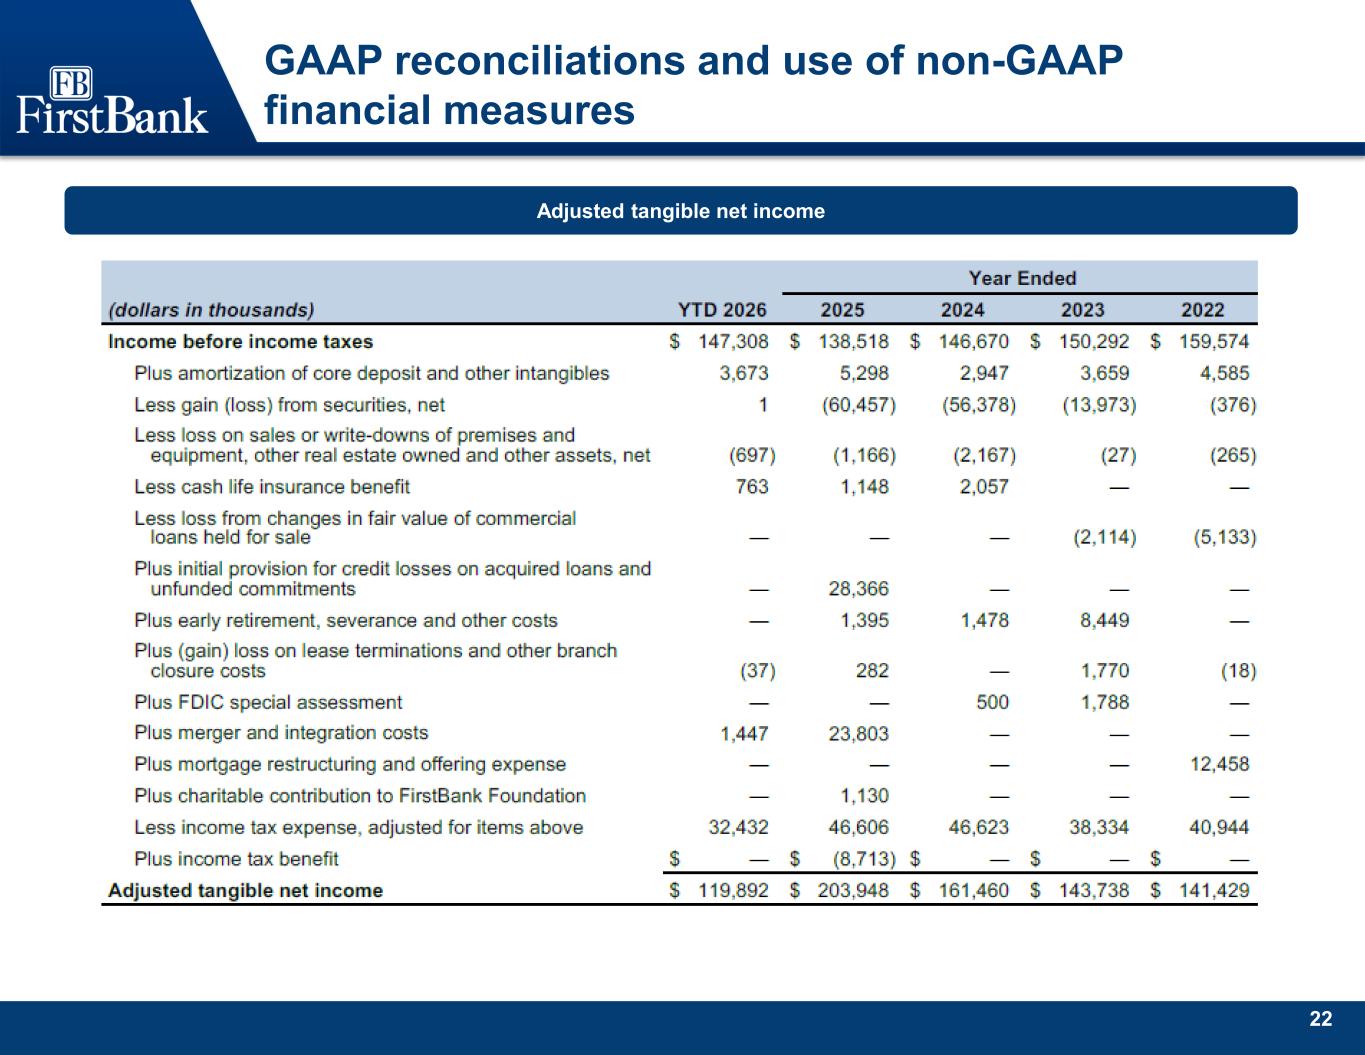
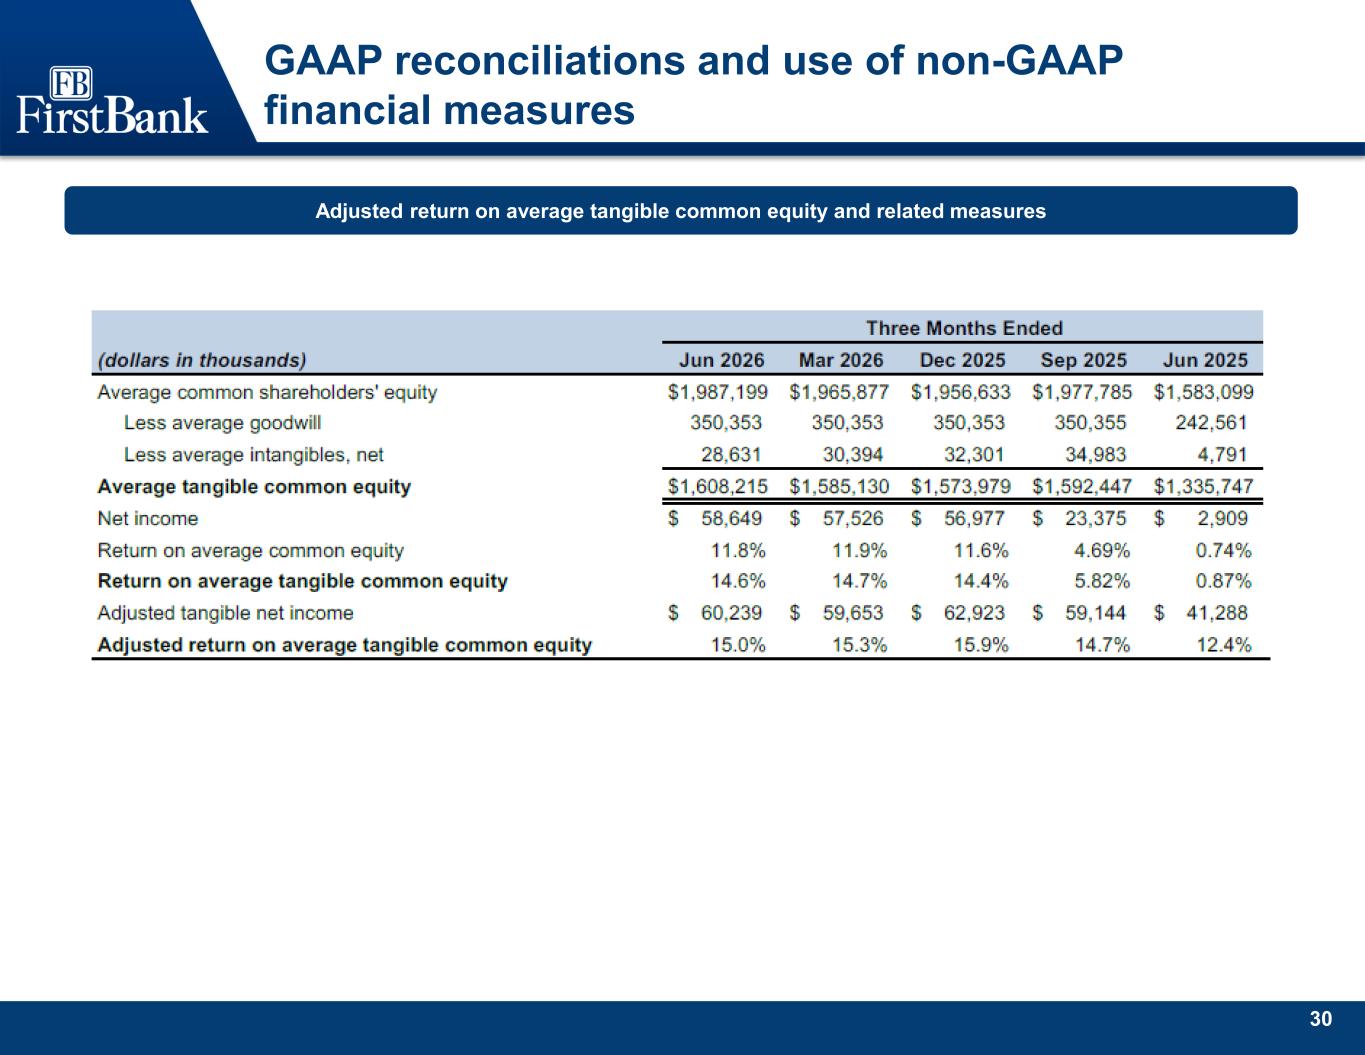
All right. Thank you, Rachel, and thanks to everybody for joining us on the call this morning and for your interest in FB financial. We reported EPS of $1.13 and adjusted EPS of $1.14 and have grown our tangible book value per share, excluding the impact of AOCI at a compound annual growth rate of 11.3% since our IPO in 2016. team. Our net income was $58.6 million and $58.9 million on an adjusted basis. And our pre-tax pre-provision net revenue increased to $83.3 million, which represents an increase of approximately 8% in a quarter. This improves our PP&R return on average assets over 2%, which we consider to be our benchmark for returns. We grew loans at an annualized rate of 11.6% and deposits at 7.7% annualized. Growth this quarter was strong, which reflects the hard work, discipline, and execution of our teams across the company. As I reflect on the second quarter, our company is well positioned and our outlook is bullish. What I'm most excited about is the sustainable momentum that we're seeing across the franchise. This quarter was marked by strong balance sheet growth, stable net interest margins, solid returns, and an improved financial position through thoughtful capital deployment, including meaningful share repurchases during the quarter. Just as importantly, the activity across our footprint gives us confidence in the road ahead. Our pipelines are healthy, our markets continue to perform well, and we're seeing continued momentum and attracting talent and winning new client relationships. What continues to differentiate First Bank is that our success is not dependent on a single factor. It's the combination of award-winning customer service, strong and growing markets, disciplined execution, talented associates, and a strong financial position that allows us to invest in growth while maintaining a conservative risk profile. We remain focused on getting better every day by improving our execution, raising our level of client service, and deepening our presence in the attractive markets across the Southeast. As we look ahead, we see sustainable opportunity in front of us. Before turning the call over to Michael, I'd like to briefly cover our share with purchase activity during the quarter. Approximately two-thirds of our repurchase activity this quarter was completed through a single transaction with a charity that receives shares as part of the administration of the estate of Jim Ayers. We remain a constructive partner with those responsible for the administration of the estate and its beneficiaries. This transaction, along with the other repurchases during the quarter, reiterates our commitment to investing in our business and deploying capital in a disciplined manner. That transaction reflects both the strength of our capital position and our continued confidence in the long-term value and prospects of our company. To conclude my remarks, our capital, reserve, and liquidity positions remain strong, and we believe the franchise is well-positioned to continue to deliver profitable growth and long-term shareholder value. We remain confident in our ability to grow organically through disciplined execution. While we evaluate strategic opportunities as they arise, our focus continues to be maximizing the significant organic opportunities already in front of us. So with that, I'm going to turn the call over to our Chief Financial and Chief Operating Officer, Michael Matee, for more color on the corner. Thank you. Michael.
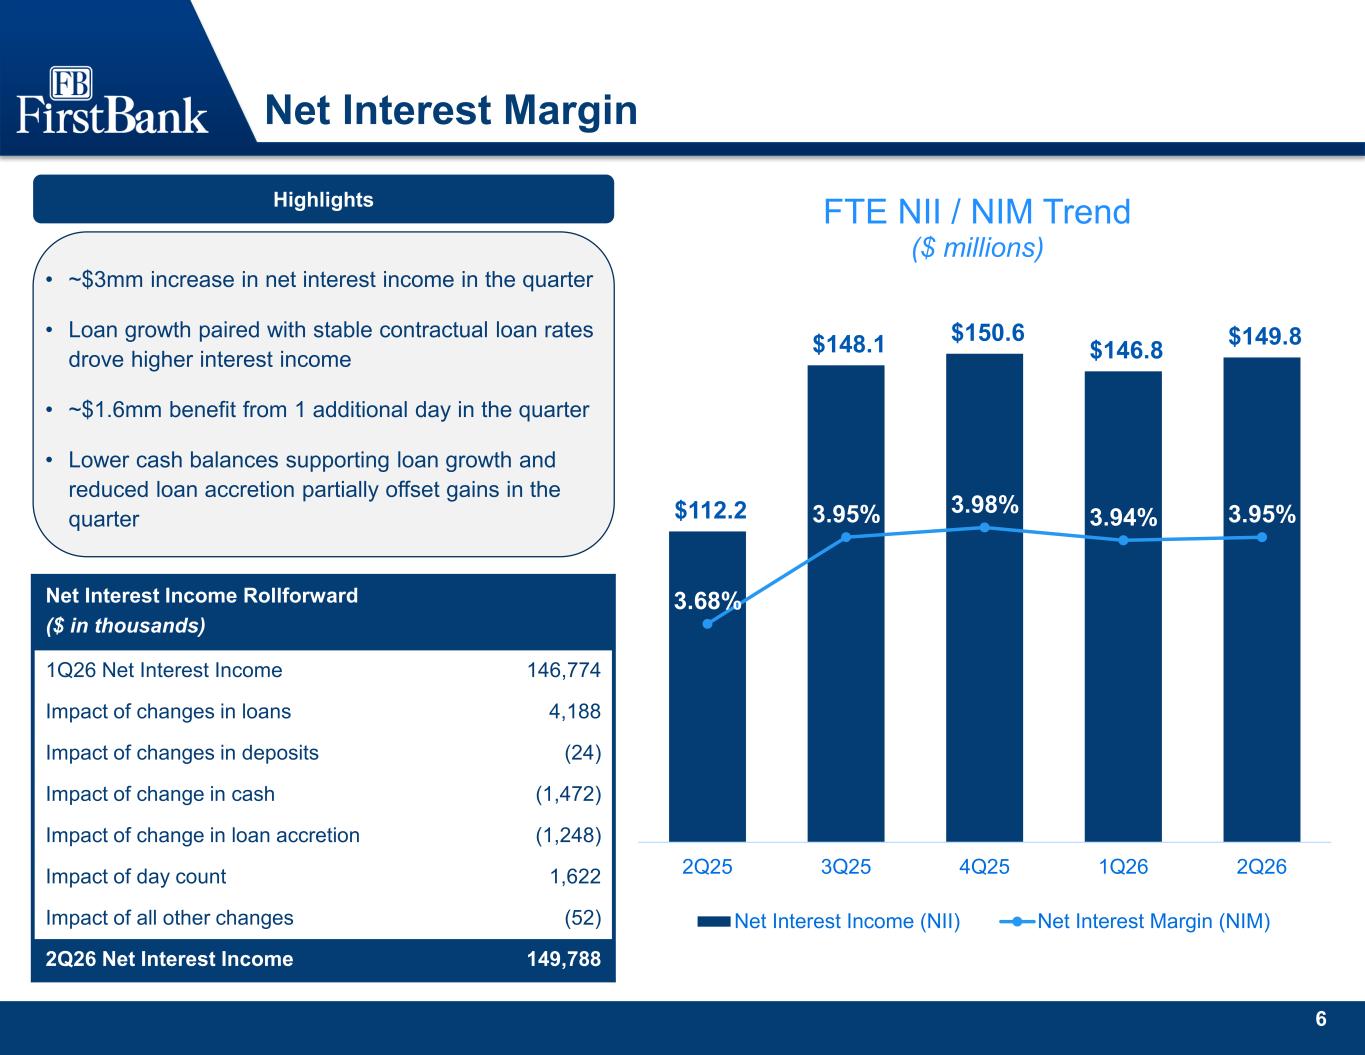
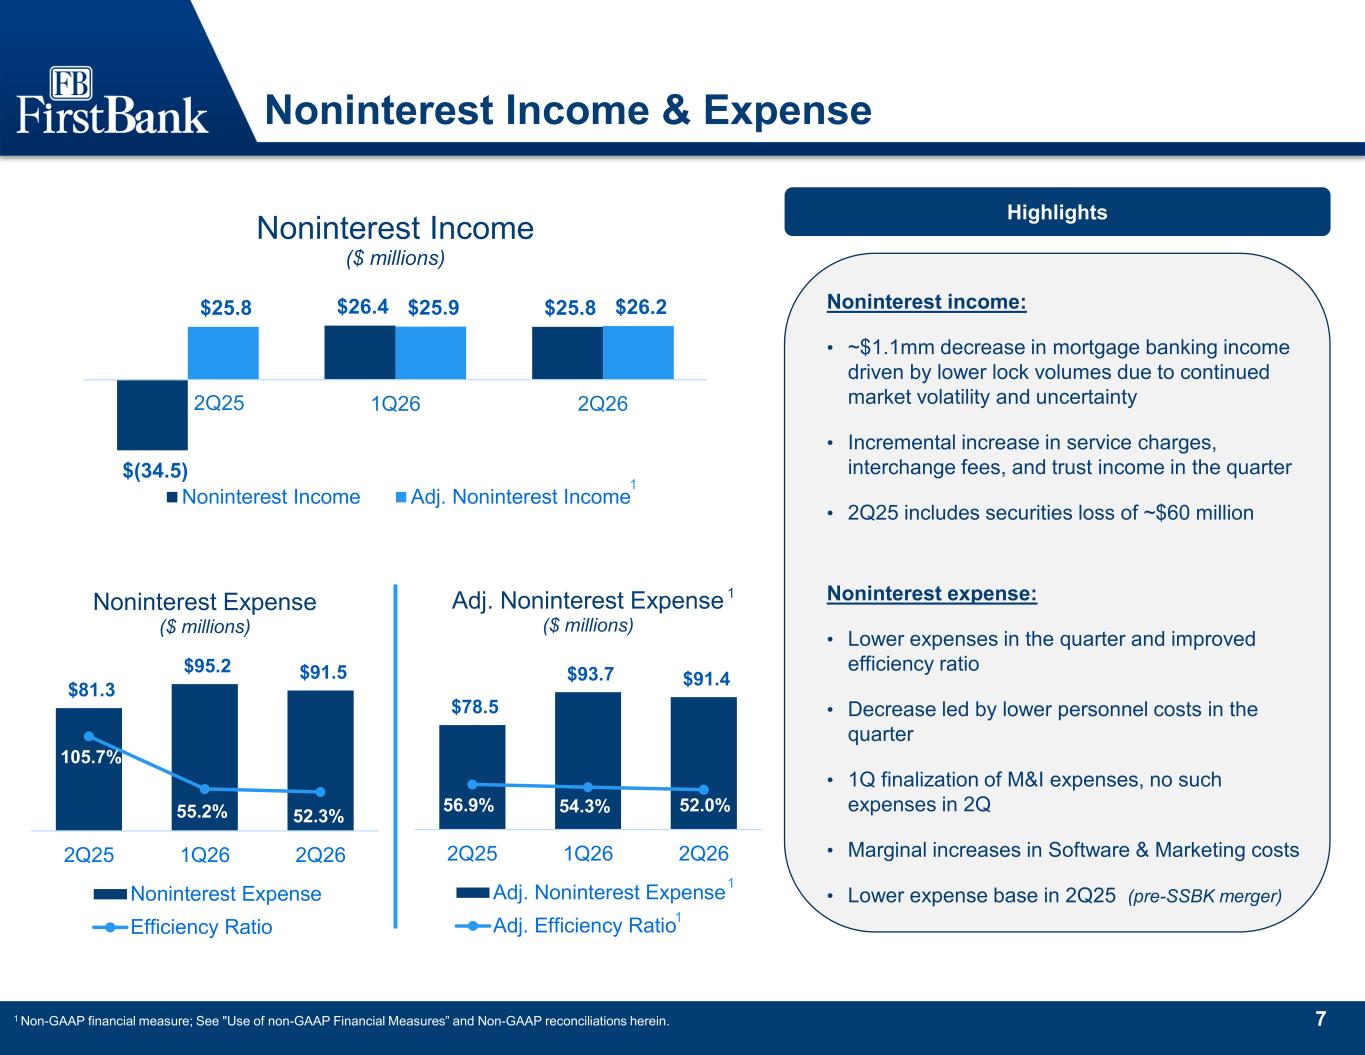
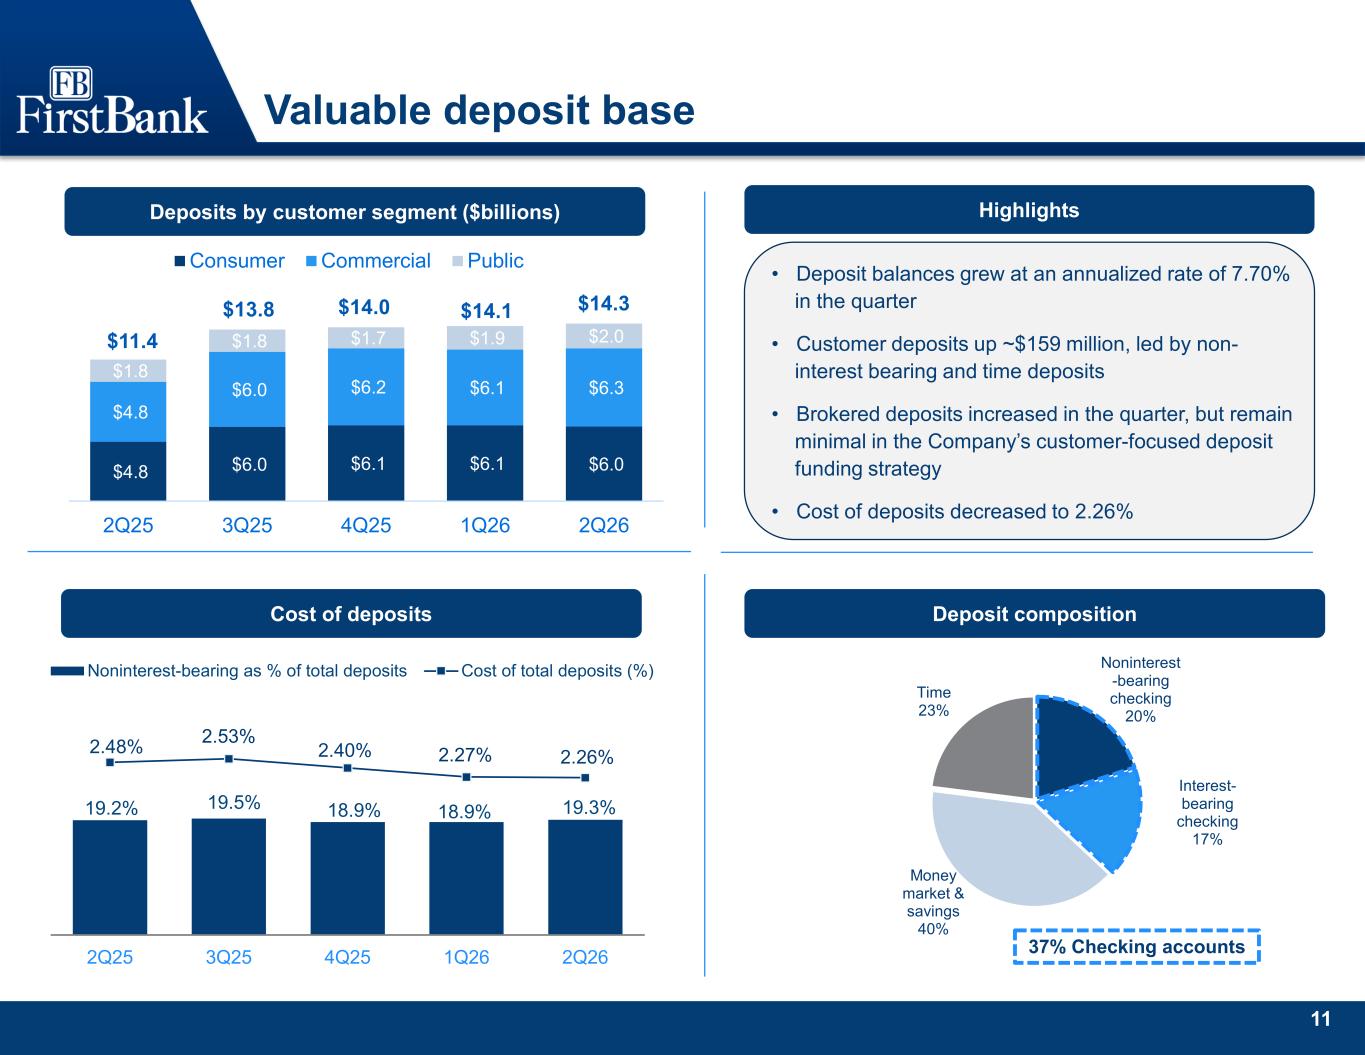
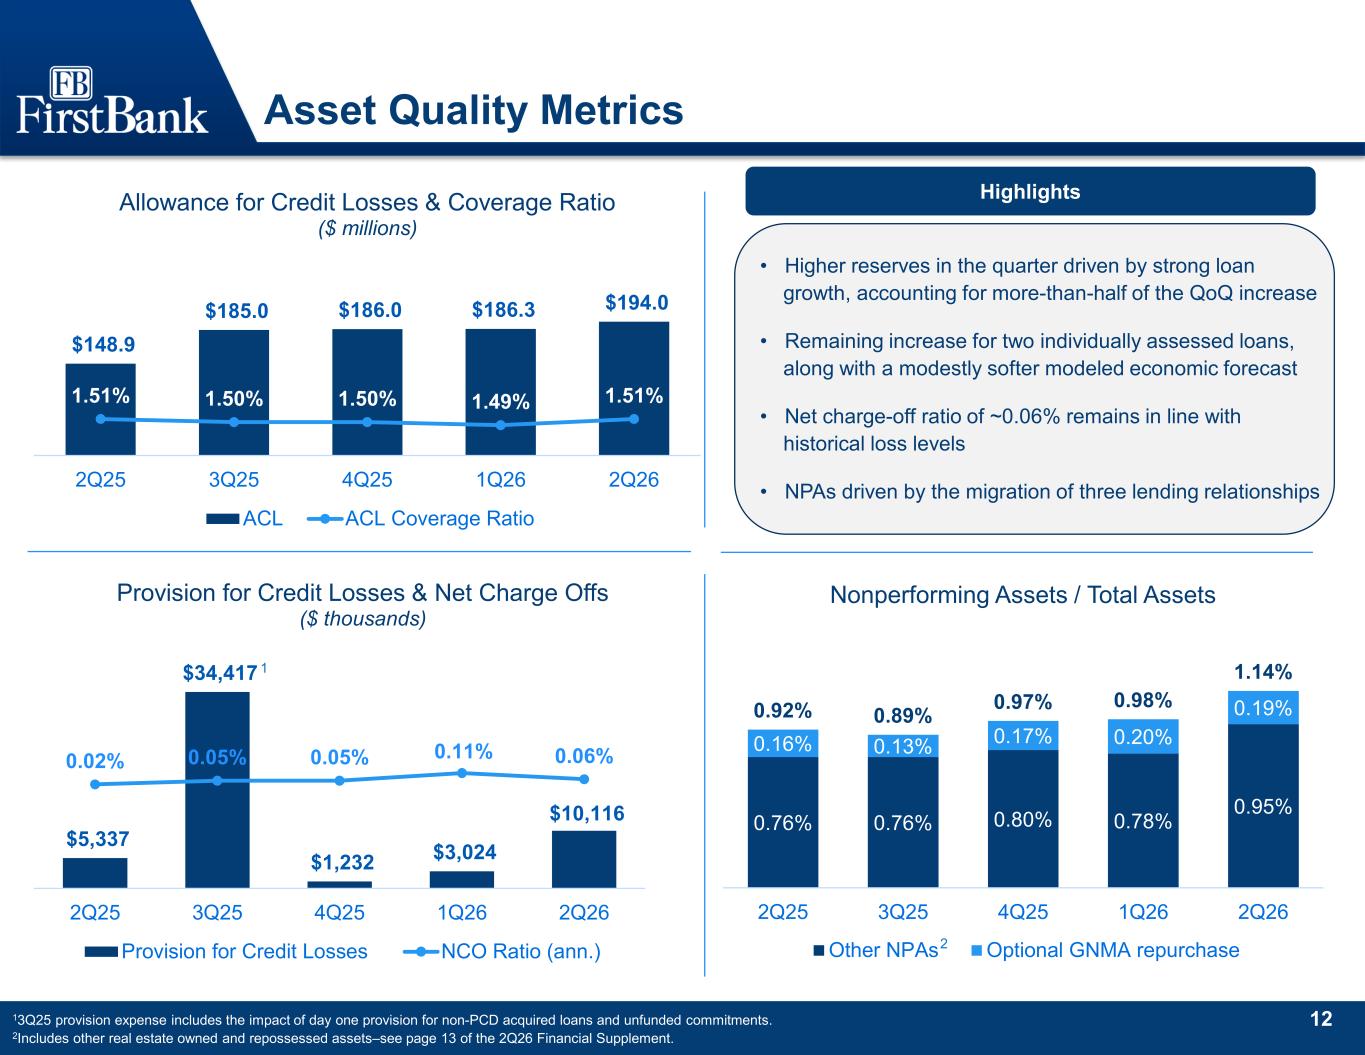
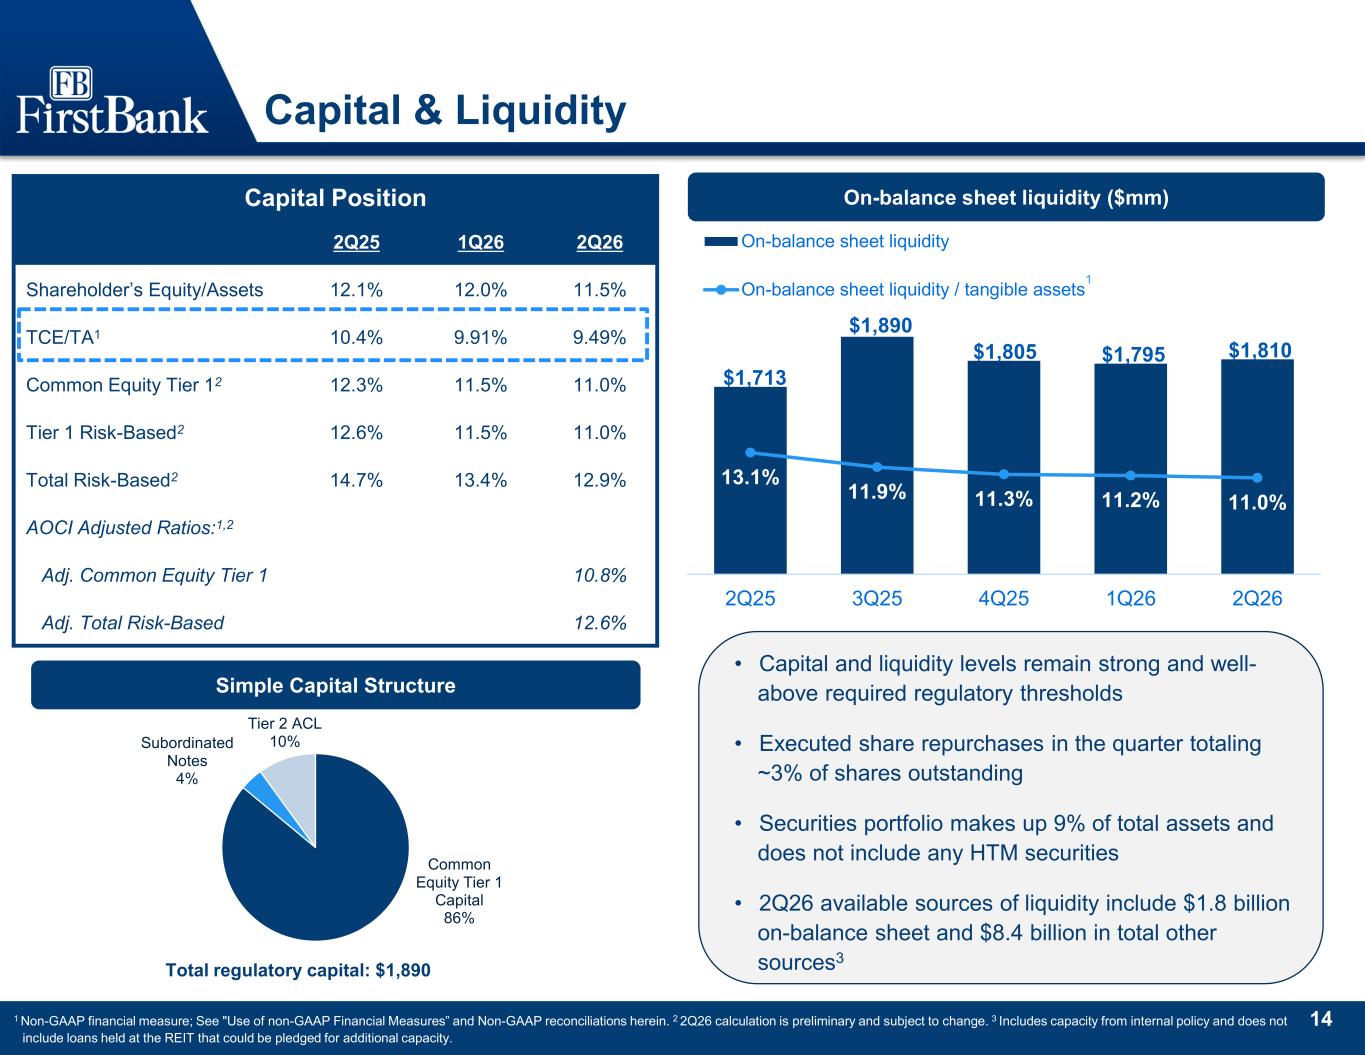
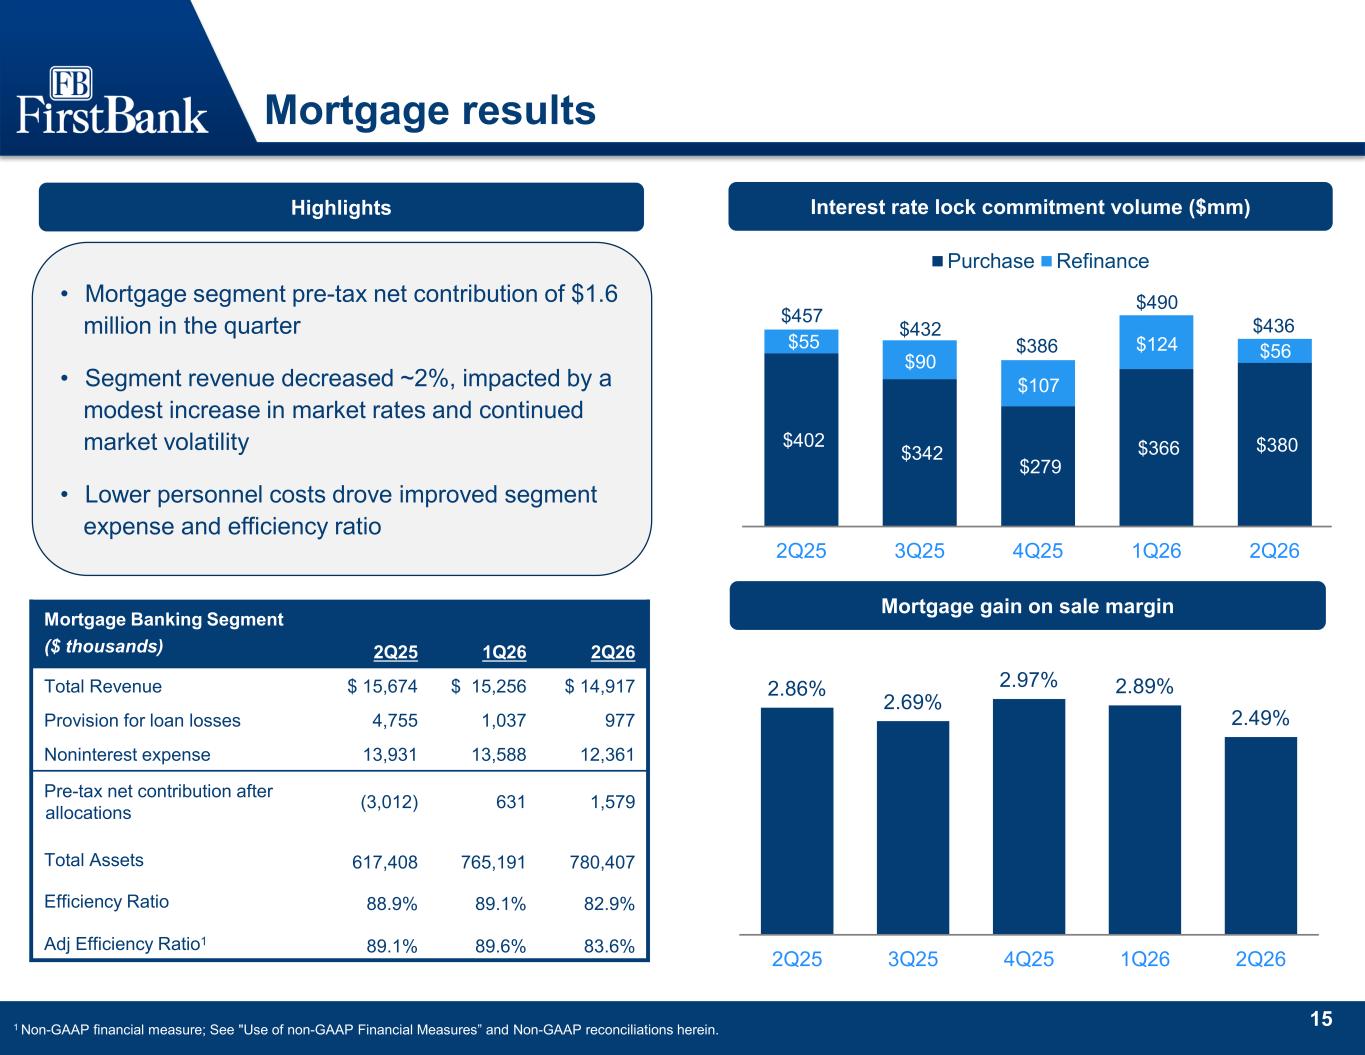
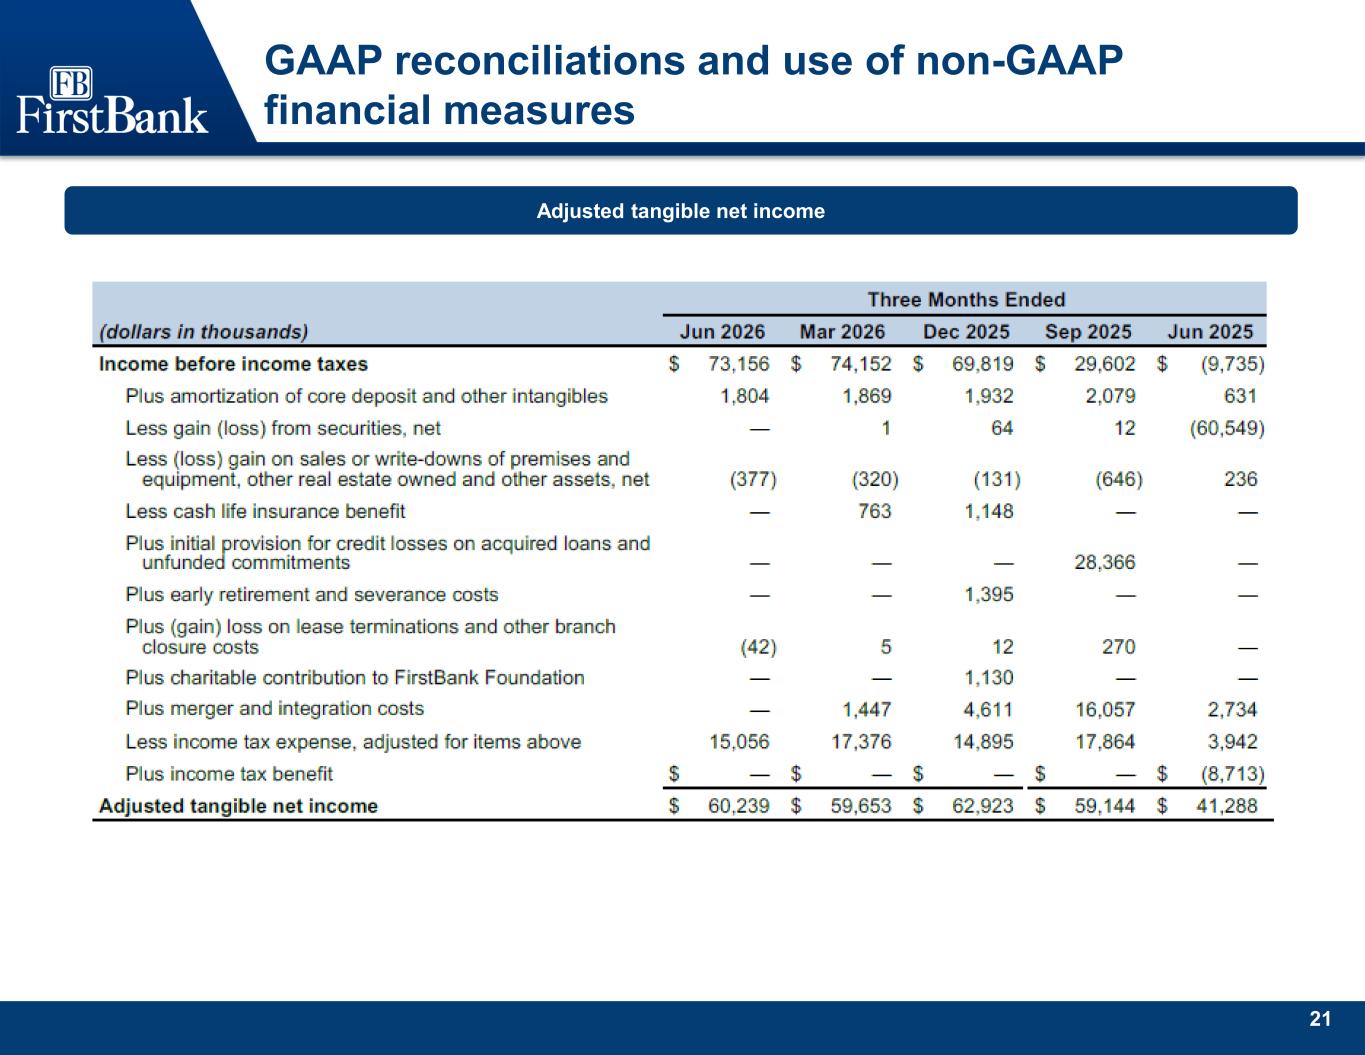
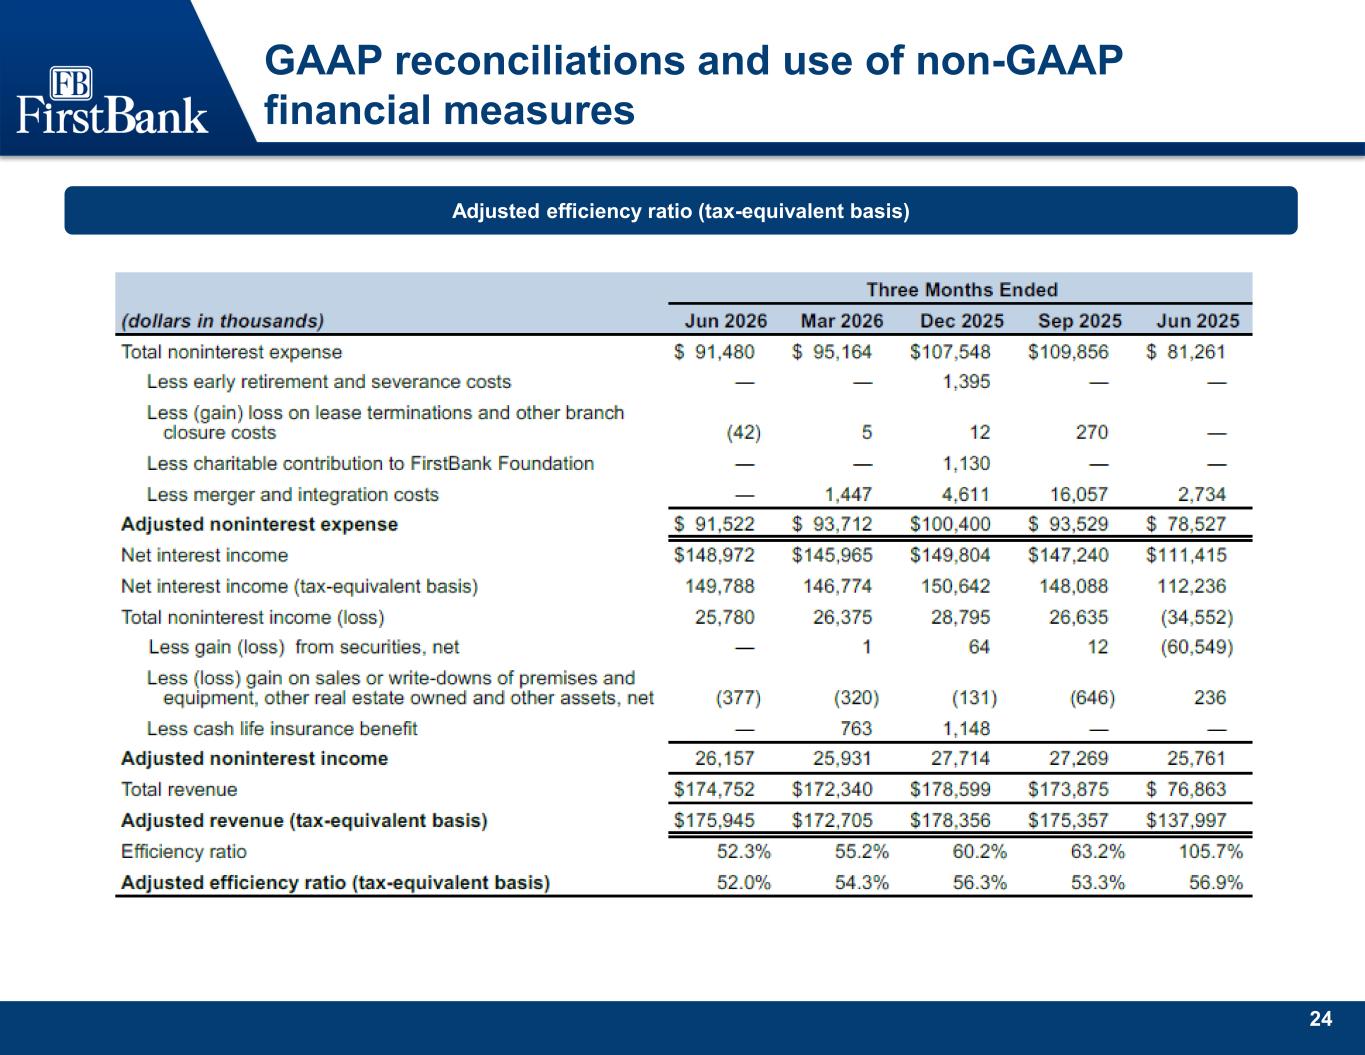
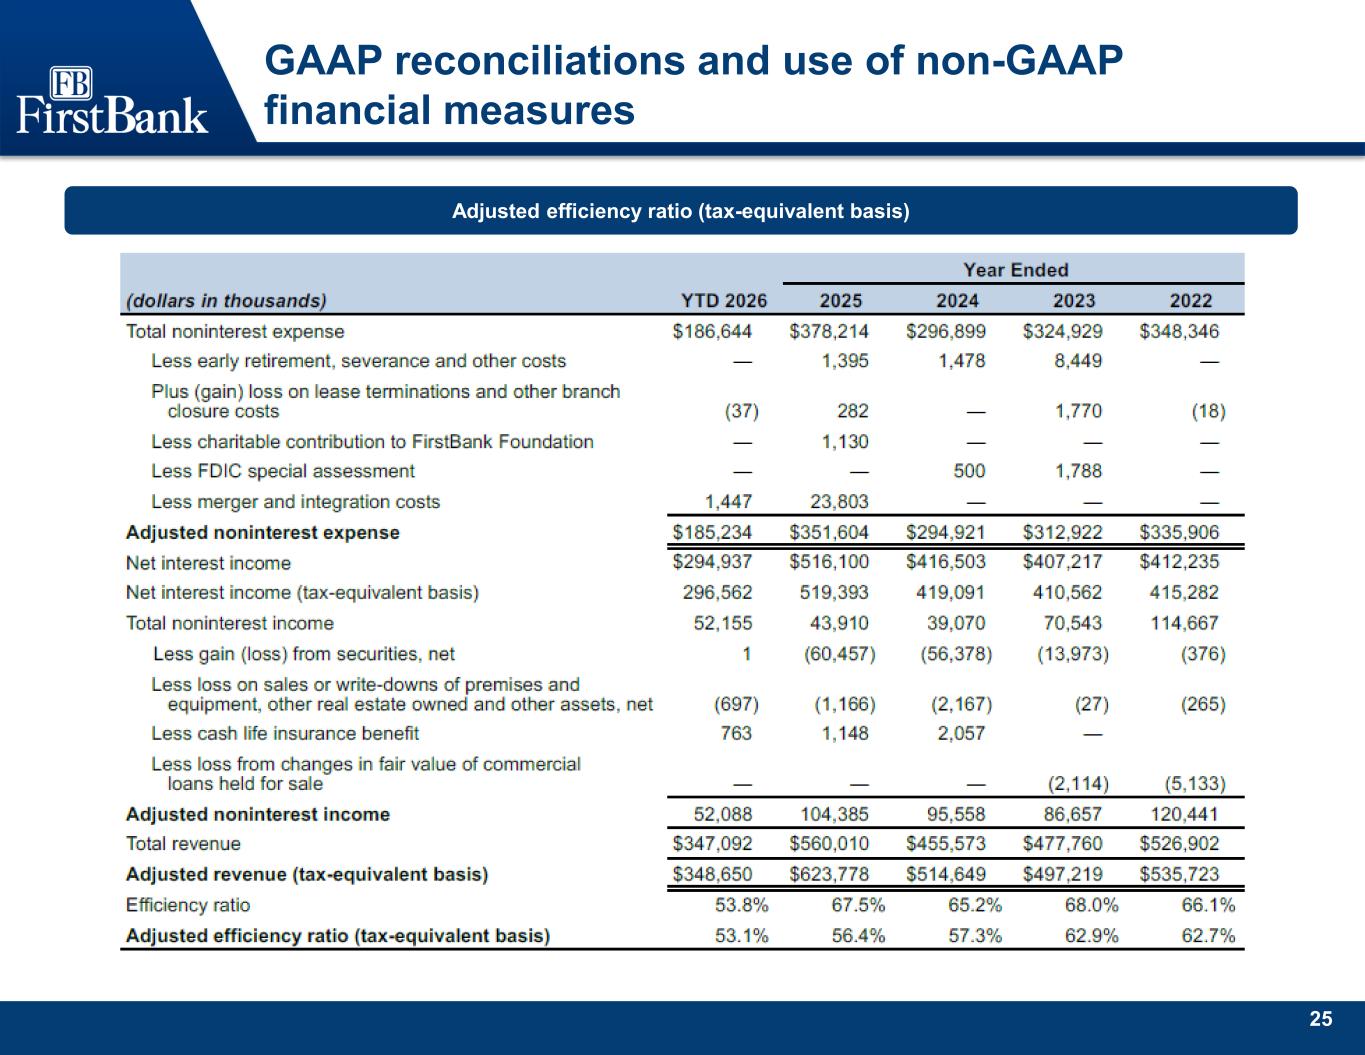
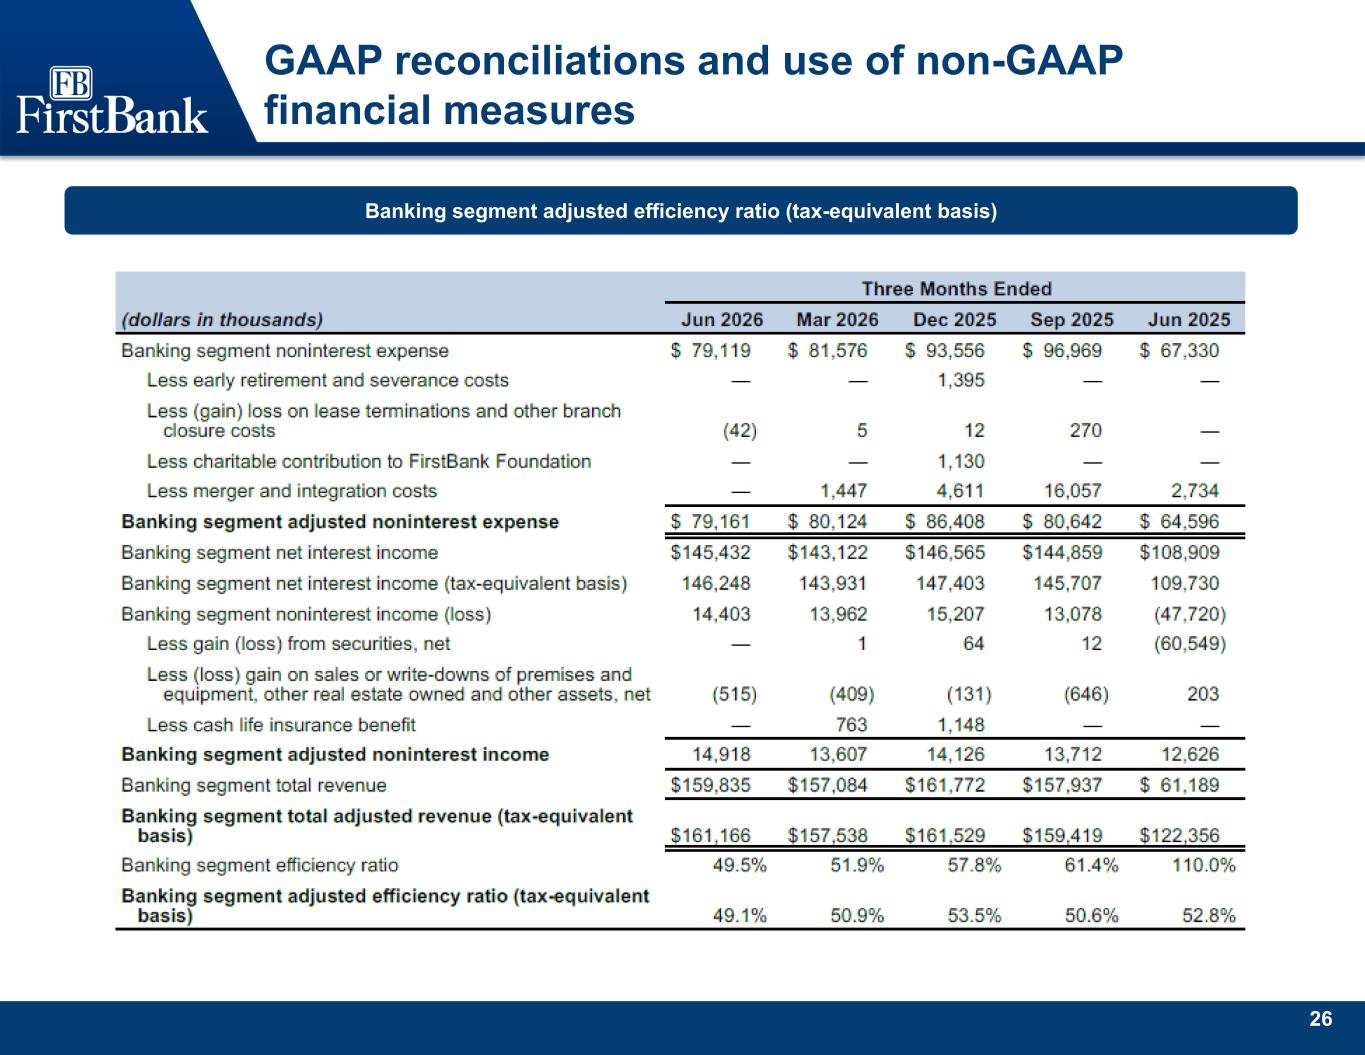
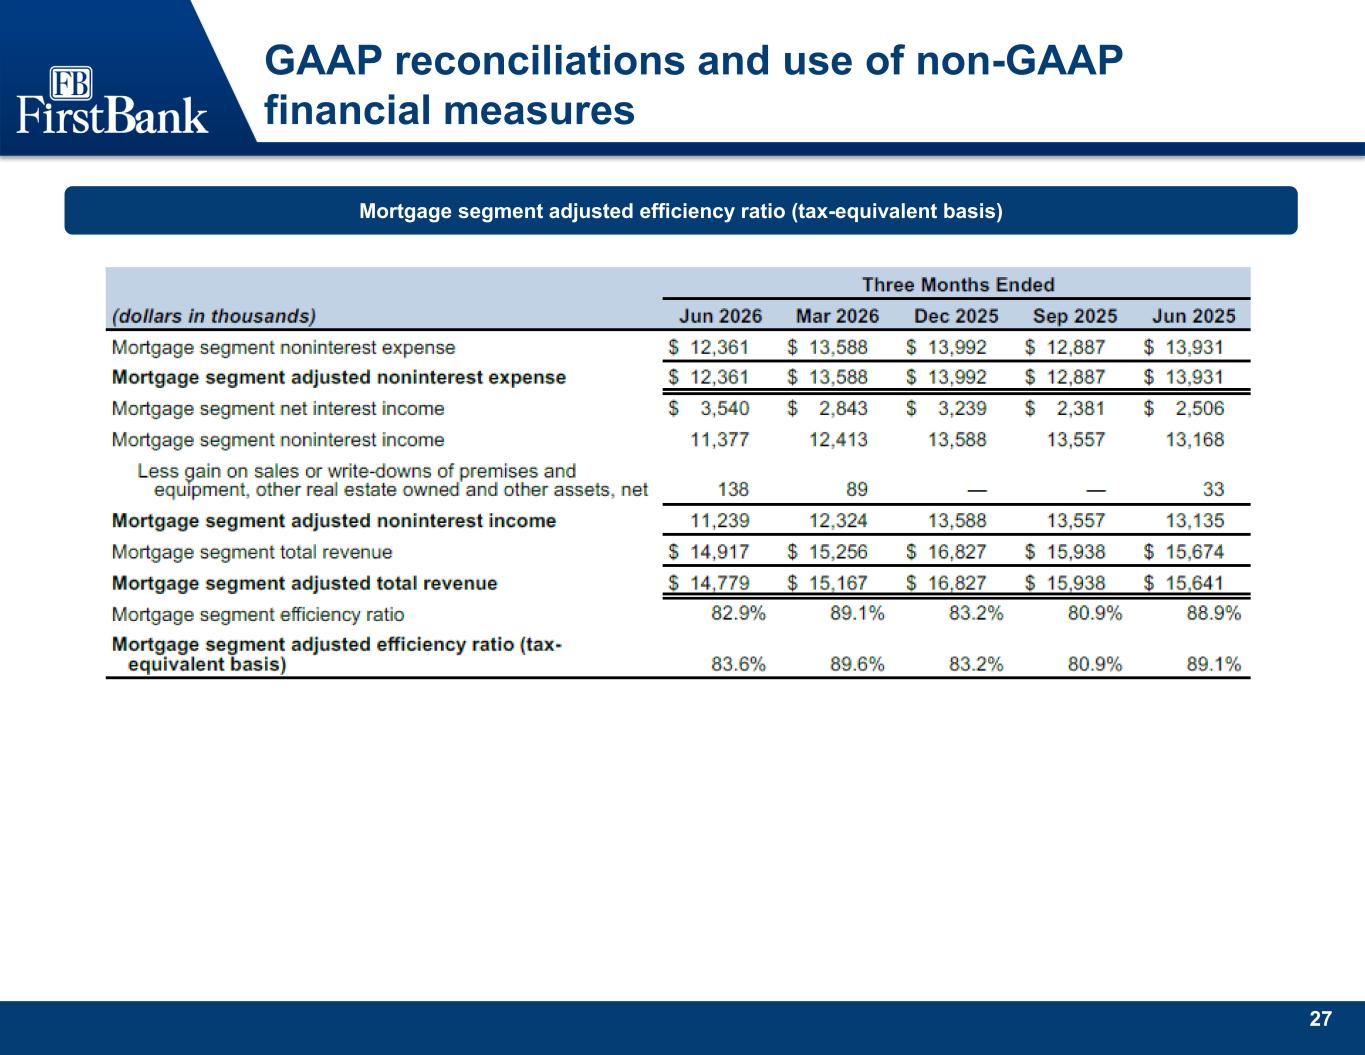
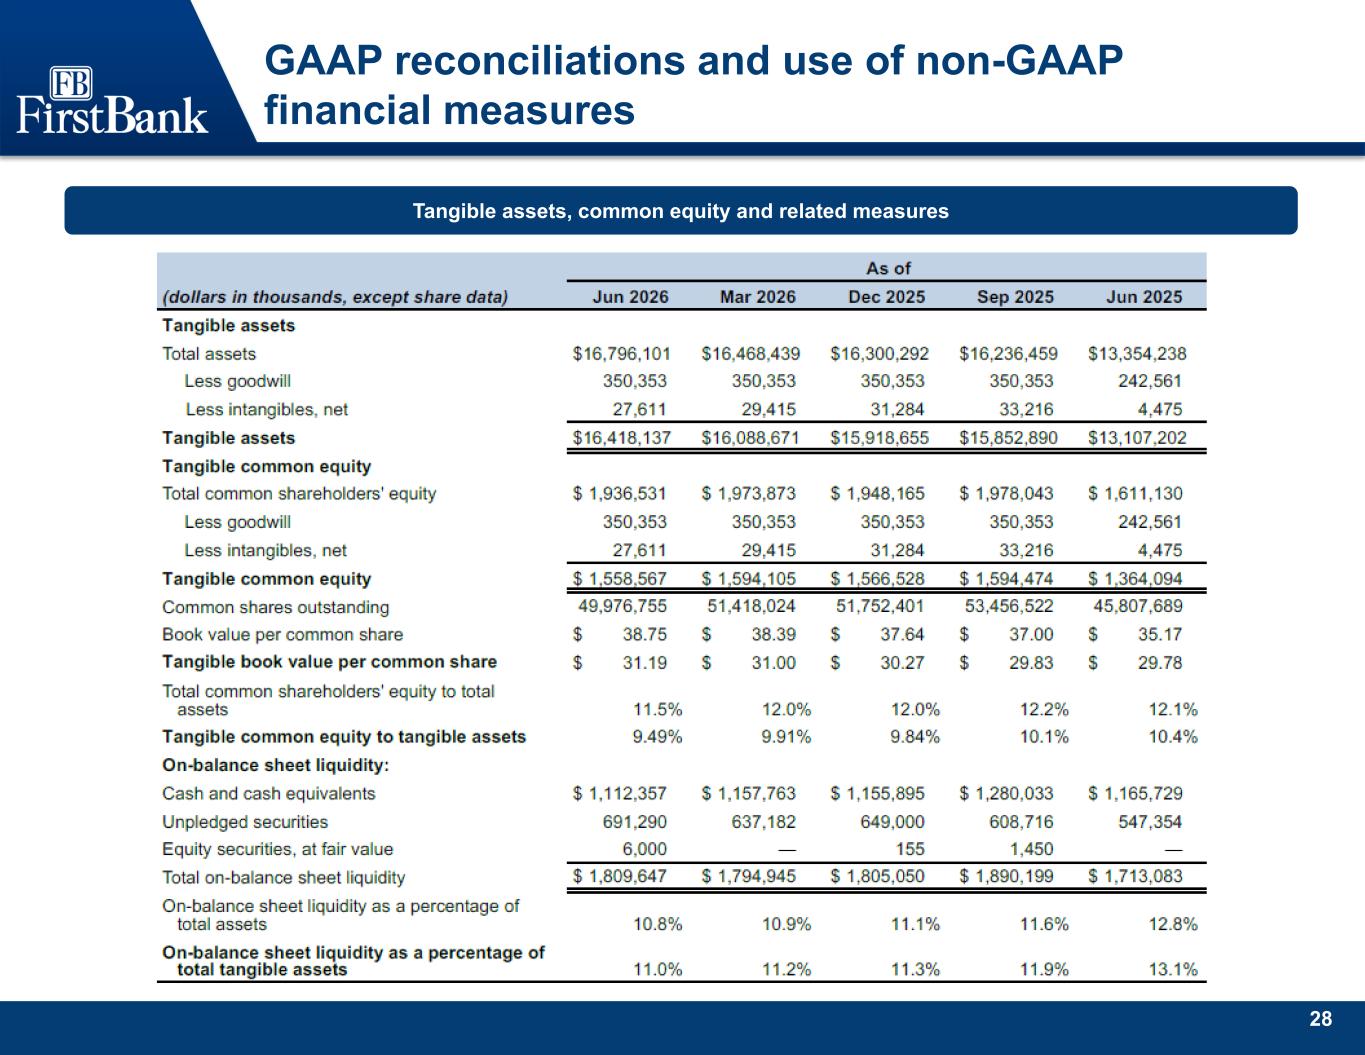
Thank you, Chris, and good morning, everyone. I'll begin my comments this quarter with the balance sheet. This quarter's results reflect the growth and momentum that we highlighted the last quarter with annualized loan growth of 11.6% and annualized deposit growth of 7.7%. Our teams continue to focus, continue executing at the highest level in an increasingly competitive environment, and our results demonstrate that our value proposition continues to resonate across our markets. We saw this most clearly in our loan portfolio, where growth was broad-based across our footprint, in metro markets including Birmingham, Memphis, and Huntsville, and throughout our community markets like Lexington, Tennessee, Auburn, Tuscaloosa, and Florence in Alabama, and Columbus in Noonan and Georgia. This balanced growth reflects the strength of our teams and demonstrates our ability to execute consistently across our geography. We believe our ability to consistently deliver strong financial advice, trusted service, and a differentiated customer experience sets us apart. As the Southeast remains the most attractive part of the country to live and work, we are seeing increased competition in pricing, recruiting, and customer acquisition. Even so, our focus remains consistent, growing the franchise organically by delivering competitive products, responsive service, and making First Bank the easiest institution to do business with. We strike a balance between growth and profitability, and this quarter reflects that discipline. We produce strong balance sheet growth while maintaining a stable margin and generating strong returns with an adjusted return on average tangible common equity of 15 percent and a pre-provisioned net revenue return on average assets above 2 percent. Ultimately, these results reinforce what we've long believed, that building deep, long-term customer relationships remains the best path to creating sustainable value for our shareholders. Looking ahead, we continue to see a healthy pipeline and remain encouraged by the level of business activity across our footprint. We remain comfortable with our expectation for full-year loan growth in the mid-to-high single-digit range. Deposits remain highly competitive, and our funding strategy continues to prioritize organically generated core deposits. We expect full-year deposit growth to remain within our previously communicated range of mid-to-high single digits, but we currently anticipate those results trending towards the lower end of that range. Turning to earnings, We grew in both net income and pre-tax pre-provisioned revenue during the quarter, totaling $58.6 million and $83.3 million, respectively. Our results were driven by stable margin performance on a growing balance sheet, disciplined expense management, and a lower effective tax rate, partially offset by a higher level of provision expense. Our net interest margin was 3.95% for the quarter, supported by stable contractual interest rates on loans and all-in loan yields of 6.48%. New loan production near quarter-end was coming in in the 6.35% to 6.4% range. Deposit costs declined modestly to 2.26%, while blended rates on new production around quarter-end were in the 260 to 270 range. Like the rest of the industry, we continue to monitor the outlook for benchmark interest rates closely. While the timing and magnitude of future rate actions remain uncertain, our current outlook assumes one rate hike in the third quarter of 2026. As we move through the second half of the year, we expect elevated competitive dynamics on pricing as institutions compete for both loans and deposits. Between those two factors, we remain comfortable with our full-year net interest margin forecast, excluding loan accretion of 370 to 3.8%. We know that the environment can change quickly, but we believe that our balance sheet remains well-positioned to perform across a variety of interest rate scenarios. Non-interest income declined modestly to $25.8 million during the quarter, but increased to $26.2 million on an adjusted basis. Reoccurring fee categories such as service charges, interchange income, and assets under management revenue all benefited from continued customer growth in the additional day in the quarter. Within mortgage banking, revenue declined $1.1 million as a greater proportion of new lock production was retained in the portfolio rather than sold into the secondary market. While this mixed shift reduces upfront gain on sale income, it has enhanced balance sheet growth, generated attractive loan yields, and strengthened broader customer relationships by creating additional opportunities for deposits and other banking services. Non-interest expense totaled $91.5 million during the quarter, down approximately 4% from the first quarter, or approximately 2% on an adjusted basis. Expense trends benefited from normal seasonal compensation patterns, disciplined expense management, and the absence of merger-related costs. As revenues expanded and expenses declined, we generated strong positive operating leverage during the quarter, highlighting the earnings power of the franchise when the balance sheet and fee businesses are performing well. As a result, our efficiency ratio improved to 52.3%, while our banking segment had a sub-50 efficiency ratio of 49.5%. Looking ahead, we continue to expect expenses to normalize during the second half of the year as we invest in talent and growth across the franchise. While we remain disciplined on expenses, we continue to see opportunities to create positive operating leverage as revenue growth outpaces expense growth. Accordingly, we're maintaining our banking segment non-interest expense outlook of $325 million to $335 million, and we continue to expect the consolidated efficiency ratio to finish the year at or around 50%. Turning to credit, provision expense was $10.1 million for the quarter, an increase of approximately $7 million, and our allowance coverage ratio ended the period at 1.51%. The majority of the reserve bill was associated with loan growth, with a remainder driven by specific reserves on two individually evaluated credits, and a modest portion of the increase resulted from somewhat softer economic forecasts incorporated into our allowance for credit loss estimation process non-performing loan and non-performing asset ratios both increased during the quarter and were driven almost entirely by three relationships two of those relationships are the two individually evaluated credits that i just referenced that led to specific reserves while the third is a well collateralized credit with a near-term workout plan in place our term Our teams remain actively engaged with these relationships, and based on our analysis, believe that these situations are borrower-specific and do not reflect broader weakness within the portfolio. Importantly, net charge-offs remain low at six basis points annualized, which is generally consistent with our long-term performance and reflects both the strength of our underwriting discipline and our ability to effectively manage credit relationships when challenges arise. Our outlook for both our markets and our franchise remains positive. At the same time, we recognize that factors such as geopolitical developments, monetary policy decisions, and housing market conditions remain largely outside of our control and can influence our customers' environment and behavior. One of the advantages of our community banking model is the depth of our customer relationships, which allows us to identify emerging risks early and respond quickly, and we'll continue to take a proactive approach as the macroeconomic environment evolves. With respect to capital, we remain in a position of considerable strength, supported by robust capital ratios and a strong liquidity profile. As Chris mentioned, we completed another meaningful share repurchase transaction during the quarter from a charity that received shares from the heirs' ownership, And in total, we've repurchased approximately 3% of our outstanding shares during the quarter. Our capital deployment strategy remains centered on supporting organic growth while maintaining the flexibility to pursue opportunities that enhance shareholder value, like the repurchase this quarter. We continually evaluate a range of capital allocation alternatives and move on opportunities that are strategically compelling and economically attractive. As a result, our capital ratios will remain well above the regulatory requirements, with a common equity Tier 1 ratio of 11%, a Tier 1 leverage ratio of 10.1%, and a total risk-based capital of 12.9%. In closing, I'd like to thank our associates for their hard work, dedication, and continued commitment to our customers. We entered the second half of the year with strong momentum, healthy pipelines, and confidence in the opportunities ahead. With that, I'll turn the call back over to Chris.
Thank you, Michael, and thanks to everybody for tuning in to the call this morning and for your interest in the financial operator. At this time, I'd like to open the line for questions.
Operator
And at this time, we will open the line for questions. If you would like to ask a question, you may press star and then one using a touchtone telephone. To withdraw your questions, you may press star and two. If you are using a speakerphone, we do ask that you please pick up the handset prior to pressing the keys to ensure the best sound quality. Once again, that is star and then one to join the question queue. We'll pause momentarily to assemble the roster. Our first question today comes from Catherine Mueller from KBW. Please go ahead with your question.
Thanks. Good morning. Good morning, Catherine. I wanted to start on deposit costs. It was great to see the deposit costs decline a basis point this quarter. I know you mentioned that new production is coming on around $260 to $270, but just wanted to see if you could just give a little bit more color around just deposit flows, your confidence in still being able to grow deposits at a mid-single-nigit pace, and maybe just from a big-picture perspective, where you think overall deposit costs trend for the rest of the year. Is this kind of a couple BIPs, kind of increase per quarter kind of thing, or how should we just kind of think of the trajectory of the overall deposit cost in the next couple quarters? Thanks.
Hey, Catherine, and good morning. And I'm going to – this is Chris, and I'm going to take the first just kind of overall. I would say this. Deposits have been challenging, but that's almost – I don't think we even have to say that anymore. As I tell our team every day, I say, today's going to be the easiest day of your career to get deposits because tomorrow it's going to be a little harder. I think that whole world is continuing. You've heard me say this before as we have private conversations. I think it's going to continue to be a challenge just because of the many different payment streams that you have now and the many different types, different ways to hold money. And so we're aware of that. We continue to adjust our strategy to meet that. And so that's a big picture. When you narrow that in over the next couple of quarters, I'm going to let Michael talk a little bit more specifically about our flows. But we saw success, obviously, this quarter. Non-interest bearing, as you saw, we had a nice increase in non-interest bearing. That's a focus for us. We also did a little bit more in broker than we usually do, but that's because it was just cheaper. That's not something that we like to use to find our balance sheet, but when it's cheaper, we'll use it. That has swung. It swings, and it's swung now. It's a little more expensive. So we think it's a focus, going to continue to be a focus, and it's going to be tough, but we think we can do similar to what we did in the second quarter. we think we can do, you know, close to that throughout the balance of the year. So, Michael, I'll let you take it from there.
Good morning, Catherine. And as well said, Chris, I think, you know, the decrease, the modest decrease in deposit costs is actually driven more by mix than it was competition, as you noted. And I mentioned, Catherine, that $260 to $270 range blended on new deposits. I think money market rates have continued to move higher from a competitive perspective. And at the same time, we've seen CD rates modestly decline in our book, but hold pretty steady. So you kind of have a tale of three different types of deposits between non-interest bearing, money market, and CDs. And customers are kind of moving in and out of where they're most comfortable, whether that's locking in duration. or wanting liquidity. So it's interesting. I think you do see deposit costs move higher just because, as Chris mentioned, it's never going to get easier than now. Your Fed funds has been relatively stable for six months or so. And so that's helped with our index deposits remain flat. But we're seeing new money market in that 4% plus range from a lot of competitors. So I think you continue to see new deposits come on at a higher cost, and it's just cost of customer acquisitions going up. And, you know, the way you keep deposit costs modest is by deepening relationships and growing wallet share and creating value for customers. And so the team did a good job with that, but we do understand that customer acquisitions can be more expensive.
Can I just say one other thing? When we say deepening relationships, we mean having an operating account. And we don't mean, you know, getting relationships that become lazy and we don't pay them a market rate. That is not what we mean. When we say getting relationships, in our language, that means getting the operating account.
That makes sense. And to be clear, that $260 to $270, that's blended total. So, that includes the NID growth you had, the kind of 4% money market you're talking about, and then also the kind of even more stable CD. Is that a way to think about that?
100%. Yeah, I mean, you know, so blended, right, if our cost of deposit is $226, even on a blended basis, new deposits are coming in higher than our deposit costs.
And then maybe the other side of the margin, just thinking about loan yields, can you talk about what the competition looks like on the lending side? And is there still enough back book repricing opportunity to still be able to offset the higher deposit costs with, you know, higher asset yields on the loan side?
Well, I mean, I'd say loans really almost just as competitive as deposits. I think it's important on the relationship side that you're getting first shot with your clients to help them with financing, whether it's refinancing or new projects, and I think we're getting our fair share of those. You know, being around 640-ish for June really is what I'd say is kind of spot rates, but we're seeing that start to feel a little bit of pressure as well. and so i mean it's it's equally as competitive although the economic environment is allowed for growth and a lot of business across our markets for us and our competitors i would say repricing kind of yeah we've had quite a bit repriced from kind of that 2021 vintage and there's probably a billion or so to go in the back half of the year but i think you got a couple things going on you got a yield curve steepening which is actually good for us uh you got 50 52 of our book is is floating so theoretically that's repriced higher but it's coming on a tighter yields than we'd expected if we started the year and looked at repricing so it's a little bit of a squeeze there as well which is why we kind of have a blended margin reduction of a couple basis points a quarter through the end of the year.
Great. That makes sense. Thanks. Great quarter, guys. Appreciate it.
Operator
Our next question comes from Stephen Scalton from Piper Sandler. Please go ahead with your question.
Yeah, thanks, everyone. Just wanted to dig into the loan growth here a little bit. Obviously, very strong and helped by y'all retaining more of the resi mortgages. I'm just wondering if moving forward, that's likely to be a continued strategy and just, you know, with growth being led by RESI and seemingly non-owner occupied CRE, is that also composition-wise what we should expect to see or would you hope that that would be weighted more towards, you know, C&I potentially in the future?
Yeah, it should be a little more weighted towards C&I. We certainly don't mind those categories that you mentioned, but we likely get some nice C&I between now and the end of the year. And on the mortgage, generally we originate to sell. We will keep some things that are – from time to time, we'll keep a little bit, and we have gotten much better at making sure we convert those to full customers. And so used to, we would sell every loan, but still our strategy is to sell those. But, you know, from time to time, we may keep some pieces. Yeah, I mean, just, Stephen, good morning.
Just to dive into that a little bit, I think, you know, where the secondary market is, when you sell a loan, a lot of the servicing is getting sold away because of, you know, what third parties are willing to pay for servicing. So we're disrupting the client a little bit, and our ability to grow deposits off that business is a little more complicated. So in the first quarter into the second quarter, we got a little bit more aggressive on our portfolio rates, which has created a lot of customer relationship opportunities, turning mortgage clients into full bank clients, which is a focus. It's been really successful. I will say, like, the headline number you mentioned, you know, $145 million or so on residential real estate, about $60 million of that's actually kind of one to four families, $50 million multifamily. And then, you know, you have some line of credit things that are part of that as well. So it's not all coming specifically from the mortgage division. It's across the banking footprint. It's a little bit of a point of clarity that I could probably point to versus converting the mortgage pipeline.
Got it. And then kind of the guide to the lower end of the growth range of mid to high single digits, I think you said, you know, currently I've seen towards the lower end of that range. What's the expected kind of constraint there? Because it seems like maybe you're kind of at the mid to higher end of that range currently. So, is that more loan-to-deposit ratio getting to a point where funding becomes more essential? Is it slowdown in the pipeline? Just kind of context on why you think that might be towards the lower end.
Yeah, I'm glad you asked that question, Stephen, because I obviously didn't communicate that well. Loan growth, we're saying mid to high single digits. I think we feel good about what loan growth is. deposits uh it's more of a competitive uh kind of way that we're thinking about it in that mid single digits uh as chris mentioned um you know funding kind of was a lot cheaper from a brokered perspective you know it's cheaper to borrow it's cheaper those things have kind of flipped um and so you know you got to get make sure you're always getting core relationships so i think the beauty of our balance sheets we got a lot of optionality to take advantage of opportunities as they arise because we have such a low brokered percentage. And we can fund the bank in a lot of different ways while we build core relationships. So for clarity, it was the deposit piece that's that kind of mid-single-digit loan growth, we think, is that higher single-digit number.
Oh, I'm sorry. I'm sure you said it right. I probably just misheard it. Apologies there. And then lastly for me, just on the repurchase, I think you kind of noted Obviously, the charity impact there, maybe that was two-thirds. So I guess X that, it would have been around 500,000 shares, give or take. Is that a way to think about the use of the remainder of the $175 million repurchase authorization moving forward? Or would it be slowed down given the acceleration of that charity-related repurchase? Or just how do we think about that capital return from here?
Yeah, so your approximations are right. You know, outside of that large repurchase, it would have been plus or minus half a million shares. And I think you're thinking of it correctly. Of course, we're price sensitive when we think about repurchase, at least to some degree. But we anticipate that we can repurchase. It's going to continue to be an option for us to repurchase in the open market or to maybe make some bulk repurchases from time to time, that could become an option for us as well. Should be maintained as an option for us as well.
Got it. Thanks so much for the color. Really nice quarter. Sounds like a lot of things are going well. Appreciate it.
Thanks, David. Appreciate it.
Operator
Our next question comes from Russell Gunther from Stevens. Please go ahead with your question.
Hey, good morning, guys. Quick just follow-up in terms of the morning on the loan growth discussion, as you think about the organic opportunity going forward, are incremental LPOs something you guys would look to do? And if so, directionally, geographically, where might that take you?
So anytime we do an LPO, we're doing that with intent to be in the market with a full banking offering. And we usually do that by going in commercial first, and then over time we'll get a little more retail, but that's usually a long period of time. And so we – and when we think about that, usually we've described the geographies that we're interested in, and they're generally around our current geographies, mostly east and south of where we are. And we actually think of that by the bankers first. We have this targeted geography, but when we get – it's a little like even an acquisition. We think through those beforehand. We've got folks that we're looking at, thinking about in different places. And if we get the opportunity, then we will do it. And so it's, you know, the old phrase, banks are sold, they're not bought. Bankers are a little bit the same way. They come available for whatever reason, and that's when we tend to make the move. Got it. Thanks, Chris.
And then just one quick follow-up on the margin for me. you guys are dialing in a rate hike later this year or this quarter. Just in isolation, could you remind us of what that means to the margin for you guys and on the funding side, quantify where index deposits stand today?
Yeah, Russell, good morning. We're, you know, we're, we're slightly asset sensitive. So incrementally you would think that a rate hike would actually help because You know, loan yields were variable, 52%. Our investment portfolio, while small, it's mighty with a floating rate of 55%, 60%. So higher rates actually helps that to the tune of a couple million dollars. We just, maybe it's being in the hand-to-hand combat every day. I see what our teams are dealing with. We feel like that's pretty much offset by the deposit growth story and where rates are headed on that. So, you know, you'd see incremental improvements, but I think the competition kind of eats into that a bit. And we're probably, I would say, 40% indexed on total deposits and, you know, 60%, 70% if you think about money market, give or take. Great.
Thank you both for taking my question. Thanks, Russell.
Operator
Our next question comes from Dave Rochester from Cantor. Please go ahead with your question.
Hey, good morning, guys. Good morning, Dave. On your loan outlook, it sounds like you guys are pretty bullish on the back half of the year, and you just wrapped up a solid quarter of growth across a number of buckets. Can you just maybe give an update on any other pay-down activity you may see coming up that you know about, And what's stopping you guys from hitting the top end of that mid-to-high singles range, given the momentum you're seeing?
Yeah, Dave, good morning. Actually, that's an insightful question there. I mean, I'll give you an example. We had one of the largest production quarters we've had in a long time out of the Nashville market. I mean, it's really, really strong. But we actually ended up bouncing, if you look just at Nashville, it's flat because of payoff activity and hundreds of millions of dollars on both sides. So in a lot of our markets, you're still seeing increased payoff activity, especially in highly competitive ones like this one. So I think that's kind of what we're trying to deal with. But then you saw the 11%-ish growth because we have contributors across the footprint. We have really strong economies, and so that's why we're really bullish. And the teams are out working hard every day to acquire new clients and provide value to those prospects. So pipeline, I tell you, the pipeline is just as big as when we started the second quarter. And that was – so that's after you've seen the growth, and so that's why we're pretty bullish. We've been really successful on a couple recent customer competitive situations, and that gives us a lot of confidence in where we're headed as well.
Sounds good. And you mentioned also success in attracting talent and seeing more potential for that in the back half of the year. Can you just catch us up on those recent hires you've had and just give an update on how you're thinking about the size of that opportunity to pick up more talent, just given the stronger competitive pressures for talent out there with all the new entrants and whatnot?
Yeah, thanks. Thanks, Dave. So on attracting talent, we have had some wins there also. And so we continue to add. And the way that we look at it is maybe individual to us. I don't know that we look at it like everybody. For us, it's long term. And so, you know, our key metric is revenue growth. And so, when we're tracking talent, we're really thinking about the right talent that fits us and is going to be here long term. And so, we're trying to make good decisions there. And so, we don't view that as a quarterly metric. We view that as long term. And so, some folks we've been talking to for years. And, you know, at the right time, we feel like those folks will come over. We added some during the quarter. Frankly, it's a lot like when we're reporting quarterly earnings. You know, you've got a June 30th cutoff. We probably added more in the last, I don't know, two weeks than we did the last two months. And so it's, again, you don't really control that pace. At least that's not the way we look at it. We look at it like, hey, we're going to do what we do and continue to attract talent for the right reasons because, you know, they look at us and they want to be here. And so and we think we'll win that battle short term and long term. And so that's that's how we that's how we view it. It's important for our leaders to be talking to peers every day and to be recruiting every day. And so that's just part of how we do business and how we go about it. I'm going to go back and say one other thing that Michael was talking about, and I think you asked a good question on, you know, bullish. We sound pretty bullish, but we said high single digits, and I think Michael's making a really good point. If you look at where our growth came from, and most people think, man, it's going to all be in Nashville. It was actually just quite different than that. Nashville was flat, and the growth came from all the other places. And if you looked at places like Birmingham, which continues to do really well. If you looked at places like Auburn, where we're doing really well. Columbus, you know, doing well. Columbus, Georgia. Georgia, some places in West Tennessee, man, are doing really well. A lot of our smaller communities are net contributors, and that's why we're bullish around the footprint, because we continue to have some pretty big payoffs in the Nashville market, but we're getting good production there. So that's the reason that we're bullish, and certainly we could exceed that, But right now, we're comfortable with that high single digits is what we're talking about.
Sounds good. Appreciate all the color.
Operator
Our next question comes from Brett Rabbiton from Stone X Group. Please go ahead with your question.
Hey, guys. Good morning, Brett. I wanted to talk about maybe some of the components of the loan growth from here. And I noticed that construction was continued to be a little bit softer, link quarter, you know, when you guys kind of got back into the market late last year and we're doing some more stuff. You know, any thoughts on the construction pipeline and if you guys are looking maybe to add on the construction or if that's an area that you're avoiding, just given, you know, credit risk or maybe a hot market in some aspects. And then just wanted to hear on a specialized lending side, you know, you talked about SBA last quarter. If there's anything else that you guys were taking a look at and if you expected the specialized lines to maybe help grow as well.
Yeah, Brett. So, first off on construction, no, we're not avoiding construction at all. I think there's probably some risk element buried in the question. Are we scared of that risk? No, we're really not scared of that construction risk, and our markets continue to perform well, so we're confident there. Of course, we manage our construction concentration and have and will continue to, but it's really where opportunities come from. We do have a couple of construction projects in the pipeline that will span next, man, several quarters, and so even years, and those will be owner-occupied type construction as opposed to non-owner-occupied type construction, but they're large and they span time, so they span over quarters. And so, again, excited about kind of where that sits, but we're certainly not avoiding it in terms of an asset class for us. And then on the specialized specialty lending group, which is mostly made up of manufactured housing, we continue to want to grow that line as well. We keep a watch on the concentration, but we're underneath our concentration levels that we've set for ourselves, so we've got room to grow, and we'll continue to grow it.
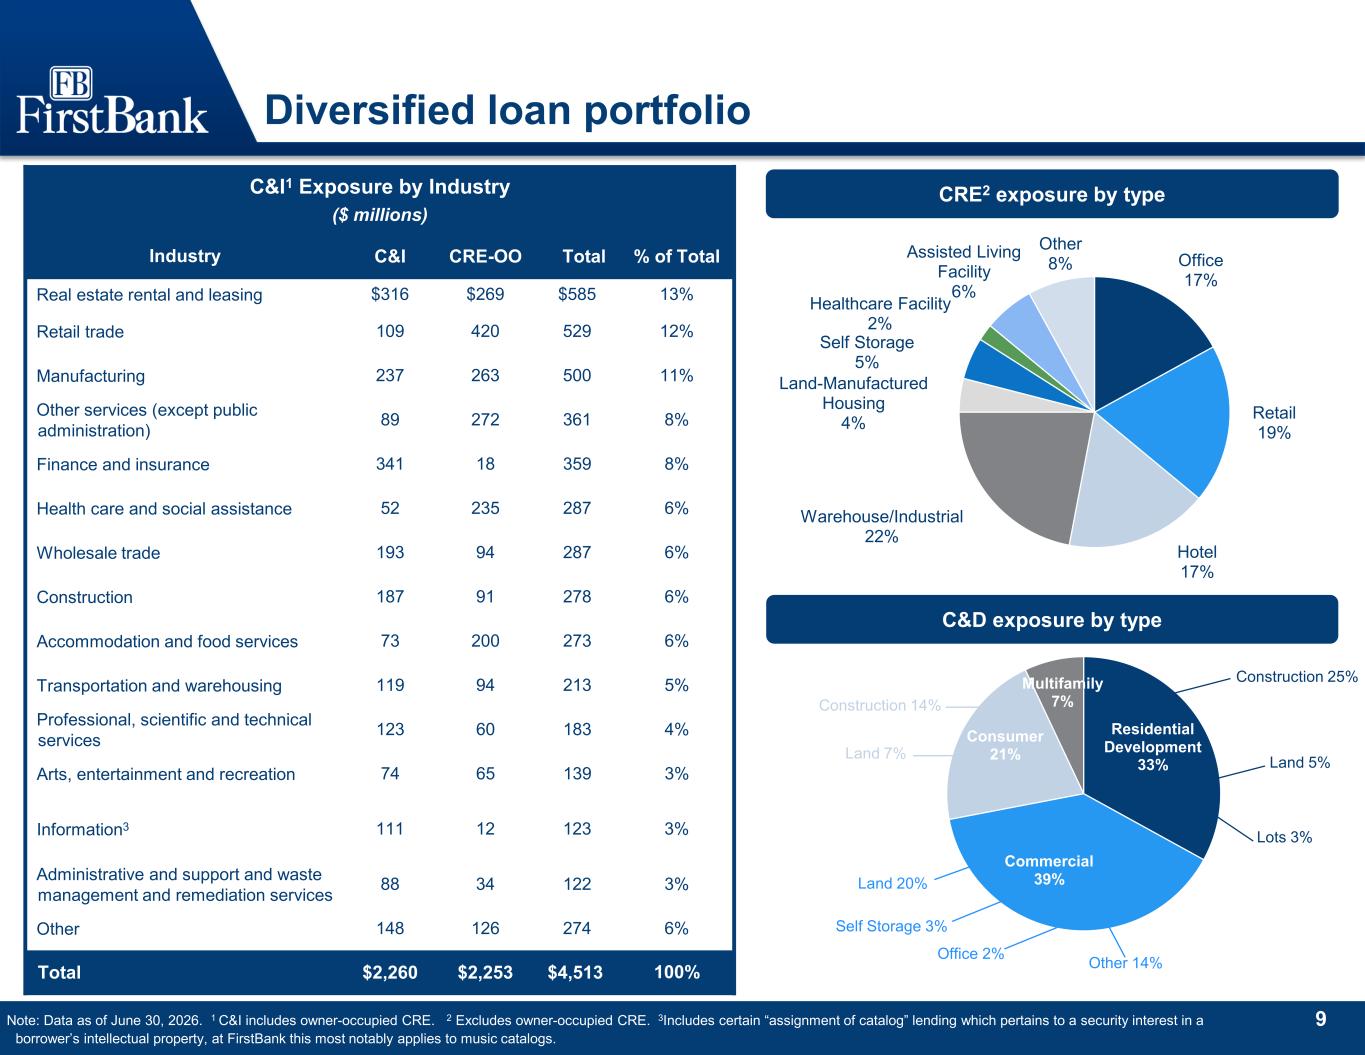
And then just wanted to see if there was any additional color you could provide on those two credits and, you know, how much were specific reserves for those two. And then I assume they were in the non-underoccupied commercial real estate bucket, just kind of given slide 13. But I just wanted to hear if there was anything interesting about those two credits that might have caused them to be assessed, so to speak.
Those two credits, yeah, both real estate-related, different geographies. One of them came to us through acquisition. And I guess that's one of them came to us through acquisition. The other one originated by an officer that we fired, and we're working through it, and so, and both, again, neither of them construction, both completed projects, And smaller Michaels in terms of the specific reserves, not huge, but that – Yeah, it was about three and a half in total on those two.
The one that was more organic, I think it's really strong guarantors. Projects just a little bit struggling a little bit, but really strong guarantors. team feels pretty confident in that, but numbers haven't penciled out yet, and the other one we're working through, and like Chris said, couldn't be further away in geography, so it says they're completely unrelated instances.
Okay, sounds like some pretty isolated things.
Okay, great, appreciate all the color guys.
Operator
All right, great. Our next question comes from David Bishop from Hopti Group. Please go ahead with your question.
Hey, good morning, gentlemen. Curious, Chris or Mike, you can remind us maybe on your near term and intermediate term capital targets. Just curious how they stand in relation to where you exited the quarter at.
Yeah, I mean, good morning, Dave. We're comfortable with where we are in our capital ratio today. I mean, you know, like we look at TCE, we follow that very closely, and it's around 9% would be our target. So pretty comfortable. We build back capital very quickly, and we'll build it back on these repurchases in the next two quarters as well.
Yeah, we look really at We keep a close eye on TCE ratio. We'd like for it to hover around the 9% right now. It's been above that, still above that. We also look at the CET1 ratio constantly and consistently, and we want it to be 10% plus. And, again, so it is, and so we're comfortable with where we are.
Got it. And then circling back to the operating expense outlook, you know, great expense control this quarter. You know, you mentioned the hires and pretty good loan growth here. Just curious, maybe, I don't know if you can give us any sort of sense, you know, from a dollar basis. You know, is there sort of, you know, mid-single-digit inflationary pressure over the second half of the year? Just curious, where are you penciling out as sort of a good run rate in terms of the back half of the year?
Yeah, gosh, that's a tough question because I would say that the cost of employees, especially on the revenue side, is more than single-digit inflation. Fair value changes every day, and so it's pretty aggressive. I think that, yeah, there's probably a little bit of conservatism, thoughtfulness, just making sure that we're hitting on all cylinders and protecting the team, but also able to go out and hire people that Chris mentioned we've been talking to for years. When you've been dating this long, you want to make sure that you're not losing out because of a couple dollars. And so that's really where that expense guidance comes from. The team's done really well across the bank, both back office and front office. But that's where that guide's coming from. It's a little bit of feel on top of math, just feeling where the numbers are going, where the hiring's going.
Got it. Then maybe one housekeeping item. I know the tax rate has jumped around here the past few quarters. Good effective tax rate to use moving forward?
Yeah, low 20%, 20% or so, so slightly higher, but not materially higher.
Appreciate the color. Yes, sir.
Operator
Our next question comes from Steve Moss from Raymond James. Please go ahead with your question.
Good afternoon, guys. Or good morning, guys.
Feels like afternoon. It's all right.
It's been a busy morning. You know, most of my questions have been asked and answered here. I guess just, you know, one cleanup for me, you know, the purchase counting number here, is this a good run rate at this lower level or, you know, more like 6 million-ish plus Yeah, I think this is a good run rate.
I think about it as 14, 15 basis points on a margin, which is why you get to that 370, 380 range on core. You know, obviously it will decline a basis point or so, a quarter in there, you know, but as a book, maybe not a quarter, but a year, a couple of basis points. But, yeah, it's a good number, Steve.
Okay, great. Appreciate that, Culler, and all the color you guys have been on the call here today. Thank you very much.
Operator
Once again, if you would like to ask a question, please press star and then one. To withdraw your questions, you may press star and two. Our next question comes from Christopher Maranek from Ring Capital. Please go ahead with your question.
Hey, good morning, and thanks for taking all of our questions today. I just want to go back to deposits, and I'm curious on how if you see changing behaviors on deposits. I know we talked a lot about the rate and the impact earlier, but just curious if you're seeing more rate shopping or you're having more exception requests. Just wanted to delve a little bit more on behaviors.
Yeah, Chris, I wouldn't say we see any real change in behaviors, at least not material. I think relationships still matter. I do think competitive, if there's any change in behavior, I would say there is, I don't think it's rate environment driven. And I think it's more some of the different types of competitors, the continuing changes in technology that maybe get people more aware of different ways and different places to hold the money. And so you see maybe a little bit of that, but I don't know that it really impacts us that much in day-to-day relationships. So I think at the end of the day, it still comes down to being easy to do business with and have a great customer experience is what it boils down to. And I think that carries the day.
Yeah, and Chris, I'd say, you know, we empower our front line to be able to take care of clients and retain and attract new business with rate authority. But we do track on a daily basis exceptions, and we have not seen an increase, a material increase. You know, it has been flows. Sometimes we'll see CDs, you know, for competitors out 12 months and we're only out six that you can see some slight price fluctuations. But in general, it's been pretty consistent. And I think you continue to see a competitive environment, but people are empowered to take care of their clients.
Hey, one other thing I would mention, Chris, listening to Michael answer that question, is that, remember, our deposit cost is actually a little bit higher than Peter's. And so that, I frankly would say that that may impact some others more than it does us because we've empowered the front line for a long time now to be able to be competitive, you know, at the point of contact for that relationship. And we're already going to be offering them a fair rate, but if they get offered some special rate, we've got the front line empowered to be able to counter that. And so that's intentional on our part, and so that behavior hasn't changed for us.
Okay, great. That's very helpful. Thank you both for that. And then just a quick follow-up on just your strategic opportunities that you look at. Do you see any shift in pricing, and is there anything that you need to do differently as you sort of review opportunities externally?
Yeah, so I think you're talking about in terms of maybe an acquisition opportunity. Is that what you're asking, Chris? So I'd say that the opportunities are ample right now, and they generally run smaller in terms of the size of the institution. They're generally going to be, we see in a lot of opportunities of less than $2 billion. And on the pricing there, yes, I would say, notice we haven't done anything in that size in a while, but that's because of our view on pricing has been that for us, it needs to bring strategic value and financial value. And disruption is very hard for us to justify because of our organic opportunity and our organic momentum. That disruption of doing an acquisition is hard for us to justify. So unless there's real strategic value and real financial value, we don't think it's worth the disruption. And so, therefore, yes, we see quite a bit, but when we think about the financial cost and the opportunity cost, it really drives the price down for the seller. and consequently you haven't seen us do a lot and so I think the answer to your question is yes we do see that impacting valuations from our perspective and we see that impacting what we think institutions the way we value institutions and consequently you haven't seen us do a lot.
Great and obviously those deals are not getting done by somebody else. So that says a lot.
Yes, I agree. It says a lot and it says a lot.
Great. Thanks again for taking my questions.
All right. Thanks, Chris.
Operator
And at this time, we'll be concluding today's question and answer session. I'd like to turn the floor back over to Chris Holmes for closing comments.
All right. Well, listen, we really appreciate everybody joining us to cover quarter. I always appreciate your interest in the company. And if there are any of you who need to speak to us directly, we're available after the call. Thanks.
Operator
And with that, ladies and gentlemen, we'll conclude today's conference call. We do thank you for joining. You may now disconnect your lines.