
FRPT 8-K
Freshpet, Inc. (FRPT)
8-K
2025-08-04
For: 2025-08-04
View Original
Added on
April 05, 2026
UNITED STATES
SECURITIES AND EXCHANGE COMMISSION
WASHINGTON, D.C. 20549
FORM 8-K
CURRENT REPORT
Pursuant to Section 13 or 15(d) of the Securities Exchange Act of 1934
Date of Report (Date of earliest event reported): August 4, 2025
(Exact name of Registrant as Specified in Its Charter)
(State or Other Jurisdiction of Incorporation) | (Commission File Number) | (IRS Employer Identification No.) | ||||||
| (Address of Principal Executive Offices) | (Zip Code) | |||||||
Registrant’s Telephone Number, Including Area Code: (201 ) 520-4000
Not Applicable
(Former Name or Former Address, if Changed Since Last Report)
Check the appropriate box below if the Form 8-K filing is intended to simultaneously satisfy the filing obligation of the registrant under any of the following provisions:
| Written communications pursuant to Rule 425 under the Securities Act (17 CFR 230.425) | |||||
| Soliciting material pursuant to Rule 14a-12 under the Exchange Act (17 CFR 240.14a-12) | |||||
| Pre-commencement communications pursuant to Rule 14d-2(b) under the Exchange Act (17 CFR 240.14d-2(b)) | |||||
| Pre-commencement communications pursuant to Rule 13e-4(c) under the Exchange Act (17 CFR 240.13e-4(c)) | |||||
Securities registered pursuant to Section 12(b) of the Act:
| Title of each class | Trading Symbol(s) | Name of each exchange on which registered | ||||||
Indicate by check mark whether the registrant is an emerging growth company as defined in Rule 405 of the Securities Act of 1933 (§ 230.405 of this chapter) or Rule 12b-2 of the Securities Exchange Act of 1934 (§ 240.12b-2 of this chapter).
Emerging growth company ☐
If an emerging growth company, indicate by check mark if the registrant has elected not to use the extended transition period for complying with any new or revised financial accounting standards provided pursuant to Section 13(a) of the Exchange Act. ☐
Item 2.02. Results of Operations and Financial Condition.
On August 4, 2025, Freshpet, Inc. (“Freshpet”) issued a press release disclosing its financial results for the quarter ended June 30, 2025. The full text of the press release is attached hereto as Exhibit 99.1 and is incorporated herein by reference.
As previously announced, Freshpet will hold a conference call at 8:00 a.m., Eastern Time, on Monday, August 4, 2025, to discuss its financial results for the quarter ended June 30, 2025.
Freshpet references non-GAAP financial information in the press release and makes similar references in the transcript to the conference call. A reconciliation of these non-GAAP financial measures to the nearest comparable GAAP financial measures is contained in the attached Exhibit 99.1 press release.
Item 7.01. Regulation FD Disclosure.
On August 4, 2025, Freshpet published to the investor relations section of its website a presentation which will be used by Freshpet’s management team in meetings with analysts and stockholders. A copy of the presentation is attached hereto as Exhibit 99.2 and is incorporated herein by reference.
The information furnished with Item 2.02 and this Item 7.01, including Exhibits 99.1 and 99.2, shall not be deemed “filed” for purposes of Section 18 of the Securities Exchange Act of 1934, as amended (“the Exchange Act”) or incorporated by reference into any other filing under the Securities Act of 1933, as amended, or the Exchange Act, except as expressly set forth by specific reference in such a filing.
Freshpet uses the “Investors” section of its website (investors.freshpet.com) as a means of disclosing material non-public information and for complying with its disclosure obligations under Regulation FD.
Item 9.01. Financial Statements and Exhibits.
(d) Exhibits
Exhibit Number | Description | |||||||
| 99.1 | ||||||||
| 99.2 | ||||||||
| 104 | Cover Page Interactive Data File (embedded within the Inline XBRL document). | |||||||
SIGNATURE
Pursuant to the requirements of the Securities Exchange Act of 1934, the registrant has duly caused this report to be signed on its behalf by the undersigned hereunto duly authorized.
| FRESHPET, INC. | ||||||||
| Date: August 4, 2025 | By: | /s/ Todd Cunfer | ||||||
| Name: Todd Cunfer | ||||||||
| Title: Chief Financial Officer | ||||||||
Exhibit 99.1

Freshpet, Inc. Reports Second Quarter 2025 Financial Results
Delivers Category Leading Growth
Drives Operational Efficiencies that Deliver Margin Expansion and Reduce Capital Requirements
Updates Outlook for 2025 and 2027
Bedminster, N.J. – August 4, 2025 – Freshpet, Inc. (“Freshpet” or the “Company”) (Nasdaq: FRPT) today reported financial results for its second quarter and six months ended June 30, 2025.
Second Quarter 2025 Financial Highlights Compared to Prior Year Period
•Net sales of $264.7 million, an increase of 12.5%.
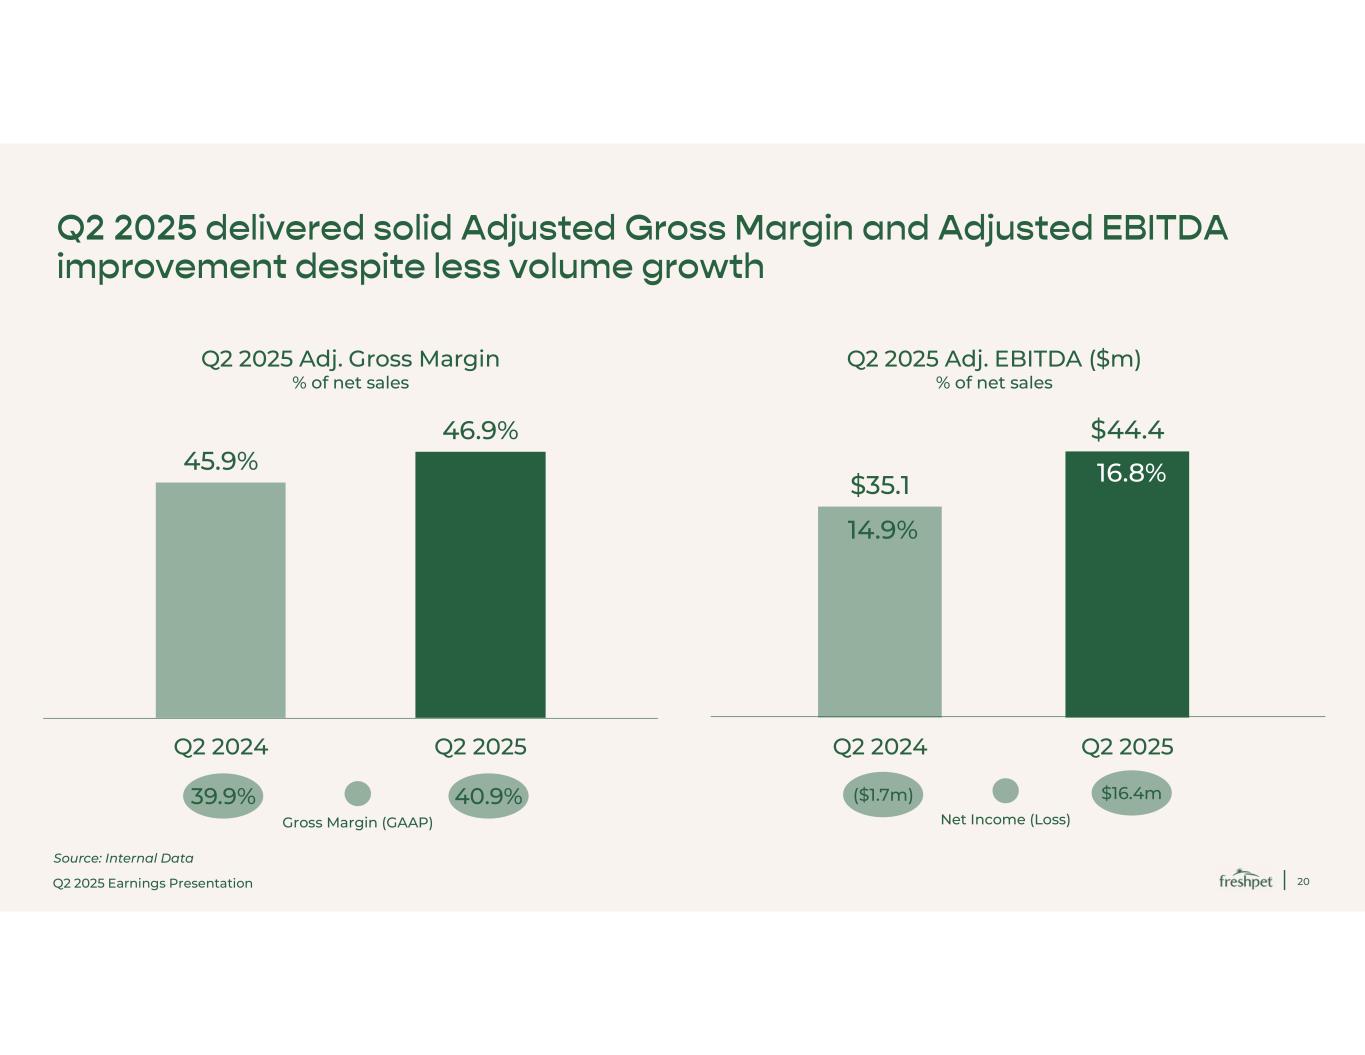
•Net income of $16.4 million, compared to the prior year period net loss of $1.7 million.
•Gross margin of 40.9%, compared to the prior year period of 39.9%.
•Adjusted Gross Margin of 46.9%, compared to the prior year period of 45.9%.1
•Adjusted EBITDA of $44.4 million, compared to the prior year period of $35.1 million.1
"Against a more challenging consumer sentiment backdrop, we continue to significantly outperform the dog food category - delivering both category leading sales growth and strong improvements in operations," commented Billy Cyr, Freshpet’s Chief Executive Officer. “As a nimble growth company that is adapting to an economically constrained consumer, we are intensely focused on what we can control. That includes accelerating our advertising and distribution programs, reducing our capital expenditures, and strengthening our operations. On the other hand, we will be pragmatic about what we can't control, so we are revising our current year's net sales target and removing our long-term net sales target to match the environment we are facing today. We still believe we will deliver outsized growth for a long period of time, but we need to plan for the current economic realities. In total, we believe the actions we are taking position us well to create significant shareholder value and fulfill our mission to elevate the way we feed our pets with fresh food that nourishes all."
Second Quarter 2025
Net sales increased 12.5% to $264.7 million for the second quarter of 2025 compared to $235.3 million in the prior year period. The increase in net sales was primarily driven by volume gains of 10.8% and favorable price/mix of 1.7%.
Gross profit was $108.2 million, or 40.9% as a percentage of net sales, for the second quarter of 2025, compared to $94.0 million, or 39.9% as a percentage of net sales, in the prior year period. The increase in reported gross profit as a percentage of net sales was primarily due to lower input costs and reduced quality costs, partially offset by reduced leverage on plant expenses. For the second quarter of 2025, Adjusted Gross Profit was $124.0 million, or 46.9% as a percentage of net sales, compared to $108.0 million, or 45.9% as a percentage of net sales, in the prior year period.1
Selling, general and administrative expenses (“SG&A”) were $90.4 million for the second quarter of 2025 compared to $95.7 million in the prior year period. SG&A as a percentage of net sales decreased by 660 basis points to 34.1% for the second quarter of 2025 compared to 40.7% in the prior year period, primarily due to decreased share-based compensation and variable compensation accrual, partially offset by increased media spend as a percentage of net sales. Adjusted SG&A for the second quarter of 2025 was $79.6 million, or 30.1% as a percentage of net sales, compared to $72.9 million, or 31.0% as a percentage of net sales, in the prior year period.1
Net income was $16.4 million for the second quarter of 2025 compared to net loss of $1.7 million in the prior year period. The increase in net income was due to contribution from higher sales, improved gross profit as a percentage of net sales and decreased SG&A expenses.
Adjusted EBITDA was $44.4 million for the second quarter of 2025 compared to $35.1 million in the prior year period.1 The increase in Adjusted EBITDA was a result of increased Adjusted Gross Profit, partially offset by higher Adjusted SG&A.
1
First Six Months of 2025
Net sales increased 15.0% to $527.9 million for the first six months of 2025 compared to $459.1 million in the prior year period. The increase in net sales was primarily driven by volume gains of 12.8% and favorable price/mix of 2.2%.
Gross profit was $212.0 million, or 40.2% as a percentage of net sales, for the first six months of 2025, compared to $182.1 million, or 39.7% as a percentage of net sales, in the prior year period. The increase in reported gross profit as a percentage of net sales was primarily due to lower input costs and reduced quality costs, partially offset by reduced leverage on plant expenses. For the first six months of 2025, Adjusted Gross Profit was $244.3 million, or 46.3% as a percentage of net sales, compared to $209.5 million, or 45.6% as a percentage of net sales, in the prior year period.1
SG&A were $205.7 million for the first six months of 2025 compared to $175.4 million in the prior year period. SG&A as a percentage of net sales increased by 80 basis points to 39.0% for the first six months of 2025 compared to 38.2% in the prior year period, primarily due to increased media spend as a percentage of net sales and higher non-recurring charges in the first quarter of 2025, partially offset by decreased share-based compensation and variable compensation accrual. Adjusted SG&A for the first six months of 2025 was $164.3 million, or 31.1% as a percentage of net sales, compared to $143.8 million, or 31.3% as a percentage of net sales, in the prior year period.1
Net income was $3.7 million for the first six months of 2025 compared to net income of $16.9 million in the prior year period. The decrease in net income was due to increased SG&A expenses, including increased media spend of $18.8 million and $16.9 million of non-recurring charges in the first quarter of 2025 compared to a $9.9 million gain on equity investment in the prior year period, which were partially offset by contributions from higher sales and improved gross profit as a percentage of net sales.
Adjusted EBITDA was $79.9 million for the first six months of 2025 compared to $65.7 million in the prior year period.1 The increase in Adjusted EBITDA was a result of increased Adjusted Gross Profit, partially offset by higher Adjusted SG&A.
Balance Sheet
As of June 30, 2025, the Company had cash and cash equivalents of $243.7 million with $396.2 million of debt outstanding, net of $6.3 million of unamortized debt issuance costs. For the six months ended June 30, 2025, cash from operations was $38.7 million, a decrease of $9.1 million compared to the prior year period driven largely by the higher variable incentive compensation payment in the first quarter of 2025.
The Company will utilize its balance sheet to support its ongoing capital needs in connection with its long-term capacity plan.
Outlook
For full year 2025, the Company is updating its guidance and now expects the following:
•Net sales increase of 13% to 16% from 2024, compared to an increase of 15% to 18% in the previous guidance;
•Adjusted EBITDA in the range of $190 million to $210 million, unchanged; and
•Capital expenditures of ~$175 million, compared to ~$225 million in the previous guidance.
The Company is also updating its long-term guidance. For full year 2027, the Company is removing the $1.8 billion net sales target to adjust for the recent slower growth; however, the Company expects to continue to deliver growth significantly in excess of the dog food category. The Company is reiterating its Adjusted Gross Margin target of 48% and Adjusted EBITDA Margin target of 22% for full year 2027.
1.Adjusted Gross Margin, Adjusted Gross Profit, Adjusted SG&A and Adjusted EBITDA are non-GAAP financial measures. See "Non-GAAP Measures" for how the Company defines these measures and the financial tables that accompany this release for reconciliations of these measures to the closest comparable GAAP measures.
2
The Company does not provide guidance for net income (loss), the U.S. GAAP measure most directly comparable to Adjusted EBITDA, and similarly cannot provide a reconciliation between its forecasted Adjusted EBITDA and net income (loss) metrics without unreasonable effort due to the unavailability of reliable estimates for certain components of net income (loss) and the respective reconciliations, including the timing of and amount of costs of goods sold and selling, general and administrative expenses. These items are not within the Company's control and may vary greatly between periods and could significantly impact future results.
Conference Call & Earnings Presentation Webcast Information
As previously announced, today, August 4, 2025, the Company will host a conference call beginning at 8:00 a.m. Eastern Time with members of its leadership team. The conference call webcast will be available live over the Internet through the "Investors" section of the Company's website at www.freshpet.com. To participate on the live call, listeners in North America may dial (877) 407-0792 and international listeners may dial (201) 689-8263; the passcode is 13754861.
About Freshpet
Freshpet's mission is to elevate the way we feed our pets with fresh food that nourishes all. Freshpet foods are blends of fresh meats, vegetables and fruits farmed locally and made at our Freshpet Kitchens. We thoughtfully prepare our foods using natural ingredients, cooking them in small batches at lower temperatures to preserve the natural goodness of the ingredients. Freshpet foods and treats are kept refrigerated from the moment they are made until they arrive at Freshpet Fridges in your local market.
Our foods are available in select grocery, mass, digital, pet specialty, and club retailers across the United States, Canada and Europe, as well as online in the U.S. From the care we take to source our ingredients and make our food, to the moment it reaches your home, our integrity, transparency and social responsibility are the way we like to run our business. To learn more, visit www.freshpet.com.
Connect with Freshpet:
https://www.facebook.com/Freshpet
https://x.com/Freshpet
http://instagram.com/Freshpet
http://pinterest.com/Freshpet
https://www.tiktok.com/@Freshpet
https://www.youtube.com/user/freshpet400
Forward Looking Statements
Certain statements in this press release constitute “forward-looking” statements within the meaning of the Private Securities Litigation Reform Act of 1995 and are based on our current expectations and assumptions. These include statements our focus on accelerating our advertising and distribution programs, reducing our capital expenditures, and strengthening our operations, our expectation to grow significantly in excess of the dog food category, updated guidance on 2025 net sales and capital expenditures and our long-term net sales target. Such statements are subject to risks and uncertainties that could cause actual results to differ materially from those discussed in the forward-looking statements including difficulties in launching our new technology, a change in economic uncertainty, changes in rates of pet acquisition, the launch of new competitive products, impact of tariffs, difficulties in construction of manufacturing facilities, and most prominently, the risks discussed under the heading "Risk Factors" in the Company's latest annual report on Form 10-K and quarterly reports on Form 10-Q filled with the Securities and Exchange Commission. Such forward-looking statements are made only as of the date of this presentation. Freshpet undertakes no obligation to publicly update or revise any forward-looking statement because of new information, future events or otherwise, except as otherwise required by law. If we do update one or more forward-looking statements, no inference should be made that we will make additional updates with respect to those or other forward-looking statements.
3
Non-GAAP Financial Measures
Freshpet uses the following non-GAAP financial measures in its financial communications. These non-GAAP financial measures should be considered as supplements to the U.S. GAAP reported measures, should not be considered replacements for, or superior to, the U.S. GAAP measures and may not be comparable to similarly named measures used by other companies.
•Adjusted Gross Profit
•Adjusted Gross Profit as a percentage of net sales (Adjusted Gross Margin)
•Adjusted SG&A Expenses
•Adjusted SG&A Expenses as a percentage of net sales
•EBITDA
•Adjusted EBITDA
•Adjusted EBITDA as a percentage of net sales (Adjusted EBITDA Margin)
Adjusted Gross Profit: Freshpet defines Adjusted Gross Profit as gross profit before depreciation expense, non-cash share-based compensation and loss on disposal of manufacturing equipment.
Adjusted SG&A Expenses: Freshpet defines Adjusted SG&A as SG&A expenses before depreciation and amortization expense, non-cash share-based compensation, loss on disposal of equipment, distributor transition costs, legal obligation and international business changes.
EBITDA and Adjusted EBITDA: EBITDA represents net income (loss) plus interest expense net of interest income, income tax expense and depreciation and amortization expense, and Adjusted EBITDA represents EBITDA less gain on equity investment, plus non-cash share-based compensation expense, loss on disposal of property, plant and equipment, distributor transition costs, legal obligation, and international business changes.
Management believes that the non-GAAP financial measures are meaningful to investors because they provide a view of the Company with respect to ongoing operating results. The non-GAAP financial measures are shown as supplemental disclosures in this release because they are widely used by the investment community for analysis and comparative evaluation. They also provide additional metrics to evaluate the Company’s operations and, when considered with both the Company’s GAAP results and the reconciliation to the most comparable U.S. GAAP measures, provide a more complete understanding of the Company’s business than could be obtained absent this disclosure. The non-GAAP measures are not and should not be considered an alternative to the most comparable U.S. GAAP measures or any other figure calculated in accordance with U.S. GAAP, or as an indicator of operating performance. The Company’s calculation of the non-GAAP financial measures may differ from methods used by other companies. Management believes that the non-GAAP measures are important to an understanding of the Company's overall operating results in the periods presented. The non-GAAP financial measures are not recognized in accordance with U.S. GAAP and should not be viewed as an alternative to U.S. GAAP measures of performance.
Investor Contact:
Rachel Ulsh
Media Contact:
4
FRESHPET, INC. AND SUBSIDIARIES
CONDENSED CONSOLIDATED BALANCE SHEETS
(Unaudited, in thousands, except per share data)
| June 30, 2025 | December 31, 2024 | ||||||||||
| ASSETS | |||||||||||
| CURRENT ASSETS: | |||||||||||
| Cash and cash equivalents | $ | 243,684 | $ | 268,633 | |||||||
| Accounts receivable, net of allowance for doubtful accounts | 60,375 | 68,419 | |||||||||
| Inventories, net | 90,583 | 80,794 | |||||||||
| Prepaid expenses | 10,702 | 16,026 | |||||||||
| Other current assets | 3,833 | 3,126 | |||||||||
| Total Current Assets | 409,177 | 436,998 | |||||||||
| Property, plant and equipment, net | 1,101,367 | 1,065,869 | |||||||||
| Deposits on equipment | 450 | 1,047 | |||||||||
| Operating lease right of use assets | 67,505 | 3,366 | |||||||||
| Long term investment in equity securities | 33,446 | 33,446 | |||||||||
| Other assets | 35,549 | 34,152 | |||||||||
| Total Assets | $ | 1,647,494 | $ | 1,574,878 | |||||||
| LIABILITIES AND STOCKHOLDERS' EQUITY | |||||||||||
| CURRENT LIABILITIES: | |||||||||||
| Accounts payable | $ | 42,817 | $ | 39,164 | |||||||
| Accrued expenses | 37,872 | 56,263 | |||||||||
| Current operating lease liabilities | 2,074 | 1,322 | |||||||||
| Current finance lease liabilities | 2,218 | 2,120 | |||||||||
| Total Current Liabilities | $ | 84,981 | $ | 98,869 | |||||||
| Convertible senior notes | 396,237 | 395,163 | |||||||||
| Long term operating lease liabilities | 65,655 | 2,213 | |||||||||
| Long term finance lease liabilities | 28,967 | 23,273 | |||||||||
| Total Liabilities | $ | 575,840 | $ | 519,518 | |||||||
| Commitments and contingencies | — | — | |||||||||
| STOCKHOLDERS' EQUITY: | |||||||||||
| Common stock — voting, $0.001 par value, 200,000 shares authorized, 48,792 issued and 48,778 outstanding on June 30, 2025, and 48,716 issued and 48,702 outstanding on December 31, 2024 | 49 | 49 | |||||||||
| Additional paid-in capital | 1,350,344 | 1,338,160 | |||||||||
| Accumulated deficit | (278,147) | (281,806) | |||||||||
| Accumulated other comprehensive loss | (336) | (787) | |||||||||
| Treasury stock, at cost — 14 shares on June 30, 2025 and on December 31, 2024 | (256) | (256) | |||||||||
| Total Stockholders' Equity | 1,071,654 | 1,055,360 | |||||||||
| Total Liabilities and Stockholders' Equity | $ | 1,647,494 | $ | 1,574,878 | |||||||
5
FRESHPET, INC. AND SUBSIDIARIES
CONDENSED CONSOLIDATED STATEMENTS OF OPERATIONS AND COMPREHENSIVE INCOME (LOSS)
(Unaudited in thousands, except per share data)
| For the Three Months Ended June 30, | For the Six Months Ended June 30, | ||||||||||||||||||||||
| 2025 | 2024 | 2025 | 2024 | ||||||||||||||||||||
| NET SALES | $ | 264,689 | $ | 235,253 | $ | 527,938 | $ | 459,102 | |||||||||||||||
| COST OF GOODS SOLD | 156,499 | 141,301 | 315,960 | 276,992 | |||||||||||||||||||
| GROSS PROFIT | 108,190 | 93,952 | 211,978 | 182,110 | |||||||||||||||||||
| SELLING, GENERAL, AND ADMINISTRATIVE EXPENSES | 90,386 | 95,702 | 205,671 | 175,396 | |||||||||||||||||||
| INCOME (LOSS) FROM OPERATIONS | 17,804 | (1,750) | 6,307 | 6,714 | |||||||||||||||||||
| OTHER (EXPENSES) INCOME: | |||||||||||||||||||||||
| Interest and Other Income, net | 2,199 | 2,861 | 4,592 | 6,195 | |||||||||||||||||||
| Interest Expense | (3,749) | (2,751) | (7,208) | (5,811) | |||||||||||||||||||
| Gain on Equity Investment | — | — | — | 9,918 | |||||||||||||||||||
| (1,550) | 110 | (2,616) | 10,302 | ||||||||||||||||||||
| INCOME (LOSS) BEFORE INCOME TAXES | 16,254 | (1,640) | 3,691 | 17,016 | |||||||||||||||||||
| INCOME TAX (BENEFIT) EXPENSE | (102) | 54 | 32 | 108 | |||||||||||||||||||
| INCOME (LOSS) ATTRIBUTABLE TO COMMON STOCKHOLDERS | $ | 16,356 | $ | (1,694) | $ | 3,659 | $ | 16,908 | |||||||||||||||
| OTHER COMPREHENSIVE INCOME (LOSS): | |||||||||||||||||||||||
| Change in foreign currency translation | $ | 240 | $ | (79) | $ | 451 | $ | (197) | |||||||||||||||
| TOTAL OTHER COMPREHENSIVE INCOME (LOSS) | 240 | (79) | 451 | (197) | |||||||||||||||||||
| TOTAL COMPREHENSIVE INCOME (LOSS) | $ | 16,596 | $ | (1,773) | $ | 4,110 | $ | 16,711 | |||||||||||||||
| NET INCOME (LOSS) PER SHARE ATTRIBUTABLE TO COMMON STOCKHOLDERS | |||||||||||||||||||||||
| -BASIC | $ | 0.34 | $ | (0.03) | $ | 0.08 | $ | 0.35 | |||||||||||||||
| -DILUTED | $ | 0.33 | $ | (0.03) | $ | 0.07 | $ | 0.34 | |||||||||||||||
| WEIGHTED AVERAGE SHARES OF COMMON STOCK OUTSTANDING | |||||||||||||||||||||||
| -BASIC | 48,778 | 48,461 | 48,755 | 48,400 | |||||||||||||||||||
| -DILUTED | 50,198 | 48,461 | 50,256 | 50,154 | |||||||||||||||||||
6
FRESHPET, INC. AND SUBSIDIARIES
CONDENSED CONSOLIDATED STATEMENT OF CASH FLOWS
(Unaudited, in thousands)
| For the Six Months Ended June 30, | |||||||||||
| 2025 | 2024 | ||||||||||
| CASH FLOWS FROM OPERATING ACTIVITIES: | |||||||||||
| Net income | $ | 3,659 | $ | 16,908 | |||||||
| Adjustments to reconcile net income to net cash flows provided by operating activities: | |||||||||||
| Provision for loss on accounts receivable | 11,452 | 13 | |||||||||
| Loss on disposal of property, plant and equipment | 1,229 | 286 | |||||||||
| Share-based compensation | 15,037 | 25,755 | |||||||||
| Inventory obsolescence | — | 699 | |||||||||
| Depreciation and amortization | 42,436 | 33,324 | |||||||||
| Amortization of deferred financing costs | 1,074 | 1,035 | |||||||||
| Change in operating lease right of use asset | 727 | 766 | |||||||||
| Gain on equity investment | — | (9,918) | |||||||||
| Changes in operating assets and liabilities: | |||||||||||
| Accounts receivable | (3,208) | (11,407) | |||||||||
| Inventories | (9,400) | (8,685) | |||||||||
| Prepaid expenses and other current assets | (3,913) | (3,968) | |||||||||
| Other assets | (3,060) | (1,240) | |||||||||
| Accounts payable | 2,291 | (981) | |||||||||
| Accrued expenses | (18,958) | 6,069 | |||||||||
| Operating lease liability | (673) | (837) | |||||||||
| Net cash flows provided by operating activities | 38,693 | 47,819 | |||||||||
| CASH FLOWS FROM INVESTING ACTIVITIES: | |||||||||||
| Acquisitions of property, plant and equipment, software and deposits on equipment | (59,932) | (94,795) | |||||||||
| Net cash flows used in investing activities | (59,932) | (94,795) | |||||||||
| CASH FLOWS FROM FINANCING ACTIVITIES: | |||||||||||
| Tax withholdings related to net shares settlements of restricted stock units | (2,860) | (1,440) | |||||||||
| Principal payments under finance lease obligations | (1,037) | (952) | |||||||||
| Proceeds from exercise of options to purchase common stock | 187 | 4,196 | |||||||||
| Net cash flows (used in) provided by financing activities | (3,710) | 1,804 | |||||||||
| NET CHANGE IN CASH AND CASH EQUIVALENTS | (24,949) | (45,172) | |||||||||
| CASH AND CASH EQUIVALENTS, BEGINNING OF YEAR | 268,633 | 296,871 | |||||||||
| CASH AND CASH EQUIVALENTS, END OF PERIOD | $ | 243,684 | $ | 251,699 | |||||||
7
FRESHPET, INC. AND SUBSIDIARIES
RECONCILIATION BETWEEN GROSS PROFIT AND ADJUSTED GROSS PROFIT
| For the Three Months Ended June 30, | For the Six Months Ended June 30, | ||||||||||||||||||||||
| 2025 | 2024 | 2025 | 2024 | ||||||||||||||||||||
| (Dollars in thousands) | |||||||||||||||||||||||
| Gross profit | $ | 108,190 | $ | 93,952 | $ | 211,978 | $ | 182,110 | |||||||||||||||
| Depreciation expense | 13,729 | 11,827 | 28,909 | 22,502 | |||||||||||||||||||
| Non-cash share-based compensation | 1,831 | 2,220 | 3,114 | 4,841 | |||||||||||||||||||
| Loss on disposal of manufacturing equipment | 260 | 32 | 255 | 53 | |||||||||||||||||||
| Adjusted Gross Profit | $ | 124,010 | $ | 108,031 | $ | 244,256 | $ | 209,506 | |||||||||||||||
| Adjusted Gross Profit as a % of Net Sales | 46.9 | % | 45.9 | % | 46.3 | % | 45.6 | % | |||||||||||||||
8
FRESHPET, INC. AND SUBSIDIARIES
RECONCILIATION BETWEEN SG&A EXPENSES AND ADJUSTED SG&A EXPENSES
| For the Three Months Ended June 30, | For the Six Months Ended June 30, | ||||||||||||||||||||||
| 2025 | 2024 | 2025 | 2024 | ||||||||||||||||||||
| (Dollars in thousands) | |||||||||||||||||||||||
| SG&A expenses | $ | 90,386 | $ | 95,702 | $ | 205,671 | $ | 175,396 | |||||||||||||||
| Depreciation and amortization expense | 6,167 | 5,385 | 12,104 | 10,455 | |||||||||||||||||||
| Non-cash share-based compensation (a) | 4,390 | 17,313 | 11,923 | 20,913 | |||||||||||||||||||
| Loss on disposal of equipment | 225 | 104 | 391 | 233 | |||||||||||||||||||
| Distributor transition costs (b) | — | — | 10,680 | — | |||||||||||||||||||
| Legal obligation (c) | — | — | 4,987 | — | |||||||||||||||||||
| International business charges (d) | — | — | 1,273 | — | |||||||||||||||||||
| Adjusted SG&A Expenses | $ | 79,604 | $ | 72,900 | $ | 164,313 | $ | 143,795 | |||||||||||||||
| Adjusted SG&A Expenses as a % of Net Sales | 30.1 | % | 31.0 | % | 31.1 | % | 31.3 | % | |||||||||||||||
(a)Includes true-ups to share-based compensation expense. We have certain outstanding share-based awards with performance-based vesting conditions that require the achievement of certain Adjusted EBITDA margins, Adjusted EBITDA and/or Net Sales targets as a condition of vesting. At each reporting period, we reassess the probability of achieving the performance criteria and the performance period required to meet those targets. When the probability of achieving such performance conditions changes, the compensation cost previously recorded is adjusted as needed. When such performance conditions are deemed to be improbable of achievement, the compensation cost previously recorded is reversed.
(b)Represents a non-recurring loss as a result of an accounts receivable write-off in connection with the liquidation of one of our pet specialty distributors. Concurrent with its liquidation, we transitioned to a new distribution partner, who is a leading pet specialty distributor and who we anticipate will facilitate sales to pet specialty stores. Thus, despite the transitory impact during the first quarter of 2025, our ability to continue to generate sales is consistent with what we would expect to generate within the pet specialty channel.
(c)Represents an accrual for legal obligations related to the ongoing litigation with Phillips.
(d)Represents termination costs due to a business change in our international go-to-market strategy.
9
FRESHPET, INC. AND SUBSIDIARIES
RECONCILIATION BETWEEN NET INCOME (LOSS) AND ADJUSTED EBITDA
| For the Three Months Ended June 30, | For the Six Months Ended June 30, | ||||||||||||||||||||||
| 2025 | 2024 | 2025 | 2024 | ||||||||||||||||||||
| (Dollars in thousands) | |||||||||||||||||||||||
| Net income (loss) | $ | 16,356 | $ | (1,694) | $ | 3,659 | $ | 16,908 | |||||||||||||||
| Depreciation and amortization | 19,896 | 17,212 | 41,013 | 32,957 | |||||||||||||||||||
| Interest expense, net of interest income | 1,546 | (110) | 2,610 | (384) | |||||||||||||||||||
| Income tax (benefit) expense | (102) | 54 | 32 | 108 | |||||||||||||||||||
| EBITDA | 37,696 | 15,462 | 47,314 | 49,589 | |||||||||||||||||||
| Non-cash share-based compensation (a) | 6,221 | 19,533 | 15,037 | 25,755 | |||||||||||||||||||
| Loss on disposal of property, plant and equipment | 485 | 136 | 646 | 286 | |||||||||||||||||||
| Distributor transition costs (b) | — | — | 10,680 | — | |||||||||||||||||||
| Legal obligation (c) | — | — | 4,987 | — | |||||||||||||||||||
| International business charges (d) | — | — | 1,273 | — | |||||||||||||||||||
| Gain on equity investment | — | — | — | (9,918) | |||||||||||||||||||
| Adjusted EBITDA | $ | 44,402 | $ | 35,131 | $ | 79,937 | $ | 65,712 | |||||||||||||||
| Adjusted EBITDA as a % of Net Sales | 16.8 | % | 14.9 | % | 15.1 | % | 14.3 | % | |||||||||||||||
(a)Includes true-ups to share-based compensation expense. We have certain outstanding share-based awards with performance-based vesting conditions that require the achievement of certain Adjusted EBITDA margins, Adjusted EBITDA and/or Net Sales targets as a condition of vesting. At each reporting period, we reassess the probability of achieving the performance criteria and the performance period required to meet those targets. When the probability of achieving such performance conditions changes, the compensation cost previously recorded is adjusted as needed. When such performance conditions are deemed to be improbable of achievement, the compensation cost previously recorded is reversed.
(b)Represents a non-recurring loss as a result of an accounts receivable write-off in connection with the liquidation of one of our pet specialty distributors. Concurrent with its liquidation, we transitioned to a new distribution partner, who is a leading pet specialty distributor and who we anticipate will facilitate sales to pet specialty stores. Thus, despite the transitory impact during the first quarter of 2025, our ability to continue to generate sales is consistent with what we would expect to generate within the pet specialty channel.
(c)Represents an accrual for legal obligations related to the ongoing litigation with Phillips.
(d)Represents termination costs due to a business change in our international go-to-market strategy.
10

Q2 2025 Earnings Presentation 1 Q2 2025 Earnings August 4, 2025
Q2 2025 Earnings Presentation 2 Forward Looking Statements & Non-GAAP Measures FORWARD-LOOKING STATEMENTS Certain statements in this presentation by Freshpet, Inc. (the “Company”) constitute “forward-looking” statements within the meaning of the Private Securities Litigation Reform Act of 1995 and are based on our current expectations and assumptions. These include statements related to growth potential, ability to maintain key fundamentals of our business model in the current macro-economic environment, timing and impact of new technology, plans to reduce capital spend, operating efficiency, FY 2025 Guidance and additional considerations and including our expected cash position at the end of 2025 and our goal of being free cashflow positive in 2026, 2027 targets, and reduced capital spend, . Words such as "anticipate", "believe", "could", "estimate", "expect", "guidance", "intend", "may", "might", "outlook", "plan", "predict", "seek", "will", "would" and variations of such word and similar future or conditional expressions are intended to identify forward looking statements. Such statements are subject to risks and uncertainties that could cause actual results to differ materially from those discussed in the forward-looking statements including difficulties in launching our new technology, a change in economic uncertainty, changes in rate of pet acquisition, the launch of new competitive products, impact of tariffs, difficulties in construction of manufacturing facilities, and most prominently, the risks discussed under the heading “Risk Factors” in the Company's latest annual report on Form 10-K and quarterly reports on Form 10-Q filed with the Securities and Exchange Commission. Such forward-looking statements are made only as of the date of this presentation. Freshpet undertakes no obligation to publicly update or revise any forward- looking statement because of new information, future events or otherwise, except as otherwise required by law. If we do update one or more forward-looking statements, no inference should be made that we will make additional updates with respect to those or other forward-looking statements. NON-GAAP MEASURES Freshpet uses certain non-GAAP financial measures, including EBITDA, adjusted EBITDA, adjusted EBITDA as a % of net sales (adjusted EBITDA Margin), adjusted Gross Profit, adjusted Gross Profit as a % of net sales (adjusted Gross Margin), adjusted SG&A and adjusted SG&A as a % of net sales. These non-GAAP financial measures should be considered as supplements to GAAP reported measures, should not be considered replacements for, or superior to, GAAP measures and may not be comparable to similarly named measures used by other companies. Freshpet defines EBITDA as net income (loss) plus interest expense, income tax expense and depreciation and amortization expense, and adjusted EBITDA as EBITDA plus net income (loss) on equity method investment, non-cash share-based compensation, fees related to equity offerings of our common stock, implementation and other costs associated with the implementation of an ERP system, and other expenses, including loss on disposal of equipment, COVID-19 expenses and organization changes designed to support long-term growth objectives. Freshpet defines adjusted Gross Profit as gross profit before depreciation expense, COVID-19 expense and non-cash share-based compensation, and adjusted SG&A as SG&A expenses before depreciation and amortization expense, non-cash share-based compensation, gain (loss) on disposal of equipment, fees related to equity offerings of our common stock, implementation and other costs associated with the implementation of an ERP system, COVID-19 expense and organization changes designed to support long term growth objectives. Management believes that the non-GAAP financial measures are meaningful to investors because they provide a view of the Company with respect to ongoing operating results. Non-GAAP financial measures are shown as supplemental disclosures in this presentation because they are widely used by the investment community for analysis and comparative evaluation. They also provide additional metrics to evaluate the Company’s operations and, when considered with both the Company’s GAAP results and the reconciliation to the most comparable GAAP measures, provide a more complete understanding of the Company’s business than could be obtained absent this disclosure. adjusted EBITDA is also an important component of internal budgeting and setting management compensation. The non-GAAP measures are not and should not be considered an alternative to the most comparable GAAP measures or any other figure calculated in accordance with GAAP, or as an indicator of operating performance. The Company’s calculation of the non-GAAP financial measures may differ from methods used by other companies. Management believes that the non-GAAP measures are important to an understanding of the Company’s overall operating results in the periods presented. The non-GAAP financial measures are not recognized in accordance with GAAP and should not be viewed as an alternative to GAAP measures of performance. Certain of these measures represent the Company's guidance for fiscal year 2024. The Company is unable to reconcile these forward-looking non-GAAP financial measures to the most directly comparable GAAP measures without unreasonable efforts because the Company is currently unable to predict with a reasonable degree of certainty the type and impact of certain items, including the timing of and amount of costs of goods sold and selling, general and administrative expenses, that would be expected to impact GAAP measures for these periods but would not impact the non-GAAP measures. The unavailable information could significantly impact our financial results. These items are not within the Company's control and may vary greatly between periods. Based on the foregoing, the Company believes that providing estimates of the amounts that would be required to reconcile these forecasted non-GAAP measures to forecasted GAAP measures would imply a degree of precision that would be confusing or misleading to investors for the reasons identified above.
Q2 2025 Earnings Presentation 3 Freshpet strengthens the bond between people and our pets so that we both live longer, healthier and happier lives while being kind to the planet.
Q2 2025 Earnings Presentation 4 Highlights
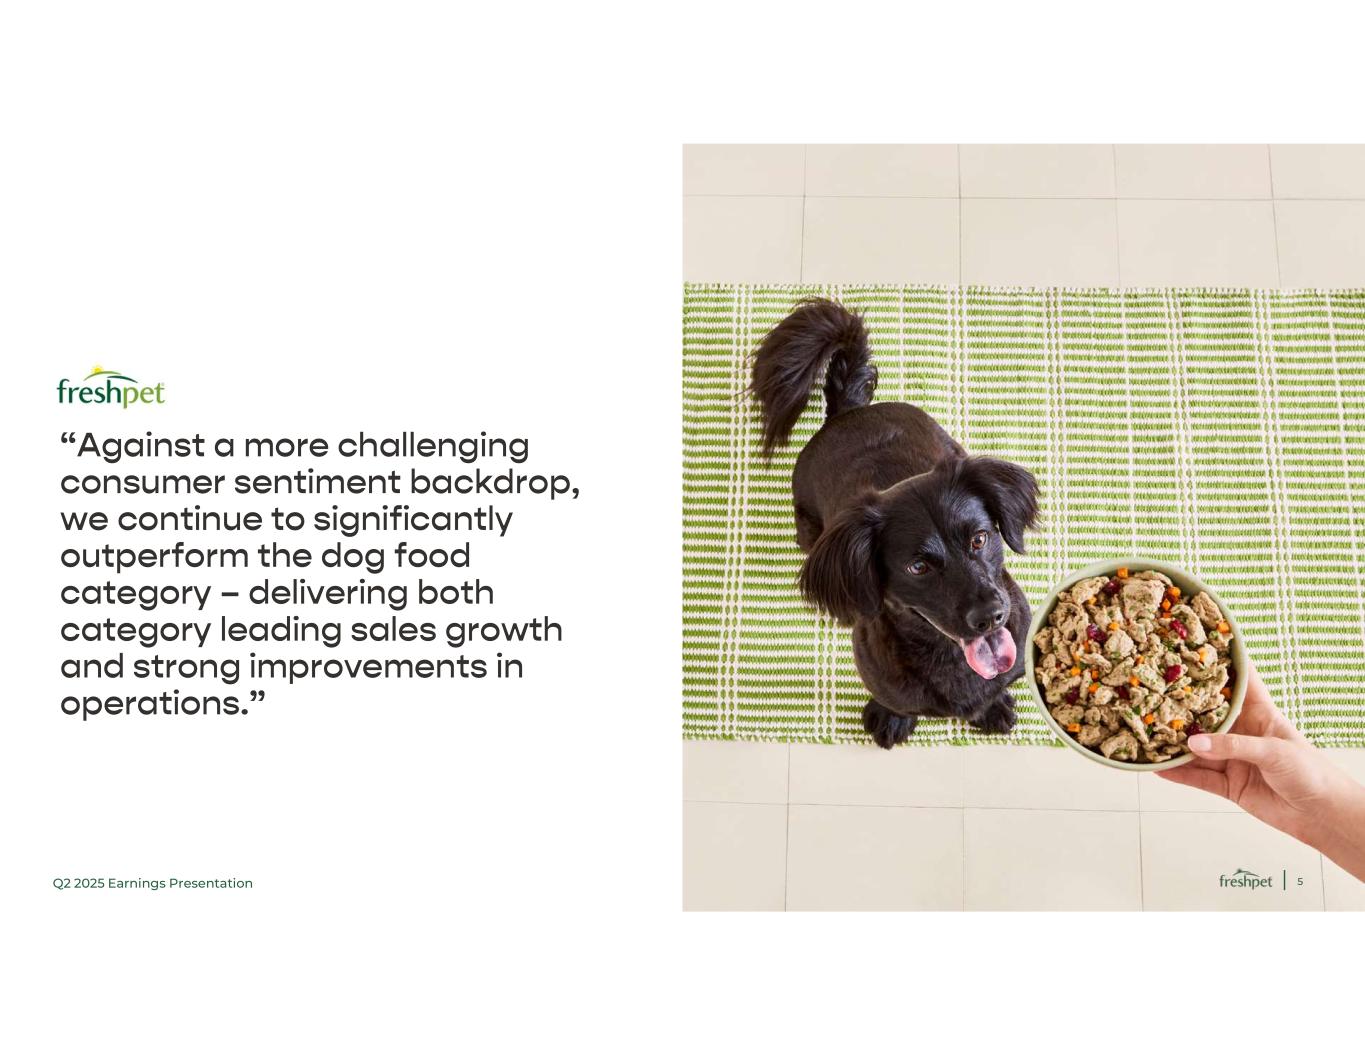
Q2 2025 Earnings Presentation 5 “Against a more challenging consumer sentiment backdrop, we continue to significantly outperform the dog food category – delivering both category leading sales growth and strong improvements in operations.”
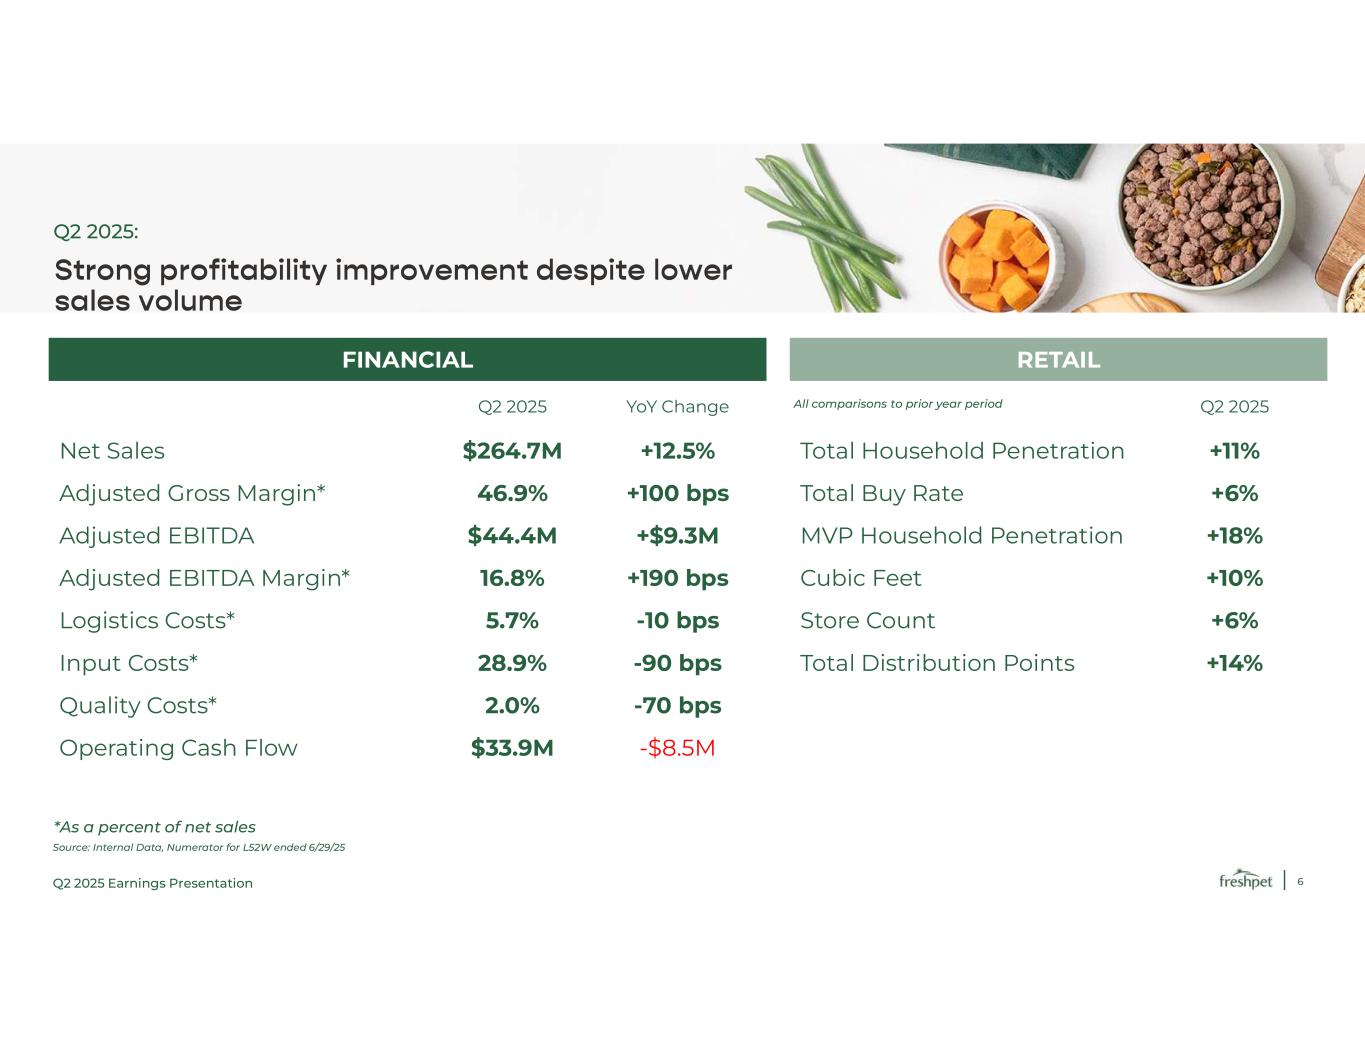
Q2 2025 Earnings Presentation 6 Source: Internal Data, Numerator for L52W ended 6/29/25 Strong profitability improvement despite lower sales volume Q2 2025: RETAIL FINANCIAL Q2 2025 YoY Change Q2 2025 +11% Total Household Penetration +12.5% $264.7M Net Sales +6% Total Buy Rate +100 bps 46.9% Adjusted Gross Margin* +18% MVP Household Penetration +$9.3M $44.4M Adjusted EBITDA +10% Cubic Feet +190 bps 16.8% Adjusted EBITDA Margin* +6% Store Count -10 bps 5.7% Logistics Costs* +14% Total Distribution Points -90 bps 28.9% Input Costs* -70 bps 2.0% Quality Costs* -$8.5M $33.9M Operating Cash Flow *As a percent of net sales All comparisons to prior year period
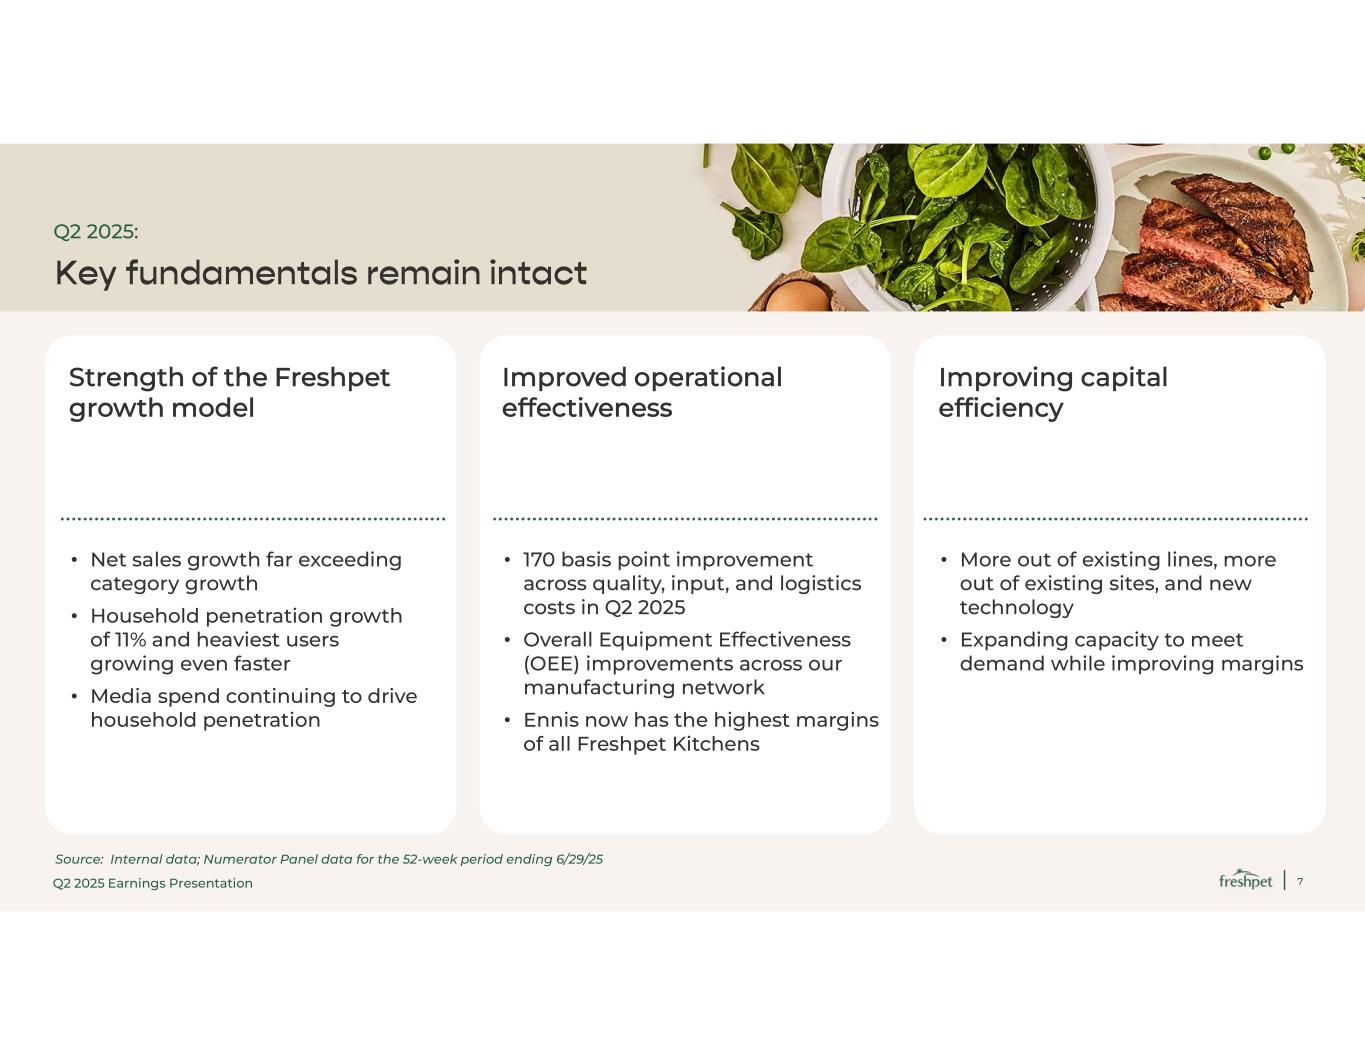
Q2 2025 Earnings Presentation 7 Key fundamentals remain intact Q2 2025: • Net sales growth far exceeding category growth • Household penetration growth of 11% and heaviest users growing even faster • Media spend continuing to drive household penetration • 170 basis point improvement across quality, input, and logistics costs in Q2 2025 • Overall Equipment Effectiveness (OEE) improvements across our manufacturing network • Ennis now has the highest margins of all Freshpet Kitchens • More out of existing lines, more out of existing sites, and new technology • Expanding capacity to meet demand while improving margins Strength of the Freshpet growth model Improved operational effectiveness Improving capital efficiency Source: Internal data; Numerator Panel data for the 52-week period ending 6/29/25
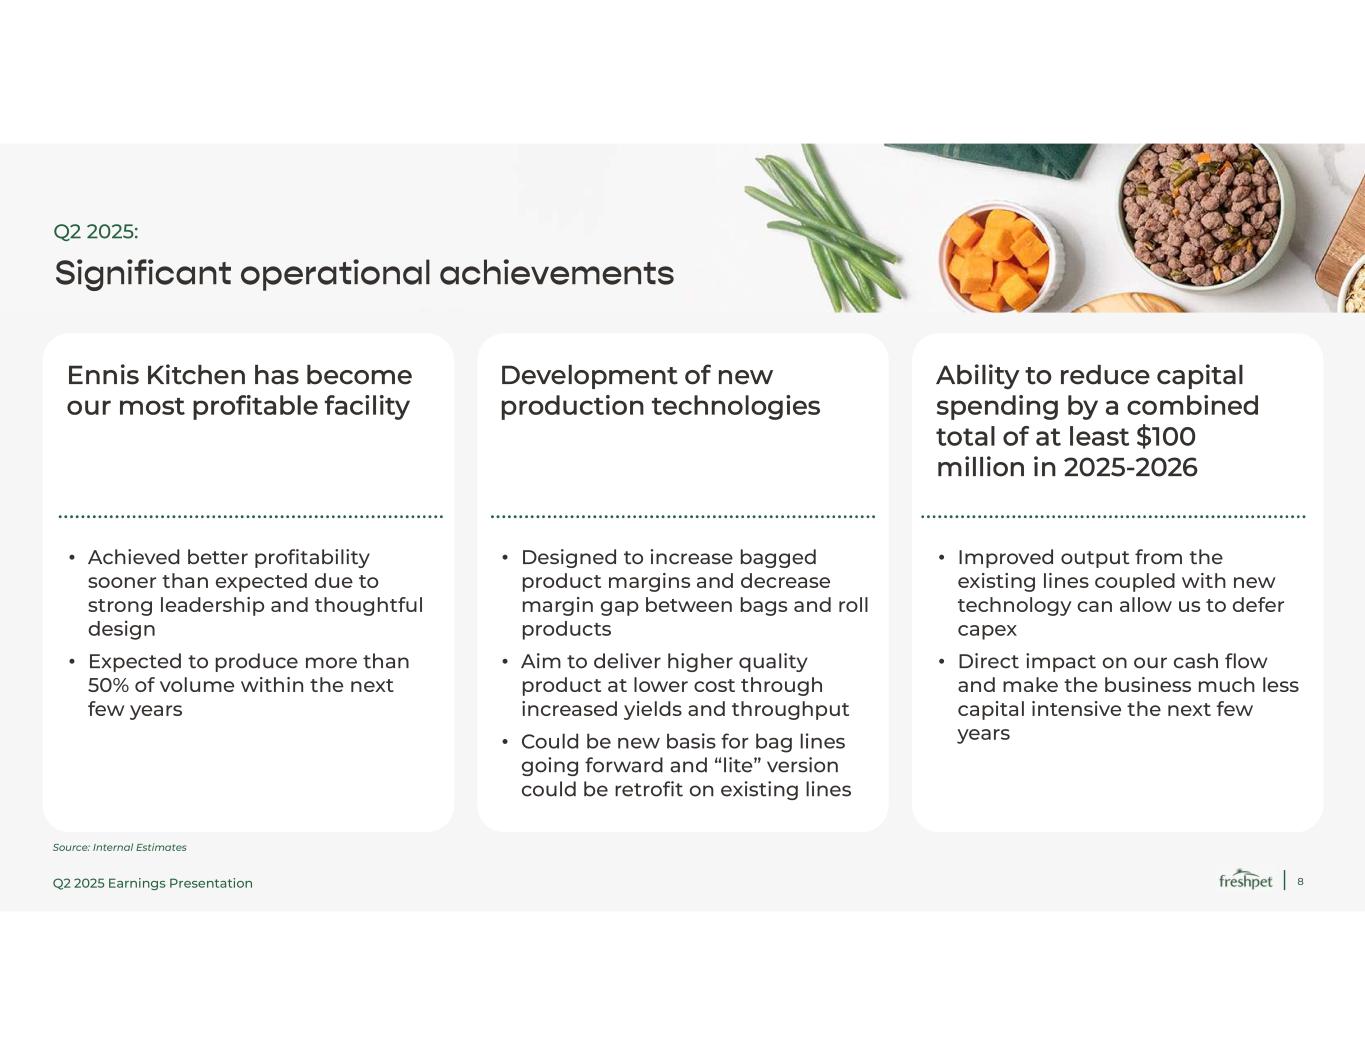
Q2 2025 Earnings Presentation 8 Source: Internal Estimates Significant operational achievements Q2 2025: • Achieved better profitability sooner than expected due to strong leadership and thoughtful design • Expected to produce more than 50% of volume within the next few years • Designed to increase bagged product margins and decrease margin gap between bags and roll products • Aim to deliver higher quality product at lower cost through increased yields and throughput • Could be new basis for bag lines going forward and “lite” version could be retrofit on existing lines • Improved output from the existing lines coupled with new technology can allow us to defer capex • Direct impact on our cash flow and make the business much less capital intensive the next few years Ennis Kitchen has become our most profitable facility Development of new production technologies Ability to reduce capital spending by a combined total of at least $100 million in 2025-2026
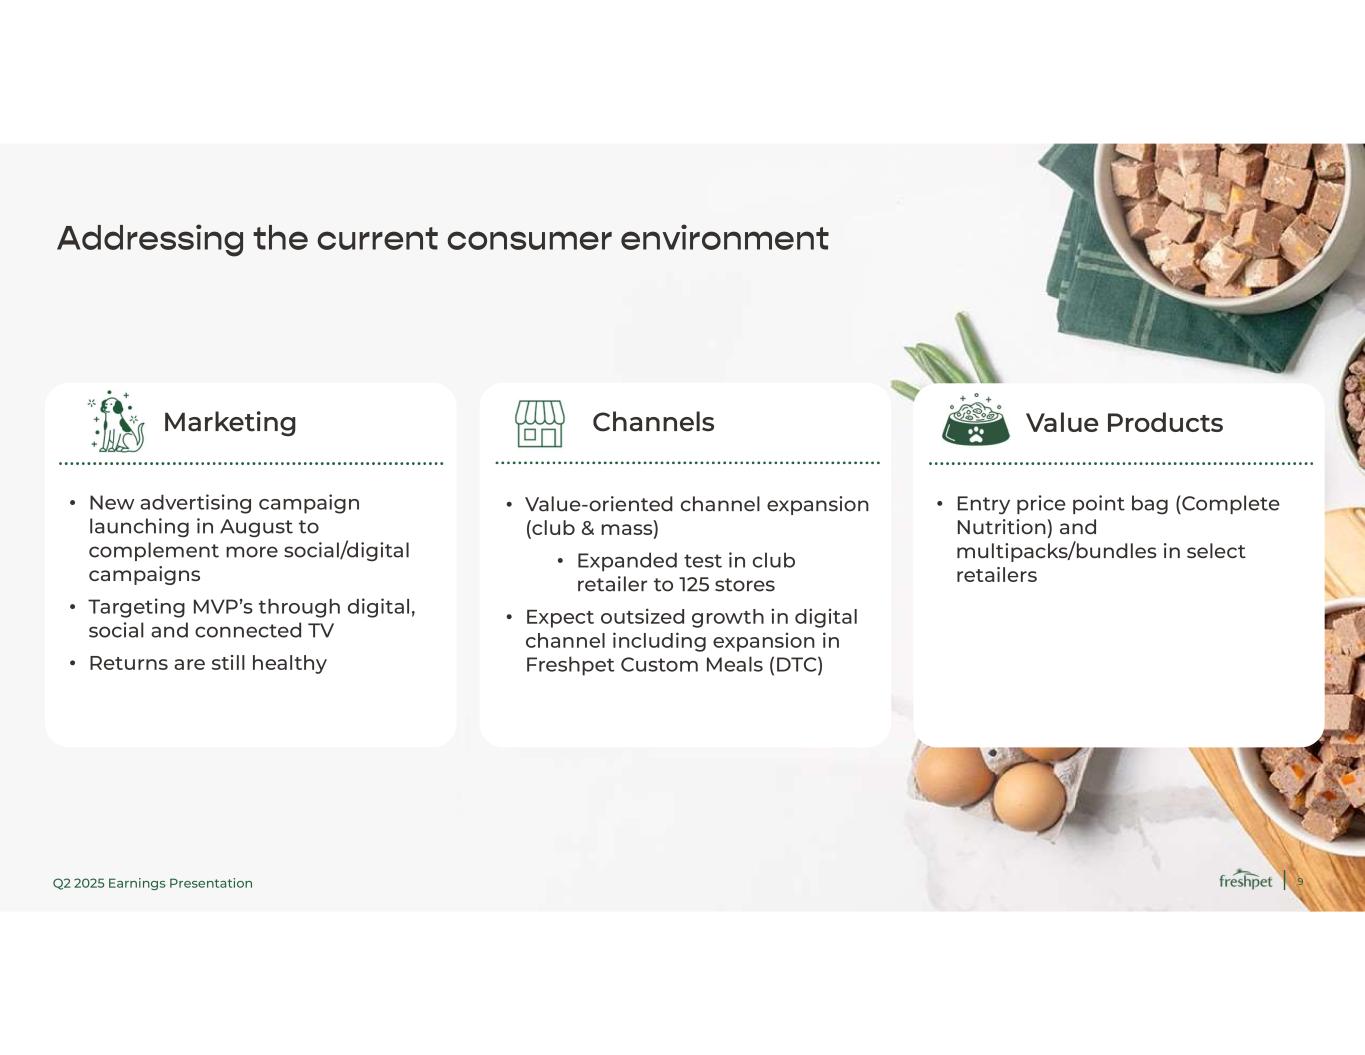
Q2 2025 Earnings Presentation 9 Addressing the current consumer environment • Entry price point bag (Complete Nutrition) and multipacks/bundles in select retailers • New advertising campaign launching in August to complement more social/digital campaigns • Targeting MVP’s through digital, social and connected TV • Returns are still healthy • Value-oriented channel expansion (club & mass) • Expanded test in club retailer to 125 stores • Expect outsized growth in digital channel including expansion in Freshpet Custom Meals (DTC) Value Products Marketing Channels
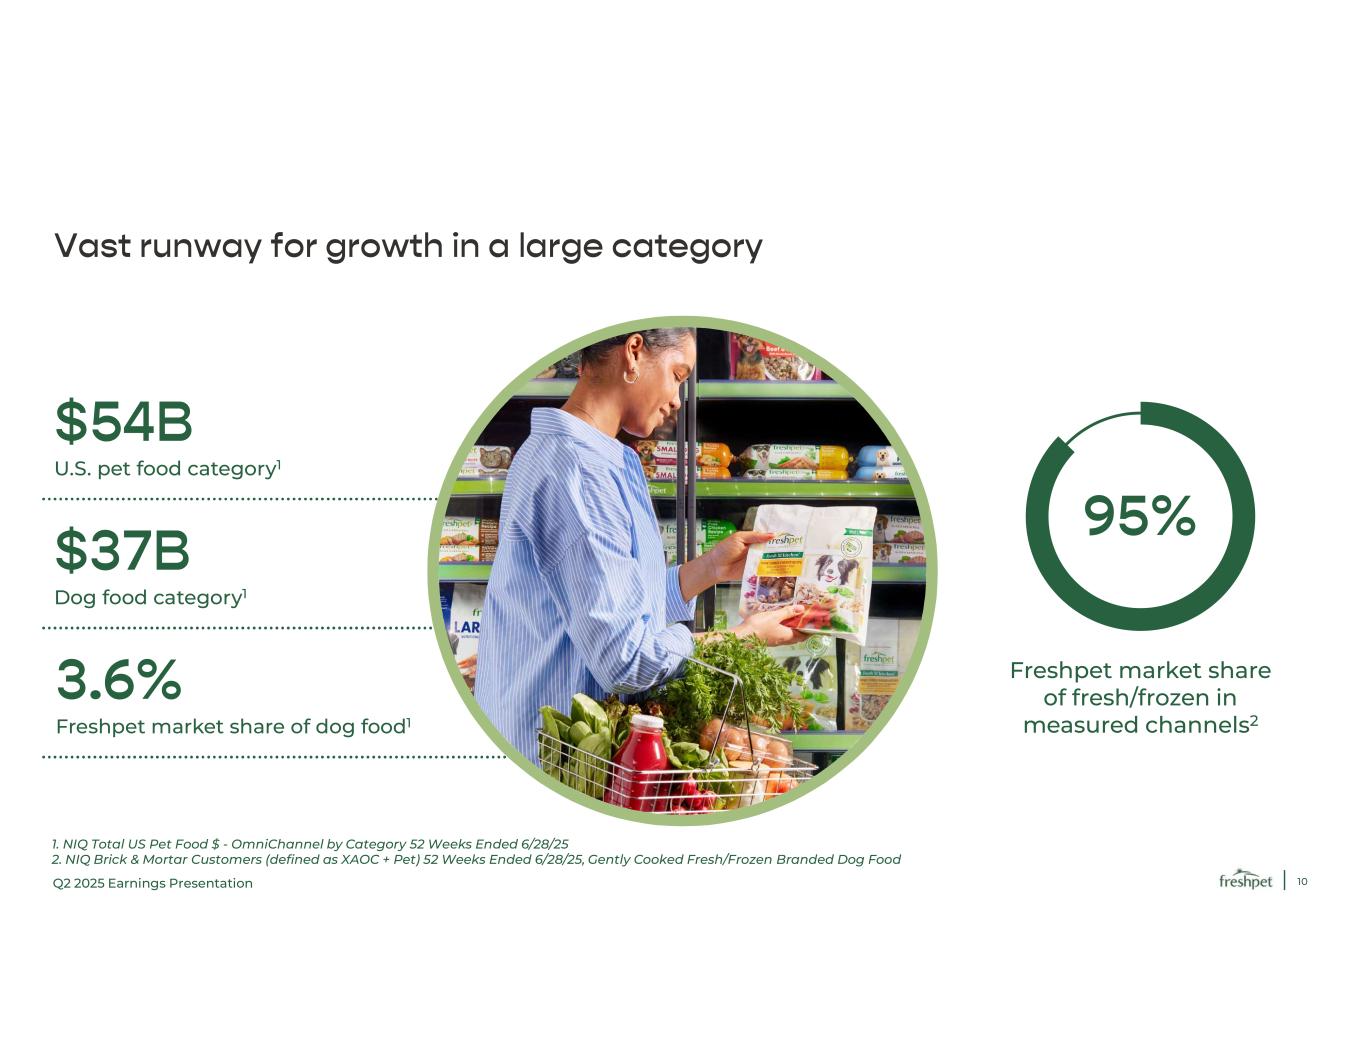
Q2 2025 Earnings Presentation 10 Vast runway for growth in a large category 1. NIQ Total US Pet Food $ - OmniChannel by Category 52 Weeks Ended 6/28/25 2. NIQ Brick & Mortar Customers (defined as XAOC + Pet) 52 Weeks Ended 6/28/25, Gently Cooked Fresh/Frozen Branded Dog Food $54B U.S. pet food category1 $37B Dog food category1 3.6% Freshpet market share of dog food1 Freshpet market share of fresh/frozen in measured channels2 95%
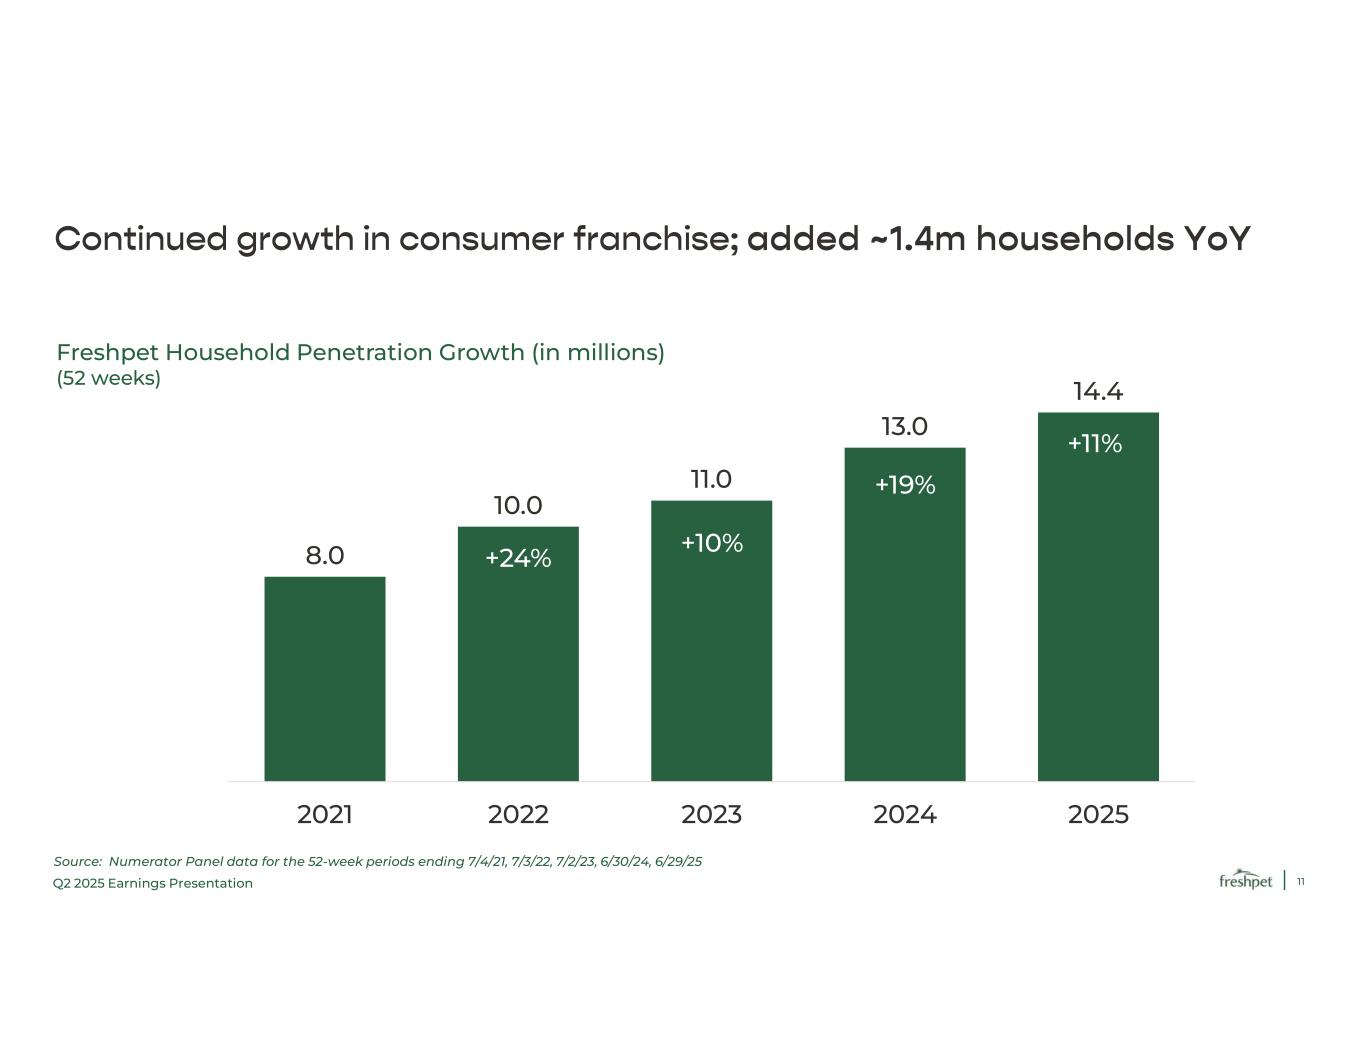
Q2 2025 Earnings Presentation 11 8.0 10.0 11.0 13.0 14.4 2021 2022 2023 2024 2025 +19% +11% +10% +24% Continued growth in consumer franchise; added ~1.4m households YoY Source: Numerator Panel data for the 52-week periods ending 7/4/21, 7/3/22, 7/2/23, 6/30/24, 6/29/25 Freshpet Household Penetration Growth (in millions) (52 weeks)
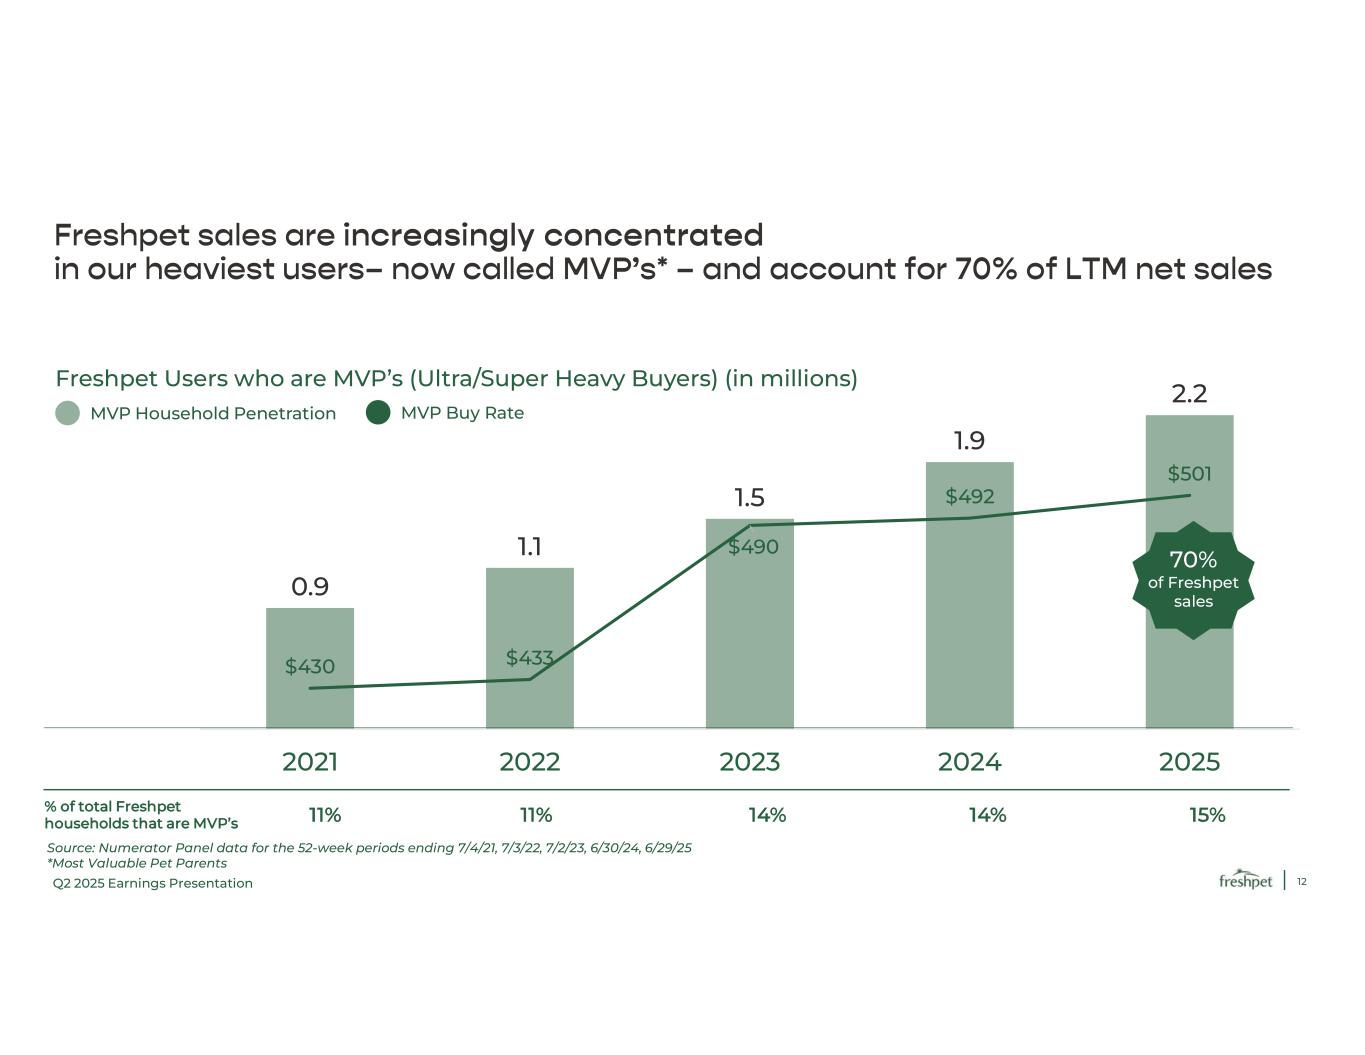
Q2 2025 Earnings Presentation 12 0.9 1.1 1.5 1.9 2.2 $430 $433 $490 $492 $501 $415 $435 $455 $475 $495 $515 $535 0.0 0.5 1.0 1.5 2.0 2.5 2021 2022 2023 2024 2025 Freshpet sales are increasingly concentrated in our heaviest users– now called MVP’s* – and account for 70% of LTM net sales Source: Numerator Panel data for the 52-week periods ending 7/4/21, 7/3/22, 7/2/23, 6/30/24, 6/29/25 *Most Valuable Pet Parents 15% 14% 14% 11% 11% % of total Freshpet households that are MVP’s Freshpet Users who are MVP’s (Ultra/Super Heavy Buyers) (in millions) MVP Household Penetration MVP Buy Rate 70% of Freshpet sales
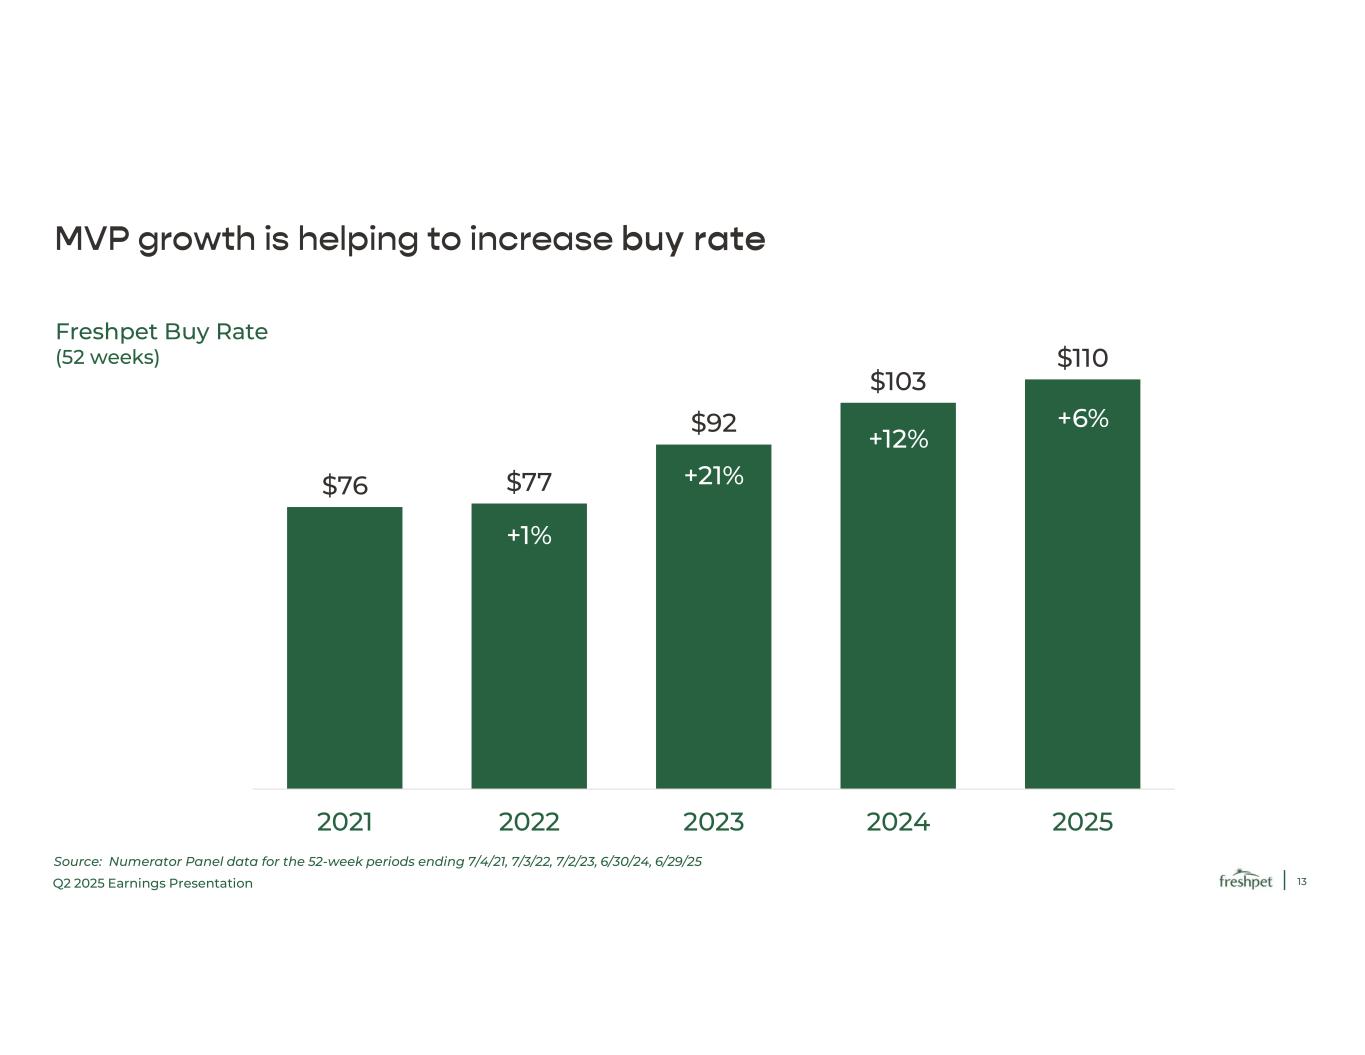
Q2 2025 Earnings Presentation 13 $76 $77 $92 $103 $110 2021 2022 2023 2024 2025 MVP growth is helping to increase buy rate Freshpet Buy Rate (52 weeks) +6% +12% +21% +1% Source: Numerator Panel data for the 52-week periods ending 7/4/21, 7/3/22, 7/2/23, 6/30/24, 6/29/25
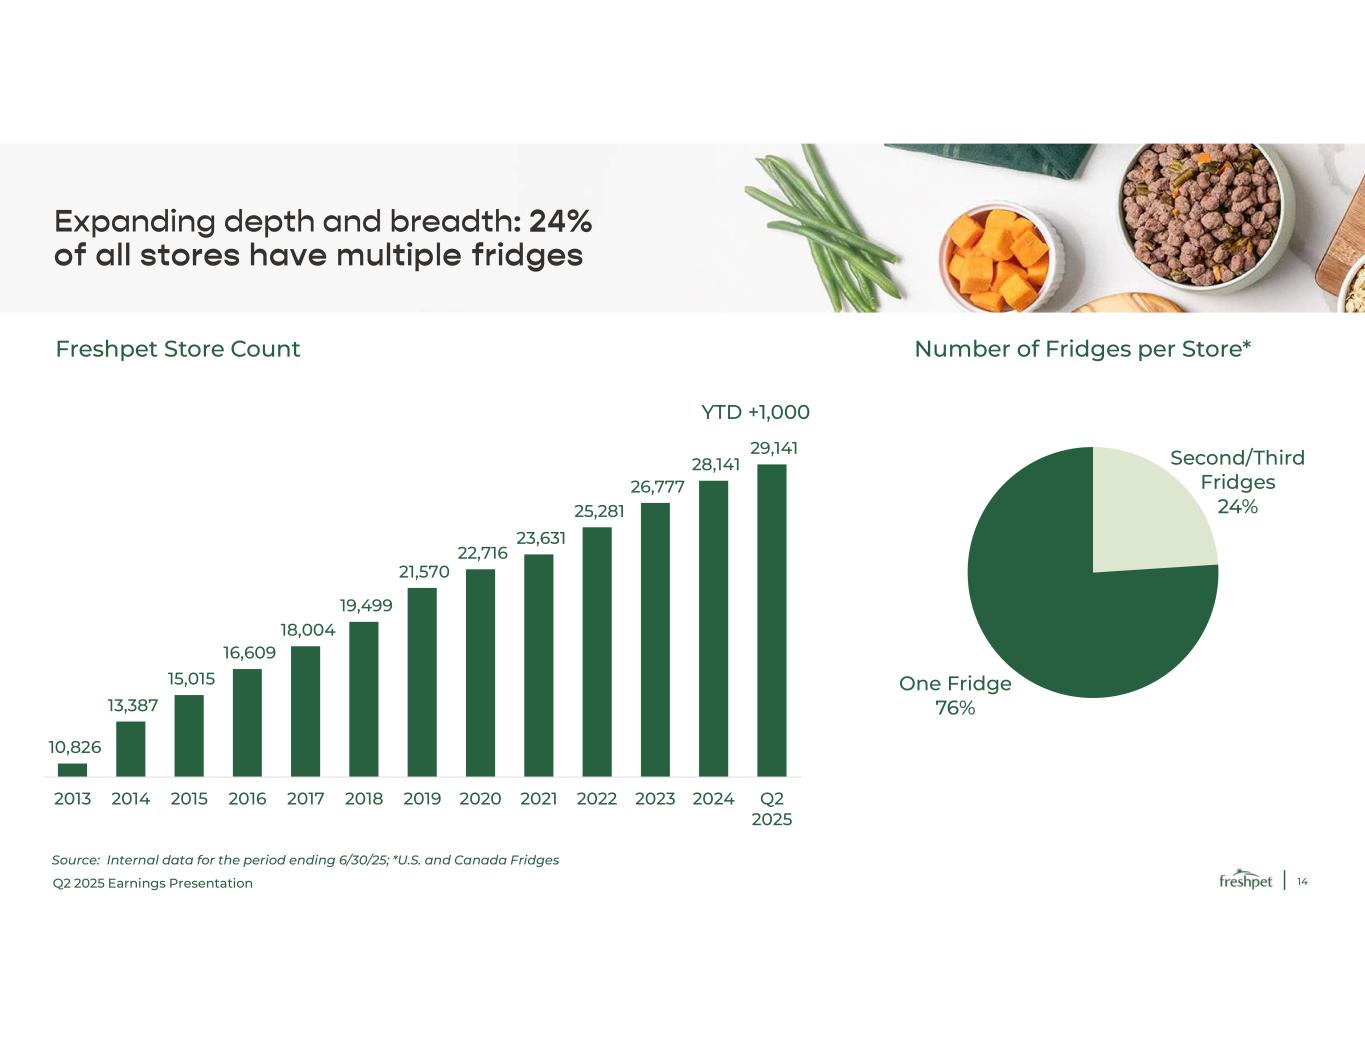
Q2 2025 Earnings Presentation 14 10,826 13,387 15,015 16,609 18,004 19,499 21,570 22,716 23,631 25,281 26,777 28,141 29,141 2013 2014 2015 2016 2017 2018 2019 2020 2021 2022 2023 2024 Q2 2025 Expanding depth and breadth: 24% of all stores have multiple fridges Source: Internal data for the period ending 6/30/25; *U.S. and Canada Fridges Freshpet Store Count Number of Fridges per Store* Second/Third Fridges 24% One Fridge 76% YTD +1,000
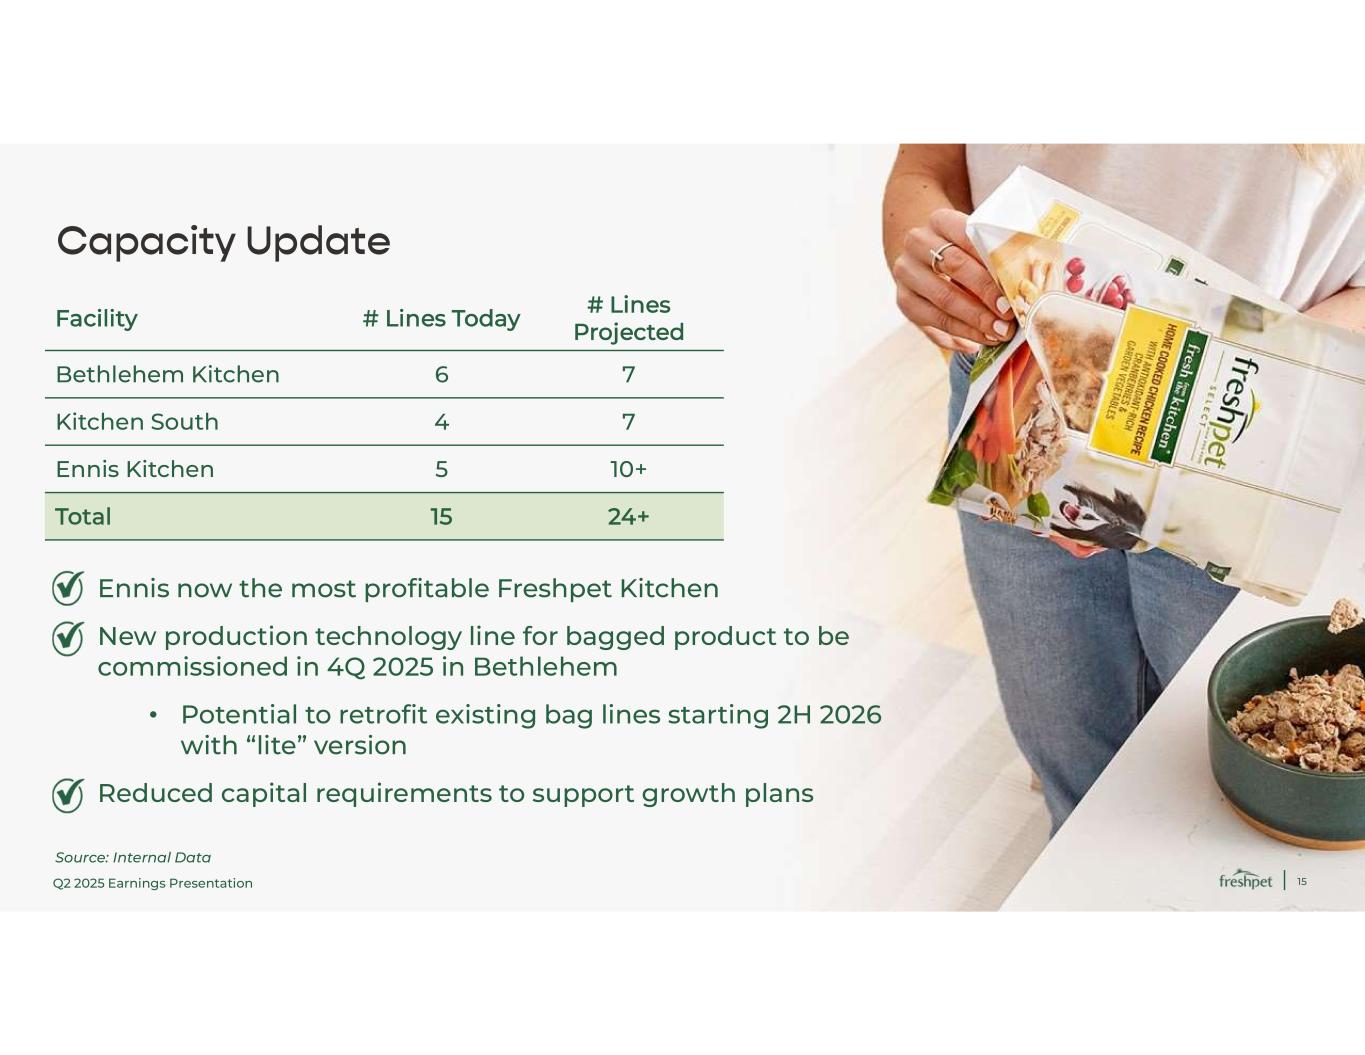
Q2 2025 Earnings Presentation 15 Capacity Update Source: Internal Data # Lines Projected # Lines Today Facility 7 6 Bethlehem Kitchen 7 4 Kitchen South 10+ 5 Ennis Kitchen 24+ 15 Total Ennis now the most profitable Freshpet Kitchen New production technology line for bagged product to be commissioned in 4Q 2025 in Bethlehem • Potential to retrofit existing bag lines starting 2H 2026 with “lite” version Reduced capital requirements to support growth plans
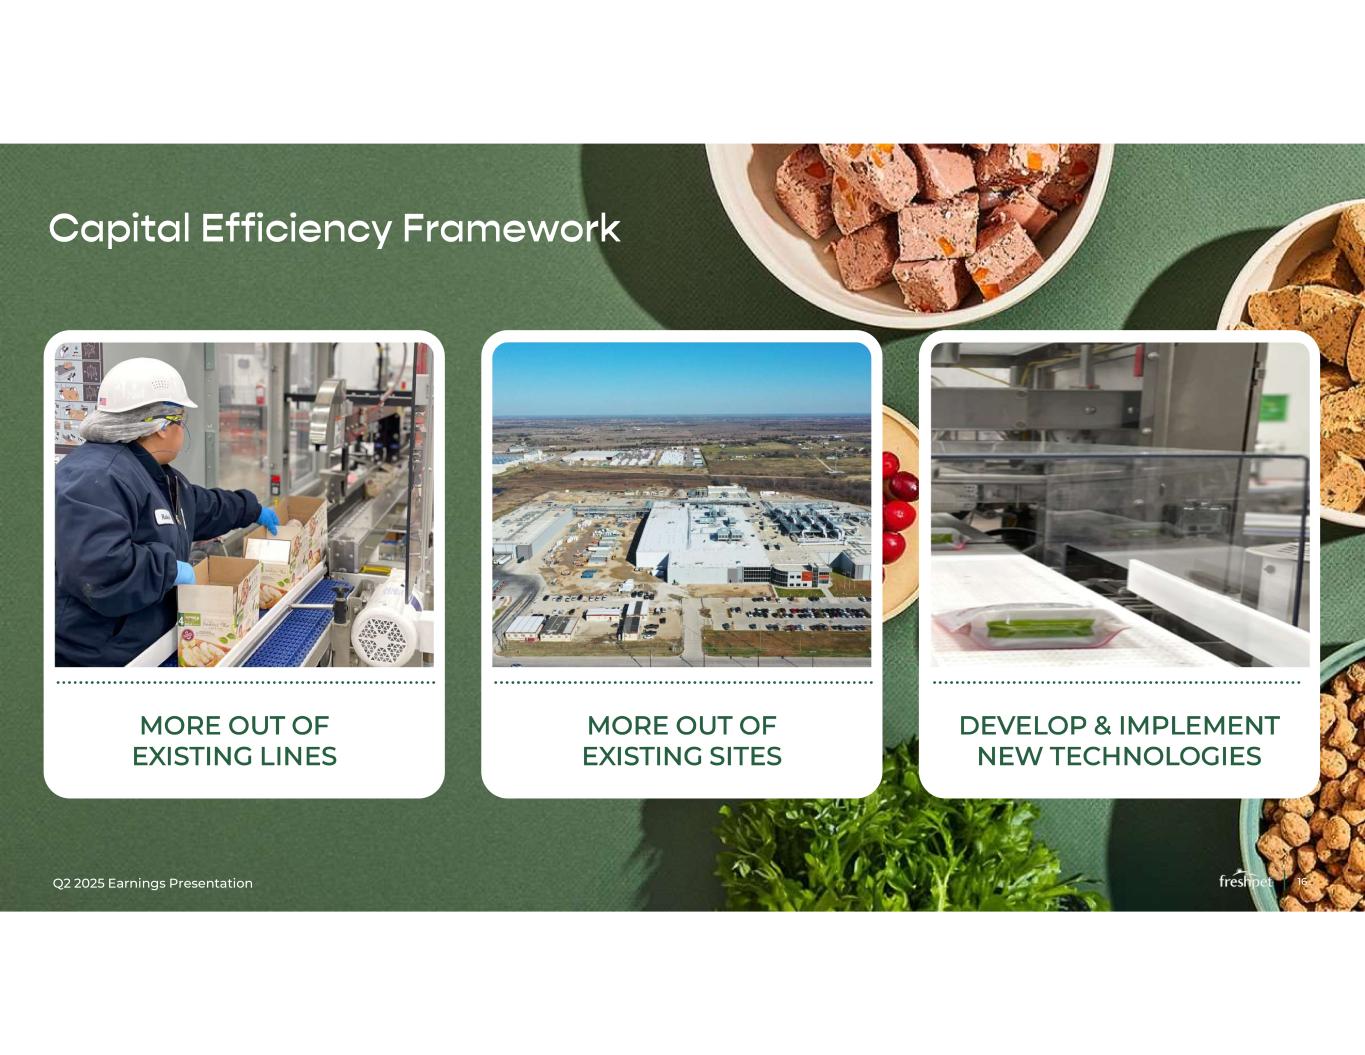
Q2 2025 Earnings Presentation 16 Capital Efficiency Framework MORE OUT OF EXISTING LINES MORE OUT OF EXISTING SITES DEVELOP & IMPLEMENT NEW TECHNOLOGIES
Q2 2025 Earnings Presentation 17 Q2 2025 Results
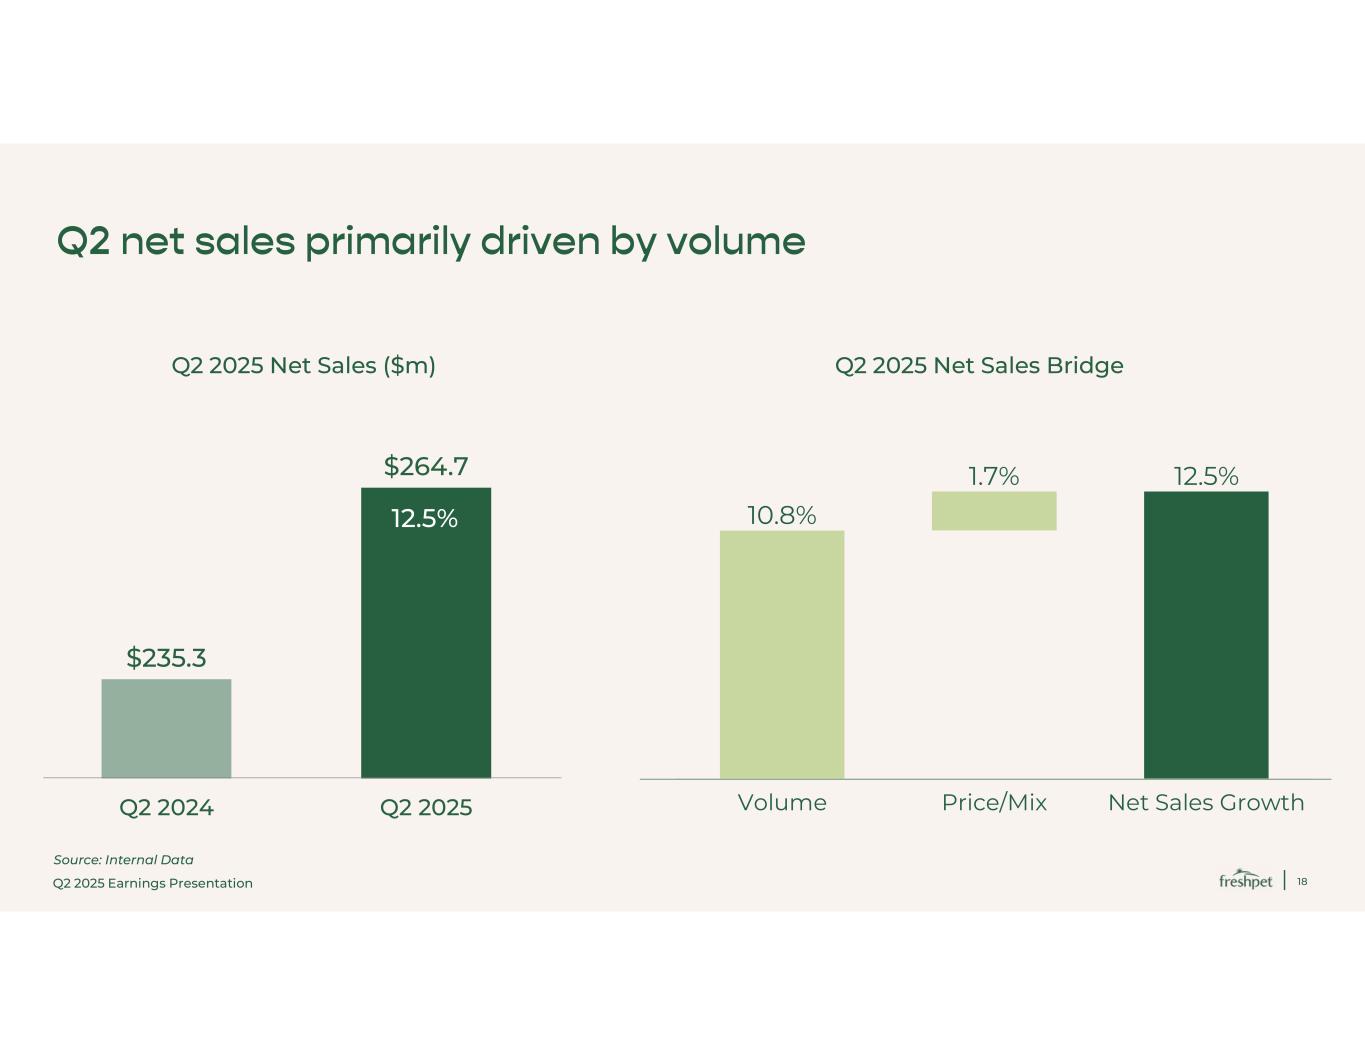
Q2 2025 Earnings Presentation 18 Q2 net sales primarily driven by volume $235.3 $264.7 Q2 2024 Q2 2025 12.5% Q2 2025 Net Sales ($m) Q2 2025 Net Sales Bridge Source: Internal Data 10.8% 1.7% 12.5% Volume Price/Mix Net Sales Growth
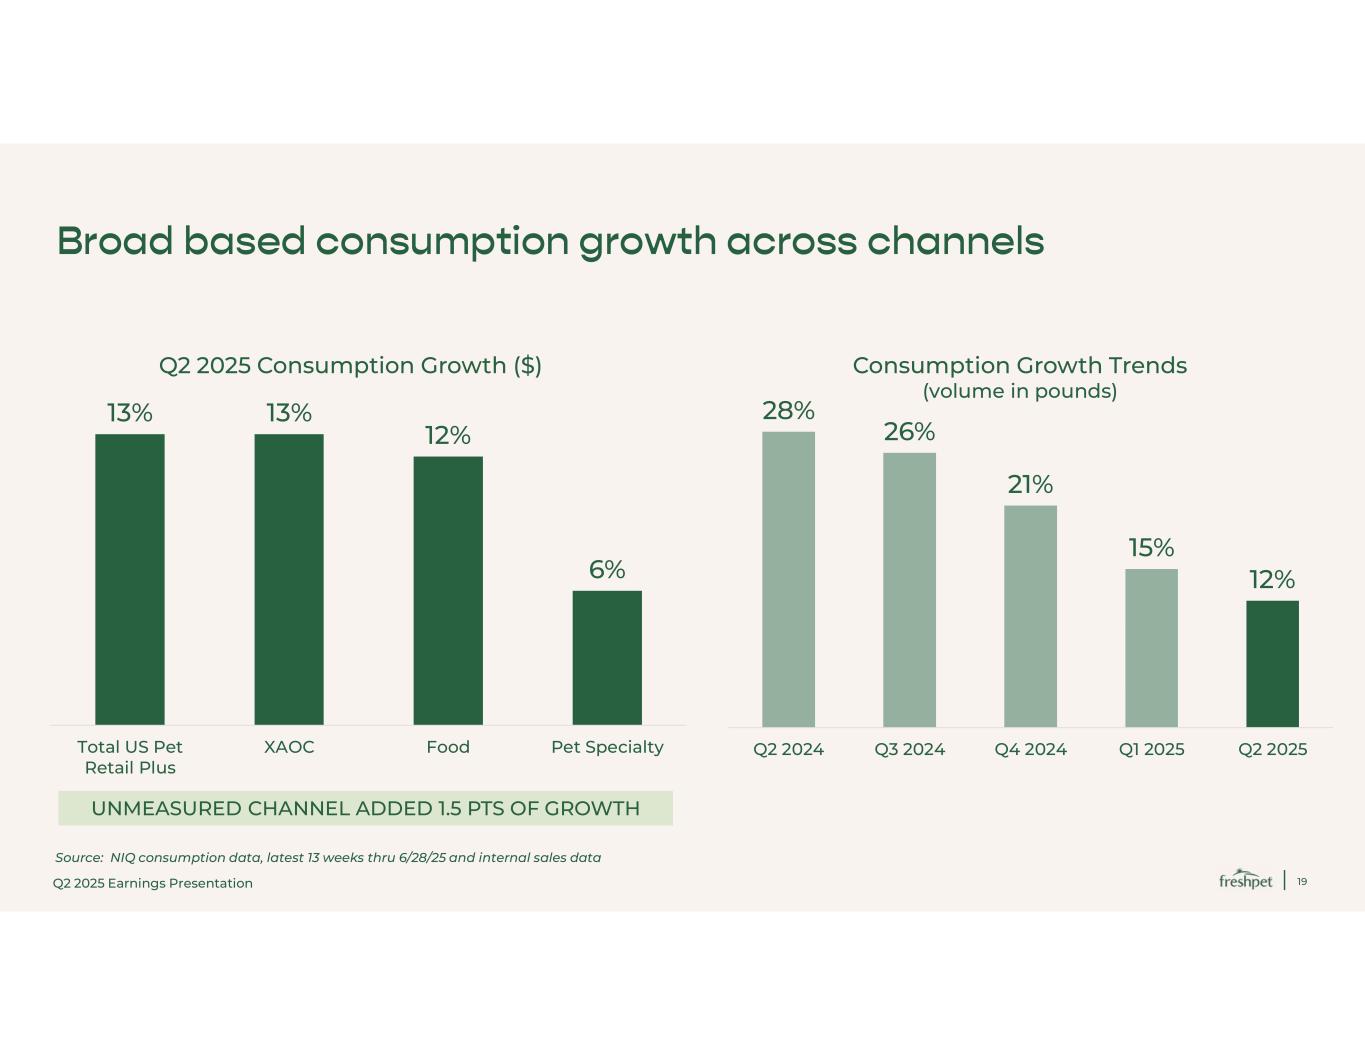
Q2 2025 Earnings Presentation 19 Broad based consumption growth across channels Source: NIQ consumption data, latest 13 weeks thru 6/28/25 and internal sales data Q2 2025 Consumption Growth ($) Consumption Growth Trends (volume in pounds) 13% 13% 12% 6% Total US Pet Retail Plus XAOC Food Pet Specialty 28% 26% 21% 15% 12% Q2 2024 Q3 2024 Q4 2024 Q1 2025 Q2 2025 UNMEASURED CHANNEL ADDED 1.5 PTS OF GROWTH
Q2 2025 Earnings Presentation 20 Q2 2025 delivered solid Adjusted Gross Margin and Adjusted EBITDA improvement despite less volume growth Q2 2025 Adj. Gross Margin % of net sales Q2 2025 Adj. EBITDA ($m) % of net sales 45.9% 46.9% Q2 2024 Q2 2025 $35.1 $44.4 Q2 2024 Q2 2025 14.9% 16.8% Net Income (Loss) ($1.7m) $16.4m Source: Internal Data Gross Margin (GAAP) 40.9% 39.9%
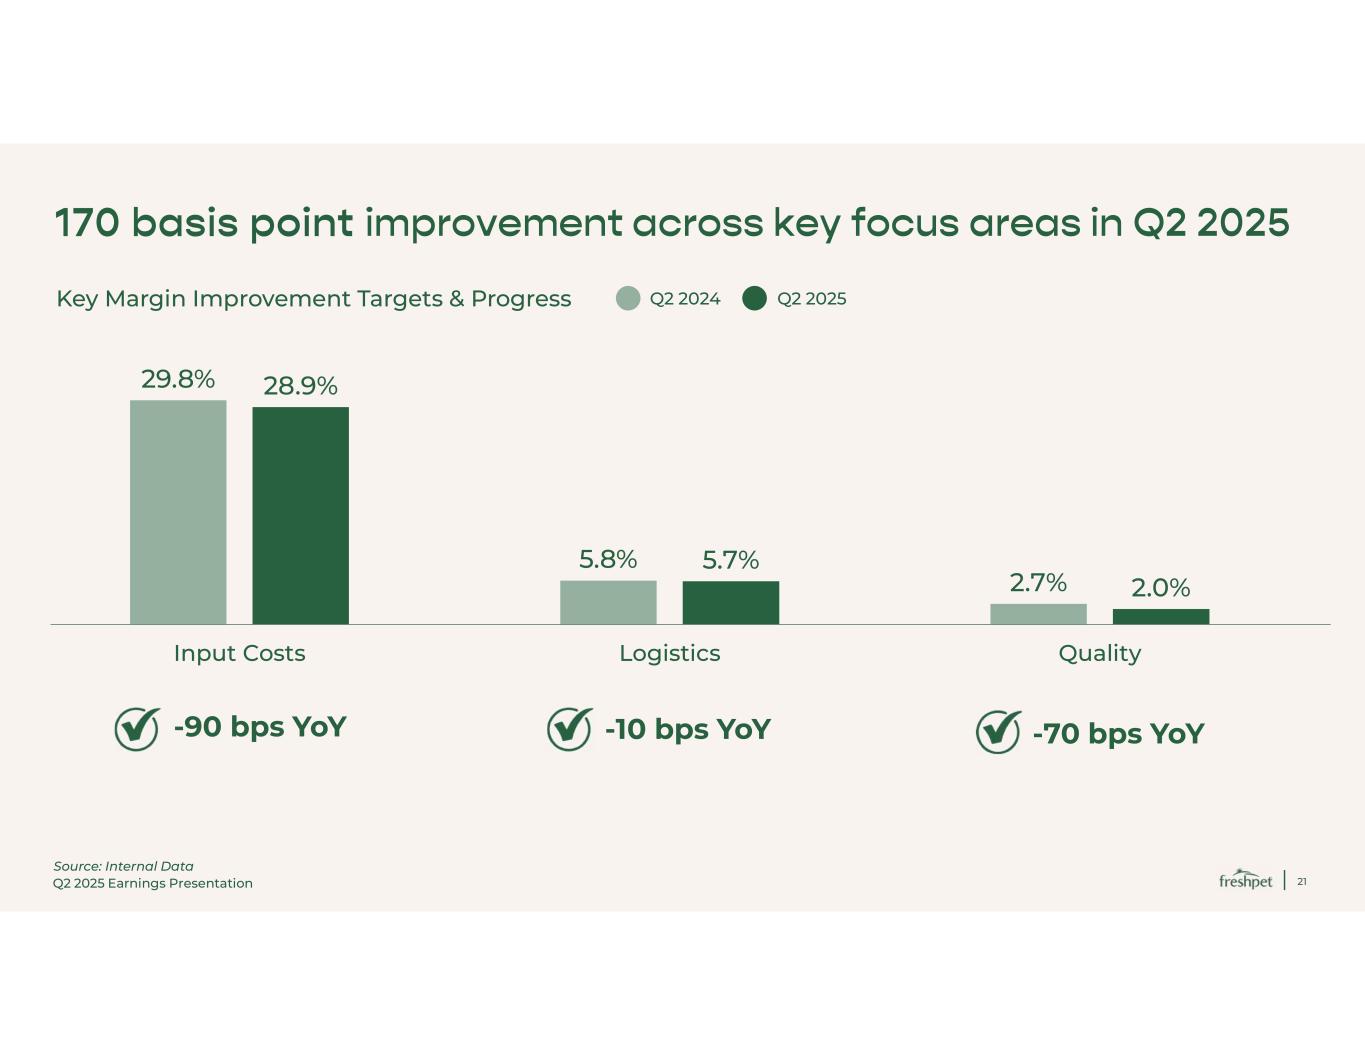
Q2 2025 Earnings Presentation 21 29.8% 5.8% 2.7% 28.9% 5.7% 2.0% Input Costs Logistics Quality 170 basis point improvement across key focus areas in Q2 2025 Key Margin Improvement Targets & Progress Q2 2024 Q2 2025 Source: Internal Data -10 bps YoY -70 bps YoY -90 bps YoY
Q2 2025 Earnings Presentation 22 Guidance
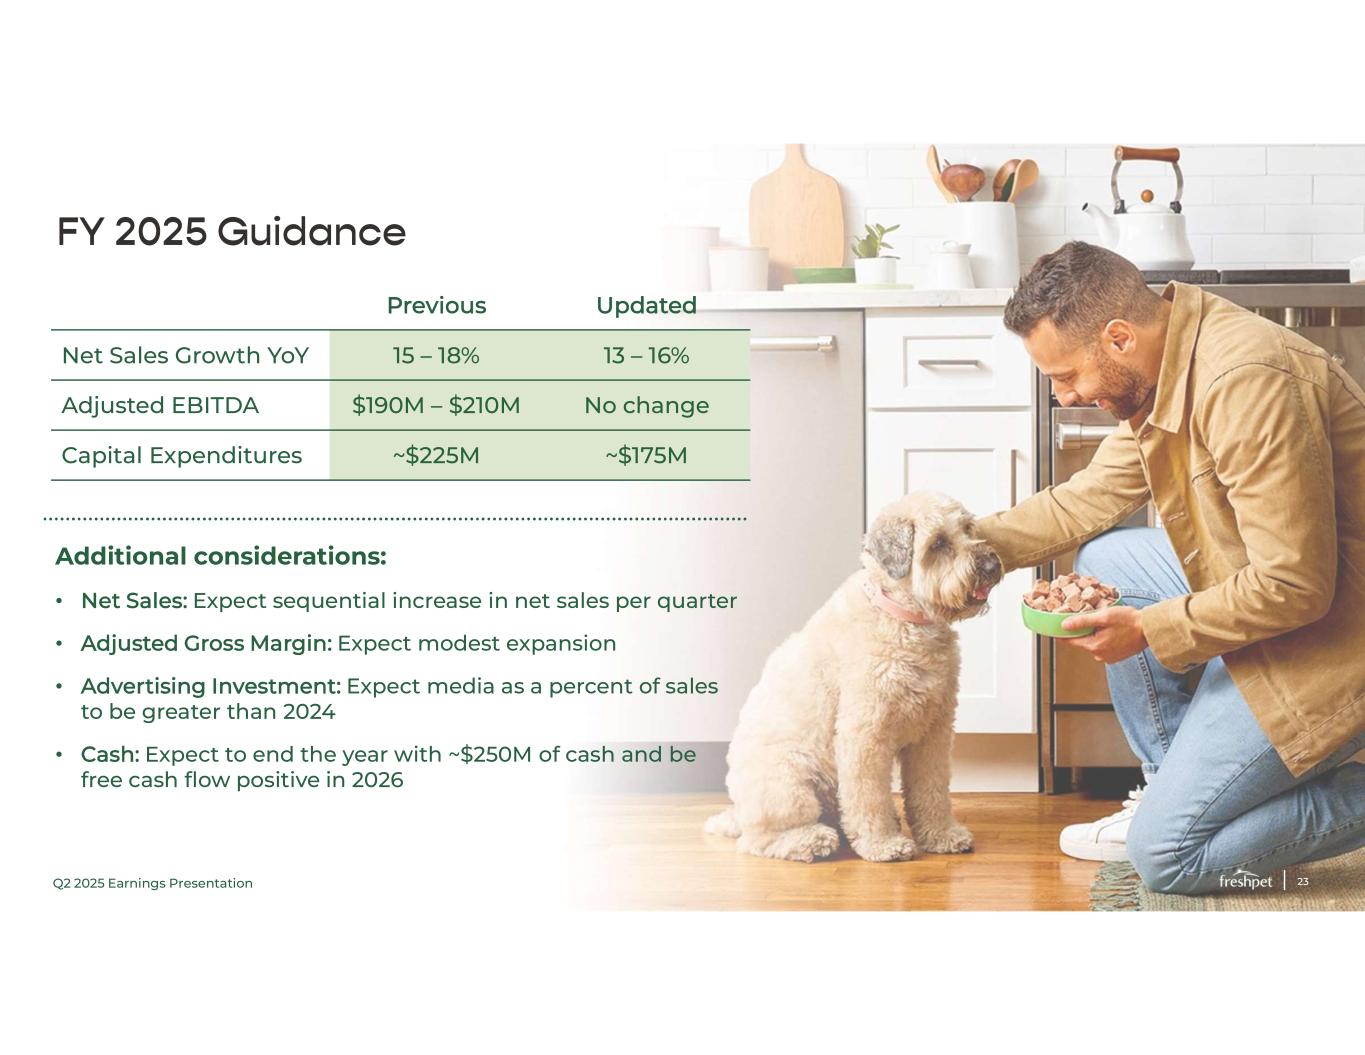
Q2 2025 Earnings Presentation 23 FY 2025 Guidance Additional considerations: • Net Sales: Expect sequential increase in net sales per quarter • Adjusted Gross Margin: Expect modest expansion • Advertising Investment: Expect media as a percent of sales to be greater than 2024 • Cash: Expect to end the year with ~$250M of cash and be free cash flow positive in 2026 Updated Previous 13 – 16% 15 – 18% Net Sales Growth YoY No change $190M – $210M Adjusted EBITDA ~$175M ~$225M Capital Expenditures
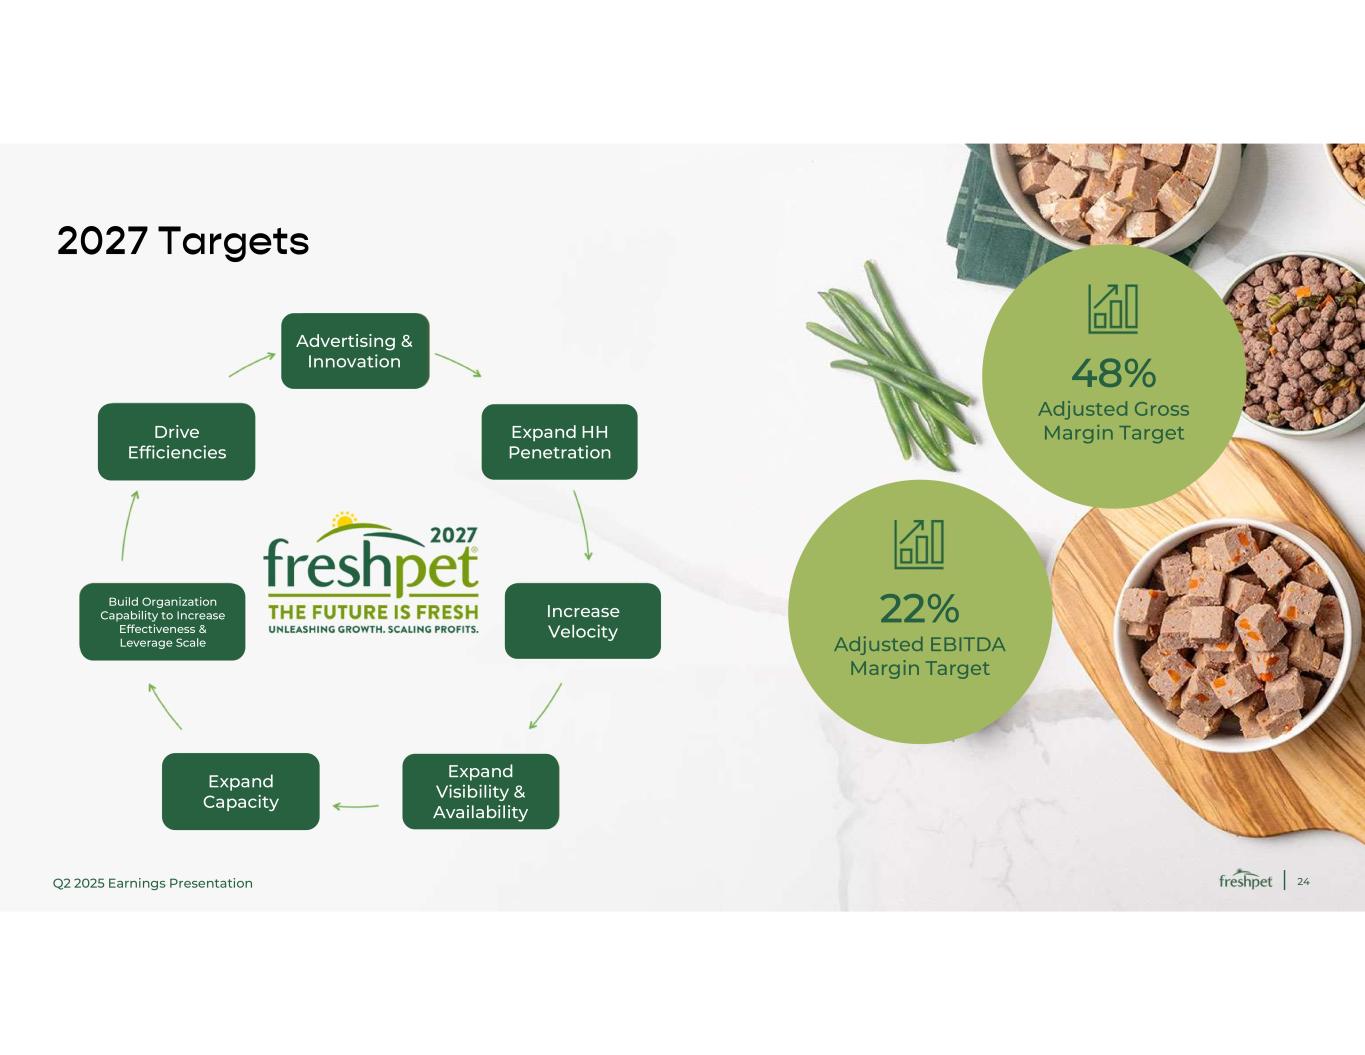
Q2 2025 EARNINGS PRESENTATION 24 2027 Targets Expand HH Penetration Increase Velocity Advertising & Innovation Expand Visibility & Availability Drive Efficiencies Build Organization Capability to Increase Effectiveness & Leverage Scale Expand Capacity 22% Adjusted EBITDA Margin Target 48% Adjusted Gross Margin Target Q2 2025 Earnings Presentation 24

Q2 2025 EARNINGS PRESENTATION 25 Capital Spending, Cash Flow & Liquidity
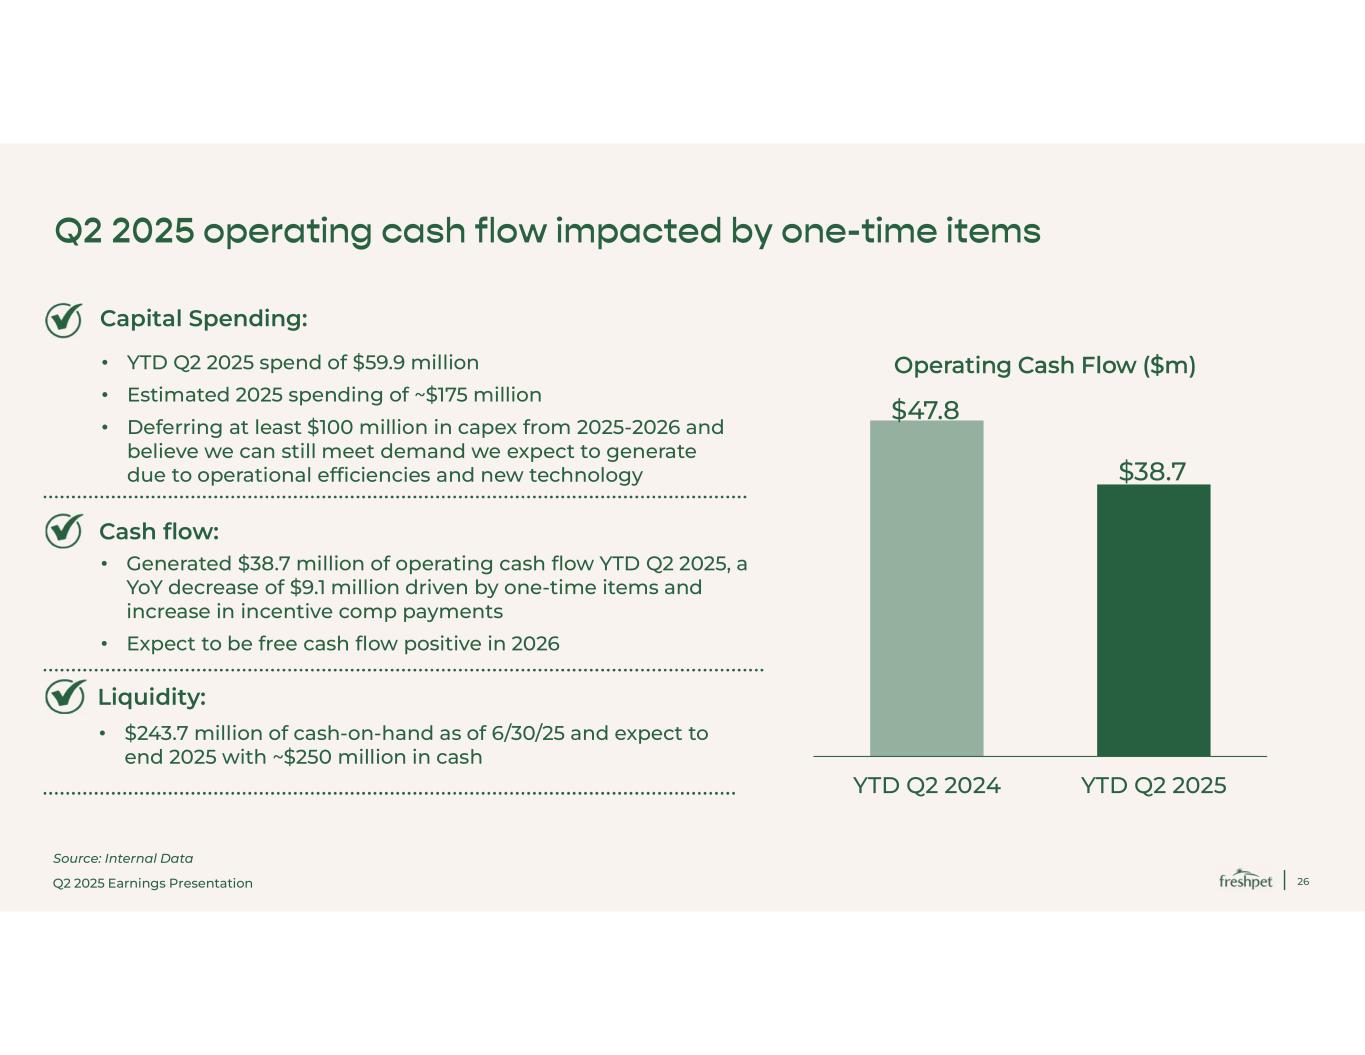
Q2 2025 Earnings Presentation 26 Q2 2025 operating cash flow impacted by one-time items Capital Spending: • YTD Q2 2025 spend of $59.9 million • Estimated 2025 spending of ~$175 million • Deferring at least $100 million in capex from 2025-2026 and believe we can still meet demand we expect to generate due to operational efficiencies and new technology Cash flow: • Generated $38.7 million of operating cash flow YTD Q2 2025, a YoY decrease of $9.1 million driven by one-time items and increase in incentive comp payments • Expect to be free cash flow positive in 2026 Liquidity: • $243.7 million of cash-on-hand as of 6/30/25 and expect to end 2025 with ~$250 million in cash Operating Cash Flow ($m) $47.8 $38.7 YTD Q2 2024 YTD Q2 2025 Source: Internal Data
Q2 2025 Earnings Presentation 27 Appendix
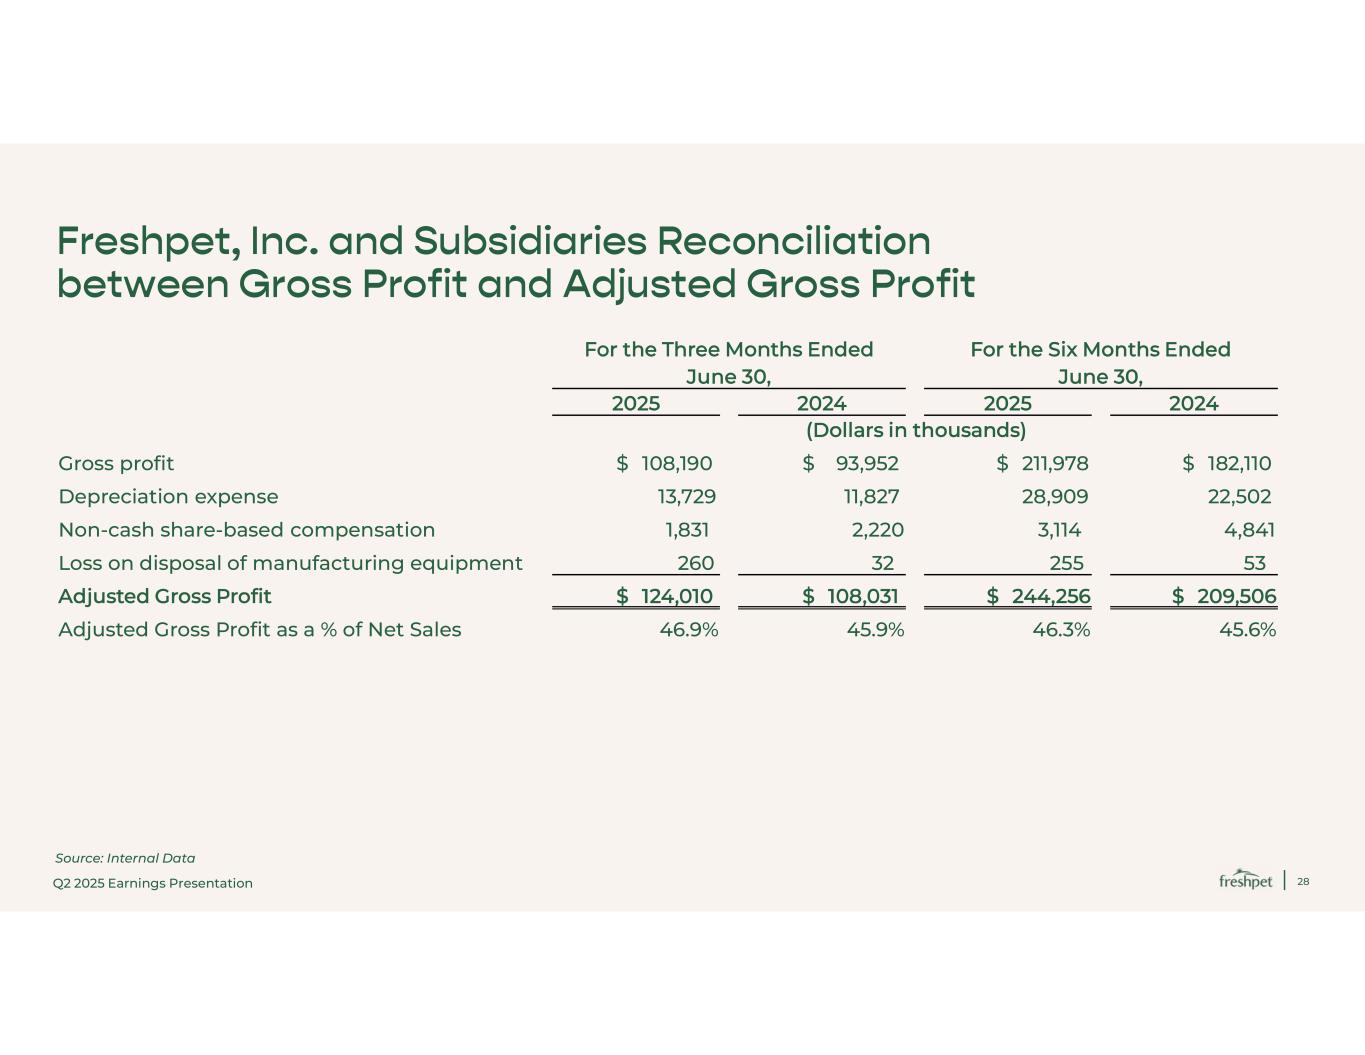
Q2 2025 Earnings Presentation 28 Freshpet, Inc. and Subsidiaries Reconciliation between Gross Profit and Adjusted Gross Profit Source: Internal Data For the Six Months Ended June 30, For the Three Months Ended June 30, 2024 2025 2024 2025 (Dollars in thousands) $ 182,110 $ 211,978 $ 93,952 $ 108,190 Gross profit 22,502 28,909 11,827 13,729 Depreciation expense 4,841 3,114 2,220 1,831 Non-cash share-based compensation 53 255 32 260 Loss on disposal of manufacturing equipment $ 209,506 $ 244,256 $ 108,031 $ 124,010 Adjusted Gross Profit 45.6% 46.3% 45.9% 46.9% Adjusted Gross Profit as a % of Net Sales
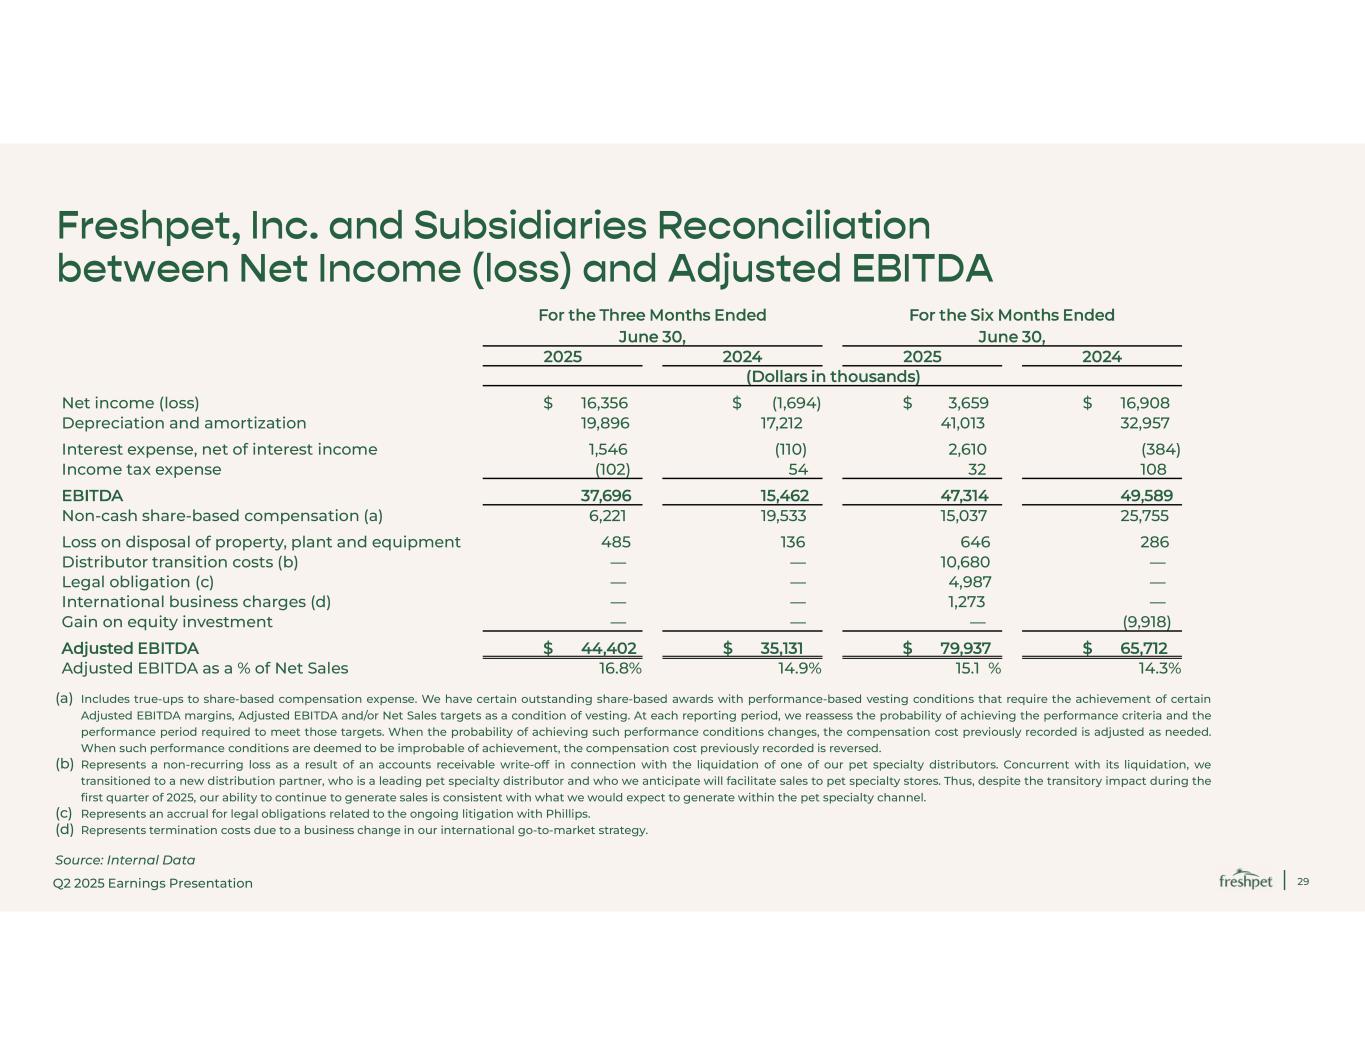
Q2 2025 Earnings Presentation 29 Freshpet, Inc. and Subsidiaries Reconciliation between Net Income (loss) and Adjusted EBITDA Source: Internal Data (a) Includes true-ups to share-based compensation expense. We have certain outstanding share-based awards with performance-based vesting conditions that require the achievement of certain Adjusted EBITDA margins, Adjusted EBITDA and/or Net Sales targets as a condition of vesting. At each reporting period, we reassess the probability of achieving the performance criteria and the performance period required to meet those targets. When the probability of achieving such performance conditions changes, the compensation cost previously recorded is adjusted as needed. When such performance conditions are deemed to be improbable of achievement, the compensation cost previously recorded is reversed. (b) Represents a non-recurring loss as a result of an accounts receivable write-off in connection with the liquidation of one of our pet specialty distributors. Concurrent with its liquidation, we transitioned to a new distribution partner, who is a leading pet specialty distributor and who we anticipate will facilitate sales to pet specialty stores. Thus, despite the transitory impact during the first quarter of 2025, our ability to continue to generate sales is consistent with what we would expect to generate within the pet specialty channel. (c) Represents an accrual for legal obligations related to the ongoing litigation with Phillips. (d) Represents termination costs due to a business change in our international go-to-market strategy. For the Six Months Ended June 30, For the Three Months Ended June 30, 2024 2025 2024 2025 (Dollars in thousands) $ 16,908 $ 3,659 $ (1,694) $ 16,356 Net income (loss) 32,957 41,013 17,212 19,896 Depreciation and amortization (384) 2,610 (110) 1,546 Interest expense, net of interest income 108 32 54 (102) Income tax expense 49,589 47,314 15,462 37,696 EBITDA 25,755 15,037 19,533 6,221 Non-cash share-based compensation (a) 286 646 136 485 Loss on disposal of property, plant and equipment — 10,680 — — Distributor transition costs (b) — 4,987 — — Legal obligation (c) — 1,273 — — International business charges (d) (9,918) — — — Gain on equity investment $ 65,712 $ 79,937 $ 35,131 $ 44,402 Adjusted EBITDA 14.3% 15.1 % 14.9% 16.8% Adjusted EBITDA as a % of Net Sales
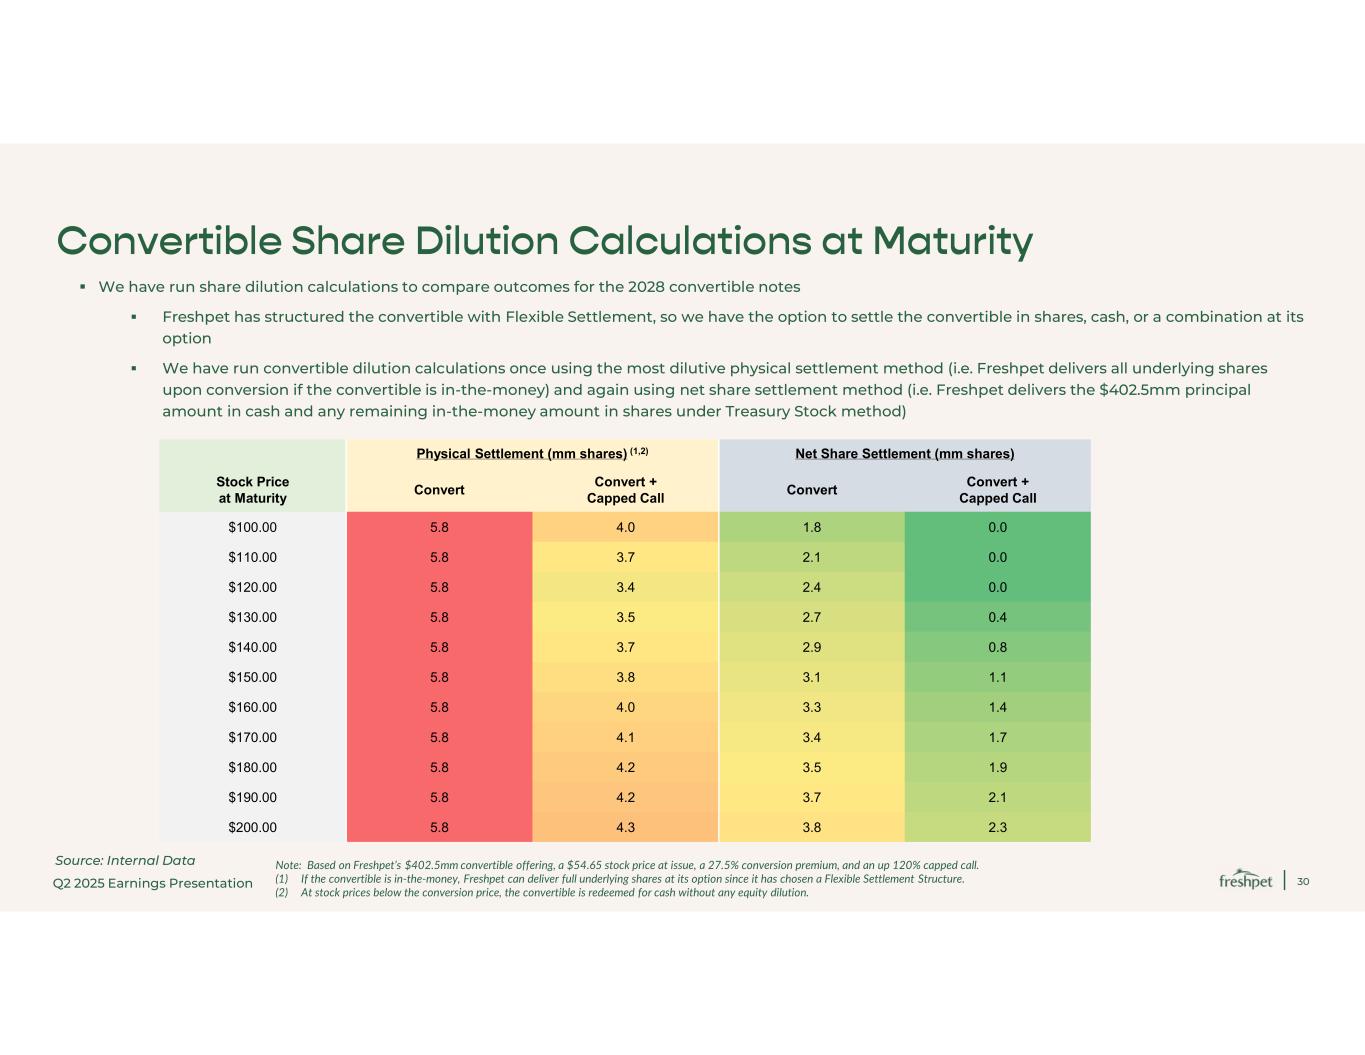
Q2 2025 Earnings Presentation 30 Convertible Share Dilution Calculations at Maturity We have run share dilution calculations to compare outcomes for the 2028 convertible notes Freshpet has structured the convertible with Flexible Settlement, so we have the option to settle the convertible in shares, cash, or a combination at its option We have run convertible dilution calculations once using the most dilutive physical settlement method (i.e. Freshpet delivers all underlying shares upon conversion if the convertible is in-the-money) and again using net share settlement method (i.e. Freshpet delivers the $402.5 mm principal amount in cash and any remaining in-the-money amount in shares under Treasury Stock method) Note: Based on Freshpet’s $402.5 mm convertible offering, a $54.65 stock price at issue, a 27.5% conversion premium, and an up 120% capped call. (1) If the convertible is in-the-money, Freshpet can deliver full underlying shares at its option since it has chosen a Flexible Settlement Structure. (2) At stock prices below the conversion price, the convertible is redeemed for cash without any equity dilution. Net Share Settlement (mm shares)Physical Settlement (mm shares) (1,2) Convert + Capped Call Convert Convert + Capped Call Convert Stock Price at Maturity 0.01.84.05.8$100.00 0.02.13.75.8$110.00 0.02.43.45.8$120.00 0.42.73.55.8$130.00 0.82.93.75.8$140.00 1.13.13.85.8$150.00 1.43.34.05.8$160.00 1.73.44.15.8$170.00 1.93.54.25.8$180.00 2.13.74.25.8$190.00 2.33.84.35.8$200.00 Source: Internal Data

Q2 2025 Earnings Presentation 31 Thank you