
FRPT 8-K
Freshpet, Inc. (FRPT)
8-K
2021-01-14
For: 2021-01-13
View Original
Added on
April 05, 2026
UNITED STATES
SECURITIES AND EXCHANGE COMMISSION
WASHINGTON, D.C. 20549
___________________
FORM 8-K
___________________
CURRENT REPORT
Pursuant to Section 13 or 15(d) of the Securities Exchange Act of 1934
Date of Report (Date of earliest event reported): January 13, 2021
___________________
(Exact name of Registrant as Specified in Its Charter)
___________________
|
|
|
|
|
(State or Other Jurisdiction
of Incorporation)
|
(Commission File Number)
|
(IRS Employer
Identification No.)
|
|
|
|
|
|
(Address of Principal Executive Offices)
|
(Zip Code)
|
Registrant’s Telephone Number, Including Area Code: (201 )
520-4000
Not Applicable
(Former Name or Former Address, if Changed Since Last Report)
___________________
Check the appropriate box below if the Form 8-K filing is intended to simultaneously satisfy the filing obligation of the registrant under any of the following provisions
(see General Instructions A.2. below):
|
Written communications pursuant to Rule 425 under the Securities Act (17 CFR 230.425)
|
|
Soliciting material pursuant to Rule 14a-12 under the Exchange Act (17 CFR 240.14a-12)
|
|
Pre-commencement communications pursuant to Rule 14d-2(b) under the Exchange Act (17 CFR 240.14d-2(b))
|
|
Pre-commencement communications pursuant to Rule 13e-4(c) under the Exchange Act (17 CFR 240.13e-4(c))
|
Securities registered pursuant to Section 12(b) of the Act:
|
Title of each class
|
Trading Symbol(s)
|
Name of each exchange on which registered
|
|
|
|
|
Indicate by check mark whether the registrant is an emerging growth company as defined in Rule 405 of the Securities Act of 1933 (§ 230.405 of this chapter) or Rule 12b-2
of the Securities Exchange Act of 1934 (§ 240.12b-2 of this chapter).
Emerging growth company ☐
If an emerging growth company, indicate by check mark if the registrant has elected not to use the extended transition period for complying with any new or revised
financial accounting standards provided pursuant to Section 13(a) of the Exchange Act. ☐
Item 2.02. Results of Operations and Financial Condition.
The information included under Item 7.01 of this Current Report, including Exhibit 99.1
and Exhibit 99.2, relating to Freshpet, Inc.’s (the “Company” or “Freshpet”) preliminary estimates of certain financial information for the quarter
and fiscal year ending December 31, 2020 with respect to its operational performance (the “Preliminary Information”) is incorporated by reference into this Item 2.02.
Item 7.01. Regulation FD Disclosure.
On January 13, 2021, Freshpet issued a press release disclosing the Preliminary Information and published to the investor relations section of its website a
presentation that contains the Preliminary Information and will be used by Freshpet’s management team in meetings with analysts and stockholders. A copy of the press release and presentation is attached hereto as Exhibit 99.1 and Exhibit 99.2,
respectively, and is incorporated herein by reference.
The information set forth under Item 2.02 and this Item 7.01 of this Current Report, including Exhibit 99.1 and Exhibit 99.2, shall not be deemed to
be “filed” for purposes of Section 18 of the Securities Exchange Act of 1934, as amended (the “Exchange Act”), or otherwise subject to the liabilities of that section, nor
shall it be deemed incorporated by reference in any filing made by the Company under the Securities Act of 1933, as amended or the Exchange Act, except as shall be expressly set forth by specific reference in such a filing.
Freshpet uses the “Investors” section of its website (investors.freshpet.com) as a means of disclosing material non-public information
and for complying with its disclosure obligations under Regulation FD.
Forward-Looking Statements
Certain statements in this Current Report (including the exhibits hereto) constitute “forward-looking” statements. These statements are based on management’s current
opinions, expectations, beliefs, plans, objectives, assumptions or projections regarding future events or future results. These forward-looking statements are only predictions, not historical fact, and involve certain risks and uncertainties, as
well as assumptions. Actual results, levels of activity, performance, achievements and events could differ materially from those stated, anticipated or implied by such forward-looking statements. While the Company believes that its assumptions are
reasonable, it is very difficult to predict the impact of known factors, and, of course, it is impossible to anticipate all factors that could affect actual results, including the impact of the COVID-19 pandemic on the Company’s business. There are
a number of risks and uncertainties that could cause actual results to differ materially from forward-looking statements made herein including, most prominently, the risks discussed under the heading “Risk Factors” in each of the Company’s Annual
Report on Form 10-K for the year ended December 31, 2019 and Quarterly Report on Form 10-Q for the period ended September 30, 2020, as well as its consolidated financial statements, related notes, and other financial information appearing therein,
and its other filings with the U.S. Securities and Exchange Commission.
Additionally, Exhibit 99.1 and 99.2 include certain preliminary financial estimates as of and for the periods ended December 31, 2020, for which consolidated financial
statements are not yet available and for which the audit has not been completed. Such estimates are “forward-looking” statements. Our actual results remain subject to the completion of our quarter-end and year-end closing process, which includes
review by management and our board of directors, including our audit committee. While carrying out such procedures, we may identify items that require us to make adjustments to such preliminary estimates. Our independent registered public
accounting firm has also not audited, reviewed, compiled or performed any procedures on this preliminary financial information, and, accordingly, does not express an opinion or other form of assurance with respect thereto. Such estimated ranges are
preliminary and may change. There can be no assurance that our final audited results of operations for such periods will not differ from these estimates, and any such changes could be material. Therefore, you should not place undue reliance on
these preliminary estimates of our results.
Such forward-looking statements are made only as of the date of this Current Report. The Company expressly disclaims any obligation or undertaking to release any
updates or revisions to any forward-looking statements contained herein to reflect any change in its expectations with regard thereto or changes in events, conditions, or circumstances on which any such statement is based.
Item 9.01. Financial Statements and Exhibits.
(d) Exhibits
|
Exhibit
No.
|
Description of Exhibit
|
|
|
Press Release
|
||
|
Investors Presentation
|
||
|
104
|
Cover Page Interactive Data File (embedded within the Inline XBRL document)
|
SIGNATURE
Pursuant to the requirements of the Securities Exchange Act of 1934, the registrant has duly caused this report to be signed on its
behalf by the undersigned hereunto duly authorized.
|
FRESHPET, INC.
|
||
|
Date: January 14, 2021
|
By:
|
/s/ Heather Pomerantz
|
|
Name: Heather Pomerantz
|
||
|
Title: Chief Financial Officer
|
||
Exhibit 99.1

Freshpet, Inc. Provides Business Update
Pre-Announces Net Sales and Updates EBITDA Guidance
SECAUCUS, N.J. – January 13, 2021 – Freshpet, Inc. (“Freshpet” or the “Company”) (NASDAQ:FRPT) today announced preliminary fourth quarter net sales and updated
adjusted EBITDA guidance in conjunction with the Company’s presentation at the ICR Conference. The presentation is available on the Company’s investor relations website.
Preliminary fourth quarter 2020 net sales are expected to be $84.5 million, representing growth of 29% compared to the prior year period. The Company also updated its
guidance for adjusted EBITDA, which is expected to approximate $12 million for the fourth quarter. For the full year 2020, the Company expects net sales of approximately $318.8 million and adjusted EBITDA of approximately $46 million.
“We continued to experience strong demand in the fourth quarter, but supply constraints limited our sales opportunity. We are pleased with our preliminary fourth
quarter results in light of the challenges we faced in the back half of the quarter due to COVID-related labor disruption and severe weather impacts to our distribution network,” commented Billy Cyr, Freshpet’s Chief Executive Officer. “We are
extremely excited about the traction we are seeing with new and existing pet parents. The underlying buy rate we are realizing in the business is stronger than anticipated and has grown each of the past five years as our household penetration has
grown at a rate in excess of 20% over the past two years. As a result, we are considering incremental investments in capacity expansion to ensure we meet the growing demand from families that are seeking a better-for-you alternative to feeding
their pets.”
About Freshpet
Freshpet’s mission is to improve the lives of dogs and cats through the power of fresh, real food. Freshpet foods are blends of fresh meats, vegetables and fruits
farmed locally and made at our Kitchens in Bethlehem PA. We thoughtfully prepare our foods using natural ingredients, cooking them in small batches at lower temperatures to preserve the natural goodness of the ingredients. Freshpet foods and treats
are kept refrigerated from the moment they are made until they arrive at Freshpet Fridges in your local market.
Our foods are available in select mass, grocery (including online), natural food, club, and pet specialty retailers across the United States, Canada and Europe. From
the care we take to source our ingredients and make our food, to the moment it reaches your home, our integrity, transparency and social responsibility are the way we like to run our business. To learn more, visit www.freshpet.com.
Connect with Freshpet:
https://www.facebook.com/Freshpet
https://twitter.com/Freshpet
http://instagram.com/Freshpet
http://pinterest.com/Freshpet
https://en.wikipedia.org/wiki/Freshpet
https://www.youtube.com/user/freshpet400
Forward Looking Statements
Certain statements in this release constitute “forward-looking” statements. These statements are based on management's current opinions, expectations, beliefs, plans,
objectives, assumptions or projections regarding future events or future results. These forward-looking statements are only predictions, not historical fact, and involve certain risks and uncertainties, as well as assumptions. Actual results,
levels of activity, performance, achievements and events could differ materially from those stated, anticipated or implied by such forward-looking statements. While Freshpet believes that its assumptions are reasonable, it is very difficult to
predict the impact of known factors, and, of course, it is impossible to anticipate all factors that could affect actual results. There are several risks and uncertainties that could cause actual results to differ materially from forward-looking
statements made herein including, most prominently, the risks discussed under the heading “Risk Factors” in the Company's latest annual report on Form 10-K and its quarterly reports on Form 10-Q filed with the Securities and Exchange Commission.
Such forward-looking statements are made only as of the date of this release. Freshpet undertakes no obligation to publicly update or revise any forward-looking statement because of new information, future events or otherwise, except as otherwise
required by law. If we do update one or more forward-looking statements, no inference should be made that we will make additional updates with respect to those or other forward-looking statements.
Non-GAAP Financial Measures
Freshpet uses the following non-GAAP financial measures in its financial communications. These non-GAAP financial measures should be considered as supplements to the
GAAP reported measures, should not be considered replacements for, or superior to, the GAAP measures and may not be comparable to similarly named measures used by other companies.
Adjusted Gross Profit
Adjusted Gross Profit as a % of net sales (Adjusted Gross Margin)
Adjusted SG&A
Adjusted SG&A as a % of net sales
EBITDA
Adjusted EBITDA
Adjusted EBITDA as a % of net sales
Adjusted Gross Profit: Freshpet defines Adjusted Gross Profit as Gross Profit before depreciation expense, plant start-up expense, COVID-19 expenses and non-cash
share-based compensation.
Adjusted SG&A Expenses: Freshpet defines Adjusted SG&A as SG&A expenses before depreciation and amortization expense, non-cash share-based compensation,
launch expense, fees related to equity offerings of our common stock, loss on disposal of equipment, COVID-19 expenses and implementation and other costs associated with the implementation of an ERP system.
EBITDA and Adjusted EBITDA: EBITDA represents net income (loss) plus interest expense, income tax expense and depreciation and amortization expense, and Adjusted
EBITDA represents EBITDA plus loss on disposal of equipment, non-cash share-based compensation expense, launch expenses, fees related to equity offerings, plant start-up expenses, COVID-19 expenses and implementation and other costs associated with
the implementation of an ERP system.
Management believes that the non-GAAP financial measures are meaningful to investors because they provide a view of the Company with respect to ongoing operating
results. The non-GAAP financial measures are shown as supplemental disclosures in this release because they are widely used by the investment community for analysis and comparative evaluation. They also provide additional metrics to evaluate the
Company’s operations and, when considered with both the Company’s GAAP results and the reconciliation to the most comparable GAAP measures, provide a more complete understanding of the Company’s business than could be obtained absent this
disclosure. The non-GAAP measures are not and should not be considered an alternative to the most comparable GAAP measures or any other figure calculated in accordance with GAAP, or as an indicator of operating performance. The Company’s
calculation of the non-GAAP financial measures may differ from methods used by other companies. Management believes that the non-GAAP measures are important to an understanding of the Company's overall operating results in the periods presented.
The non-GAAP financial measures are not recognized in accordance with GAAP and should not be viewed as an alternative to GAAP measures of performance.
CONTACT
ICR
Jeff Sonnek
646-277-1263
Exhibit 99.1

ICR Investor Presentation January 13,2021
Forward Looking Statements & Non-GAAP Measures * Forward-Looking StatementsCertain
statements in this presentation constitute “forward-looking” statements, which include any statements related to the novel coronavirus ("COVID-19"), the Freshpet Kitchens Expansion, and the Company's general operating and economic
environment. These statements are based on management's current opinions, expectations, beliefs, plans, objectives, assumptions or projections regarding future events or future results. These forward-looking statements are only predictions,
not historical fact, and involve certain risks and uncertainties, as well as assumptions. Actual results, levels of activity, performance, achievements and events could differ materially from those stated, anticipated or implied by such
forward-looking statements. While Freshpet believes that its assumptions are reasonable, it is very difficult to predict the impact of known factors, and, of course, it is impossible to anticipate all factors that could affect actual results.
There are many risks and uncertainties that could cause actual results to differ materially from forward-looking statements made herein including, most prominently, the risks discussed under the heading “Risk Factors” in the Company's latest
annual report on Form 10-K and quarterly reports on Form 10-Q filed with the Securities and Exchange Commission. Such forward-looking statements are made only as of the date of this presentation. Freshpet undertakes no obligation to publicly
update or revise any forward-looking statement because of new information, future events or otherwise, except as otherwise required by law. If we do update one or more forward-looking statements, no inference should be made that we will make
additional updates with respect to those or other forward- looking statements.Non-GAAP MeasuresFreshpet uses certain non-GAAP financial measures, including EBITDA, Adjusted EBITDA, Adjusted EBITDA as a % of net sales, Adjusted Gross Profit,
Adjusted Gross Profit as a % of net sales (Adjusted Gross Margin), Adjusted SG&A and Adjusted SG&A as a % of net sales. These non-GAAP financial measures should be considered as supplements to GAAP reported measures, should not be
considered replacements for, or superior to, GAAP measures and may not be comparable to similarly named measures used by other companies.Freshpet defines EBITDA as net income (loss) plus interest expense, income tax expense and depreciation
and amortization expense, and Adjusted EBITDA as EBITDA plus gain (loss) on disposal of equipment, plant start-up expenses, non-cash share-based compensation, launch expense, fees related to equity offerings, COVID-19 expenses, and fees
associated with due diligence of new enterprise resource planning ("ERP") software.
Forward Looking Statements & Non-GAAP Measures (cont.) * Freshpet defines Adjusted Gross
Profit as gross profit before depreciation expense, plant start-up costs, COVID-19 expenses and non-cash share-based compensation, and Adjusted SG&A as SG&A expenses before depreciation and amortization expense, non-cash share-based
compensation, launch expense, gain (loss) on disposal of equipment, fees related to equity offerings, and fees associated with due diligence of new ERP software..Management believes that the non-GAAP financial measures are meaningful to
investors because they provide a view of the Company with respect to ongoing operating results. Non-GAAP financial measures are shown as supplemental disclosures in this presentation because they are widely used by the investment community
for analysis and comparative evaluation. They also provide additional metrics to evaluate the Company’s operations and, when considered with both the Company’s GAAP results and the reconciliation to the most comparable GAAP measures, provide
a more complete understanding of the Company’s business than could be obtained absent this disclosure. Adjusted EBITDA is also an important component of internal budgeting and setting management compensation. The non-GAAP measures are not and
should not be considered an alternative to the most comparable GAAP measures or any other figure calculated in accordance with GAAP, or as an indicator of operating performance. The Company’s calculation of the non-GAAP financial measures may
differ from methods used by other companies. Management believes that the non-GAAP measures are important to an understanding of the Company's overall operating results in the periods presented. The non-GAAP financial measures are not
recognized in accordance with GAAP and should not be viewed as an alternative to GAAP measures of performance.Certain of these measures present the company’s guidance for fiscal year 2020, for which the Company has not yet completed its
internal or external audit procedures. The Company does not provide guidance for the most directly comparable GAAP measure and similarly cannot provide a reconciliation to such measure without unreasonable effort due to the unavailability of
reliable estimates for certain items. These items are not within the Company’s control and may vary greatly between periods and could significantly impact future financial results.

4
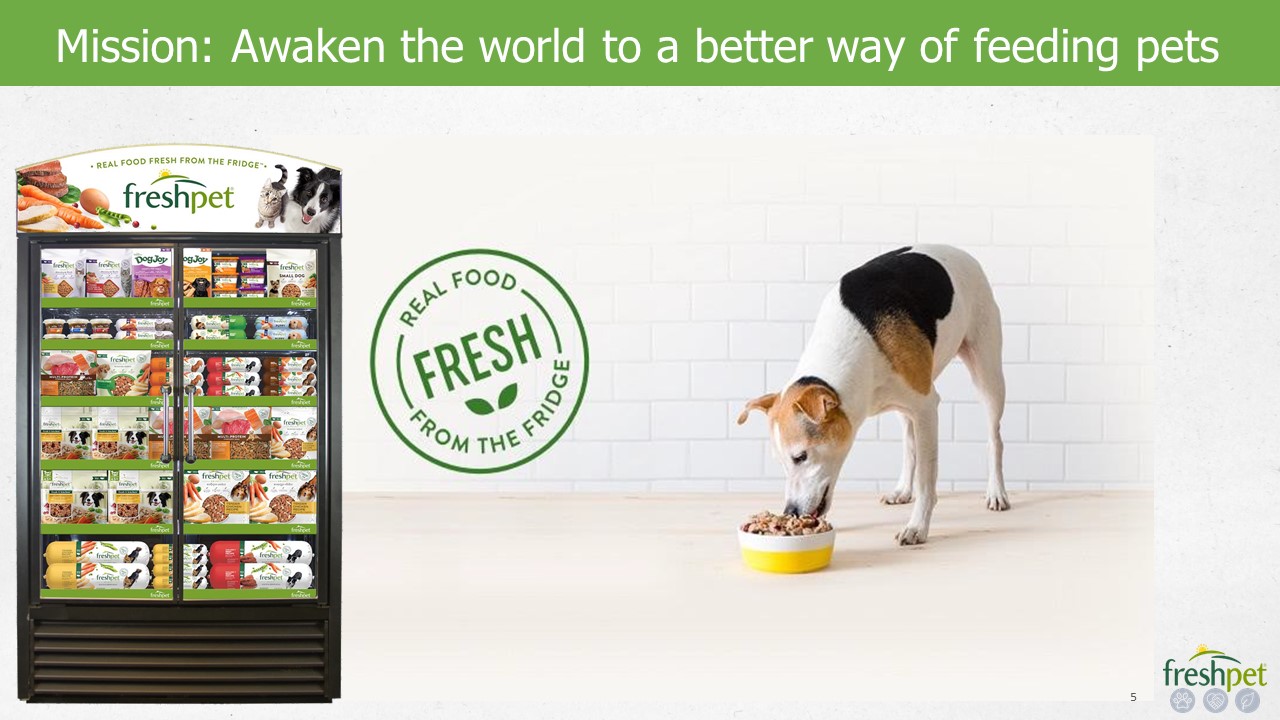
Mission: Awaken the world to a better way of feeding pets 5

Embed video here *
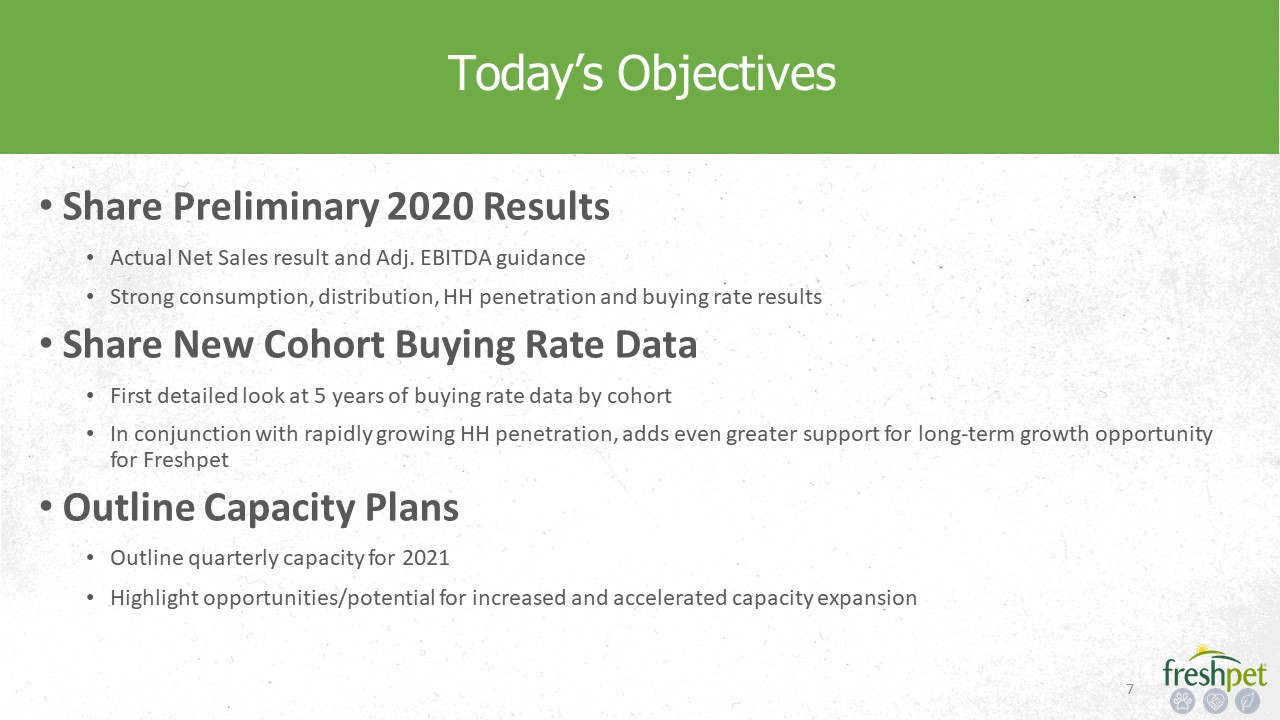
Today’s Objectives * Share Preliminary 2020 ResultsActual Net Sales result and Adj. EBITDA
guidanceStrong consumption, distribution, HH penetration and buying rate resultsShare New Cohort Buying Rate DataFirst detailed look at 5 years of buying rate data by cohortIn conjunction with rapidly growing HH penetration, adds even greater
support for long-term growth opportunity for FreshpetOutline Capacity PlansOutline quarterly capacity for 2021Highlight opportunities/potential for increased and accelerated capacity expansion

Preliminary 2020 Results
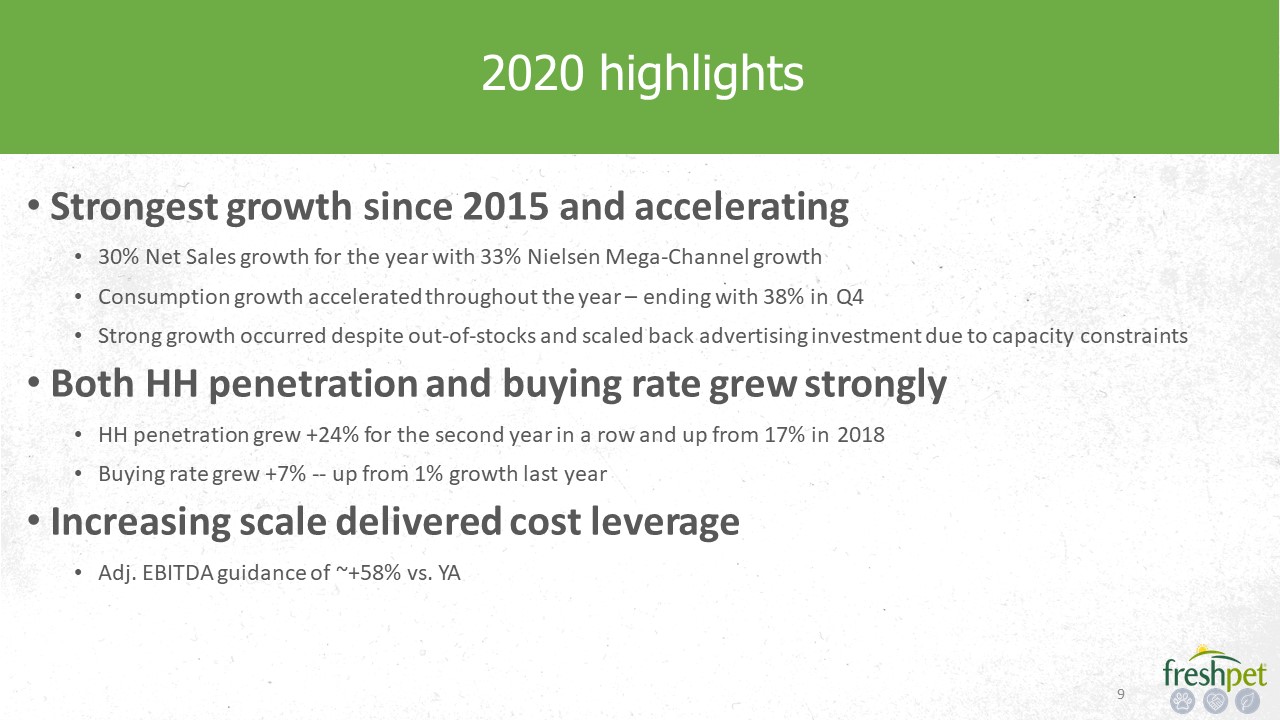
2020 highlights * Strongest growth since 2015 and accelerating 30% Net Sales growth for the year
with 33% Nielsen Mega-Channel growthConsumption growth accelerated throughout the year – ending with 38% in Q4Strong growth occurred despite out-of-stocks and scaled back advertising investment due to capacity constraints Both HH penetration
and buying rate grew stronglyHH penetration grew +24% for the second year in a row and up from 17% in 2018Buying rate grew +7% -- up from 1% growth last yearIncreasing scale delivered cost leverageAdj. EBITDA guidance of ~+58% vs. YA
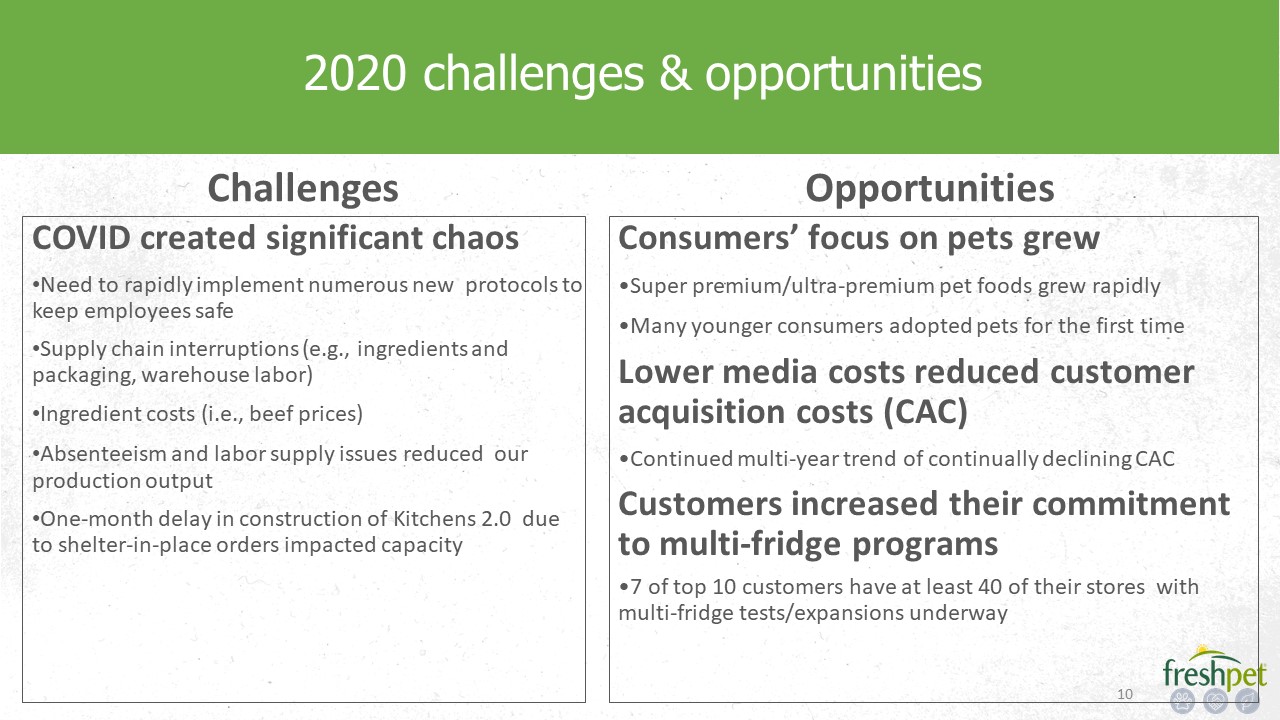
2020 challenges & opportunities COVID created significant chaosNeed to rapidly implement numerous
new protocols to keep employees safeSupply chain interruptions (e.g., ingredients and packaging, warehouse labor)Ingredient costs (i.e., beef prices)Absenteeism and labor supply issues reduced our production outputOne-month delay in
construction of Kitchens 2.0 due to shelter-in-place orders impacted capacity Consumers’ focus on pets grewSuper premium/ultra-premium pet foods grew rapidlyMany younger consumers adopted pets for the first timeLower media costs reduced
customer acquisition costs (CAC)Continued multi-year trend of continually declining CACCustomers increased their commitment to multi-fridge programs7 of top 10 customers have at least 40 of their stores with multi-fridge tests/expansions
underway * Challenges Opportunities
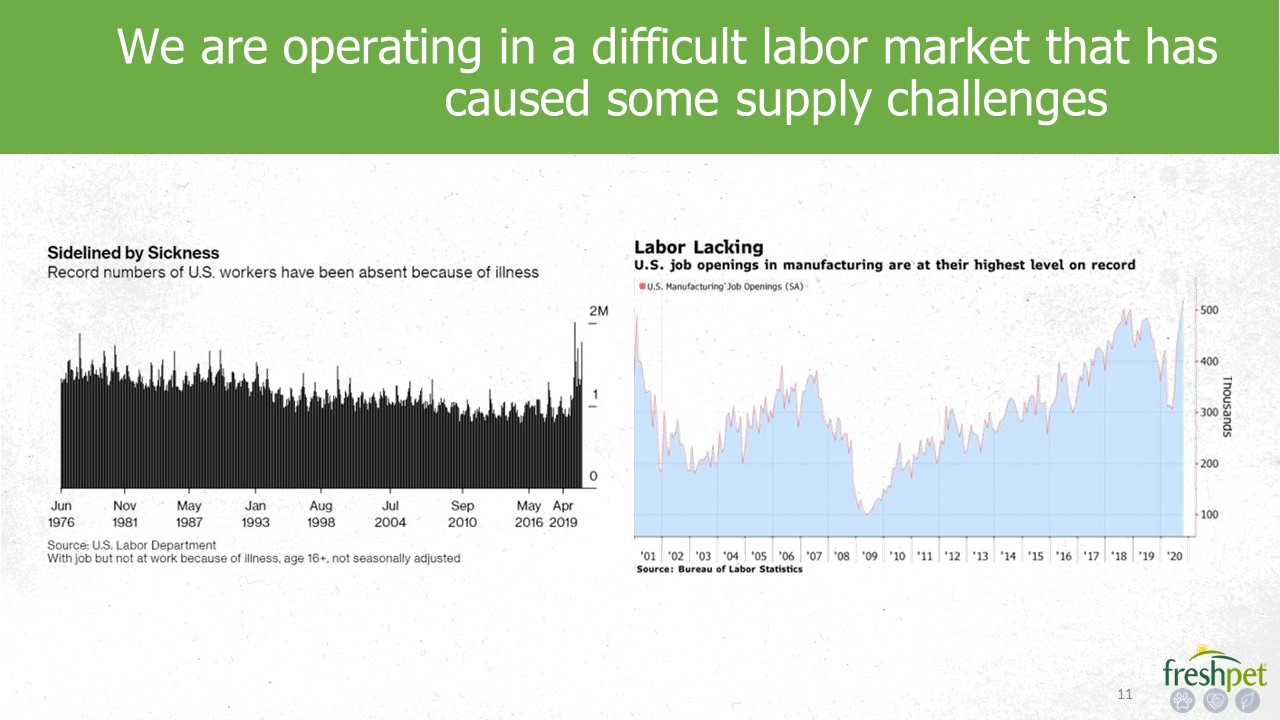
We are operating in a difficult labor market that has caused some supply challenges *
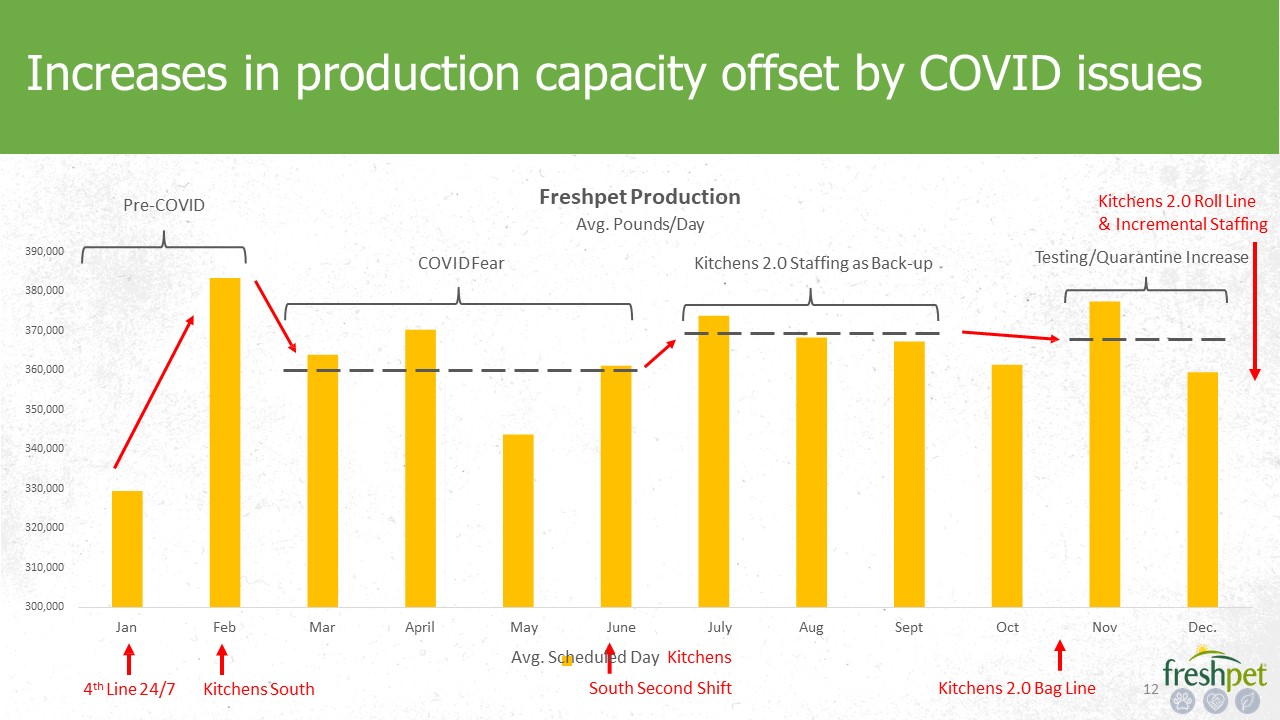
300,000 380,000370,000360,000350,000340,000330,000320,000310,000 390,000 Jan Feb Mar April Aug Sept Oct Nov Dec. Freshpet
ProductionAvg. Pounds/Day 12 Increases in production capacity offset by COVID issues Pre-COVID COVID Fear Kitchens 2.0 Staffing as Back-up 4th Line 24/7 Kitchens South May June JulyAvg. Scheduled Day Kitchens South Second
Shift Kitchens 2.0 Bag Line Kitchens 2.0 Roll Line& Incremental StaffingTesting/Quarantine Increase
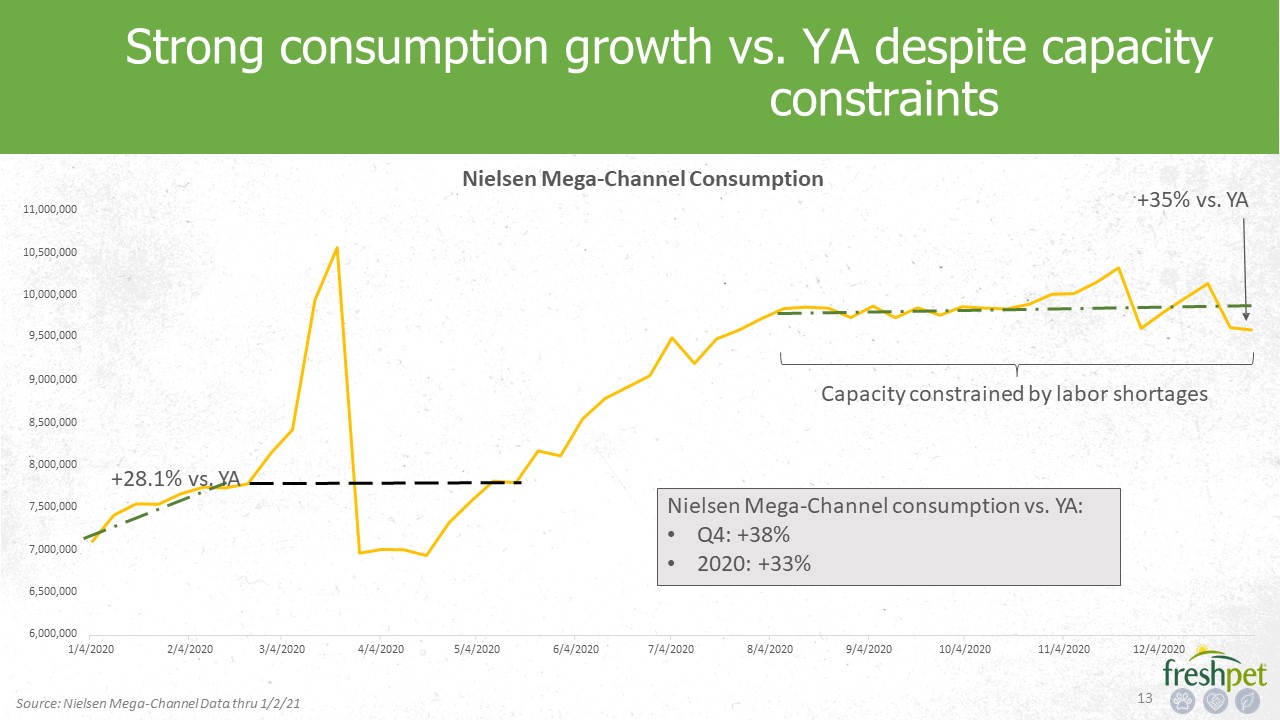
6,500,0006,000,000 7,000,000 7,500,000 8,000,000 8,500,000 9,000,000 10,500,00010,000,0009,500,000 11,000,000 1/4/2020 2/4/2020 3/4/2020 4/4/2020 5/4/2020 6/4/2020 7/4/2020 8/4/2020 9/4/2020 10/4/2020 11/4/2020 12/4/2020 Nielsen
Mega-Channel Consumption +35% vs. YA 13 Strong consumption growth vs. YA despite capacity constraints +28.1% vs. YA Nielsen Mega-Channel consumption vs. YA:Q4: +38%2020: +33% Source: Nielsen Mega-Channel Data thru 1/2/21 Capacity
constrained by labor shortages
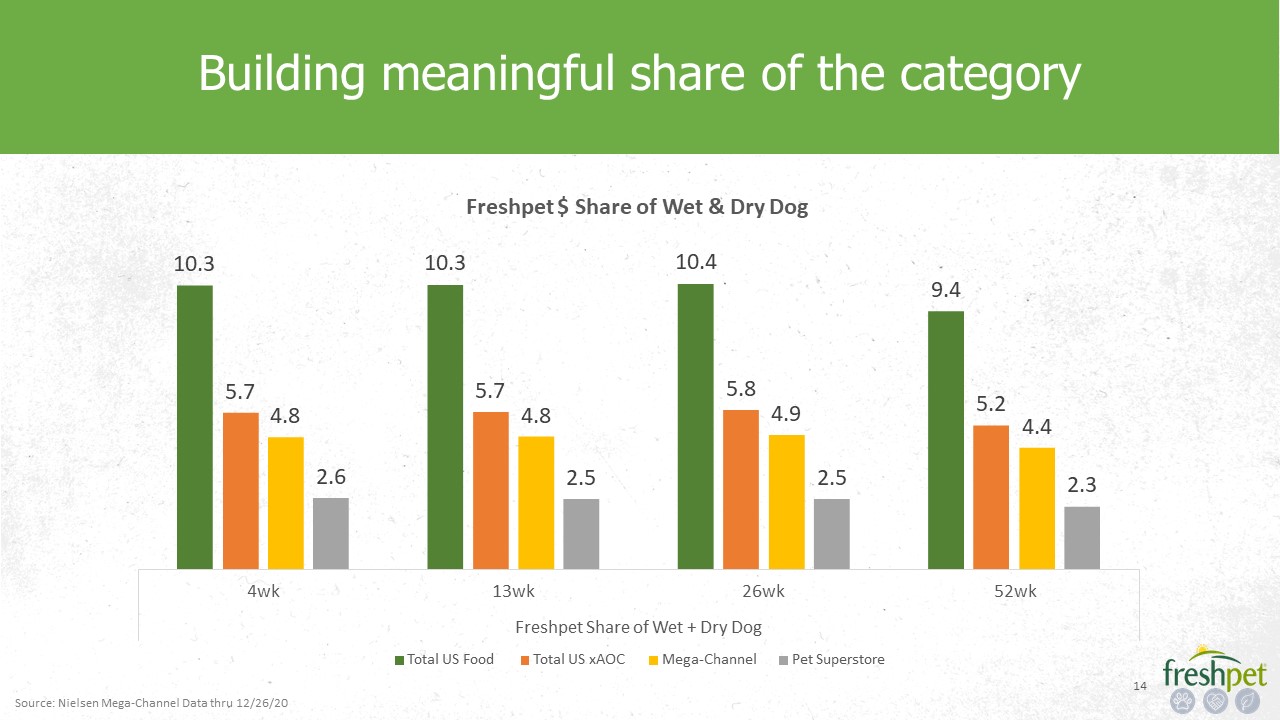
14 Building meaningful share of the
category 10.3 9.4 5.7 5.7 5.8 5.2 4.8 4.8 4.9 4.4 2.6 2.5 2.5 2.3 4wk 52wk Freshpet $ Share of Wet & Dry Dog10.3 10.4 13wk 26wkFreshpet Share of Wet + Dry DogTotal US Food Total US xAOC Mega-Channel Pet
Superstore Source: Nielsen Mega-Channel Data thru 12/26/20

15 Category growth skews heavily towards most premium
brands -9.1 -20.1 -0.10.7 17.3 Price Tier Growth: Wet + Dry + Fresh Dog Food52 Weeks: Dollar % Change vs. YAG Private Label Wet + Dry Value Wet + Dry Premium Wet + Dry Dog Food Super Premium Wet +
Dry Ultra Premium Wet + Dry + Refrigerated Source: Nielsen US XAOC Data thru 12/26/20
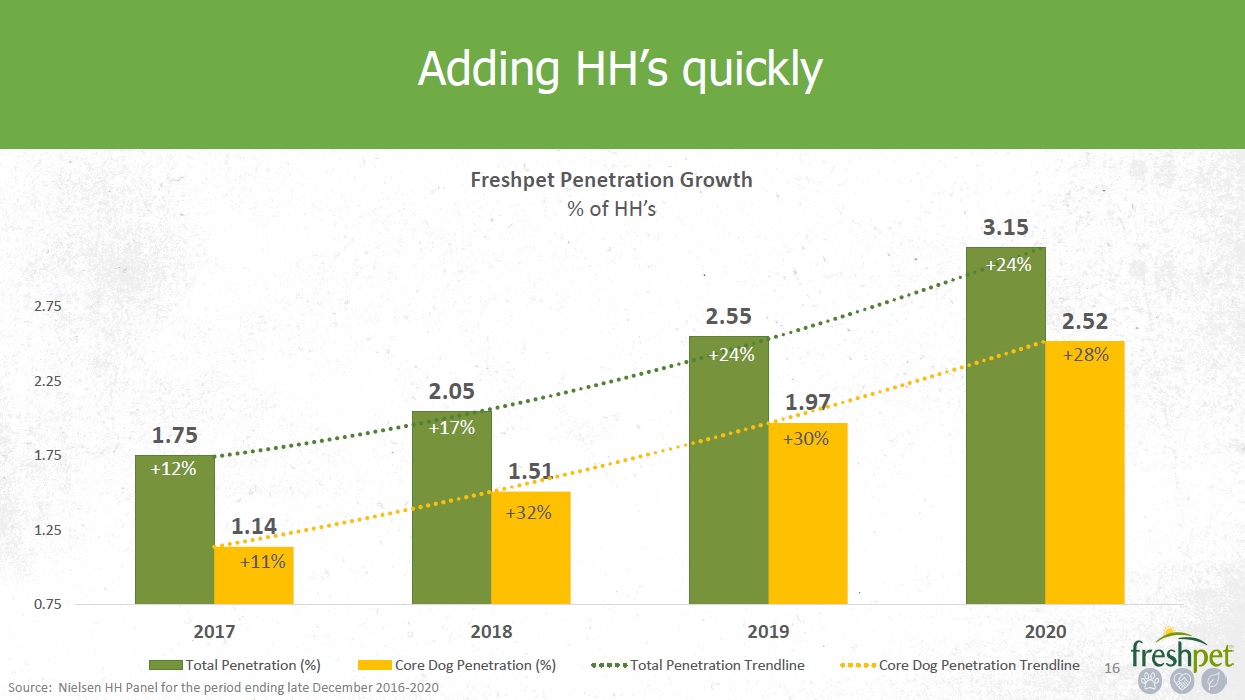
1.75 2.05 2.55 3.15 1.1 4 1 .5 1 1 .97 2.52 0.75 1.25 1.75 2.25 2.75 2020 Freshpet
Penetration Growth% of HH’s 2017Total Penetration (%) 2018Core Dog Penetration (%) 2019Total Penetration Trendline Core Dog Penetration Trendline +30% +32% +28% +24% +12% Adding HH’s quickly Source: Nielsen HH Panel for the period
ending late December 2016-2020 +11% +24% +17% 16

Buying rate growth continues Source: Nielsen HH Panel for the period ending late December 2017, 2018,
2019, 2020 and company internal data $98.84 $108.14 $109.35 $116.94 $128.82 $128.94 $127.64 $134.38 $60.00 $70.00 $80.00 $90.00 $100.00 $110.00 $120.00 $130.00 $140.00 2017 2020 Freshpet Buying Rate 2018Total Buying
Rate 2019Core Dog Buying Rate +5% +7% +11% -% -1% +7% +9% +1% 17

45.5 45.7
45.7 45.8 46.1 46.4 47.4 47.9 48.2 48.5 48.9 49.3 49.7 49.9 50.2 51.1 52.5 52.8 53.4 54.4 54.5 54.6 54.8 54.9 55.0 55.1 55.3 55.5 55.4 55.5 44.042.0 46.0 48.0 50.0 52.0 54.0 56.0 58.0 Freshpet %
ACV Distribution growth plateaued during COVID crisis Source: Nielsen Mega-Channel Data thru 12/26/20 COVID Crisis 18

19 Store count growth limited by COVID; 2nd Fridge growth accelerating 791 2,071 345 1,146 Qtr.
Increase YTD Increase Net New Stores Q4 2019 Q4 2020 1,591 2,386 786 795 Total Operating YTD New Fridge Upgrades Q4 2019 Q4 2020 807 705 2,477 1,640 Total Operating YTD New Second Fridges Q4 2019 Q4
2020 21,570 22,716 Q4 2019 Q4 2020 Store Count Source: Internal company data
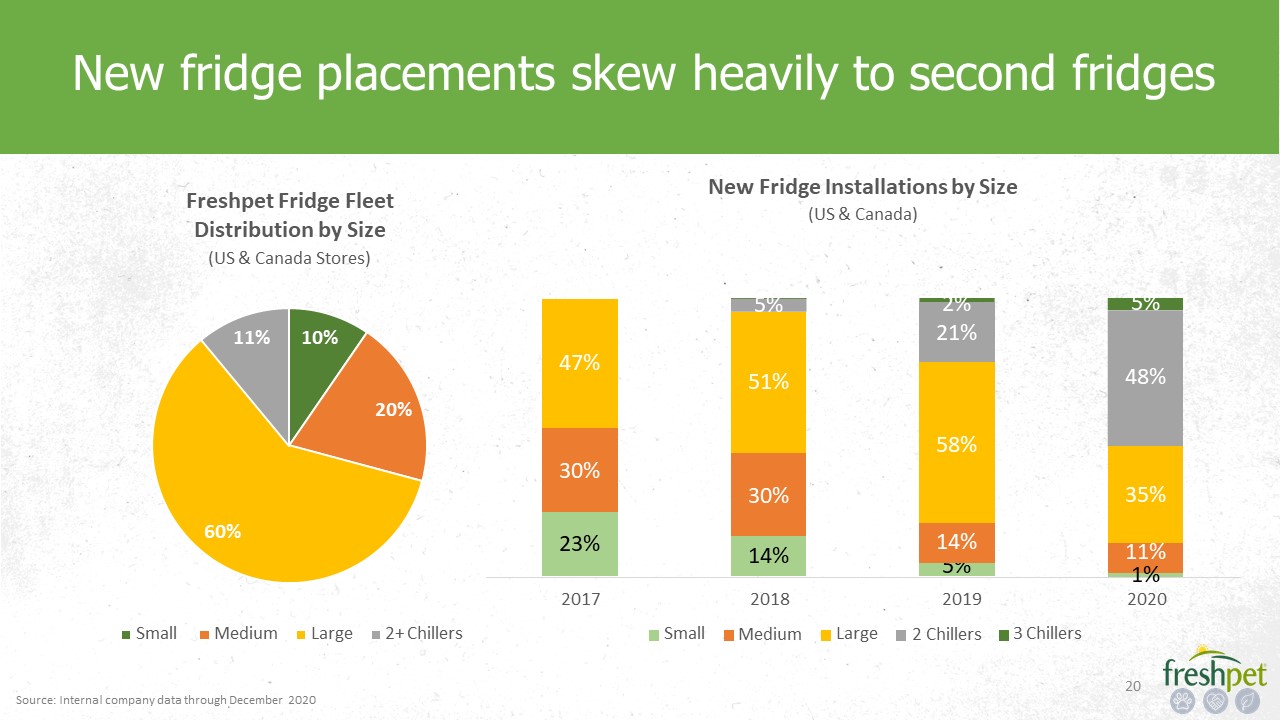
New fridge placements skew heavily to second fridges Source: Internal company data through December
2020 20 20% 60% 11% 10% Freshpet Fridge Fleet Distribution by Size(US & Canada Stores) Small Medium Large 2+ Chillers 23% 14% 5% 30% 30% 14% 11%1% 47% 51% 58% 35% 5% 48% 2%21% 5% 2017 2020 New Fridge
Installations by Size(US & Canada) Small 2018Medium Large 20192 Chillers 3 Chillers

525 523 517 516 523 546 560 568 571 580 587 584
585 596 600 594 572 587 607 716 538 586 644 701 738 748 743 747 757 745 500.0450.0400.0 550.0 600.0 650.0 700.0 750.0 800.0 Freshpet Velocity$ / $MM ACV * Source: Nielsen Mega-Channel Data thru 12/26/20 Velocity
growth has surged COVID Crisis

647 648 644 640
639 660 687 684 687 682 678 695 706 715 722 731 737 749 762 788 709 739 785 814 826 824 796 803 802 775 550.0 600.0 650.0 700.0 750.0 800.0 850.0 Freshpet Total Distribution Points (TDP)Nielsen
Mega-Channel * Source: Nielsen Mega-Channel Data thru 12/26/20 Distribution is eroding behind out-of-stocks but 2ndFridges adding TDP’s vs. YA COVID Crisis

Q4 2020 e-commerce results: 23 Continued strong growth in e-commerce 33%Last Mile Delivery 56%Click
& Collect 11%Online Fresh Delivery >85% of e- commerce sales go through a Freshpet Fridge in Q4 Net sales +192% vs. YA e-commerce = 6.1% of sales
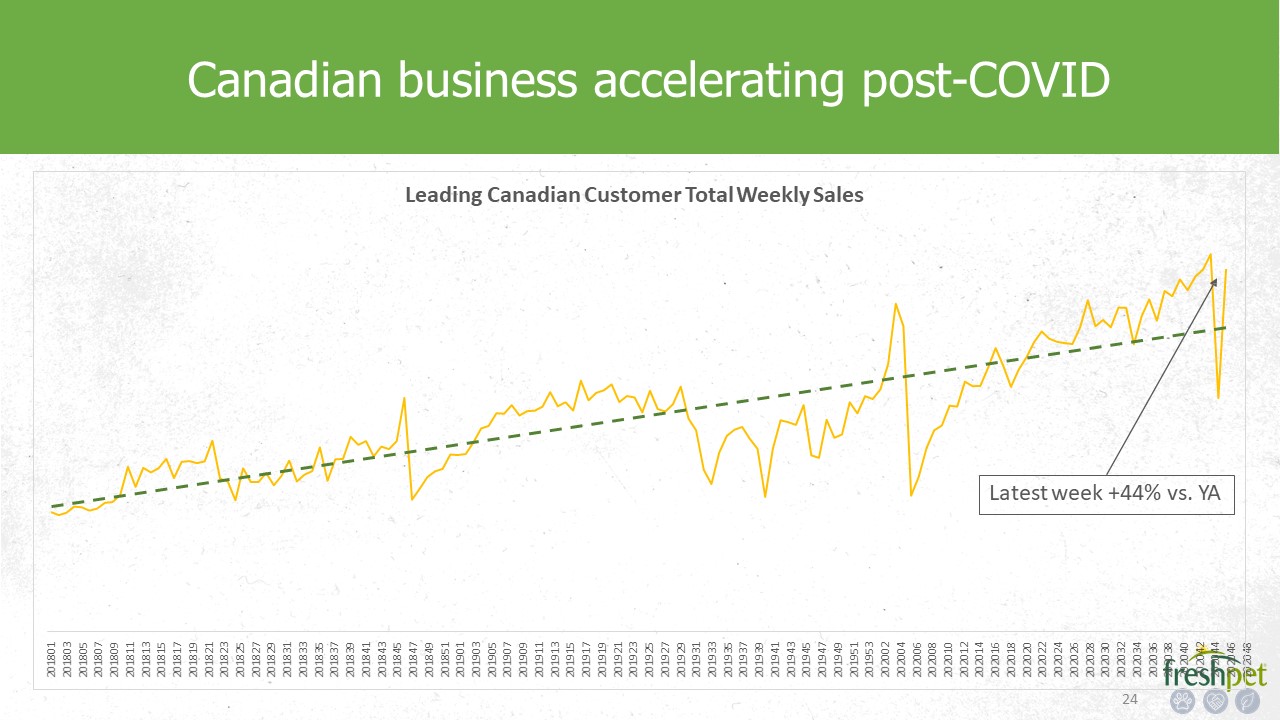
Leading Canadian Customer Total Weekly Sales Canadian business accelerating post-COVID 24 Latest
week +44% vs. YA
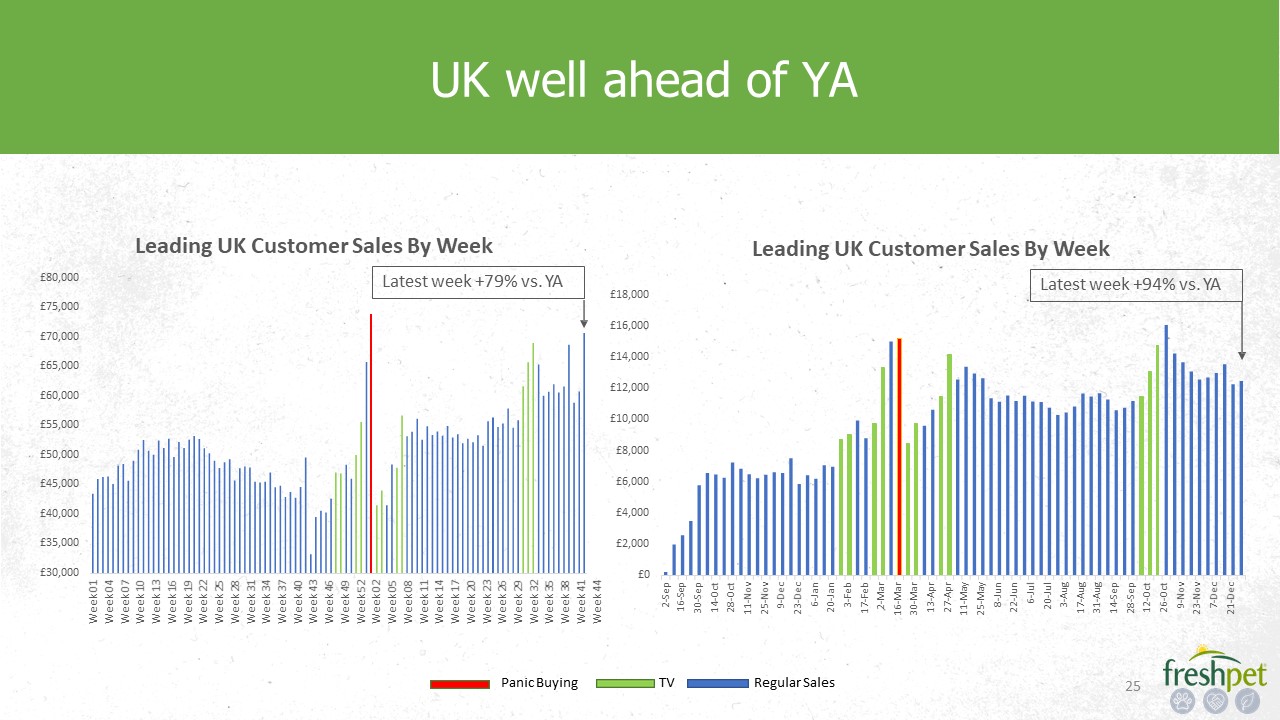
£0 £2,000 £4,000 £6,000 £8,000 £10,000 £12,000 £14,000 £16,000 £18,000 Leading UK Customer
Sales By Week £30,000 £35,000 £40,000 £45,000 £50,000 £55,000 £60,000 £65,000 £70,000 £75,000 £80,000 Leading UK Customer Sales By Week UK well ahead of YA Panic Buying TV Regular Sales Latest week +94% vs. YA Latest
week +79% vs. YA 25

2020 Net Sales & Adj. EBITDA

Q4 2020 Net Sales: Strong growth constrained by supply
limits 27 $65.8 $50.0$40.0$30.0$20.0 $60.0 $70.0 $80.0 $90.0 Q4 2019 Q4 2020 Freshpet Net Sales & Adj. EBITDA Performance$84.5 Net Sales ($ millions) +27% +29%
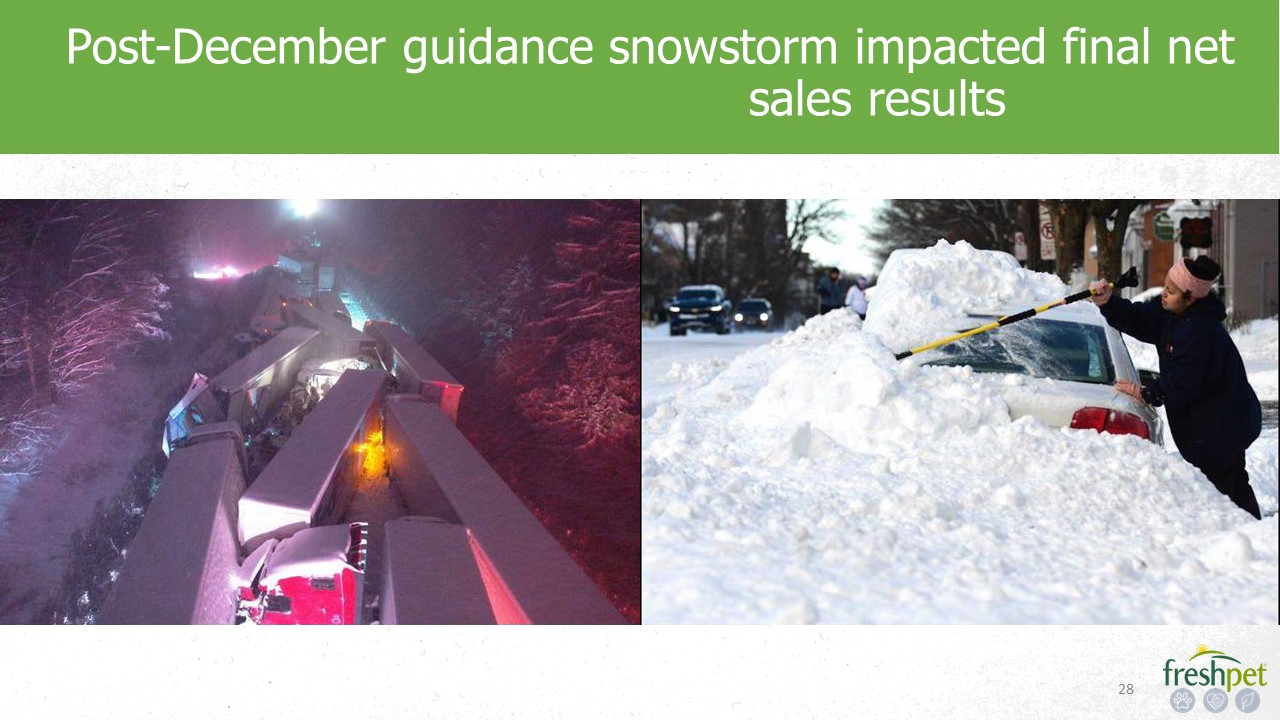
Post-December guidance snowstorm impacted final net sales results *
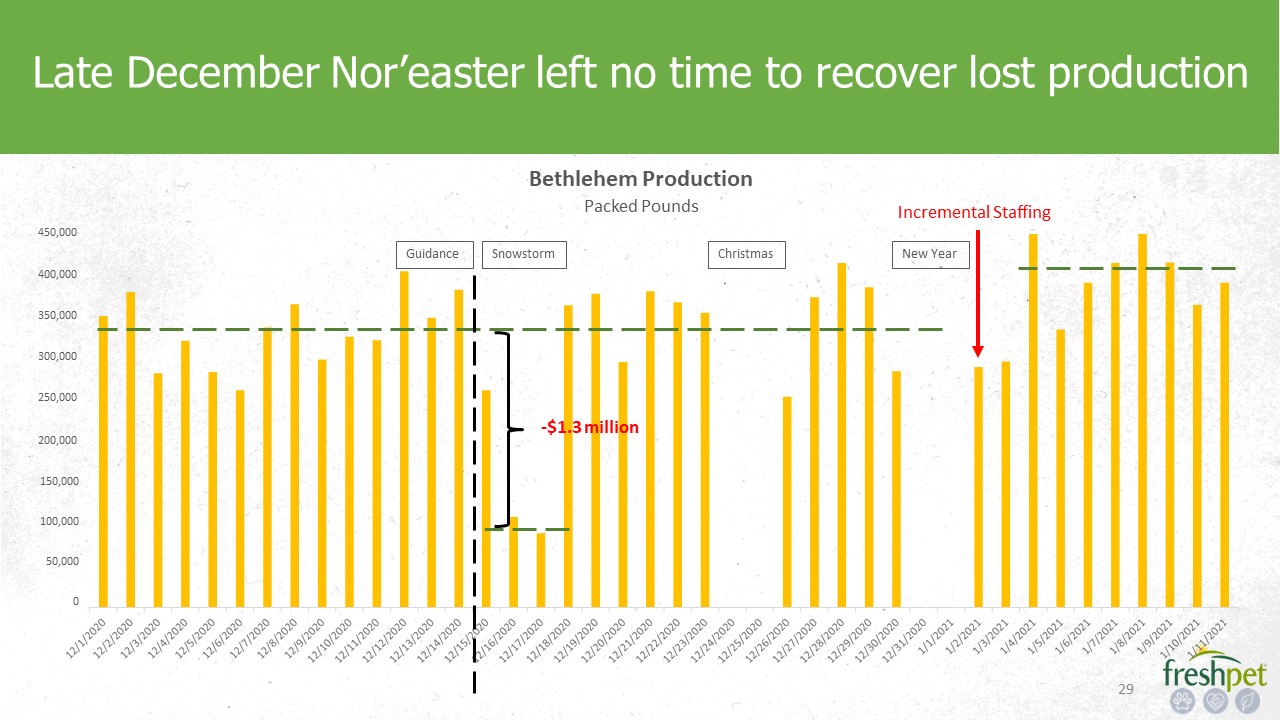
150,000100,00050,0000 200,000 400,000350,000300,000250,000 450,000 Bethlehem ProductionPacked
Pounds * Late December Nor’easter left no time to recover lost production Snowstorm Christmas Guidance Incremental Staffing New Year -$1.3 million
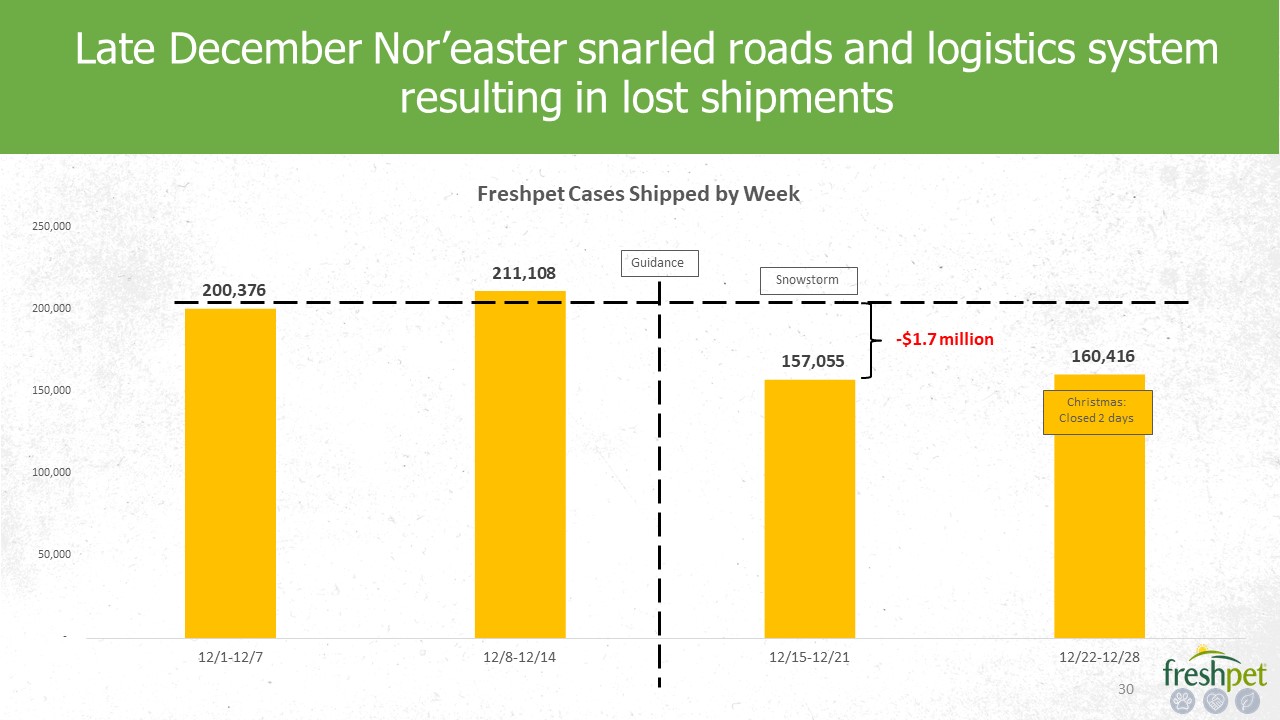
200,376 211,108 157,055 160,416 - 50,000 100,000 150,000 200,000 250,000 12/1-12/7 12/8-12/14 12/15-12/21 12/22-12/28 Freshpet
Cases Shipped by Week Late December Nor’easter snarled roads and logistics systemresulting in lost shipments * Snowstorm Christmas: Closed 2 days Guidance -$1.7 million

$4,000,000$2,000,000$- $6,000,000 $16,000,000$14,000,000$12,000,000$10,000,000$8,000,000 $18,000,000 Nielsen
XAOC Orders, Shipments & Consumption Carrying a large backlog of orders into Q1 2021 Snowstorm Drew down trade inventory by an incremental $7-8 million in Q4 Orders Grossed Up Shipments Gro ssed Up Nielsen XAOC Consumption 4
per. Mov. Avg. (Orders Grossed Up) 4 per. Mov. Avg. (Shipments Grossed Up)* Source: Nielsen Mega-Channel Data thru 12/26/20 and internal company data
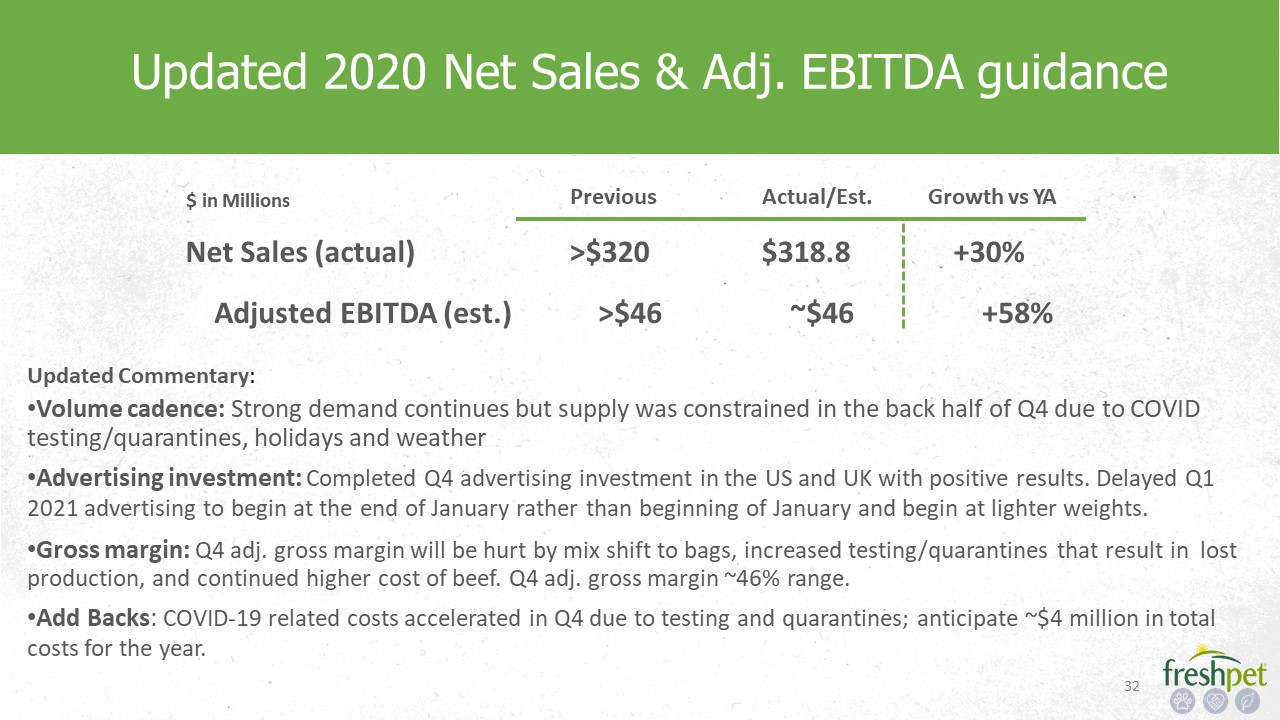
Updated 2020 Net Sales & Adj. EBITDA guidance Previous Actual/Est. Growth vs YA Net Sales
(actual) >$320 $318.8 +30% $ in Millions * Adjusted EBITDA (est.) >$46 ~$46 +58%Updated Commentary:Volume cadence: Strong demand continues but supply was constrained in the back half of Q4 due to COVID testing/quarantines,
holidays and weatherAdvertising investment: Completed Q4 advertising investment in the US and UK with positive results. Delayed Q12021 advertising to begin at the end of January rather than beginning of January and begin at lighter
weights.Gross margin: Q4 adj. gross margin will be hurt by mix shift to bags, increased testing/quarantines that result in lost production, and continued higher cost of beef. Q4 adj. gross margin ~46% range.Add Backs: COVID-19 related costs
accelerated in Q4 due to testing and quarantines; anticipate ~$4 million in totalcosts for the year.
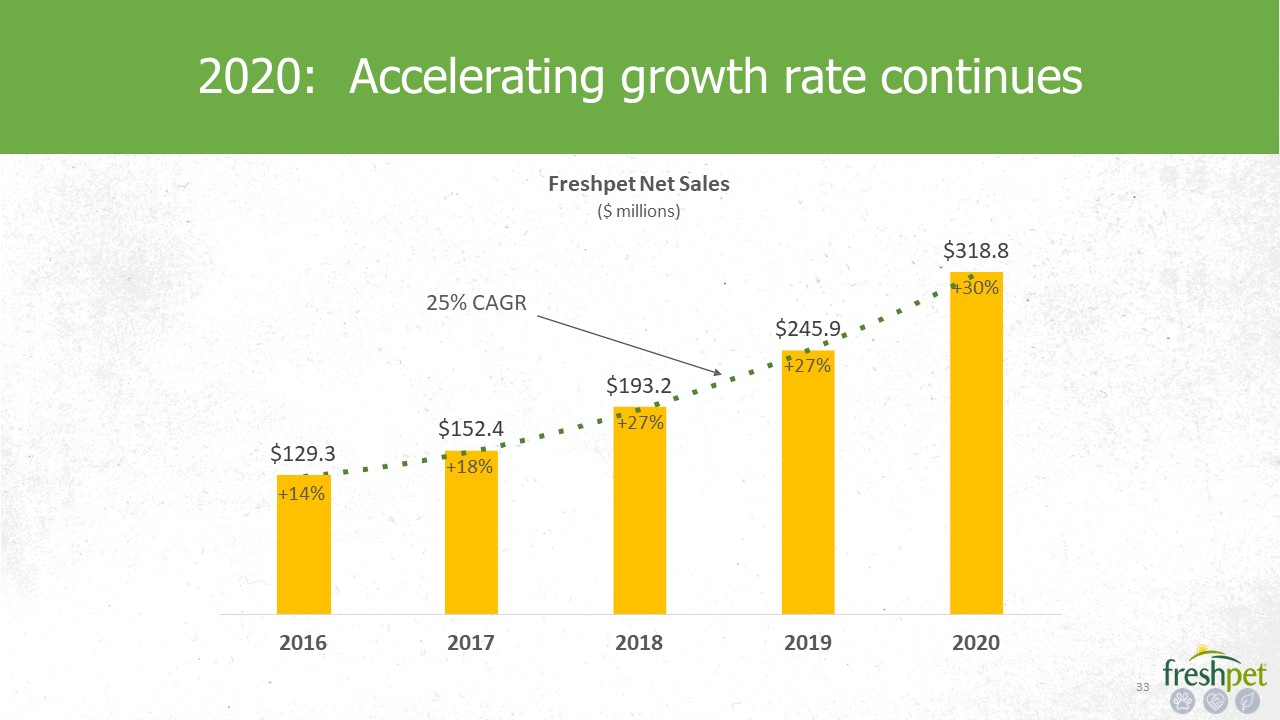
$129.3 $152.4 $193.2 $318.8 2016 2017 2018 2019 2020 Freshpet Net Sales($ millions) 2020:
Accelerating growth rate continues +18% +27% $245.9+27% +14% 25% CAGR +30% *
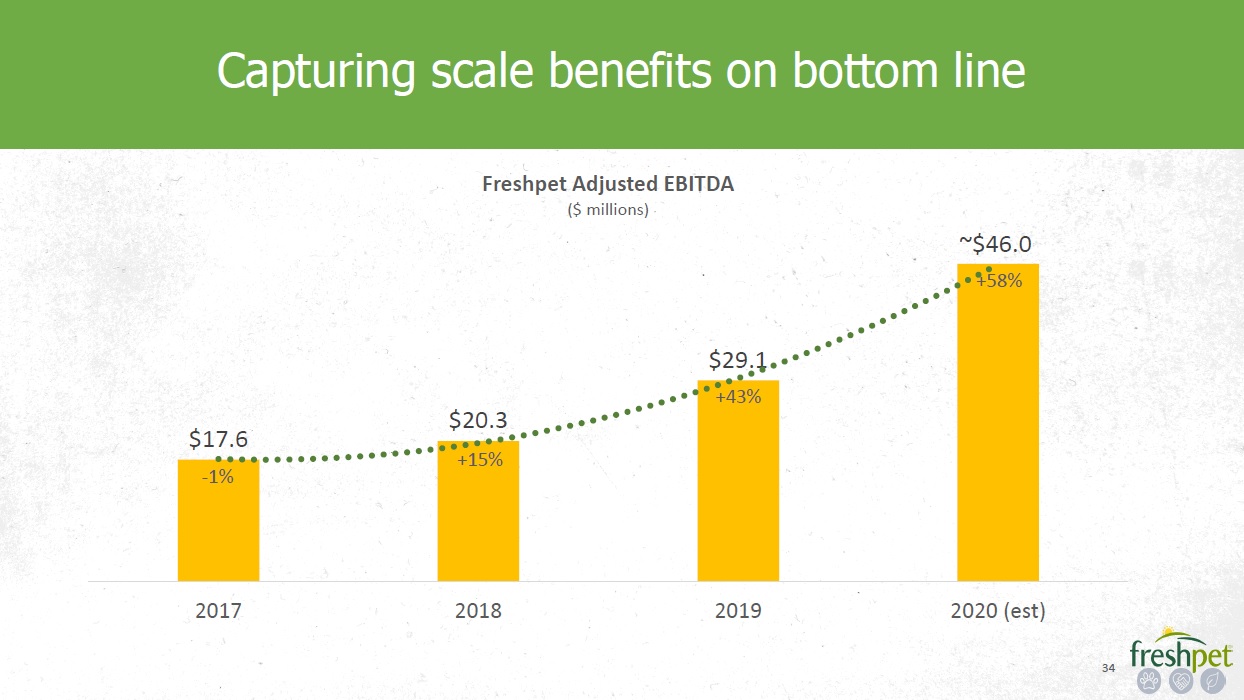
Capturing scale benefits on bottom line $17.6 * $20.3 2017 2018 2019 2020 (est) Freshpet
Adjusted EBITDA($ millions) +15% -1% $29 .1 +43% ~$46.0+58%

Growth Opportunity: Penetration and Buying Rate

In the early stages of accelerating consumer adoption Take-off Roger’s Diffusion of Innovation
ModelTotal Market Potential Rate of Consumer Adoption 12% of Prime Prospects using Core Dog products Current Prime Prospect net sales potential= $2 billion and growing 36

Demographic trends are working in our
favor 11% 34% 26% 26% 2% Boomer Builder 27% 31% 22% 18% 2% Boomer Builder 58% Gen Z Millennial Gen X Dog HHs 2025 Gen Z Millennial Gen X Dog HHs Today 45% 37 Source: Idexx, 2019 A&U, APPA

Addressable market: >20 million HH’s Prime Prospect Methodology Consumer ConceptPurchase Interest
Among Never UsersTop 2 Box purchase interest 2016 2019 7.5MMDog HHs 20MMDog HH’s 2016 2019 4MM 12MMDefinitely would buy 16MMProbably would buy 28MMDog HH’s 6MM 10MMDog HH’s 3.0x 2.6x 2.6x 38 Source: 2019 A&U

39 5 million more HH’s by
2025 1,779 1,913 2,177 2,537 3,186 3,558 8,1096,8245,7614,8834,158 2015 2016 2017 2018 2019 2020 2021 2022 2023 2024 2025 Freshpet HH Penetration('000's HH's)
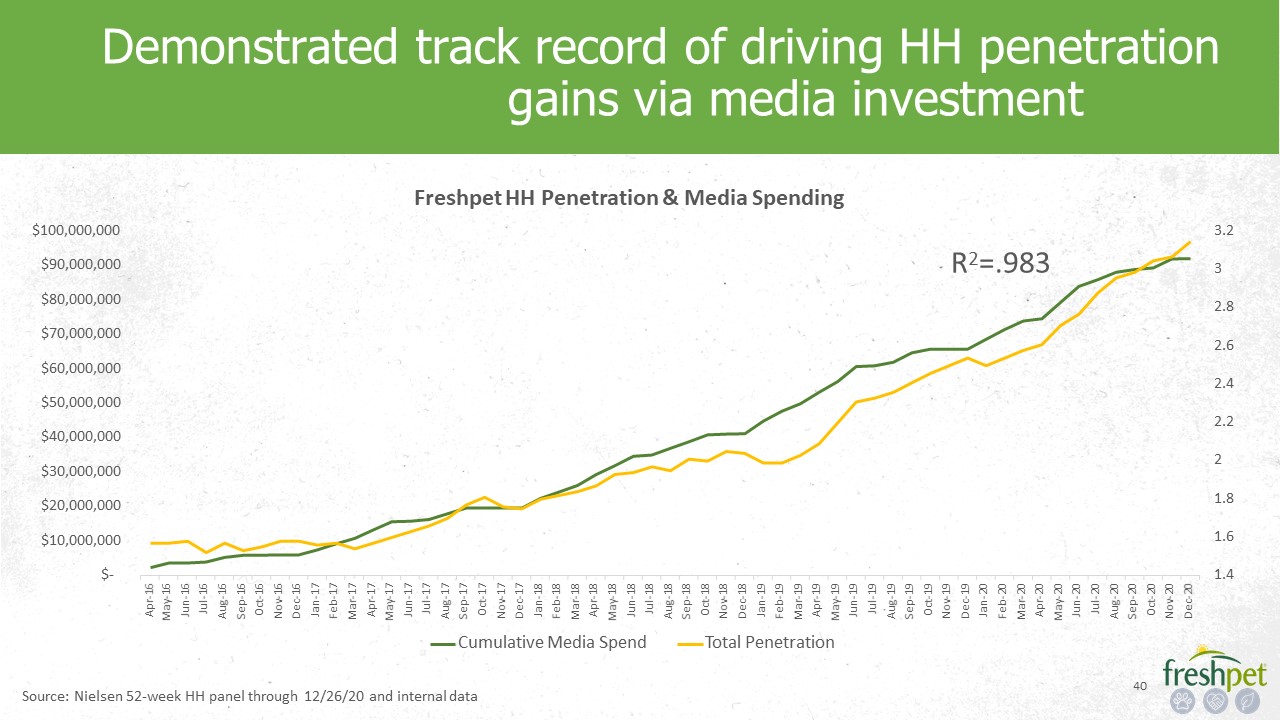
1.4 1.6 1.8 2 2.2 2.4 2.6 2.8 3 3.2 $- $10,000,000 $20,000,000 $30,000,000 $40,000,000 $50,000,000 $60,000,000 $70,000,000 $80,000,000 $90,000,000 $100,000,000 Freshpet
HH Penetration & Media Spending Cumulative Media Spend Total Penetration 40 Demonstrated track record of driving HH penetration gains via media investment R2=.983 Source: Nielsen 52-week HH panel through 12/26/20 and internal data
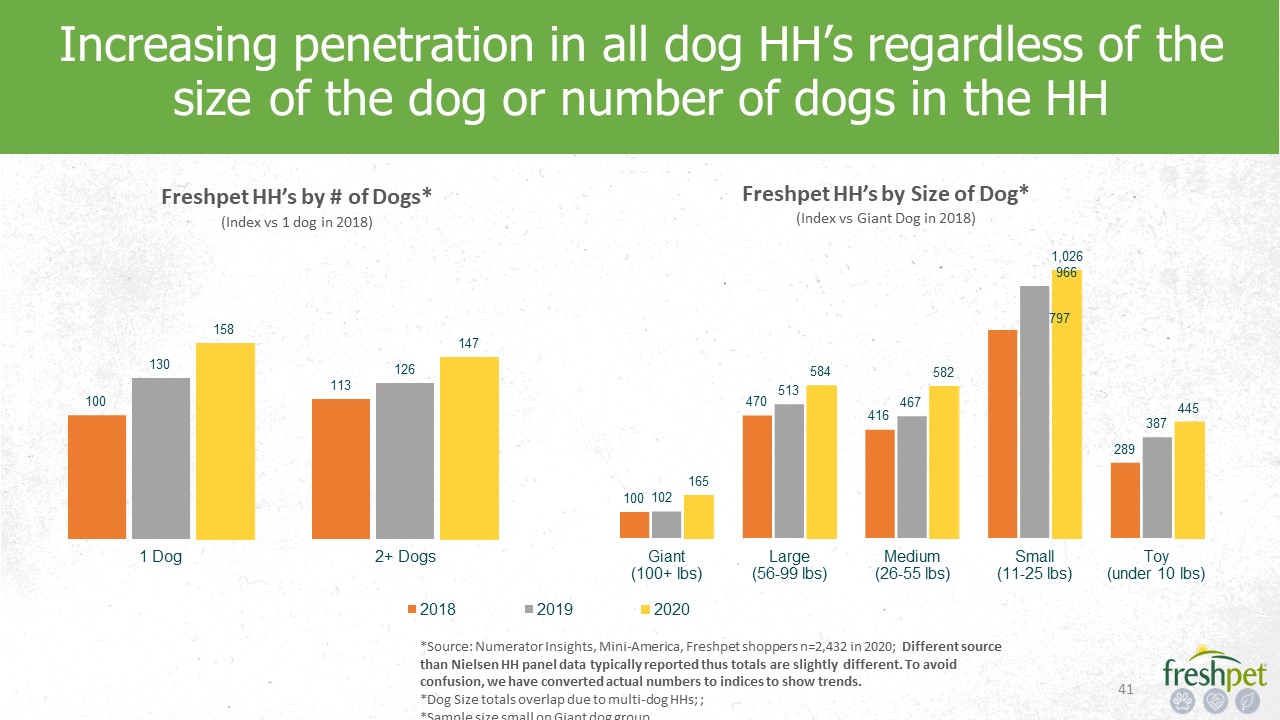
41 Increasing penetration in all dog HH’s regardless of thesize of the dog or number of dogs in the
HH 100 113 130 126 158 147 Freshpet HH’s by # of Dogs*(Index vs 1 dog in 2018) 2018 2019 2020*Source: Numerator Insights, Mini-America, Freshpet shoppers n=2,432 in 2020; Different source than Nielsen HH panel data typically reported
thus totals are slightly different. To avoid confusion, we have converted actual numbers to indices to show trends.*Dog Size totals overlap due to multi-dog HHs; ;*Sample size small on Giant dog group 470 416 289 513 467 387 165100
102 584 582 1,026966797 445 1 Dog 2+ Dogs Giant Large Medium Small Toy (100+ lbs) (56-99 lbs) (26-55 lbs) (11-25 lbs) (under 10 lbs) Freshpet HH’s by Size of Dog*(Index vs Giant Dog in 2018)

42 Halfway to our 2025 8 MM HH goal 4.0 4.0 Progress Towards 2025 HH Penetration Goal Current HH
Penetration 2025 Target HH Penetration Source: Nielsen HH Panel for the period ending 12/26/20
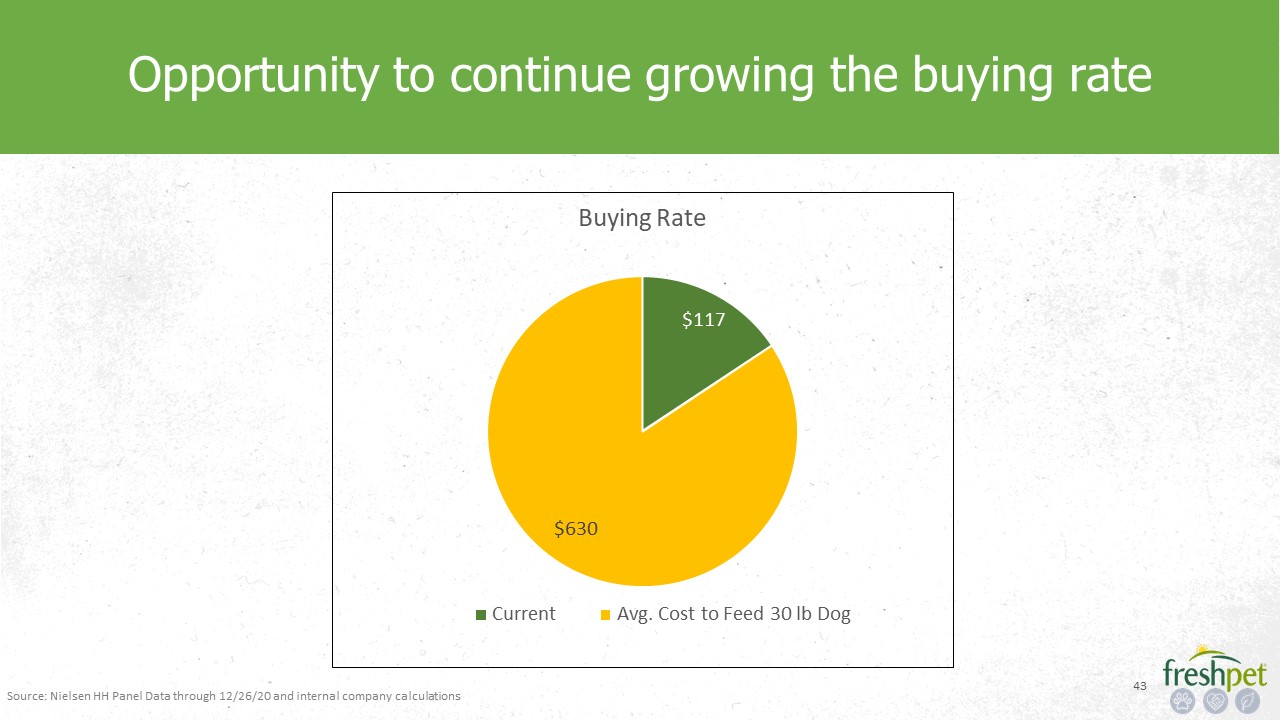
43 Opportunity to continue growing the buying rate $117 $630 Buying Rate Current Avg. Cost to
Feed 30 lb Dog Source: Nielsen HH Panel Data through 12/26/20 and internal company calculations
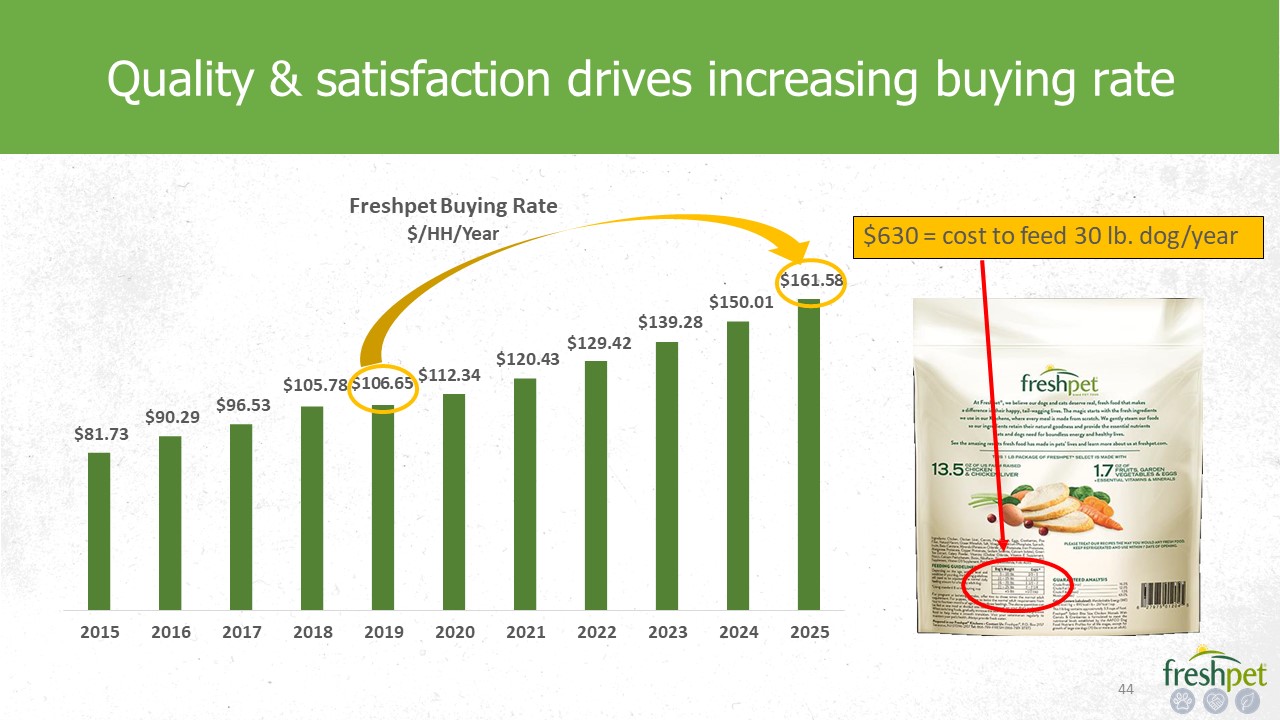
44 Quality & satisfaction drives increasing buying rate $81.73 $90.29 $96.53 $105.78 $106.65
$112.34 $120.43 $161.58$150.01$139.28$129.42 2015 2016 2017 2018 2019 2020 2021 2022 2023 2024 2025 Freshpet Buying Rate$/HH/Year $630 = cost to feed 30 lb. dog/year
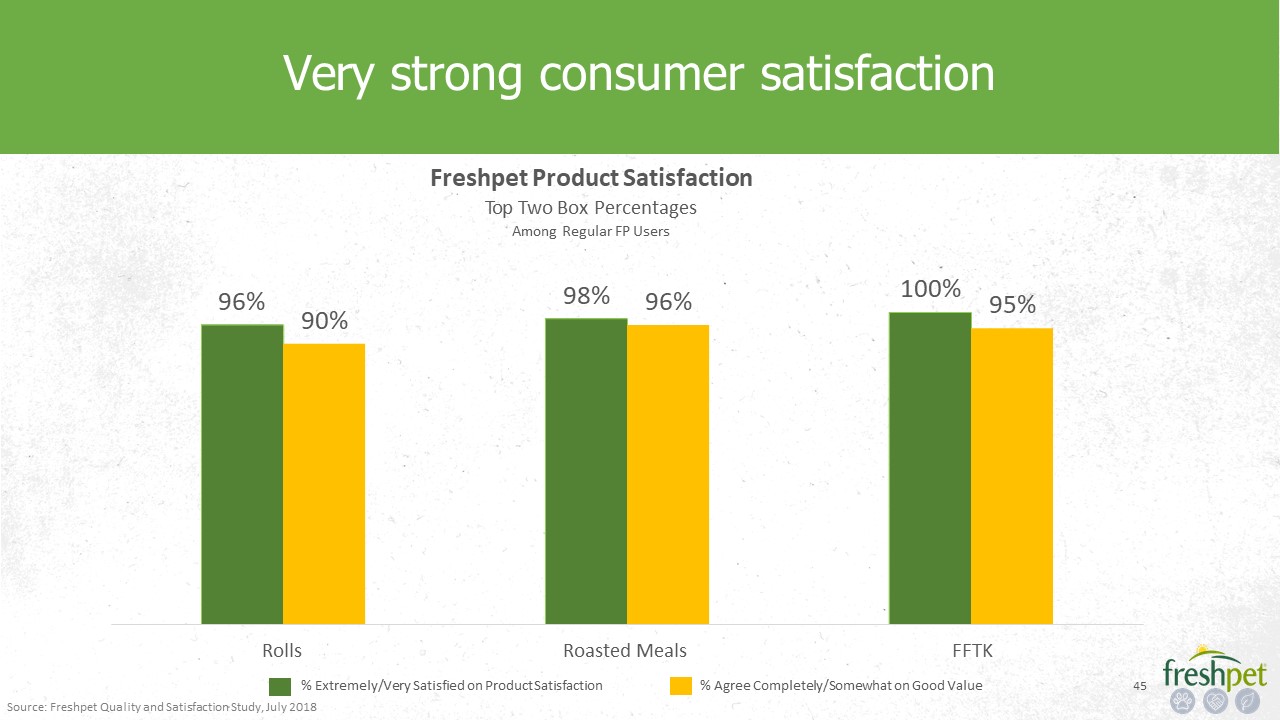
45 Very strong consumer satisfaction 96% 98% 100% 90% 96% 95% Freshpet Product SatisfactionTop
Two Box PercentagesAmong Regular FP Users FFTK% Agree Completely/Somewhat on Good Value Rolls Roasted Meals% Extremely/Very Satisfied on Product SatisfactionSource: Freshpet Quality and Satisfaction Study, July 2018
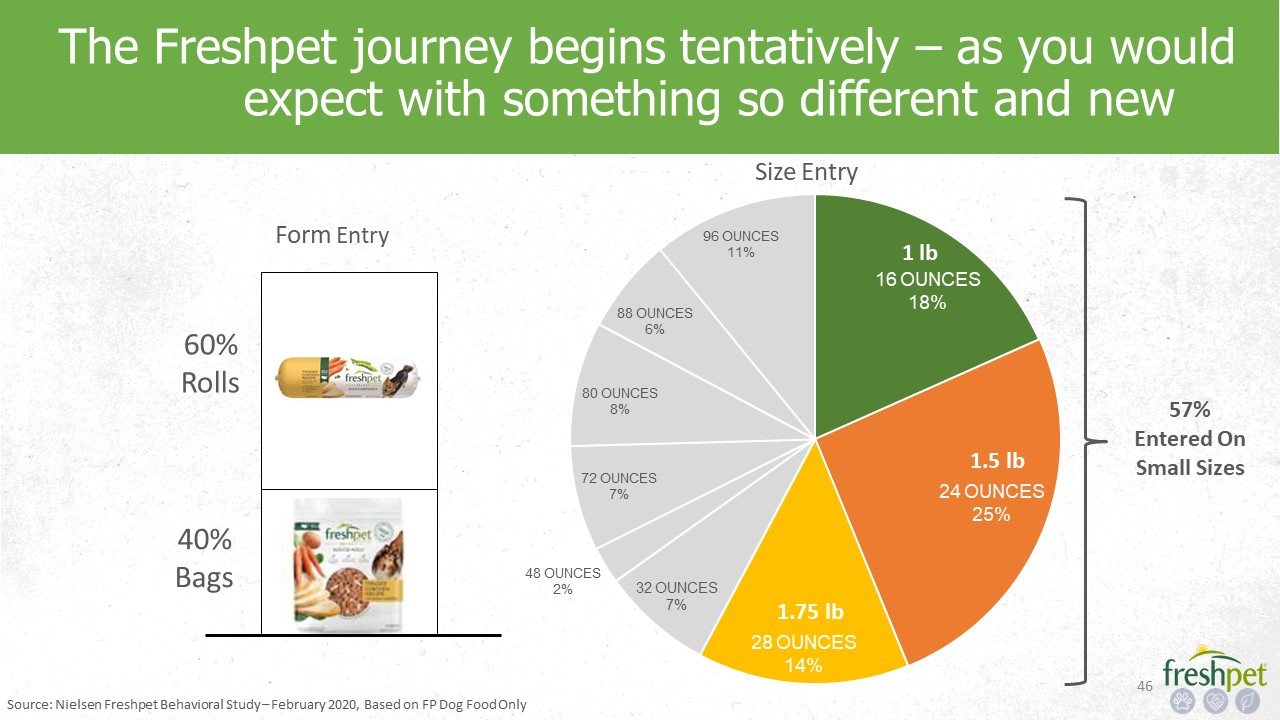
46 The Freshpet journey begins tentatively – as you would expect with something so different and
new 40% 60% Form Entry 32 OUNCES7% 48 OUNCES2% 72 OUNCES7% 80 OUNCES8% 88 OUNCES6% 96 OUNCES11% Size Entry Source: Nielsen Freshpet Behavioral Study – February 2020, Based on FP Dog Food Only 1 lb16 OUNCES18% 1.5 lb24
OUNCES25% 1.75 lb28 OUNCES14% 57%Entered On Small Sizes 40%Bags 60%Rolls
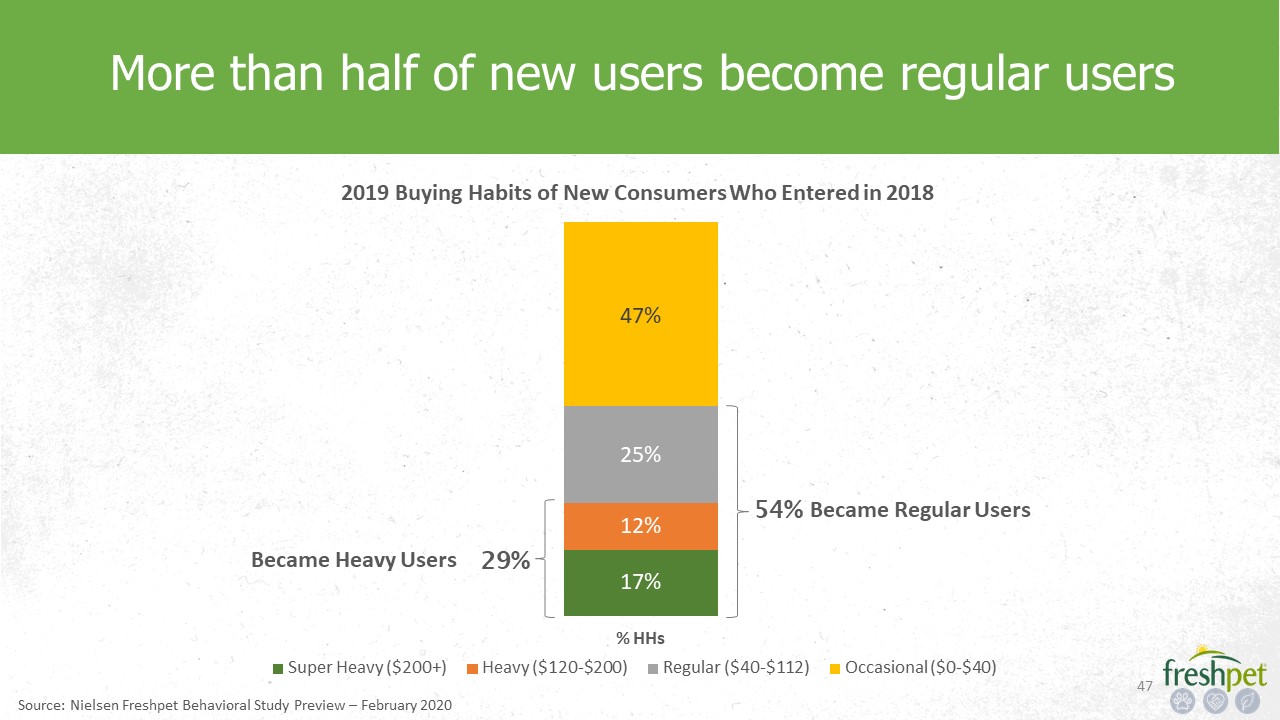
47% 25% 12% 17% % HHs 2019 Buying Habits of New Consumers Who Entered in 2018 Super Heavy
($200+) Heavy ($120-$200) Regular ($40-$112) Occasional ($0-$40) 47 More than half of new users become regular users Source: Nielsen Freshpet Behavioral Study Preview – February 2020 29% Became Heavy Users 54% Became Regular Users
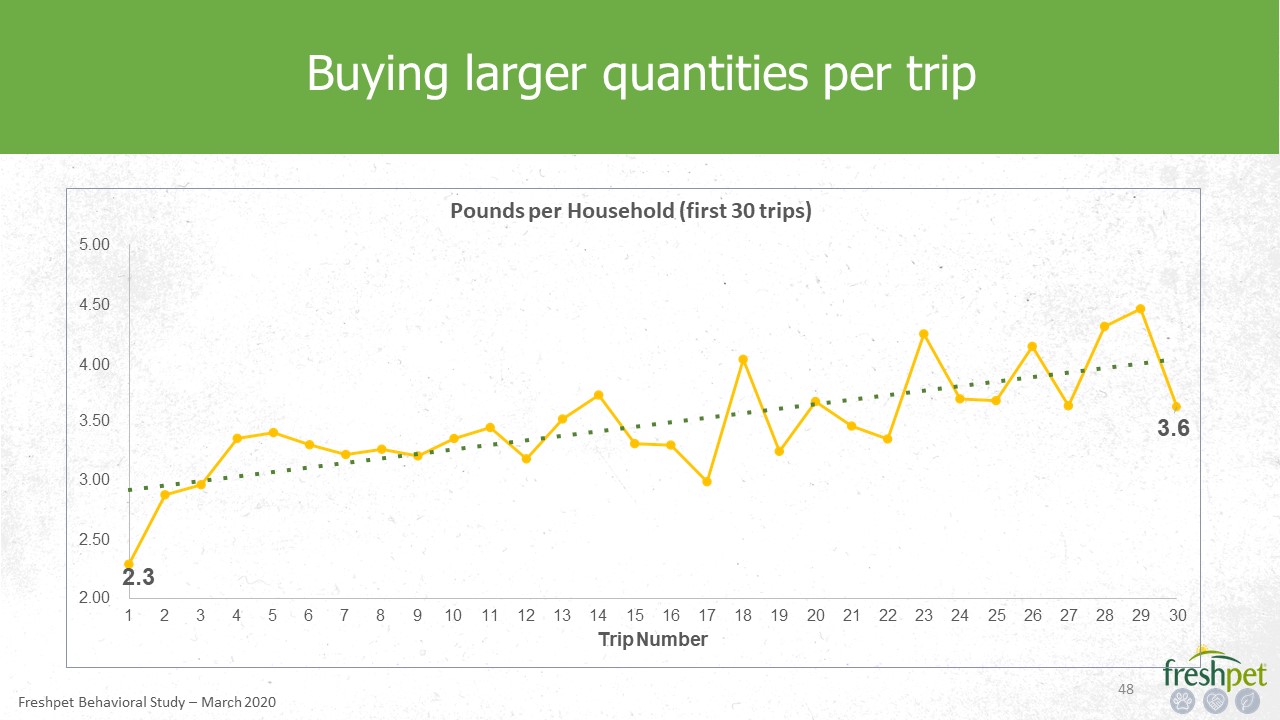
48 Buying larger quantities per
trip 2.3 3.6 3.002.50 3.50 5.004.504.00 2.00 1 2 3 4 5 6 7 8 9 10 11 12 13 14 15 16 17 18 19 20 21 22 23 24 25 26 27 28 29 30 Trip
Number Pounds per Household (first 30 trips) Freshpet Behavioral Study – March 2020
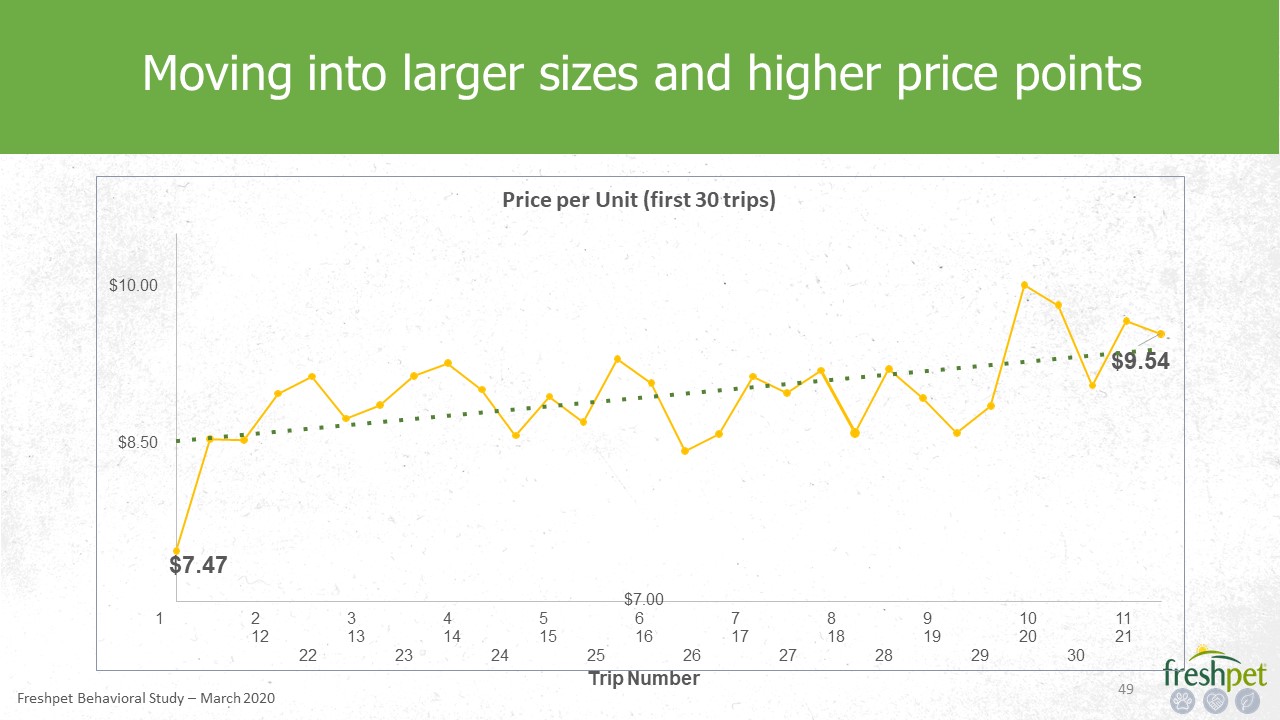
Moving into larger sizes and higher price
points $7.47 $9.54 $8.50 $10.00 $7.001 2 3 4 5 6 7 8 9 10 11 12 13 14 15 16 17 18 19 20 21 22 23 24 25 26 27 28 29 30Trip Number Price per Unit (first 30 trips) 49 Freshpet
Behavioral Study – March 2020

50 Steady increase in dollars spent per
trip $8.96 $12.11 $9.00 $11.00$10.00 $12.00 $16.00$15.00$14.00$13.00 $8.00$7.001 2 3 4 5 6 7 8 9 10 11 12 13 14 15 16 17 18 19 20 21 22 23 24 25 26 27 28 29 30Trip Number Dollars per Household (first 30 trips) Freshpet Behavioral
Study – March 2020

100 242 113 266 125 297 263 256 143 335 244 294 163 2016 Cohort 2017 Cohort 2018 Cohort
2019 Cohort 2020 Cohort Freshpet Core Dog New Buyers - Dollar Buy Rate Evolution(Index vs. 2016 New Buyers)366 Cohort buying rate data confirms significant multi-year growth potential of each new
user +142% +135% +14% +14% +10% +13% +23% 258 +15% +7% +105% -5% +104% +28% -1% Year 1 Year 2 Year 3 Year 4 Year 5 * Source: Nielsen New Buyer Analysis, 2020
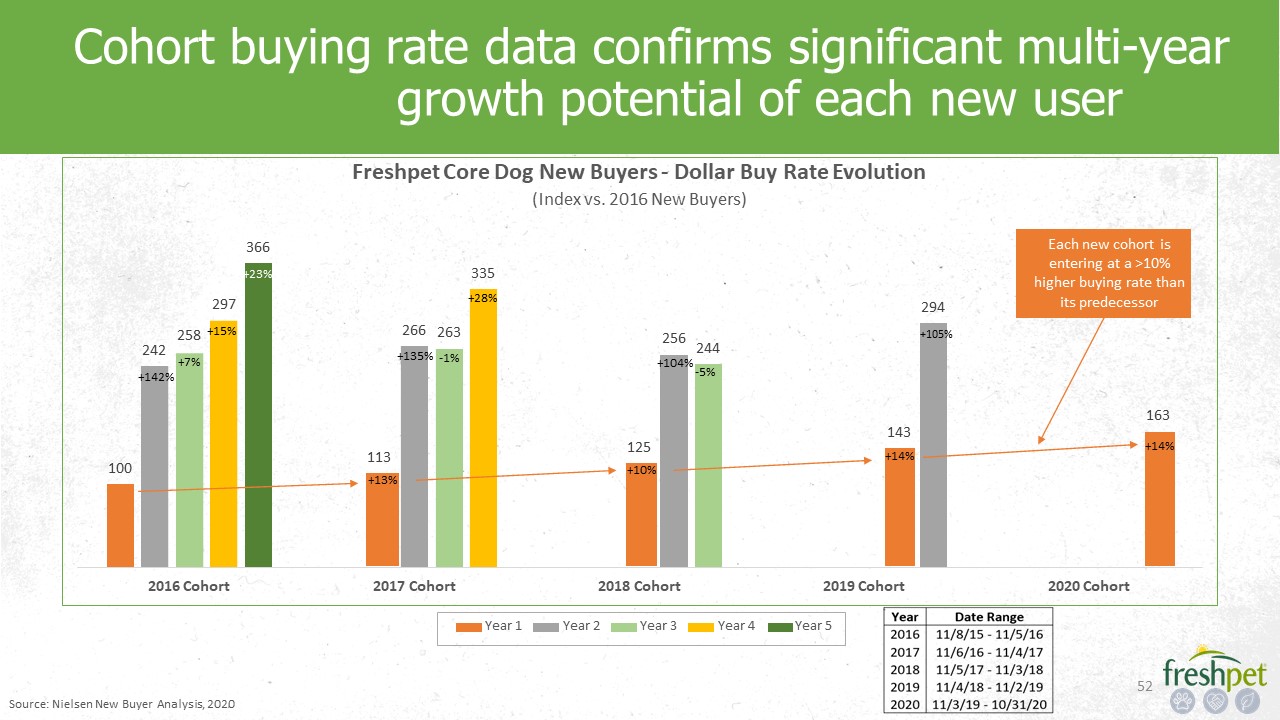
100 242 113 266 125 297 263 256 143 366 335 244 294 163 2016 Cohort 2017 Cohort 2018
Cohort 2019 Cohort 2020 Cohort Freshpet Core Dog New Buyers - Dollar Buy Rate Evolution(Index vs. 2016 New Buyers) Cohort buying rate data confirms significant multi-year growth potential of each new
user +142% +14% +14% +10% +13% +23% 258 +15% +7% +105% -5% +104% +28% +135% -1% Each new cohort is entering at a >10% higher buying rate than its predecessor Year 1 Year 2 Year 3 Year 4 Year 5 * Source: Nielsen New Buyer
Analysis, 2020
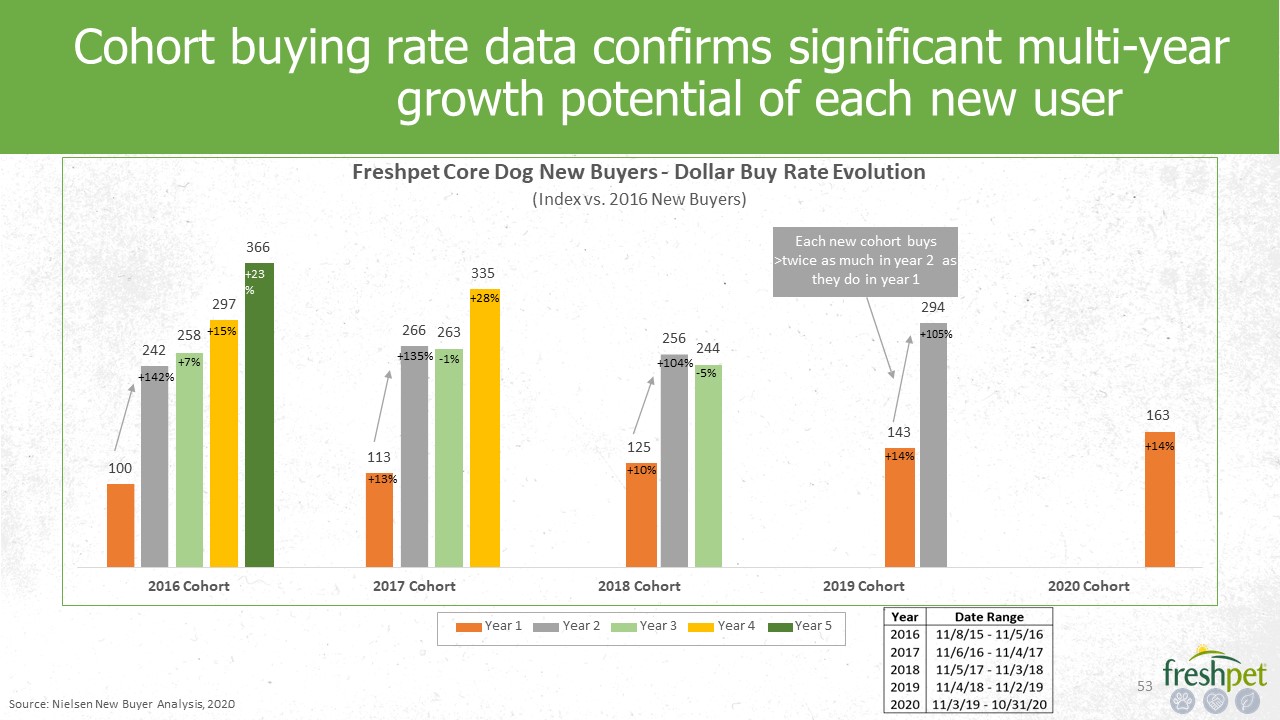
100 242 113 266 125 297 263 256 143 366 335 244 294 163 2016 Cohort 2017 Cohort 2018
Cohort 2019 Cohort 2020 Cohort Freshpet Core Dog New Buyers - Dollar Buy Rate Evolution(Index vs. 2016 New Buyers) Cohort buying rate data confirms significant multi-year growth potential of each new
user +142% +135% +14% +14% +10% +13% +23% 258 +15% +7% +105% -5% +104% +28% -1% Each new cohort buys>twice as much in year 2 as they do in year 1 Year 1 Year 2 Year 3 Year 4 Year 5 * Source: Nielsen New Buyer Analysis,
2020
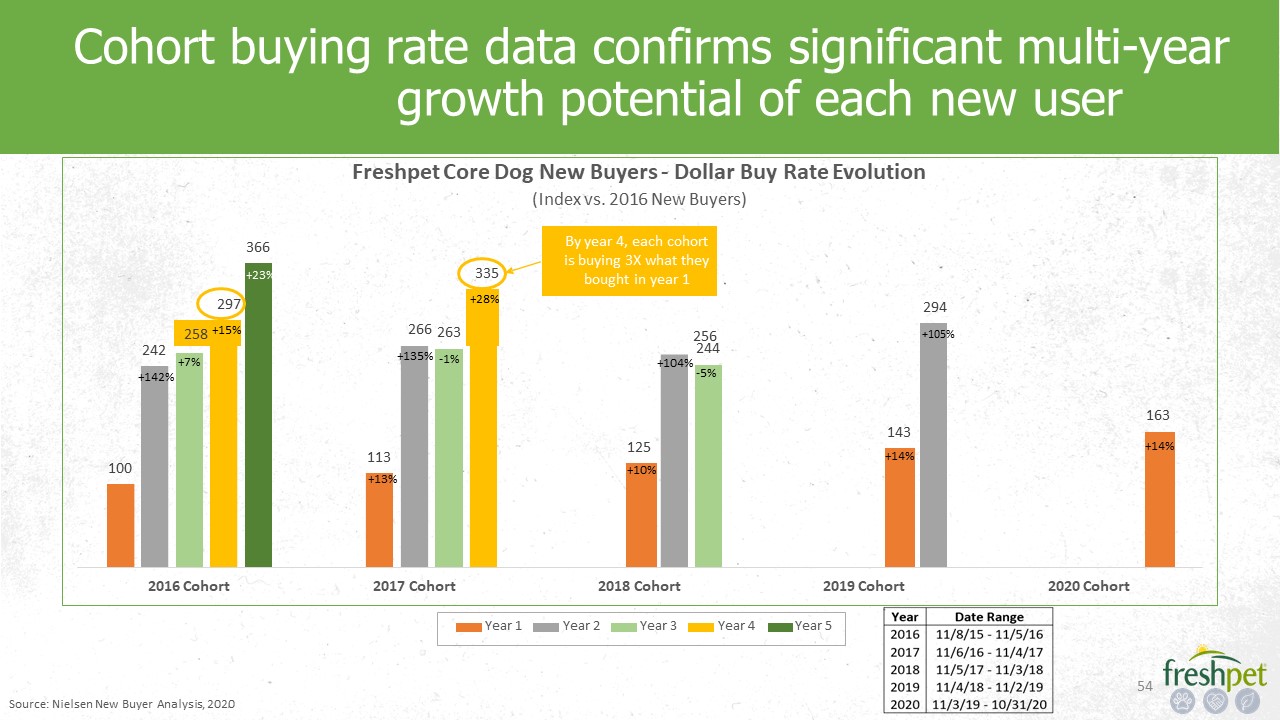
100 242 113 125 143 244 163 2016 Cohort 2017 Cohort 2018 Cohort 2019 Cohort 2020
Cohort Freshpet Core Dog New Buyers - Dollar Buy Rate Evolution(Index vs. 2016 New Buyers) Cohort buying rate data confirms significant multi-year growth potential of each new
user +142% +135% +14% +14% +10% +13% +7% -5% +104% -1% 366+23% 335 By year 4, each cohort is buying 3X what they bought in year 1 297 +28% 294 258 +15% 266 263 256 +105% Year 1 Year 2
Year 3 Year 4 Year 5 * Source: Nielsen New Buyer Analysis, 2020
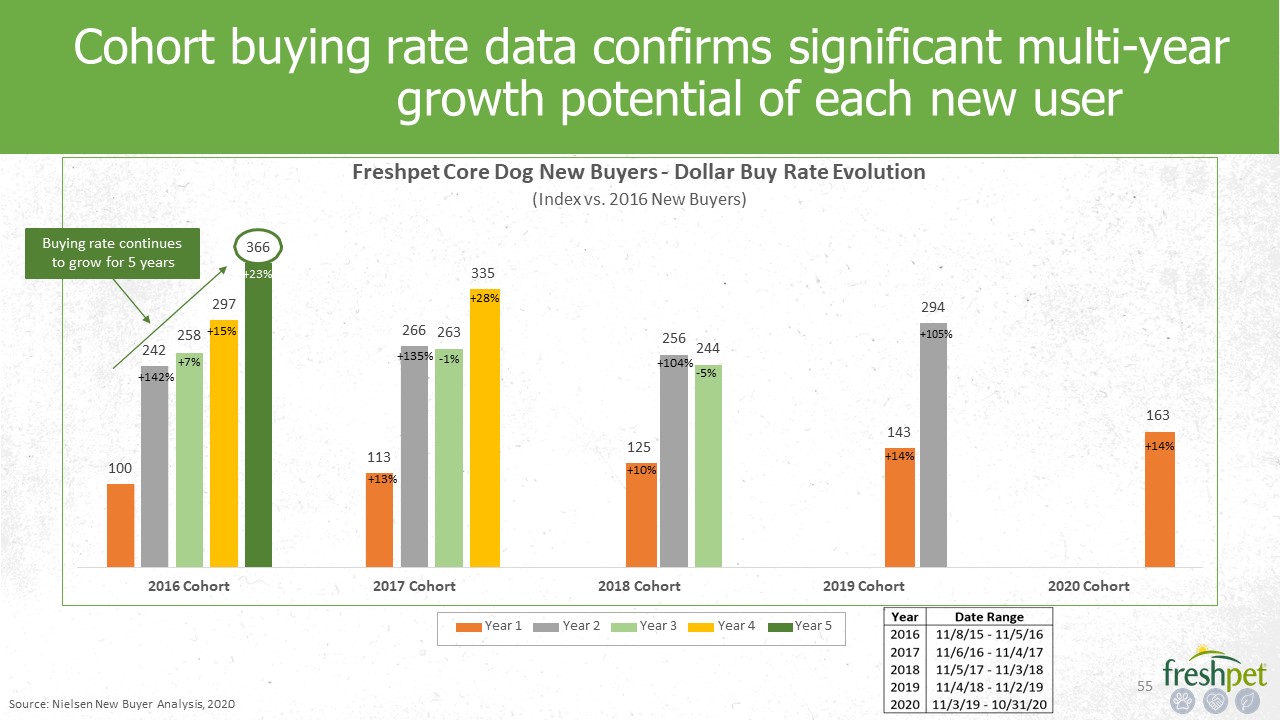
100 242 113 266 125 297 263 256 143 366 335 244 294 163 2016 Cohort 2017 Cohort 2018
Cohort 2019 Cohort 2020 Cohort Freshpet Core Dog New Buyers - Dollar Buy Rate Evolution(Index vs. 2016 New Buyers) Cohort buying rate data confirms significant multi-year growth potential of each new
user +142% +135% +14% +14% +10% +13% +23% 258 +15% +7% +105% -5% +104% +28% -1% Buying rate continues to grow for 5 years Year 1 Year 2 Year 3 Year 4 Year 5 * Source: Nielsen New Buyer Analysis, 2020
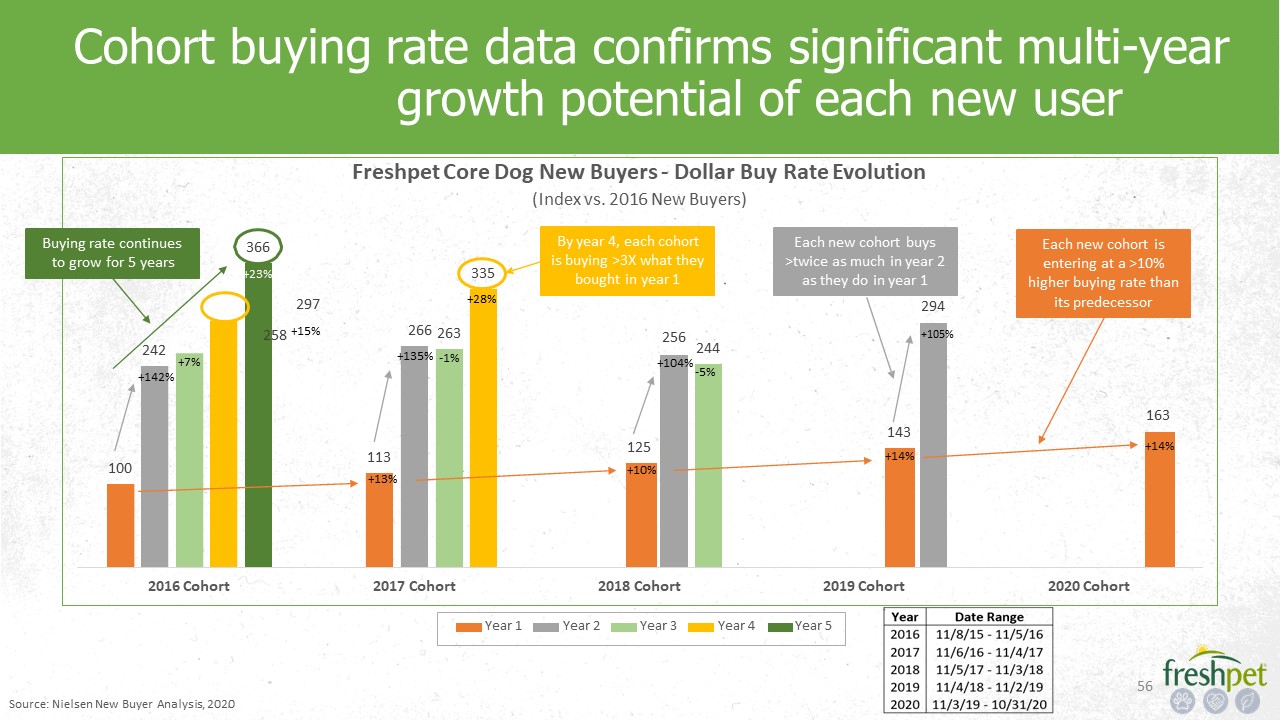
100 242 113 125 143 366 335 244 163 2016 Cohort 2017 Cohort 2018 Cohort 2019 Cohort 2020
Cohort Freshpet Core Dog New Buyers - Dollar Buy Rate Evolution(Index vs. 2016 New Buyers) Cohort buying rate data confirms significant multi-year growth potential of each new
user +142% +14% +14% +10% +13% +23% +7% -5% +104% 297 +28% 294 258 +15% 266 263 256 +105% +135% -1% Each new cohort is entering at a >10% higher buying rate than its predecessor Each new cohort buys>twice as much in
year 2 as they do in year 1 By year 4, each cohort is buying >3X what they bought in year 1 Buying rate continues to grow for 5 years Year 1 Year 2 Year 3 Year 4 Year 5 * Source: Nielsen New Buyer Analysis, 2020
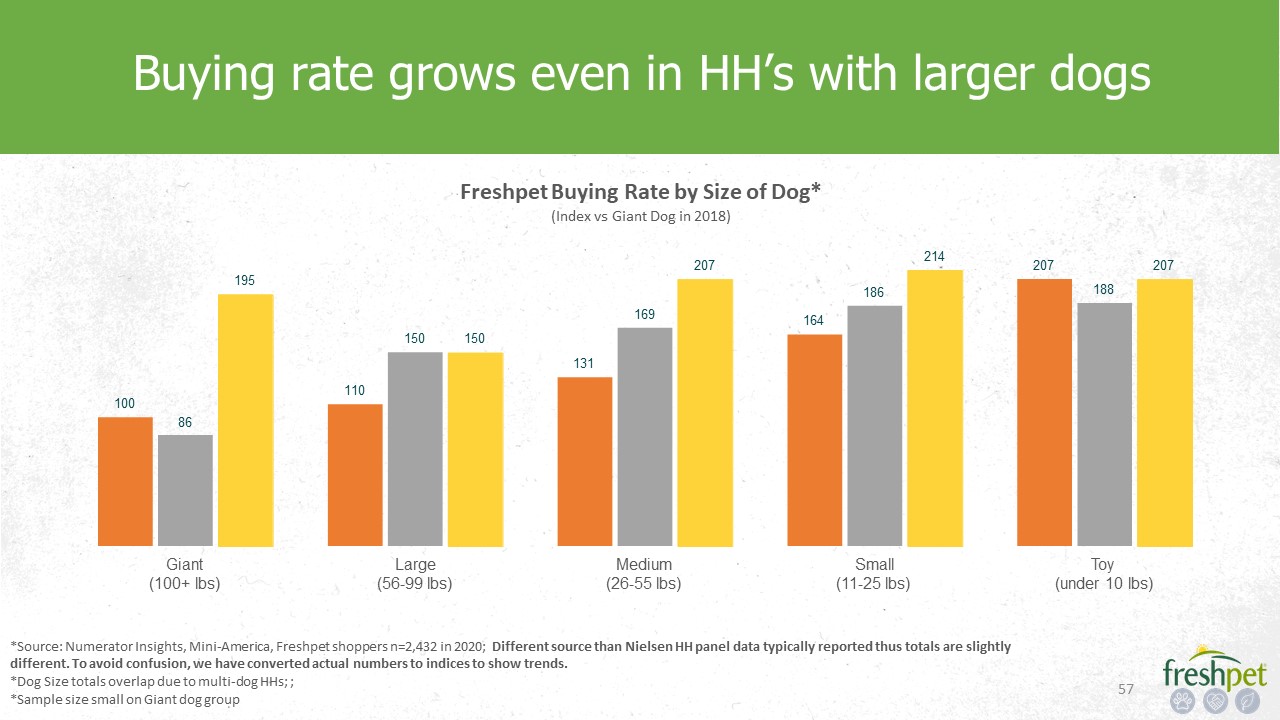
57 Buying rate grows even in HH’s with larger dogs *Source: Numerator Insights, Mini-America,
Freshpet shoppers n=2,432 in 2020; Different source than Nielsen HH panel data typically reported thus totals are slightly different. To avoid confusion, we have converted actual numbers to indices to show trends.*Dog Size totals overlap due
to multi-dog HHs; ;*Sample size small on Giant dog group 110 131 164 207 10086 150 169 186 188 195 150 207 214 207 Giant (100+ lbs) Large (56-99 lbs) Medium (26-55 lbs) Small (11-25 lbs) Toy (under 10 lbs) Freshpet Buying
Rate by Size of Dog*(Index vs Giant Dog in 2018)

58 Conclusions Strong and increasingly efficient ability to drive HH penetrationHH penetration growth
accelerating into mid-20% rangePenetration remains very low – with significant upsideMedia investment reduced to fit within capacity constraints; at 12% of sales, we expect stronger growth in penetrationCAC has gone down each year for >5
consecutive yearsBuying rate is growing strongly but is obscured by number of new buyersSustained mid-teen buying rate growth for existing users is well in excess of our long-term volume forecastsBuying rate gains continuing for 5 consecutive
years is well in excess of our long-term volume forecastsCombined, these two pieces of data suggest the long-term Freshpet opportunity is larger than previously projectedWe are not revising 2025 target at this time but planning to protect the
high side from a capacity perspectiveBuilding plans to deliver the high side if market opportunity is proven

Capacity
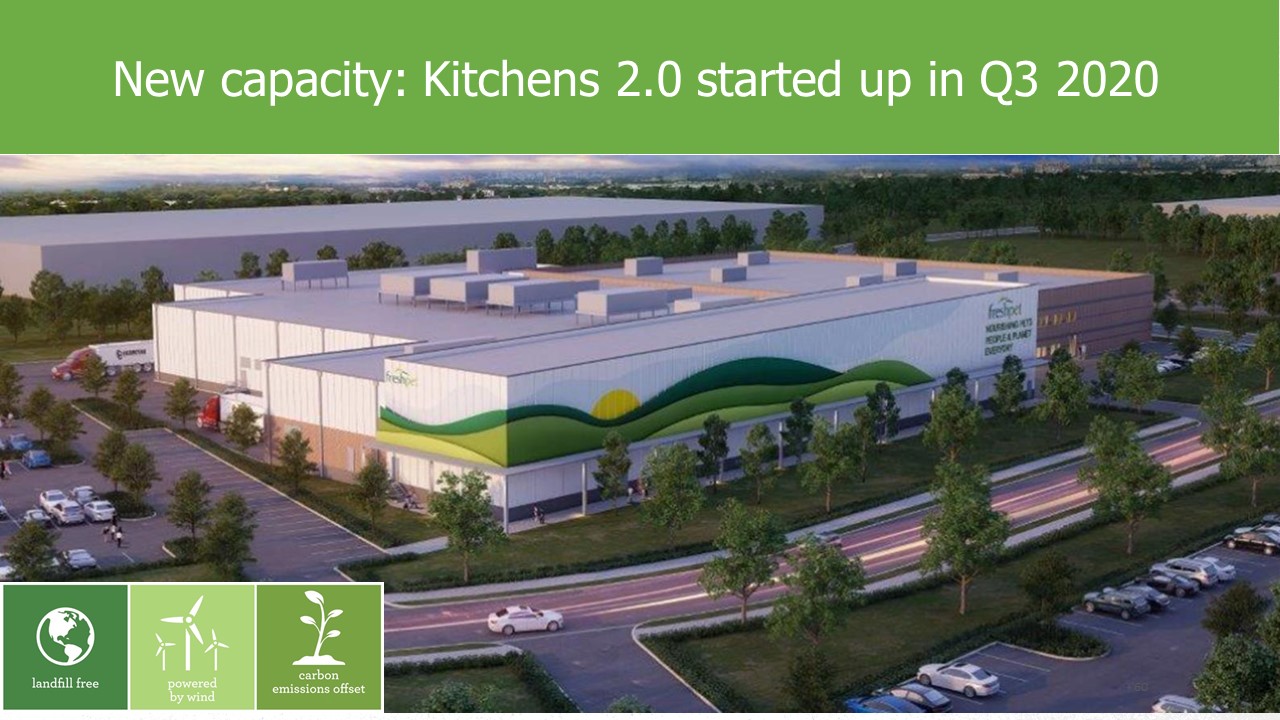
New capacity: Kitchens 2.0 started up in Q3 2020 *
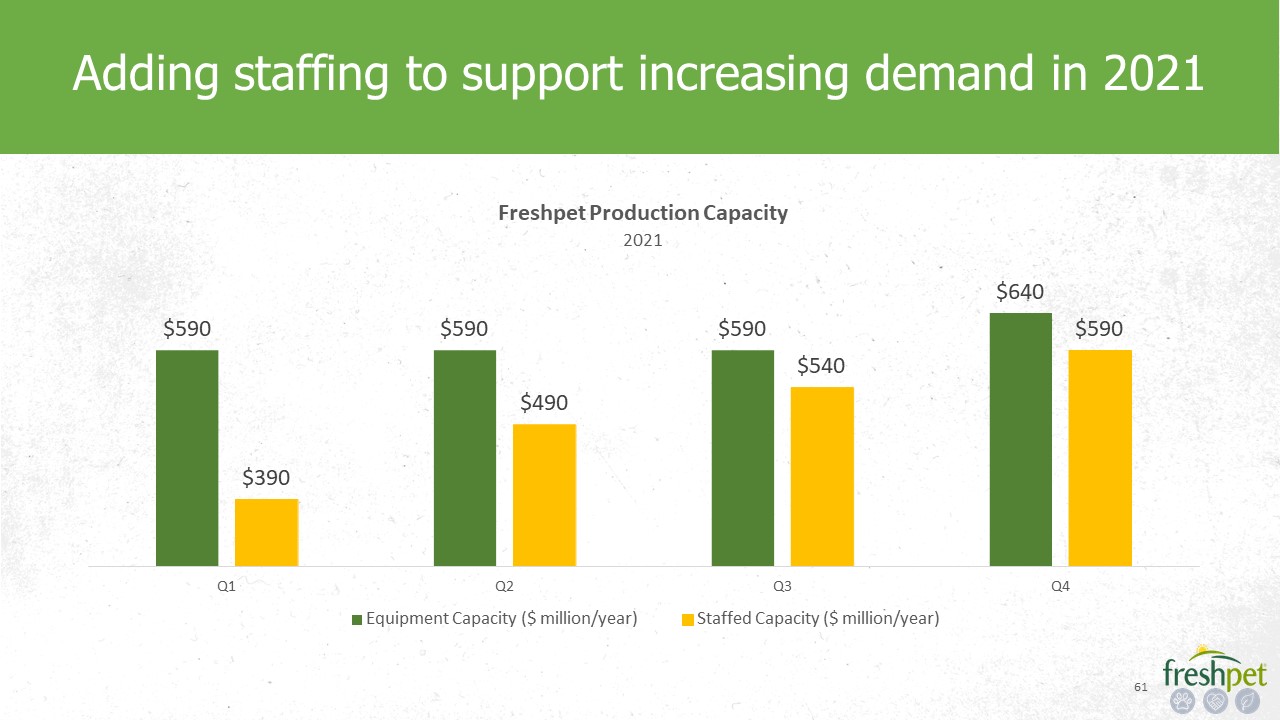
Adding staffing to support increasing demand in
2021 $590 $590 $590 $640 $390 $490 $540 $590 Q1 Q2 Q3 Q4 Freshpet Production Capacity2021 Equipment Capacity ($ million/year) Staffed Capacity ($ million/year) *

62 Kitchens 3.0 in Ennis, TX is on track Phase 1 scheduled to begin production in mid-2022* *Could
pull start-up forward by one quarter through increased investment to meet higher levels of demand
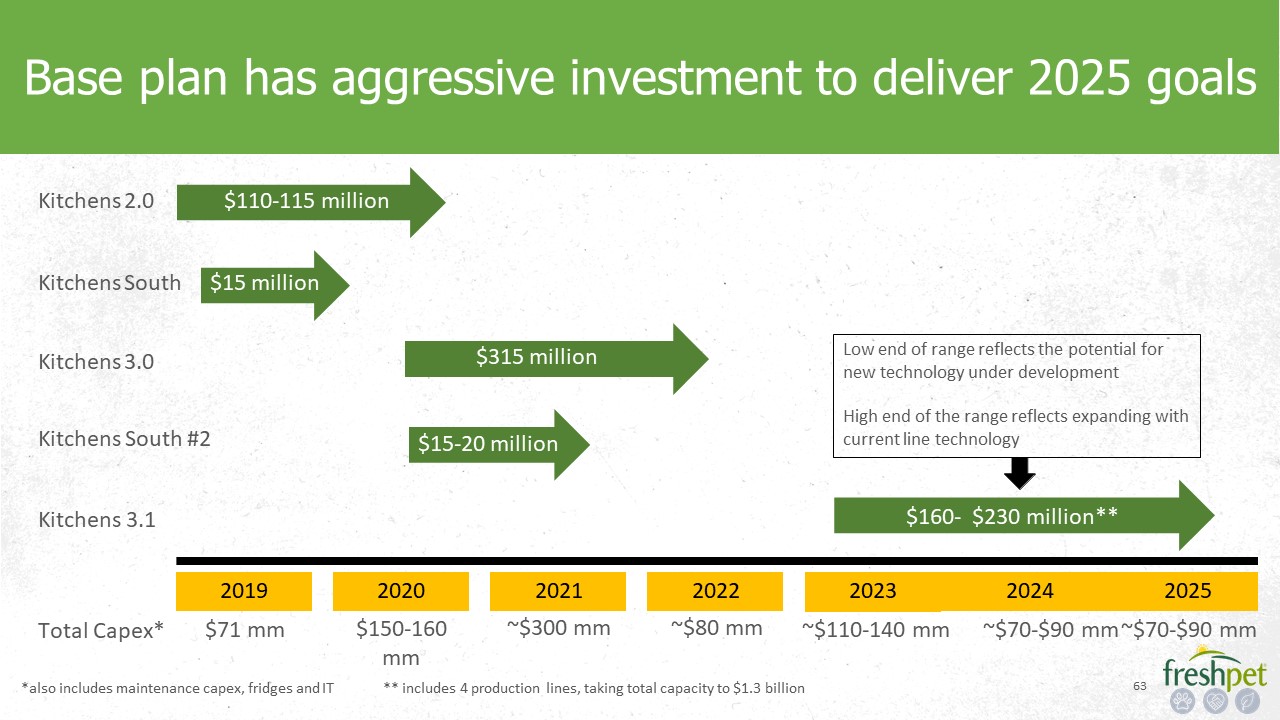
63 Base plan has aggressive investment to deliver 2025 goals $110-115 million Kitchens 2.0 $15
million Kitchens South Kitchens 3.0 $315 million Kitchens South #2 $15-20 million *also includes maintenance capex, fridges and IT Kitchens 3.1 $160- $230
million** 2019 2020 2021 2022 2023 2024 2025 Total Capex* $71 mm $150-160 mm ~$300 mm ~$80 mm ~$110-140 mm ~$70-$90 mm ~$70-$90 mm ** includes 4 production lines, taking total
capacity to $1.3 billion Low end of range reflects the potential for new technology under development High end of the range reflects expanding with current line technology
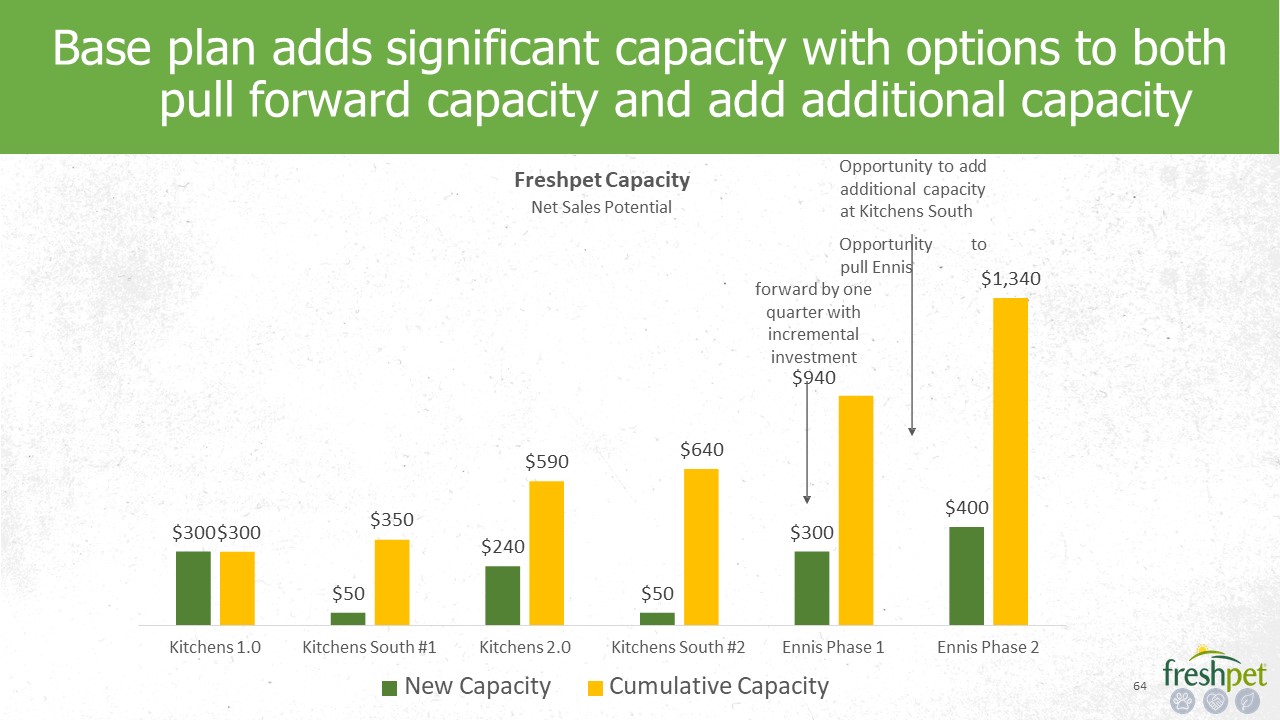
64 Base plan adds significant capacity with options to both pull forward capacity and add additional
capacity $50 $240 $50 $300 $400 $300$300 $350 $590 $640 $1,340 Kitchens 1.0 Ennis Phase 2 Freshpet CapacityNet Sales Potential Kitchens South #1 Kitchens 2.0New Capacity Kitchens South #2 Ennis Phase 1Cumulative
Capacity forward by one quarter with incremental investment$940 Opportunity to add additional capacity at Kitchens SouthOpportunity to pull Ennis
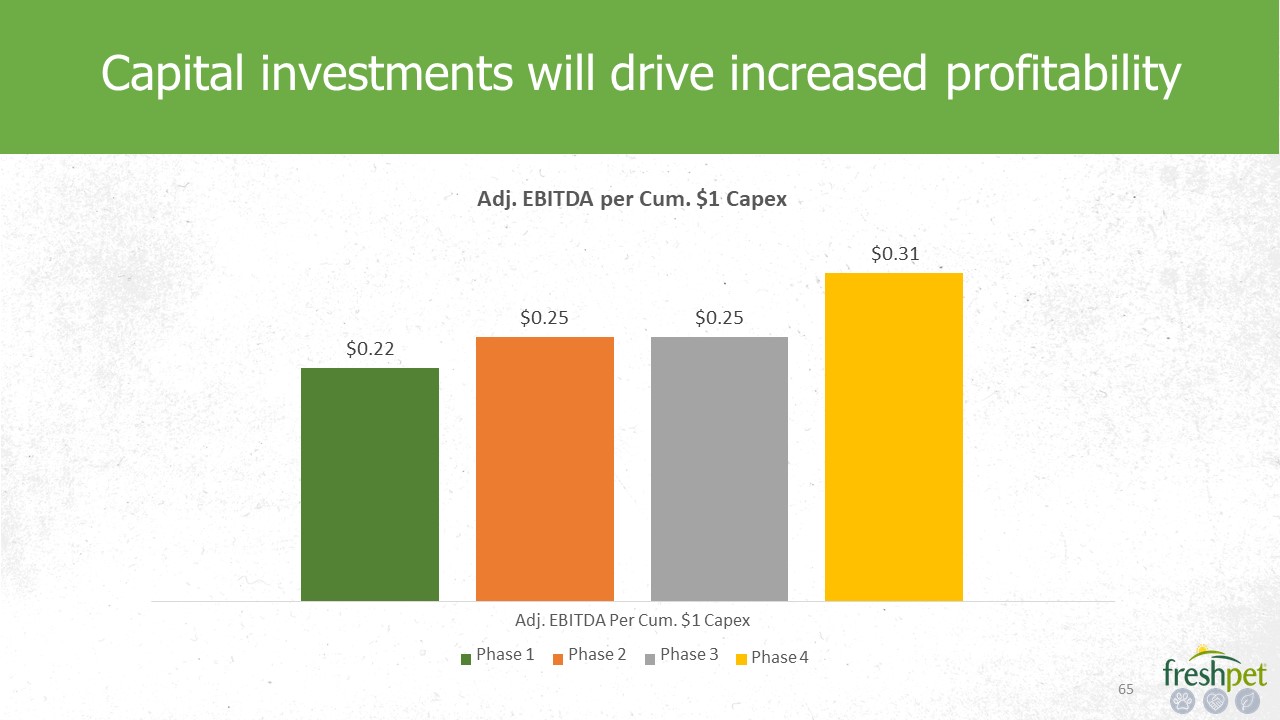
Capital investments will drive increased profitability $0.22 $0.25 $0.25 Adj. EBITDA per Cum. $1
Capex$0.31 Adj. EBITDA Per Cum. $1 Capex Phase 1 Phase 2 Phase 3 Phase 4 *
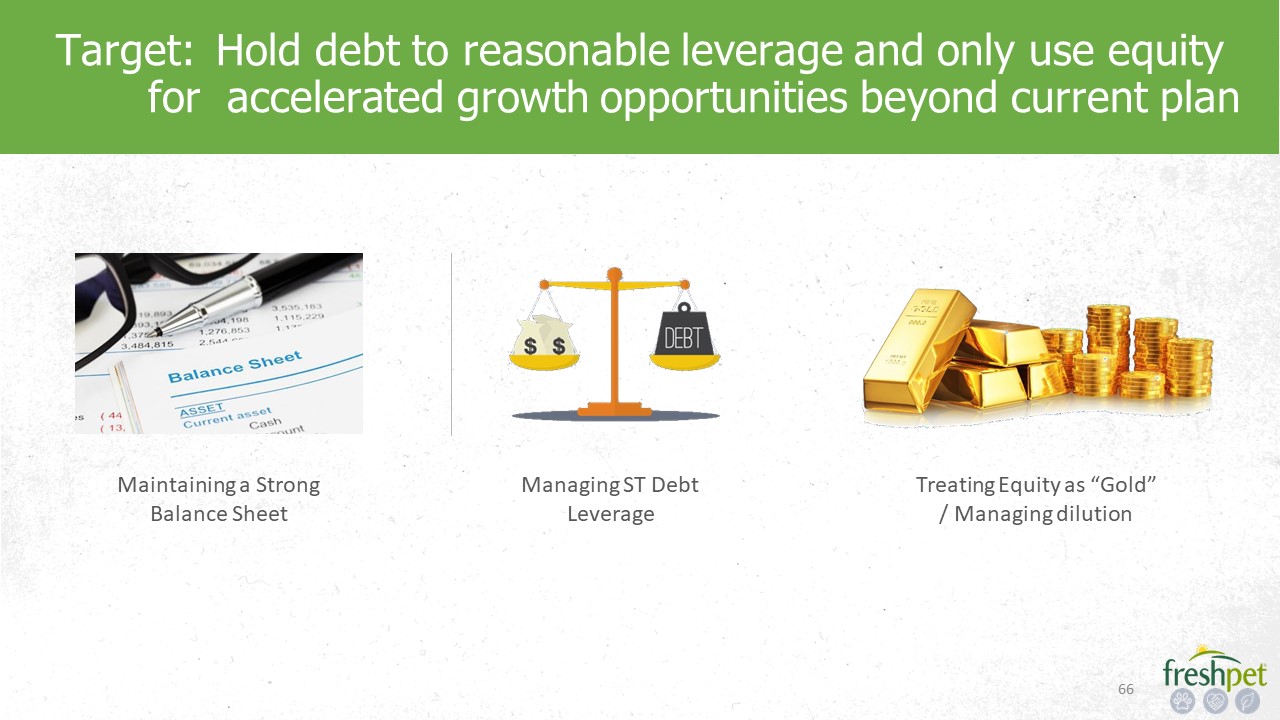
Maintaining a Strong Balance Sheet Target: Hold debt to reasonable leverage and only use equity for
accelerated growth opportunities beyond current plan Managing ST Debt Leverage Treating Equity as “Gold”/ Managing dilution *

Summary
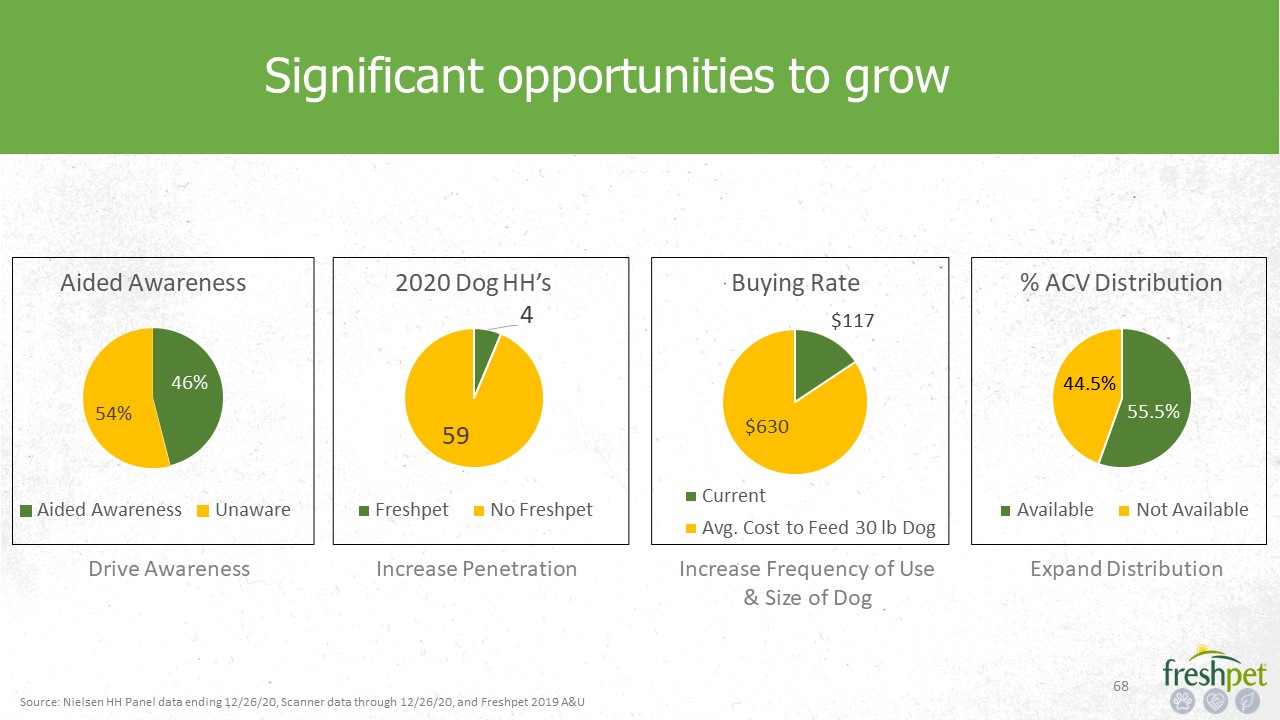
Significant opportunities to grow 46% 54% Aided Awareness 59 2020 Dog HH’s4 55.5% 44.5% % ACV
Distribution $630 Buying Rate$117 CurrentAvg. Cost to Feed 30 lb Dog Aided Awareness UnawareDrive Awareness Freshpet No FreshpetIncrease Penetration Increase Frequency of Use & Size of Dog Available Not AvailableExpand
Distribution 68 Source: Nielsen HH Panel data ending 12/26/20, Scanner data through 12/26/20, and Freshpet 2019 A&U

69 5 million new HH’s leads to $1 billion net sales by 2025 27.2% CAGR
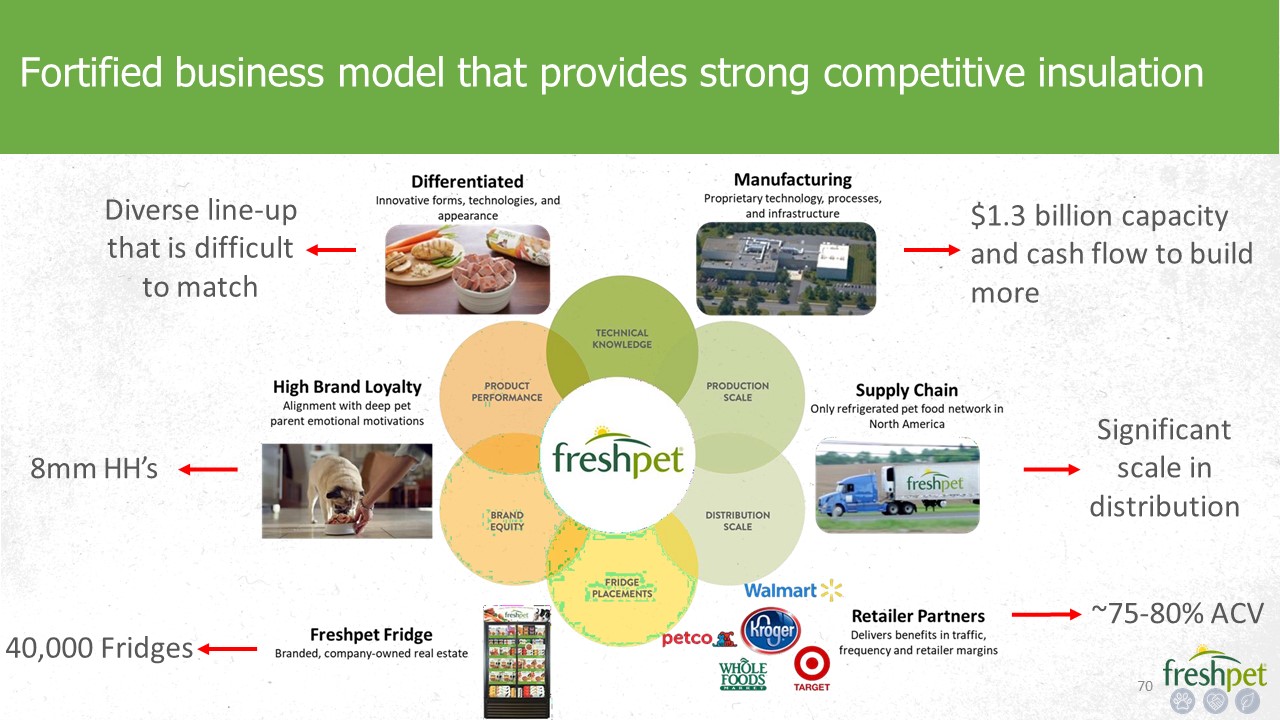
70 Fortified business model that provides strong competitive insulation ~75-80% ACV 8mm
HH’s Diverse line-up that is difficult to match $1.3 billion capacity and cash flow to build more 40,000 Fridges Significant scale in distribution

71 Building the foundation for a business with the potential to be >$2 billion in net
sales 40,000 highly visible, branded, technology-enabled Fridges in 75-80% ACV Manufacturing capacity to support at least $1.3 billion of net sales and the organization capability to build more R&D capability, infrastructure
and systems capable ofsupporting a >$2 billion business

Appa Thank-you! 72

73