
GM 8-K
General Motors Co (GM)
8-K
2020-05-06
For: 2020-05-06
View Original
Added on
April 07, 2026
UNITED STATES SECURITIES AND EXCHANGE COMMISSION
Washington, DC 20549-1004
___________________
FORM 8-K
___________________
CURRENT REPORT
Pursuant to Section 13 or 15(d) of
the Securities Exchange Act of 1934
Date of Report (Date of earliest event reported): May 6, 2020
___________________
(Exact name of registrant as specified in its charter)
__________________
(State or other jurisdiction of incorporation) | (Commission File Number) | (I.R.S. Employer Identification No.) | |
-3000 | ||||||||||||||
(Address of principal executive offices) | (Zip Code) | |||||||||||||
(313 ) 667-1500
(Registrant's telephone number, including area code)
Not Applicable
(Former name or former address, if changed since last report)
__________________
Check the appropriate box below if the Form 8-K filing is intended to simultaneously satisfy the filing obligation of the registrant under any of the following provisions:
Written communications pursuant to Rule 425 under the Securities Act (17 CFR 230.425) | ||
Soliciting material pursuant to Rule 14a-12 under the Exchange Act (17 CFR 240.14a-12) | ||
Pre-commencement communications pursuant to Rule 14d-2(b) under the Exchange Act (17 CFR 240.14d-2(b)) | ||
Pre-commencement communications pursuant to Rule 13e-4(c) under the Exchange Act (17 CFR 240.13e-4(c)) | ||
Securities registered pursuant to Section 12(b) of the Act:
Title of each class | Trading Symbol(s) | Name of each exchange on which registered |
Indicate by check mark whether the registrant is an emerging growth company as defined in Rule 405 of the Securities Act of 1933 (§230.405 of this chapter) or Rule 12b-2 of the Securities Exchange Act of 1934 (§240.12b-2 of this chapter). Emerging growth company ☐
If an emerging growth company, indicate by check mark if the registrant has elected not to use the extended transition period for complying with any new or revised financial accounting standards provided pursuant to Section 13(a) of the Exchange Act. ☐
ITEM 2.02 Results of Operations and Financial Condition
On May 6, 2020 General Motors Company (GM) issued a news release and supplemental materials on the subject of its 2020 first quarter earnings. The news release and supplemental materials are attached as Exhibit 99.1 and Exhibit 99.2.
Charts furnished to securities analysts in connection with GM's 2020 first quarter earnings release are available on GM's website at www.gm.com/investors/earnings-releases.html.
ITEM 9.01 Financial Statements and Exhibits
EXHIBIT
Exhibit | Description |
Exhibit 99.1 | |
Exhibit 99.2 | |
Exhibit 104 | Cover Page Interactive Data File (embedded within the Inline XBRL document) |
SIGNATURE
Pursuant to the requirements of the Securities Exchange Act of 1934, the registrant has duly caused this report to be signed on its behalf by the undersigned hereunto duly authorized.
GENERAL MOTORS COMPANY (Registrant) | ||
By: | /s/ CHRISTOPHER T. HATTO | |
Date: May 6, 2020 | Christopher T. Hatto, Vice President, Global Business Solutions and Chief Accounting Officer | |
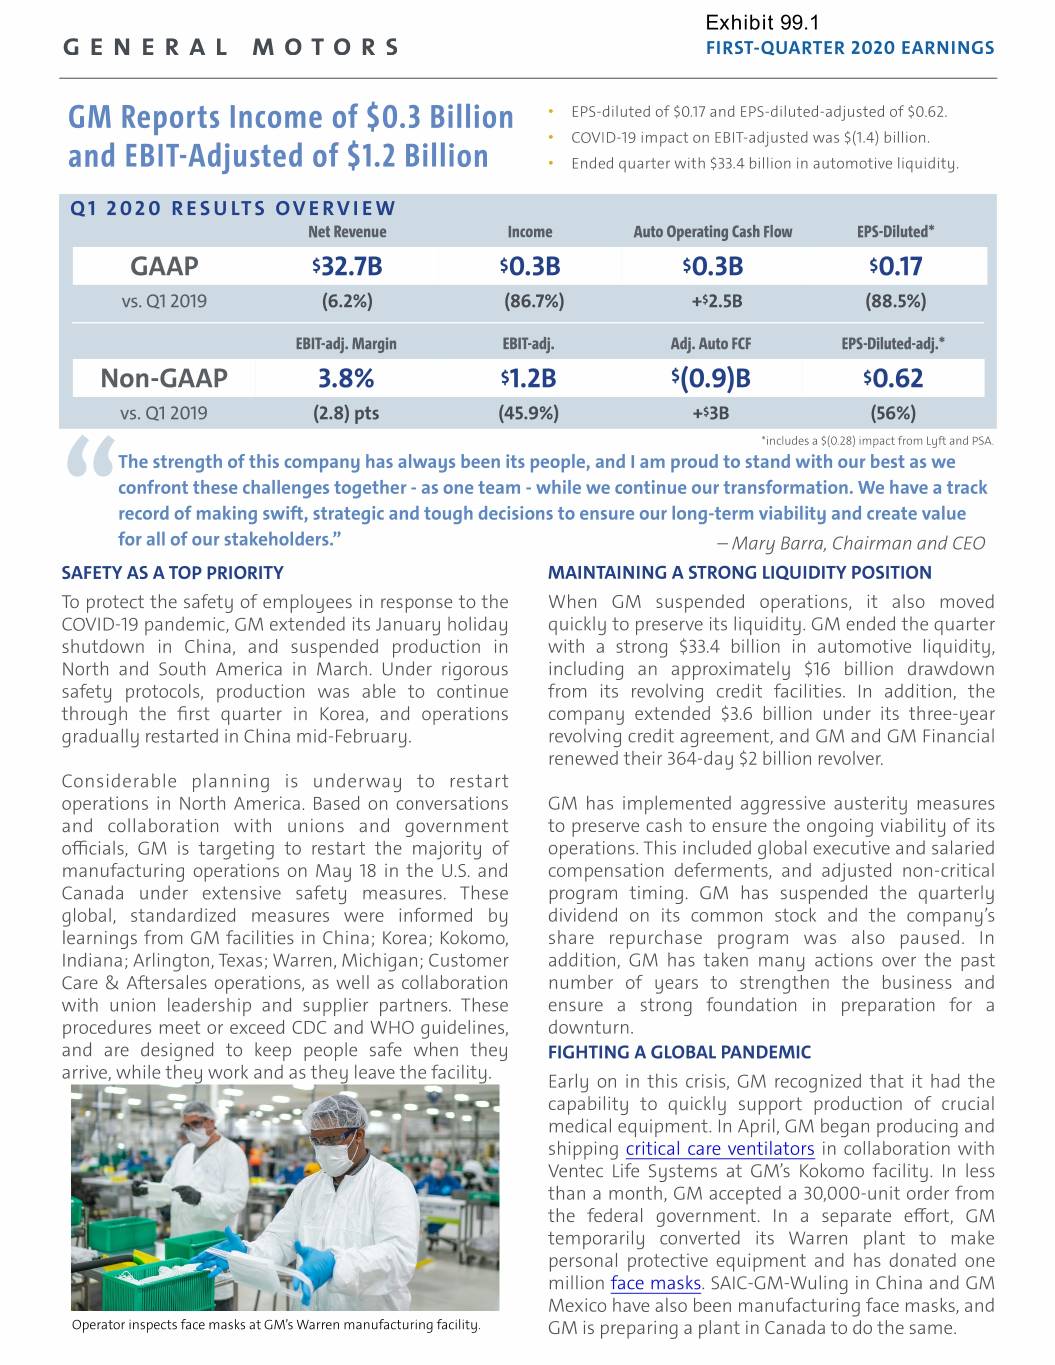
FIRST-QUARTER 2020 EARNINGS GM Reports Income of $0.3 Billion • EPS-diluted of $0.17 and EPS-diluted-adjusted of $0.62. • COVID-19 impact on EBIT-adjusted was $(1.4) billion. and EBIT-Adjusted of $1.2 Billion • Ended quarter with $33.4 billion in automotive liquidity. Q1 2020 RESULTS OVERVIEW Net Revenue Income Auto Operating Cash Flow EPS-Diluted* GAAP $32.7B $0.3B $0.3B $0.17 vs. Q1 2019 (6.2%) (86.7%) +$2.5B (88.5%) EBIT-adj. Margin EBIT-adj. Adj. Auto FCF EPS-Diluted-adj.* Non-GAAP 3.8% $1.2B $(0.9)B $0.62 vs. Q1 2019 (2.8) pts (45.9%) +$3B (56%) *includes a $(0.28) impact from Lyft and PSA. The strength of this company has always been its people, and I am proud to stand with our best as we confront these challenges together - as one team - while we continue our transformation. We have a track record of making swift, strategic and tough decisions to ensure our long-term viability and create value for all of our stakeholders.” – Mary Barra, Chairman and CEO SAFETY“ AS A TOP PRIORITY MAINTAINING A STRONG LIQUIDITY POSITION To protect the safety of employees in response to the When GM suspended operations, it also moved COVID-19 pandemic, GM extended its January holiday quickly to preserve its liquidity. GM ended the quarter shutdown in China, and suspended production in with a strong $33.4 billion in automotive liquidity, North and South America in March. Under rigorous including an approximately $16 billion drawdown safety protocols, production was able to continue from its revolving credit facilities. In addition, the through the frst quarter in Korea, and operations company extended $3.6 billion under its three-year gradually restarted in China mid-February. revolving credit agreement, and GM and GM Financial renewed their 364-day $2 billion revolver. Considerable planning is underway to restart operations in North America. Based on conversations GM has implemented aggressive austerity measures and collaboration with unions and government to preserve cash to ensure the ongoing viability of its ofcials, GM is targeting to restart the majority of operations. This included global executive and salaried manufacturing operations on May 18 in the U.S. and compensation deferments, and adjusted non-critical Canada under extensive safety measures. These program timing. GM has suspended the quarterly global, standardized measures were informed by dividend on its common stock and the company’s learnings from GM facilities in China; Korea; Kokomo, share repurchase program was also paused. In Indiana; Arlington, Texas; Warren, Michigan; Customer addition, GM has taken many actions over the past Care & Aftersales operations, as well as collaboration number of years to strengthen the business and with union leadership and supplier partners. These ensure a strong foundation in preparation for a procedures meet or exceed CDC and WHO guidelines, downturn. and are designed to keep people safe when they FIGHTING A GLOBAL PANDEMIC arrive, while they work and as they leave the facility. Early on in this crisis, GM recognized that it had the capability to quickly support production of crucial medical equipment. In April, GM began producing and shipping critical care ventilators in collaboration with Ventec Life Systems at GM’s Kokomo facility. In less than a month, GM accepted a 30,000-unit order from the federal government. In a separate efort, GM temporarily converted its Warren plant to make personal protective equipment and has donated one million face masks. SAIC-GM-Wuling in China and GM Mexico have also been manufacturing face masks, and Operator inspects face masks at GM’s Warren manufacturing facility. GM is preparing a plant in Canada to do the same.
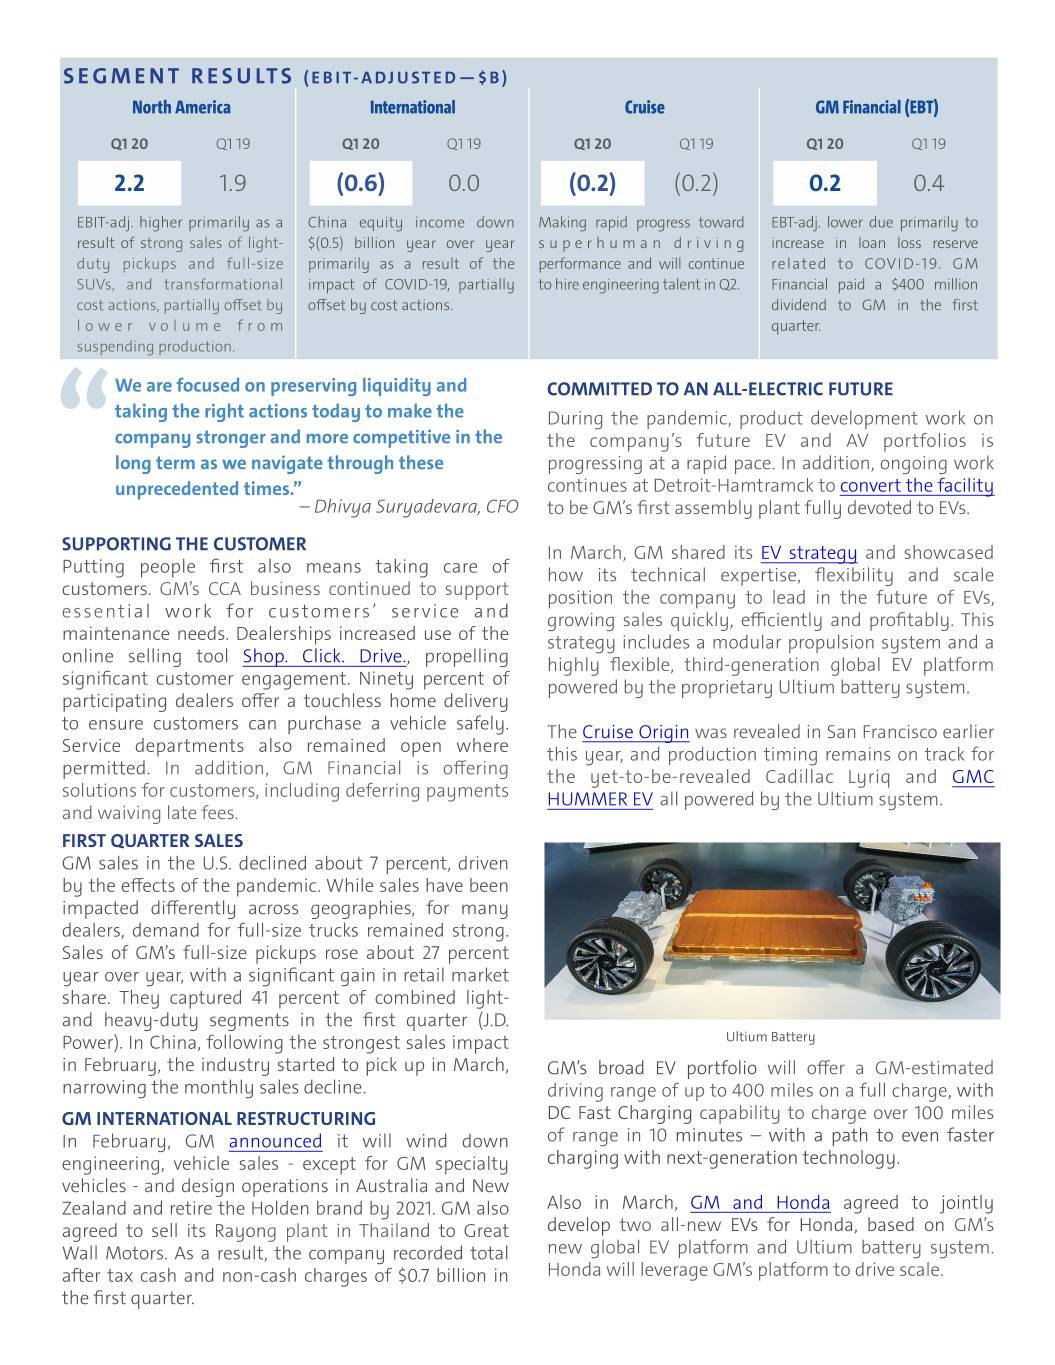
SEGMENT RESULTS (EBIT-ADJUSTED—$B) North America International Cruise GM Financial (EBT) Q1 20 Q1 19 Q1 20 Q1 19 Q1 20 Q1 19 Q1 20 Q1 19 2.2 1.9 (0.6) 0.0 (0.2) (0.2) 0.2 0.4 EBIT-adj. higher primarily as a China equity income down Making rapid progress toward EBT-adj. lower due primarily to result of strong sales of light- $(0.5) billion year over year superhuman driving increase in loan loss reserve duty pickups and full-size primarily as a result of the performance and will continue related to COVID-19. GM SUVs, and transformational impact of COVID-19, partially to hire engineering talent in Q2. Financial paid a $400 million cost actions, partially ofset by ofset by cost actions.
dividend to GM in the first l o w e r v o l u m e f r o m quarter. suspending production.
We are focused on preserving liquidity and COMMITTED TO AN ALL-ELECTRIC FUTURE taking the right actions today to make the During the pandemic, product development work on company stronger and more competitive in the the company’s future EV and AV portfolios is long term as we navigate through these progressing at a rapid pace. In addition, ongoing work unprecedented times.” continues at Detroit-Hamtramck to convert the facility “ – Dhivya Suryadevara, CFO to be GM’s frst assembly plant fully devoted to EVs. SUPPORTING THE CUSTOMER In March, GM shared its EV strategy and showcased Putting people frst also means taking care of how its technical expertise, fexibility and scale customers. GM’s CCA business continued to support position the company to lead in the future of EVs, essential work for customers’ service and growing sales quickly, efciently and proftably. This maintenance needs. Dealerships increased use of the strategy includes a modular propulsion system and a online selling tool Shop. Click. Drive., propelling highly fexible, third-generation global EV platform signifcant customer engagement. Ninety percent of powered by the proprietary Ultium battery system. participating dealers ofer a touchless home delivery to ensure customers can purchase a vehicle safely. The Cruise Origin was revealed in San Francisco earlier Service departments also remained open where this year, and production timing remains on track for permitted. In addition, GM Financial is ofering the yet-to-be-revealed Cadillac Lyriq and GMC solutions for customers, including deferring payments HUMMER EV all powered by the Ultium system. and waiving late fees. FIRST QUARTER SALES GM sales in the U.S. declined about 7 percent, driven by the efects of the pandemic. While sales have been impacted diferently across geographies, for many dealers, demand for full-size trucks remained strong. Sales of GM’s full-size pickups rose about 27 percent year over year, with a signifcant gain in retail market share. They captured 41 percent of combined light- and heavy-duty segments in the frst quarter (J.D. Power). In China, following the strongest sales impact Ultium Battery in February, the industry started to pick up in March, GM’s broad EV portfolio will ofer a GM-estimated narrowing the monthly sales decline. driving range of up to 400 miles on a full charge, with GM INTERNATIONAL RESTRUCTURING DC Fast Charging capability to charge over 100 miles In February, GM announced it will wind down of range in 10 minutes – with a path to even faster engineering, vehicle sales - except for GM specialty charging with next-generation technology. vehicles - and design operations in Australia and New Zealand and retire the Holden brand by 2021. GM also Also in March, GM and Honda agreed to jointly agreed to sell its Rayong plant in Thailand to Great develop two all-new EVs for Honda, based on GM’s Wall Motors. As a result, the company recorded total new global EV platform and Ultium battery system. after tax cash and non-cash charges of $0.7 billion in Honda will leverage GM’s platform to drive scale. the frst quarter.
MEDIA CONTACT INVESTOR CONTACT Juli Huston-Rough Michael Heifler GM Finance Communications GM Investor Relations Media Investors 313-549-6977 313-418-0220 [email protected] [email protected] General Motors (NYSE:GM) is a global company committed to delivering safer, better and more sustainable ways for people to get around. General Motors, its subsidiaries and its joint venture entities sell vehicles under the Chevrolet, Buick, GMC, Cadillac, Holden, Baojun and Wuling brands. More information on the company and its subsidiaries, including OnStar, a global leader in vehicle safety and security services, can be found at http://www.gm.com. Cautionary Note on Forward-Looking Statements: This press release may include “forward-looking statements” within the meaning of the U.S. federal securities laws. We caution readers not to place undue reliance on forward-looking statements. Statements including words such as “anticipate,” “appears,” “approximately,” “believe,” “continue,” “could,” “designed,” “efect,” “estimate,” “evaluate,” “expect,” “forecast,” “goal,” “initiative,” “intend,” “may,” “objective,” “outlook,” “plan,” “potential,” “priorities,” “project,” “pursue,” “seek,” “should,” “target,” “when,” “will,” “would,” or the negative of any of those words or similar expressions to identify forward-looking statements represent our current judgment about possible future events. In making these statements we rely upon assumptions and analysis based on our experience and perception of historical trends, current conditions and expected future developments, as well as other factors we consider appropriate under the circumstances. These statements are not guarantees of future performance; they involve risks and uncertainties and actual events or results may difer materially from these statements. Factors that might cause such diferences include, but are not limited to, a variety of economic, competitive and regulatory factors, many of which are beyond our control. Many of these factors are described in our Annual Report on Form 10-K and our other flings with the U.S. Securities and Exchange Commission. We undertake no obligation to update publicly or otherwise revise any forward-looking statements, whether as a result of new information, future events or other factors that afect the subject of these statements, except where we are expressly required to do so by law.
Exhibit 99.2
General Motors Company and Subsidiaries
Supplemental Material
(Unaudited)
General Motors Company's (GM) non-GAAP measures include: earnings before interest and taxes (EBIT)-adjusted, presented net of noncontrolling interests; earnings before income taxes (EBT)-adjusted for our General Motors Financial Company, Inc. (GM Financial) segment; earnings per share (EPS)-diluted-adjusted; effective tax rate-adjusted (ETR-adjusted); return on invested capital-adjusted (ROIC-adjusted) and adjusted automotive free cash flow. GM's calculation of these non-GAAP measures may not be comparable to similarly titled measures of other companies due to potential differences between companies in the method of calculation. As a result, the use of these non-GAAP measures has limitations and should not be considered superior to, in isolation from, or as a substitute for, related U.S. GAAP measures.
These non-GAAP measures allow management and investors to view operating trends, perform analytical comparisons and benchmark performance between periods and among geographic regions to understand operating performance without regard to items we do not consider a component of our core operating performance. Furthermore, these non-GAAP measures allow investors the opportunity to measure and monitor our performance against our externally communicated targets and evaluate the investment decisions being made by management to improve ROIC-adjusted. Management uses these measures in its financial, investment and operational decision-making processes, for internal reporting and as part of its forecasting and budgeting processes. Further, our Board of Directors uses certain of these and other measures as key metrics to determine management performance under our performance-based compensation plans. For these reasons, we believe these non-GAAP measures are useful for our investors.
EBIT-adjusted EBIT-adjusted is presented net of noncontrolling interests and is used by management and can be used by investors to review our consolidated operating results because it excludes automotive interest income, automotive interest expense and income taxes as well as certain additional adjustments that are not considered part of our core operations. Examples of adjustments to EBIT include, but are not limited to, impairment charges on long-lived assets and other exit costs resulting from strategic shifts in our operations or discrete market and business conditions; costs arising from the ignition switch recall and related legal matters; and certain currency devaluations associated with hyperinflationary economies. For EBIT-adjusted and our other non-GAAP measures, once we have made an adjustment in the current period for an item, we will also adjust the related non-GAAP measure in any future periods in which there is an impact from the item. Our corresponding measure for our GM Financial segment is EBT-adjusted because interest income and interest expense are part of operating results when assessing and measuring the operational and financial performance of the segment.
EPS-diluted-adjusted EPS-diluted-adjusted is used by management and can be used by investors to review our consolidated diluted EPS results on a consistent basis. EPS-diluted-adjusted is calculated as net income attributable to common stockholders-diluted less adjustments noted above for EBIT-adjusted and certain income tax adjustments divided by weighted-average common shares outstanding-diluted. Examples of income tax adjustments include the establishment or reversal of significant deferred tax asset valuation allowances.
ETR-adjusted ETR-adjusted is used by management and can be used by investors to review the consolidated effective tax rate for our core operations on a consistent basis. ETR-adjusted is calculated as Income tax expense less the income tax related to the adjustments noted above for EBIT-adjusted and the income tax adjustments noted above for EPS-diluted-adjusted divided by Income before income taxes less adjustments. When we provide an expected adjusted effective tax rate, we do not provide an expected effective tax rate because the U.S. GAAP measure may include significant adjustments that are difficult to predict.
ROIC-adjusted ROIC-adjusted is used by management and can be used by investors to review our investment and capital allocation decisions. We define ROIC-adjusted as EBIT-adjusted for the trailing four quarters divided by ROIC-adjusted average net assets, which is considered to be the average equity balances adjusted for average automotive debt and interest liabilities, exclusive of finance leases; average automotive net pension and other postretirement benefits (OPEB) liabilities; and average automotive net income tax assets during the same period.
Adjusted automotive free cash flow Adjusted automotive free cash flow is used by management and can be used by investors to review the liquidity of our automotive operations and to measure and monitor our performance against our capital allocation program and evaluate our automotive liquidity against the substantial cash requirements of our automotive operations. We measure adjusted automotive free cash flow as automotive operating cash flow from operations less capital expenditures adjusted for management actions. Management actions can include voluntary events such as discretionary contributions to employee benefit plans or nonrecurring specific events such as a closure of a facility that are considered special for EBIT-adjusted purposes.
1
General Motors Company and Subsidiaries
Supplemental Material
(Unaudited)
The following table reconciles segment profit (loss) to Net income attributable to stockholders under U.S. GAAP (dollars in millions):
Three Months Ended | |||||||
March 31, 2020 | March 31, 2019 | ||||||
Operating segments | |||||||
GM North America (GMNA) | $ | 2,194 | $ | 1,896 | |||
GM International (GMI) | (551 | ) | 31 | ||||
Cruise | (228 | ) | (169 | ) | |||
GM Financial(a) | 230 | 359 | |||||
Total operating segments | 1,645 | 2,117 | |||||
Corporate and eliminations(b) | (395 | ) | 193 | ||||
EBIT-adjusted | 1,250 | 2,310 | |||||
Adjustments | |||||||
GMI restructuring(c) | (489 | ) | — | ||||
Transformation activities(d) | — | (790 | ) | ||||
GM Brazil indirect tax recoveries(e) | — | 857 | |||||
Total adjustments | (489 | ) | 67 | ||||
Automotive interest income | 83 | 98 | |||||
Automotive interest expense | (193 | ) | (181 | ) | |||
Income tax expense | (357 | ) | (137 | ) | |||
Net income attributable to stockholders(f) | $ | 294 | $ | 2,157 | |||
__________
(a) | GM Financial amounts represent EBT-adjusted. |
(b) | GM's automotive interest income and interest expense, legacy costs from the Opel and Vauxhall businesses and certain other assets in Europe, which are primarily pension costs, corporate expenditures and certain nonsegment-specific revenues and expenses are recorded centrally in Corporate. |
(c) | This adjustment was excluded because of a strategic decision to rationalize our core operations by exiting or significantly reducing our presence in various international markets to focus resources on opportunities expected to deliver higher returns. The adjustment primarily consists of asset impairments, dealer restructurings, employee separation charges and sales allowances in Australia, New Zealand and Thailand. |
(d) | This adjustment was excluded because of a strategic decision to accelerate our transformation for the future to strengthen our core business, capitalize on the future of personal mobility and drive significant cost efficiencies. The adjustment primarily consists of accelerated depreciation. |
(e) | These adjustments were excluded because of the unique events associated with decisions rendered by the Superior Judicial Court of Brazil resulting in retrospective recoveries of indirect taxes. |
(f) | Net of Net loss attributable to noncontrolling interests. |
2
General Motors Company and Subsidiaries
Supplemental Material
(Unaudited)
The following table reconciles Net income (loss) attributable to stockholders under U.S. GAAP to EBIT-adjusted (dollars in millions):
Three Months Ended | |||||||||||||||||||||||||||||||
March 31, | December 31, | September 30, | June 30, | ||||||||||||||||||||||||||||
2020 | 2019 | 2019 | 2018 | 2019 | 2018 | 2019 | 2018 | ||||||||||||||||||||||||
Net income (loss) attributable to stockholders | $ | 294 | $ | 2,157 | $ | (194 | ) | $ | 2,044 | $ | 2,351 | $ | 2,534 | $ | 2,418 | $ | 2,390 | ||||||||||||||
Income tax expense (benefit) | 357 | 137 | (163 | ) | (611 | ) | 271 | 100 | 524 | 519 | |||||||||||||||||||||
Automotive interest expense | 193 | 181 | 200 | 185 | 206 | 161 | 195 | 159 | |||||||||||||||||||||||
Automotive interest income | (83 | ) | (98 | ) | (96 | ) | (117 | ) | (129 | ) | (82 | ) | (106 | ) | (72 | ) | |||||||||||||||
Adjustments | |||||||||||||||||||||||||||||||
GMI restructuring(a) | 489 | — | — | — | — | — | — | 196 | |||||||||||||||||||||||
Transformation activities(b) | — | 790 | 194 | 1,327 | 390 | — | 361 | — | |||||||||||||||||||||||
GM Brazil indirect tax recoveries(c) | — | (857 | ) | — | — | (123 | ) | — | (380 | ) | — | ||||||||||||||||||||
FAW-GM divestiture(d) | — | — | 164 | — | — | — | — | — | |||||||||||||||||||||||
Ignition switch recall and related legal matters(e) | — | — | — | — | — | 440 | — | — | |||||||||||||||||||||||
Total adjustments | 489 | (67 | ) | 358 | 1,327 | 267 | 440 | (19 | ) | 196 | |||||||||||||||||||||
EBIT-adjusted | $ | 1,250 | $ | 2,310 | $ | 105 | $ | 2,828 | $ | 2,966 | $ | 3,153 | $ | 3,012 | $ | 3,192 | |||||||||||||||
________
(a) | These adjustments were excluded because of a strategic decision to rationalize our core operations by exiting or significantly reducing our presence in various international markets to focus resources on opportunities expected to deliver higher returns. These adjustments primarily consist of asset impairments, dealer restructurings, employee separation charges and sales allowances in Australia, New Zealand and Thailand in the three months ended March 31, 2020, and supplier claims and employee separation charges in Korea in the three months ended June 30, 2018. |
(b) | These adjustments were excluded because of a strategic decision to accelerate our transformation for the future to strengthen our core business, capitalize on the future of personal mobility and drive significant cost efficiencies. The adjustments primarily consist of accelerated depreciation in the three months ended March 31, 2019, accelerated depreciation and employee separation charges in the three months ended December 31, 2019, employee separation charges and accelerated depreciation in the three months ended December 31, 2018, supplier-related charges and pension curtailment and other charges in the three months ended September 30, 2019 and supplier-related charges and accelerated depreciation in the three months ended June 30, 2019. |
(c) | These adjustments were excluded because of the unique events associated with decisions rendered by the Superior Judicial Court of Brazil resulting in retrospective recoveries of indirect taxes. |
(d) | This adjustment was excluded because we divested our joint venture FAW-GM Light Duty Commercial Vehicle Co., Ltd. (FAW-GM), as a result of a strategic decision by both shareholders, allowing us to focus our resources on opportunities expected to deliver higher returns. |
(e) | This adjustment was excluded because of the unique events associated with the ignition switch recall, which included various investigations, inquiries and complaints from constituents. |
The following table reconciles diluted earnings per common share under U.S. GAAP to EPS-diluted-adjusted (dollars in millions, except per share amounts):
Three Months Ended | |||||||||||||||
March 31, 2020 | March 31, 2019 | ||||||||||||||
Amount | Per Share | Amount | Per Share | ||||||||||||
Diluted earnings per common share | $ | 247 | $ | 0.17 | $ | 2,119 | $ | 1.48 | |||||||
Adjustments(a) | 489 | 0.34 | (67 | ) | (0.05 | ) | |||||||||
Tax effect on adjustment(b) | (73 | ) | (0.05 | ) | (32 | ) | (0.02 | ) | |||||||
Tax adjustment(c) | 236 | 0.16 | — | — | |||||||||||
EPS-diluted-adjusted | $ | 899 | $ | 0.62 | $ | 2,020 | $ | 1.41 | |||||||
________
(a) | Refer to the reconciliation of segment profit (loss) to Net income attributable to stockholders under U.S. GAAP for adjustment details. |
(b) | The tax effect of each adjustment is determined based on the tax laws and valuation allowance status of the jurisdiction to which the adjustment relates. |
(c) | This adjustment consists of tax expense related to the establishment of a valuation allowance against deferred tax assets that are no longer realizable in Australia and New Zealand. This adjustment was excluded because significant impacts of valuation allowances are not considered part of our core operations. |
3
General Motors Company and Subsidiaries
Supplemental Material
(Unaudited)
The following table reconciles our effective tax rate under U.S. GAAP to ETR-adjusted (dollars in millions):
Three Months Ended | |||||||||||||||||||||
March 31, 2020 | March 31, 2019 | ||||||||||||||||||||
Income before income taxes | Income tax expense | Effective tax rate | Income before income taxes | Income tax expense | Effective tax rate | ||||||||||||||||
Effective tax rate | $ | 643 | $ | 357 | 55.5 | % | $ | 2,282 | $ | 137 | 6.0 | % | |||||||||
Adjustments(a) | 489 | 73 | (67 | ) | 32 | ||||||||||||||||
Tax adjustment(b) | (236 | ) | — | ||||||||||||||||||
ETR-adjusted | $ | 1,132 | $ | 194 | 17.1 | % | $ | 2,215 | $ | 169 | 7.6 | % | |||||||||
________
(a) | Refer to the reconciliation of segment profit (loss) to Net income attributable to stockholders under U.S. GAAP for adjustment details. The tax effect of each adjustment is determined based on the tax laws and valuation allowance status of the jurisdiction to which the adjustment relates. |
(b) | Refer to the reconciliation of diluted earnings per common share under U.S. GAAP to EPS-diluted adjusted within the previous section for adjustment details. |
We define return on equity (ROE) as Net income (loss) attributable to stockholders for the trailing four quarters divided by average equity for the same period. Management uses average equity to provide comparable amounts in the calculation of ROE. The following table summarizes the calculation of ROE (dollars in billions):
Four Quarters Ended | |||||||
March 31, 2020 | March 31, 2019 | ||||||
Net income (loss) attributable to stockholders | $ | 4.9 | $ | 9.1 | |||
Average equity(a) | $ | 43.6 | $ | 39.3 | |||
ROE | 11.2 | % | 23.2 | % | |||
________
(a) | Includes equity of noncontrolling interests where the corresponding earnings (loss) are included in Net income (loss) attributable to stockholders. |
The following table summarizes the calculation of ROIC-adjusted (dollars in billions):
Four Quarters Ended | |||||||
March 31, 2020 | March 31, 2019 | ||||||
EBIT-adjusted(a) | $ | 7.3 | $ | 11.5 | |||
Average equity(b) | $ | 43.6 | $ | 39.3 | |||
Add: Average automotive debt and interest liabilities (excluding finance leases) | 18.8 | 14.4 | |||||
Add: Average automotive net pension & OPEB liability | 16.9 | 17.5 | |||||
Less: Average automotive and other net income tax asset | (23.7 | ) | (22.9 | ) | |||
ROIC-adjusted average net assets | $ | 55.6 | $ | 48.3 | |||
ROIC-adjusted | 13.2 | % | 23.8 | % | |||
________
(a) | Refer to the reconciliation of Net income (loss) attributable to stockholders under U.S. GAAP to EBIT-adjusted for adjustment details. |
(b) | Includes equity of noncontrolling interests where the corresponding earnings (loss) are included in EBIT-adjusted. |
4
General Motors Company and Subsidiaries
Supplemental Material
(Unaudited)
The following table reconciles Net automotive cash provided by (used in) operating activities under U.S. GAAP to adjusted automotive free cash flow (dollars in millions):
Three Months Ended | |||||||
March 31, 2020 | March 31, 2019 | ||||||
Net automotive cash provided by (used in) operating activities | $ | 337 | $ | (2,207 | ) | ||
Less: Capital expenditures | (1,205 | ) | (1,993 | ) | |||
Add: GMI restructuring | 23 | 9 | |||||
Add: Transformation activities | — | 315 | |||||
Less: GM Brazil indirect tax recoveries | (58 | ) | — | ||||
Adjusted automotive free cash flow | $ | (903 | ) | $ | (3,876 | ) | |
The following tables summarize key financial information by segment (dollars in millions):
GMNA | GMI | Corporate | Eliminations | Total Automotive | Cruise | GM Financial | Reclassifications/Eliminations | Total | |||||||||||||||||||||||||||
Three Months Ended March 31, 2020 | |||||||||||||||||||||||||||||||||||
Net sales and revenue | $ | 25,831 | $ | 3,280 | $ | 38 | $ | 29,149 | $ | 25 | $ | 3,561 | $ | (26 | ) | $ | 32,709 | ||||||||||||||||||
Expenditures for property | $ | 946 | $ | 255 | $ | 4 | $ | — | $ | 1,205 | $ | 5 | $ | 14 | $ | — | $ | 1,224 | |||||||||||||||||
Depreciation and amortization | $ | 1,227 | $ | 166 | $ | 9 | $ | — | $ | 1,402 | $ | 8 | $ | 1,788 | $ | — | $ | 3,198 | |||||||||||||||||
Impairment charges | $ | 20 | $ | 90 | $ | — | $ | — | $ | 110 | $ | — | $ | — | $ | — | $ | 110 | |||||||||||||||||
Equity income (loss)(a) | $ | 6 | $ | (163 | ) | $ | — | $ | — | $ | (157 | ) | $ | — | $ | 25 | $ | — | $ | (132 | ) | ||||||||||||||
GMNA | GMI | Corporate | Eliminations | Total Automotive | Cruise | GM Financial | Reclassifications/Eliminations | Total | |||||||||||||||||||||||||||
Three Months Ended March 31, 2019 | |||||||||||||||||||||||||||||||||||
Net sales and revenue | $ | 27,365 | $ | 3,850 | $ | 46 | $ | 31,261 | $ | 25 | $ | 3,620 | $ | (28 | ) | $ | 34,878 | ||||||||||||||||||
Expenditures for property | $ | 1,701 | $ | 292 | $ | — | $ | — | $ | 1,993 | $ | 4 | $ | 17 | $ | — | $ | 2,014 | |||||||||||||||||
Depreciation and amortization | $ | 2,069 | $ | 127 | $ | 12 | $ | — | $ | 2,208 | $ | 2 | $ | 1,899 | $ | — | $ | 4,109 | |||||||||||||||||
Impairment charges | $ | 7 | $ | — | $ | — | $ | — | $ | 7 | $ | — | $ | — | $ | — | $ | 7 | |||||||||||||||||
Equity income (loss)(a) | $ | 2 | $ | 374 | $ | (7 | ) | $ | — | $ | 369 | $ | — | $ | 45 | $ | — | $ | 414 | ||||||||||||||||
________
(a) | Includes Automotive China equity loss of $167 million and Automotive China equity income of $376 million in the three months ended March 31, 2020 and 2019. |
5
General Motors Company and Subsidiaries
Supplemental Material
(Unaudited)
Vehicle Sales
GM presents both wholesale and total vehicle sales data to assist in the analysis of our revenue and our market share. Cuba, Iran, North Korea, Sudan and Syria are subject to broad economic sanctions. Accordingly these countries are excluded from industry sales data and the corresponding calculation of GM's market share.
Wholesale vehicle sales data consists of sales to GM's dealers and distributors as well as sales to the U.S. Government and excludes vehicles sold by our joint ventures. Wholesale vehicle sales data correlates to GM's revenue recognized from the sale of vehicles, which is the largest component of Automotive net sales and revenue. In the three months ended March 31, 2020, 32.4% of our wholesale vehicle sales volume was generated outside the U.S. The following table summarizes wholesale vehicle sales by automotive segment (vehicles in thousands):
Three Months Ended | |||||
March 31, 2020 | March 31, 2019 | ||||
GMNA | 775 | 859 | |||
GMI | 191 | 236 | |||
Total | 966 | 1,095 | |||
6
General Motors Company and Subsidiaries
Supplemental Material
(Unaudited)
Total vehicle sales data represents: (1) retail sales (i.e., sales to consumers who purchase new vehicles from dealers or distributors); (2) fleet sales, such as sales to large and small businesses, governments, and daily rental car companies; and (3) vehicles used by dealers in their businesses, including courtesy transportation vehicles. Total vehicle sales data includes all sales by joint ventures on a total vehicle basis, not based on our percentage ownership interest in the joint venture. Certain joint venture agreements in China allow for the contractual right to report vehicle sales of non-GM trademarked vehicles by those joint ventures, which are included in the total vehicle sales we report for China. While total vehicle sales data does not correlate directly to the revenue GM recognizes during a particular period, we believe it is indicative of the underlying demand for GM vehicles. Total vehicle sales data represents management's good faith estimate based on sales reported by GM's dealers, distributors, and joint ventures, commercially available data sources such as registration and insurance data, and internal estimates and forecasts when other data is not available.
The following table summarizes total vehicle sales by geographic region (vehicles in thousands):
Three Months Ended | |||||
March 31, 2020 | March 31, 2019 | ||||
United States | |||||
Chevrolet – Cars | 65 | 100 | |||
Chevrolet – Trucks | 210 | 197 | |||
Chevrolet – Crossovers | 160 | 155 | |||
Cadillac | 30 | 36 | |||
Buick | 34 | 52 | |||
GMC | 119 | 126 | |||
Total United States | 618 | 666 | |||
Canada, Mexico and Other | 101 | 109 | |||
Total North America | 719 | 775 | |||
Asia/Pacific, Middle East and Africa | |||||
Chevrolet | 173 | 220 | |||
Wuling | 176 | 266 | |||
Buick | 130 | 225 | |||
Baojun | 82 | 169 | |||
Cadillac | 28 | 46 | |||
Other | 17 | 21 | |||
Total Asia/Pacific, Middle East and Africa | 606 | 947 | |||
South America(a) | 132 | 155 | |||
Total in GM markets | 1,457 | 1,877 | |||
Total Europe | — | 1 | |||
Total Worldwide | 1,457 | 1,878 | |||
_______
(a) | Primarily Chevrolet. |
The vehicle sales at GM's China joint ventures presented in the following table are included in the preceding vehicle sales table (vehicles in thousands):
Three Months Ended | |||||
March 31, 2020 | March 31, 2019 | ||||
SAIC General Motors Sales Co., Ltd. | 207 | 382 | |||
SAIC GM Wuling Automobile Co., Ltd. | 255 | 432 | |||
7
General Motors Company and Subsidiaries
Supplemental Material
(Unaudited)
Three Months Ended | |||||
March 31, 2020 | March 31, 2019 | ||||
Market Share | |||||
United States – Cars | 8.2 | % | 9.8 | % | |
United States – Trucks | 31.0 | % | 28.2 | % | |
United States – Crossovers | 14.5 | % | 14.1 | % | |
Total United States | 17.3 | % | 16.2 | % | |
Total North America | 16.8 | % | 15.7 | % | |
Total Asia/Pacific, Middle East and Africa | 6.6 | % | 8.0 | % | |
Total South America | 15.3 | % | 15.5 | % | |
Total GM Market | 10.1 | % | 10.5 | % | |
Total Worldwide | 7.9 | % | 8.3 | % | |
United States fleet sales as a percentage of retail vehicle sales | 27.7 | % | 25.0 | % | |
North America capacity two-shift utilization | 104.9 | % | 100.7 | % | |
8
General Motors Company and Subsidiaries
Combining Income Statement Information
(In millions) (Unaudited)
Three Months Ended March 31, 2020 | Three Months Ended March 31, 2019 | ||||||||||||||||||||||||||||||||||||||
Automotive | Cruise | GM Financial | Reclassifications/Eliminations | Combined | Automotive | Cruise | GM Financial | Reclassifications/Eliminations | Combined | ||||||||||||||||||||||||||||||
Net sales and revenue | |||||||||||||||||||||||||||||||||||||||
Automotive | $ | 29,149 | $ | 25 | $ | — | $ | (24 | ) | $ | 29,150 | $ | 31,261 | $ | 25 | $ | — | $ | (25 | ) | $ | 31,261 | |||||||||||||||||
GM Financial | — | — | 3,561 | (2 | ) | 3,559 | — | — | 3,620 | (3 | ) | 3,617 | |||||||||||||||||||||||||||
Total net sales and revenue | 29,149 | 25 | 3,561 | (26 | ) | 32,709 | 31,261 | 25 | 3,620 | (28 | ) | 34,878 | |||||||||||||||||||||||||||
Costs and expenses | |||||||||||||||||||||||||||||||||||||||
Automotive and other cost of sales | 26,543 | 183 | — | — | 26,726 | 28,035 | 195 | — | (1 | ) | 28,229 | ||||||||||||||||||||||||||||
GM Financial interest, operating and other expenses | — | — | 3,356 | — | 3,356 | — | — | 3,306 | — | 3,306 | |||||||||||||||||||||||||||||
Automotive and other selling, general and administrative expense | 1,902 | 68 | — | — | 1,970 | 2,080 | 19 | — | — | 2,099 | |||||||||||||||||||||||||||||
Total costs and expenses | 28,445 | 251 | 3,356 | — | 32,052 | 30,115 | 214 | 3,306 | (1 | ) | 33,634 | ||||||||||||||||||||||||||||
Operating income (loss) | 704 | (226 | ) | 205 | (26 | ) | 657 | 1,146 | (189 | ) | 314 | (27 | ) | 1,244 | |||||||||||||||||||||||||
Automotive interest expense | 193 | — | — | — | 193 | 184 | — | — | (3 | ) | 181 | ||||||||||||||||||||||||||||
Interest income and other non-operating income (loss), net | 278 | (10 | ) | — | 43 | 311 | 768 | 24 | — | 13 | 805 | ||||||||||||||||||||||||||||
Equity income (loss) | (157 | ) | — | 25 | — | (132 | ) | 369 | — | 45 | — | 414 | |||||||||||||||||||||||||||
Income (loss) before income taxes | $ | 632 | $ | (236 | ) | $ | 230 | $ | 17 | 643 | $ | 2,099 | $ | (165 | ) | $ | 359 | $ | (11 | ) | 2,282 | ||||||||||||||||||
Income tax expense | 357 | 137 | |||||||||||||||||||||||||||||||||||||
Net income | 286 | 2,145 | |||||||||||||||||||||||||||||||||||||
Net loss attributable to noncontrolling interests | 8 | 12 | |||||||||||||||||||||||||||||||||||||
Net income attributable to stockholders | $ | 294 | $ | 2,157 | |||||||||||||||||||||||||||||||||||
Net income attributable to common stockholders | $ | 247 | $ | 2,119 | |||||||||||||||||||||||||||||||||||
9
General Motors Company and Subsidiaries
Basic and Diluted Earnings per Share
(Unaudited)
The following table summarizes basic and diluted earnings per share (in millions, except per share amounts):
Three Months Ended | |||||||
March 31, 2020 | March 31, 2019 | ||||||
Basic earnings per share | |||||||
Net income attributable to stockholders(a) | $ | 294 | $ | 2,157 | |||
Less: cumulative dividends on subsidiary preferred stock | (47 | ) | (38 | ) | |||
Net income attributable to common stockholders | $ | 247 | $ | 2,119 | |||
Weighted-average common shares outstanding | 1,433 | 1,417 | |||||
Basic earnings per common share | $ | 0.17 | $ | 1.50 | |||
Diluted earnings per share | |||||||
Net income attributable to common stockholders – diluted(a) | $ | 247 | $ | 2,119 | |||
Weighted-average common shares outstanding – diluted | 1,440 | 1,436 | |||||
Diluted earnings per common share | $ | 0.17 | $ | 1.48 | |||
Potentially dilutive securities(b) | 32 | 8 | |||||
__________
(a) | Net of Net loss attributable to noncontrolling interests. |
(b) | Potentially dilutive securities attributable to outstanding stock options and Restricted Stock Units were excluded from the computation of diluted EPS because the securities would have had an antidilutive effect. |
10
General Motors Company and Subsidiaries
Combining Balance Sheet Information
(In millions, except per share amounts) (Unaudited)(a)
March 31, 2020 | December 31, 2019 | ||||||||||||||||||||||||||||||||||||||
Automotive | Cruise | GM Financial | Reclassifications/Eliminations | Combined | Automotive | Cruise | GM Financial | Reclassifications/Eliminations | Combined | ||||||||||||||||||||||||||||||
ASSETS | |||||||||||||||||||||||||||||||||||||||
Current Assets | |||||||||||||||||||||||||||||||||||||||
Cash and cash equivalents | $ | 25,340 | $ | 1,534 | $ | 11,632 | $ | — | $ | 38,506 | $ | 13,409 | $ | 2,349 | $ | 3,311 | $ | — | $ | 19,069 | |||||||||||||||||||
Marketable debt securities(b) | 6,743 | 904 | — | (27 | ) | 7,620 | 3,908 | 320 | — | (54 | ) | 4,174 | |||||||||||||||||||||||||||
Accounts and notes receivable, net(c) | 7,112 | 2 | 1,179 | (757 | ) | 7,536 | 6,614 | 2 | 1,004 | (823 | ) | 6,797 | |||||||||||||||||||||||||||
GM Financial receivables, net(d) | — | — | 26,859 | (539 | ) | 26,320 | — | — | 27,101 | (500 | ) | 26,601 | |||||||||||||||||||||||||||
Inventories | 10,799 | — | — | — | 10,799 | 10,398 | — | — | — | 10,398 | |||||||||||||||||||||||||||||
Other current assets(e) | 2,123 | 23 | 4,782 | (9 | ) | 6,918 | 2,517 | 16 | 5,424 | (4 | ) | 7,953 | |||||||||||||||||||||||||||
Total current assets | 52,115 | 2,462 | 44,452 | (1,331 | ) | 97,699 | 36,846 | 2,687 | 36,841 | (1,383 | ) | 74,992 | |||||||||||||||||||||||||||
Non-current Assets | |||||||||||||||||||||||||||||||||||||||
GM Financial receivables, net(d) | — | — | 25,961 | (13 | ) | 25,948 | — | — | 26,372 | (17 | ) | 26,355 | |||||||||||||||||||||||||||
Equity in net assets of nonconsolidated affiliates | 6,084 | — | 1,437 | — | 7,521 | 7,107 | — | 1,455 | — | 8,562 | |||||||||||||||||||||||||||||
Property, net | 37,608 | 144 | 216 | — | 37,969 | 38,374 | 150 | 226 | — | 38,750 | |||||||||||||||||||||||||||||
Goodwill and intangible assets, net | 3,253 | 634 | 1,338 | — | 5,225 | 3,348 | 634 | 1,355 | — | 5,337 | |||||||||||||||||||||||||||||
Equipment on operating leases, net | — | — | 41,296 | — | 41,296 | — | — | 42,055 | — | 42,055 | |||||||||||||||||||||||||||||
Deferred income taxes | 24,137 | 415 | (111 | ) | — | 24,441 | 24,582 | 345 | (287 | ) | — | 24,640 | |||||||||||||||||||||||||||
Other assets | 5,373 | 413 | 791 | (53 | ) | 6,525 | 6,123 | 413 | 863 | (53 | ) | 7,346 | |||||||||||||||||||||||||||
Total non-current assets | 76,456 | 1,607 | 70,929 | (66 | ) | 148,925 | 79,533 | 1,542 | 72,040 | (70 | ) | 153,045 | |||||||||||||||||||||||||||
Total Assets | $ | 128,571 | $ | 4,069 | $ | 115,381 | $ | (1,397 | ) | $ | 246,624 | $ | 116,380 | $ | 4,230 | $ | 108,881 | $ | (1,454 | ) | $ | 228,037 | |||||||||||||||||
LIABILITIES AND EQUITY | |||||||||||||||||||||||||||||||||||||||
Current Liabilities | |||||||||||||||||||||||||||||||||||||||
Accounts payable (principally trade)(c) | $ | 20,163 | $ | 78 | $ | 553 | $ | (764 | ) | $ | 20,031 | $ | 21,101 | $ | 109 | $ | 644 | $ | (836 | ) | $ | 21,018 | |||||||||||||||||
Short-term debt and current portion of long-term debt | |||||||||||||||||||||||||||||||||||||||
Automotive(d) | 2,269 | — | — | (539 | ) | 1,730 | 2,397 | — | — | (500 | ) | 1,897 | |||||||||||||||||||||||||||
GM Financial | — | — | 43,331 | — | 43,331 | — | — | 35,503 | — | 35,503 | |||||||||||||||||||||||||||||
Accrued liabilities | 21,285 | 110 | 4,811 | (7 | ) | 26,200 | 22,493 | 82 | 3,916 | (4 | ) | 26,487 | |||||||||||||||||||||||||||
Total current liabilities | 43,717 | 188 | 48,695 | (1,308 | ) | 91,292 | 45,990 | 192 | 40,064 | (1,341 | ) | 84,905 | |||||||||||||||||||||||||||
Non-current Liabilities | |||||||||||||||||||||||||||||||||||||||
Long-term debt | |||||||||||||||||||||||||||||||||||||||
Automotive(d) | 28,594 | — | — | (13 | ) | 28,581 | 12,507 | — | — | (18 | ) | 12,489 | |||||||||||||||||||||||||||
GM Financial | — | — | 52,858 | — | 52,858 | — | — | 53,435 | — | 53,435 | |||||||||||||||||||||||||||||
Postretirement benefits other than pensions | 5,766 | — | — | — | 5,766 | 5,935 | — | — | — | 5,935 | |||||||||||||||||||||||||||||
Pensions | 11,502 | — | 3 | — | 11,505 | 12,166 | — | 4 | — | 12,170 | |||||||||||||||||||||||||||||
Other liabilities | 9,823 | 506 | 2,030 | (53 | ) | 12,305 | 10,518 | 505 | 2,176 | (53 | ) | 13,146 | |||||||||||||||||||||||||||
Total non-current liabilities | 55,683 | 506 | 54,892 | (66 | ) | 111,015 | 41,126 | 505 | 55,615 | (71 | ) | 97,175 | |||||||||||||||||||||||||||
Total Liabilities | 99,400 | 694 | 103,587 | (1,374 | ) | 202,307 | 87,114 | 697 | 95,679 | (1,410 | ) | 182,080 | |||||||||||||||||||||||||||
Commitments and contingencies | |||||||||||||||||||||||||||||||||||||||
Equity | |||||||||||||||||||||||||||||||||||||||
Common stock, $0.01 par value | 14 | — | — | — | 14 | 14 | — | — | — | 14 | |||||||||||||||||||||||||||||
Preferred stock, $0.01 par value | — | — | — | — | — | — | — | — | — | — | |||||||||||||||||||||||||||||
Additional paid-in capital(b)(e) | 26,032 | 57 | 1,283 | (1,359 | ) | 26,014 | 26,095 | 50 | 1,283 | (1,354 | ) | 26,074 | |||||||||||||||||||||||||||
Retained earnings(b) | 12,344 | 1,397 | 12,149 | (4 | ) | 25,885 | 12,303 | 1,566 | 13,013 | (22 | ) | 26,860 | |||||||||||||||||||||||||||
Accumulated other comprehensive loss | (10,163 | ) | — | (1,637 | ) | — | (11,800 | ) | (10,062 | ) | — | (1,094 | ) | — | (11,156 | ) | |||||||||||||||||||||||
Total stockholders’ equity | 28,228 | 1,454 | 11,794 | (1,363 | ) | 40,113 | 28,348 | 1,617 | 13,202 | (1,376 | ) | 41,792 | |||||||||||||||||||||||||||
Noncontrolling interests(e) | 944 | 1,921 | — | 1,340 | 4,204 | 918 | 1,916 | — | 1,331 | 4,165 | |||||||||||||||||||||||||||||
Total Equity | 29,171 | 3,375 | 11,794 | (23 | ) | 44,317 | 29,266 | 3,533 | 13,202 | (43 | ) | 45,957 | |||||||||||||||||||||||||||
Total Liabilities and Equity | $ | 128,571 | $ | 4,069 | $ | 115,381 | $ | (1,397 | ) | $ | 246,624 | $ | 116,380 | $ | 4,230 | $ | 108,881 | $ | (1,454 | ) | $ | 228,037 | |||||||||||||||||
_________
(a) | Amounts may not sum due to rounding. |
(b) | Elimination includes Cruise investment in GM common stock at March 31, 2020 and December 31, 2019. |
(c) | Eliminations primarily include GM Financial accounts receivable of $670 million offset by Automotive accounts payable and Automotive accounts receivable of $43 million offset by GM Financial accounts payable at March 31, 2020 and GM Financial accounts receivable of $678 million offset by Automotive accounts payable and Automotive accounts receivable of $78 million offset by GM Financial accounts payable at December 31, 2019. |
(d) | Eliminations include GM Financial loan receivable of $552 million and $517 million offset by an Automotive loan payable at March 31, 2020 and December 31, 2019. |
(e) | Primarily reclassification of GM Financial Cumulative Perpetual Preferred Stock, Series A and B. The preferred stock is classified as noncontrolling interests in our condensed consolidated balance sheet. |
11
General Motors Company and Subsidiaries
Combining Cash Flow Information
(In millions) (Unaudited)(a)
Three Months Ended March 31, 2020 | Three Months Ended March 31, 2019 | ||||||||||||||||||||||||||||||||||||||
Automotive | Cruise | GM Financial | Reclassification/Eliminations | Combined | Automotive | Cruise | GM Financial | Reclassification/Eliminations | Combined | ||||||||||||||||||||||||||||||
Cash flows from operating activities | |||||||||||||||||||||||||||||||||||||||
Net income (loss) | $ | 265 | $ | (166 | ) | $ | 170 | $ | 18 | $ | 286 | $ | 2,001 | $ | (118 | ) | $ | 273 | $ | (11 | ) | $ | 2,145 | ||||||||||||||||
Depreciation and impairment of Equipment on operating leases, net | 36 | — | 1,770 | — | 1,806 | 16 | — | 1,881 | — | 1,897 | |||||||||||||||||||||||||||||
Depreciation, amortization and impairment charges on Property, net | 1,476 | 8 | 18 | — | 1,502 | 2,199 | 2 | 18 | — | 2,219 | |||||||||||||||||||||||||||||
Foreign currency remeasurement and transaction (gains) losses | (117 | ) | — | 1 | — | (116 | ) | 82 | — | (2 | ) | — | 80 | ||||||||||||||||||||||||||
Undistributed earnings of nonconsolidated affiliates, net | 158 | — | (26 | ) | — | 132 | (368 | ) | — | (45 | ) | — | (413 | ) | |||||||||||||||||||||||||
Pension contributions and OPEB payments | (212 | ) | — | — | — | (213 | ) | (291 | ) | — | — | — | (291 | ) | |||||||||||||||||||||||||
Pension and OPEB income, net | (264 | ) | — | — | — | (263 | ) | (149 | ) | — | — | — | (149 | ) | |||||||||||||||||||||||||
Provision (benefit) for deferred taxes | 212 | (70 | ) | 46 | — | 188 | (273 | ) | (47 | ) | 67 | — | (253 | ) | |||||||||||||||||||||||||
Change in other operating assets and liabilities(b)(c)(d) | (1,217 | ) | 20 | 234 | (798 | ) | (1,761 | ) | (5,424 | ) | 16 | (49 | ) | 141 | (5,316 | ) | |||||||||||||||||||||||
Net cash provided by (used in) operating activities | 337 | (208 | ) | 2,213 | (781 | ) | 1,561 | (2,207 | ) | (147 | ) | 2,143 | 130 | (81 | ) | ||||||||||||||||||||||||
Cash flows from investing activities | |||||||||||||||||||||||||||||||||||||||
Expenditures for property | (1,205 | ) | (5 | ) | (14 | ) | — | (1,224 | ) | (1,993 | ) | (4 | ) | (17 | ) | — | (2,014 | ) | |||||||||||||||||||||
Available-for-sale marketable securities, acquisitions | (3,281 | ) | (810 | ) | — | — | (4,091 | ) | (677 | ) | — | — | — | (677 | ) | ||||||||||||||||||||||||
Available-for-sale marketable securities, liquidations | 911 | 208 | — | (6 | ) | 1,113 | 678 | 12 | — | (12 | ) | 678 | |||||||||||||||||||||||||||
Purchases of finance receivables, net(b)(c) | — | — | (6,939 | ) | 565 | (6,374 | ) | — | — | (7,222 | ) | 7 | (7,215 | ) | |||||||||||||||||||||||||
Principal collections and recoveries on finance receivables(c) | — | — | 4,890 | (151 | ) | 4,739 | — | — | 6,370 | (163 | ) | 6,207 | |||||||||||||||||||||||||||
Purchases of leased vehicles, net | — | — | (3,733 | ) | — | (3,733 | ) | — | — | (3,747 | ) | — | (3,747 | ) | |||||||||||||||||||||||||
Proceeds from termination of leased vehicles | — | — | 3,088 | — | 3,088 | — | — | 3,059 | — | 3,059 | |||||||||||||||||||||||||||||
Other investing activities | (17 | ) | (1 | ) | — | (70 | ) | (88 | ) | (4 | ) | — | 1 | 1 | (2 | ) | |||||||||||||||||||||||
Net cash provided by (used in) investing activities | (3,592 | ) | (607 | ) | (2,710 | ) | 338 | (6,570 | ) | (1,996 | ) | 8 | (1,556 | ) | (167 | ) | (3,711 | ) | |||||||||||||||||||||
Cash flows from financing activities | |||||||||||||||||||||||||||||||||||||||
Net increase in short-term debt | — | — | 13 | — | 13 | 480 | — | 479 | — | 959 | |||||||||||||||||||||||||||||
Proceeds from issuance of debt (original maturities greater than three months) | 16,362 | — | 19,502 | — | 35,863 | 683 | 1 | 11,074 | (1 | ) | 11,757 | ||||||||||||||||||||||||||||
Payments on debt (original maturities greater than three months) | (104 | ) | — | (11,259 | ) | 25 | (11,339 | ) | (110 | ) | — | (10,682 | ) | 15 | (10,777 | ) | |||||||||||||||||||||||
Dividends paid(d) | (545 | ) | — | (445 | ) | 400 | (590 | ) | (565 | ) | (16 | ) | (46 | ) | 1 | (626 | ) | ||||||||||||||||||||||
Other financing activities | (257 | ) | — | (28 | ) | 17 | (267 | ) | (222 | ) | (2 | ) | (34 | ) | 22 | (236 | ) | ||||||||||||||||||||||
Net cash provided by (used in) financing activities | 15,455 | — | 7,782 | 442 | 23,680 | 266 | (17 | ) | 791 | 37 | 1,077 | ||||||||||||||||||||||||||||
Effect of exchange rate changes on cash, cash equivalents and restricted cash | (288 | ) | — | (159 | ) | — | (448 | ) | (8 | ) | — | 8 | — | — | |||||||||||||||||||||||||
Net increase (decrease) in cash, cash equivalents and restricted cash | 11,912 | (815 | ) | 7,126 | — | 18,223 | (3,945 | ) | (156 | ) | 1,386 | — | (2,715 | ) | |||||||||||||||||||||||||
Cash, cash equivalents and restricted cash at beginning of period | 13,487 | 2,355 | 7,102 | — | 22,943 | 13,762 | 2,291 | 7,443 | — | 23,496 | |||||||||||||||||||||||||||||
Cash, cash equivalents and restricted cash at end of period | $ | 25,398 | $ | 1,540 | $ | 14,228 | $ | — | $ | 41,166 | $ | 9,817 | $ | 2,135 | $ | 8,829 | $ | — | $ | 20,781 | |||||||||||||||||||
_________
(a) | Amounts may not sum due to rounding. |
(b) | Includes reclassifications of $325 million and $200 million in the three months ended March 31, 2020 and 2019 for purchases/collections of wholesale finance receivables resulting from vehicles sold by GM to dealers that have arranged their inventory floor plan financing through GM Financial. |
(c) | Eliminations include $240 million and $207 million in Purchases of finance receivables, net in the three months ended March 31, 2020 and 2019, and $151 million and $163 million in Principal collections and recoveries on finance receivables in the three months ended March 31, 2020 and 2019 primarily related to the re-timing of cash receipts and payments between Automotive and GM Financial. |
(d) | Eliminations include dividends issued by GM Financial to Automotive. |
12