Operator
Good morning. My name is Krista, and I would like to welcome everyone to the JetBlue Airways Fourth Quarter 2025 Earnings Conference Call. As a reminder, today's call is being recorded. At this time, all participants are in a listen-only mode. I would now like to turn the call over to JetBlue's Director of Investor Relations, Kush Patel. Please go ahead, sir.
Thanks, Krista. Good morning, everyone, and thanks for joining us for our Fourth Quarter 25 earnings call. This morning, we issued our earnings release and a presentation that we will reference during this call. All of those documents are available on our website at investor.jetlue.com and on the SEC's website at www.srcc.gov. In New York, to discuss our results are Devon Garrity, our Chief Executive Officer, Martin St. George, our President, and Ursula Hurley, our Chief Financial Officer. During today's call, we will make forward-looking statements within the meaning of the safe harbor provisions of the private securities litigation reform act date of 1995. Such world-looking statements include, without limitation, statements regarding our first quarter and full year 2026 financial outlook and future results of operations and financial position, including a long-term financial target. Financial targets are uncertainties, or materially from those of our most recent earnings release, as well, made only as of the date of this call. This will be required by law. We have to take into of the application. Investors should not place undue reliance evidence for eight minutes. Also during the course of this call, we may. And now I'd like to turn the call over to Joanna Carity. Okay.
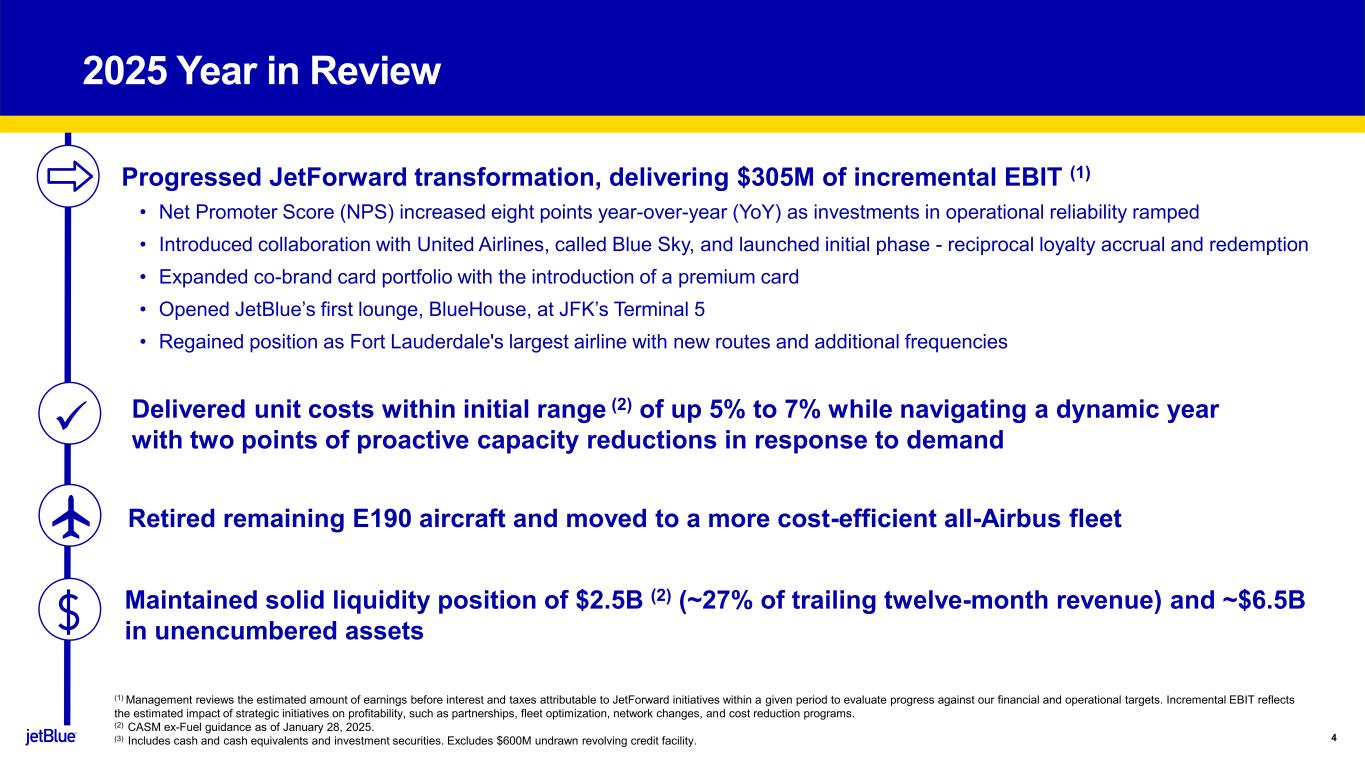
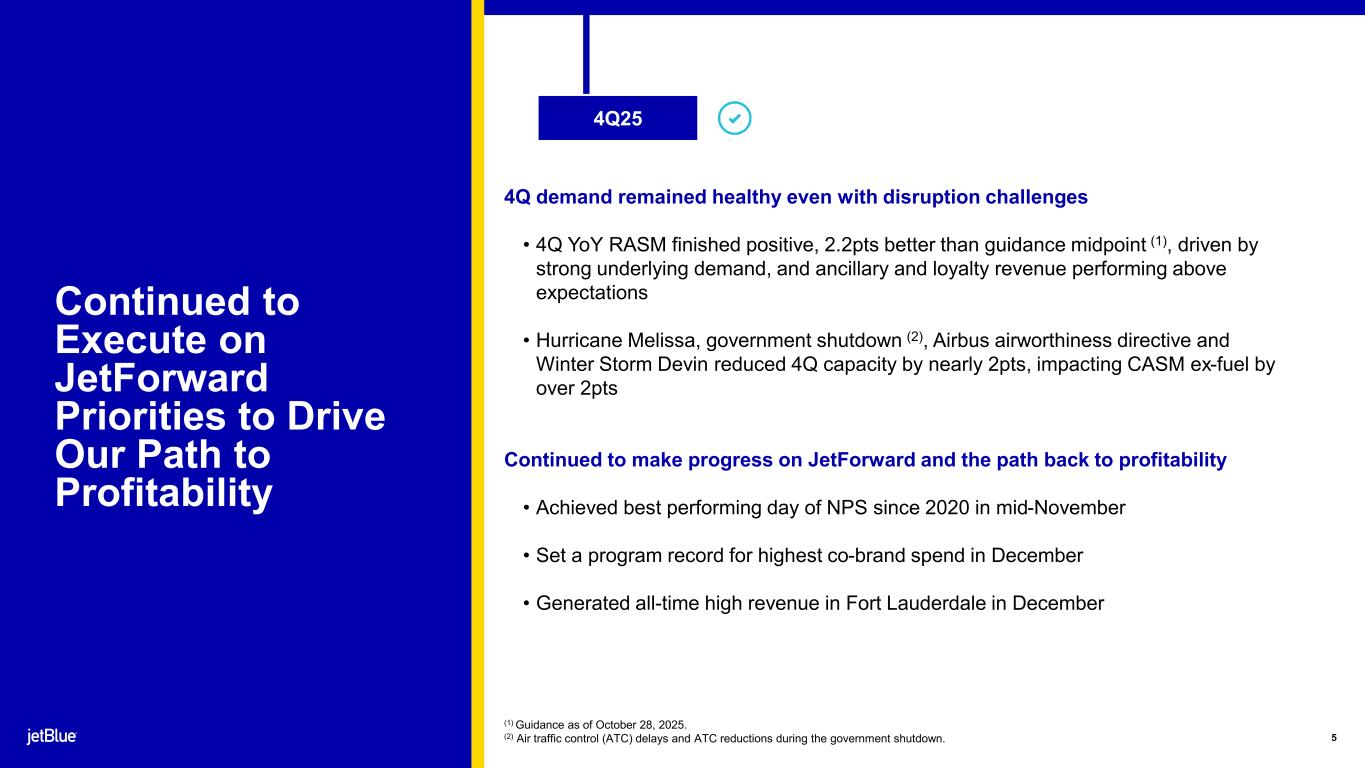
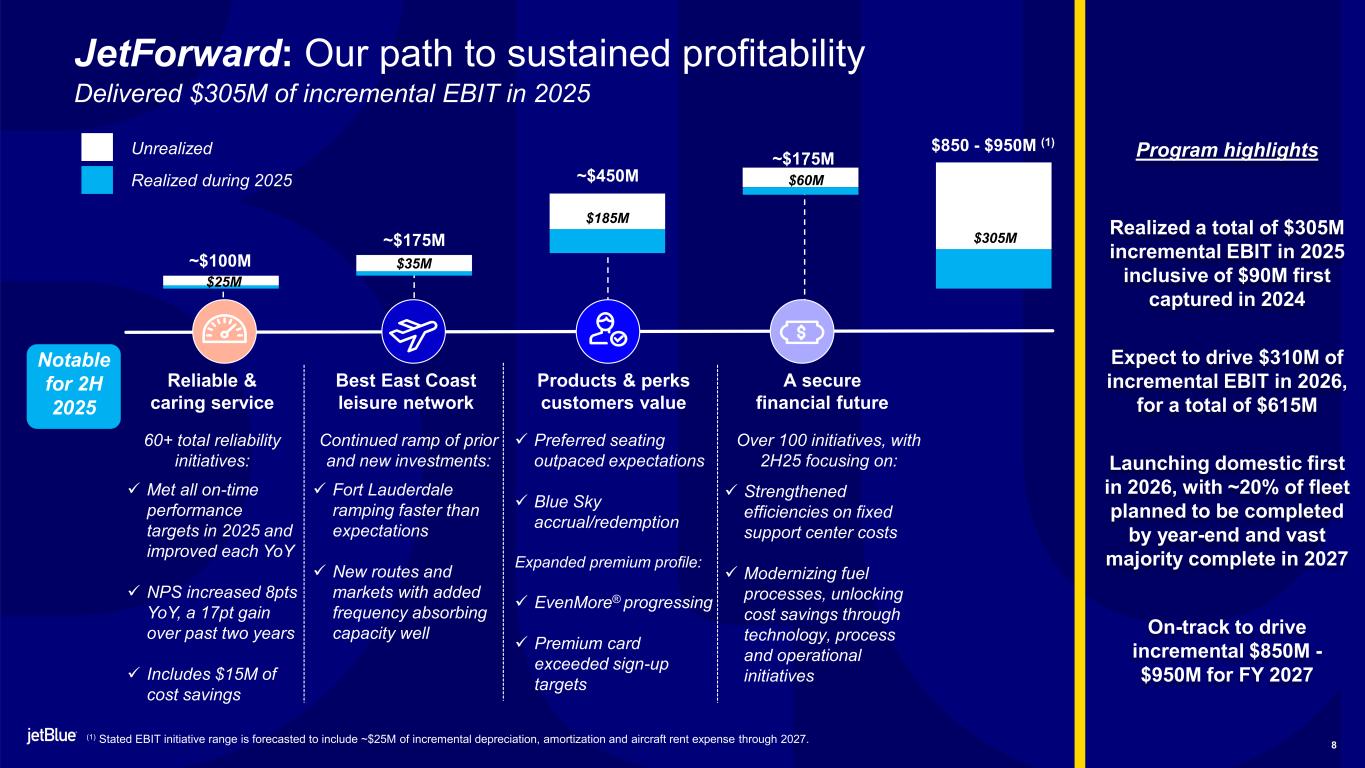
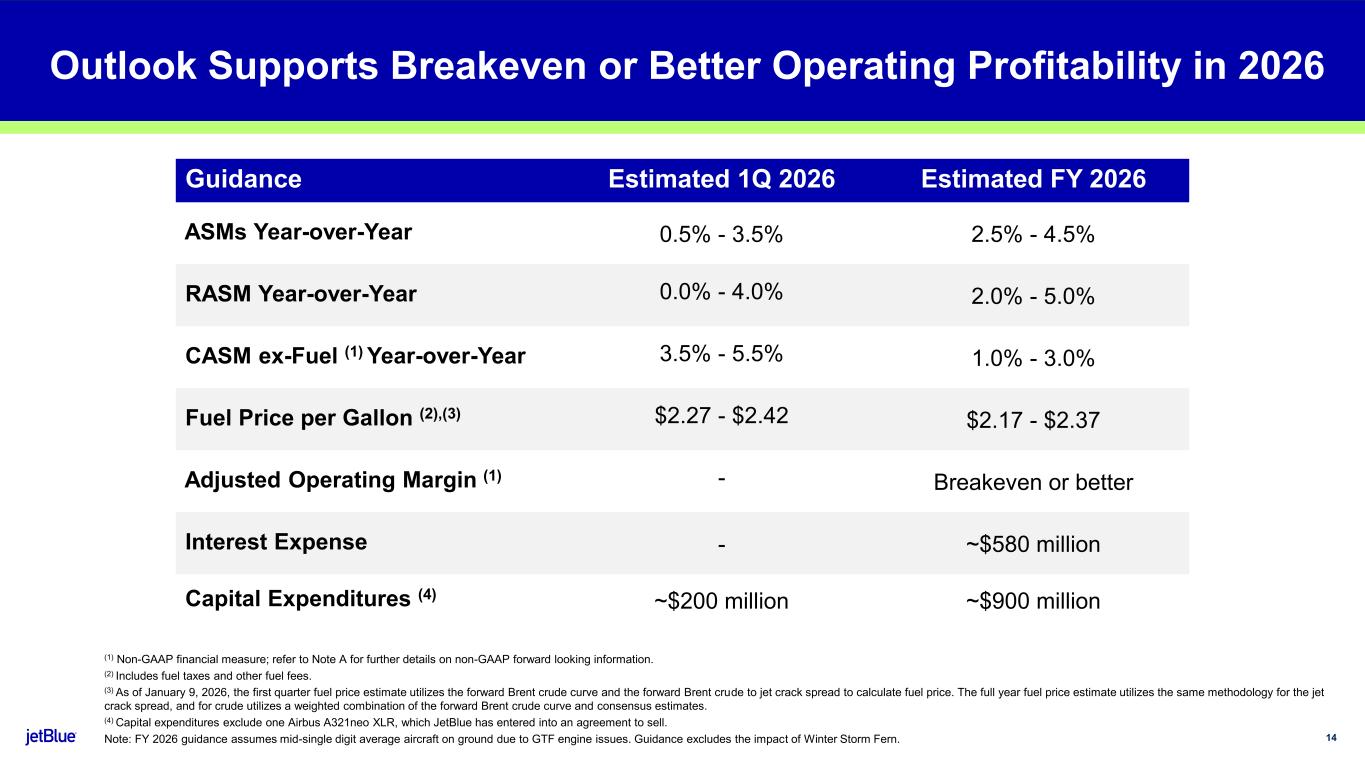
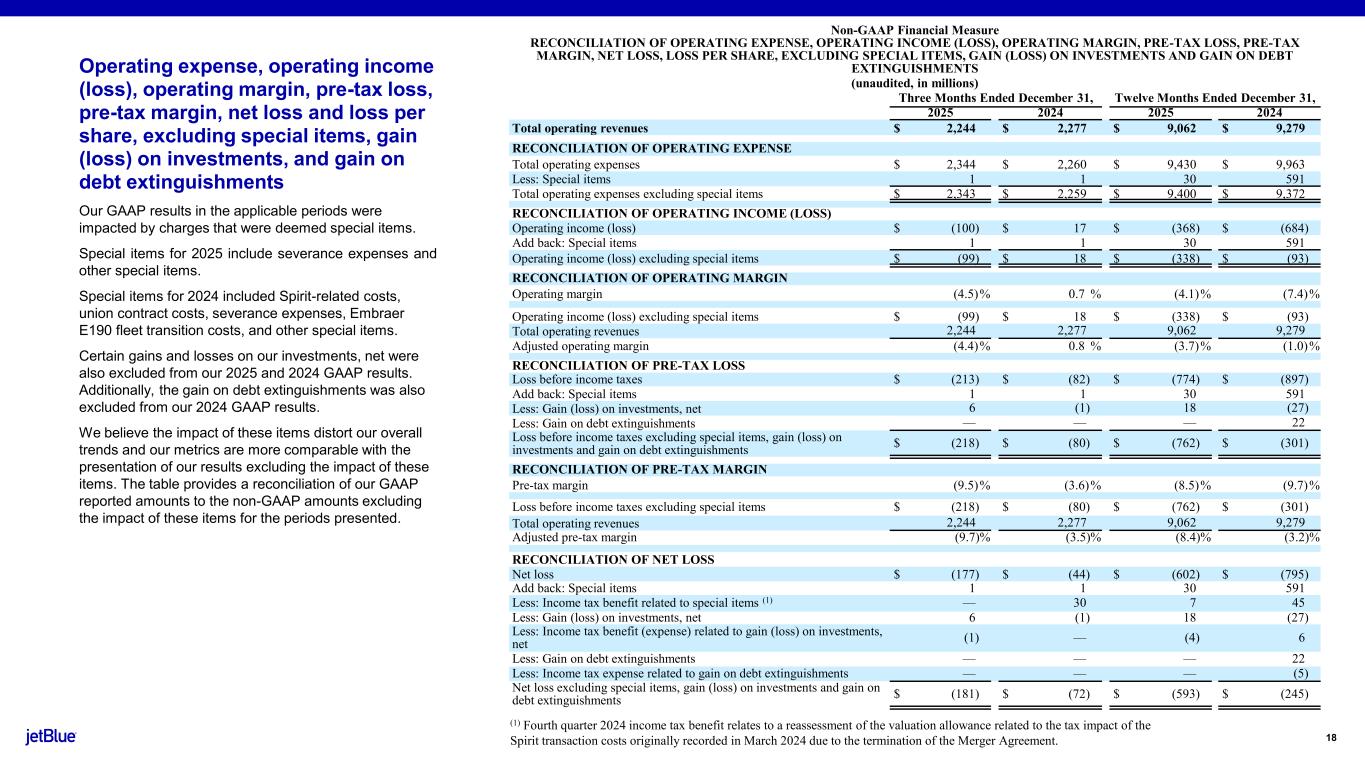
Good morning and thank you for joining JetBlue's fourth quarter and full year 2025 earnings call. I want to thank our crew members for their continued dedication to running a safe operation, especially during Winter Storm Firm, who's canceled over 1,100 flights as a result of the storm, and the industry remains in recovery mode. While today's forward-looking guidance excludes the storm's impact, given January is typically a trough period for us, we don't currently expect the impact to be material to achieving our full-year earnings guidance. Before we get to 2026, let's take a look at the calendar year of our Jet Forward transformation. I am very proud of what we've accomplished. In the face of a government shutdown, macro uncertainty and need to work for our performance has been a key proof of transformation the prior year and narrowed the gap. What makes this even more significant is that it follows an equally strong 2024 when we also beat all of our on-time performance targets. Two consecutive years of reliability improvements are a direct result of forward investments, smarter planning, and doing the basics well. Our customers are recognizing these meaningful reliability improvements. I want to emphasize this. In 2025, we achieved an eight-point gain in Net Promoter Score and a 17-point gain since the beginning of 2024 and the launch of Jet Forward, making us once again a leader in customer satisfaction. This improved experience is driving loyalty and, in turn, has increased the rate at which customers return to fly JetBlue. The progress we've made on delivering reliable and caring service not only increases customer satisfaction, it also sets a solid foundation to enable the success of our other priority Our products and perks are increasingly capturing more premium revenue, following the enhancement of even more, the continued outperformance of preferred seating, the release of our premium credit card, which far exceeded sign-up targets last year, and the opening of our first-ever lounge at JFK. And not to forget, we won the J.D. Power Award for the best business class product last year. Our network changes continued to progress well, even as we capitalized on near-term strategic opportunities in Fort Lauderdale, where customer response to our close-in schedule additions has greatly exceeded our expectations. Now, underlying it all, we maintained a tight hold on costs in the face of meaningful capacity reductions. Taken together, these Jet Forward initiatives delivered $305 million of incremental EBITs, slightly better than our initial expectations. This outcome gives me great confidence that Jet Forward continues to be the right plan. Macro uncertainty pressured industry demand last year and impacted results versus our initial full-year operating margin guidance of 0 to 1 percent. As previously shared, we estimate this uncertainty represented more than four points of headwind to operating margin for the year, impeding our path to restoring operating profitability in 2025, and resulting in an adjusted operating margin of negative 3.7%. Looking ahead to 26, we are focused on turning the progress from our Jet Forward initiative into improved profitability. At a high level, our full-year guidance is based upon 3.5 points of capacity growth, 3.5 points of unit revenue improvement, and 2% non-fuel unit cost growth. growth, all contributing to our forecast of breakeven operating margin or better. Our guidance assumes the macro environment continues to provide a constructive baseline for demand. Any incremental recovery in GDP or reduction in fuel prices beyond consensus estimates represents a potential upside as 2026 progresses. Critically, we expect to deliver $310 million of incremental EBIT from JetForward this year for a total of $615 million in 2026. This keeps us on track to deliver $850 to $950 million of total incremental EBIT for the full year 2027. The incremental EBIT growth in 2026 is driven by the continued ramp of our existing initiatives and the launch of several exciting new initiatives, including rolling out the remaining key components of our Blue Skies collaboration with United, the opening of our Boston Lounge, and the launch of our domestic first-class products. Though it has already been a dynamic start to the year with the temporary closure of a portion of Caribbean airspace and Winter Storm Fern, our focus remains on controlling what we can and translating these efforts into several points of operating margin improvement in 2026. With that, I will turn it over to Marty.
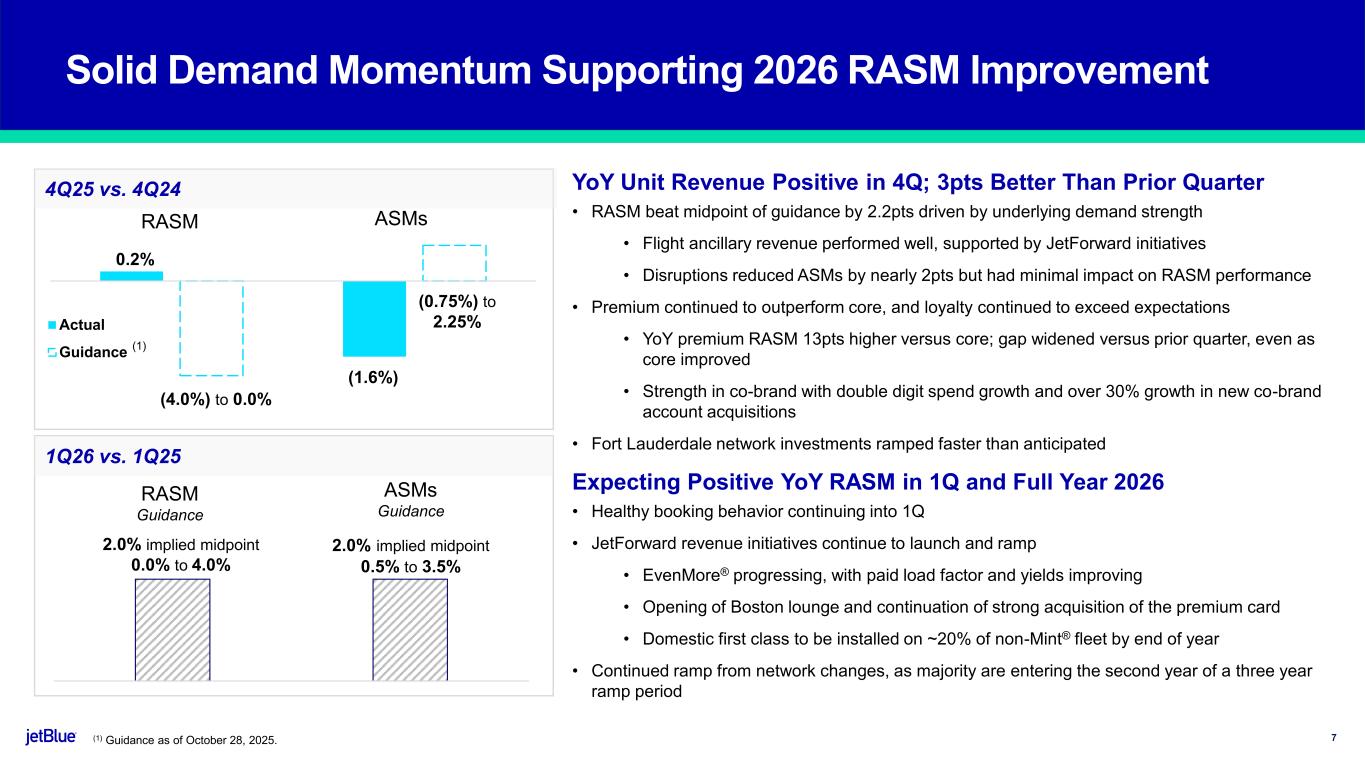
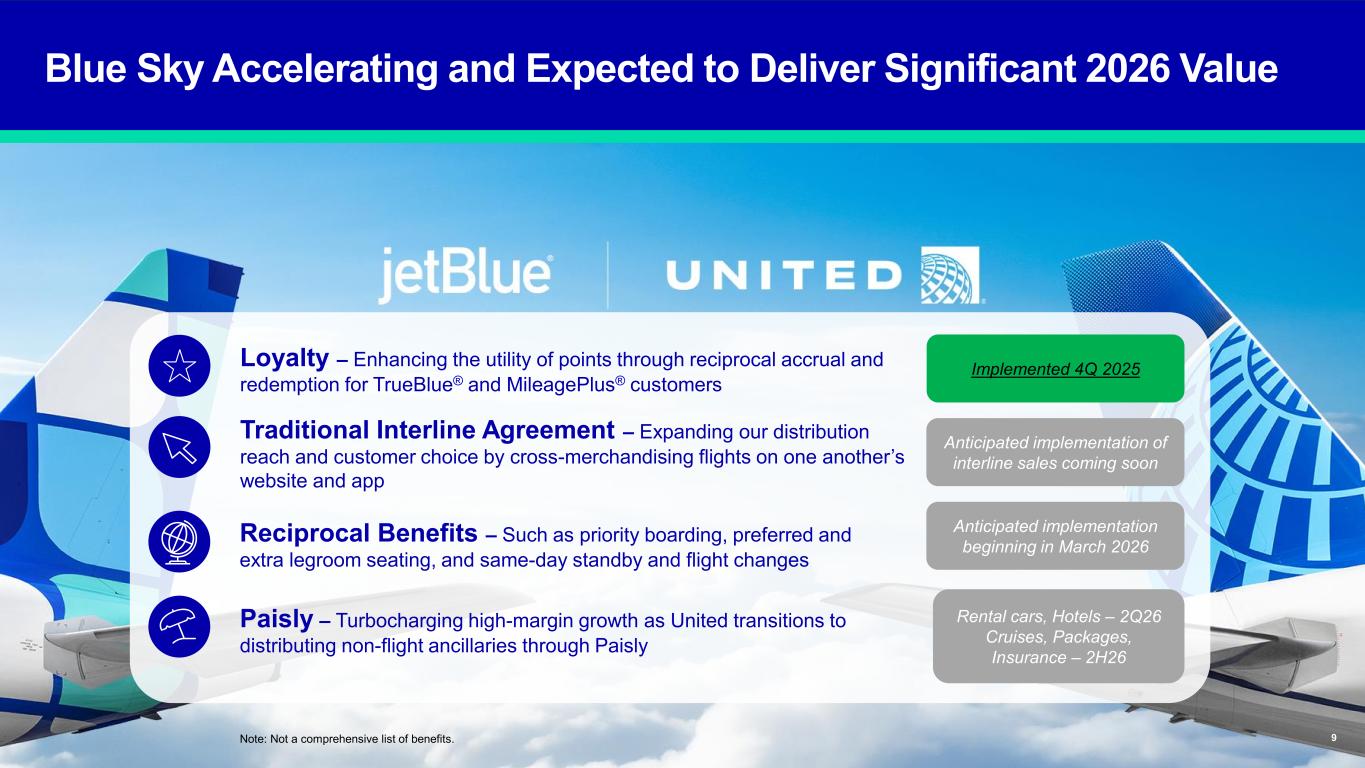
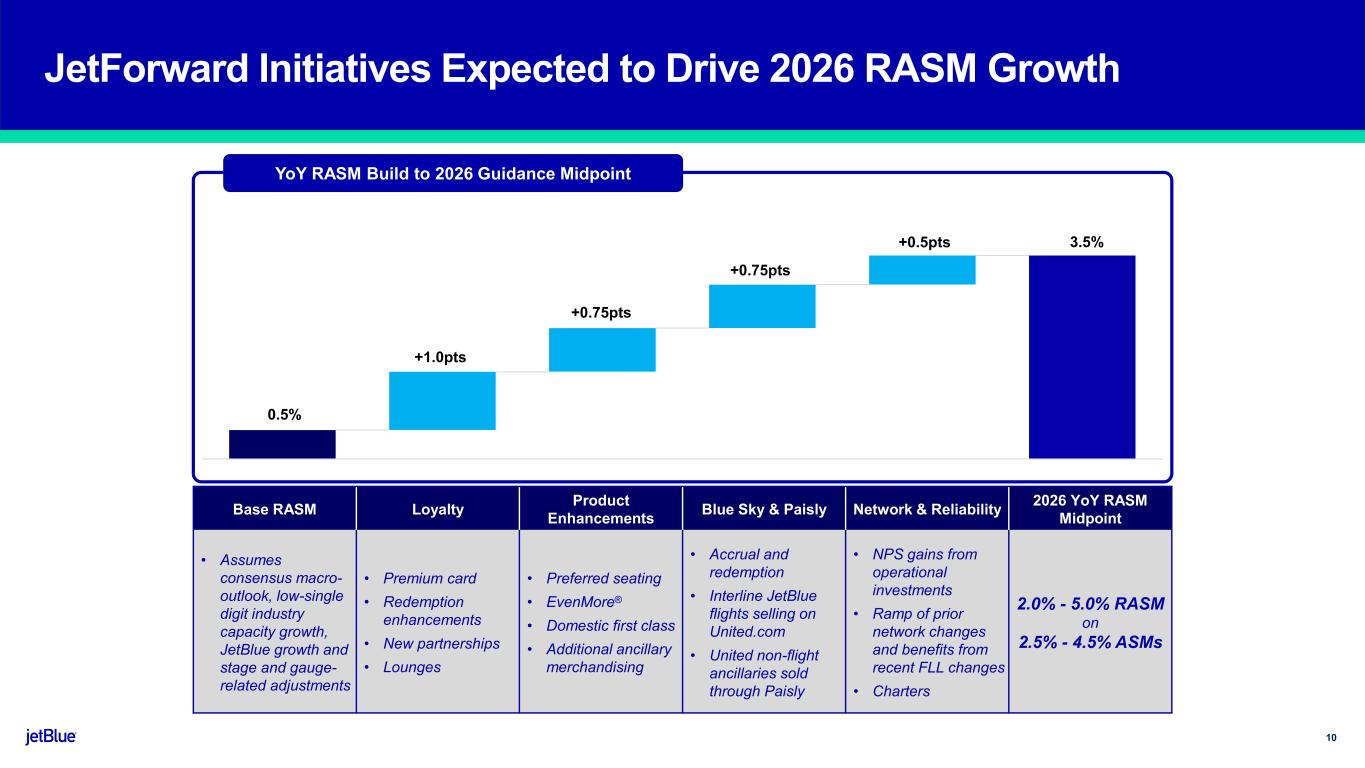
Thank you, Joanna. And once again, a sincere thank you to our crew members who stepped up to keep our operation running safely throughout 2025 and into 2026. So turning to slide 7 of the presentation, fourth quarter, year-over-year, unit revenue finished up 0.2%, over two points better than our guidance midpoint, and nearly three points better than our third quarter performance. The majority of our ransom beat was driven by underlying demand strength, coupled with loyalty, ancillaries, and other revenue exceeding expectations. Importantly, those trends have carried forward into early first quarter bookings. We've seen a healthy recovery in domestic performance, with year-over-year RASM for the fourth quarter better than that of international flying. The booking curve further normalizes throughout the quarter with strong close-in booking performance for holiday travel that was more in line with historic levels. And as we've discussed throughout the year, the fourth quarter continued to show strong peak period performance, while off-peak demand remains more pressured. Our positive RASM was propelled by premium growth, with premium RASM outperforming core RASM by 13 points in the quarter, reinforcing the strategic importance of our investments in Mint even more, Loyalty, Lounges, and coming later this year, Domestic First. To complement this addition, we are also refreshing our award-winning Mint Cabin's in-flight food menu later this year. We have over a decade of experience serving the premium customer, and we are excited to continue refining the premium experience, whether in Mint, Blue House, or Domestic First us. We are also proud of the improvements we have made to our core offerings with changes to our Blue Basic fare and improvements in reliability and hospitality. We continue to make refinements across the cabin to make sure that all customers have a reason to return to JetBlue. Additionally, the improvements we've made to our operation and customer experience with JetForward have translated into even stronger brand loyalty and we capitalized on that in 2025. Loyalty revenue grew by 8% for the full year and a year when capacity was down 1.6% and now accounts for over 13% of total revenue, up from 11% in 2023. The introduction of our Blue Sky collaboration with United has made True Blue even more relevant across new geographies and combined with our loyalty programs leading customer satisfaction gives us confidence in continued outside loyalty and premium growth. Co-brand performance accelerated throughout the year with double-digit spend growth and over 30% growth in new co-brand account acquisitions in the fourth quarter. Our first lounge called Blue House has been open at JFK for over a month and is generating rate reviews. Since opening we've seen lounge NPS in the mid 80s alongside a meaningful increase in the acquisition rate of our premium co-branded credit card. Turning to the network, in the fourth quarter we added significant close-in capacity to our Fort Lauderdale focus city. The ramp of this strategic expansion, we've announced over 20 new non-stop destinations plus increased frequency on a dozen others, is materializing faster than our initial expectations. While we initially expected a one-point random headwind in the fourth quarter resulting from the closer nature of growth, the impact was closer to half a point, reflecting customers' strong response to our scheduled additions and preference for our award-winning customer experience. Fort Lauderdale represents a strong premium leisure market at both an origin and destination. We are now offering up to 26 daily mid-flights touching Fort Lauderdale this winter, offering more domestic lifelike seats than any other carrier in Florida. In addition, Fort Lauderdale sits strategically between our strong foothold in the Northeast and our robust Latin and Caribbean network, making it a well-placed connection gateway for customers, with significant upside potential for JetBlue. With our far better customer experience and competitive affairs, and now more destinations, we are pleased to bring even more value and choice to customers in Fort Lauderdale and across South Florida. These initiatives and more have contributed to our Jet Forward performance in 2025. Jet Forward delivered a total of $305 million of incremental EBIT last year. On slide eight of our earning presentation, we've broken down each priority move and the key initiatives that delivered value in the second half of 2025. We're capitalizing on this progress and more in 2026. It will be a big year for Blue Sky, as we expect to roll out the remaining key features this collaboration with United throughout the year. We expect to activate cross-selling interline flights on each other's websites very soon. This will be followed by mutual elite customer loyalty benefits turning on as the year progresses. Through the second quarter, we expect to begin selling United's non-air ancillaries through our Pager subsidiary. We plan to launch with car rentals, followed by hotels, cruisers, vacation packages, and travel insurance, with the expectation to be selling all ancillary products by the end of the year. Lastly, turning to guidance. For the first quarter, we expect capacity to be up 0.5% to 3.5% year-over-year, with unit revenue growth in the range of flat to up 4%, supported by demand momentum actually the fourth quarter, and a constructive competitive capacity backdrop. We estimate the closure of Caribbean airspace in early January, and some lingering demand impact will be a headwind to RASM of less than a point for the quarter, which is incorporated in our guidance. As Rwanda mentioned, not incorporated in our formal guidance are the recent impacts of what's still infirm. For the full year, we plan to deliver unit revenue growth of 2 to 5 percent on capacity growth of 2.5 to 4.5 percent, contributing to break-even operating profitability or better. We expect positive year-over-year RASM growth in each quarter in 2026, but more weighted toward the second half of the year as an initiative's ramp. A RASM guidance is dependent on four key drivers, highlighted on slide 10 of our presentation. These drivers are part of Jet Forward and larger than I control, which gives me confidence in our ability to execute. A larger driver's loyalty, driving about one point of the year-over-year RASM. We expect to grow loyalty revenue as a percentage of total revenue by about 1.14%, driven by added reduction options and the opening of lawsuits. Next are product enhancements, which are expected to contribute three-quarters of a point of These enhancements help to drive yield and improve load factor as our offering evolves. Additionally, Blue Sky and Paisley are expected to drive another three-quarters of a point, and we believe the maturing of our network changes and improving customer satisfaction will contribute the remaining half a point to get to a full-year RASM midpoint of up 3.5%. Ultimately, we expect the combination of these drivers and over 200 underlying JetForward initiatives to result in a more competitive customer value proposition, translating the rise of growth, exceeding cash in growth this year, and supporting our path back to sustained profitability. While the environment remains dynamic, the progress we've made through JetForward gives us confidence that we are positioned to deliver on our commitments in 2026. I will now turn it over to Ursula.
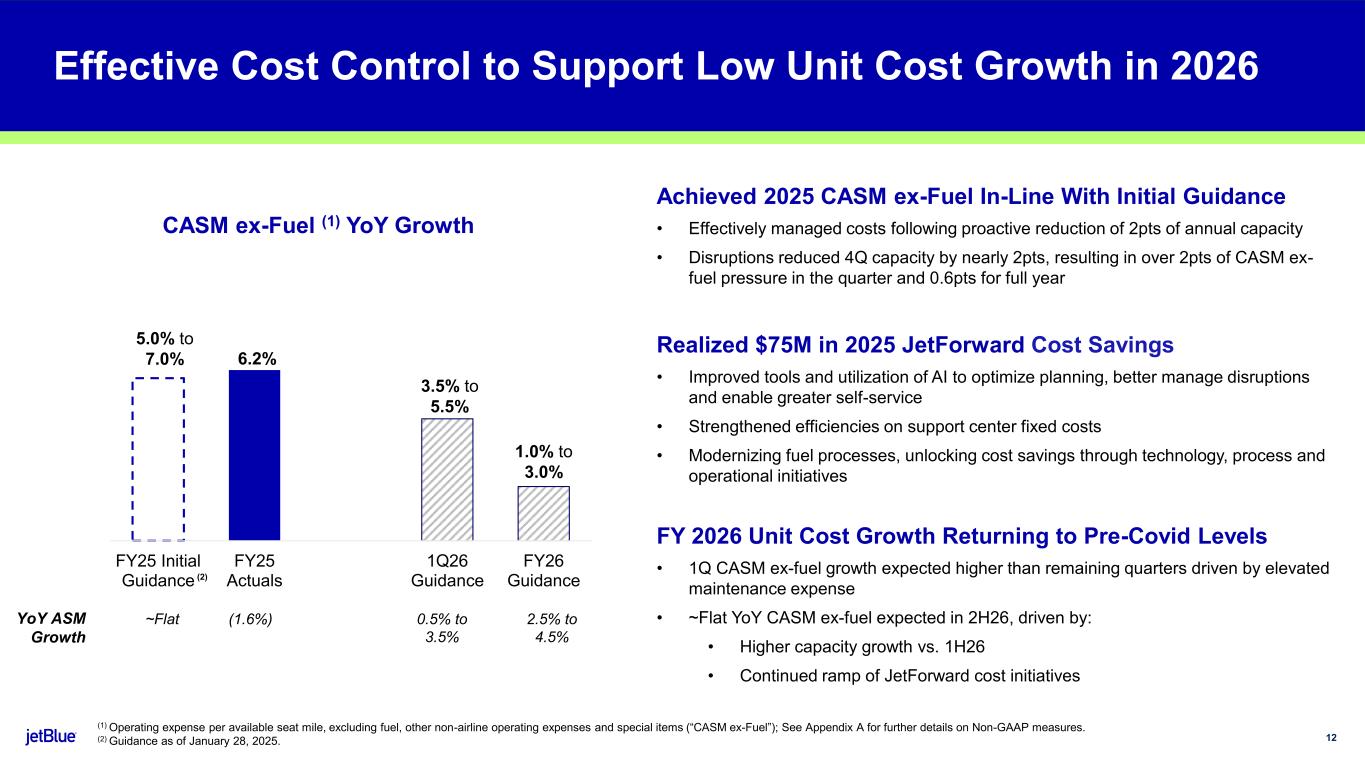
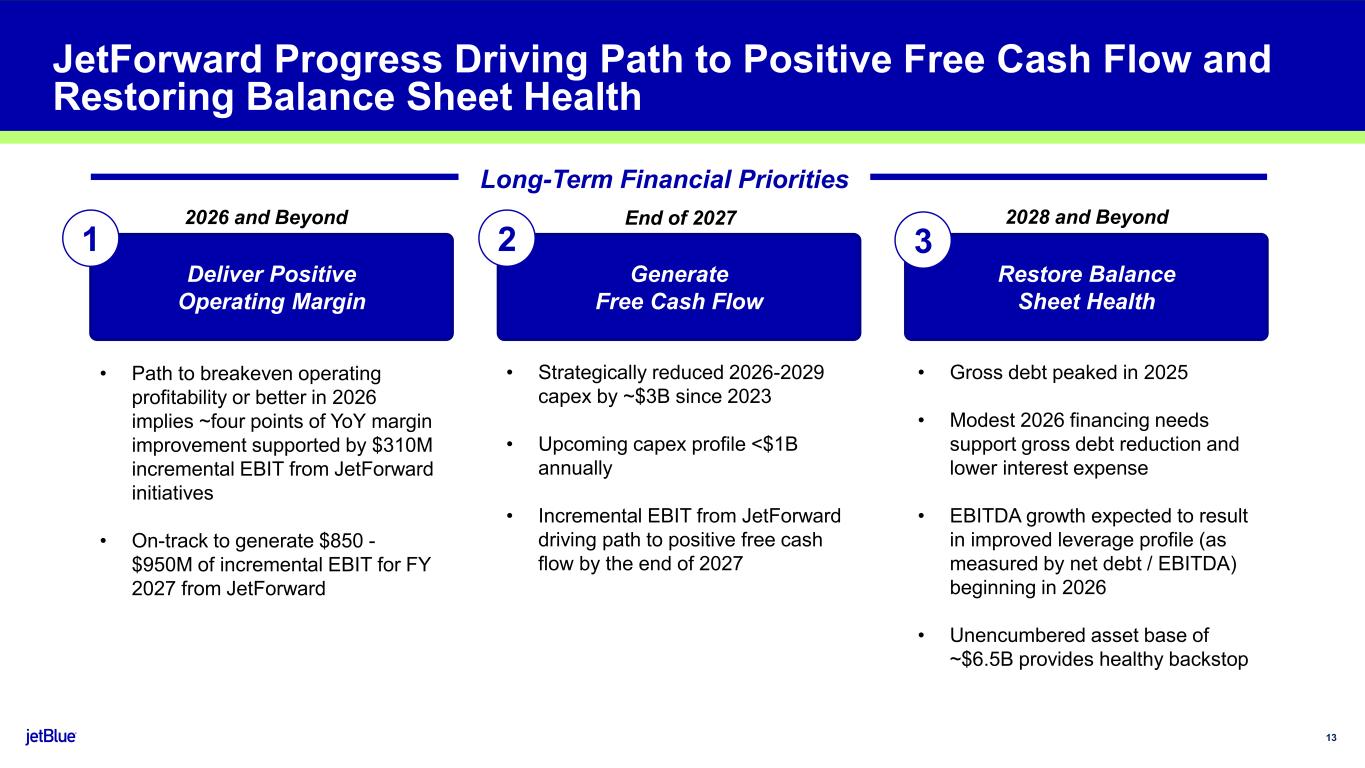
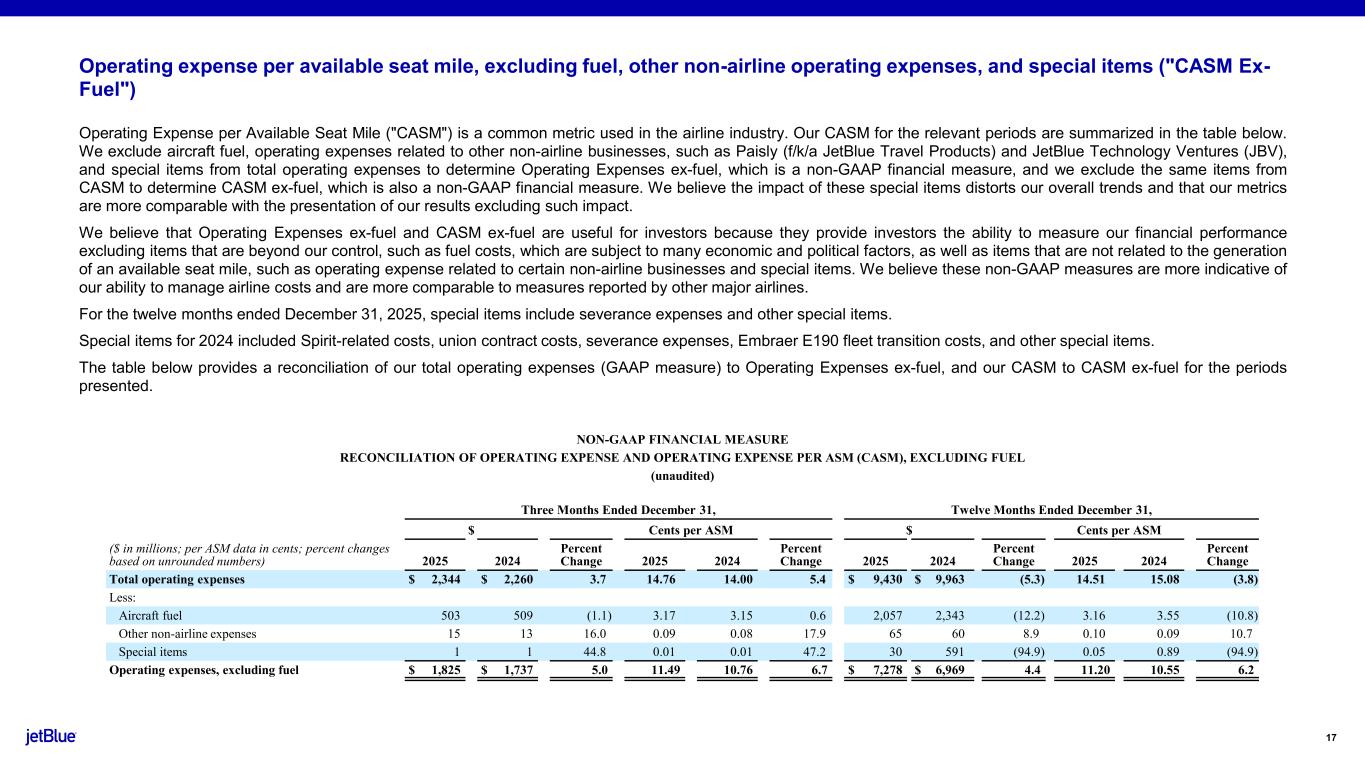
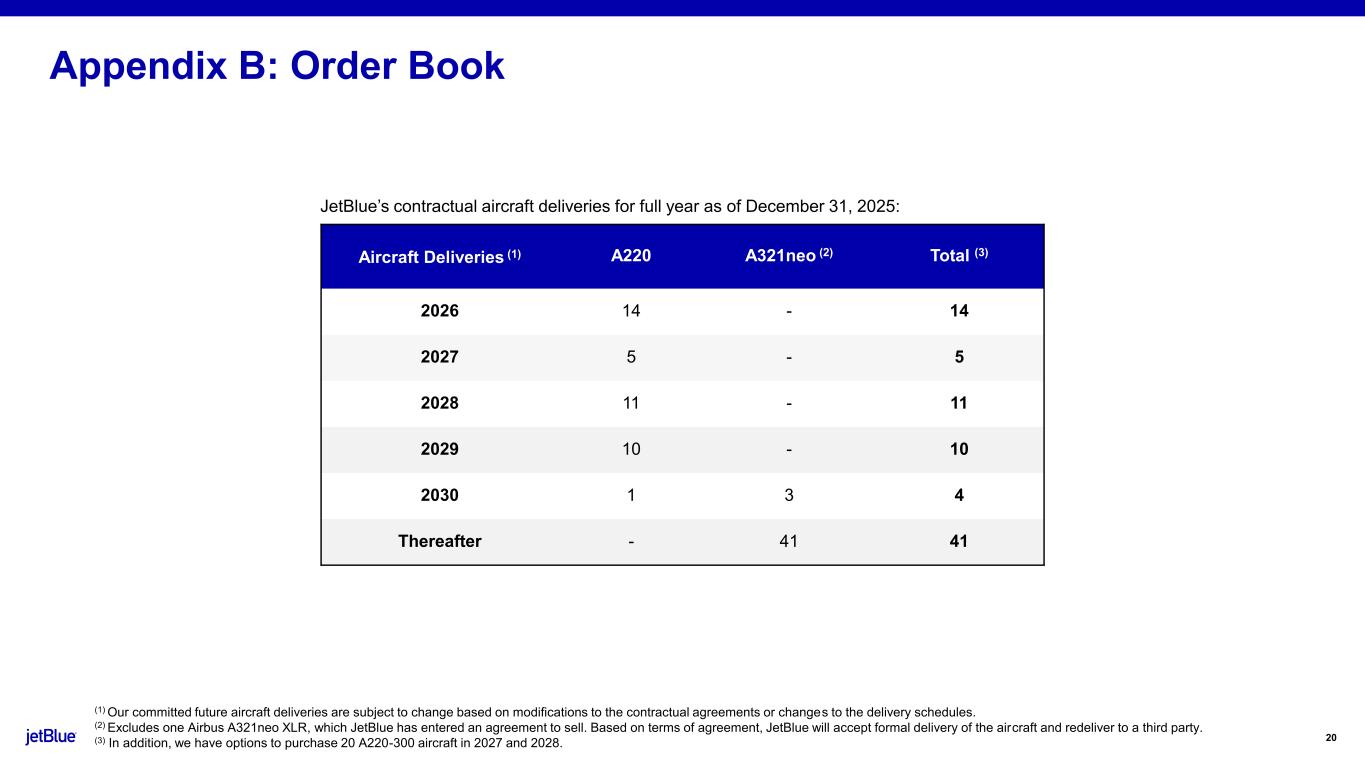
Thank you, Marty. I want to reiterate what Joanna said about 2025. I am very proud of our team for controlling what we could amidst a dynamic environment to deliver on our full-year cost outlook and build a strong foundation for what's next. We adjusted our business to navigate a challenging macro environment. We proactively reduced capacity by two points over the year as demand softened. We identified cost savings above and beyond our initial budget. And most importantly, we progressed on JetForward and delivered $305 million of incremental EBIT in the face of all these challenges. Turning to slide 12, the fourth quarter was marked by a high volume of unforeseen external events. Despite this, the team did an excellent job recovering from each event and moving forward under difficult circumstances. For the quarter, CHASM-X Fuel was up 6.7 percent, disruptions from the government shutdown, the Airbus Airworthiness Directive, and two major weather events added cost, reduced capacity by nearly two points, and drove the gap to our initial CHASM-X Fuel guidance. Fuel price was also a headwind in the quarter, with crack spreads rising sharply in late October and later moderating in conjunction with breads, resulting in a fuel price of $2.51 versus our midpoint expectation of $2.40. For the full year, ChasmX Fuel finished up 6.2%. Given full year capacity was reduced by nearly 2 points versus our initial expectations, I am especially proud of the team for managing costs within our initial range of up 5-7%. And in our first official year of JetForward, we achieved substantial cost savings driven by initiatives like improved tooling and utilization of AI to optimize planning, better manage disruptions, and enable greater self-service. On the support center side, we strengthened efficiencies and our fixed costs. We also began modernizing fuel processes, unlocking cost savings through technology, process, and operational initiatives. Shifting to 2026, we expect full-year passive ex-fuel growth of 1% to 3%, driven by several factors. We averaged nine aircraft on the ground from GTF-related issues in 2025, and we expect that number to be in the mid-single digits in 2026. New deliveries will also drive capacity growth this year and provide tailwinds to labor productivity and fixed costs. Additionally, we are seeing benefits from fleet simplification efforts as we are now down to two fleet types. These benefits will be offset by higher rents and landing fees, investments in our customer experience, and the impact of tariffs. CHASM-X fuel in the first quarter is expected to grow the most of any quarter in the range of 3.5% to 5.5%, largely due to elevated maintenance expense. CHASM-X fuel growth is expected to moderate downward over the year, and especially in the second half when we expect roughly flat year-over-year CHASM-X as jet-forward cost savings initiatives ramp up and year-over-year capacity grows. We estimate fuel price to be, at the midpoint of our ranges, $2.34 for the first quarter and $2.27 for the full year. Encouragingly, fuel efficiency remains a tailwind this year. ASMs per gallon are expected to improve by approximately 1.5% in 2026, contributing to an approximately 5% total improvement over the last three years, driven by the retirement of the E-190 fleet and substantial fuel savings initiatives as part of Jet Forward. For reference, 5% of our annual fuel cost equates to $100 million of savings in 2026. Powered by an improving macro backdrop and $310 million of incremental jet-forward EBIT, we expect RASM growth of 2% to 5% and CasMX fuel growth of 1% to 3% will drive breakeven or better operating profitability this year. Turning to capital allocation and our financial priorities on slide 13. In 2025, we invested $1.1 billion in capital expenditures, primarily consisting of 20 aircraft deliveries. For 2026, we expect capital expenditures of approximately $900 million, driven by 14 aircraft deliveries and the start of domestic first-class retrofits. Since the start of Jet Forward, we've worked to secure our financial future by cutting in half our plan 2026 through 2029 capital spending from $6 billion to $3 billion. As a result of these efforts, CapEx is expected to remain below $1 billion annually through the end of the decade, enabling low- to mid-single-digit annual capacity growth while also accelerating our return to positive free cash flow. We ended the year with $2.5 billion of liquidity, excluding our undrawn $600 million revolving credit facility. This year, we expect to repay approximately $800 million of flexible throughout the year, including $325 million outstanding on our 2021 convertible notes which mature this April. To address cash needs, we intend to raise approximately $500 million in new financing, supply, supported by roughly $6.5 billion of unencumbered assets. We are focused on aircraft-backed structures and are evaluating all available markets as we prioritize securing low-cost capital. For the year, we expect gross interest expense of approximately $580 million. We know there is still much work to do on our balance sheet, but I am encouraged by steps in the right direction. Gross debt peaked last year, and in 2026, we expect our leverage profile, measured by net debt to EBITDA, to begin to improve as benefits from JetForward substantially grow our EBITDA and help us reach our goal of restoring full-year operating profitability. As we look ahead, our priorities remain the same. Getting back to sustained operating profitability, followed by generating positive free cash flow and restoring the health of our balance sheet. We believe there is a path to generating free cash flow by the end of 2027. In closing, while 2025 brought unexpected challenges, it also marked a year of meaningful progress that strengthens Jeff Liu's foundation and reinforced our confidence that Jeff Bullard is working. We enter 2026 focused, energized, and committed to returning to break-even, profitability, or better. The macro backdrop is improving. We're excited to be growing again. Our operation is performing at a level we haven't seen in years, and our commercial initiatives continue to ramp with new initiatives rolling out from blue sky to the launch of domestic first class and the opening of our second lounge in my hometown of Boston at the same time we are returning to disciplined low single-digit cost growth with these elements coming together we believe we are well positioned to restore profitability and I am eager for what comes next for jet blue with that rest out we'll open the call for questions thank you we will now
Operator
begin the question and answer session if you would like to ask a question please press star 1 on your telephone keypad to raise your hand and join the queue and if you'd like to withdraw that question again press star 1 we also ask that you You limit yourself to one question and one follow-up. For any additional questions, please re-queue. And your first question comes from Dan McKenzie with Seaport Global. Please go ahead.
Oh, hey. Thanks for the time, you guys. So premium is clearly outperforming leisure today, so my first question really starts And, you know, that is that premium seats today, I guess, are 25 percent of the total flying. But I'm wondering what percent of revenue they comprise and what you would expect that to be when you exit 2027. So, I'm thinking it's probably 30% plus today, and the question becomes could it be over, you know, could premium revenue be, you know, over 40% of revenue in 2027?
Hey, I'll take that, Dan. Thanks for the question. So, we generally have not released that number, and I think as premium becomes a bigger and bigger part, we'll have to think about how we want to manage that in the future. The one thing I do want to stress is that with the introduction of the domestic first-class products later on this year, the total percentage of premium seats is not going up dramatically. That product is basically being funded from reduction in the even more cabin. However, the quality of the seats actually goes way up and as does the yield. So it is absolutely creative. The benefit of domestic first class is clearly in the products and perks initiative under JetForward, and we're really excited about just continuing momentum we've seen for premium products, whether it's lounges, mints, even more. We have a really great track record as far as being able to deliver premium products to our customers. Our customers love them, and we are really excited to use first class later this year domestically. Yeah, yeah.
Second question here just ties to leisure revenue and the, you know, recovery glide path that the current guide embeds. And I'm thinking leisure fairs so far this month are, you know, largely flat year over year. And I'm just wondering if that full year guide embeds sort of a flattish revenue, you know, leisure component or what that recovery, the shape of that recovery could look like.
So that's a great question. And I will start with a line I use pretty much every college, is we guide what we see. And the trajectory of 2026 unit revenue is fundamentally based on fourth quarter performance and first quarter booking. So, you know, you will hear us use a word today that we generally haven't used in well over a year, which is strong. Booking is strong right now. And I think what I'm especially excited about is, you know, we've seen a nice recovery of leisure customers. And frankly, I cannot talk enough about how pleasantly surprised we've been with the speed of the adoption of our new capacity at Fort Lauderdale. That's been a very nice contributor. But overall, you know, when you look at our operational improvements, you look at the improvements of loyalty program, the resulting increase in NPS, I think we sort of have a flywheel of goodness going on right now that's resulting in great unit revenue. There are no big assumptions of, you know, a GDP snapback quickly, you know, significant changes in competitive ASAMs, basically we're sort of forecasting based on what we see right Yeah. Thanks for the time, you guys. Thank you.
Operator
Your next question comes from the line of Duane Fenningworth with Evercore Partners. Please go ahead.
Hey, thank you. Good morning. Marty, that word, demand strength, which you haven't used in a while, what is different about the trends that you're seeing now um maybe um maybe you could speak to changes in the booking curve and then for my follow-up which i'll state right up front you know to what extent is competitive capacity uh in the first half you know contributing to that uh anyway so let me start with the the the little more color around that what we mean by the word strong uh i think that the thing that has been most interesting to us is the recovery in the domestic coach market.
You know I made a comment in the remarks about how domestic and international performance has been has been converging which I think we're very optimistic about. I'll also say the booking curve looks very normal. I think if you go back to the middle of 2025 what you would have heard us say in calls was the bookings are coming very close in and there was a little bit of apprehension of you know you're sort of sitting here with bated breath waiting to make sure the bookings actually came that's really not we're seeing now we were seeing a very normal booking curve with the exception of the Caribbean for the first couple weeks of January where we did see a bit of a drop which by the way we're back to positive here we aroused in the Caribbean so that's that That was a blip that's been temporal and much better now. It just looks like a normal demand year, which I'm very, very optimistic about. With respect to competitive capacity, yes, and we're in a relatively good competitive capacity environment right now. We have had our biggest competitor in Fort Lauderdale pulldown dramatically. We have not made any assumptions about any further pulldowns or any significant change in competitive capacity. I will say that the first quarter is very clear as far as what's out there right now. I think second quarter still has some time to settle down. You know, we're still selling more in second quarter than we're probably going to fly. But that's generally what you've seen in the time periods when you've got strong dekes and weak troughs, where it appears that there's sort of a big net strategy, and then you winnow it down a little bit closer in. But there is no – I want to make it really clear in this call. There is no magic hat with a rabbit in it of some sort of a big surprise that's going to make these numbers. This is just execution of the Jet Forward Plan on top of the existing strength and industry unit revenue right now. That's one of the reasons we're self-domestic about 2026. Thank you.
Operator
Your next question comes from the line of Savvy Sight with Raymond James. Please go ahead.
Hey. Good morning. I was wondering, Marty, just to follow up on Fort Lauderdale, could you talk about just, you know how Fort Lauderdale might be changing under kind of the current strategy other than just getting bigger like are the connections going to be bigger as a result in terms of total system just how should we think about Fort Lauderdale you know once this is kind of fully baked in versus kind of the strategy is set up you know two three years ago.
Thanks Avi. First thing I would say is, I think we should acknowledge Fort Lauderdale is our very first destination. The original JetBlue flight flew from JFK to Fort Lauderdale. So we have been, the history of JetBlue and Fort Lauderdale is as long as the history of JetBlue. And we have had a lot of growth in Fort Lauderdale over the years. I think you go back 10 years or so, we announced publicly this concept we called Fort Lauderdale 140, which was growing Fort Lauderdale to about 140 flights a day. We had trouble executing that mostly because of gate resources in the airport. It is a relatively constrained airport, especially constrained for international gates. And if you look at the opportunities to grow, you know, we have a pretty solid slate of destinations to the north of Fort Lauderdale. Our challenges are really to, you know, Caribbean, Central, and South America. And for that reason, the lack of international gates has been a problem for us. I'd say with the pull-downs that we've seen from Spirit in Fort Lauderdale, gate resources have become available. And, you know, we've wanted this for many, many years. So when the opportunity came up, we jumped on it very, very quickly to make sure that we could backfill because this is an aspiration we've had for a long time. And I would say that, you know, starting with crew members and also investors, you know, we have continually gotten this feedback of, you know, you need to diversify beyond the Northeast. And, you know, I think if you're looking at diversification beyond the Northeast, this is it. I mean, Fort Lauderdale is a great premium market, South Florida, great premium market, the best premium market in Florida. And obviously, we have a very premium heavy strategy going forward. Number two, geographically, it is a perfect location between North and South. So I think given the franchise that we already have in South Florida, the opportunity to grow there, we're really bullish on Fort Lauderdale. Specifically, yes, we have more of a bank structure in Fort Lauderdale than we had historically for connectivity, and as gates become available, we'll continue to emphasize – to enhance that, and in fact, you know, we are currently in the process of expanding our banking plans there. We don't really want to become a legacy hub-and-smoke airline, so it's not going to that extent, but the extent to which we can create casual connections at good departure times in Fort Lauderdale, we will absolutely take advantage of it. And so far, I've performed very, very well from a connective perspective. I think for those customers who have connected in Miami versus connecting in Fort Lauderdale, I think I know which one everybody would pick. And it seems like customers are picking it, and Fort Lauderdale has done very well for That's helpful.
If I might just quickly follow up for Ursula, just on the $500 million that you plan to raise this year, is that reflected in the Intrins Expense Guide, or is that kind of potentially an increase to the interest expense assumption good morning Sabi and yes the interest expense is included in the 580 million dollar guide I will note the 500 million that we're anticipating raising will probably dual tranches so that there could be a portion of that race which happens early in the year to support the convertible debt pay down that is due in April and then the second tranche of the financing most likely will happen in the back half of the year.
That's helpful, thank you.
Operator
Your next question comes from the line of Tom Fitzgerald with TD Cowan. Please go ahead.
Everyone, thanks very much for the time. It's good to see that the premium credit card signups are exceeding your expectations. I was wondering if that's primarily in the New York area, just given the lounge, or if you're seeing that kind of throughout the network or in new geographies, or any details you'd want to expand on there?
It's really throughout the system, and I think it's because the premium credit card itself actually has a great value proposition, and frankly, you know, a lot of our customers touch New York. So, even if you don't live in New York, it's generally an important destination. And I think when we get New York and Boston both up, we're really bullish about the premium credit card. It also has a lower annual fee than other airlines and the bank premium credit cards. And I sort of mentioned this in the script, and we put this in a release but didn't put in the script. Our friends at Bain who do like industry-level NPS scores have now given us permission. We can say that True Blue has the highest NPS as any loyalty program of any airline in the US. So I think again, back to the concept of the flywheel, you know, success sort of breeds success. So we're very excited with the card. You know, our partnership with Blacklead is absolutely fantastic and I'm really optimistic about the lounge as a contributor. We are, and back to Asabi's point about Fort Lauderdale, we are exploring whether we can make a launch of Fort Lauderdale work. It's a pretty constrained airport, so we're not as sure that we have space for it, but if we can make it work and provide a great customer experience, it's certainly something we'll be talking about later on in 2026.
I'll just add on Marty's comment regarding Barclays. I think what's unique about our program is we're not competing with a bank's proprietary card. This is, you know, fully dedicated Barclays card for JetBlue, and so when you think about the depth of the relationship and you know two entities really rowing in the same direction that's very much what you see with the JetBlue card.
Okay great that's really helpful thank you for that and then just as a follow-up on Blue Sky I was just kind of curious do you see upside potential to that 75 points of RASM expansion and then just within the within the various buckets you know do you see the wider funnel from the you you know, being on their distribution website, driving a lot of the games, or do you see it kind of split evenly, or Paisley? I just wonder if you could kind of break out the different drivers within Blue Sky and Paisley. Thanks again for the time.
Thanks, John. Honestly, all those things are important. Obviously, Paisley is very, very important. What we love the most about the Paisley upside is that, first, you know, we have really built a better mousetrap with the Paisley platform. And especially important for us is that Paisley is an extremely capital-like way to grow earnings. You know, the only capital there is basically IP capital, and it's the minimus compared to our overall capital expenditure. With respect to the other upsides for Paisley, I do fundamentally believe that the benefits – excuse me, to Blue Sky. I do fundamentally believe that the benefits of Blue Sky are focused in True Blue. As you look at True Blue Program's ability to compete with the big three legacy airlines, the biggest challenge we have is that we do not have a full roster of worldwide destinations to earn and burn. And through this partnership with United, we finally plugged that hole. And I think the utility with True Blue Point has skyrocketed in the last six months with the addition of this program. We're also relatively early along in the game. So, I think it's, you know, we'll see how that works for customers, but I love the value proposition of True Blue, and I very much appreciate this relationship with United to make this possible. I do also believe that the mutual distribution has got to be important. You know, I think about places where we offer services that United doesn't, you know, JFK to the West Coast, you know, even when they do eventually enter JFK, and we're not sure where they're going to go, but, you know, sometime in 27 they'll be in. And today, if you want to earn mileage-plus points from anywhere in New York to the West, from this side of the Hudson to the West Coast, we're really the only option. I love having those flights on United.com. And, you know, even though, you know, United may not have the same direct penetration as JetBlue does, it is a significantly bigger airline. We don't really know the traffic to their website other than what we can pull publicly, but I love the thought of all the JetBlue flights getting the eyeballs of all these United customers going United.com all the time. And, frankly, I will remind you, you know, we have a great high NPS, so I think when United customers actually get to fly JetBlue, their reaction is going to be, hey, this is great. I can have a great customer experience, and I can also earn my mileage plus points. So we're really excited about that as well.
Operator
Your next question comes from the line of Mike Linenberg with Deutsche Bank. Please go ahead.
Oh, yeah. Hey, good morning. Just two here. Ursula, just you called out the $6.5 billion of unencumbered assets, and I just – that seemed a little bit higher than maybe what you shared in the past. I thought it was more like $5 billion, and so maybe it reflects some debt pay down, or maybe, you know, you reappraised, I don't know, a pool of spare engines. Has that changed at all?
It did. Good catch, Mike. So the previous number that we publicly quoted was $5 billion. As we were assessing our liquidity needs for 2026, we did go through and update all of our appraisals on the unencumbered assets. So, as a reminder, we purchased our aircraft deliveries last year with cash, so those were added into the pool. In addition to that, there's still incremental value on our loyalty program as well, So those were really the two main drivers of the increase. As a reminder, as we look at the unencumbered offset base, the breakdown is about 30% of other aircraft and engines, about 20% of it is loyalty, and then obviously the remainder is spot, gates, and routes and our brand. So yeah, we're really pleased to continue to have this cushion, and the cushion is a really healthy culmination of assets.
Great. Thanks for that clarification. And then just Marty, you talked about the LOPA changes with the rollout of First Class. When actually do you start selling that first First Class seat and how long is that rollout going to take before you get to all of your domestic flights with First Class? Thank you.
So, hey Mike, we're expecting the first airplane to roll out in the third quarter, and we're right now in the middle of certification, so we're not ready to pin a date down yet, as far as when that will be. And the implementation is actually relatively quick. We'll have, you know, 20-something percent of the fleet done by the end of this year. The overwhelming majority will be done by the end of 27, but not all of it, and the rest comes in the 28. And the benefits, you know, it's obviously an important part of the products and perks initiative in Jet Forward. It will not be fully ramped by the end of Jet Forward. They'll be continued ramping in So we're really excited about it, and we'll be making more specific announcements later on this year.
Okay. Did you say 20% or 27% by year end? 20%. Great. Thanks for taking my question.
Operator
Your next question comes from the line of Catherine O'Brien with Goldman Sachs. Please go ahead.
Hey, everyone. Thanks for the time. So, Marty, you know, you talked about that the Fort Lauderdale capacities are having better than expected, less of a drag to fourth quarter. Would you say that's more a function of, you know, improving overall demand? Did you see faster than expected share shift? You know, was the competitive response better than expected? Just, you know, can you talk about how Fort Lauderdale rises forming, you know, versus the system? And then higher level, like, as you're thinking about this additional capacity in the mint ads, how do you expect that to impact the medium-term hub profitability versus system profitability in Fort Lauderdale?
Thanks, Katie. And I'll say two things. First of all, we have multiple databases that help us measure share shift. The one that is the most close in, Spirit actually does not participate in. So, right now, I cannot tell you if the fourth quarter upside has been chair shift or has been simulation, but when we get the DOT data, which should be coming in the next several weeks, well, I think we'll have a better answer for that. So, I don't want to get ahead of my skis here because I don't actually have the real I do know that we're certainly carrying a lot more customers to be expected and higher yields to be expected. So, whether it came from Spirit or from people coming off their couches, I'm happy to have it either way. With respect to profitability, we do expect Fort Lauderdale to be accretive to our overall system profitability. And, frankly, I feel like with the change of the competitive environment down there and also, you know, the ability to compete with, you know, a tough customer experience in Miami with one of our competitors, just, you know, Fort Lauderdale is a very easy airport. It's centrally located in the region. You know, we would not be doing this if we did not think that Fort Lauderdale would be a significant upside contributor to the system. Obviously, we could put airplanes anywhere. We're specifically choosing to put them in Fort Lauderdale for a reason.
Got it. Makes sense. Maybe, Ursula, one for you. You mentioned you're thinking this year's finance and needs will be about $500 million. How sensitive is that to your 2026 profitability outlook? You know, I realize you're guiding to breakeven plus, not a range. But does it look different at breakeven versus above breakeven? And how does the E19D and XLR asset sales help offset fundraising requirements this year, if at all? Thanks again for the time, guys.
Yeah, good morning, Katie. Thanks for the questions. So the first one is we're targeting what would need to be anywhere between 17% and 20% of trailing 12 months revenues. So, obviously, that excludes our revolver as well, so there's a little bit of buffer there just in regards to, you know, the operating performance of the business. So, you know, I will say, you know, I feel really confident based on what we know today in the team's ability to execute on the breakeven or better operating margin, and so as we head in to raise liquidity, you know, like I said, we'll target that 17% to 20% range. We'll pivot if we have to. Obviously, we have the very healthy, unencumbered asset base to choose from if we do need more liquidity. You know, I'm pleased that I believe that we've hit peak debt levels last year, so really leaning hard into the EBITDA growth driven by Jet Forward to help improve the leverage metrics. And then in regards to your cost question on fleet, last year we had a meaningful amount of fleet transactions, the most impactful being the sale of the E-190s. We also took advantage of some market opportunities in regards to engine sale leasebacks. As we look at 2026, we do have about a half a point of controllable cost benefit based into the full year guide. That's really driven by the remaining sales of the E-190. So, we have about eight aircraft that we will be selling in the first half of this year. And we'll continue to monitor, you know, the markets as well in terms of sale-leaseback opportunities. Hope that answers your question.
Operator
Thanks so much. Your next question comes from the line of Jamie Baker with J.P. Morgan. Please go ahead.
Oh, hey. Good afternoon. So, Marty, I wanted to go back. The question you were answering before, Savi's question, you mentioned the rabbit. Can I just confirm there are no specific assumptions in your full-year guide as to what potentially happens with any of your competitors that might be facing, shall we say, a precarious situation at the moment? Is that correct interpretation?
Yeah, and I'll give you a little more clarity on that, Jamie. There has been capacity added by some other airlines to Fort Lauderdale with the reduction of Spirit ASMs. Those ASMs are there, and they're not going away. So that growth is still there. We're not assuming that that was temporal. We're also not assuming that that spirit goes through any significant shrink versus where they are right now. I mean, our view is we want to make sure that as we give a guide, there's no sort of little secret upside in there. I mean, we've been trying to guide this thing very straight for the last two years, and we're not going to change now. I mean, obviously, the rumors are out there. You know, I think that, you know, there's certainly probably more rumors than they have airplanes. But I don't think there's any upside for us to try to make any assumptions of that.
But I will say, Jamie, we do have multiple plans in place depending on the outcome of Florida Ale and FinSpirit. So, you know, we're ready for a number of scenarios to ensure that customers are protected and that we bring the JetBlue product and the offering to more folks in South Florida and beyond.
Excellent. I appreciate that clarification, both of you. And then, you know, just round numbers, JetForward's contribution was about $500 million last year, but total EBIT went down about $250 year-on-year. So that implies, simplistically, that your core was down $550 million. Now, last year was obviously, you know, a tumultuous one for JetBlue and the industry. Do you attribute that entire $550 million entirely to the macro as opposed to any, you know, idiosyncratic challenges your franchise was facing?
Yeah, yeah, Jamie, so I'll take that. Yeah, we attribute it entirely to the macro. And as we look back at 25, we've been able to isolate out the JetPort initiatives and the value that they've driven. And if not for the macro, we're quite confident we would have hit our full-year operating margin guide. So, you know, we're actually very excited about 26. This is going to be our year. You know, if you think about the initiative that we continue to execute in 2025, whether it was operational performance and improved MPS, our premium loyalty benefits like the JFK Lounge, you know, even more changes, the Blue Sky Partnership and our network changes, These are all initiatives that are built to ramp over time. And as Marty mentioned, you know, these initiatives create a flywheel effect where operational reliability and MPS will enable premium growth, which will then strengthen loyalty and revenue, and then you layer in network optimization, amplifying that impact. So, you know, we really are excited that this really sets us up for continued acceleration and upside in 26, as we then, as they decide for this year, you know, last year was definitely a step back to execute, and we look forward to taking advantage of all that execution and more in 2016.
Thank you very much. We appreciate it. Take care.
Operator
Your next question comes from the line of Connor Cunningham with Malias Research. Please go ahead.
Hi, everyone. Thank you. More rumors than aircraft. I'm going to potentially steal that one. The bridge in the deck was interesting to me. I just, the 50 basis point macro or industry setup, I think that you got or that you have there is, I think it feels really conservative. If you could just frame up what you assume there. Like, are you assuming that there's some sort of competitive fallout from the Chicago situation? Just any thought process on how you got there. Thank you.
No, yeah. So, I mean, the tie to the demand fence we're seeing exiting Q4 into Q1 and beyond, And then, obviously, normal GDP and macro inputs. And so, to the extent that there's upside, you know, the upside would come in macro. The upside in terms of, you know, incremental three points of RASM growth for Jeff Fullward, you know, could come in things like improvements in Fort Lauderdale, beyond what we've assumed, premium ramping faster, you know, sort of the flywheel effect really kicking in. So, you know, I think as you look at the guide, we guide what we see.
And we do not assume any – I just want to add one thing, Connor, and it's something that I think as Jet Forward has progressed, we started to feel the tension between the base airline and the Jet Forward numbers because, honestly, it's kind of the same thing to a certain extent. There's a lot of interaction between those two numbers. You know, when we laid out the $900 million proposal for Jet Forward, a lot of those things at other airlines would be normal course of business. So when you say, like, this is what the base airline's doing versus this is what Jet Forward's doing. It's getting to the point where you almost can't make those distinctions because there's so much relation between the two of them. We're very, very proud of all the initiatives and it was a lot of change in a year, but I think that it's tougher and tougher to measure it, I think, as we go forward because the individual jet forward initiatives, you know, other islands are doing them and that's in their base. So it's just a little bit tough to do that apples and apples comparison through our RASM, after jet forward and their RASM without any sort of branded program.
But, you know, to be clear, if you think there's upside in macro, that's upside to the JetBlue plan.
Got it. Helpful. And I realize that you're not guiding, including the impact of FERN, but, I mean, the feedback I've gotten this morning that it kind of derails your 1Q already. So just any thoughts? Like, are the ranges wide enough to assume that you can weather like it? I mean, you canceled 1,200 flights. So I'm just trying to understand the risk to the 1Q outlook already, given the weather events that's already happening.
I mean, we canceled just over 1,100 flights. We didn't cancel, you know, some of the numbers that other carriers are coasting. So I think that's an important distinction. And the impact will be proportional to those cancels. So we'll definitely see some pressure on CAS and we'll see some pressure on ASMs. But this hit us, I want to be clear, during a trough. So when you think about the timing, it could not have come. We never asked for these things. We never want these things, but it could not have come at a better time. And so, really proud that the team is executing and getting us back on track. If you see the cancellations today, you know, the number is much, much, much lower. Others still have, you know, the impact lingering. And I'm confident that as we move through the week, we'll be back up and running fully.
And I would just add, Connor, like, this is – we're still going to hit our full-year I mean, this is something that obviously can be weathered within the full-year context.
Okay. Thank you very much.
Operator
Your next question comes from the line of Ravi Shanker with Morgan Stanley. Please go ahead.
Great. Apologies if I missed this. You guys did quantify the impact of the Caribbean shutdown of airspace in the first week of January, but some of your peers have noted that the kind of warnings or the restrictions on kind of flight activity issued a couple of weekends ago, that's had somewhat of a chilling impact on bookings and then the forward curve in the Caribbean. Are you guys seeing any of that as well for the forward view?
Hey Ravi, good question, thank you. We certainly saw an impact for a couple of weeks and there's no question that the, you know, it was a tough time, it was a peak day when we had the disruption, you know, it's New Year's return, so it was an incredibly poorly timed event for us, and we did see a couple of weeks of booking depression, but nowhere near what we heard other airlines say. I will say that our Caribbean is actually very, very diversified. You know, you think about the size of operations, they're being in Republic, Puerto Rico, and we had a lot of markets that were not affected. Yes, we certainly started impact in places like Aruba, Curacao for a couple of weeks, but those have both rebounded, and we're back to normal course of business. There is – I keep using this word divot, and I'm not sure that's the right word. We still have a bit of an impact in first quarter, but for forward-looking bookings, that'll be fine. We're actually not worried about it at all.
And I think as a follow-up, just on the lounges, can you just share early feedback on the JFK lounge so far? Are you seeing any kind of loyalty or any measurable impact from opening that? And also, you said that you're looking at the potential for Fort Lauderdale. Is that just like a one-off, given your strength there, or do you think that there's opportunity for having a network of domestic lounges over time?
Yeah. So, Robby, we're not – we've even gone on, like, a network of lounges, but we're not I mean, we are – JFK's been great, as Marty mentioned in his prepared remarks, you know, 80-plus percent NPS. We're seeing it absolutely drive sign-ups for the premium card. We're excited to bring Boston online later next year. You know, as we think about Fort Lauderdale, we think it's got a great premium base that could lend itself to a lounge. We haven't announced anything yet, but we're really focused on, you know, if it makes sense for a particular market, we will evaluate it, but it has to have a strong return, and it has to be tied to driving our jet forward initiatives around premium customer.
Yeah, and just to be clear, Ronnie, the Boston Lounge is this year.
I would say, like, yeah, later this year. Sorry, my bad.
I will say one thing. As we mentioned when we announced this, the number one thing we're worried about is We actually give the customer feedback of their hatred of lines. We do have a picture floating around of the first line outside the lounge, and it was a line of people who were signing up for instant approval of the pre-American side because they wanted to get in. So it's doing exactly what we want to do, and we're really, really bullish about it. That being the case, it's a big CapEx investment. You know, we work with Barclays, obviously, to make sure the math works or something like this. But I think the, you know, given how our network works, which is, you know, We have a handful of cities above 30-somethings like today. This is not something we're expecting to have in 20 cities. Good to hear. Good job, Greg. No, go.
Operator
Your next question comes from the line of Scott Group with Wolf Research. Please go ahead. Hey, thanks. Good morning.
Marty, your answer on jet forward versus core earnings, a couple of questions, that was totally fair. So you might not like the spirit of the question, but I do have a follow-up. So if I just take the guidance for this year, you're saying the bridge has 310 million of jet forward benefits, and I think if we're doing like, I think that implies like flat core earnings. So I guess my question is like, if base RASM's up half a point and CASM's up two, So, what are the offsets there that keep core earnings more flat or what are the upside and downside risks that core earnings being flat?
Okay, I'm writing this down. I need to go through that math and try it. I wish to get back to that one to make sure I understand the exact question. I mean, at the core, overall, industry RASM is on a very good trend right now, And that's driving a big chunk of 2026, the 2026 guide that we laid out there. And, again, back in this issue of what's core for us and what's core for the competitors, there's a lot of stuff that's in Jet Forward that would be core for our competitors. So it is very difficult to do an Apple comparison when you look at what other airlines are doing with things like, you know, how they price their extra legroom seats or how they price things like, you know, their domestic long-haul premium products. So I think that it's actually much, much tougher than you think to actually split those two things upon it. I'm really focused on the top-level guide, which is the high-level guide for a RASM this year. And remember, it's, you know, two to five is our range, and that's on two-and-a-half to four-and-a-half in ASM growth. So I think if you look at the combination of those two things, you know, we're really excited about this guide. And I think it's the ability to produce that level of RASM growth with this amount of ASM growth. I think it's testimony to the strength of the franchise and of the positive output we're seeing from all the changes we've made in Jet Forward.
Okay, that's I think that's fair. So, your point is don't get too caught up in the individual bridge like look at the whole level, look at the big picture, ASM up, RASM up, it's working kind of thing.
Yeah, I mean to grow, right, like the The majority of that is driven by Jet Forward. We are, as a company, growing again, which is fantastic. The AOG outlook has improved, and so when you take the powerful combination of the revenue initiatives, growth, the efficiency and execution on the controllable cost structure, I mean, we believe that this is a material step forward in terms of margin progression, and, you know, Right now, what we're seeing in the demand environment is strong, the macro is, you know, constructive, and so that's why we're, you know, super confident in being able to hit this and get on a path to sustain profitability. I mean, step number two is free cash flow, and we have a path to deliver positive free cash flow at the end of 27, and then we'll turn to improving the health of the balance So, you know, we feel good about 2026 in our ability to execute or in execution mode.
Thank you, guys. Appreciate the time.
Operator
Your next question comes from the line of Chris Strafalofagus with SIG. Please go ahead.
Thanks for taking my questions. Ursula, if for whatever reason there's a macro downtake, seasonal on the performance, unanticipated steep growth in New York or other markets, What are some of the levers you can pull to still get to the break-even margins? You know, I realize that there's some – or perhaps a lot of leverage here in the fleet and areas like maintenance and fuel efficiency, but what are some of the other, I guess, cost buckets we should consider should macro or steep growth move in an unanticipated direction?
I'll take that. I mean, I think if you look back at 2025 and what we did in 2025 when we did see that macro step back. I mean, first we matched the fly with the man in the trough period. We pulled two points of capacity, I mean, after it, and we still hit our annual cost guidance, which I think is a true testament to the team. And then we ultimately made some really hard decisions around discretionary expenses, leadership structure, and then other budget cuts. So if you think about 26, if there were a macro step back, we're going to focus on controlling what we can. We're going to continue to execute on JET Forward, and then we will pull some of of those levers if need be as we move forward. Obviously, you know, capital expenditures, we would re-look at that list. So, you know, this team is one that has a track record of hitting the cost targets, because that is something that we control more so than obviously revenue. And so, you'll continue to see us lean into that if there's a match.
Okay, and then on free cash flow, I think I heard you're targeting positive year-end 27. If you could maybe size that, so assuming you hit all your targets, And, Jed, forward, you move within the CapEx profile you outlined earlier. What exactly does that positive look like?
Yeah, maybe I'll take that. We're not going out with any guide or specific numbers. But if you think as earnings grow and CapEx moderates, this is going to enable a path for JetBlue to deliver positive free cash flow and ultimately delever the balance sheet over the next couple of years. So, first, we need to deliver positive operating margin in 2026. We've got a great plan to do that. that plan takes advantage of everything we built this year and then all the additional initiatives that are layering on in 26 and then that should hopefully as we think about exiting 26 allow us to generate free cash flow by the end of 27 and then ultimately beyond that restoring our balance sheet health in 28 and beyond okay thank you your next question comes from the line of Brandon Oglenski with Barclays please go ahead hey good morning thanks for taking the question.
Joanna, maybe to follow up on that, I mean, I know it's been a difficult couple years here. I've been targeting breakeven for a while, and there's been some macro setbacks for sure, but how do you think about longer-term profitability of JetBlue once you get to free cash flow and things like that and de-levering? Can you get back to, you know, ROIC and excess of your cost of capital, or do you see fundamentally there's issues of scale here that, you know, a lot of airline CEOs will talk about just given how important rewards programs have become?
Yeah, no, we absolutely see a path back. This is all about improving our operating margin. When you think about scale, I mean, there's two ways to look at it. One is scale within the market that you're in. And we continue, as we're growing this year again in Fort Lauderdale, but we continue to focus on trying to ensure that we have strong franchises in our core geographies. And then the Blue Sky Partnership is really designed to provide scale to our loyalty program and scale beyond JetBlue for our customers. And so, you know, that's our approach. And I think, you know, we look at the initiatives we're delivering, the fact that customers are coming back to us because we've improved operational performance and NPS. We've got a full series of initiatives we executed last year that are fully in ramp this year and then layering on our first class product, bringing blue sky further to life, and then obviously domestic first. So we're really bullish about the next few years. It will absolutely get us back on a path and delivering, you know, more than positive free cash flow and restoring the balance sheet in the longer term. And, you know, taking it one year at a time. The last year was a pretty big challenge for the industry, and so we're being cautious about how we step into this year with a guide that we think is very achievable, given the initiatives we have laid out for the plan, and looking forward to hitting that great even number this year.
And I know it's been a long call, but Ursula, you brought up AOG and the GTF issues, which I think is impacting you less now. Can you talk through the financial impact there in 26 and maybe any recourse you're getting from Pratt?
Sure. So, we're pleased that the AOG situation has improved year over year. So, we had nine aircrafts on the ground last year, and we're expecting mid-single digits this year. It did take over the last few weeks a slight step backwards. We thought we would be in low single-digit land in terms of aircraft on the ground this year. We got a recent update from FRAT. They continue to struggle on the A321 fleet type with supply chain and shock capacity. So, we're navigating through it. It clearly continues to be a dynamic, you know, environment for the A320 fleet type. We are still working through, with Pratt and Whitney, the compensation. We're focused on getting what we believe we deserve. We are, given we're such a large customer of Pratt, there could be many forms in which compensation comes through, and in light of, you know, accounting treatment, while the settlement is important to us, you know, the amount is not meaningful to whether or not we achieve our full-year guidance for 2026. But in the end, you know, improvement year-over-year, allowing us to grow again, we're pleased.
Operator
Thank you. And that concludes our question-and-answer session. I will now turn it over to Joanna Geraghty for closing remarks.
Thanks so much. I appreciate all the questions. As you can tell, this group is very excited to deliver on break-even or better operating margin this year, underpinned by what we see as a strengthening macro backdrop, returning to growth – I have to emphasize that – very excited about that – constructive capacity backdrop, and then all of the Jet Forward initiatives really coming into a really nice place for 2026 and beyond so thanks for the calls today and then I'll just end with congrats to the need to the New England Patriots as the official airline sponsor of the past this is your year too thanks ladies and gentlemen this does conclude today's call thank you all for joining and you may now disconnect