
LNC 8-K
Lincoln National Corp (LNC)
8-K
2024-05-02
For: 2024-05-02
View Original
Added on
April 12, 2026
UNITED STATES
SECURITIES AND EXCHANGE COMMISSION
Washington, D.C. 20549
SECURITIES AND EXCHANGE COMMISSION
Washington, D.C. 20549
FORM 8-K
CURRENT REPORT
Pursuant to Section 13 or 15(d) of the Securities Exchange Act of 1934
May 2, 2024
Date of Report (Date of earliest event reported)
Lincoln National Corporation
(Exact name of registrant as specified in its charter)
| Indiana | 1-6028 | 35-1140070 | ||||||||||||
| (State or other jurisdiction | (Commission | (IRS Employer | ||||||||||||
| of incorporation) | File Number) | Identification No.) | ||||||||||||
150 N. Radnor Chester Road, Radnor, PA 19087
(Address of principal executive offices) (Zip Code)
Registrant’s telephone number, including area code: (484) 583-1400
Check the appropriate box below if the Form 8-K filing is intended to simultaneously satisfy the filing obligation of the registrant under any of the following provisions:
| ☐ | Written communications pursuant to Rule 425 under the Securities Act (17 CFR 230.425) | ||||
| ☐ | Soliciting material pursuant to Rule 14a-12 under the Exchange Act (17 CFR 240.14a-12) | ||||
| ☐ | Pre-commencement communications pursuant to Rule 14d-2(b) under the Exchange Act (17 CFR 240.14d-2(b)) | ||||
| ☐ | Pre-commencement communications pursuant to Rule 13e-4(c) under the Exchange Act (17 CFR 240.13e-4(c)) | ||||
__________________________________
Securities registered pursuant to Section 12(b) of the Act:
| Title of each class | Trading symbol(s) | Name of each exchange on which registered | ||||||
| Common Stock | LNC | New York Stock Exchange | ||||||
Depositary Shares, each representing a 1/1000th interest in a share of 9.000% Non-Cumulative Preferred Stock, Series D | LNC PRD | New York Stock Exchange | ||||||
__________________________________
Indicate by check mark whether the registrant is an emerging growth company as defined in Rule 405 of the Securities Act of 1933 (§230.405 of this chapter) or Rule 12b-2 of the Securities Exchange Act of 1934 (§240.12b-2 of this chapter).
Emerging growth company ☐
If an emerging growth company, indicate by check mark if the registrant has elected not to use the extended transition period for complying with any new or revised financial accounting standards provided pursuant to Section 13(a) of the Exchange Act. ☐
Item 2.02. Results of Operations and Financial Condition.
On May 2, 2024, Lincoln National Corporation (the “Company”) issued a press release announcing its financial results for the quarter ended March 31, 2024, a copy of which is attached as Exhibit 99.1 and is incorporated herein by reference. The Company’s statistical supplement for the quarter ended March 31, 2024, is attached as Exhibit 99.2 and is incorporated herein by reference.
The information, including exhibits attached hereto, furnished under this Item 2.02 shall not be deemed “filed” for the purposes of Section 18 of the Securities Exchange Act of 1934, as amended (the “Exchange Act”), or otherwise subject to the liabilities of that Section. The information in this Current Report shall not be incorporated by reference into any registration statement or other document pursuant to the Securities Act of 1933, as amended (the “Securities Act”), except as otherwise expressly stated in such filing.
Item 7.01. Regulation FD Disclosure.
On May 2, 2024, in connection with the Company’s first quarter 2024 earnings conference call scheduled for the same date, the Company made available on its website a first quarter 2024 earnings supplement presentation dated May 2, 2024, a copy of which is attached hereto as Exhibit 99.3 and is incorporated herein by reference.
This presentation is being furnished under this Item 7.01 and shall not be deemed “filed” for the purposes of Section 18 of the Exchange Act or otherwise subject to the liabilities of that Section. The information in Exhibit 99.3 shall not be incorporated by reference into any registration statement or other document pursuant to the Securities Act, except as otherwise expressly stated in such filing.
Item 9.01. Financial Statements and Exhibits.
(d)Exhibits.
The following exhibits are being furnished with this Form 8-K.
Exhibit Number | Description | ||||
| 99.1 | |||||
| 99.2 | |||||
| 99.3 | |||||
| 104 | Cover Page Interactive Data File (embedded within the Inline XBRL document). | ||||
SIGNATURES
Pursuant to the requirements of the Securities Exchange Act of 1934, the Registrant has duly caused this report to be signed on its behalf by the undersigned hereunto duly authorized.
| LINCOLN NATIONAL CORPORATION | |||||||||||||||||
| By | /s/ Adam Cohen | ||||||||||||||||
| Name: | Adam Cohen | ||||||||||||||||
| Title: | Senior Vice President, Chief Accounting Officer and Treasurer | ||||||||||||||||
Date: May 2, 2024

.
FOR IMMEDIATE RELEASE
Lincoln Financial Group Reports 2024 First Quarter Results
____________________________________
Radnor, PA, May 2, 2024: Lincoln Financial Group (NYSE: LNC) today reported financial results for the first quarter ended March 31, 2024.
•Net income available to common stockholders was $1.2 billion, or $6.93 per diluted share.
•Adjusted operating income available to common stockholders was $71 million, or $0.41 per diluted share.
•Adjusted operating income available to stockholders was unfavorably impacted by significant items totaling $164 million, or $0.96 per diluted share, including:
◦A legal accrual of $90 million, or $0.53 per diluted share
◦Severance expense of $39 million, or $0.23 per diluted share
◦Balance sheet true-up related to the sale of the wealth management business of $19 million, or $0.11 per diluted share
◦Tax-related items of $16 million, or $0.09 per diluted share.
•The primary differences between net income and adjusted operating income resulted from the following non-economic factors:
◦$1.1 billion of the net income, or $6.64 per diluted share, was primarily due to changes in market risk benefits driven by the increase in interest rates and equity markets.
◦$153 million of the net income, or $0.89 per diluted share, was primarily driven by a change in the fair value of an embedded derivative related to the Fortitude Re reinsurance transaction, with a direct offset in other comprehensive income.
•Estimated RBC ratio was in the range of 400 - 410% at quarter end.
“Our first quarter results, excluding the impact of significant items, exceeded our expectations,” said Ellen Cooper, Chairman, President and CEO of Lincoln Financial Group. “We made continued progress with the strategic realignment in each of our four businesses and executed well, with some notable highlights. Our Annuities business reported its highest earnings quarter in nearly two years, with 5% sequential growth in ending account balances, Group Protection delivered another strong quarter of earnings growth and margin expansion, Life earnings were consistent with our expectations, and Retirement Plan Services sales increased almost 19% from the prior year.
"While our progress won't always be linear, we see this year as our opportunity to meaningfully advance on our strategy. We will continue to position our businesses for profitable growth, build foundational capital, and optimize our operating model. We believe our results this quarter represent a solid foundation for success in 2024."
Business Highlights

Our 2024 first-quarter results were driven by continued progress in each of our businesses executing on their respective strategic priorities.
•Group Protection delivered operating income of $80 million, the second highest earnings quarter in its history and an increase of almost 13% over the prior-year period. Group Protection's margin grew 60 basis points year-over-year to 6.2%, attributable to disciplined pricing and lower expenses.
•Annuities reported $259 million in operating income, down 5.5%, driven by unfavorable impacts including a balance sheet true-up related to the close of the sale of the wealth management business of $19 million and tax-related impacts of $12 million. Excluding the impact of these items, Annuities generated earnings of $290 million, its highest earnings quarter in nearly two years. Ending account balances increased 5% sequentially.
•Life Insurance reported an operating loss of $(35) million, compared to a loss of $(13) million in the first quarter of 2023. The year-over-year decline included a $(28) million impact from the Fortitude Re reinsurance transaction. The year-over-year decline in sales is a result of our intentional strategic realignment to products that are expected to deliver more stable cash flows and higher risk-adjusted returns, such as accumulation products.
•Retirement Plan Services delivered operating income of $36 million, down 16% year over year, driven by lower spread income. Ending account balances were $107 billion, up 15% compared to the first quarter of 2023. First-year sales growth was robust with a 53% year-over-year increase, driving positive flows, and we continue to take actions that support long-term sustainable growth and profitability.
Earnings Summary
| As of or For the Three Months Ended | ||||||||
| 3/31/23 | 3/31/24 | |||||||
| Net income (loss) | $ | (881) | $ | 1,222 | ||||
| Net income (loss) available to common stockholders | (909) | 1,191 | ||||||
Net income (loss) per diluted share available to common stockholders1 | $ | (5.37) | $ | 6.93 | ||||
| Adjusted income (loss) from operations | 288 | 105 | ||||||
| Adjusted income (loss) from operations available to | ||||||||
| common stockholders | 260 | 71 | ||||||
Adjusted income (loss) from operations per diluted share available to common stockholders2 | $ | 1.52 | $ | 0.41 | ||||
1In periods where a net loss or adjusted loss from operations is presented, basic shares are used in the diluted EPS and adjusted diluted EPS calculations, as the use of diluted shares would result in a lower loss per share.
2 Refer to the full reconciliation of Net Income to Adjusted Income from Operations at the back of this press release.
Condensed Reconciliation of Net Income to Adjusted Income from Operations1
| For the Three Months Ended | |||||||||||||||||
| 3/31/23 | 3/31/24 | ||||||||||||||||
| Net income (loss) available to common stockholders — diluted | $ | (909) | $ | 1,191 | |||||||||||||
| Less: | |||||||||||||||||
| Preferred stock dividends declared | (25) | (34) | |||||||||||||||
| Adjusted for deferred units of LNC stock in deferred compensation plans | (3) | 3 | |||||||||||||||
| Net income (loss) | (881) | 1,222 | |||||||||||||||
| Less: | |||||||||||||||||
| Non-economic market risk benefit impacts, related to net annuity products, after-tax | (1,018) | 1,141 | |||||||||||||||
| Net life insurance product features, after-tax | (95) | (103) | |||||||||||||||
| Change in fair value of reinsurance-related embedded derivatives, trading securities and certain mortgage loans, after-tax | 7 | 153 | |||||||||||||||
| Investment gains (losses), after-tax | (45) | (65) | |||||||||||||||
| Other | $ | (18) | $ | (9) | |||||||||||||
| Adjusted income (loss) from operations | $ | 288 | $ | 105 | |||||||||||||
| Adjusted income (loss) from operations available to common stockholders | $ | 260 | $ | 71 | |||||||||||||
1 Refer to the full reconciliation of Net Income to Adjusted Income from Operations at the back of this press release.
•The 2024 first quarter included a $1.1 billion net gain primarily due to changes in market risk benefits driven by the increase in interest rates and equity markets.
•$153 million of the net income was driven by a change in the fair value of an embedded derivative primarily related to the Fortitude Re reinsurance transaction, with a direct offset in other comprehensive income.
Variable Investment Income
Alternative Investment Income, after-tax1 | For the Three Months Ended | ||||||||||||||||
| 3/31/2023 | 6/30/2023 | 9/30/2023 | 12/31/2023 | 3/31/2024 | |||||||||||||
| Annuities | $2 | $5 | $3 | $3 | $2 | ||||||||||||
| Life Insurance | 37 | 53 | 34 | 39 | 58 | ||||||||||||
| Group Protection | 2 | 2 | 2 | 2 | 1 | ||||||||||||
| Retirement Plan Services | 1 | 3 | 2 | 2 | 1 | ||||||||||||
| Other Operations | — | — | — | — | — | ||||||||||||
| Consolidated | $42 | $63 | $41 | $46 | $62 | ||||||||||||
1 Excludes alternative investment income on investments supporting our modified coinsurance and coinsurance with funds withheld agreements as we have limited economic interest in those investments.
Prepayment Income, after-tax | For the Three Months Ended | ||||||||||||||||
(in millions) | 3/31/2023 | 6/30/2023 | 9/30/2023 | 12/31/2023 | 3/31/2024 | ||||||||||||
Annuities | $1 | $— | $1 | $1 | $1 | ||||||||||||
Life Insurance | 2 | 1 | — | 2 | — | ||||||||||||
Group Protection | — | — | — | — | — | ||||||||||||
Retirement Plan Services | — | 1 | — | — | 1 | ||||||||||||
Other Operations | — | — | — | — | — | ||||||||||||
Consolidated | $3 | $2 | $1 | $3 | $2 | ||||||||||||
Items Impacting Segment Results
For the Three Months Ended March 31, 2024 | |||||||||||||||||
(in millions) | Annuities | Life Insurance | Group Protection | Retirement Plan Services | Other Operations | ||||||||||||
After-tax segment impacts: | |||||||||||||||||
Alternative investment income compared to long-term target(1) | $(1) | $(5) | $— | $— | $— | ||||||||||||
Prepayment income(2) | 1 | — | — | 1 | — | ||||||||||||
Annual assumption review | — | — | — | — | — | ||||||||||||
Legal accruals | — | — | — | — | (90) | ||||||||||||
| Tax items | (12) | (1) | — | — | (3) | ||||||||||||
| Other | (19) | — | — | — | (39) | ||||||||||||
Total impact | $(31) | $(6) | $— | $1 | $(132) | ||||||||||||
(1) Alternative investment income comparison to long-term target assumes a 10% annual return on the alternative investment portfolio.
(2) Prepayment income is actual income reported in the quarter.
"Other" in the table above includes severance expense of $39 million related to organizational changes and a $19 million balance sheet true-up in preparation for the close of the sale of the wealth management business.
Capital and Liquidity
| For the Three Months Ended | |||||||||||||||||
| 3/31/23 | 6/30/23 | 9/30/23 | 12/31/23 | 3/31/24 | |||||||||||||
Holding company available liquidity1 | $ | 454 | $ | 457 | $ | 455 | $ | 458 | $ | 466 | |||||||
RBC Ratio2 | ~380% | ~380% | 375-385% | 407 | % | 400-410% | |||||||||||
| Book value per share (BVPS), including AOCI | $ | 33.89 | $ | 28.49 | $ | 13.04 | $ | 34.81 | $ | 38.46 | |||||||
Book value per share, excluding AOCI3 | $ | 56.04 | $ | 58.58 | $ | 63.03 | $ | 55.30 | $ | 61.63 | |||||||
Adjusted book value per share3,4 | $ | 66.05 | $ | 64.37 | $ | 63.53 | $ | 64.97 | $ | 65.01 | |||||||
1 Holding company available liquidity presented for the quarters ended 3/31/2023 and 6/30/2023 does not include the $500 million prefunding used to repay $500 million of debt that matured at 9/30/2023, and the quarter ended 3/31/2024 does not include the $300 million prefunding of a 2025 maturity.
2 The RBC ratio is calculated as of December 31 annually, but is reported in the March statutory reporting, and as such, the quarterly ratios presented for 3/31/2023, 6/30/2023, 9/30/2023 and 3/31/2024 are considered estimates based on information known at the time of reporting.
3 Refer to the reconciliation to book value per share, including AOCI, at the back of this release.
4 This measure has been updated, effective beginning with the fourth quarter of 2023, to exclude reinsurance-related embedded derivatives and the underlying portfolio gains (losses), given the size of the impact of the fourth quarter 2023 reinsurance transaction. Such amounts in the prior periods presented, and the impact of this change to such prior periods, was not meaningful.
Annuities
| As for or For the Three Months Ended | ||||||||||||||||||||
| 3/31/23 | 6/30/23 | 9/30/23 | 12/31/23 1 | 3/31/24 | Change | |||||||||||||||
| Total operating revenues | $ | 1,141 | $ | 1,190 | $ | 1,197 | $ | (525) | $ | 1,269 | 11.2 | % | ||||||||
| Total operating expenses | 841 | 880 | 915 | (846) | 952 | 13.2 | % | |||||||||||||
| Income (loss) from operations before taxes | 300 | 310 | 282 | 321 | 317 | 5.7 | % | |||||||||||||
| Federal income tax expense (benefit) | 26 | 39 | 34 | 42 | 58 | 123.1 | % | |||||||||||||
| Income (loss) from operations | $ | 274 | $ | 271 | $ | 248 | $ | 279 | $ | 259 | (5.5) | % | ||||||||
| Total sales | $ | 3,164 | $ | 2,582 | $ | 2,728 | $ | 4,365 | $ | 2,847 | (10.0) | % | ||||||||
| Net flows | $ | (331) | $ | (1,108) | $ | (874) | $ | 285 | $ | (1,993) | NM | |||||||||
| Average account balances, net of reinsurance | $ | 146,331 | $ | 148,260 | $ | 151,312 | $ | 147,419 | $ | 155,291 | 6.1 | % | ||||||||
Return on average account balances2 | 75 | 73 | 66 | 76 | 67 | |||||||||||||||
1 Day one impacts related to the reinsurance transaction with Fortitude Re caused line-item volatility in the fourth quarter 2023.
2 Reported ROA including the impact of the following significant items: 1Q’23: $11M dividends received deduction true-up; 3Q’23: $(12)M assumption review; 4Q’23: $14M model refinement; and 1Q’24: $(19)M balance sheet true-up in preparation for the close of the sale of the wealth management business and $(12)M of tax-related items.
•Income from operations was $259 million for the first quarter, down 5.5% over the prior year. The year-over-year reduction was driven by the unfavorable impact of $31 million of significant items related to a balance sheet true-up in preparation for the close of the sale of the wealth management business of $19 million and $12 million in tax-related expenses.
•We continued our track record of strong annuity sales, which once again exceeded $2.5 billion in the quarter.
•Net outflows were approximately $2 billion in the quarter, compared to net outflows of $331 million in the prior-year quarter, the result of higher interest rates coinciding with higher account balances.
•Average account balances, net of reinsurance, for the quarter were $155 billion, up 6%, compared to $146 billion in the prior-year quarter, primarily driven by growth in variable annuities. RILA represented 19% of total annuity end-of-quarter account balances, net of reinsurance, an increase of 4 percentage points compared to the prior-year quarter.
Life Insurance
| As for or For the Three Months Ended | ||||||||||||||||||||
| 3/31/23 | 6/30/23 | 9/30/23 | 12/31/23 | 3/31/24 | Change | |||||||||||||||
| Total operating revenues | $ | 1,757 | $ | 1,760 | $ | 1,723 | $ | 1,667 | $ | 1,541 | (12.3) | % | ||||||||
| Total operating expenses | 1,780 | 1,725 | 1,952 | 1,681 | 1,591 | (10.6) | % | |||||||||||||
| Income (loss) from operations before taxes | (23) | 35 | (229) | (14) | (50) | NM | ||||||||||||||
| Federal income tax expense (benefit) | (10) | 2 | (56) | (8) | (15) | (50.0) | % | |||||||||||||
| Income (loss) from operations | $ | (13) | $ | 33 | $ | (173) | $ | (6) | $ | (35) | NM | |||||||||
| Average account balances, net of reinsurance | $ | 49,100 | $ | 50,049 | $ | 50,130 | $ | 45,608 | $ | 42,280 | (13.9) | % | ||||||||
| Total sales | $ | 130 | $ | 123 | $ | 144 | $ | 144 | $ | 91 | (30.0) | % | ||||||||
•Loss from operations was $(35) million for the quarter, $22 million lower than the loss from operations of $(13) million in the prior-year quarter. The year-over-year change was driven primarily by the impact of the Fortitude Re reinsurance transaction that closed in the fourth quarter of 2023.
•Total sales were 30% lower year over year, driven by our intentional shift to a capital-efficient new business mix.
•Average account balances, net of reinsurance, were $42 billion, down 14% compared to the prior-year quarter, driven by the impact of the Fortitude Re transaction.
Group Protection
| As of or For the Three Months Ended | ||||||||||||||||||||
| 3/31/23 | 6/30/23 | 9/30/23 | 12/31/23 | 3/31/24 | Change | |||||||||||||||
| Total operating revenues | $ | 1,388 | $ | 1,400 | $ | 1,388 | $ | 1,387 | $ | 1,425 | 2.7 | % | ||||||||
| Total operating expenses | 1,299 | 1,262 | 1,302 | 1,322 | 1,324 | 1.9 | % | |||||||||||||
| Income (loss) from operations before taxes | 89 | 138 | 86 | 65 | 101 | 13.5 | % | |||||||||||||
| Federal income tax expense (benefit) | 18 | 29 | 18 | 13 | 21 | 16.7 | % | |||||||||||||
| Income (loss) from operations | $ | 71 | $ | 109 | $ | 68 | $ | 52 | $ | 80 | 12.7 | % | ||||||||
| Insurance premiums | $ | 1,251 | $ | 1,263 | $ | 1,251 | $ | 1,250 | $ | 1,285 | 2.7 | % | ||||||||
| Total sales | $ | 128 | $ | 96 | $ | 71 | $ | 398 | $ | 144 | 12.5 | % | ||||||||
| Total loss ratio | 75.0 | % | 71.3 | % | 75.2 | % | 76.6 | % | 75.0 | % | ||||||||||
| Operating margin | 5.6 | % | 8.6 | % | 5.4 | % | 4.1 | % | 6.2 | % | ||||||||||
•Income from operations was $80 million in the quarter, compared to $71 million in the prior-year quarter, driven by lower expenses and pricing discipline.
•Group Protection's margin grew 60 basis points year over year to 6.2%, attributable to disciplined pricing and lower expenses. Total loss ratio was 75.0% in the quarter in line with the prior-year quarter, resulting
from lower life incidence offset by higher disability results, which were historically low in the first half of 2023.
•Insurance premiums were $1.3 billion in the quarter, up 3% compared to the prior-year quarter.
•Group Protection sales for the quarter were $144 million, up 13% compared to the prior-year quarter, driven by broad-based growth across products and market segments.
Retirement Plan Services
| As of or For the Three Months Ended | ||||||||||||||||||||
| 3/31/23 | 6/30/23 | 9/30/23 | 12/31/23 | 3/31/24 | Change | |||||||||||||||
| Total operating revenues | $ | 328 | $ | 334 | $ | 327 | $ | 322 | $ | 322 | (1.8) | % | ||||||||
| Total operating expenses | 277 | 279 | 277 | 278 | 281 | 1.4 | % | |||||||||||||
| Income (loss) from operations before taxes | 51 | 55 | 50 | 44 | 41 | (19.6) | % | |||||||||||||
| Federal income tax expense (benefit) | 8 | 8 | 7 | 6 | 5 | (37.5) | % | |||||||||||||
| Income (loss) from operations | $ | 43 | $ | 47 | $ | 43 | $ | 38 | $ | 36 | (16.3) | % | ||||||||
| Deposits | $ | 3,209 | $ | 2,897 | $ | 2,700 | $ | 2,972 | $ | 3,802 | 18.5 | % | ||||||||
| Net flows | $ | 535 | $ | 201 | $ | (272) | $ | (332) | $ | 391 | (26.9) | % | ||||||||
| Average account balances | $ | 91,457 | $ | 94,099 | $ | 96,473 | $ | 96,045 | $ | 103,240 | 12.9 | % | ||||||||
| Return on average account balances | 19 | 20 | 18 | 16 | 14 | |||||||||||||||
•Income from operations was $36 million in the quarter, a 16% decline compared to the prior-year quarter, primarily driven by lower spread income.
•Total deposits for the quarter were $3.8 billion, an increase of 18.5% over the prior-year quarter driven by significant sales growth of 53% year over year and strong recurring deposit growth of 8%.
•Net flows totaled $391 million for the quarter.
•Average account balances for the quarter were $103 billion, increasing 13% from the prior-year quarter.
Other Operations
| As of or For the Three Months Ended | ||||||||||||||||||||
| 3/31/23 | 6/30/23 | 9/30/23 | 12/31/231 | 3/31/24 | Change | |||||||||||||||
| Total operating revenues | $ | 43 | $ | 46 | $ | 38 | $ | (884) | $ | 27 | (37.2) | % | ||||||||
| Total operating expenses | 150 | 181 | 180 | (744) | 321 | 114.0 | % | |||||||||||||
| Income (loss) from operations before taxes | (107) | (135) | (142) | (140) | (294) | NM | ||||||||||||||
| Federal income tax expense (benefit) | (20) | (29) | (29) | (35) | (59) | NM | ||||||||||||||
Income (loss) from operations2 | $ | (87) | $ | (106) | $ | (113) | $ | (105) | $ | (235) | NM | |||||||||
1 Day one impacts related to the reinsurance transaction with Fortitude Re caused line-item volatility in the fourth quarter 2023.
2 Income (loss) from operations does not include preferred dividends.
•First quarter 2024 operating loss included the impact of a legal accrual of $90 million, severance expense of $39 million, and a $3 million tax-related expense.
Unrealized Gains and Losses
The Company reported a net unrealized loss of $9.8 billion (pre-tax) on its available-for-sale securities as of March 31, 2024. This compared to a net unrealized loss of $9.6 billion (pre-tax) as of March 31, 2023, with the year-over-year decrease primarily due to higher treasury rates.
The tables attached to this release define and reconcile the non-GAAP measures adjusted income (loss) from operations, adjusted income (loss) from operations available to common stockholders, book value per share, excluding AOCI, and adjusted book value per share to net income (loss), net income (loss) available to common stockholders, and book value per share, including AOCI, calculated in accordance with GAAP.
This press release contains statements that are forward-looking, and actual results may differ materially. Please see the Forward-looking Statements – Cautionary Language at the end of this release for factors that may cause actual results to differ materially from the company’s current expectations.
For other financial information, please refer to the company’s first quarter 2024 statistical supplement, which is available in the investor relations section of its website http://www.lincolnfinancial.com/investor.
Conference Call Information
Lincoln Financial Group will discuss the company’s first-quarter 2024 results with the investment community in a conference call beginning at 8:00 a.m. Eastern Time on Thursday, May 2, 2024.
The conference call will be broadcast live through the company’s website at www.lincolnfinancial.com/webcast. Please log on to the webcast at least 15 minutes prior to the start of the conference call to download and install any necessary streaming media software. A replay of the call will be available by 10:30 a.m. Eastern Time on May 2, 2024, at www.lincolnfinancial.com/webcast.
About Lincoln Financial Group
Lincoln Financial Group helps people to plan, protect and retire with confidence. As of December 31, 2023, approximately 17 million customers trust our guidance and solutions across four core businesses – annuities, life insurance, group protection, and retirement plan services. As of March 31, 2024, the company had $310 billion in end-of-period account balances, net of reinsurance. Headquartered in Radnor, Pa., Lincoln Financial Group is the marketing name for Lincoln National Corporation (NYSE: LNC) and its affiliates. Learn more at LincolnFinancial.com.
| Contacts: | ||||||||||||||
| Tina Madon | Sarah Boxler | |||||||||||||
| 445-280-0488 | 215-495-8439 | |||||||||||||
| Investor Relations | Media Relations | |||||||||||||
| [email protected] | [email protected] | |||||||||||||
Explanatory Notes on Use of Non-GAAP Measures
Management believes that adjusted income (loss) from operations (or adjusted operating income), adjusted income (loss) from operations available to common stockholders, and adjusted income (loss) from operations per diluted share available to common stockholders better explain the results of the company’s ongoing businesses in a manner that allows for a better understanding of the underlying trends in the company’s current business as the excluded items are unpredictable and not necessarily indicative of current operating fundamentals or future performance of the business segments, and, in most instances, decisions regarding these items do not necessarily relate to the operations of the individual segments. Management also believes that using book value, excluding accumulated other comprehensive income (“AOCI”), and adjusted book value per share enables investors to analyze the amount of our net worth that is primarily attributable to our business operations. Book value per share, excluding AOCI is useful to investors because it eliminates the effect of items that are unpredictable and can fluctuate significantly from period to period, primarily based on changes in interest rates. Adjusted book value per share is useful to investors because it eliminates the effect of items that are unpredictable and can fluctuate significantly from period to period, primarily based on changes in equity markets and interest rates.
For the historical periods, reconciliations of non-GAAP measures used in this press release to the most directly comparable GAAP measure may be included in this Appendix to the press release and/or are included in the Statistical Supplements for the corresponding periods contained in the Earnings section of the Investor Relations page on our website: http://www.lincolnfinancial.com/investor.
Definitions of Non-GAAP Measures Used in this Press Release
Adjusted income (loss) from operations, adjusted income (loss) from operations available to common stockholders, book value per share, excluding AOCI, and adjusted book value per share are financial measures we use to evaluate and assess our results. Adjusted income (loss) from operations, adjusted income (loss) from operations available to common stockholders, book value per share, excluding AOCI, and adjusted book value per share, as used in the press release, are non-GAAP financial measures and do not replace GAAP net income (loss), net income (loss) available to common stockholders, and book value per share, including AOCI, the most directly comparable GAAP measures.
Adjusted Income (Loss) from Operations
Adjusted income (loss) from operations is GAAP net income (loss) excluding the after-tax effects of the following items, as applicable:
•Items related to annuity product features, which include changes in MRBs, including gains and losses and benefit payments (“MRB-related impacts”), changes in the fair value of the derivative instruments we hold to hedge GLB and GDB riders, net of fee income allocated to support the cost of hedging them, and changes in the fair value of the embedded derivative liabilities of our indexed annuity contracts and the associated index options we hold to hedge them, including collateral expense associated with the hedge program (collectively, “net annuity product features”);
•Items related to life insurance product features, which include changes in the fair value of derivatives we hold as part of VUL hedging, changes in reserves resulting from benefit ratio unlocking associated with the impact of capital markets, and changes in the fair value of the embedded derivative liabilities of our IUL contracts and the associated index options we hold to hedge them (collectively, “net life insurance product features”);
•Credit loss-related adjustments on fixed maturity AFS securities, mortgage loans on real estate and reinsurance-related assets (“credit loss-related adjustments”);
•Changes in the fair value of equity securities, certain derivatives, certain other investments and realized gains (losses) on sales, disposals and impairments of financial assets (collectively, “investment gains (losses)”);
•Changes in the fair value of reinsurance-related embedded derivatives, trading securities and mortgage loans on real estate electing the fair value option (“changes in the fair value of reinsurance-related embedded derivatives, trading securities and certain mortgage loans”);
•Income (loss) from the initial adoption of new accounting standards, regulations and policy changes;
•Income (loss) from reserve changes, net of related amortization, on business sold through reinsurance;
•Transaction and integration costs related to mergers and acquisitions including the acquisition or divestiture, through reinsurance or other means, of businesses or blocks of business;
•Gains (losses) on modification or early extinguishment of debt;
•Losses from the impairment of intangible assets and gains (losses) on other non-financial assets; and
•Income (loss) from discontinued operations.
Adjusted Income (Loss) from Operations Available to Common Stockholders
Adjusted income (loss) from operations available to common stockholders is defined as after-tax adjusted income (loss) from operations less preferred stock dividends and the adjustment for deferred units of LNC stock in our deferred compensation plans.
Book Value Per Share, Excluding AOCI
Book value per share, excluding AOCI, is calculated based upon a non-GAAP financial measure.
•It is calculated by dividing (a) stockholders’ equity, excluding AOCI and preferred stock, by (b) common shares outstanding.
•We provide book value per share, excluding AOCI, to enable investors to analyze the amount of our net worth that is attributable primarily to our business operations.
•Management believes book value per share, excluding AOCI, is useful to investors because it eliminates the effect of items that are unpredictable and can fluctuate significantly from period to period, primarily based on changes in interest rates.
•Book value per share is the most directly comparable GAAP measure.
Adjusted Book Value Per Share
Adjusted book value per share is calculated based upon a non-GAAP financial measure.
•It is calculated by dividing (a) stockholders’ equity, excluding AOCI, preferred stock, MRB-related impacts, GLB and GLB hedge instrument gains (losses), and the difference between amounts recognized in net income (loss) on reinsurance-related embedded derivatives and the underlying asset portfolios (“reinsurance-related embedded derivatives and portfolio gains (losses)”) by (b) common shares outstanding.
•We provide adjusted book value per share to enable investors to analyze the amount of our net worth that is primarily attributable to our business operations.
•Management believes adjusted book value per share is useful to investors because it eliminates the effect of market movements that are unpredictable that can fluctuate significantly from period to period, primarily based on changes in equity markets and interest rates.
•Book value per share is the most directly comparable GAAP measure.
Other Definitions
Holding Company Available Liquidity
Holding company available liquidity consists of cash and invested cash, excluding cash held as collateral, and certain short-term investments that can be readily converted into cash, net of commercial paper outstanding.
Notable Items
Notable items are items which, in management’s view, do not reflect the company’s normal, ongoing operations.
•We believe highlighting notable items included in adjusted income (loss) from operations enables investors to better understand the fundamental trends in its results of operations and financial condition.
Sales
Sales as reported consist of the following:
•Annuities and Retirement Plan Services – deposits from new and existing customers;
•Universal life insurance (“UL”), indexed universal life insurance (“IUL”), variable universal life insurance (“VUL”) – first-year commissionable premiums plus 5% of excess premiums received;
•MoneyGuard® linked-benefit products – MoneyGuard® (UL), 15% of total expected premium deposits, and MoneyGuard Market AdvantageSM (VUL), 150% of commissionable premiums;
•Executive Benefits – insurance and corporate-owned UL and VUL, first-year commissionable premiums plus 5% of excess premium received, and single premium bank-owned UL and VUL, 15% of single premium deposits;
•Term – 100% of annualized first-year premiums; and
•Group Protection – annualized first-year premiums from new policies.
Lincoln National Corporation
Reconciliation of Net Income to Adjusted Income from Operations
| For the | |||||||||||
| (in millions, except per share data) | Three Months Ended | ||||||||||
| March 31, | |||||||||||
| 2024 | 2023 | ||||||||||
| Net Income (Loss) Available to Common | |||||||||||
| Stockholders – Diluted | $ | 1,191 | $ | (909) | |||||||
| Less: | |||||||||||
| Preferred stock dividends declared | (34) | (25) | |||||||||
| Adjustment for deferred units of LNC stock in our | |||||||||||
deferred compensation plans (1) | 3 | (3) | |||||||||
| Net Income (Loss) | 1,222 | (881) | |||||||||
| Less: | |||||||||||
| Net annuity product features, after-tax | 1,141 | (1,018) | |||||||||
| Net life insurance product features, after-tax | (103) | (95) | |||||||||
| Credit loss-related adjustments, after-tax | (1) | (18) | |||||||||
| Investment gains (losses), after-tax | (65) | (45) | |||||||||
| Changes in the fair value of reinsurance-related | |||||||||||
| embedded derivatives, trading securities and certain | |||||||||||
mortgage loans, after-tax (2) | 153 | 7 | |||||||||
| Transaction and integration costs related to mergers, | |||||||||||
acquisitions and divestitures, after-tax (3) | (8) | — | |||||||||
| Total adjustments | 1,117 | (1,169) | |||||||||
| Adjusted Income (Loss) from Operations | $ | 105 | $ | 288 | |||||||
| Add: | |||||||||||
| Preferred stock dividends declared | (34) | (25) | |||||||||
| Adjustment for deferred units of LNC stock | |||||||||||
| in our deferred compensation plans | — | (3) | |||||||||
| Adjusted Income (Loss) from Operations Available to Common Stockholders | $ | 71 | $ | 260 | |||||||
Earnings (Loss) Per Common Share – Diluted (4) | |||||||||||
| Net income (loss) | $ | 6.93 | $ | (5.37) | |||||||
| Adjusted income (loss) from operations | 0.41 | 1.52 | |||||||||
| Stockholders’ Equity, Average | |||||||||||
| Stockholders' equity | $ | 7,219 | $ | 5,917 | |||||||
| Less: | |||||||||||
| Preferred stock | 986 | 986 | |||||||||
| AOCI | (3,714) | (5,053) | |||||||||
| Stockholders’ equity, excluding AOCI and preferred stock | 9,947 | 9,984 | |||||||||
| MRB-related impacts | 1,829 | (905) | |||||||||
| GLB and GDB hedge instruments gains (losses) | (2,380) | (269) | |||||||||
| Reinsurance-related embedded derivatives and portfolio gains (losses) | (557) | NM | |||||||||
| Adjusted average stockholders' equity | $ | 11,055 | $ | 11,158 | |||||||
(1) We exclude deferred units of LNC stock that are antidilutive from our diluted earnings per share calculation.
(2) Includes primarily changes in the fair value of the embedded derivative related to the fourth quarter 2023 reinsurance transaction.
(3) Includes costs pertaining to the planned sale of our wealth management business and the fourth quarter 2023 reinsurance transaction.
(4) In periods where a net loss or adjusted loss from operations is presented, basic shares are used in the diluted EPS and adjusted diluted EPS calculations, as the use of diluted shares would result in a lower loss per share.
Lincoln National Corporation
Reconciliation of Book Value per Share
| As for the Three Months Ended | ||||||||||||||||||||||||||||||||
| 3/31/2023 | 6/30/2023 | 9/30/2023 | 12/31/2023 | 3/31/2024 | ||||||||||||||||||||||||||||
| Book Value Per Common Share | ||||||||||||||||||||||||||||||||
| Book value per share | $ | 33.89 | $ | 28.49 | $ | 13.04 | $ | 34.81 | $ | 38.46 | ||||||||||||||||||||||
| Less: | ||||||||||||||||||||||||||||||||
| AOCI | (22.15) | (30.09) | (49.99) | (20.49) | (23.17) | |||||||||||||||||||||||||||
| Book value per share, excluding AOCI | 56.04 | 58.58 | 63.03 | 55.30 | 61.63 | |||||||||||||||||||||||||||
| Less: | ||||||||||||||||||||||||||||||||
| MRB-related gains (losses) | (6.83) | 2.51 | 9.11 | 6.38 | 15.10 | |||||||||||||||||||||||||||
| GLB and GDB hedge instruments gains (losses) | (3.18) | (8.30) | (9.61) | (12.29) | (15.69) | |||||||||||||||||||||||||||
| Reinsurance-related embedded derivatives and portfolio gains (losses) | NM | NM | NM | (3.76) | (2.79) | |||||||||||||||||||||||||||
| Adjusted book value per share1 | $ | 66.05 | $ | 64.37 | $ | 63.53 | $ | 64.97 | $ | 65.01 | ||||||||||||||||||||||
1 This measure has been updated, effective beginning with the fourth quarter of 2023, to exclude reinsurance-related embedded derivatives and the underlying portfolio gains (losses), given the size of the impact of the fourth quarter 2023 reinsurance transaction. Such amounts in the prior periods presented, and the impact of this change
to such prior periods, was not meaningful.
to such prior periods, was not meaningful.
Lincoln National Corporation
Digest of Earnings
| For the | |||||||||||
| (in millions, except per share data) | Three Months Ended | ||||||||||
| March 31, | |||||||||||
| 2024 | 2023 | ||||||||||
| Revenues | $ | 4,116 | $ | 3,814 | |||||||
| Net Income (Loss) | $ | 1,222 | $ | (881) | |||||||
| Preferred stock dividends declared | (34) | (25) | |||||||||
| Adjustment for deferred units of LNC stock in our | |||||||||||
deferred compensation plans (1) | 3 | (3) | |||||||||
| Net Income (Loss) Available to Common | |||||||||||
| Stockholders – Diluted | $ | 1,191 | $ | (909) | |||||||
| Earnings (Loss) Per Common Share – Basic | $ | 6.98 | $ | (5.35) | |||||||
Earnings (Loss) Per Common Share – Diluted (2) | $ | 6.93 | $ | (5.37) | |||||||
| Average Shares – Basic | 170,049,994 | 169,357,846 | |||||||||
| Average Shares – Diluted | 171,834,746 | 170,485,160 | |||||||||
(1) We exclude deferred units of LNC stock that are antidilutive from our diluted earnings per share calculation.
(2) In periods where a net loss or adjusted loss from operations is presented, basic shares are used in the diluted EPS and adjusted diluted EPS calculations, as the use of diluted shares would result in a lower loss per share.
1
FORWARD-LOOKING STATEMENTS – CAUTIONARY LANGUAGE
Certain statements made in this press release and in other written or oral statements made by Lincoln or on Lincoln’s behalf are “forward-looking statements” within the meaning of the Private Securities Litigation Reform Act of 1995 (“PSLRA”). A forward-looking statement is a statement that is not a historical fact and, without limitation, includes any statement that may predict, forecast, indicate or imply future results, performance or achievements. Forward-looking statements may contain words like: “anticipate,” “believe,” “estimate,” “expect,” “project,” “shall,” “will” and other words or phrases with similar meaning in connection with a discussion of future operating or financial performance. In particular, these include statements relating to future actions, trends in Lincoln’s businesses, prospective services or products, future performance or financial results and the outcome of contingencies, such as legal proceedings. Lincoln claims the protection afforded by the safe harbor for forward-looking statements provided by the PSLRA.
Forward-looking statements are subject to risks and uncertainties. Actual results could differ materially from those expressed in or implied by such forward-looking statements due to a variety of factors, including:
•Weak general economic and business conditions that may affect demand for our products, account balances, investment results, guaranteed benefit liabilities, premium levels and claims experience;
•Adverse global capital and credit market conditions that may affect our ability to raise capital, if necessary, and may cause us to realize impairments on investments and certain intangible assets, including goodwill and the valuation allowance against deferred tax assets, which may reduce future earnings and/or affect our financial condition and ability to raise additional capital or refinance existing debt as it matures;
•The inability of our subsidiaries to pay dividends to the holding company in sufficient amounts, which could harm the holding company’s ability to meet its obligations;
•Legislative, regulatory or tax changes, both domestic and foreign, that affect: the cost of, or demand for, our subsidiaries’ products; the required amount of reserves and/or surplus; our ability to conduct business and our captive reinsurance arrangements as well as restrictions on the payment of revenue sharing and 12b-1 distribution fees;
•The impact of U.S. federal tax reform legislation on our business, earnings and capital;
•The impact of regulations adopted by the Securities and Exchange Commission (“SEC”), the Department of Labor or other federal or state regulators or self-regulatory organizations that could adversely affect our distribution model and sales of our products and result in additional disclosure and other requirements related to the sale and delivery of our products;
•The impact of new and emerging rules, laws and regulations relating to privacy, cybersecurity and artificial intelligence that may lead to increased compliance costs, reputation risk and/or changes in business practices;
•Increasing scrutiny and evolving expectations and regulations regarding ESG matters that may adversely affect our reputation and our investment portfolio;
•Actions taken by reinsurers to raise rates on in-force business;
•Declines in or sustained low interest rates causing a reduction in investment income, the interest margins of our businesses and demand for our products;
•Rapidly increasing or sustained high interest rates that may negatively affect our profitability, value of our investment portfolio and capital position and may cause policyholders to surrender annuity and life insurance policies, thereby causing realized investment losses;
•The impact of the implementation of the provisions of the European Market Infrastructure Regulation relating to the regulation of derivatives transactions;
•The initiation of legal or regulatory proceedings against us, and the outcome of any legal or regulatory proceedings, such as: adverse actions related to present or past business practices common in businesses in which we compete; adverse decisions in significant actions including, but not limited to, actions brought by federal and state authorities and class action cases; new decisions that result in changes in law; and unexpected trial court rulings;
•A decline or continued volatility in the equity markets causing a reduction in the sales of our subsidiaries’ products; a reduction of asset-based fees that our subsidiaries charge on various investment and insurance
products; and an increase in liabilities related to guaranteed benefit riders, which are accounted for as market risk benefits, of our subsidiaries’ variable annuity products;
•Ineffectiveness of our risk management policies and procedures, including our various hedging strategies;
•A deviation in actual experience regarding future policyholder behavior, mortality, morbidity, interest rates or equity market returns from the assumptions used in pricing our subsidiaries’ products and in establishing related insurance reserves, which may reduce future earnings;
•Changes in accounting principles that may affect our consolidated financial statements;
•Lowering of one or more of our debt ratings issued by nationally recognized statistical rating organizations and the adverse effect such action may have on our ability to raise capital and on our liquidity and financial condition;
•Lowering of one or more of the insurer financial strength ratings of our insurance subsidiaries and the adverse effect such action may have on the premium writings, policy retention, profitability of our insurance subsidiaries and liquidity;
•Significant credit, accounting, fraud, corporate governance or other issues that may adversely affect the value of certain financial assets, as well as counterparties to which we are exposed to credit risk, requiring that we realize losses on financial assets;
•Interruption in telecommunication, information technology or other operational systems or failure to safeguard the confidentiality or privacy of sensitive data on such systems, including from cyberattacks or other breaches of our data security systems;
•The effect of acquisitions and divestitures, including the inability to realize the anticipated benefits of acquisitions and dispositions of businesses and potential operating difficulties and unforeseen liabilities relating thereto, as well as the effect of restructurings, product withdrawals and other unusual items;
•The inability to realize or sustain the benefits we expect from, greater than expected investments in, and the potential impact of efforts related to, our strategic initiatives;
•The adequacy and collectability of reinsurance that we have obtained;
•Pandemics, acts of terrorism, war or other man-made and natural catastrophes that may adversely impact liabilities for policyholder claims, affect our businesses and increase the cost and availability of reinsurance;
•Competitive conditions, including pricing pressures, new product offerings and the emergence of new competitors, that may affect the level of premiums and fees that our subsidiaries can charge for their products;
•The unknown effect on our subsidiaries’ businesses resulting from evolving market preferences and the changing demographics of our client base; and
•The unanticipated loss of key management, financial planners or wholesalers.
The risks and uncertainties included here are not exhaustive. Our most recent Form 10-K, as well as other reports that we file with the SEC, include additional factors that could affect our businesses and financial performance. Moreover, we operate in a rapidly changing and competitive environment. New risk factors emerge from time to time, and it is not possible for management to predict all such risk factors.
Further, it is not possible to assess the effect of all risk factors on our businesses or the extent to which any factor, or combination of factors, may cause actual results to differ materially from those contained in any forward-looking statements. Given these risks and uncertainties, investors should not place undue reliance on forward-looking statements as a prediction of actual results. In addition, Lincoln disclaims any obligation to correct or update any forward-looking statements to reflect events or circumstances that occur after the date of this press release.
The reporting of Risk-Based Capital (“RBC”) measures is not intended for the purpose of ranking any insurance company or for use in connection with any marketing, advertising or promotional activities.
| Lincoln Financial Group | |||||||||||
| Table of Contents | |||||||||||
| Notes | 1 | ||||||||||
| Credit Ratings | 2 | ||||||||||
| Consolidated | |||||||||||
| Consolidated Statements of Income (Loss) | 3 | ||||||||||
| Consolidated Balance Sheets | 4 | ||||||||||
| Earnings, Shares and Return on Equity | 5 | ||||||||||
| Key Stakeholder Metrics | 6 | ||||||||||
| Select Earnings Drivers By Segment | 7 | ||||||||||
| Sales By Segment | 8 | ||||||||||
| Operating Revenues and General and Administrative Expenses By Segment | 9 | ||||||||||
| Operating Commissions and Other Expenses | 10 | ||||||||||
| Select Earnings and Operational Data from Business Segments | |||||||||||
| Annuities | 11 | ||||||||||
| Life Insurance | 12 | ||||||||||
| Group Protection | 13 | ||||||||||
| Retirement Plan Services | 14 | ||||||||||
| Other Operations | 15 | ||||||||||
| DAC & Account Balance Roll Forwards | |||||||||||
| Consolidated DAC, VOBA, DSI and DFEL Roll Forwards | 16 | ||||||||||
| Account Balance Roll Forwards: | |||||||||||
| Annuities | 17 | ||||||||||
| Life Insurance | 18 | ||||||||||
| Retirement Plan Services | 19 | ||||||||||
| Investment Information | |||||||||||
| Fixed-Income Asset Class | 20 | ||||||||||
| Fixed-Income Credit Quality | 21 | ||||||||||
| GAAP to Non-GAAP Reconciliations | |||||||||||
| Select GAAP to Non-GAAP Reconciliations | 22-24 | ||||||||||
| Lincoln Financial Group | ||||||||||||||||||||||||||||||||||||||||||||||||||||||||||||||||||||||||||||||||
| Notes | ||||||||||||||||||||||||||||||||||||||||||||||||||||||||||||||||||||||||||||||||
| Non-GAAP Performance Measures | ||||||||||||||||||||||||||||||||||||||||||||||||||||||||||||||||||||||||||||||||
| Non-GAAP measures do not replace the most directly comparable GAAP measures, and we have included detailed reconciliations herein beginning on page 22. | ||||||||||||||||||||||||||||||||||||||||||||||||||||||||||||||||||||||||||||||||
| Adjusted Income (Loss) From Operations | ||||||||||||||||||||||||||||||||||||||||||||||||||||||||||||||||||||||||||||||||
| Adjusted income (loss) from operations is GAAP net income excluding the after-tax effects of the following items, as applicable: | ||||||||||||||||||||||||||||||||||||||||||||||||||||||||||||||||||||||||||||||||
| • Items related to annuity product features, which include changes in market risk benefits (“MRBs”), including gains and losses and benefit payments (“MRB-related impacts”), changes in the fair | ||||||||||||||||||||||||||||||||||||||||||||||||||||||||||||||||||||||||||||||||
| value of the derivative instruments we hold to hedge guaranteed living benefit (“GLB”) and guaranteed death benefit (“GDB”) riders, net of fee income allocated to support the cost of hedging them, | ||||||||||||||||||||||||||||||||||||||||||||||||||||||||||||||||||||||||||||||||
| and changes in the fair value of the embedded derivative liabilities of our indexed annuity contracts and the associated index options we hold to hedge them, including collateral expense associated with | ||||||||||||||||||||||||||||||||||||||||||||||||||||||||||||||||||||||||||||||||
| the hedge program (collectively, “net annuity product features”); | ||||||||||||||||||||||||||||||||||||||||||||||||||||||||||||||||||||||||||||||||
| • Items related to life insurance product features, which include changes in the fair value of derivatives we hold as part of variable universal life insurance (“VUL”) hedging, changes in reserves resulting | ||||||||||||||||||||||||||||||||||||||||||||||||||||||||||||||||||||||||||||||||
| from benefit ratio unlocking associated with the impact of capital markets, and changes in the fair value of the embedded derivative liabilities of our indexed universal life insurance (“IUL”) contracts | ||||||||||||||||||||||||||||||||||||||||||||||||||||||||||||||||||||||||||||||||
| and the associated index options we hold to hedge them (collectively, “net life insurance product features”); | ||||||||||||||||||||||||||||||||||||||||||||||||||||||||||||||||||||||||||||||||
| • Credit loss-related adjustments on fixed maturity available-for-sale (“AFS”) securities, mortgage loans on real estate and reinsurance-related assets (“credit loss-related adjustments”); | ||||||||||||||||||||||||||||||||||||||||||||||||||||||||||||||||||||||||||||||||
| • Changes in the fair value of equity securities, certain derivatives, certain other investments and realized gains (losses) on sales, disposals and impairments of financial assets (collectively, “investment | ||||||||||||||||||||||||||||||||||||||||||||||||||||||||||||||||||||||||||||||||
| gains (losses)”); | ||||||||||||||||||||||||||||||||||||||||||||||||||||||||||||||||||||||||||||||||
| • Changes in the fair value of reinsurance-related embedded derivatives, trading securities and mortgage loans on real estate electing the fair value option (“changes in the fair value of reinsurance-related | ||||||||||||||||||||||||||||||||||||||||||||||||||||||||||||||||||||||||||||||||
| embedded derivatives, trading securities and certain mortgage loans”); | ||||||||||||||||||||||||||||||||||||||||||||||||||||||||||||||||||||||||||||||||
| • Income (loss) from the initial adoption of new accounting standards, regulations and policy changes; | ||||||||||||||||||||||||||||||||||||||||||||||||||||||||||||||||||||||||||||||||
| • Income (loss) from reserve changes, net of related amortization, on business sold through reinsurance; | ||||||||||||||||||||||||||||||||||||||||||||||||||||||||||||||||||||||||||||||||
| • Transaction and integration costs related to mergers and acquisitions including the acquisition or divestiture, through reinsurance or other means, of businesses or blocks of business; | ||||||||||||||||||||||||||||||||||||||||||||||||||||||||||||||||||||||||||||||||
| • Gains (losses) on modification or early extinguishment of debt; | ||||||||||||||||||||||||||||||||||||||||||||||||||||||||||||||||||||||||||||||||
| • Losses from the impairment of intangible assets and gains (losses) on other non-financial assets; and | ||||||||||||||||||||||||||||||||||||||||||||||||||||||||||||||||||||||||||||||||
| • Income (loss) from discontinued operations. | ||||||||||||||||||||||||||||||||||||||||||||||||||||||||||||||||||||||||||||||||
Adjusted income (loss) from operations available to common stockholders is defined as after-tax adjusted income (loss) from operations less preferred stock dividends and the adjustment for deferred | ||||||||||||||||||||||||||||||||||||||||||||||||||||||||||||||||||||||||||||||||
| units of LNC stock in our deferred compensation plans. | ||||||||||||||||||||||||||||||||||||||||||||||||||||||||||||||||||||||||||||||||
| Adjusted Operating Revenues | ||||||||||||||||||||||||||||||||||||||||||||||||||||||||||||||||||||||||||||||||
| Adjusted operating revenues represent GAAP revenues excluding the pre-tax effects of the following items, as applicable: | ||||||||||||||||||||||||||||||||||||||||||||||||||||||||||||||||||||||||||||||||
| • Changes in the fair value of the derivative instruments we hold to hedge GLB and GDB riders, net of fee income allocated to support the cost of hedging them, and changes in the fair value of the | ||||||||||||||||||||||||||||||||||||||||||||||||||||||||||||||||||||||||||||||||
| embedded derivative liabilities of our indexed annuity and indexed universal life insurance contracts and the associated index options we hold to hedge them (“revenue adjustments from annuity and | ||||||||||||||||||||||||||||||||||||||||||||||||||||||||||||||||||||||||||||||||
| life insurance product features”); | ||||||||||||||||||||||||||||||||||||||||||||||||||||||||||||||||||||||||||||||||
| • Credit loss-related adjustments; | ||||||||||||||||||||||||||||||||||||||||||||||||||||||||||||||||||||||||||||||||
| • Investment gains (losses); | ||||||||||||||||||||||||||||||||||||||||||||||||||||||||||||||||||||||||||||||||
| • Changes in the fair value of reinsurance-related embedded derivatives, trading securities and certain mortgage loans; | ||||||||||||||||||||||||||||||||||||||||||||||||||||||||||||||||||||||||||||||||
| • Revenue adjustments from the initial adoption of new accounting standards; and | ||||||||||||||||||||||||||||||||||||||||||||||||||||||||||||||||||||||||||||||||
| • Amortization of deferred gains arising from reserve changes on business sold through reinsurance. | ||||||||||||||||||||||||||||||||||||||||||||||||||||||||||||||||||||||||||||||||
| Management believes that the non-GAAP performance measures discussed above explain the results of our ongoing businesses in a manner that allows for a better understanding of the underlying trends | ||||||||||||||||||||||||||||||||||||||||||||||||||||||||||||||||||||||||||||||||
| in our current business as the excluded items are unpredictable and not necessarily indicative of current operating fundamentals or future performance of the business segments, and, in many instances, | ||||||||||||||||||||||||||||||||||||||||||||||||||||||||||||||||||||||||||||||||
| decisions regarding these items do not necessarily relate to the operations of the individual segments. In addition, we believe that our definitions of adjusted operating revenues and adjusted income (loss) | ||||||||||||||||||||||||||||||||||||||||||||||||||||||||||||||||||||||||||||||||
| from operations provide investors with more valuable measures of our performance as they better reveal trends in our business. | ||||||||||||||||||||||||||||||||||||||||||||||||||||||||||||||||||||||||||||||||
Page 1a
| Lincoln Financial Group | ||||||||||||||||||||||||||||||||||||||||||||||||||||||||||||||||||||||||||||||||
| Notes | ||||||||||||||||||||||||||||||||||||||||||||||||||||||||||||||||||||||||||||||||
| Non-GAAP Performance Measures, Continued | ||||||||||||||||||||||||||||||||||||||||||||||||||||||||||||||||||||||||||||||||
| Stockholders’ Equity, Excluding AOCI and Preferred Stock | ||||||||||||||||||||||||||||||||||||||||||||||||||||||||||||||||||||||||||||||||
| Stockholders’ equity, excluding AOCI and preferred stock is stockholders’ equity, excluding AOCI and preferred stock. Management believes this metric is useful to investors because it eliminates market | ||||||||||||||||||||||||||||||||||||||||||||||||||||||||||||||||||||||||||||||||
| movements that are unpredictable and can fluctuate significantly from period to period, primarily related to changes in interest rates. Stockholders’ equity is the most directly comparable GAAP measure. | ||||||||||||||||||||||||||||||||||||||||||||||||||||||||||||||||||||||||||||||||
| Adjusted Stockholders’ Equity | ||||||||||||||||||||||||||||||||||||||||||||||||||||||||||||||||||||||||||||||||
| Adjusted stockholders’ equity is stockholders’ equity, excluding AOCI, preferred stock, MRB-related impacts, GLB and GDB hedged instruments gains (losses) and the difference between | ||||||||||||||||||||||||||||||||||||||||||||||||||||||||||||||||||||||||||||||||
| amounts recognized in net income (loss) on reinsurance-related embedded derivatives and the underlying asset portfolios (“reinsurance-related embedded derivatives and portfolio gains (losses)”). | ||||||||||||||||||||||||||||||||||||||||||||||||||||||||||||||||||||||||||||||||
| Management believes this metric is useful to investors because it eliminates the effect of market movements that are unpredictable and can fluctuate significantly from period to period, primarily related to | ||||||||||||||||||||||||||||||||||||||||||||||||||||||||||||||||||||||||||||||||
| changes in equity markets and interest rates. Stockholders’ equity is the most directly comparable GAAP measure. | ||||||||||||||||||||||||||||||||||||||||||||||||||||||||||||||||||||||||||||||||
| Book Value per Share, Excluding AOCI | ||||||||||||||||||||||||||||||||||||||||||||||||||||||||||||||||||||||||||||||||
| Book value per share, excluding AOCI, is calculated by dividing stockholders’ equity, excluding AOCI and preferred stock, by common shares outstanding. We provide book value per share, excluding AOCI, to | ||||||||||||||||||||||||||||||||||||||||||||||||||||||||||||||||||||||||||||||||
| enable investors to analyze the amount of our net worth that is attributable primarily to our business operations. Management believes book value per share, excluding AOCI, is useful to investors because it | ||||||||||||||||||||||||||||||||||||||||||||||||||||||||||||||||||||||||||||||||
| eliminates the effect of items that are unpredictable and can fluctuate significantly from period to period, primarily based on changes in interest rates. Book value per share is the most directly comparable GAAP | ||||||||||||||||||||||||||||||||||||||||||||||||||||||||||||||||||||||||||||||||
| measure. | ||||||||||||||||||||||||||||||||||||||||||||||||||||||||||||||||||||||||||||||||
| Adjusted Book Value per Share | ||||||||||||||||||||||||||||||||||||||||||||||||||||||||||||||||||||||||||||||||
| Adjusted book value per share is calculated by dividing adjusted stockholders’ equity by common shares outstanding. We provide adjusted book value per share to enable investors to analyze the amount | ||||||||||||||||||||||||||||||||||||||||||||||||||||||||||||||||||||||||||||||||
| of our net worth that is attributable primarily to our business operations. Management believes adjusted book value per share is useful to investors because it eliminates the effect of items that are unpredictable | ||||||||||||||||||||||||||||||||||||||||||||||||||||||||||||||||||||||||||||||||
| and can fluctuate significantly from period to period, primarily based on changes in equity markets and interest rates. Book value per share is the most directly comparable GAAP measure. | ||||||||||||||||||||||||||||||||||||||||||||||||||||||||||||||||||||||||||||||||
| Adjusted Income (Loss) From Operations Available to Common Stockholders, Excluding AOCI and Preferred Stock ROE | ||||||||||||||||||||||||||||||||||||||||||||||||||||||||||||||||||||||||||||||||
| Adjusted income (loss) from operations available to common stockholders, excluding AOCI and preferred stock ROE is calculated by dividing annualized adjusted income (loss) from operations available | ||||||||||||||||||||||||||||||||||||||||||||||||||||||||||||||||||||||||||||||||
| to common stockholders by average stockholders’ equity, excluding AOCI and preferred stock. Management believes this metric is useful to investors because it eliminates the effect of market movements | ||||||||||||||||||||||||||||||||||||||||||||||||||||||||||||||||||||||||||||||||
| on ROE that are unpredictable and can fluctuate significantly from period to period, primarily related to changes in interest rates. Net income (loss) ROE is the most directly comparable GAAP measure. | ||||||||||||||||||||||||||||||||||||||||||||||||||||||||||||||||||||||||||||||||
| Adjusted Income (Loss) From Operations ROE | ||||||||||||||||||||||||||||||||||||||||||||||||||||||||||||||||||||||||||||||||
| Adjusted income (loss) from operations ROE is calculated by dividing annualized adjusted income (loss) from operations available to common stockholders by adjusted average stockholders’ equity. | ||||||||||||||||||||||||||||||||||||||||||||||||||||||||||||||||||||||||||||||||
| Management believes this metric is useful to investors because it eliminates the effect of market movements on ROE that are unpredictable and can fluctuate significantly from period to period, primarily | ||||||||||||||||||||||||||||||||||||||||||||||||||||||||||||||||||||||||||||||||
| related to changes in equity markets and interest rates. Net income (loss) ROE is the most directly comparable GAAP measure. | ||||||||||||||||||||||||||||||||||||||||||||||||||||||||||||||||||||||||||||||||
| Management believes that the non-GAAP measures discussed above allow for a better understanding of the underlying trends in our current business as the excluded items are unpredictable and not necessarily | ||||||||||||||||||||||||||||||||||||||||||||||||||||||||||||||||||||||||||||||||
| indicative of current operating fundamentals or future performance of the business. | ||||||||||||||||||||||||||||||||||||||||||||||||||||||||||||||||||||||||||||||||
| Computations | ||||||||||||||||||||||||||||||||||||||||||||||||||||||||||||||||||||||||||||||||
| • The quarterly financial information for the current year may not sum to the corresponding year-to-date amount as both are rounded to millions. | ||||||||||||||||||||||||||||||||||||||||||||||||||||||||||||||||||||||||||||||||
| • The financial ratios reported herein are calculated using whole dollars instead of dollars rounded to millions. | ||||||||||||||||||||||||||||||||||||||||||||||||||||||||||||||||||||||||||||||||
| • We exclude deferred units of LNC stock that are antidilutive from our diluted earnings per share calculation. In addition, for any period where a net loss or adjusted loss from operations is experienced, shares | ||||||||||||||||||||||||||||||||||||||||||||||||||||||||||||||||||||||||||||||||
| used in the diluted EPS calculation represent basic shares, as the use of diluted shares would result in a lower loss per share. | ||||||||||||||||||||||||||||||||||||||||||||||||||||||||||||||||||||||||||||||||
| • Pre-tax net margin is calculated by dividing adjusted income (loss) from operations before taxes by net revenue, which is defined as total adjusted operating revenues less interest credited. | ||||||||||||||||||||||||||||||||||||||||||||||||||||||||||||||||||||||||||||||||
Page 1b
| Lincoln Financial Group | ||||||||||||||||||||||||||||||||||||||||||||||||||||||||||||||||||||||||||||||||
| Notes | ||||||||||||||||||||||||||||||||||||||||||||||||||||||||||||||||||||||||||||||||
| Definitions | ||||||||||||||||||||||||||||||||||||||||||||||||||||||||||||||||||||||||||||||||
| Holding company available liquidity consists of cash and invested cash, excluding cash held as collateral, and certain short-term investments that can be readily converted into cash, net of commercial paper | ||||||||||||||||||||||||||||||||||||||||||||||||||||||||||||||||||||||||||||||||
| outstanding. | ||||||||||||||||||||||||||||||||||||||||||||||||||||||||||||||||||||||||||||||||
| Return on equity (“ROE”) measures how efficiently we generate profits from the resources provided by our net assets. See adjusted income (loss) from operations ROE and adjusted income (loss) from | ||||||||||||||||||||||||||||||||||||||||||||||||||||||||||||||||||||||||||||||||
| operations available to common stockholders, excluding AOCI and preferred stock ROE metrics on page 1b for further information on how these metrics are calculated. Management evaluates consolidated | ||||||||||||||||||||||||||||||||||||||||||||||||||||||||||||||||||||||||||||||||
| ROE by both including and excluding the effect of average goodwill. | ||||||||||||||||||||||||||||||||||||||||||||||||||||||||||||||||||||||||||||||||
| Leverage ratio is a measure that we use to monitor the level of our debt relative to our total capitalization. Debt used in this metric reflects total debt and preferred stock adjusted for certain items. | ||||||||||||||||||||||||||||||||||||||||||||||||||||||||||||||||||||||||||||||||
| Total capitalization reflects debt used in the numerator of this ratio and stockholders' equity adjusted for certain items. | ||||||||||||||||||||||||||||||||||||||||||||||||||||||||||||||||||||||||||||||||
| Indexed variable annuities are referred to as registered index-linked annuities (“RILA”). | ||||||||||||||||||||||||||||||||||||||||||||||||||||||||||||||||||||||||||||||||
| Sales as reported consist of the following: | ||||||||||||||||||||||||||||||||||||||||||||||||||||||||||||||||||||||||||||||||
| • Annuities and Retirement Plan Services – deposits from new and existing customers; | ||||||||||||||||||||||||||||||||||||||||||||||||||||||||||||||||||||||||||||||||
| • Universal life insurance (“UL”), IUL, VUL – first-year commissionable premiums plus 5% of excess premiums received; | ||||||||||||||||||||||||||||||||||||||||||||||||||||||||||||||||||||||||||||||||
• MoneyGuard® linked-benefit products – MoneyGuard® (UL), 15% of total expected premium deposits, and MoneyGuard Market AdvantageSM (VUL), 150% of commissionable premiums; | ||||||||||||||||||||||||||||||||||||||||||||||||||||||||||||||||||||||||||||||||
| • Executive Benefits – insurance and corporate-owned UL and VUL, first-year commissionable premiums plus 5% of excess premium received, and single premium bank-owned UL and VUL, 15% of | ||||||||||||||||||||||||||||||||||||||||||||||||||||||||||||||||||||||||||||||||
| single premium deposits; | ||||||||||||||||||||||||||||||||||||||||||||||||||||||||||||||||||||||||||||||||
| • Term – 100% of annualized first-year premiums; and | ||||||||||||||||||||||||||||||||||||||||||||||||||||||||||||||||||||||||||||||||
| • Group Protection – annualized first-year premiums from new policies. | ||||||||||||||||||||||||||||||||||||||||||||||||||||||||||||||||||||||||||||||||
| Statistical Supplement is Dated | ||||||||||||||||||||||||||||||||||||||||||||||||||||||||||||||||||||||||||||||||
| This document is dated May 2, 2024, and has not been updated since that date. Lincoln Financial Group does not intend to update this document. | ||||||||||||||||||||||||||||||||||||||||||||||||||||||||||||||||||||||||||||||||
Page 1c
| Lincoln Financial Group | ||||||||||||||||||||||||||||||||||||||||||||||||||||||||||||||||||||||||||||||||
| Credit Ratings | ||||||||||||||||||||||||||||||||||||||||||||||||||||||||||||||||||||||||||||||||
| Ratings as of May 2, 2024 | ||||||||||||||||||||||||||||||||||||||||||||||||||||||||||||||||||||||||||||||||
| Standard | ||||||||||||||||||||||||||||||||||||||||||||||||||||||||||||||||||||||||||||||||
| AM Best | Fitch | Moody's | & Poor's | |||||||||||||||||||||||||||||||||||||||||||||||||||||||||||||||||||||||||||||
| Senior Debt Ratings | bbb+ | BBB+ | Baa2 | BBB+ | ||||||||||||||||||||||||||||||||||||||||||||||||||||||||||||||||||||||||||||
| Financial Strength Ratings | ||||||||||||||||||||||||||||||||||||||||||||||||||||||||||||||||||||||||||||||||
| The Lincoln National Life Insurance Company | A | A+ | A2 | A+ | ||||||||||||||||||||||||||||||||||||||||||||||||||||||||||||||||||||||||||||
| First Penn-Pacific Life Insurance Company | A | A+ | A2 | A- | ||||||||||||||||||||||||||||||||||||||||||||||||||||||||||||||||||||||||||||
| Lincoln Life & Annuity Company of New York | A | A+ | A2 | A+ | ||||||||||||||||||||||||||||||||||||||||||||||||||||||||||||||||||||||||||||
| Investor Inquiries May Be Directed To: | ||||||||||||||||||||||||||||||||||||||||||||||||||||||||||||||||||||||||||||||||
| Tina Madon, Senior Vice President, Investor Relations | ||||||||||||||||||||||||||||||||||||||||||||||||||||||||||||||||||||||||||||||||
| Email: [email protected] | ||||||||||||||||||||||||||||||||||||||||||||||||||||||||||||||||||||||||||||||||
| Phone: 800-237-2920 | ||||||||||||||||||||||||||||||||||||||||||||||||||||||||||||||||||||||||||||||||
Page 2

| Lincoln Financial Group | ||||||||||||||||||||||||||||||||||||||||||||||||||||||||
| Consolidated Statements of Income (Loss) | ||||||||||||||||||||||||||||||||||||||||||||||||||||||||
| Unaudited (millions of dollars, except per share data) | ||||||||||||||||||||||||||||||||||||||||||||||||||||||||
| For the Three Months Ended | ||||||||||||||||||||||||||||||||||||||||||||||||||||||||
| 3/31/23 | 6/30/23 | 9/30/23 | 12/31/23 | 3/31/24 | Change | |||||||||||||||||||||||||||||||||||||||||||||||||||
| Revenues | ||||||||||||||||||||||||||||||||||||||||||||||||||||||||
| Insurance premiums | $ | 1,579 | $ | 1,612 | $ | 1,566 | $ | (1,086) | $ | 1,601 | 1.4 | % | ||||||||||||||||||||||||||||||||||||||||||||
| Fee income | 1,379 | 1,365 | 1,363 | 1,361 | 1,324 | -4.0 | % | |||||||||||||||||||||||||||||||||||||||||||||||||
| Net investment income | 1,466 | 1,508 | 1,494 | 1,411 | 1,346 | -8.2 | % | |||||||||||||||||||||||||||||||||||||||||||||||||
| Realized gain (loss) | (828) | (1,784) | (453) | (1,245) | (434) | 47.6 | % | |||||||||||||||||||||||||||||||||||||||||||||||||
| Amortization of deferred gain (loss) on business | ||||||||||||||||||||||||||||||||||||||||||||||||||||||||
| sold through reinsurance | 9 | 9 | 15 | 4 | (12) | NM | ||||||||||||||||||||||||||||||||||||||||||||||||||
| Other revenues | 209 | 219 | 218 | 255 | 291 | 39.2 | % | |||||||||||||||||||||||||||||||||||||||||||||||||
| Total revenues | 3,814 | 2,929 | 4,203 | 700 | 4,116 | 7.9 | % | |||||||||||||||||||||||||||||||||||||||||||||||||
| Expenses | ||||||||||||||||||||||||||||||||||||||||||||||||||||||||
| Benefits | 2,291 | 2,192 | 2,152 | (497) | 2,003 | -12.6 | % | |||||||||||||||||||||||||||||||||||||||||||||||||
| Interest credited | 785 | 808 | 831 | 824 | 822 | 4.7 | % | |||||||||||||||||||||||||||||||||||||||||||||||||
| Market risk benefit (gain) loss | 619 | (2,023) | (1,428) | 568 | (1,907) | NM | ||||||||||||||||||||||||||||||||||||||||||||||||||
| Policyholder liability remeasurement (gain) loss | (118) | (110) | 159 | (84) | (12) | 89.8 | % | |||||||||||||||||||||||||||||||||||||||||||||||||
| Commissions and other expenses | 1,324 | 1,376 | 1,371 | 1,421 | 1,601 | 20.9 | % | |||||||||||||||||||||||||||||||||||||||||||||||||
| Interest and debt expense | 83 | 84 | 84 | 81 | 81 | -2.4 | % | |||||||||||||||||||||||||||||||||||||||||||||||||
| Total expenses | 4,984 | 2,327 | 3,169 | 2,313 | 2,588 | -48.1 | % | |||||||||||||||||||||||||||||||||||||||||||||||||
| Income (loss) before taxes | (1,170) | 602 | 1,034 | (1,613) | 1,528 | 230.6 | % | |||||||||||||||||||||||||||||||||||||||||||||||||
| Federal income tax expense (benefit) | (289) | 91 | 181 | (378) | 306 | 205.9 | % | |||||||||||||||||||||||||||||||||||||||||||||||||
| Net income (loss) | (881) | 511 | 853 | (1,235) | 1,222 | 238.7 | % | |||||||||||||||||||||||||||||||||||||||||||||||||
| Preferred stock dividends declared | (25) | (11) | (34) | (11) | (34) | -36.0 | % | |||||||||||||||||||||||||||||||||||||||||||||||||
| Adjustment for deferred units of LNC stock | ||||||||||||||||||||||||||||||||||||||||||||||||||||||||
| in our deferred compensation plans | (3) | 2 | — | — | 3 | 200.0 | % | |||||||||||||||||||||||||||||||||||||||||||||||||
| Net income (loss) available to common | ||||||||||||||||||||||||||||||||||||||||||||||||||||||||
| stockholders – diluted | $ | (909) | $ | 502 | $ | 819 | $ | (1,246) | $ | 1,191 | 231.0 | % | ||||||||||||||||||||||||||||||||||||||||||||
| Earnings (Loss) Per Common Share – Diluted | ||||||||||||||||||||||||||||||||||||||||||||||||||||||||
| Net income (loss) | $ | (5.37) | $ | 2.94 | $ | 4.79 | $ | (7.35) | $ | 6.93 | 229.1 | % | ||||||||||||||||||||||||||||||||||||||||||||
Page 3
| Lincoln Financial Group | ||||||||||||||||||||||||||||||||||||||||||||||||||||||||
| Consolidated Balance Sheets | ||||||||||||||||||||||||||||||||||||||||||||||||||||||||
| Unaudited (millions of dollars) | ||||||||||||||||||||||||||||||||||||||||||||||||||||||||
| As of | ||||||||||||||||||||||||||||||||||||||||||||||||||||||||
| 3/31/23 | 6/30/23 | 9/30/23 | 12/31/23 | 3/31/24 | Change | |||||||||||||||||||||||||||||||||||||||||||||||||||
| ASSETS | ||||||||||||||||||||||||||||||||||||||||||||||||||||||||
| Investments: | ||||||||||||||||||||||||||||||||||||||||||||||||||||||||
| Fixed maturity available-for-sale (“AFS”) securities, net of allowance for | ||||||||||||||||||||||||||||||||||||||||||||||||||||||||
| credit losses: | ||||||||||||||||||||||||||||||||||||||||||||||||||||||||
| Corporate bonds | $ | 80,448 | $ | 79,307 | $ | 76,001 | $ | 69,657 | $ | 68,533 | -14.8% | |||||||||||||||||||||||||||||||||||||||||||||
| U.S. government bonds | 383 | 371 | 373 | 393 | 391 | 2.1% | ||||||||||||||||||||||||||||||||||||||||||||||||||
| State and municipal bonds | 5,257 | 5,074 | 4,770 | 2,790 | 2,743 | -47.8% | ||||||||||||||||||||||||||||||||||||||||||||||||||
| Foreign government bonds | 309 | 281 | 273 | 283 | 263 | -14.9% | ||||||||||||||||||||||||||||||||||||||||||||||||||
| Residential mortgage-backed securities | 2,050 | 2,015 | 1,928 | 1,773 | 1,760 | -14.1% | ||||||||||||||||||||||||||||||||||||||||||||||||||
| Commercial mortgage-backed securities | 1,671 | 1,684 | 1,701 | 1,424 | 1,484 | -11.2% | ||||||||||||||||||||||||||||||||||||||||||||||||||
| Asset-backed securities | 11,458 | 11,793 | 12,393 | 12,171 | 12,349 | 7.8% | ||||||||||||||||||||||||||||||||||||||||||||||||||
| Hybrid and redeemable preferred securities | 360 | 365 | 365 | 247 | 241 | -33.1% | ||||||||||||||||||||||||||||||||||||||||||||||||||
| Total fixed maturity AFS securities, net of allowance for credit losses | 101,936 | 100,890 | 97,804 | 88,738 | 87,764 | -13.9% | ||||||||||||||||||||||||||||||||||||||||||||||||||
| Trading securities | 3,266 | 2,943 | 2,788 | 2,359 | 2,227 | -31.8% | ||||||||||||||||||||||||||||||||||||||||||||||||||
| Equity securities | 414 | 403 | 383 | 306 | 319 | -22.9% | ||||||||||||||||||||||||||||||||||||||||||||||||||
| Mortgage loans on real estate, net of allowance for credit losses | 18,327 | 18,460 | 18,751 | 18,963 | 19,266 | 5.1% | ||||||||||||||||||||||||||||||||||||||||||||||||||
| Policy loans | 2,383 | 2,423 | 2,428 | 2,476 | 2,476 | 3.9% | ||||||||||||||||||||||||||||||||||||||||||||||||||
| Derivative investments | 4,005 | 5,155 | 5,790 | 6,474 | 8,394 | 109.6% | ||||||||||||||||||||||||||||||||||||||||||||||||||
| Other investments | 3,892 | 4,195 | 4,551 | 5,015 | 5,256 | 35.0% | ||||||||||||||||||||||||||||||||||||||||||||||||||
| Total investments | 134,223 | 134,469 | 132,495 | 124,331 | 125,702 | -6.3% | ||||||||||||||||||||||||||||||||||||||||||||||||||
| Cash and invested cash | 3,766 | 3,768 | 2,529 | 3,365 | 4,122 | 9.5% | ||||||||||||||||||||||||||||||||||||||||||||||||||
| Deferred acquisition costs, value of business acquired and deferred sales inducements | 12,277 | 12,316 | 12,341 | 12,397 | 12,405 | 1.0% | ||||||||||||||||||||||||||||||||||||||||||||||||||
| Reinsurance recoverables, net of allowance for credit losses | 19,827 | 19,571 | 18,924 | 29,843 | 29,461 | 48.6% | ||||||||||||||||||||||||||||||||||||||||||||||||||
| Deposit assets, net of allowance for credit losses | 12,249 | 12,308 | 12,494 | 28,789 | 28,904 | 136.0% | ||||||||||||||||||||||||||||||||||||||||||||||||||
| Market risk benefit assets | 3,445 | 3,906 | 4,108 | 3,894 | 4,878 | 41.6% | ||||||||||||||||||||||||||||||||||||||||||||||||||
| Accrued investment income | 1,277 | 1,277 | 1,372 | 1,082 | 1,127 | -11.7% | ||||||||||||||||||||||||||||||||||||||||||||||||||
| Goodwill | 1,144 | 1,144 | 1,144 | 1,144 | 1,144 | 0.0% | ||||||||||||||||||||||||||||||||||||||||||||||||||
| Other assets | 6,682 | 6,798 | 7,351 | 9,311 | 9,413 | 40.9% | ||||||||||||||||||||||||||||||||||||||||||||||||||
| Separate account assets | 148,421 | 153,246 | 145,810 | 158,257 | 166,225 | 12.0% | ||||||||||||||||||||||||||||||||||||||||||||||||||
| Total assets | $ | 343,311 | $ | 348,803 | $ | 338,568 | $ | 372,413 | $ | 383,381 | 11.7% | |||||||||||||||||||||||||||||||||||||||||||||
Page 4a
| Lincoln Financial Group | ||||||||||||||||||||||||||||||||||||||||||||||||||||||||
| Consolidated Balance Sheets | ||||||||||||||||||||||||||||||||||||||||||||||||||||||||
| Unaudited (millions of dollars) | ||||||||||||||||||||||||||||||||||||||||||||||||||||||||
| As of | ||||||||||||||||||||||||||||||||||||||||||||||||||||||||
| 3/31/23 | 6/30/23 | 9/30/23 | 12/31/23 | 3/31/24 | Change | |||||||||||||||||||||||||||||||||||||||||||||||||||
| LIABILITIES AND STOCKHOLDERS’ EQUITY | ||||||||||||||||||||||||||||||||||||||||||||||||||||||||
| Liabilities | ||||||||||||||||||||||||||||||||||||||||||||||||||||||||
| Policyholder account balances | $ | 116,167 | $ | 117,598 | $ | 117,210 | $ | 120,737 | $ | 122,300 | 5.3 | % | ||||||||||||||||||||||||||||||||||||||||||||
| Future contract benefits | 39,757 | 39,711 | 39,362 | 39,864 | 38,848 | -2.3 | % | |||||||||||||||||||||||||||||||||||||||||||||||||
| Funds withheld reinsurance liabilities | 5,517 | 5,244 | 5,006 | 17,641 | 17,486 | 216.9 | % | |||||||||||||||||||||||||||||||||||||||||||||||||
| Market risk benefit liabilities | 1,976 | 1,548 | 1,385 | 1,716 | 1,266 | -35.9 | % | |||||||||||||||||||||||||||||||||||||||||||||||||
| Deferred front-end loads | 5,291 | 5,494 | 5,695 | 5,901 | 6,099 | 15.3 | % | |||||||||||||||||||||||||||||||||||||||||||||||||
| Payables for collateral on investments | 6,803 | 7,062 | 8,046 | 8,105 | 10,117 | 48.7 | % | |||||||||||||||||||||||||||||||||||||||||||||||||
| Short-term debt | 500 | 500 | — | 250 | 503 | 0.6 | % | |||||||||||||||||||||||||||||||||||||||||||||||||
| Long-term debt by rating agency leverage definitions: | ||||||||||||||||||||||||||||||||||||||||||||||||||||||||
Operating (see note (2) on page 6 for details) | 867 | 867 | 867 | 867 | 867 | 0.0% | ||||||||||||||||||||||||||||||||||||||||||||||||||
| Financial | 5,107 | 5,087 | 5,038 | 4,832 | 4,859 | -4.9 | % | |||||||||||||||||||||||||||||||||||||||||||||||||
| Other liabilities | 6,173 | 6,627 | 6,950 | 7,350 | 7,265 | 17.7 | % | |||||||||||||||||||||||||||||||||||||||||||||||||
| Separate account liabilities | 148,421 | 153,246 | 145,810 | 158,257 | 166,225 | 12.0 | % | |||||||||||||||||||||||||||||||||||||||||||||||||
| Total liabilities | 336,579 | 342,984 | 335,369 | 365,520 | 375,835 | 11.7 | % | |||||||||||||||||||||||||||||||||||||||||||||||||
| Stockholders’ Equity | ||||||||||||||||||||||||||||||||||||||||||||||||||||||||
| Preferred stock | 986 | 986 | 986 | 986 | 986 | 0.0% | ||||||||||||||||||||||||||||||||||||||||||||||||||
| Common stock | 4,560 | 4,575 | 4,591 | 4,605 | 4,624 | 1.4 | % | |||||||||||||||||||||||||||||||||||||||||||||||||
| Retained earnings | 4,940 | 5,362 | 6,102 | 4,778 | 5,887 | 19.2 | % | |||||||||||||||||||||||||||||||||||||||||||||||||
| Accumulated other comprehensive income (loss): | ||||||||||||||||||||||||||||||||||||||||||||||||||||||||
| Unrealized investment gain (loss) | (6,754) | (7,267) | (10,163) | (4,813) | (4,940) | 26.9 | % | |||||||||||||||||||||||||||||||||||||||||||||||||
| Market risk benefit non-performance risk gain (loss) | 2,766 | 1,842 | 998 | 1,070 | 606 | -78.1 | % | |||||||||||||||||||||||||||||||||||||||||||||||||
| Policyholder liability discount rate remeasurement gain (loss) | 545 | 657 | 1,021 | 587 | 703 | 29.0 | % | |||||||||||||||||||||||||||||||||||||||||||||||||
| Foreign currency translation adjustment | (31) | (26) | (32) | (26) | (27) | 12.9 | % | |||||||||||||||||||||||||||||||||||||||||||||||||
| Funded status of employee benefit plans | (280) | (310) | (304) | (294) | (293) | -4.6 | % | |||||||||||||||||||||||||||||||||||||||||||||||||
| Total accumulated other comprehensive income (loss) | (3,754) | (5,104) | (8,480) | (3,476) | (3,951) | -5.2 | % | |||||||||||||||||||||||||||||||||||||||||||||||||
| Total stockholders’ equity | 6,732 | 5,819 | 3,199 | 6,893 | 7,546 | 12.1 | % | |||||||||||||||||||||||||||||||||||||||||||||||||
| Total liabilities and stockholders’ equity | $ | 343,311 | $ | 348,803 | $ | 338,568 | $ | 372,413 | $ | 383,381 | 11.7 | % | ||||||||||||||||||||||||||||||||||||||||||||
Page 4b
| Lincoln Financial Group | |||||||||||||||||||||||||||||||||||||||||||||||||||||||||||
| Earnings, Shares and Return on Equity | |||||||||||||||||||||||||||||||||||||||||||||||||||||||||||
| Unaudited (millions of dollars, except per share data) | |||||||||||||||||||||||||||||||||||||||||||||||||||||||||||
| As of or For the Three Months Ended | |||||||||||||||||||||||||||||||||||||||||||||||||||||||||||
| 3/31/23 | 6/30/23 | 9/30/23 | 12/31/23 | 3/31/24 | Change | ||||||||||||||||||||||||||||||||||||||||||||||||||||||
| Income (Loss) | |||||||||||||||||||||||||||||||||||||||||||||||||||||||||||
| Net income (loss) | $ | (881) | $ | 511 | $ | 853 | $ | (1,235) | $ | 1,222 | 238.7 | % | |||||||||||||||||||||||||||||||||||||||||||||||
| Pre-tax adjusted income (loss) from operations | 310 | 403 | 47 | 276 | 115 | -62.9 | % | ||||||||||||||||||||||||||||||||||||||||||||||||||||
After-tax adjusted income (loss) from operations (1) | 288 | 354 | 73 | 258 | 105 | -63.5 | % | ||||||||||||||||||||||||||||||||||||||||||||||||||||
| Adjusted operating tax rate | 7.2 | % | 12.2 | % | -56.2 | % | 6.7 | % | 8.7 | % | |||||||||||||||||||||||||||||||||||||||||||||||||
| Adjusted income (loss) from operations available to | |||||||||||||||||||||||||||||||||||||||||||||||||||||||||||
| common stockholders | 260 | 343 | 39 | 246 | 71 | -72.7 | % | ||||||||||||||||||||||||||||||||||||||||||||||||||||
| ROE | |||||||||||||||||||||||||||||||||||||||||||||||||||||||||||
| Net income (loss) ROE | -59.6 | % | 32.6 | % | 75.7 | % | -97.9 | % | 67.7 | % | |||||||||||||||||||||||||||||||||||||||||||||||||
| Adjusted income (loss) from operations available to | |||||||||||||||||||||||||||||||||||||||||||||||||||||||||||
| common stockholders, excluding AOCI and preferred | |||||||||||||||||||||||||||||||||||||||||||||||||||||||||||
| stock ROE | 10.4 | % | 14.1 | % | 1.5 | % | 9.8 | % | 2.9 | % | |||||||||||||||||||||||||||||||||||||||||||||||||
Adjusted income (loss) from operations ROE (4) | 9.3 | % | 12.4 | % | 1.4 | % | 9.0 | % | 2.6 | % | |||||||||||||||||||||||||||||||||||||||||||||||||
| Per Common Share | |||||||||||||||||||||||||||||||||||||||||||||||||||||||||||
| Net income (loss) (diluted) | $ | (5.37) | $ | 2.94 | $ | 4.79 | $ | (7.35) | $ | 6.93 | 229.1 | % | |||||||||||||||||||||||||||||||||||||||||||||||
Adjusted income (loss) from operations (diluted) (2) | 1.52 | 2.02 | 0.23 | 1.45 | 0.41 | -73.0 | % | ||||||||||||||||||||||||||||||||||||||||||||||||||||
| Dividends declared during the period | 0.45 | 0.45 | 0.45 | 0.45 | 0.45 | 0.0% | |||||||||||||||||||||||||||||||||||||||||||||||||||||
| Book Value Per Common Share | |||||||||||||||||||||||||||||||||||||||||||||||||||||||||||
| Book value per share | $ | 33.89 | $ | 28.49 | $ | 13.04 | $ | 34.81 | $ | 38.46 | 13.5 | % | |||||||||||||||||||||||||||||||||||||||||||||||
Book value per share, excluding AOCI (3) | 56.04 | 58.58 | 63.03 | 55.30 | 61.63 | 10.0 | % | ||||||||||||||||||||||||||||||||||||||||||||||||||||
Adjusted book value per share (3)(4) | 66.05 | 64.37 | 63.53 | 64.97 | 65.01 | -1.6 | % | ||||||||||||||||||||||||||||||||||||||||||||||||||||
| Common Shares | |||||||||||||||||||||||||||||||||||||||||||||||||||||||||||
| End-of-period – basic | 169.5 | 169.6 | 169.7 | 169.7 | 170.5 | 0.6 | % | ||||||||||||||||||||||||||||||||||||||||||||||||||||
| Average for the period – basic | 169.4 | 169.6 | 169.6 | 169.7 | 170.0 | 0.4 | % | ||||||||||||||||||||||||||||||||||||||||||||||||||||
| End-of-period – diluted | 170.5 | 170.0 | 171.0 | 170.6 | 171.7 | 0.7 | % | ||||||||||||||||||||||||||||||||||||||||||||||||||||
| Average for the period – diluted | 170.5 | 169.9 | 170.9 | 170.4 | 171.1 | 0.4 | % | ||||||||||||||||||||||||||||||||||||||||||||||||||||
(1) See reconciliation to net income (loss) on page 22. | |||||||||||||||||||||||||||||||||||||||||||||||||||||||||||
(2) See reconciliation to earnings (loss) per common share - diluted on page 23. | |||||||||||||||||||||||||||||||||||||||||||||||||||||||||||
(3) See reconciliation to stockholders’ equity and book value per common share on page 24. | |||||||||||||||||||||||||||||||||||||||||||||||||||||||||||
(4) This measure has been updated, effective beginning with the fourth quarter of 2023, to exclude reinsurance-related embedded derivatives and the underlying portfolio gains (losses), given | |||||||||||||||||||||||||||||||||||||||||||||||||||||||||||
| the size of the impact of the fourth quarter 2023 reinsurance transaction. Such amounts in the prior periods presented, and the impact of this change to such prior periods, | |||||||||||||||||||||||||||||||||||||||||||||||||||||||||||
| were not meaningful. | |||||||||||||||||||||||||||||||||||||||||||||||||||||||||||
Page 5
| Lincoln Financial Group | |||||||||||||||||||||||||||||||||||||||||||||||||||||||||||
| Key Stakeholder Metrics | |||||||||||||||||||||||||||||||||||||||||||||||||||||||||||
| Unaudited (millions of dollars, except per share data) | |||||||||||||||||||||||||||||||||||||||||||||||||||||||||||
| As of or For the Three Months Ended | |||||||||||||||||||||||||||||||||||||||||||||||||||||||||||
| 3/31/23 | 6/30/23 | 9/30/23 | 12/31/23 | 3/31/24 | Change | ||||||||||||||||||||||||||||||||||||||||||||||||||||||
| Cash Returned to Common Stockholders – Common Dividends | $ | 76 | $ | 76 | $ | 76 | $ | 76 | $ | 76 | 0.0% | ||||||||||||||||||||||||||||||||||||||||||||||||
| Cash Returned to Preferred Stockholders – Preferred Dividends | $ | 25 | $ | 11 | $ | 34 | $ | 11 | $ | 34 | 36.0 | % | |||||||||||||||||||||||||||||||||||||||||||||||
| Leverage Ratio | |||||||||||||||||||||||||||||||||||||||||||||||||||||||||||
| Short-term debt | $ | 500 | $ | 500 | $ | — | $ | 250 | $ | 503 | 0.6 | % | |||||||||||||||||||||||||||||||||||||||||||||||
| Long-term debt | 5,974 | 5,954 | 5,905 | 5,699 | 5,726 | -4.2 | % | ||||||||||||||||||||||||||||||||||||||||||||||||||||
Total debt (1) | 6,474 | 6,454 | 5,905 | 5,949 | 6,229 | -3.8 | % | ||||||||||||||||||||||||||||||||||||||||||||||||||||
| Preferred stock | 986 | 986 | 986 | 986 | 986 | 0.0% | |||||||||||||||||||||||||||||||||||||||||||||||||||||
| Total debt and preferred stock | 7,460 | 7,440 | 6,891 | 6,935 | 7,215 | -3.3 | % | ||||||||||||||||||||||||||||||||||||||||||||||||||||
| Less: | |||||||||||||||||||||||||||||||||||||||||||||||||||||||||||
Operating debt (2) | 867 | 867 | 867 | 867 | 867 | 0.0% | |||||||||||||||||||||||||||||||||||||||||||||||||||||
| Pre-funding of upcoming debt maturities | 500 | 500 | — | — | 300 | -40.0 | % | ||||||||||||||||||||||||||||||||||||||||||||||||||||
| 25% of capital securities and subordinated notes | 302 | 302 | 302 | 302 | 302 | 0.0% | |||||||||||||||||||||||||||||||||||||||||||||||||||||
| 50% of preferred stock | 493 | 493 | 493 | 493 | 493 | 0.0% | |||||||||||||||||||||||||||||||||||||||||||||||||||||
| Carrying value of fair value hedges and other items | 182 | 161 | 111 | 154 | 133 | -26.9 | % | ||||||||||||||||||||||||||||||||||||||||||||||||||||
| Total numerator | $ | 5,116 | $ | 5,117 | $ | 5,118 | $ | 5,119 | $ | 5,120 | 0.1 | % | |||||||||||||||||||||||||||||||||||||||||||||||
Adjusted stockholders’ equity (3) | $ | 11,197 | $ | 10,918 | $ | 10,778 | $ | 11,023 | $ | 11,087 | -1.0 | % | |||||||||||||||||||||||||||||||||||||||||||||||
| Add: | |||||||||||||||||||||||||||||||||||||||||||||||||||||||||||
| 25% of capital securities and subordinated notes | 302 | 302 | 302 | 302 | 302 | 0.0% | |||||||||||||||||||||||||||||||||||||||||||||||||||||
| 50% of preferred stock | 493 | 493 | 493 | 493 | 493 | 0.0% | |||||||||||||||||||||||||||||||||||||||||||||||||||||
| Total numerator | 5,116 | 5,117 | 5,118 | 5,119 | 5,120 | 0.1 | % | ||||||||||||||||||||||||||||||||||||||||||||||||||||
| Total denominator | $ | 17,108 | $ | 16,830 | $ | 16,691 | $ | 16,937 | $ | 17,002 | -0.6 | % | |||||||||||||||||||||||||||||||||||||||||||||||
| Leverage ratio | 29.9 | % | 30.4 | % | 30.7 | % | 30.2 | % | 30.1 | % | |||||||||||||||||||||||||||||||||||||||||||||||||
Holding Company Available Liquidity (4) | $ | 954 | $ | 957 | $ | 455 | $ | 458 | $ | 766 | -19.7 | % | |||||||||||||||||||||||||||||||||||||||||||||||
(1) Excludes obligations under finance leases and certain financing arrangements of $602 million that are reported in other liabilities on our Consolidated Balance Sheets. | |||||||||||||||||||||||||||||||||||||||||||||||||||||||||||
(2) We have categorized as operating debt the senior notes issued in October 2007 and June 2010 because the proceeds were used as a long-term structured solution to reduce | |||||||||||||||||||||||||||||||||||||||||||||||||||||||||||
| the strain on increasing statutory reserves associated with secondary guarantee UL and term policies. | |||||||||||||||||||||||||||||||||||||||||||||||||||||||||||
(3) See reconciliation to stockholders’ equity on page 24. | |||||||||||||||||||||||||||||||||||||||||||||||||||||||||||
(4) Includes pre-funding of upcoming debt maturities. | |||||||||||||||||||||||||||||||||||||||||||||||||||||||||||
Page 6
| Lincoln Financial Group | |||||||||||||||||||||||||||||||||||||||||||||||||||||||||||
| Select Earnings Drivers By Segment | |||||||||||||||||||||||||||||||||||||||||||||||||||||||||||
| Unaudited (millions of dollars) | |||||||||||||||||||||||||||||||||||||||||||||||||||||||||||
| For the Three Months Ended | |||||||||||||||||||||||||||||||||||||||||||||||||||||||||||
| 3/31/23 | 6/30/23 | 9/30/23 | 12/31/23 | 3/31/24 | Change | ||||||||||||||||||||||||||||||||||||||||||||||||||||||
| Annuities | |||||||||||||||||||||||||||||||||||||||||||||||||||||||||||
| Operating revenues | $ | 1,141 | $ | 1,190 | $ | 1,197 | $ | (525) | $ | 1,269 | 11.2 | % | |||||||||||||||||||||||||||||||||||||||||||||||
| Deposits | 3,164 | 2,560 | 2,737 | 4,359 | 2,849 | -10.0 | % | ||||||||||||||||||||||||||||||||||||||||||||||||||||
| Net flows | (331) | (1,108) | (874) | 285 | (1,993) | NM | |||||||||||||||||||||||||||||||||||||||||||||||||||||
| Average account balances, net of reinsurance | 146,331 | 148,260 | 151,312 | 147,419 | 155,291 | 6.1 | % | ||||||||||||||||||||||||||||||||||||||||||||||||||||
Alternative investment income (1) | 3 | 6 | 4 | 4 | 2 | -33.3 | % | ||||||||||||||||||||||||||||||||||||||||||||||||||||
| Life Insurance | |||||||||||||||||||||||||||||||||||||||||||||||||||||||||||
| Operating revenues | $ | 1,757 | $ | 1,760 | $ | 1,723 | $ | 1,667 | $ | 1,541 | -12.3 | % | |||||||||||||||||||||||||||||||||||||||||||||||
| Deposits | 1,320 | 1,333 | 1,272 | 1,458 | 1,208 | -8.5 | % | ||||||||||||||||||||||||||||||||||||||||||||||||||||
| Net flows | 852 | 932 | 821 | 1,013 | 741 | -13.0 | % | ||||||||||||||||||||||||||||||||||||||||||||||||||||
| Average account balances, net of reinsurance | 49,100 | 50,049 | 50,130 | 45,608 | 42,280 | -13.9 | % | ||||||||||||||||||||||||||||||||||||||||||||||||||||
| Average in-force face amount | 1,075,614 | 1,081,795 | 1,085,253 | 1,087,535 | 1,087,405 | 1.1 | % | ||||||||||||||||||||||||||||||||||||||||||||||||||||
Alternative investment income (1) | 46 | 68 | 44 | 49 | 74 | 60.9 | % | ||||||||||||||||||||||||||||||||||||||||||||||||||||
| Group Protection | |||||||||||||||||||||||||||||||||||||||||||||||||||||||||||
| Operating revenues | $ | 1,388 | $ | 1,400 | $ | 1,388 | $ | 1,387 | $ | 1,425 | 2.7 | % | |||||||||||||||||||||||||||||||||||||||||||||||
| Insurance premiums | 1,251 | 1,263 | 1,251 | 1,250 | 1,285 | 2.7 | % | ||||||||||||||||||||||||||||||||||||||||||||||||||||
Alternative investment income (1) | 2 | 3 | 2 | 2 | 1 | -50.0 | % | ||||||||||||||||||||||||||||||||||||||||||||||||||||
| Retirement Plan Services | |||||||||||||||||||||||||||||||||||||||||||||||||||||||||||
| Operating revenues | $ | 328 | $ | 334 | $ | 327 | $ | 322 | $ | 322 | -1.8 | % | |||||||||||||||||||||||||||||||||||||||||||||||
| Deposits | 3,209 | 2,897 | 2,700 | 2,972 | 3,802 | 18.5 | % | ||||||||||||||||||||||||||||||||||||||||||||||||||||
| Net flows | 535 | 201 | (272) | (332) | 391 | -26.9 | % | ||||||||||||||||||||||||||||||||||||||||||||||||||||
| Average account balances | 91,457 | 94,099 | 96,473 | 96,045 | 103,240 | 12.9 | % | ||||||||||||||||||||||||||||||||||||||||||||||||||||
Alternative investment income (1) | 2 | 3 | 2 | 3 | 1 | -50.0 | % | ||||||||||||||||||||||||||||||||||||||||||||||||||||
| Consolidated | |||||||||||||||||||||||||||||||||||||||||||||||||||||||||||
Adjusted operating revenues (2) | $ | 4,657 | $ | 4,730 | $ | 4,673 | $ | 1,967 | $ | 4,584 | -1.6 | % | |||||||||||||||||||||||||||||||||||||||||||||||
| Deposits | 7,693 | 6,790 | 6,709 | 8,789 | 7,859 | 2.2 | % | ||||||||||||||||||||||||||||||||||||||||||||||||||||
| Net flows | 1,056 | 25 | (325) | 959 | (861) | NM | |||||||||||||||||||||||||||||||||||||||||||||||||||||
| Average account balances, net of reinsurance | 286,888 | 292,408 | 297,915 | 289,072 | 300,811 | 4.9 | % | ||||||||||||||||||||||||||||||||||||||||||||||||||||
Alternative investment income (1) | 53 | 80 | 52 | 58 | 78 | 47.2 | % | ||||||||||||||||||||||||||||||||||||||||||||||||||||
(1) Excludes alternative investment income on investments supporting our modified coinsurance and coinsurance with funds withheld agreements as we have a limited economic interest in | |||||||||||||||||||||||||||||||||||||||||||||||||||||||||||
| the investments. | |||||||||||||||||||||||||||||||||||||||||||||||||||||||||||
(2) See reconciliation to total revenues on page 23. | |||||||||||||||||||||||||||||||||||||||||||||||||||||||||||
Page 7
| Lincoln Financial Group | |||||||||||||||||||||||||||||||||||||||||||||||||||||||||||
| Sales By Segment | |||||||||||||||||||||||||||||||||||||||||||||||||||||||||||
| Unaudited (millions of dollars) | |||||||||||||||||||||||||||||||||||||||||||||||||||||||||||
| For the Three Months Ended | |||||||||||||||||||||||||||||||||||||||||||||||||||||||||||
| 3/31/23 | 6/30/23 | 9/30/23 | 12/31/23 | 3/31/24 | Change | ||||||||||||||||||||||||||||||||||||||||||||||||||||||
| Sales | |||||||||||||||||||||||||||||||||||||||||||||||||||||||||||
| Annuities: | |||||||||||||||||||||||||||||||||||||||||||||||||||||||||||
| RILA | $ | 1,147 | $ | 1,123 | $ | 1,069 | $ | 986 | $ | 942 | -17.9 | % | |||||||||||||||||||||||||||||||||||||||||||||||
| Other variable without GLBs | 255 | 341 | 359 | 362 | 388 | 52.2 | % | ||||||||||||||||||||||||||||||||||||||||||||||||||||
| Other variable with GLBs | 445 | 494 | 530 | 579 | 546 | 22.7 | % | ||||||||||||||||||||||||||||||||||||||||||||||||||||
| Total variable | 1,847 | 1,958 | 1,958 | 1,927 | 1,876 | 1.6 | % | ||||||||||||||||||||||||||||||||||||||||||||||||||||
| Fixed | 1,317 | 624 | 770 | 2,438 | 971 | -26.3 | % | ||||||||||||||||||||||||||||||||||||||||||||||||||||
| Total Annuities | $ | 3,164 | $ | 2,582 | $ | 2,728 | $ | 4,365 | $ | 2,847 | -10.0 | % | |||||||||||||||||||||||||||||||||||||||||||||||
| Life Insurance: | |||||||||||||||||||||||||||||||||||||||||||||||||||||||||||
| IUL/UL | $ | 34 | $ | 28 | $ | 23 | $ | 34 | $ | 18 | -47.1 | % | |||||||||||||||||||||||||||||||||||||||||||||||
MoneyGuard® | 21 | 23 | 27 | 27 | 24 | 14.3 | % | ||||||||||||||||||||||||||||||||||||||||||||||||||||
| VUL | 30 | 34 | 29 | 38 | 23 | -23.3 | % | ||||||||||||||||||||||||||||||||||||||||||||||||||||
| Term | 30 | 26 | 23 | 21 | 19 | -36.7 | % | ||||||||||||||||||||||||||||||||||||||||||||||||||||
| Executive Benefits | 15 | 12 | 42 | 24 | 7 | -53.3 | % | ||||||||||||||||||||||||||||||||||||||||||||||||||||
| Total Life Insurance | $ | 130 | $ | 123 | $ | 144 | $ | 144 | $ | 91 | -30.0 | % | |||||||||||||||||||||||||||||||||||||||||||||||
| Group Protection: | |||||||||||||||||||||||||||||||||||||||||||||||||||||||||||
| Life | $ | 82 | $ | 54 | $ | 30 | $ | 167 | $ | 85 | 3.7 | % | |||||||||||||||||||||||||||||||||||||||||||||||
| Disability | 40 | 36 | 32 | 204 | 51 | 27.5 | % | ||||||||||||||||||||||||||||||||||||||||||||||||||||
| Dental | 6 | 6 | 9 | 27 | 8 | 33.3 | % | ||||||||||||||||||||||||||||||||||||||||||||||||||||
| Total Group Protection | $ | 128 | $ | 96 | $ | 71 | $ | 398 | $ | 144 | 12.5 | % | |||||||||||||||||||||||||||||||||||||||||||||||
| Percent employee-paid | 70.3 | % | 54.8 | % | 48.8 | % | 33.8 | % | 70.4 | % | |||||||||||||||||||||||||||||||||||||||||||||||||
| Retirement Plan Services: | |||||||||||||||||||||||||||||||||||||||||||||||||||||||||||
| First-year sales | $ | 736 | $ | 819 | $ | 464 | $ | 874 | $ | 1,127 | 53.1 | % | |||||||||||||||||||||||||||||||||||||||||||||||
| Recurring deposits | 2,473 | 2,078 | 2,236 | 2,098 | 2,675 | 8.2 | % | ||||||||||||||||||||||||||||||||||||||||||||||||||||
| Total Retirement Plan Services | $ | 3,209 | $ | 2,897 | $ | 2,700 | $ | 2,972 | $ | 3,802 | 18.5 | % | |||||||||||||||||||||||||||||||||||||||||||||||
Page 8
| Lincoln Financial Group | |||||||||||||||||||||||||||||||||||||||||||||||||||||||||||
| Operating Revenues and General and Administrative Expenses By Segment | |||||||||||||||||||||||||||||||||||||||||||||||||||||||||||
| Unaudited (millions of dollars) | |||||||||||||||||||||||||||||||||||||||||||||||||||||||||||
| For the Three Months Ended | |||||||||||||||||||||||||||||||||||||||||||||||||||||||||||
| 3/31/23 | 6/30/23 | 9/30/23 | 12/31/23 | 3/31/24 | Change | ||||||||||||||||||||||||||||||||||||||||||||||||||||||
| Operating Revenues | |||||||||||||||||||||||||||||||||||||||||||||||||||||||||||
| Annuities | $ | 1,141 | $ | 1,190 | $ | 1,197 | $ | (525) | $ | 1,269 | 11.2 | % | |||||||||||||||||||||||||||||||||||||||||||||||
| Life Insurance | 1,757 | 1,760 | 1,723 | 1,667 | 1,541 | -12.3 | % | ||||||||||||||||||||||||||||||||||||||||||||||||||||
| Group Protection | 1,388 | 1,400 | 1,388 | 1,387 | 1,425 | 2.7 | % | ||||||||||||||||||||||||||||||||||||||||||||||||||||
| Retirement Plan Services | 328 | 334 | 327 | 322 | 322 | -1.8 | % | ||||||||||||||||||||||||||||||||||||||||||||||||||||
| Other Operations | 43 | 46 | 38 | (884) | 27 | -37.2 | % | ||||||||||||||||||||||||||||||||||||||||||||||||||||
| Total segment operating revenues | $ | 4,657 | $ | 4,730 | $ | 4,673 | $ | 1,967 | $ | 4,584 | -1.6 | % | |||||||||||||||||||||||||||||||||||||||||||||||
| General and Administrative Expenses, | |||||||||||||||||||||||||||||||||||||||||||||||||||||||||||
| Net of Amounts Capitalized | |||||||||||||||||||||||||||||||||||||||||||||||||||||||||||
| Annuities | $ | 123 | $ | 135 | $ | 138 | $ | 131 | $ | 134 | 8.9 | % | |||||||||||||||||||||||||||||||||||||||||||||||
| Life Insurance | 134 | 136 | 138 | 143 | 130 | -3.0 | % | ||||||||||||||||||||||||||||||||||||||||||||||||||||
| Group Protection | 191 | 191 | 191 | 191 | 187 | -2.1 | % | ||||||||||||||||||||||||||||||||||||||||||||||||||||
| Retirement Plan Services | 79 | 81 | 81 | 84 | 81 | 2.5 | % | ||||||||||||||||||||||||||||||||||||||||||||||||||||
| Other Operations | 38 | 75 | 70 | 85 | 229 | NM | |||||||||||||||||||||||||||||||||||||||||||||||||||||
| Total | $ | 565 | $ | 618 | $ | 618 | $ | 635 | $ | 762 | 34.9 | % | |||||||||||||||||||||||||||||||||||||||||||||||
| General and Administrative Expenses, | |||||||||||||||||||||||||||||||||||||||||||||||||||||||||||
| Net of Amounts Capitalized, as a Percentage | |||||||||||||||||||||||||||||||||||||||||||||||||||||||||||
| of Operating Revenues | |||||||||||||||||||||||||||||||||||||||||||||||||||||||||||
| Annuities | 10.8 | % | 11.3 | % | 11.5 | % | NM | 10.6 | % | ||||||||||||||||||||||||||||||||||||||||||||||||||
| Life Insurance | 7.6 | % | 7.7 | % | 8.0 | % | 8.6 | % | 8.5 | % | |||||||||||||||||||||||||||||||||||||||||||||||||
| Group Protection | 13.8 | % | 13.6 | % | 13.8 | % | 13.8 | % | 13.1 | % | |||||||||||||||||||||||||||||||||||||||||||||||||
| Retirement Plan Services | 24.0 | % | 24.3 | % | 24.9 | % | 26.1 | % | 25.3 | % | |||||||||||||||||||||||||||||||||||||||||||||||||
| Other Operations | 90.0 | % | 162.1 | % | 177.3 | % | NM | 838.2 | % | ||||||||||||||||||||||||||||||||||||||||||||||||||
| Total | 12.1 | % | 13.1 | % | 13.2 | % | 32.2 | % | 16.6 | % | |||||||||||||||||||||||||||||||||||||||||||||||||
Page 9
| Lincoln Financial Group | |||||||||||||||||||||||||||||||||||||||||||||||||||||||||||
| Operating Commissions and Other Expenses | |||||||||||||||||||||||||||||||||||||||||||||||||||||||||||
| Unaudited (millions of dollars) | |||||||||||||||||||||||||||||||||||||||||||||||||||||||||||
| For the Three Months Ended | |||||||||||||||||||||||||||||||||||||||||||||||||||||||||||
| 3/31/23 | 6/30/23 | 9/30/23 | 12/31/23 | 3/31/24 | Change | ||||||||||||||||||||||||||||||||||||||||||||||||||||||
| Operating Commissions and | |||||||||||||||||||||||||||||||||||||||||||||||||||||||||||
| Other Expenses Incurred | |||||||||||||||||||||||||||||||||||||||||||||||||||||||||||
| General and administrative expenses | $ | 617 | $ | 672 | $ | 672 | $ | 693 | $ | 813 | 31.8 | % | |||||||||||||||||||||||||||||||||||||||||||||||
| Commissions | 615 | 617 | 603 | 651 | 639 | 3.9 | % | ||||||||||||||||||||||||||||||||||||||||||||||||||||
| Taxes, licenses and fees | 94 | 81 | 96 | 81 | 94 | 0.0% | |||||||||||||||||||||||||||||||||||||||||||||||||||||
| Interest and debt expense | 83 | 84 | 84 | 81 | 81 | -2.4 | % | ||||||||||||||||||||||||||||||||||||||||||||||||||||
| Expenses associated with reserve financing | |||||||||||||||||||||||||||||||||||||||||||||||||||||||||||
| and letters of credit | 30 | 27 | 28 | 29 | 30 | 0.0% | |||||||||||||||||||||||||||||||||||||||||||||||||||||
| Total adjusted operating commissions and other | |||||||||||||||||||||||||||||||||||||||||||||||||||||||||||
| expenses incurred | 1,439 | 1,481 | 1,483 | 1,535 | 1,657 | 15.1 | % | ||||||||||||||||||||||||||||||||||||||||||||||||||||
| Less Amounts Capitalized | |||||||||||||||||||||||||||||||||||||||||||||||||||||||||||
| General and administrative expenses | (52) | (54) | (54) | (58) | (51) | 1.9 | % | ||||||||||||||||||||||||||||||||||||||||||||||||||||
| Commissions | (241) | (240) | (223) | (259) | (205) | 14.9 | % | ||||||||||||||||||||||||||||||||||||||||||||||||||||
| Taxes, licenses and fees | (9) | (8) | (8) | (8) | (9) | 0.0% | |||||||||||||||||||||||||||||||||||||||||||||||||||||
| Total amounts capitalized | (302) | (302) | (285) | (325) | (265) | 12.3 | % | ||||||||||||||||||||||||||||||||||||||||||||||||||||
| Total expenses incurred, net of amounts | |||||||||||||||||||||||||||||||||||||||||||||||||||||||||||
| capitalized, excluding amortization | 1,137 | 1,179 | 1,198 | 1,210 | 1,392 | 22.4 | % | ||||||||||||||||||||||||||||||||||||||||||||||||||||
| Amortization | |||||||||||||||||||||||||||||||||||||||||||||||||||||||||||
| Amortization of DAC, VOBA and other intangibles | 268 | 271 | 270 | 271 | 271 | 1.1 | % | ||||||||||||||||||||||||||||||||||||||||||||||||||||
| Total operating commissions and other expenses | $ | 1,405 | $ | 1,450 | $ | 1,468 | $ | 1,481 | $ | 1,663 | 18.4 | % | |||||||||||||||||||||||||||||||||||||||||||||||
Page 10

| Lincoln Financial Group | |||||||||||||||||||||||||||||||||||||||||||||||||||||||||||
| Annuities – Select Earnings and Operational Data | |||||||||||||||||||||||||||||||||||||||||||||||||||||||||||
| Unaudited (millions of dollars) | |||||||||||||||||||||||||||||||||||||||||||||||||||||||||||
| As of or For the Three Months Ended | |||||||||||||||||||||||||||||||||||||||||||||||||||||||||||
| 3/31/23 | 6/30/23 | 9/30/23 | 12/31/23 | 3/31/24 | Change | ||||||||||||||||||||||||||||||||||||||||||||||||||||||
| Income (Loss) from Operations | |||||||||||||||||||||||||||||||||||||||||||||||||||||||||||
| Operating revenues: | |||||||||||||||||||||||||||||||||||||||||||||||||||||||||||
Insurance premiums (1) | $ | 38 | $ | 54 | $ | 24 | $ | (1,700) | $ | 26 | -31.6 | % | |||||||||||||||||||||||||||||||||||||||||||||||
Fee income (2) | 540 | 546 | 557 | 552 | 580 | 7.4 | % | ||||||||||||||||||||||||||||||||||||||||||||||||||||
| Net investment income | 421 | 437 | 451 | 425 | 420 | -0.2 | % | ||||||||||||||||||||||||||||||||||||||||||||||||||||
| Amortization of deferred gain (loss) on | |||||||||||||||||||||||||||||||||||||||||||||||||||||||||||
| business sold through reinsurance | 5 | 5 | 11 | 10 | 5 | 0.0% | |||||||||||||||||||||||||||||||||||||||||||||||||||||
| Other revenues | 137 | 148 | 154 | 188 | 238 | 73.7 | % | ||||||||||||||||||||||||||||||||||||||||||||||||||||
| Total operating revenues | 1,141 | 1,190 | 1,197 | (525) | 1,269 | 11.2 | % | ||||||||||||||||||||||||||||||||||||||||||||||||||||
| Operating expenses: | |||||||||||||||||||||||||||||||||||||||||||||||||||||||||||
Benefits (1) | 63 | 69 | 45 | (1,683) | 27 | -57.1 | % | ||||||||||||||||||||||||||||||||||||||||||||||||||||
| Interest credited | 278 | 306 | 330 | 338 | 354 | 27.3 | % | ||||||||||||||||||||||||||||||||||||||||||||||||||||
| Policyholder liability remeasurement (gain) loss | (1) | (1) | 19 | (15) | — | 100.0 | % | ||||||||||||||||||||||||||||||||||||||||||||||||||||
| Commissions incurred | 240 | 240 | 238 | 252 | 254 | 5.8 | % | ||||||||||||||||||||||||||||||||||||||||||||||||||||
| Other expenses incurred | 251 | 257 | 276 | 265 | 309 | 23.1 | % | ||||||||||||||||||||||||||||||||||||||||||||||||||||
| Amounts capitalized | (98) | (100) | (102) | (110) | (98) | 0.0% | |||||||||||||||||||||||||||||||||||||||||||||||||||||
| Amortization | 108 | 109 | 109 | 107 | 106 | -1.9 | % | ||||||||||||||||||||||||||||||||||||||||||||||||||||
| Total operating expenses | 841 | 880 | 915 | (846) | 952 | 13.2 | % | ||||||||||||||||||||||||||||||||||||||||||||||||||||
| Income (loss) from operations before taxes | 300 | 310 | 282 | 321 | 317 | 5.7 | % | ||||||||||||||||||||||||||||||||||||||||||||||||||||
| Federal income tax expense (benefit) | 26 | 39 | 34 | 42 | 58 | 123.1 | % | ||||||||||||||||||||||||||||||||||||||||||||||||||||
| Income (loss) from operations | $ | 274 | $ | 271 | $ | 248 | $ | 279 | $ | 259 | -5.5 | % | |||||||||||||||||||||||||||||||||||||||||||||||
| Effective Federal Income Tax Rate | 8.6 | % | 12.6 | % | 12.0 | % | 12.9 | % | 18.5 | % | |||||||||||||||||||||||||||||||||||||||||||||||||
| Return on Average Account Balances | 75 | 73 | 66 | 76 | 67 | (8) | |||||||||||||||||||||||||||||||||||||||||||||||||||||
| Account Balances, Net of Reinsurance – | |||||||||||||||||||||||||||||||||||||||||||||||||||||||||||
| End-of-Period | |||||||||||||||||||||||||||||||||||||||||||||||||||||||||||
| RILA account balances | $ | 21,841 | $ | 24,407 | $ | 25,006 | $ | 27,533 | $ | 30,100 | 37.8 | % | |||||||||||||||||||||||||||||||||||||||||||||||
| Other variable account balances without GLBs | 42,983 | 44,381 | 42,196 | 45,499 | 47,657 | 10.9 | % | ||||||||||||||||||||||||||||||||||||||||||||||||||||
| Other variable account balances with GLBs | 67,274 | 68,460 | 64,754 | 69,458 | 71,822 | 6.8 | % | ||||||||||||||||||||||||||||||||||||||||||||||||||||
| Fixed account balances | 15,053 | 14,828 | 14,694 | 10,336 | 10,214 | -32.1 | % | ||||||||||||||||||||||||||||||||||||||||||||||||||||
| Total account balances | $ | 147,151 | $ | 152,076 | $ | 146,650 | $ | 152,826 | $ | 159,793 | 8.6 | % | |||||||||||||||||||||||||||||||||||||||||||||||
| Percent variable account balances with GLBs | 45.7 | % | 45.0 | % | 44.2 | % | 45.4 | % | 44.9 | % | |||||||||||||||||||||||||||||||||||||||||||||||||
| Fee Income, Gross of Hedge Allowance | $ | 745 | $ | 750 | $ | 758 | $ | 752 | $ | 780 | 4.7 | % | |||||||||||||||||||||||||||||||||||||||||||||||
Net Investment Income, Net of Reinsurance (3) | 376 | 396 | 409 | 385 | 390 | 3.7 | % | ||||||||||||||||||||||||||||||||||||||||||||||||||||
Interest Credited, Net of Reinsurance (3) | 224 | 247 | 270 | 255 | 245 | 9.4 | % | ||||||||||||||||||||||||||||||||||||||||||||||||||||
(1) Day one impacts related to the fourth quarter 2023 reinsurance transaction contributed to line item volatility in the fourth quarter. | |||||||||||||||||||||||||||||||||||||||||||||||||||||||||||
(2) Fee income is reported net of the hedge allowance, which represents fees allocated to net annuity product features to support the cost of hedging. | |||||||||||||||||||||||||||||||||||||||||||||||||||||||||||
(3) Net investment income and interest credited are both reported gross of reinsurance. Reinsurance impacts are settled through other revenues. | |||||||||||||||||||||||||||||||||||||||||||||||||||||||||||
Page 11
| Lincoln Financial Group | |||||||||||||||||||||||||||||||||||||||||||||||||||||||||||
| Life Insurance – Select Earnings and Operational Data | |||||||||||||||||||||||||||||||||||||||||||||||||||||||||||
| Unaudited (millions of dollars) | |||||||||||||||||||||||||||||||||||||||||||||||||||||||||||
| As of or For the Three Months Ended | |||||||||||||||||||||||||||||||||||||||||||||||||||||||||||
| 3/31/23 | 6/30/23 | 9/30/23 | 12/31/23 | 3/31/24 | Change | ||||||||||||||||||||||||||||||||||||||||||||||||||||||
| Income (Loss) from Operations | |||||||||||||||||||||||||||||||||||||||||||||||||||||||||||
| Operating revenues: | |||||||||||||||||||||||||||||||||||||||||||||||||||||||||||
| Insurance premiums | $ | 285 | $ | 293 | $ | 289 | $ | 295 | $ | 288 | 1.1 | % | |||||||||||||||||||||||||||||||||||||||||||||||
| Fee income | 776 | 753 | 739 | 741 | 672 | -13.4 | % | ||||||||||||||||||||||||||||||||||||||||||||||||||||
| Net investment income | 687 | 707 | 689 | 629 | 581 | -15.4 | % | ||||||||||||||||||||||||||||||||||||||||||||||||||||
| Operating realized gain (loss) | (2) | (2) | (2) | (2) | (2) | 0.0% | |||||||||||||||||||||||||||||||||||||||||||||||||||||
| Amortization of deferred gain (loss) on | |||||||||||||||||||||||||||||||||||||||||||||||||||||||||||
| business sold through reinsurance | 4 | 4 | 4 | (6) | (19) | NM | |||||||||||||||||||||||||||||||||||||||||||||||||||||
| Other revenues | 7 | 5 | 4 | 10 | 21 | 200.0 | % | ||||||||||||||||||||||||||||||||||||||||||||||||||||
| Total operating revenues | 1,757 | 1,760 | 1,723 | 1,667 | 1,541 | -12.3 | % | ||||||||||||||||||||||||||||||||||||||||||||||||||||
| Operating expenses: | |||||||||||||||||||||||||||||||||||||||||||||||||||||||||||
| Benefits | 1,152 | 1,073 | 1,129 | 1,083 | 928 | -19.4 | % | ||||||||||||||||||||||||||||||||||||||||||||||||||||
| Interest credited | 328 | 325 | 325 | 312 | 294 | -10.4 | % | ||||||||||||||||||||||||||||||||||||||||||||||||||||
| Policyholder liability remeasurement (gain) loss | (13) | 14 | 183 | (37) | 59 | NM | |||||||||||||||||||||||||||||||||||||||||||||||||||||
| Commissions incurred | 148 | 143 | 129 | 150 | 113 | -23.6 | % | ||||||||||||||||||||||||||||||||||||||||||||||||||||
| Other expenses incurred | 216 | 216 | 215 | 223 | 204 | -5.6 | % | ||||||||||||||||||||||||||||||||||||||||||||||||||||
| Amounts capitalized | (174) | (170) | (152) | (175) | (133) | 23.6 | % | ||||||||||||||||||||||||||||||||||||||||||||||||||||
| Amortization | 123 | 124 | 123 | 125 | 126 | 2.4 | % | ||||||||||||||||||||||||||||||||||||||||||||||||||||
| Total operating expenses | 1,780 | 1,725 | 1,952 | 1,681 | 1,591 | -10.6 | % | ||||||||||||||||||||||||||||||||||||||||||||||||||||
| Income (loss) from operations before taxes | (23) | 35 | (229) | (14) | (50) | NM | |||||||||||||||||||||||||||||||||||||||||||||||||||||
| Federal income tax expense (benefit) | (10) | 2 | (56) | (8) | (15) | -50.0 | % | ||||||||||||||||||||||||||||||||||||||||||||||||||||
| Income (loss) from operations | $ | (13) | $ | 33 | $ | (173) | $ | (6) | $ | (35) | NM | ||||||||||||||||||||||||||||||||||||||||||||||||
| Effective Federal Income Tax Rate | 45.0 | % | 6.6 | % | 24.2 | % | 59.7 | % | 29.7 | % | |||||||||||||||||||||||||||||||||||||||||||||||||
| Average Account Balances, Net of Reinsurance | $ | 49,100 | $ | 50,049 | $ | 50,130 | $ | 45,608 | $ | 42,280 | -13.9 | % | |||||||||||||||||||||||||||||||||||||||||||||||
| In-Force Face Amount | |||||||||||||||||||||||||||||||||||||||||||||||||||||||||||
| UL and other | $ | 364,101 | $ | 364,633 | $ | 364,586 | $ | 365,938 | $ | 365,507 | 0.4 | % | |||||||||||||||||||||||||||||||||||||||||||||||
| Term insurance | 715,495 | 719,361 | 721,927 | 722,620 | 720,745 | 0.7 | % | ||||||||||||||||||||||||||||||||||||||||||||||||||||
| Total in-force face amount | $ | 1,079,596 | $ | 1,083,994 | $ | 1,086,513 | $ | 1,088,558 | $ | 1,086,252 | 0.6 | % | |||||||||||||||||||||||||||||||||||||||||||||||
Page 12
| Lincoln Financial Group | ||||||||||||||||||||||||||||||||||||||||||||||||||||||||
| Group Protection – Select Earnings and Operational Data | ||||||||||||||||||||||||||||||||||||||||||||||||||||||||
| Unaudited (millions of dollars) | ||||||||||||||||||||||||||||||||||||||||||||||||||||||||
| As of or For the Three Months Ended | ||||||||||||||||||||||||||||||||||||||||||||||||||||||||
| 3/31/23 | 6/30/23 | 9/30/23 | 12/31/23 | 3/31/24 | Change | |||||||||||||||||||||||||||||||||||||||||||||||||||
| Income (Loss) from Operations | ||||||||||||||||||||||||||||||||||||||||||||||||||||||||
| Operating revenues: | ||||||||||||||||||||||||||||||||||||||||||||||||||||||||
| Insurance premiums | $ | 1,251 | $ | 1,263 | $ | 1,251 | $ | 1,250 | $ | 1,285 | 2.7 | % | ||||||||||||||||||||||||||||||||||||||||||||
| Net investment income | 85 | 85 | 84 | 85 | 85 | 0.0% | ||||||||||||||||||||||||||||||||||||||||||||||||||
| Other revenues | 52 | 52 | 53 | 52 | 55 | 5.8 | % | |||||||||||||||||||||||||||||||||||||||||||||||||
| Total operating revenues | 1,388 | 1,400 | 1,388 | 1,387 | 1,425 | 2.7 | % | |||||||||||||||||||||||||||||||||||||||||||||||||
| Operating expenses: | ||||||||||||||||||||||||||||||||||||||||||||||||||||||||
| Benefits | 1,037 | 1,019 | 979 | 984 | 1,030 | -0.7 | % | |||||||||||||||||||||||||||||||||||||||||||||||||
| Interest credited | 1 | 1 | 1 | 1 | 1 | 0.0% | ||||||||||||||||||||||||||||||||||||||||||||||||||
| Policyholder liability remeasurement (gain) loss | (100) | (121) | (39) | (28) | (67) | 33.0 | % | |||||||||||||||||||||||||||||||||||||||||||||||||
| Commissions incurred | 106 | 112 | 109 | 119 | 109 | 2.8 | % | |||||||||||||||||||||||||||||||||||||||||||||||||
| Other expenses incurred | 248 | 246 | 245 | 246 | 246 | -0.8 | % | |||||||||||||||||||||||||||||||||||||||||||||||||
| Amounts capitalized | (25) | (28) | (26) | (34) | (29) | -16.0 | % | |||||||||||||||||||||||||||||||||||||||||||||||||
| Amortization | 32 | 33 | 33 | 34 | 34 | 6.3 | % | |||||||||||||||||||||||||||||||||||||||||||||||||
| Total operating expenses | 1,299 | 1,262 | 1,302 | 1,322 | 1,324 | 1.9 | % | |||||||||||||||||||||||||||||||||||||||||||||||||
| Income (loss) from operations before taxes | 89 | 138 | 86 | 65 | 101 | 13.5 | % | |||||||||||||||||||||||||||||||||||||||||||||||||
| Federal income tax expense (benefit) | 18 | 29 | 18 | 13 | 21 | 16.7 | % | |||||||||||||||||||||||||||||||||||||||||||||||||
| Income (loss) from operations | $ | 71 | $ | 109 | $ | 68 | $ | 52 | $ | 80 | 12.7 | % | ||||||||||||||||||||||||||||||||||||||||||||
| Effective Federal Income Tax Rate | 21.0 | % | 21.0 | % | 21.0 | % | 21.0 | % | 21.0 | % | ||||||||||||||||||||||||||||||||||||||||||||||
| Loss Ratios by Product Line | ||||||||||||||||||||||||||||||||||||||||||||||||||||||||
| Life | 80.4 | % | 71.6 | % | 76.8 | % | 67.2 | % | 76.1 | % | ||||||||||||||||||||||||||||||||||||||||||||||
| Disability | 71.4 | % | 70.7 | % | 74.1 | % | 83.1 | % | 74.2 | % | ||||||||||||||||||||||||||||||||||||||||||||||
| Dental | 76.4 | % | 76.9 | % | 75.9 | % | 75.4 | % | 76.5 | % | ||||||||||||||||||||||||||||||||||||||||||||||
| Total | 75.0 | % | 71.3 | % | 75.2 | % | 76.6 | % | 75.0 | % | ||||||||||||||||||||||||||||||||||||||||||||||
Page 13
| Lincoln Financial Group | |||||||||||||||||||||||||||||||||||||||||||||||||||||||||||
| Retirement Plan Services – Select Earnings and Operational Data | |||||||||||||||||||||||||||||||||||||||||||||||||||||||||||
| Unaudited (millions of dollars) | |||||||||||||||||||||||||||||||||||||||||||||||||||||||||||
| As of or For the Three Months Ended | |||||||||||||||||||||||||||||||||||||||||||||||||||||||||||
| 3/31/23 | 6/30/23 | 9/30/23 | 12/31/23 | 3/31/24 | Change | ||||||||||||||||||||||||||||||||||||||||||||||||||||||
| Income (Loss) from Operations | |||||||||||||||||||||||||||||||||||||||||||||||||||||||||||
| Operating revenues: | |||||||||||||||||||||||||||||||||||||||||||||||||||||||||||
| Fee income | $ | 64 | $ | 65 | $ | 66 | $ | 67 | $ | 70 | 9.4 | % | |||||||||||||||||||||||||||||||||||||||||||||||
| Net investment income | 255 | 259 | 251 | 248 | 244 | -4.3 | % | ||||||||||||||||||||||||||||||||||||||||||||||||||||
| Other revenues | 9 | 10 | 10 | 7 | 8 | -11.1 | % | ||||||||||||||||||||||||||||||||||||||||||||||||||||
| Total operating revenues | 328 | 334 | 327 | 322 | 322 | -1.8 | % | ||||||||||||||||||||||||||||||||||||||||||||||||||||
| Operating expenses: | |||||||||||||||||||||||||||||||||||||||||||||||||||||||||||
| Interest credited | 167 | 168 | 165 | 164 | 166 | -0.6 | % | ||||||||||||||||||||||||||||||||||||||||||||||||||||
| Commissions incurred | 21 | 21 | 22 | 22 | 23 | 9.5 | % | ||||||||||||||||||||||||||||||||||||||||||||||||||||
| Other expenses incurred | 89 | 90 | 90 | 93 | 92 | 3.4 | % | ||||||||||||||||||||||||||||||||||||||||||||||||||||
| Amounts capitalized | (5) | (5) | (5) | (6) | (5) | 0.0% | |||||||||||||||||||||||||||||||||||||||||||||||||||||
| Amortization | 5 | 5 | 5 | 5 | 5 | 0.0% | |||||||||||||||||||||||||||||||||||||||||||||||||||||
| Total operating expenses | 277 | 279 | 277 | 278 | 281 | 1.4 | % | ||||||||||||||||||||||||||||||||||||||||||||||||||||
| Income (loss) from operations before taxes | 51 | 55 | 50 | 44 | 41 | -19.6 | % | ||||||||||||||||||||||||||||||||||||||||||||||||||||
| Federal income tax expense (benefit) | 8 | 8 | 7 | 6 | 5 | -37.5 | % | ||||||||||||||||||||||||||||||||||||||||||||||||||||
| Income (loss) from operations | $ | 43 | $ | 47 | $ | 43 | $ | 38 | $ | 36 | -16.3 | % | |||||||||||||||||||||||||||||||||||||||||||||||
| Effective Federal Income Tax Rate | 16.4 | % | 14.9 | % | 13.9 | % | 13.2 | % | 12.9 | % | |||||||||||||||||||||||||||||||||||||||||||||||||
| Return on Average Account Balances | 19 | 20 | 18 | 16 | 14 | (5) | |||||||||||||||||||||||||||||||||||||||||||||||||||||
| Pre-tax Net Margin | 31.8 | % | 33.5 | % | 31.2 | % | 27.8 | % | 26.5 | % | |||||||||||||||||||||||||||||||||||||||||||||||||
| Net Flows by Market | |||||||||||||||||||||||||||||||||||||||||||||||||||||||||||
| Small Market | $ | 148 | $ | 99 | $ | 21 | $ | 115 | $ | (32) | NM | ||||||||||||||||||||||||||||||||||||||||||||||||
| Mid - Large Market | 711 | 408 | 83 | 78 | 847 | 19.1 | % | ||||||||||||||||||||||||||||||||||||||||||||||||||||
Multi-Fund® and Other | (324) | (306) | (376) | (525) | (424) | -30.9 | % | ||||||||||||||||||||||||||||||||||||||||||||||||||||
| Net Flows – Trailing Twelve Months | $ | 2,304 | $ | 1,592 | $ | 515 | $ | 132 | $ | (12) | NM | ||||||||||||||||||||||||||||||||||||||||||||||||
| Base Spreads, Excluding Variable | |||||||||||||||||||||||||||||||||||||||||||||||||||||||||||
Investment Income (1) | 1.14 | % | 1.18 | % | 1.10 | % | 1.09 | % | 1.02 | % | (12) | ||||||||||||||||||||||||||||||||||||||||||||||||
(1) Variable investment income consists of commercial mortgage loan prepayment and bond make-whole premiums. | |||||||||||||||||||||||||||||||||||||||||||||||||||||||||||
Page 14
| Lincoln Financial Group | |||||||||||||||||||||||||||||||||||||||||||||||||||||||||||
| Other Operations – Select Earnings and Operational Data | |||||||||||||||||||||||||||||||||||||||||||||||||||||||||||
| Unaudited (millions of dollars) | |||||||||||||||||||||||||||||||||||||||||||||||||||||||||||
| For the Three Months Ended | |||||||||||||||||||||||||||||||||||||||||||||||||||||||||||
| 3/31/23 | 6/30/23 | 9/30/23 | 12/31/23 | 3/31/24 | Change | ||||||||||||||||||||||||||||||||||||||||||||||||||||||
| Other Operations | |||||||||||||||||||||||||||||||||||||||||||||||||||||||||||
| Operating revenues: | |||||||||||||||||||||||||||||||||||||||||||||||||||||||||||
Insurance premiums (1) | $ | 5 | $ | 2 | $ | 1 | $ | (930) | $ | 2 | -60.0 | % | |||||||||||||||||||||||||||||||||||||||||||||||
| Net investment income | 35 | 38 | 37 | 37 | 16 | -54.3 | % | ||||||||||||||||||||||||||||||||||||||||||||||||||||
| Amortization of deferred gain (loss) on | |||||||||||||||||||||||||||||||||||||||||||||||||||||||||||
| business sold through reinsurance | — | — | — | 1 | 2 | NM | |||||||||||||||||||||||||||||||||||||||||||||||||||||
| Other revenues | 3 | 6 | — | 8 | 7 | 133.3 | % | ||||||||||||||||||||||||||||||||||||||||||||||||||||
| Total operating revenues | 43 | 46 | 38 | (884) | 27 | -37.2 | % | ||||||||||||||||||||||||||||||||||||||||||||||||||||
| Operating expenses: | |||||||||||||||||||||||||||||||||||||||||||||||||||||||||||
Benefits (1) | 20 | 14 | 17 | (918) | 6 | -70.0 | % | ||||||||||||||||||||||||||||||||||||||||||||||||||||
| Interest credited | 10 | 9 | 9 | 9 | 9 | -10.0 | % | ||||||||||||||||||||||||||||||||||||||||||||||||||||
| Policyholder liability remeasurement (gain) loss | — | 1 | (5) | — | (1) | NM | |||||||||||||||||||||||||||||||||||||||||||||||||||||
| Commissions and other expenses | 37 | 73 | 75 | 84 | 226 | NM | |||||||||||||||||||||||||||||||||||||||||||||||||||||
| Interest and debt expense | 83 | 84 | 84 | 81 | 81 | -2.4 | % | ||||||||||||||||||||||||||||||||||||||||||||||||||||
| Total operating expenses | 150 | 181 | 180 | (744) | 321 | 114.0 | % | ||||||||||||||||||||||||||||||||||||||||||||||||||||
| Income (loss) from operations before taxes | (107) | (135) | (142) | (140) | (294) | NM | |||||||||||||||||||||||||||||||||||||||||||||||||||||
| Federal income tax expense (benefit) | (20) | (29) | (29) | (35) | (59) | NM | |||||||||||||||||||||||||||||||||||||||||||||||||||||
| Income (loss) from operations | $ | (87) | $ | (106) | $ | (113) | $ | (105) | $ | (235) | NM | ||||||||||||||||||||||||||||||||||||||||||||||||
(1) Day one impacts related to the fourth quarter 2023 reinsurance transaction contributed to line item volatility in the fourth quarter. | |||||||||||||||||||||||||||||||||||||||||||||||||||||||||||
Page 15

| Lincoln Financial Group | |||||||||||||||||||||||||||||||||||||||||||||||||||||||||||
| Consolidated – DAC, VOBA, DSI and DFEL Roll Forwards | |||||||||||||||||||||||||||||||||||||||||||||||||||||||||||
| Unaudited (millions of dollars) | |||||||||||||||||||||||||||||||||||||||||||||||||||||||||||
| For the Three Months Ended | |||||||||||||||||||||||||||||||||||||||||||||||||||||||||||
| 3/31/23 | 6/30/23 | 9/30/23 | 12/31/23 | 3/31/24 | Change | ||||||||||||||||||||||||||||||||||||||||||||||||||||||
| DAC, VOBA and DSI | |||||||||||||||||||||||||||||||||||||||||||||||||||||||||||
| Balance as of beginning-of-period | $ | 12,235 | $ | 12,277 | $ | 12,316 | $ | 12,341 | $ | 12,397 | 1.3 | % | |||||||||||||||||||||||||||||||||||||||||||||||
| Business acquired (sold) through reinsurance | — | — | — | (11) | — | NM | |||||||||||||||||||||||||||||||||||||||||||||||||||||
| Deferrals | 306 | 304 | 289 | 333 | 274 | -10.5 | % | ||||||||||||||||||||||||||||||||||||||||||||||||||||
| Operating amortization | (264) | (265) | (264) | (266) | (266) | -0.8 | % | ||||||||||||||||||||||||||||||||||||||||||||||||||||
| Balance as of end-of-period | $ | 12,277 | $ | 12,316 | $ | 12,341 | $ | 12,397 | $ | 12,405 | 1.0 | % | |||||||||||||||||||||||||||||||||||||||||||||||
| DFEL | |||||||||||||||||||||||||||||||||||||||||||||||||||||||||||
| Balance as of beginning-of-period | $ | 5,091 | $ | 5,291 | $ | 5,494 | $ | 5,695 | $ | 5,901 | 15.9 | % | |||||||||||||||||||||||||||||||||||||||||||||||
| Deferrals | 268 | 274 | 275 | 281 | 272 | 1.5 | % | ||||||||||||||||||||||||||||||||||||||||||||||||||||
| Operating amortization | (68) | (71) | (74) | (75) | (74) | -8.8 | % | ||||||||||||||||||||||||||||||||||||||||||||||||||||
| Balance as of end-of-period | $ | 5,291 | $ | 5,494 | $ | 5,695 | $ | 5,901 | $ | 6,099 | 15.3 | % | |||||||||||||||||||||||||||||||||||||||||||||||
| DAC, VOBA, DSI and DFEL | |||||||||||||||||||||||||||||||||||||||||||||||||||||||||||
| Balance as of End-of-Period, After-Tax | $ | 5,519 | $ | 5,389 | $ | 5,250 | $ | 5,132 | $ | 4,981 | -9.7 | % | |||||||||||||||||||||||||||||||||||||||||||||||
Page 16
| Lincoln Financial Group | |||||||||||||||||||||||||||||||||||||||||||||||||||||||||||
| Annuities – Account Balance Roll Forwards | |||||||||||||||||||||||||||||||||||||||||||||||||||||||||||
| Unaudited (millions of dollars) | |||||||||||||||||||||||||||||||||||||||||||||||||||||||||||
| For the Three Months Ended | |||||||||||||||||||||||||||||||||||||||||||||||||||||||||||
| 3/31/23 | 6/30/23 | 9/30/23 | 12/31/23 | 3/31/24 | Change | ||||||||||||||||||||||||||||||||||||||||||||||||||||||
| Traditional Variable Annuities | |||||||||||||||||||||||||||||||||||||||||||||||||||||||||||
| Balance as of beginning-of-period | $ | 107,627 | $ | 110,264 | $ | 112,848 | $ | 106,957 | $ | 114,963 | 6.8 | % | |||||||||||||||||||||||||||||||||||||||||||||||
| Gross deposits | 700 | 835 | 889 | 941 | 934 | 33.4 | % | ||||||||||||||||||||||||||||||||||||||||||||||||||||
| Full surrenders and deaths | (1,527) | (1,543) | (1,559) | (1,714) | (2,145) | -40.5 | % | ||||||||||||||||||||||||||||||||||||||||||||||||||||
| Other contract benefits | (979) | (993) | (984) | (1,147) | (1,130) | -15.4 | % | ||||||||||||||||||||||||||||||||||||||||||||||||||||
| Net flows | (1,806) | (1,701) | (1,654) | (1,920) | (2,341) | -29.6 | % | ||||||||||||||||||||||||||||||||||||||||||||||||||||
| Policyholder assessments | (623) | (626) | (630) | (624) | (644) | -3.4 | % | ||||||||||||||||||||||||||||||||||||||||||||||||||||
| Change in market value and reinvestment | 5,066 | 4,911 | (3,607) | 10,550 | 7,507 | 48.2 | % | ||||||||||||||||||||||||||||||||||||||||||||||||||||
| Balance as of end-of-period, gross | 110,264 | 112,848 | 106,957 | 114,963 | 119,485 | 8.4 | % | ||||||||||||||||||||||||||||||||||||||||||||||||||||
| Account balances reinsured | (7) | (7) | (7) | (6) | (6) | 14.3 | % | ||||||||||||||||||||||||||||||||||||||||||||||||||||
| Balance as of end-of-period, net | $ | 110,257 | $ | 112,841 | $ | 106,950 | $ | 114,957 | $ | 119,479 | 8.4 | % | |||||||||||||||||||||||||||||||||||||||||||||||
| RILA | |||||||||||||||||||||||||||||||||||||||||||||||||||||||||||
| Balance as of beginning-of-period | $ | 20,130 | $ | 21,841 | $ | 24,407 | $ | 25,006 | $ | 27,533 | 36.8 | % | |||||||||||||||||||||||||||||||||||||||||||||||
| Gross deposits | 1,147 | 1,123 | 1,069 | 986 | 942 | -17.9 | % | ||||||||||||||||||||||||||||||||||||||||||||||||||||
| Full surrenders and deaths | (65) | (78) | (105) | (103) | (112) | -72.3 | % | ||||||||||||||||||||||||||||||||||||||||||||||||||||
| Other contract benefits | (35) | (23) | (20) | (45) | (45) | -28.6 | % | ||||||||||||||||||||||||||||||||||||||||||||||||||||
| Net flows | 1,047 | 1,022 | 944 | 838 | 785 | -25.0 | % | ||||||||||||||||||||||||||||||||||||||||||||||||||||
| Policyholder assessments | (1) | (2) | (2) | (3) | (3) | NM | |||||||||||||||||||||||||||||||||||||||||||||||||||||
| Change in market value and reinvestment | 125 | 163 | 190 | 213 | 247 | 97.6 | % | ||||||||||||||||||||||||||||||||||||||||||||||||||||
| Change in fair value of embedded derivative instruments | 540 | 1,383 | (533) | 1,479 | 1,538 | 184.8 | % | ||||||||||||||||||||||||||||||||||||||||||||||||||||
| Balance as of end-of-period, gross | $ | 21,841 | $ | 24,407 | $ | 25,006 | $ | 27,533 | $ | 30,100 | 37.8 | % | |||||||||||||||||||||||||||||||||||||||||||||||
Page 17a
| Lincoln Financial Group | |||||||||||||||||||||||||||||||||||||||||||||||||||||||||||
| Annuities – Account Balance Roll Forwards | |||||||||||||||||||||||||||||||||||||||||||||||||||||||||||
| Unaudited (millions of dollars) | |||||||||||||||||||||||||||||||||||||||||||||||||||||||||||
| For the Three Months Ended | |||||||||||||||||||||||||||||||||||||||||||||||||||||||||||
| 3/31/23 | 6/30/23 | 9/30/23 | 12/31/23 | 3/31/24 | Change | ||||||||||||||||||||||||||||||||||||||||||||||||||||||
| Fixed Annuities | |||||||||||||||||||||||||||||||||||||||||||||||||||||||||||
| Balance as of beginning-of-period | $ | 23,365 | $ | 24,019 | $ | 23,813 | $ | 23,681 | $ | 25,355 | 8.5 | % | |||||||||||||||||||||||||||||||||||||||||||||||
| Gross deposits | 1,317 | 602 | 779 | 2,432 | 973 | -26.1 | % | ||||||||||||||||||||||||||||||||||||||||||||||||||||
| Full surrenders and deaths | (728) | (864) | (782) | (878) | (1,213) | -66.6 | % | ||||||||||||||||||||||||||||||||||||||||||||||||||||
| Other contract benefits | (161) | (167) | (161) | (187) | (197) | -22.4 | % | ||||||||||||||||||||||||||||||||||||||||||||||||||||
| Net flows | 428 | (429) | (164) | 1,367 | (437) | NM | |||||||||||||||||||||||||||||||||||||||||||||||||||||
| Policyholder assessments | (15) | (14) | (13) | (15) | (17) | -13.3 | % | ||||||||||||||||||||||||||||||||||||||||||||||||||||
| Reinvested interest credited | 154 | 159 | 158 | 172 | 183 | 18.8 | % | ||||||||||||||||||||||||||||||||||||||||||||||||||||
| Change in fair value of embedded derivative instruments | 87 | 78 | (113) | 150 | 78 | -10.3 | % | ||||||||||||||||||||||||||||||||||||||||||||||||||||
| Balance as of end-of-period, gross | 24,019 | 23,813 | 23,681 | 25,355 | 25,162 | 4.8 | % | ||||||||||||||||||||||||||||||||||||||||||||||||||||
| Account balances reinsured | (8,966) | (8,985) | (8,987) | (15,019) | (14,948) | -66.7 | % | ||||||||||||||||||||||||||||||||||||||||||||||||||||
| Balance as of end-of-period, net | $ | 15,053 | $ | 14,828 | $ | 14,694 | $ | 10,336 | $ | 10,214 | -32.1 | % | |||||||||||||||||||||||||||||||||||||||||||||||
| Total | |||||||||||||||||||||||||||||||||||||||||||||||||||||||||||
| Balance as of beginning-of-period | $ | 151,122 | $ | 156,124 | $ | 161,068 | $ | 155,644 | $ | 167,851 | 11.1 | % | |||||||||||||||||||||||||||||||||||||||||||||||
| Gross deposits | 3,164 | 2,560 | 2,737 | 4,359 | 2,849 | -10.0 | % | ||||||||||||||||||||||||||||||||||||||||||||||||||||
| Full surrenders and deaths | (2,320) | (2,485) | (2,446) | (2,695) | (3,470) | -49.6 | % | ||||||||||||||||||||||||||||||||||||||||||||||||||||
| Other contract benefits | (1,175) | (1,183) | (1,165) | (1,379) | (1,372) | -16.8 | % | ||||||||||||||||||||||||||||||||||||||||||||||||||||
| Net flows | (331) | (1,108) | (874) | 285 | (1,993) | NM | |||||||||||||||||||||||||||||||||||||||||||||||||||||
| Policyholder assessments | (639) | (642) | (645) | (642) | (664) | -3.9 | % | ||||||||||||||||||||||||||||||||||||||||||||||||||||
| Change in market value, reinvestment and interest credited | 5,345 | 5,233 | (3,259) | 10,935 | 7,937 | 48.5 | % | ||||||||||||||||||||||||||||||||||||||||||||||||||||
| Change in fair value of embedded derivative instruments | 627 | 1,461 | (646) | 1,629 | 1,616 | 157.7 | % | ||||||||||||||||||||||||||||||||||||||||||||||||||||
| Balance as of end-of-period, gross | 156,124 | 161,068 | 155,644 | 167,851 | 174,747 | 11.9 | % | ||||||||||||||||||||||||||||||||||||||||||||||||||||
| Account balances reinsured | (8,973) | (8,992) | (8,994) | (15,025) | (14,954) | -66.7 | % | ||||||||||||||||||||||||||||||||||||||||||||||||||||
| Balance as of end-of-period, net | $ | 147,151 | $ | 152,076 | $ | 146,650 | $ | 152,826 | $ | 159,793 | 8.6 | % | |||||||||||||||||||||||||||||||||||||||||||||||
Page 17b
| Lincoln Financial Group | |||||||||||||||||||||||||||||||||||||||||||||||||||||||||||
| Life Insurance – Account Balance Roll Forwards | |||||||||||||||||||||||||||||||||||||||||||||||||||||||||||
| Unaudited (millions of dollars) | |||||||||||||||||||||||||||||||||||||||||||||||||||||||||||
| For the Three Months Ended | |||||||||||||||||||||||||||||||||||||||||||||||||||||||||||
| 3/31/23 | 6/30/23 | 9/30/23 | 12/31/23 | 3/31/24 | Change | ||||||||||||||||||||||||||||||||||||||||||||||||||||||
| General Account | |||||||||||||||||||||||||||||||||||||||||||||||||||||||||||
| Balance as of beginning-of-period | $ | 37,694 | $ | 37,533 | $ | 37,458 | $ | 37,217 | $ | 37,180 | -1.4 | % | |||||||||||||||||||||||||||||||||||||||||||||||
| Gross deposits | 926 | 907 | 915 | 1,006 | 850 | -8.2 | % | ||||||||||||||||||||||||||||||||||||||||||||||||||||
| Withdrawals and deaths | (393) | (323) | (378) | (359) | (364) | 7.4 | % | ||||||||||||||||||||||||||||||||||||||||||||||||||||
| Net flows | 533 | 584 | 537 | 647 | 486 | -8.8 | % | ||||||||||||||||||||||||||||||||||||||||||||||||||||
| Transfers between general and separate accounts | 32 | 44 | 14 | 7 | 38 | 18.8 | % | ||||||||||||||||||||||||||||||||||||||||||||||||||||
| Policyholder assessments | (1,128) | (1,120) | (1,124) | (1,140) | (1,124) | 0.4 | % | ||||||||||||||||||||||||||||||||||||||||||||||||||||
| Reinvested interest credited | 373 | 371 | 370 | 366 | 365 | -2.1 | % | ||||||||||||||||||||||||||||||||||||||||||||||||||||
| Change in fair value of embedded derivative instruments | 29 | 46 | (38) | 83 | 61 | 110.3 | % | ||||||||||||||||||||||||||||||||||||||||||||||||||||
| Balance as of end-of-period, gross | 37,533 | 37,458 | 37,217 | 37,180 | 37,006 | -1.4 | % | ||||||||||||||||||||||||||||||||||||||||||||||||||||
| Account balances reinsured | (5,525) | (5,527) | (5,503) | (15,777) | (15,607) | NM | |||||||||||||||||||||||||||||||||||||||||||||||||||||
| Balance as of end-of-period, net | $ | 32,008 | $ | 31,931 | $ | 31,714 | $ | 21,403 | $ | 21,399 | -33.1 | % | |||||||||||||||||||||||||||||||||||||||||||||||
| Separate Account | |||||||||||||||||||||||||||||||||||||||||||||||||||||||||||
| Balance as of beginning-of-period | $ | 20,920 | $ | 22,162 | $ | 23,409 | $ | 22,642 | $ | 25,150 | 20.2 | % | |||||||||||||||||||||||||||||||||||||||||||||||
| Gross deposits | 394 | 426 | 357 | 452 | 358 | -9.1 | % | ||||||||||||||||||||||||||||||||||||||||||||||||||||
| Withdrawals and deaths | (75) | (78) | (73) | (86) | (103) | -37.3 | % | ||||||||||||||||||||||||||||||||||||||||||||||||||||
| Net flows | 319 | 348 | 284 | 366 | 255 | -20.1 | % | ||||||||||||||||||||||||||||||||||||||||||||||||||||
| Transfers between general and separate accounts | (32) | (44) | (12) | (7) | (37) | -15.6 | % | ||||||||||||||||||||||||||||||||||||||||||||||||||||
| Policyholder assessments | (238) | (238) | (238) | (250) | (246) | -3.4 | % | ||||||||||||||||||||||||||||||||||||||||||||||||||||
| Change in market value and reinvestment | 1,193 | 1,181 | (801) | 2,399 | 1,885 | 58.0 | % | ||||||||||||||||||||||||||||||||||||||||||||||||||||
| Balance as of end-of-period, gross | 22,162 | 23,409 | 22,642 | 25,150 | 27,007 | 21.9 | % | ||||||||||||||||||||||||||||||||||||||||||||||||||||
| Account balances reinsured | (4,606) | (4,805) | (4,632) | (5,062) | (5,338) | -15.9 | % | ||||||||||||||||||||||||||||||||||||||||||||||||||||
| Balance as of end-of-period, net | $ | 17,556 | $ | 18,604 | $ | 18,010 | $ | 20,088 | $ | 21,669 | 23.4 | % | |||||||||||||||||||||||||||||||||||||||||||||||
| Total | |||||||||||||||||||||||||||||||||||||||||||||||||||||||||||
| Balance as of beginning-of-period | $ | 58,614 | $ | 59,695 | $ | 60,867 | $ | 59,859 | $ | 62,330 | 6.3 | % | |||||||||||||||||||||||||||||||||||||||||||||||
| Gross deposits | 1,320 | 1,333 | 1,272 | 1,458 | 1,208 | -8.5 | % | ||||||||||||||||||||||||||||||||||||||||||||||||||||
| Withdrawals and deaths | (468) | (401) | (451) | (445) | (467) | 0.2 | % | ||||||||||||||||||||||||||||||||||||||||||||||||||||
| Net flows | 852 | 932 | 821 | 1,013 | 741 | -13.0 | % | ||||||||||||||||||||||||||||||||||||||||||||||||||||
| Transfers between general and separate accounts | — | — | 2 | — | 1 | ||||||||||||||||||||||||||||||||||||||||||||||||||||||
| Policyholder assessments | (1,366) | (1,358) | (1,362) | (1,390) | (1,370) | -0.3 | % | ||||||||||||||||||||||||||||||||||||||||||||||||||||
| Change in market value and reinvestment | 1,566 | 1,552 | (431) | 2,765 | 2,250 | 43.7 | % | ||||||||||||||||||||||||||||||||||||||||||||||||||||
| Change in fair value of embedded derivative instruments | 29 | 46 | (38) | 83 | 61 | 110.3 | % | ||||||||||||||||||||||||||||||||||||||||||||||||||||
| Balance as of end-of-period, gross | 59,695 | 60,867 | 59,859 | 62,330 | 64,013 | 7.2 | % | ||||||||||||||||||||||||||||||||||||||||||||||||||||
| Account balances reinsured | (10,131) | (10,332) | (10,135) | (20,839) | (20,945) | NM | |||||||||||||||||||||||||||||||||||||||||||||||||||||
| Balance as of end-of-period, net | $ | 49,564 | $ | 50,535 | $ | 49,724 | $ | 41,491 | $ | 43,068 | -13.1 | % | |||||||||||||||||||||||||||||||||||||||||||||||
Page 18
| Lincoln Financial Group | |||||||||||||||||||||||||||||||||||||||||||||||||||||||||||
| Retirement Plan Services – Account Balance Roll Forwards | |||||||||||||||||||||||||||||||||||||||||||||||||||||||||||
| Unaudited (millions of dollars) | |||||||||||||||||||||||||||||||||||||||||||||||||||||||||||
| For the Three Months Ended | |||||||||||||||||||||||||||||||||||||||||||||||||||||||||||
| 3/31/23 | 6/30/23 | 9/30/23 | 12/31/23 | 3/31/24 | Change | ||||||||||||||||||||||||||||||||||||||||||||||||||||||
| General Account | |||||||||||||||||||||||||||||||||||||||||||||||||||||||||||
| Balance as of beginning-of-period | $ | 25,138 | $ | 24,994 | $ | 24,430 | $ | 24,099 | $ | 23,784 | -5.4 | % | |||||||||||||||||||||||||||||||||||||||||||||||
| Gross deposits | 701 | 616 | 709 | 750 | 790 | 12.7 | % | ||||||||||||||||||||||||||||||||||||||||||||||||||||
| Withdrawals | (1,113) | (981) | (1,168) | (1,233) | (1,203) | -8.1 | % | ||||||||||||||||||||||||||||||||||||||||||||||||||||
| Net flows | (412) | (365) | (459) | (483) | (413) | -0.2 | % | ||||||||||||||||||||||||||||||||||||||||||||||||||||
| Transfers between fixed and variable accounts | 103 | (363) | (38) | 2 | 50 | -51.5 | % | ||||||||||||||||||||||||||||||||||||||||||||||||||||
| Policyholder assessments | (3) | (3) | (3) | (3) | (3) | 0.0% | |||||||||||||||||||||||||||||||||||||||||||||||||||||
| Reinvested interest credited | 168 | 167 | 169 | 169 | 168 | 0.0% | |||||||||||||||||||||||||||||||||||||||||||||||||||||
| Balance as of end-of-period | $ | 24,994 | $ | 24,430 | $ | 24,099 | $ | 23,784 | $ | 23,586 | -5.6 | % | |||||||||||||||||||||||||||||||||||||||||||||||
| Separate Account and Mutual Funds | |||||||||||||||||||||||||||||||||||||||||||||||||||||||||||
| Balance as of beginning-of-period | $ | 63,592 | $ | 67,985 | $ | 72,156 | $ | 69,834 | $ | 77,201 | 21.4 | % | |||||||||||||||||||||||||||||||||||||||||||||||
| Gross deposits | 2,508 | 2,281 | 1,991 | 2,222 | 3,012 | 20.1 | % | ||||||||||||||||||||||||||||||||||||||||||||||||||||
| Withdrawals | (1,561) | (1,715) | (1,804) | (2,071) | (2,208) | -41.4 | % | ||||||||||||||||||||||||||||||||||||||||||||||||||||
| Net flows | 947 | 566 | 187 | 151 | 804 | -15.1 | % | ||||||||||||||||||||||||||||||||||||||||||||||||||||
| Transfers between fixed and variable accounts | (104) | 370 | 42 | (10) | (34) | 67.3 | % | ||||||||||||||||||||||||||||||||||||||||||||||||||||
| Policyholder assessments | (58) | (60) | (62) | (62) | (64) | -10.3 | % | ||||||||||||||||||||||||||||||||||||||||||||||||||||
| Change in market value and reinvestment | 3,608 | 3,295 | (2,489) | 7,288 | 5,319 | 47.4 | % | ||||||||||||||||||||||||||||||||||||||||||||||||||||
| Balance as of end-of-period | $ | 67,985 | $ | 72,156 | $ | 69,834 | $ | 77,201 | $ | 83,226 | 22.4 | % | |||||||||||||||||||||||||||||||||||||||||||||||
| Total | |||||||||||||||||||||||||||||||||||||||||||||||||||||||||||
| Balance as of beginning-of-period | $ | 88,730 | $ | 92,979 | $ | 96,586 | $ | 93,933 | $ | 100,985 | 13.8 | % | |||||||||||||||||||||||||||||||||||||||||||||||
| Gross deposits | 3,209 | 2,897 | 2,700 | 2,972 | 3,802 | 18.5 | % | ||||||||||||||||||||||||||||||||||||||||||||||||||||
| Withdrawals | (2,674) | (2,696) | (2,972) | (3,304) | (3,411) | -27.6 | % | ||||||||||||||||||||||||||||||||||||||||||||||||||||
| Net flows | 535 | 201 | (272) | (332) | 391 | -26.9 | % | ||||||||||||||||||||||||||||||||||||||||||||||||||||
| Transfers between fixed and variable accounts | (1) | 7 | 4 | (8) | 16 | NM | |||||||||||||||||||||||||||||||||||||||||||||||||||||
| Policyholder assessments | (61) | (63) | (65) | (65) | (67) | -9.8 | % | ||||||||||||||||||||||||||||||||||||||||||||||||||||
| Change in market value and reinvestment | 3,776 | 3,462 | (2,320) | 7,457 | 5,487 | 45.3 | % | ||||||||||||||||||||||||||||||||||||||||||||||||||||
| Balance as of end-of-period | $ | 92,979 | $ | 96,586 | $ | 93,933 | $ | 100,985 | $ | 106,812 | 14.9 | % | |||||||||||||||||||||||||||||||||||||||||||||||
Page 19

| Lincoln Financial Group | |||||||||||||||||||||||||||||||||||||||||||||||||||||||||||
| Fixed-Income Asset Class | |||||||||||||||||||||||||||||||||||||||||||||||||||||||||||
| Unaudited (millions of dollars) | |||||||||||||||||||||||||||||||||||||||||||||||||||||||||||
| As of 3/31/2023 | As of 12/31/2023 | As of 3/31/2024 | |||||||||||||||||||||||||||||||||||||||||||||||||||||||||
| Amount | % | Amount | % | Amount | % | ||||||||||||||||||||||||||||||||||||||||||||||||||||||
| Fixed Maturity AFS Securities, Net of Modified Coinsurance and Funds Withheld | |||||||||||||||||||||||||||||||||||||||||||||||||||||||||||
Investments and Allowance for Credit Losses, at Amortized Cost (1) | |||||||||||||||||||||||||||||||||||||||||||||||||||||||||||
| Industry corporate bonds: | |||||||||||||||||||||||||||||||||||||||||||||||||||||||||||
| Financial services | $ | 17,548 | 15.8 | % | $ | 13,510 | 15.2 | % | $ | 12,695 | 14.9 | % | |||||||||||||||||||||||||||||||||||||||||||||||
| Basic industry | 4,187 | 3.8 | % | 2,986 | 3.3 | % | 2,870 | 3.4 | % | ||||||||||||||||||||||||||||||||||||||||||||||||||
| Capital goods | 7,205 | 6.5 | % | 5,569 | 6.2 | % | 5,364 | 6.3 | % | ||||||||||||||||||||||||||||||||||||||||||||||||||
| Communications | 4,233 | 3.8 | % | 3,110 | 3.5 | % | 2,827 | 3.3 | % | ||||||||||||||||||||||||||||||||||||||||||||||||||
| Consumer cyclical | 5,804 | 5.2 | % | 5,268 | 5.8 | % | 5,240 | 6.1 | % | ||||||||||||||||||||||||||||||||||||||||||||||||||
| Consumer non-cyclical | 16,886 | 15.2 | % | 13,458 | 15.1 | % | 12,613 | 14.8 | % | ||||||||||||||||||||||||||||||||||||||||||||||||||
| Energy | 4,719 | 4.3 | % | 2,776 | 3.1 | % | 2,569 | 3.0 | % | ||||||||||||||||||||||||||||||||||||||||||||||||||
| Technology | 5,687 | 5.1 | % | 4,376 | 4.9 | % | 4,124 | 4.8 | % | ||||||||||||||||||||||||||||||||||||||||||||||||||
| Transportation | 3,600 | 3.2 | % | 3,233 | 3.6 | % | 3,092 | 3.6 | % | ||||||||||||||||||||||||||||||||||||||||||||||||||
| Industrial other | 2,338 | 2.1 | % | 2,107 | 2.4 | % | 2,068 | 2.4 | % | ||||||||||||||||||||||||||||||||||||||||||||||||||
| Utilities | 14,246 | 12.8 | % | 11,613 | 13.0 | % | 11,099 | 13.0 | % | ||||||||||||||||||||||||||||||||||||||||||||||||||
| Government-related entities | 1,807 | 1.6 | % | 1,278 | 1.4 | % | 1,204 | 1.4 | % | ||||||||||||||||||||||||||||||||||||||||||||||||||
| Residential mortgage-backed securities ("RMBS") | |||||||||||||||||||||||||||||||||||||||||||||||||||||||||||
| Agency backed | 1,851 | 1.7 | % | 1,505 | 1.7 | % | 1,468 | 1.7 | % | ||||||||||||||||||||||||||||||||||||||||||||||||||
| Non-agency backed | 363 | 0.3 | % | 332 | 0.4 | % | 318 | 0.3 | % | ||||||||||||||||||||||||||||||||||||||||||||||||||
| Commercial mortgage-backed securities ("CMBS") | 1,905 | 1.7 | % | 1,546 | 1.7 | % | 1,557 | 1.8 | % | ||||||||||||||||||||||||||||||||||||||||||||||||||
| Asset-backed securities ("ABS") | |||||||||||||||||||||||||||||||||||||||||||||||||||||||||||
| Collateralized loan obligations ("CLOs") | 8,690 | 7.8 | % | 8,325 | 9.3 | % | 8,163 | 9.5 | % | ||||||||||||||||||||||||||||||||||||||||||||||||||
| Other ABS | 3,455 | 3.1 | % | 4,220 | 4.7 | % | 4,444 | 5.2 | % | ||||||||||||||||||||||||||||||||||||||||||||||||||
| Municipals | 5,386 | 4.8 | % | 2,973 | 3.3 | % | 2,777 | 3.2 | % | ||||||||||||||||||||||||||||||||||||||||||||||||||
| United States and foreign government | 733 | 0.9 | % | 731 | 1.1 | % | 724 | 1.0 | % | ||||||||||||||||||||||||||||||||||||||||||||||||||
| Hybrid & redeemable preferred securities | 362 | 0.3 | % | 237 | 0.3 | % | 226 | 0.3 | % | ||||||||||||||||||||||||||||||||||||||||||||||||||
| Total fixed maturity AFS securities, net of modified coinsurance and funds withheld | |||||||||||||||||||||||||||||||||||||||||||||||||||||||||||
| investments and allowance for credit losses, at amortized cost | 111,005 | 100.0 | % | 89,153 | 100.0 | % | 85,442 | 100.0 | % | ||||||||||||||||||||||||||||||||||||||||||||||||||
| Trading Securities, Net of Modified Coinsurance and Funds Withheld Investments | 530 | 626 | 540 | ||||||||||||||||||||||||||||||||||||||||||||||||||||||||
| Equity Securities, Net of Modified Coinsurance and Funds Withheld Investments | 313 | 275 | 277 | ||||||||||||||||||||||||||||||||||||||||||||||||||||||||
| Total fixed maturity AFS, trading and equity securities, net of modified coinsurance and funds | |||||||||||||||||||||||||||||||||||||||||||||||||||||||||||
| withheld investments and allowance for credit losses, at amortized cost | 111,848 | 90,054 | 86,259 | ||||||||||||||||||||||||||||||||||||||||||||||||||||||||
| Modified coinsurance and funds withheld investments | 3,570 | 10,215 | 13,988 | ||||||||||||||||||||||||||||||||||||||||||||||||||||||||
| Total fixed maturity AFS, trading and equity securities | $ | 115,418 | $ | 100,269 | $ | 100,247 | |||||||||||||||||||||||||||||||||||||||||||||||||||||
(1) Net investment income and net gains (losses) related to assets held by us to support certain modified coinsurance and funds withheld agreements are included in periodic payments to | |||||||||||||||||||||||||||||||||||||||||||||||||||||||||||
| or from the reinsurers, resulting in the economic benefits of these assets flowing to the reinsurers. Accordingly, these assets have been excluded from summaries provided on page 20 | |||||||||||||||||||||||||||||||||||||||||||||||||||||||||||
| and page 21 as we have a limited economic interest in the assets. | |||||||||||||||||||||||||||||||||||||||||||||||||||||||||||
Page 20
| Lincoln Financial Group | |||||||||||||||||||||||||||||||||||||||||||||||||||||||||||
| Fixed-Income Credit Quality | |||||||||||||||||||||||||||||||||||||||||||||||||||||||||||
| Unaudited (millions of dollars) | |||||||||||||||||||||||||||||||||||||||||||||||||||||||||||
| As of 3/31/2023 | As of 12/31/2023 | As of 3/31/2024 | |||||||||||||||||||||||||||||||||||||||||||||||||||||||||
| Amount | % | Amount | % | Amount | % | ||||||||||||||||||||||||||||||||||||||||||||||||||||||
| Fixed Maturity AFS Securities, Net of Modified Coinsurance and Funds Withheld Investments | |||||||||||||||||||||||||||||||||||||||||||||||||||||||||||
and Allowance for Credit Losses, at Amortized Cost (1) | |||||||||||||||||||||||||||||||||||||||||||||||||||||||||||
| NAIC 1 (AAA-A) | $ | 63,965 | 57.6 | % | $ | 51,732 | 58.0 | % | $ | 50,246 | 58.5 | % | |||||||||||||||||||||||||||||||||||||||||||||||
| NAIC 2 (BBB) | 43,464 | 39.2 | % | 34,472 | 38.7 | % | 32,866 | 38.3 | % | ||||||||||||||||||||||||||||||||||||||||||||||||||
| Total investment grade | 107,429 | 96.8 | % | 86,204 | 96.7 | % | 83,112 | 96.8 | % | ||||||||||||||||||||||||||||||||||||||||||||||||||
| NAIC 3 (BB) | 1,895 | 1.7 | % | 1,090 | 1.2 | % | 1,028 | 1.2 | % | ||||||||||||||||||||||||||||||||||||||||||||||||||
| NAIC 4 (B) | 1,591 | 1.4 | % | 1,760 | 2.0 | % | 1,667 | 1.9 | % | ||||||||||||||||||||||||||||||||||||||||||||||||||
| NAIC 5 (CCC and lower) | 69 | 0.1 | % | 86 | 0.1 | % | 67 | 0.1 | % | ||||||||||||||||||||||||||||||||||||||||||||||||||
| NAIC 6 (in or near default) | 20 | 0.0 | % | 2 | 0.0 | % | 3 | 0.0 | % | ||||||||||||||||||||||||||||||||||||||||||||||||||
| Total below investment grade | 3,575 | 3.2 | % | 2,938 | 3.3 | % | 2,765 | 3.2 | % | ||||||||||||||||||||||||||||||||||||||||||||||||||
| Total | $ | 111,004 | 100.0 | % | $ | 89,142 | 100.0 | % | $ | 85,877 | 100.0 | % | |||||||||||||||||||||||||||||||||||||||||||||||
| Commercial Mortgage Loans, Net of Modified Coinsurance and Funds Withheld Investments, | |||||||||||||||||||||||||||||||||||||||||||||||||||||||||||
at Amortized Cost (1)(2) | |||||||||||||||||||||||||||||||||||||||||||||||||||||||||||
| CM1 (AAA-A) | $ | 13,148 | 79.7 | % | $ | 13,687 | 80.4 | % | $ | 13,559 | 79.1 | % | |||||||||||||||||||||||||||||||||||||||||||||||
| CM2 (BBB) | 3,283 | 19.9 | % | 3,248 | 19.1 | % | 3,538 | 20.6 | % | ||||||||||||||||||||||||||||||||||||||||||||||||||
| CM3-7 (BB and lower) | 73 | 0.4 | % | 84 | 0.5 | % | 43 | 0.3 | % | ||||||||||||||||||||||||||||||||||||||||||||||||||
| Total | $ | 16,504 | 100.0 | % | $ | 17,019 | 100.0 | % | $ | 17,140 | 100.0 | % | |||||||||||||||||||||||||||||||||||||||||||||||
| Total Fixed Maturity AFS Securities and Commercial Mortgage Loans, Net of Modified | |||||||||||||||||||||||||||||||||||||||||||||||||||||||||||
Coinsurance and Funds Withheld Investments, at Amortized Cost (1)(2) | |||||||||||||||||||||||||||||||||||||||||||||||||||||||||||
| AAA-A | $ | 77,113 | 60.3 | % | $ | 65,419 | 61.6 | % | $ | 63,805 | 61.9 | % | |||||||||||||||||||||||||||||||||||||||||||||||
| BBB | 46,747 | 36.7 | % | 37,720 | 35.5 | % | 36,404 | 35.3 | % | ||||||||||||||||||||||||||||||||||||||||||||||||||
| BB and lower | 3,648 | 3.0 | % | 3,022 | 2.9 | % | 2,808 | 2.8 | % | ||||||||||||||||||||||||||||||||||||||||||||||||||
| Total | $ | 127,508 | 100.0 | % | $ | 106,161 | 100.0 | % | $ | 103,017 | 100.0 | % | |||||||||||||||||||||||||||||||||||||||||||||||
(1) Ratings are based upon the designations determined and provided by the National Association of Insurance Commissioners (“NAIC”) or based upon ratings from credit rating | |||||||||||||||||||||||||||||||||||||||||||||||||||||||||||
| agencies to derive the NAIC designation. | |||||||||||||||||||||||||||||||||||||||||||||||||||||||||||
(2) CM ratings reflect the risk-based capital risk category for commercial mortgage loans. Letter ratings are assumed NAIC equivalent ratings where NAIC 1 = CM1, NAIC 2 = CM2 | |||||||||||||||||||||||||||||||||||||||||||||||||||||||||||
| and NAIC 3-6 = CM3-7. | |||||||||||||||||||||||||||||||||||||||||||||||||||||||||||
Page 21

| Lincoln Financial Group | |||||||||||||||||||||||||||||||||||||||||||||||||||||||||||
| Select GAAP to Non-GAAP Reconciliations | |||||||||||||||||||||||||||||||||||||||||||||||||||||||||||
| Unaudited (millions of dollars) | |||||||||||||||||||||||||||||||||||||||||||||||||||||||||||
| For the Three Months Ended | |||||||||||||||||||||||||||||||||||||||||||||||||||||||||||
| 3/31/23 | 6/30/23 | 9/30/23 | 12/31/23 | 3/31/24 | Change | ||||||||||||||||||||||||||||||||||||||||||||||||||||||
| Net Income | |||||||||||||||||||||||||||||||||||||||||||||||||||||||||||
| Net income (loss) available to common stockholders – diluted | $ | (909) | $ | 502 | $ | 819 | $ | (1,246) | $ | 1,191 | 231.0 | % | |||||||||||||||||||||||||||||||||||||||||||||||
| Less: | |||||||||||||||||||||||||||||||||||||||||||||||||||||||||||
| Preferred stock dividends declared | (25) | (11) | (34) | (11) | (34) | -36.0 | % | ||||||||||||||||||||||||||||||||||||||||||||||||||||
| Adjustment for deferred units of LNC stock | |||||||||||||||||||||||||||||||||||||||||||||||||||||||||||
| in our deferred compensation plans | (3) | 2 | — | — | 3 | 200.0 | % | ||||||||||||||||||||||||||||||||||||||||||||||||||||
| Net income (loss) | (881) | 511 | 853 | (1,235) | 1,222 | 238.7 | % | ||||||||||||||||||||||||||||||||||||||||||||||||||||
| Less: | |||||||||||||||||||||||||||||||||||||||||||||||||||||||||||
| Net annuity product features, after-tax | (1,018) | 822 | 1,045 | (797) | 1,141 | 212.1 | % | ||||||||||||||||||||||||||||||||||||||||||||||||||||
| Net life insurance product features, after-tax | (95) | (123) | 85 | (178) | (103) | -8.4 | % | ||||||||||||||||||||||||||||||||||||||||||||||||||||
| Credit loss-related adjustments, after-tax | (18) | (3) | (21) | (21) | (1) | 94.4 | % | ||||||||||||||||||||||||||||||||||||||||||||||||||||
| Investment gains (losses), after-tax | (45) | (528) | (306) | 136 | (65) | -44.4 | % | ||||||||||||||||||||||||||||||||||||||||||||||||||||
| Changes in the fair value of reinsurance-related | |||||||||||||||||||||||||||||||||||||||||||||||||||||||||||
| embedded derivatives, trading securities and certain | |||||||||||||||||||||||||||||||||||||||||||||||||||||||||||
mortgage loans, after-tax (1) | 7 | (4) | (23) | (613) | 153 | NM | |||||||||||||||||||||||||||||||||||||||||||||||||||||
| Transaction and integration costs related to mergers, | |||||||||||||||||||||||||||||||||||||||||||||||||||||||||||
acquisitions and divestitures, after-tax (2) | — | (7) | — | (20) | (8) | NM | |||||||||||||||||||||||||||||||||||||||||||||||||||||
| Total adjustments | (1,169) | 157 | 780 | (1,493) | 1,117 | 195.6 | % | ||||||||||||||||||||||||||||||||||||||||||||||||||||
| Adjusted income (loss) from operations | 288 | 354 | 73 | 258 | 105 | -63.5 | % | ||||||||||||||||||||||||||||||||||||||||||||||||||||
| Add: | |||||||||||||||||||||||||||||||||||||||||||||||||||||||||||
| Preferred stock dividends declared | (25) | (11) | (34) | (11) | (34) | -36.0 | % | ||||||||||||||||||||||||||||||||||||||||||||||||||||
| Adjustment for deferred units of LNC stock | |||||||||||||||||||||||||||||||||||||||||||||||||||||||||||
| in our deferred compensation plans | (3) | — | — | (1) | — | 100.0 | % | ||||||||||||||||||||||||||||||||||||||||||||||||||||
| Adjusted income (loss) from operations available to | |||||||||||||||||||||||||||||||||||||||||||||||||||||||||||
| common stockholders | $ | 260 | $ | 343 | $ | 39 | $ | 246 | $ | 71 | -72.7 | % | |||||||||||||||||||||||||||||||||||||||||||||||
(1) Includes primarily changes in the fair value of the embedded derivative related to the fourth quarter 2023 reinsurance transaction. | |||||||||||||||||||||||||||||||||||||||||||||||||||||||||||
(2) Includes costs pertaining to the planned sale of our wealth management business and the fourth quarter 2023 reinsurance transaction. | |||||||||||||||||||||||||||||||||||||||||||||||||||||||||||
Page 22
| Lincoln Financial Group | |||||||||||||||||||||||||||||||||||||||||||||||||||||||||||
| Select GAAP to Non-GAAP Reconciliations | |||||||||||||||||||||||||||||||||||||||||||||||||||||||||||
| Unaudited (millions of dollars, except per share data) | |||||||||||||||||||||||||||||||||||||||||||||||||||||||||||
| For the Three Months Ended | |||||||||||||||||||||||||||||||||||||||||||||||||||||||||||
| 3/31/23 | 6/30/23 | 9/30/23 | 12/31/23 | 3/31/24 | Change | ||||||||||||||||||||||||||||||||||||||||||||||||||||||
| Revenues | |||||||||||||||||||||||||||||||||||||||||||||||||||||||||||
| Total revenues | $ | 3,814 | $ | 2,929 | $ | 4,203 | $ | 700 | $ | 4,116 | 7.9 | % | |||||||||||||||||||||||||||||||||||||||||||||||
| Less: | |||||||||||||||||||||||||||||||||||||||||||||||||||||||||||
| Revenue adjustments from annuity | |||||||||||||||||||||||||||||||||||||||||||||||||||||||||||
| and life insurance product features | (773) | (1,123) | (14) | (631) | (580) | 25.0 | % | ||||||||||||||||||||||||||||||||||||||||||||||||||||
| Credit loss-related adjustments | (22) | (5) | (27) | (27) | (1) | 95.5 | % | ||||||||||||||||||||||||||||||||||||||||||||||||||||
| Investment gains (losses) | (57) | (668) | (400) | 167 | (81) | -42.1 | % | ||||||||||||||||||||||||||||||||||||||||||||||||||||
| Changes in the fair value of reinsurance-related | |||||||||||||||||||||||||||||||||||||||||||||||||||||||||||
| embedded derivatives, trading securities and certain | |||||||||||||||||||||||||||||||||||||||||||||||||||||||||||
| mortgage loans | 9 | (5) | (29) | (776) | 194 | NM | |||||||||||||||||||||||||||||||||||||||||||||||||||||
| Adjusted operating revenues | $ | 4,657 | $ | 4,730 | $ | 4,673 | $ | 1,967 | $ | 4,584 | -1.6 | % | |||||||||||||||||||||||||||||||||||||||||||||||
| Earnings (Loss) Per Common Share – Diluted | |||||||||||||||||||||||||||||||||||||||||||||||||||||||||||
| Net income (loss) | $ | (5.37) | $ | 2.94 | $ | 4.79 | $ | (7.35) | $ | 6.93 | 229.1 | % | |||||||||||||||||||||||||||||||||||||||||||||||
| Less: | |||||||||||||||||||||||||||||||||||||||||||||||||||||||||||
| Net annuity product features, after-tax | (6.03) | 4.84 | 6.11 | (4.71) | 6.64 | 210.1 | % | ||||||||||||||||||||||||||||||||||||||||||||||||||||
| Net life insurance product features, after-tax | (0.56) | (0.73) | 0.50 | (1.06) | (0.60) | -7.1 | % | ||||||||||||||||||||||||||||||||||||||||||||||||||||
| Credit loss-related adjustments, after-tax | (0.10) | (0.02) | (0.12) | (0.12) | — | 100.0 | % | ||||||||||||||||||||||||||||||||||||||||||||||||||||
| Investment gains (losses), after-tax | (0.26) | (3.11) | (1.79) | 0.80 | (0.38) | -46.2 | % | ||||||||||||||||||||||||||||||||||||||||||||||||||||
| Changes in the fair value of reinsurance-related | |||||||||||||||||||||||||||||||||||||||||||||||||||||||||||
| embedded derivatives, trading securities and certain | |||||||||||||||||||||||||||||||||||||||||||||||||||||||||||
| mortgage loans, after-tax | 0.04 | (0.02) | (0.14) | (3.61) | 0.89 | NM | |||||||||||||||||||||||||||||||||||||||||||||||||||||
| Transaction and integration costs related to | |||||||||||||||||||||||||||||||||||||||||||||||||||||||||||
| mergers, acquisitions and divestitures, after-tax | — | (0.04) | — | (0.12) | (0.05) | NM | |||||||||||||||||||||||||||||||||||||||||||||||||||||
| Adjustment attributable to using different average | |||||||||||||||||||||||||||||||||||||||||||||||||||||||||||
| diluted shares for adjusted income (loss) from | |||||||||||||||||||||||||||||||||||||||||||||||||||||||||||
operations as compared to net income (loss) (1) | 0.02 | — | — | 0.02 | 0.02 | NM | |||||||||||||||||||||||||||||||||||||||||||||||||||||
| Adjusted income (loss) from operations | $ | 1.52 | $ | 2.02 | $ | 0.23 | $ | 1.45 | $ | 0.41 | -73.0 | % | |||||||||||||||||||||||||||||||||||||||||||||||
(1) In periods where net income (loss) or adjusted income (loss) from operations is presented, basic shares are used in the diluted EPS and adjusted diluted EPS calculations, as the use of | |||||||||||||||||||||||||||||||||||||||||||||||||||||||||||
| diluted shares would result in a lower loss per share. Due to reporting adjusted income (loss) from operations per common share on a different share basis than net income (loss) per | |||||||||||||||||||||||||||||||||||||||||||||||||||||||||||
| common share, we have included an adjustment to reconcile the two metrics. | |||||||||||||||||||||||||||||||||||||||||||||||||||||||||||
Page 23
| Lincoln Financial Group | |||||||||||||||||||||||||||||||||||||||||||||||||||||||||||
| Select GAAP to Non-GAAP Reconciliations | |||||||||||||||||||||||||||||||||||||||||||||||||||||||||||
| Unaudited (millions of dollars, except per share data) | |||||||||||||||||||||||||||||||||||||||||||||||||||||||||||
| For the Three Months Ended | |||||||||||||||||||||||||||||||||||||||||||||||||||||||||||
| 3/31/23 | 6/30/23 | 9/30/23 | 12/31/23 | 3/31/24 | Change | ||||||||||||||||||||||||||||||||||||||||||||||||||||||
| Stockholders’ Equity, End-of-Period | |||||||||||||||||||||||||||||||||||||||||||||||||||||||||||
| Stockholders' equity | $ | 6,732 | $ | 5,819 | $ | 3,199 | $ | 6,893 | $ | 7,546 | 12.1 | % | |||||||||||||||||||||||||||||||||||||||||||||||
| Less: | |||||||||||||||||||||||||||||||||||||||||||||||||||||||||||
| Preferred stock | 986 | 986 | 986 | 986 | 986 | 0.0% | |||||||||||||||||||||||||||||||||||||||||||||||||||||
| AOCI | (3,754) | (5,104) | (8,480) | (3,476) | (3,951) | -5.2 | % | ||||||||||||||||||||||||||||||||||||||||||||||||||||
| Stockholders’ equity, excluding AOCI and preferred | |||||||||||||||||||||||||||||||||||||||||||||||||||||||||||
| stock | 9,500 | 9,937 | 10,693 | 9,383 | 10,511 | 10.6 | % | ||||||||||||||||||||||||||||||||||||||||||||||||||||
| MRB-related impacts | (1,158) | 426 | 1,545 | 1,083 | 2,575 | NM | |||||||||||||||||||||||||||||||||||||||||||||||||||||
| GLB and GDB hedge instruments gains (losses) | (539) | (1,407) | (1,630) | (2,085) | (2,675) | NM | |||||||||||||||||||||||||||||||||||||||||||||||||||||
Reinsurance-related embedded derivatives and portfolio gains (losses) (1) | NM | NM | NM | (638) | (476) | ||||||||||||||||||||||||||||||||||||||||||||||||||||||
Adjusted stockholders' equity (1) | $ | 11,197 | $ | 10,918 | $ | 10,778 | $ | 11,023 | $ | 11,087 | -1.0 | % | |||||||||||||||||||||||||||||||||||||||||||||||
| Stockholders’ Equity, Average | |||||||||||||||||||||||||||||||||||||||||||||||||||||||||||
| Stockholders' equity | $ | 5,917 | $ | 6,276 | $ | 4,509 | $ | 5,046 | $ | 7,219 | 22.0 | % | |||||||||||||||||||||||||||||||||||||||||||||||
| Less: | |||||||||||||||||||||||||||||||||||||||||||||||||||||||||||
| Preferred stock | 986 | 986 | 986 | 986 | 986 | 0.0% | |||||||||||||||||||||||||||||||||||||||||||||||||||||
| AOCI | (5,053) | (4,429) | (6,792) | (5,979) | (3,714) | 26.5 | % | ||||||||||||||||||||||||||||||||||||||||||||||||||||
| Stockholders’ equity, excluding AOCI and preferred | |||||||||||||||||||||||||||||||||||||||||||||||||||||||||||
| stock | 9,984 | 9,719 | 10,315 | 10,038 | 9,947 | -0.4 | % | ||||||||||||||||||||||||||||||||||||||||||||||||||||
| MRB-related impacts | (905) | (366) | 986 | 1,314 | 1,829 | NM | |||||||||||||||||||||||||||||||||||||||||||||||||||||
| GLB and GDB hedge instruments gains (losses) | (269) | (973) | (1,519) | (1,857) | (2,380) | NM | |||||||||||||||||||||||||||||||||||||||||||||||||||||
Reinsurance-related embedded derivatives and portfolio gains (losses) (1) | NM | NM | NM | (318) | (557) | ||||||||||||||||||||||||||||||||||||||||||||||||||||||
Adjusted average stockholders' equity (1) | $ | 11,158 | $ | 11,058 | $ | 10,848 | $ | 10,900 | $ | 11,055 | -0.9 | % | |||||||||||||||||||||||||||||||||||||||||||||||
| Book Value Per Common Share | |||||||||||||||||||||||||||||||||||||||||||||||||||||||||||
| Book value per share | $ | 33.89 | $ | 28.49 | $ | 13.04 | $ | 34.81 | $ | 38.46 | 13.5 | % | |||||||||||||||||||||||||||||||||||||||||||||||
| Less: | |||||||||||||||||||||||||||||||||||||||||||||||||||||||||||
| AOCI | (22.15) | (30.09) | (49.99) | (20.49) | (23.17) | -4.6 | % | ||||||||||||||||||||||||||||||||||||||||||||||||||||
| Book value per share, excluding AOCI | 56.04 | 58.58 | 63.03 | 55.30 | 61.63 | 10.0 | % | ||||||||||||||||||||||||||||||||||||||||||||||||||||
| Less: | |||||||||||||||||||||||||||||||||||||||||||||||||||||||||||
| MRB-related gains (losses) | (6.83) | 2.51 | 9.11 | 6.38 | 15.10 | NM | |||||||||||||||||||||||||||||||||||||||||||||||||||||
| GLB and GDB hedge instruments gains (losses) | (3.18) | (8.30) | (9.61) | (12.29) | (15.69) | NM | |||||||||||||||||||||||||||||||||||||||||||||||||||||
Reinsurance-related embedded derivatives and portfolio gains (losses) (1) | NM | NM | NM | (3.76) | (2.79) | ||||||||||||||||||||||||||||||||||||||||||||||||||||||
Adjusted book value per share (1) | $ | 66.05 | $ | 64.37 | $ | 63.53 | $ | 64.97 | $ | 65.01 | -1.6 | % | |||||||||||||||||||||||||||||||||||||||||||||||
(1) This measure has been updated, effective beginning with the fourth quarter of 2023, to exclude reinsurance-related embedded derivatives and the underlying portfolio | |||||||||||||||||||||||||||||||||||||||||||||||||||||||||||
| gains (losses), given the size of the impact of the fourth quarter 2023 reinsurance transaction. Such amounts in the prior periods presented, and the impact of this change to | |||||||||||||||||||||||||||||||||||||||||||||||||||||||||||
| such prior periods, were not meaningful (“NM”). | |||||||||||||||||||||||||||||||||||||||||||||||||||||||||||
Page 24
©2024 Lincoln National Corporation May 2, 2024 First Quarter 2024 Earnings Supplement
This slide has no elements that change color 2©2024 Lincoln National Corporation Certain statements made in this presentation and in other written or oral statements made by Lincoln or on Lincoln’s behalf are “forward-looking statements” within the meaning of the Private Securities Litigation Reform Act of 1995 (“PSLRA”). A forward-looking statement is a statement that is not a historical fact and, without limitation, includes any statement that may predict, forecast, indicate or imply future results, performance or achievements. Forward-looking statements may contain words like: “anticipate,” “believe,” “estimate,” “expect,” “project,” “shall,” “will” and other words or phrases with similar meaning in connection with a discussion of future operating or financial performance. In particular, these include statements relating to future actions, trends in Lincoln’s businesses, prospective services or products, future performance or financial results and the outcome of contingencies, such as legal proceedings. Lincoln claims the protection afforded by the safe harbor for forward-looking statements provided by the PSLRA. Forward-looking statements are subject to risks and uncertainties. Actual results could differ materially from those expressed in or implied by such forward-looking statements due to a variety of factors, including: • Weak general economic and business conditions that may affect demand for our products, account balances, investment results, guaranteed benefit liabilities, premium levels and claims experience; • Adverse global capital and credit market conditions that may affect our ability to raise capital, if necessary, and may cause us to realize impairments on investments and certain intangible assets, including goodwill and the valuation allowance against deferred tax assets, which may reduce future earnings and/or affect our financial condition and ability to raise additional capital or refinance existing debt as it matures; • The inability of our subsidiaries to pay dividends to the holding company in sufficient amounts, which could harm the holding company’s ability to meet its obligations; • Legislative, regulatory or tax changes, both domestic and foreign, that affect: the cost of, or demand for, our subsidiaries’ products; the required amount of reserves and/or surplus; our ability to conduct business and our captive reinsurance arrangements as well as restrictions on the payment of revenue sharing and 12b-1 distribution fees; • The impact of U.S. federal tax reform legislation on our business, earnings and capital; • The impact of regulations adopted by the Securities and Exchange Commission (“SEC”), the Department of Labor or other federal or state regulators or self-regulatory organizations that could adversely affect our distribution model and sales of our products and result in additional disclosure and other requirements related to the sale and delivery of our products; • The impact of new and emerging rules, laws and regulations relating to privacy, cybersecurity and artificial intelligence that may lead to increased compliance costs, reputation risk and/or changes in business practices; • Increasing scrutiny and evolving expectations and regulations regarding ESG matters that may adversely affect our reputation and our investment portfolio; • Actions taken by reinsurers to raise rates on in-force business; • Declines in or sustained low interest rates causing a reduction in investment income, the interest margins of our businesses and demand for our products; • Rapidly increasing or sustained high interest rates that may negatively affect our profitability, value of our investment portfolio and capital position and may cause policyholders to surrender annuity and life insurance policies, thereby causing realized investment losses; • The impact of the implementation of the provisions of the European Market Infrastructure Regulation relating to the regulation of derivatives transactions; • The initiation of legal or regulatory proceedings against us, and the outcome of any legal or regulatory proceedings, such as: adverse actions related to present or past business practices common in businesses in which we compete; adverse decisions in significant actions including, but not limited to, actions brought by federal and state authorities and class action cases; new decisions that result in changes in law; and unexpected trial court rulings; • A decline or continued volatility in the equity markets causing a reduction in the sales of our subsidiaries’ products; a reduction of asset-based fees that our subsidiaries charge on various investment and insurance products; and an increase in liabilities related to guaranteed benefit riders, which are accounted for as market risk benefits, of our subsidiaries’ variable annuity products; • Ineffectiveness of our risk management policies and procedures, including our various hedging strategies; • A deviation in actual experience regarding future policyholder behavior, mortality, morbidity, interest rates or equity market returns from the assumptions used in pricing our subsidiaries’ products and in establishing related insurance reserves, which may reduce future earnings; • Changes in accounting principles that may affect our consolidated financial statements; • Lowering of one or more of our debt ratings issued by nationally recognized statistical rating organizations and the adverse effect such action may have on our ability to raise capital and on our liquidity and financial condition; • Lowering of one or more of the insurer financial strength ratings of our insurance subsidiaries and the adverse effect such action may have on the premium writings, policy retention, profitability of our insurance subsidiaries and liquidity; • Significant credit, accounting, fraud, corporate governance or other issues that may adversely affect the value of certain financial assets, as well as counterparties to which we are exposed to credit risk, requiring that we realize losses on financial assets; • Interruption in telecommunication, information technology or other operational systems or failure to safeguard the confidentiality or privacy of sensitive data on such systems, including from cyberattacks or other breaches of our data security systems; • The effect of acquisitions and divestitures, including the inability to realize the anticipated benefits of acquisitions and dispositions of businesses and potential operating difficulties and unforeseen liabilities relating thereto, as well as the effect of restructurings, product withdrawals and other unusual items; • The inability to realize or sustain the benefits we expect from, greater than expected investments in, and the potential impact of efforts related to, our strategic initiatives; • The adequacy and collectability of reinsurance that we have obtained; • Pandemics, acts of terrorism, war or other man-made and natural catastrophes that may adversely impact liabilities for policyholder claims, affect our businesses and increase the cost and availability of reinsurance; • Competitive conditions, including pricing pressures, new product offerings and the emergence of new competitors, that may affect the level of premiums and fees that our subsidiaries can charge for their products; • The unknown effect on our subsidiaries’ businesses resulting from evolving market preferences and the changing demographics of our client base; and • The unanticipated loss of key management, financial planners or wholesalers. • The risks and uncertainties included here are not exhaustive. Our most recent Form 10-K, as well as other reports that we file with the SEC, include additional factors that could affect our businesses and financial performance. Moreover, we operate in a rapidly changing and competitive environment. New risk factors emerge from time to time, and it is not possible for management to predict all such risk factors. • Further, it is not possible to assess the effect of all risk factors on our businesses or the extent to which any factor, or combination of factors, may cause actual results to differ materially from those contained in any forward-looking statements. Given these risks and uncertainties, investors should not place undue reliance on forward-looking statements as a prediction of actual results. In addition, Lincoln disclaims any obligation to correct or update any forward-looking statements to reflect events or circumstances that occur after the date of this presentation. The reporting of Risk-Based Capital (“RBC”) measures is not intended for the purpose of ranking any insurance company or for use in connection with any marketing, advertising or promotional activities. FORWARD-LOOKING STATEMENTS – CAUTIONARY LANGUAGE
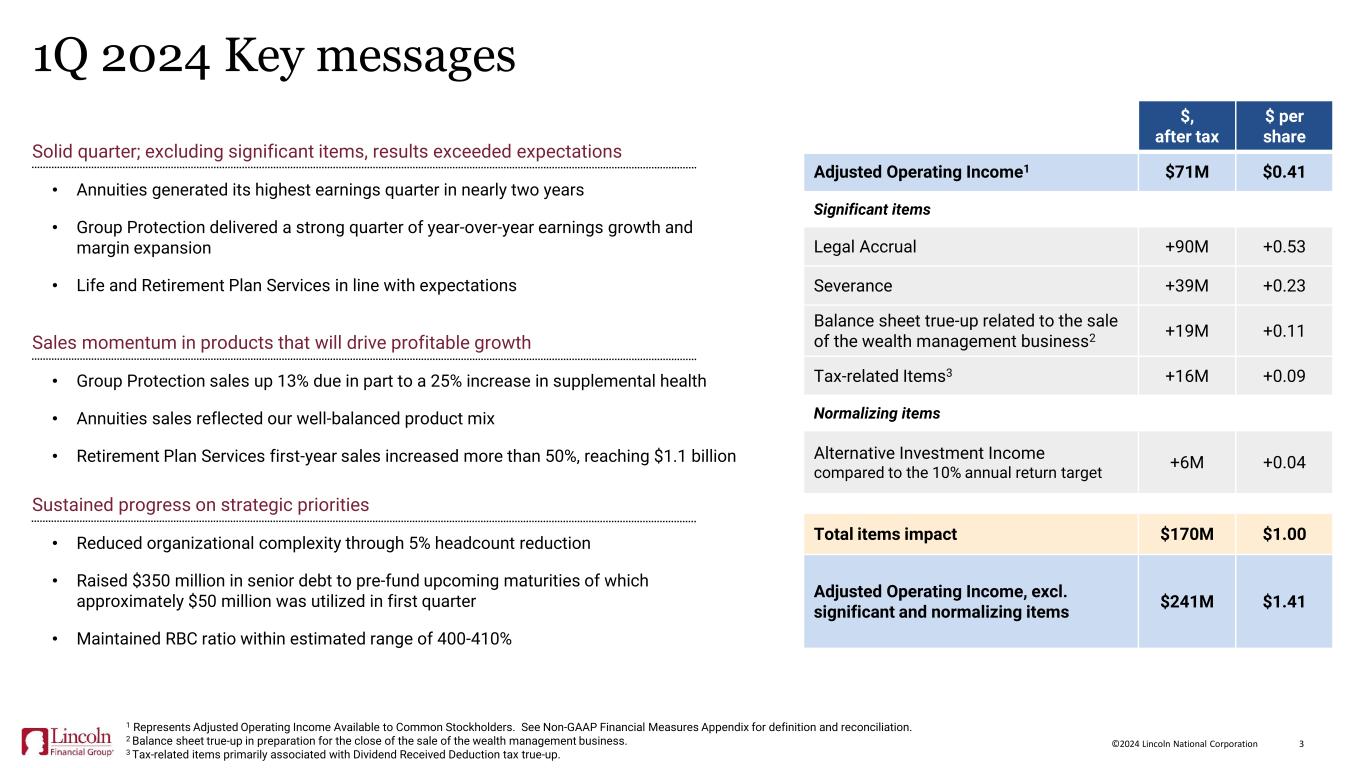
3©2024 Lincoln National Corporation 1Q 2024 Key messages 1 Represents Adjusted Operating Income Available to Common Stockholders. See Non-GAAP Financial Measures Appendix for definition and reconciliation. 2 Balance sheet true-up in preparation for the close of the sale of the wealth management business. 3 Tax-related items primarily associated with Dividend Received Deduction tax true-up. Solid quarter; excluding significant items, results exceeded expectations • Annuities generated its highest earnings quarter in nearly two years • Group Protection delivered a strong quarter of year-over-year earnings growth and margin expansion • Life and Retirement Plan Services in line with expectations Sales momentum in products that will drive profitable growth • Group Protection sales up 13% due in part to a 25% increase in supplemental health • Annuities sales reflected our well-balanced product mix • Retirement Plan Services first-year sales increased more than 50%, reaching $1.1 billion Sustained progress on strategic priorities • Reduced organizational complexity through 5% headcount reduction • Raised $350 million in senior debt to pre-fund upcoming maturities of which approximately $50 million was utilized in first quarter • Maintained RBC ratio within estimated range of 400-410% $, after tax $ per share Adjusted Operating Income1 $71M $0.41 Significant items Legal Accrual +90M +0.53 Severance +39M +0.23 Balance sheet true-up related to the sale of the wealth management business2 +19M +0.11 Tax-related Items3 +16M +0.09 Normalizing items Alternative Investment Income compared to the 10% annual return target +6M +0.04 Total items impact $170M $1.00 Adjusted Operating Income, excl. significant and normalizing items $241M $1.41
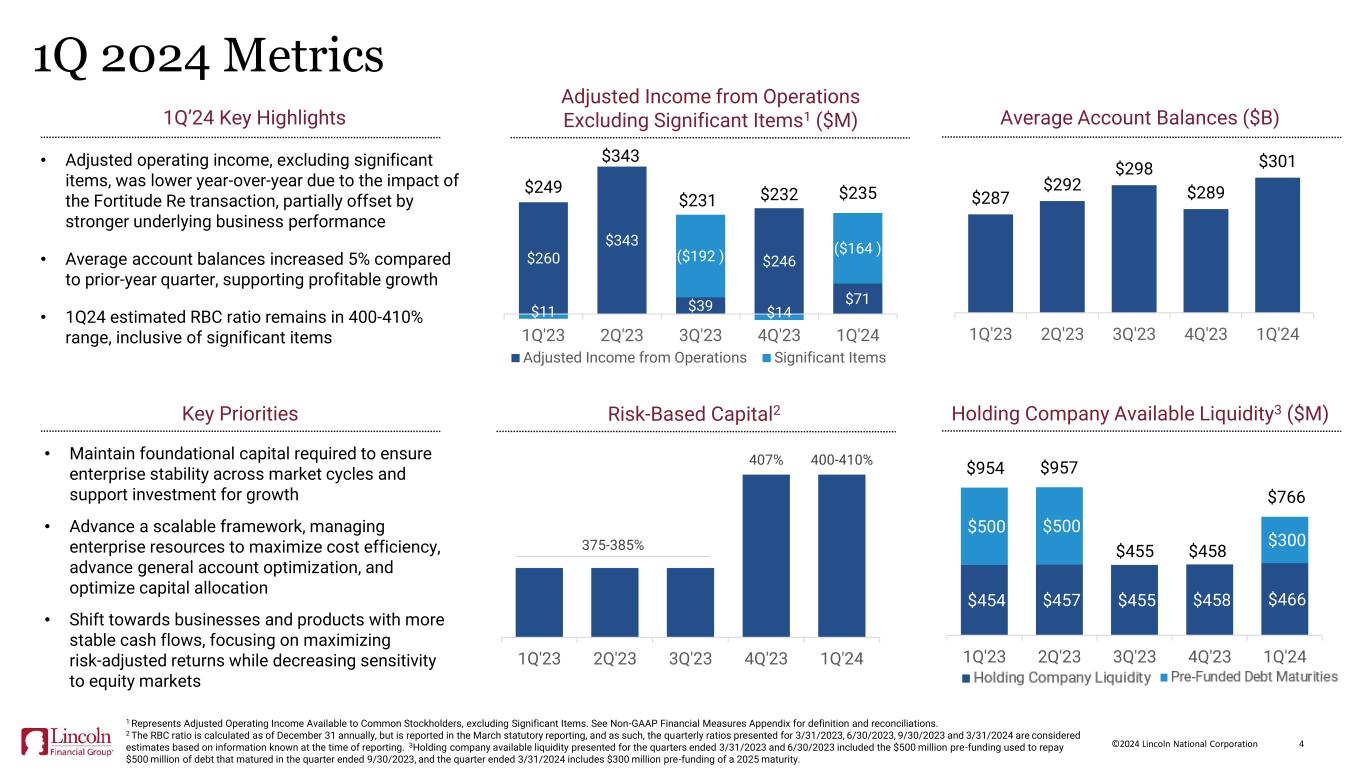
4©2024 Lincoln National Corporation $454 $457 $455 $458 $466 $500 $500 $300 1Q'23 2Q'23 3Q'23 4Q'23 1Q'24 $11 ($189 ) $14 ($164 ) $260 $343 $39 $246 $71 $249 $343 $228 $232 $235 1Q'23 2Q'23 3Q'23 4Q'23 1Q'24 Adjusted Income from Operations Significant Items 1Q 2024 Metrics Key Priorities 1Q’24 Key Highlights 1 Represents Adjusted Operating Income Available to Common Stockholders, excluding Significant Items. See Non-GAAP Financial Measures Appendix for definition and reconciliations. 2 The RBC ratio is calculated as of December 31 annually, but is reported in the March statutory reporting, and as such, the quarterly ratios presented for 3/31/2023, 6/30/2023, 9/30/2023 and 3/31/2024 are considered estimates based on information known at the time of reporting. 3Holding company available liquidity presented for the quarters ended 3/31/2023 and 6/30/2023 included the $500 million pre-funding used to repay $500 million of debt that matured in the quarter ended 9/30/2023, and the quarter ended 3/31/2024 includes $300 million pre-funding of a 2025 maturity. $260 $343 $39 $246 $71 ($192 ) ($164 ) $249 $343 31 $232 $235 ' ' ' ' ' Adjusted Income from Operations Excluding Significant Items1 ($M) • Adjusted operating income, excluding significant items, was lower year-over-year due to the impact of the Fortitude Re transaction, partially offset by stronger underlying business performance • Average account balances increased 5% compared to prior-year quarter, supporting profitable growth • 1Q24 estimated RBC ratio remains in 400-410% range, inclusive of significant items • Maintain foundational capital required to ensure enterprise stability across market cycles and support investment for growth • Advance a scalable framework, managing enterprise resources to maximize cost efficiency, advance general account optimization, and optimize capital allocation • Shift towards businesses and products with more stable cash flows, focusing on maximizing risk-adjusted returns while decreasing sensitivity to equity markets 375-385% 407% 400-410% 1Q'23 2Q'23 3Q'23 4Q'23 1Q'24 Risk-Based Capital2 Holding Company Available Liquidity3 ($M) Average Account Balances ($B) $287 $292 $298 $289 $301 1Q'23 2Q'23 3Q'23 4Q'23 1Q'24 $954 $957 $455 $458 $766
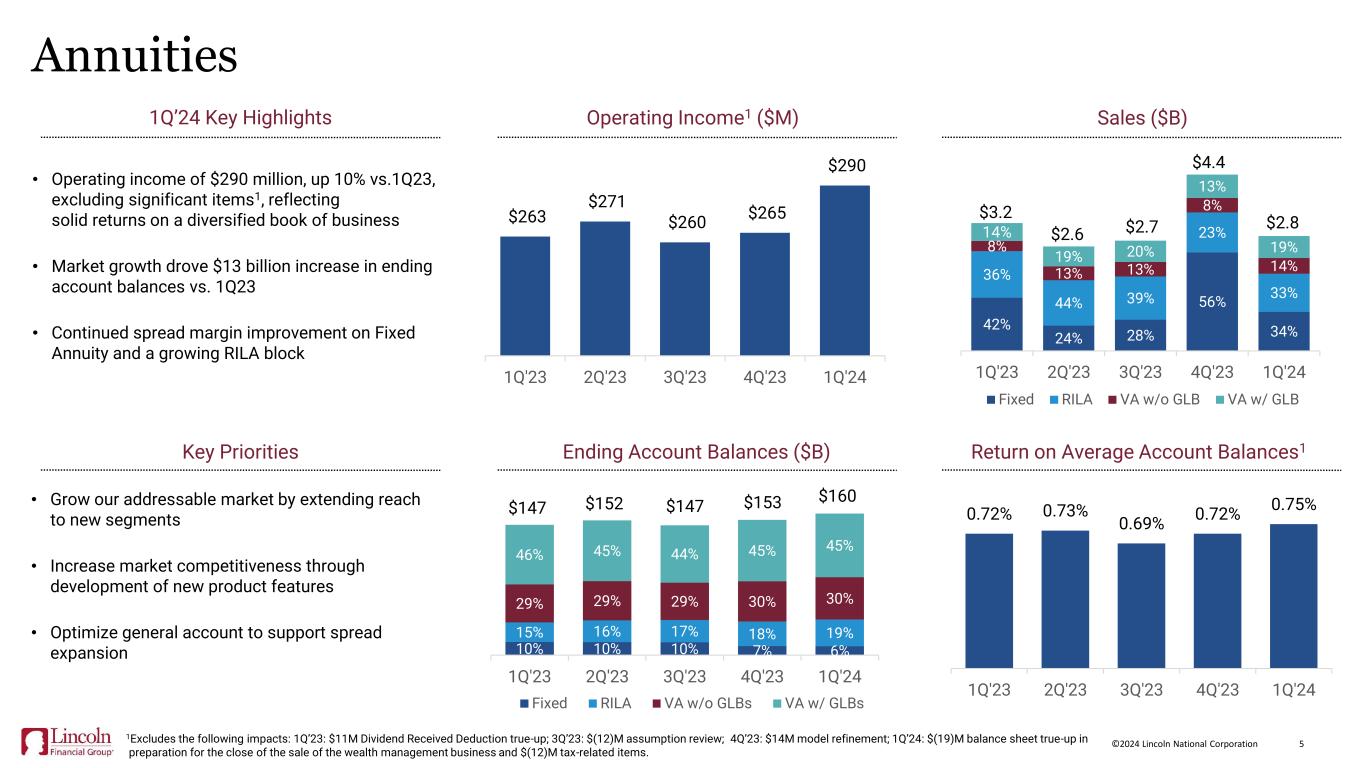
5©2024 Lincoln National Corporation 10% 10% 10% 7% 6% 15% 16% 17% 18% 19% 29% 29% 29% 30% 30% 46% 45% 44% 45% 45% 1Q'23 2Q'23 3Q'23 4Q'23 1Q'24 Fixed RILA VA w/o GLBs VA w/ GLBs 42% 24% 28% 56% 34% 36% 44% 39% 23% 33% 8% 13% 13% 8% 14% 14% 19% 20% 13% 19% 1Q'23 2Q'23 3Q'23 4Q'23 1Q'24 Fixed RILA VA w/o GLB VA w/ GLB Annuities • Grow our addressable market by extending reach to new segments • Increase market competitiveness through development of new product features • Optimize general account to support spread expansion Key Priorities Ending Account Balances ($B) Return on Average Account Balances1 • Operating income of $290 million, up 10% vs.1Q23, excluding significant items1, reflecting solid returns on a diversified book of business • Market growth drove $13 billion increase in ending account balances vs. 1Q23 • Continued spread margin improvement on Fixed Annuity and a growing RILA block Sales ($B)Operating Income1 ($M)1Q’24 Key Highlights 0.72% 0.73% 0.69% 0.72% 0.75% 1Q'23 2Q'23 3Q'23 4Q'23 1Q'24 $263 $271 $260 $265 $290 1Q'23 2Q'23 3Q'23 4Q'23 1Q'24 $147 $152 $147 $153 $160 $3.2 $2.6 $2.7 $4.4 $2.8 1Excludes the following impacts: 1Q’23: $11M Dividend Received Deduction true-up; 3Q’23: $(12)M assumption review; 4Q’23: $14M model refinement; 1Q’24: $(19)M balance sheet true-up in preparation for the close of the sale of the wealth management business and $(12)M tax-related items.
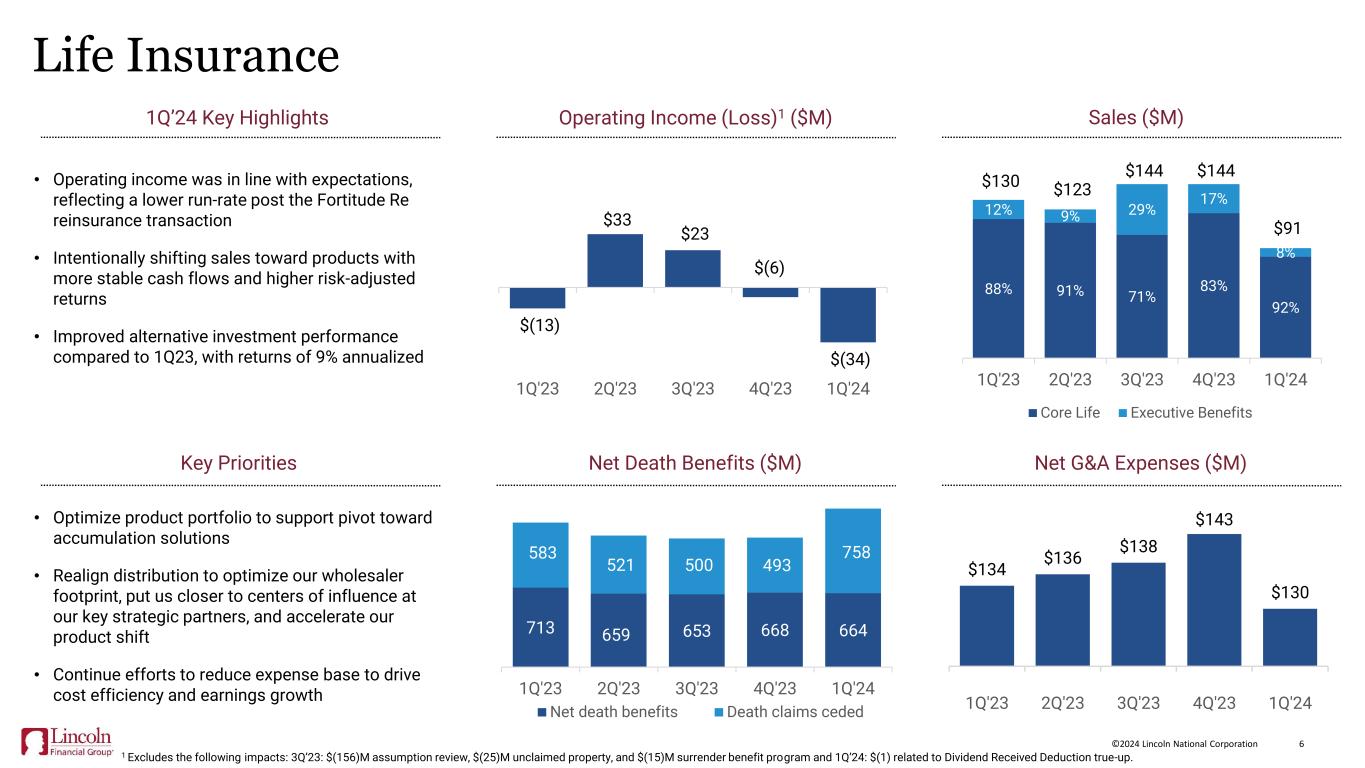
6©2024 Lincoln National Corporation $134 $136 $138 $143 $130 1Q'23 2Q'23 3Q'23 4Q'23 1Q'24 Life Insurance Key Priorities $(13) $33 $23 $(6) $(34) 1Q'23 2Q'23 3Q'23 4Q'23 1Q'24 • Operating income was in line with expectations, reflecting a lower run-rate post the Fortitude Re reinsurance transaction • Intentionally shifting sales toward products with more stable cash flows and higher risk-adjusted returns • Improved alternative investment performance compared to 1Q23, with returns of 9% annualized • Optimize product portfolio to support pivot toward accumulation solutions • Realign distribution to optimize our wholesaler footprint, put us closer to centers of influence at our key strategic partners, and accelerate our product shift • Continue efforts to reduce expense base to drive cost efficiency and earnings growth Sales ($M)Operating Income (Loss)1 ($M) 1Q’24 Key Highlights Net G&A Expenses ($M)Net Death Benefits ($M) 1 Excludes the following impacts: 3Q’23: $(156)M assumption review, $(25)M unclaimed property, and $(15)M surrender benefit program and 1Q’24: $(1) related to Dividend Received Deduction true-up. 713 659 653 668 664 583 521 500 493 758 1Q'23 2Q'23 3Q'23 4Q'23 1Q'24 Net death benefits Death claims ceded 88% 91% 71% 83% 92% 12% 9% 29% 17% 8% $130 $123 $144 $144 $91 1Q'23 2Q'23 3Q'23 4Q'23 1Q'24 Core Life Executive Benefits
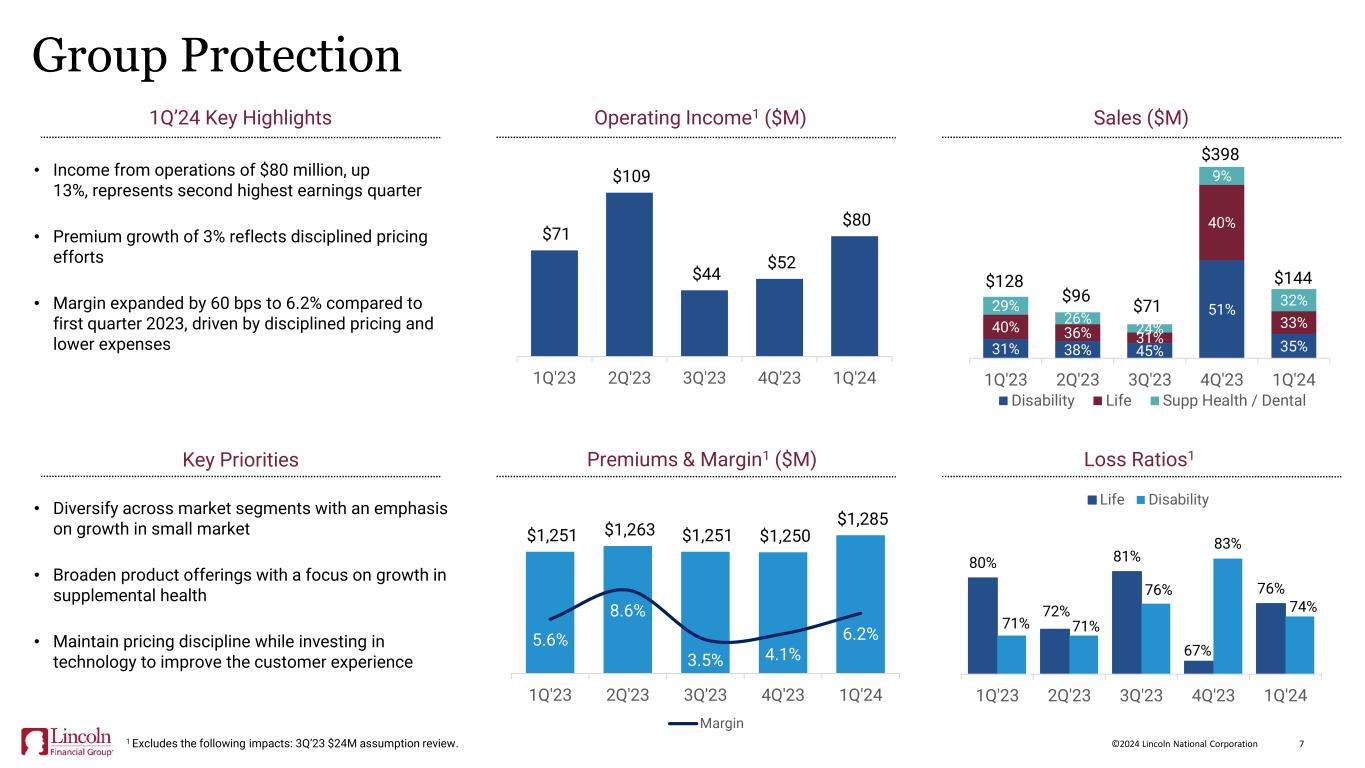
7©2024 Lincoln National Corporation 31% 38% 45% 51% 35% 40% 36% 31% 40% 33% 29% 26% 24% 9% 32% 1Q'23 2Q'23 3Q'23 4Q'23 1Q'24 Disability Life Supp Health / Dental $128 80% 72% 81% 67% 76% 71% 71% 76% 83% 74% 1Q'23 2Q'23 3Q'23 4Q'23 1Q'24 Life Disability Group Protection Sales ($M)Operating Income1 ($M) Key Priorities 1Q’24 Key Highlights Premiums & Margin1 ($M) Loss Ratios1 • Income from operations of $80 million, up 13%, represents second highest earnings quarter • Premium growth of 3% reflects disciplined pricing efforts • Margin expanded by 60 bps to 6.2% compared to first quarter 2023, driven by disciplined pricing and lower expenses $71 $109 $44 $52 $80 1Q'23 2Q'23 3Q'23 4Q'23 1Q'24 $1,251 $1,263 $1,251 $1,250 $1,285 5.6% 8.6% 3.5% 4.1% 6.2% 1Q'23 2Q'23 3Q'23 4Q'23 1Q'24 Margin 1 Excludes the following impacts: 3Q’23 $24M assumption review. $96 $71 $398 $144 • Diversify across market segments with an emphasis on growth in small market • Broaden product offerings with a focus on growth in supplemental health • Maintain pricing discipline while investing in technology to improve the customer experience
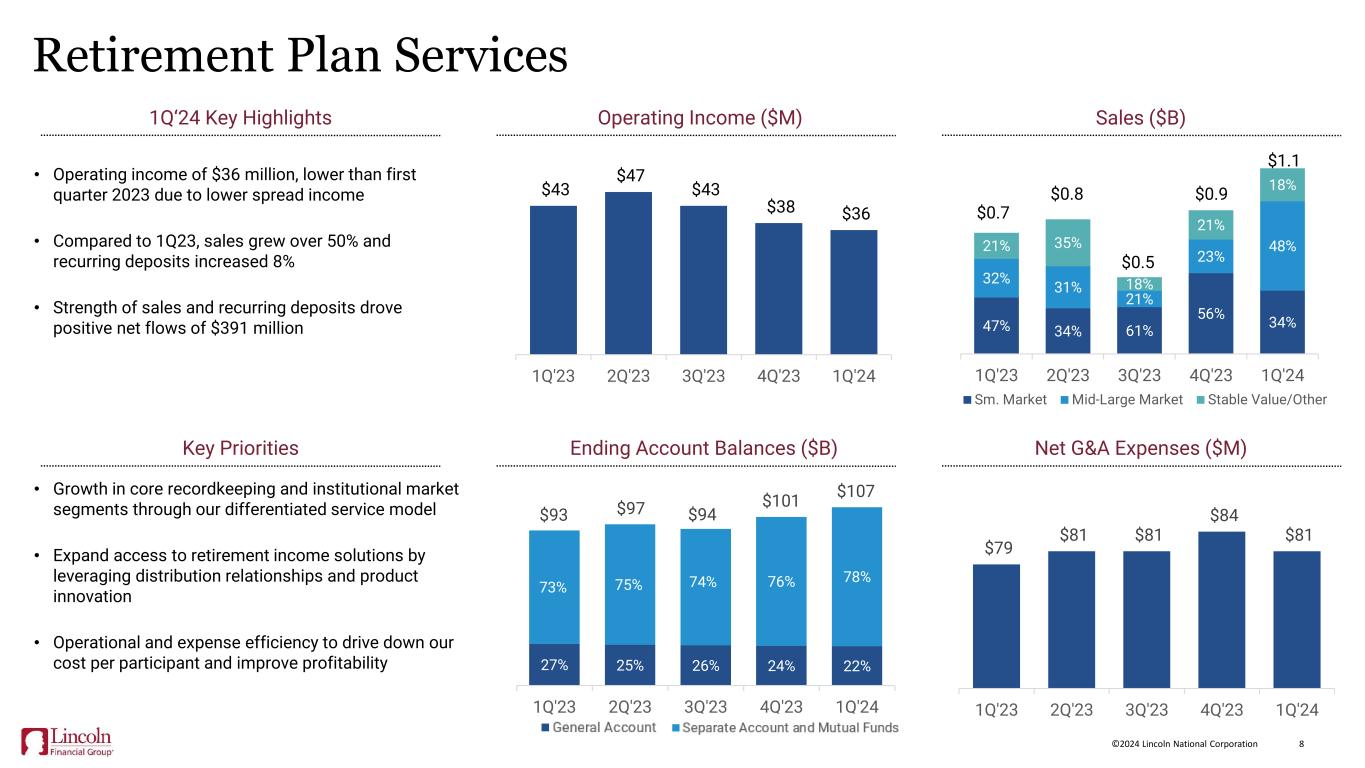
8©2024 Lincoln National Corporation 27% 25% 26% 24% 22% 73% 75% 74% 76% 78% $93 $97 $94 $101 $107 1Q'23 2Q'23 3Q'23 4Q'23 1Q'24 47% 34% 61% 56% 34% 32% 31% 21% 23% 48%21% 35% 18% 21% 18% 1Q'23 2Q'23 3Q'23 4Q'23 1Q'24 Sm. Market Mid-Large Market Stable Value/Other Retirement Plan Services $43 $47 $43 $38 $36 1Q'23 2Q'23 3Q'23 4Q'23 1Q'24 Sales ($B)Operating Income ($M) 1Q‘24 Key Highlights • Operating income of $36 million, lower than first quarter 2023 due to lower spread income • Compared to 1Q23, sales grew over 50% and recurring deposits increased 8% • Strength of sales and recurring deposits drove positive net flows of $391 million Key Priorities Ending Account Balances ($B) Net G&A Expenses ($M) • Growth in core recordkeeping and institutional market segments through our differentiated service model • Expand access to retirement income solutions by leveraging distribution relationships and product innovation • Operational and expense efficiency to drive down our cost per participant and improve profitability $79 $81 $81 $84 $81 1Q'23 2Q'23 3Q'23 4Q'23 1Q'24 $1.1 l ( ) $0.7 $0.5 $0.8 $0.9
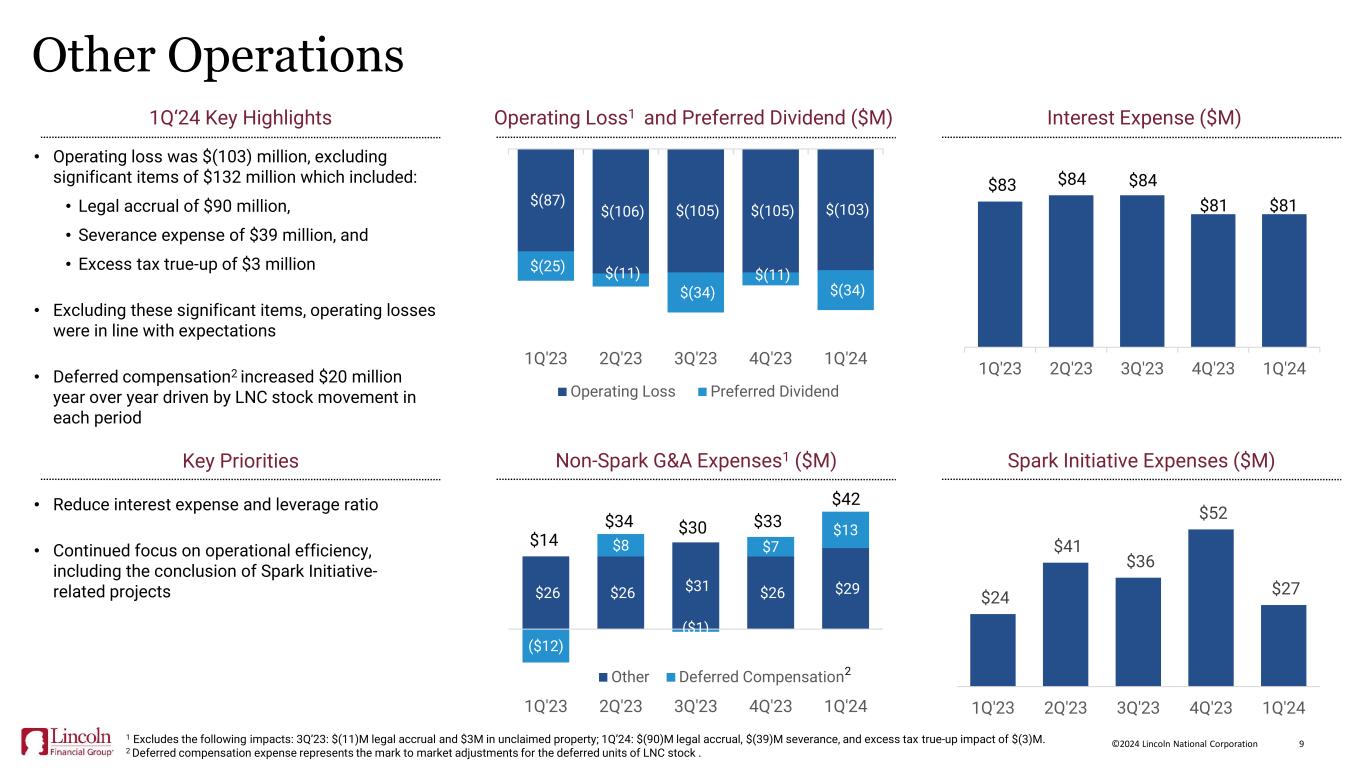
9©2024 Lincoln National Corporation $26 $26 $31 $26 $29 ($12) $8 ($1) $7 $13 1Q'23 2Q'23 3Q'23 4Q'23 1Q'24 Other Deferred Compensation Other Operations $(87) $(106) $(105) $(105) $(103) $(25) $(11) $(34) $(11) $(34) 1Q'23 2Q'23 3Q'23 4Q'23 1Q'24 Operating Loss Preferred Dividend Operating Loss1 and Preferred Dividend ($M) • Operating loss was $(103) million, excluding significant items of $132 million which included: • Legal accrual of $90 million, • Severance expense of $39 million, and • Excess tax true-up of $3 million • Excluding these significant items, operating losses were in line with expectations • Deferred compensation2 increased $20 million year over year driven by LNC stock movement in each period 1Q‘24 Key Highlights • Reduce interest expense and leverage ratio • Continued focus on operational efficiency, including the conclusion of Spark Initiative- related projects Key Priorities $83 $84 $84 $81 $81 1Q'23 2Q'23 3Q'23 4Q'23 1Q'24 Interest Expense ($M) Non-Spark G&A Expenses1 ($M) $14 $30$34 $33 $42 $24 $41 $36 $52 $27 1Q'23 2Q'23 3Q'23 4Q'23 1Q'24 Spark Initiative Expenses ($M) 1 Excludes the following impacts: 3Q’23: $(11)M legal accrual and $3M in unclaimed property; 1Q’24: $(90)M legal accrual, $(39)M severance, and excess tax true-up impact of $(3)M. 2 Deferred compensation expense represents the mark to market adjustments for the deferred units of LNC stock . 2
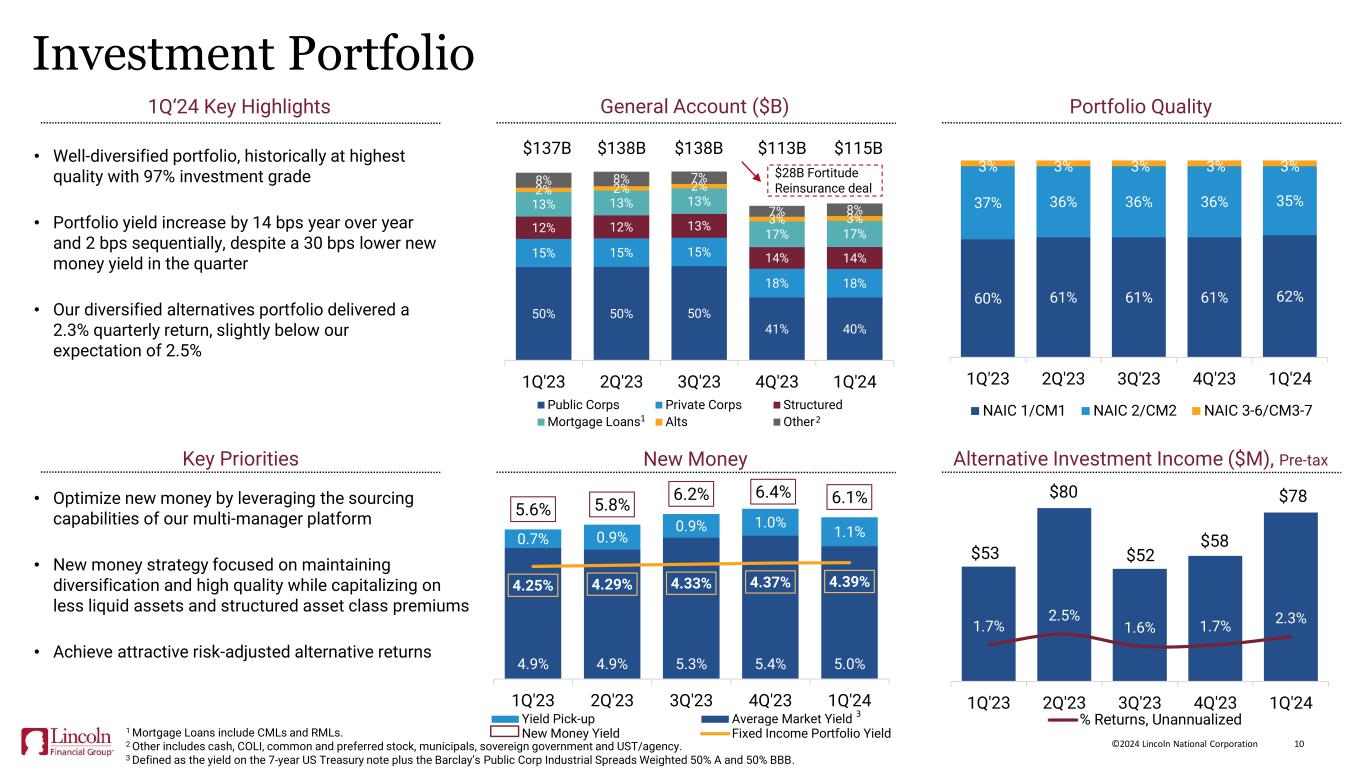
10©2024 Lincoln National Corporation 4.9% 4.9% 5.3% 5.4% 5.0% 0.7% 0.9% 0.9% 1.0% 1.1% 5.6% 5.8% 6.2% 6.4% 6.1% 4.25% 4.29% 4.33% 4.37% 4.39% 1Q'23 2Q'23 3Q'23 4Q'23 1Q'24 Yield Pick-up Average Market Yield New Money Yield Fixed Income Portfolio Yield $53 $80 $52 $58 $78 1.7% 2.5% 1.6% 1.7% 2.3% 1Q'23 2Q'23 3Q'23 4Q'23 1Q'24 % Returns, Unannualized Investment Portfolio Portfolio Quality1Q‘24 Key Highlights Alternative Investment Income ($M), Pre-taxNew Money • Well-diversified portfolio, historically at highest quality with 97% investment grade • Portfolio yield increase by 14 bps year over year and 2 bps sequentially, despite a 30 bps lower new money yield in the quarter • Our diversified alternatives portfolio delivered a 2.3% quarterly return, slightly below our expectation of 2.5% 3 60% 61% 61% 61% 62% 37% 36% 36% 36% 35% 3% 3% 3% 3% 3% 1Q'23 2Q'23 3Q'23 4Q'23 1Q'24 NAIC 1/CM1 NAIC 2/CM2 NAIC 3-6/CM3-7 1 Mortgage Loans include CMLs and RMLs. 2 Other includes cash, COLI, common and preferred stock, municipals, sovereign government and UST/agency. 3 Defined as the yield on the 7-year US Treasury note plus the Barclay’s Public Corp Industrial Spreads Weighted 50% A and 50% BBB. 50% 50% 50% 41% 40% 15% 15% 15% 18% 18% 12% 12% 13% 14% 14% 13% 13% 13% 17% 17% 2% 2% 2% 3% 3% 8% 8% 7% 7% 8% 1Q'23 2Q'23 3Q'23 4Q'23 1Q'24 Public Corps Private Corps Structured Mortgage Loans Alts Other General Account ($B) $137B $138B $138B $113B $115B 1 2 $28B Fortitude Reinsurance deal Key Priorities • Optimize new money by leveraging the sourcing capabilities of our multi-manager platform • New money strategy focused on maintaining diversification and high quality while capitalizing on less liquid assets and structured asset class premiums • Achieve attractive risk-adjusted alternative returns

11©2024 Lincoln National Corporation Appendix
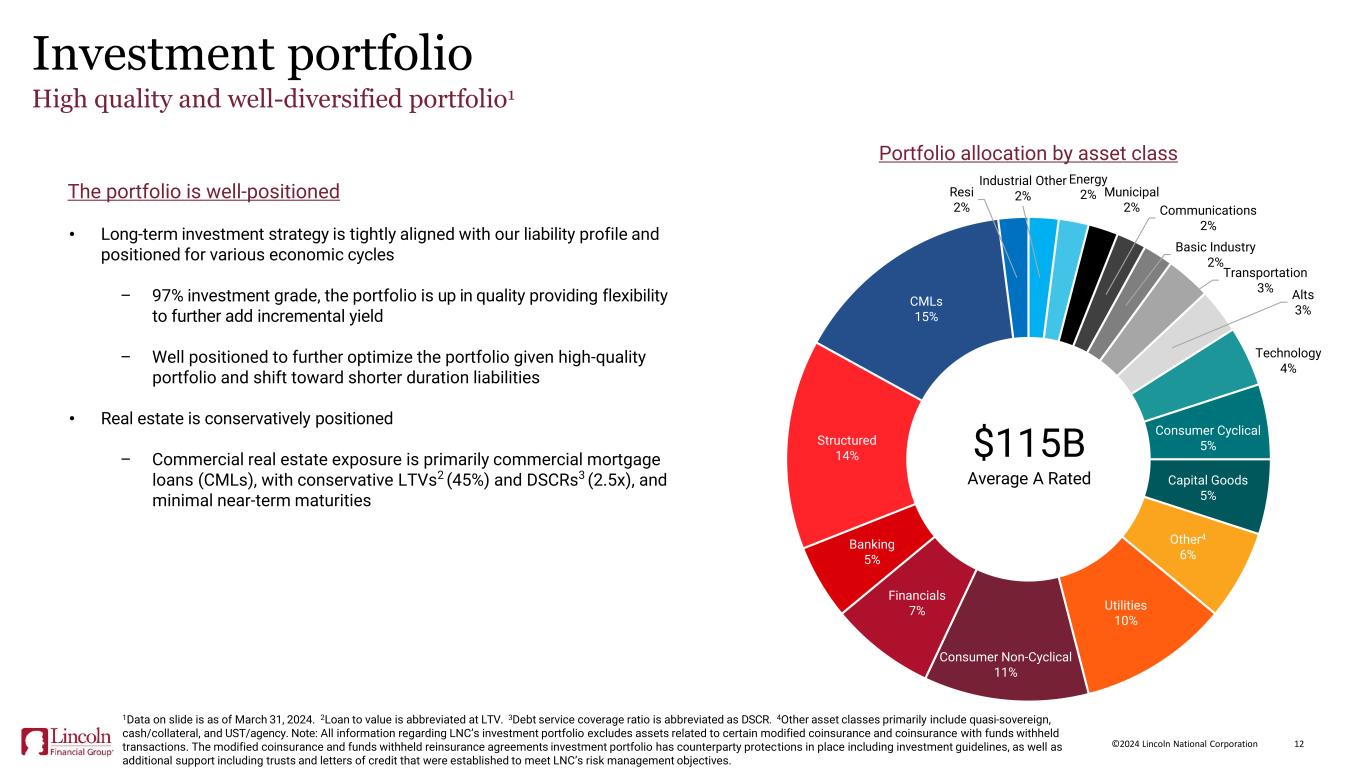
12©2024 Lincoln National Corporation Investment portfolio High quality and well-diversified portfolio1 The portfolio is well-positioned • Long-term investment strategy is tightly aligned with our liability profile and positioned for various economic cycles – 97% investment grade, the portfolio is up in quality providing flexibility to further add incremental yield – Well positioned to further optimize the portfolio given high-quality portfolio and shift toward shorter duration liabilities • Real estate is conservatively positioned – Commercial real estate exposure is primarily commercial mortgage loans (CMLs), with conservative LTVs2 (45%) and DSCRs3 (2.5x), and minimal near-term maturities 1Data on slide is as of March 31, 2024. 2Loan to value is abbreviated at LTV. 3Debt service coverage ratio is abbreviated as DSCR. 4Other asset classes primarily include quasi-sovereign, cash/collateral, and UST/agency. Note: All information regarding LNC’s investment portfolio excludes assets related to certain modified coinsurance and coinsurance with funds withheld transactions. The modified coinsurance and funds withheld reinsurance agreements investment portfolio has counterparty protections in place including investment guidelines, as well as additional support including trusts and letters of credit that were established to meet LNC’s risk management objectives. $115B Average A Rated Industrial Other 2% Energy 2% Municipal 2% Communications 2% Basic Industry 2% Transportation 3% Alts 3% Technology 4% Consumer Cyclical 5% Capital Goods 5% Other4 6% Utilities 10% Consumer Non-Cyclical 11% Financials 7% Banking 5% Structured 14% CMLs 15% Resi 2% Portfolio allocation by asset class
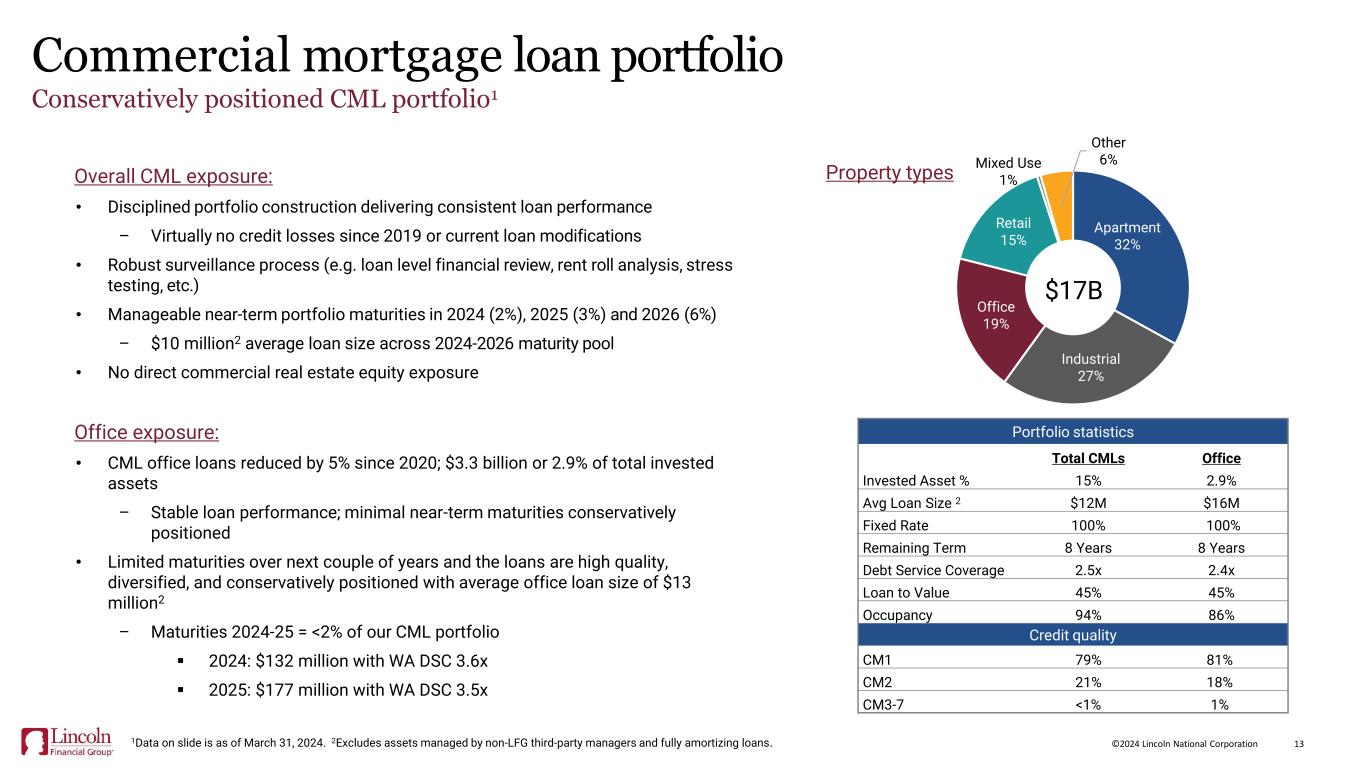
13©2024 Lincoln National Corporation Commercial mortgage loan portfolio Conservatively positioned CML portfolio1 Overall CML exposure: • Disciplined portfolio construction delivering consistent loan performance – Virtually no credit losses since 2019 or current loan modifications • Robust surveillance process (e.g. loan level financial review, rent roll analysis, stress testing, etc.) • Manageable near-term portfolio maturities in 2024 (2%), 2025 (3%) and 2026 (6%) – $10 million2 average loan size across 2024-2026 maturity pool • No direct commercial real estate equity exposure Office exposure: • CML office loans reduced by 5% since 2020; $3.3 billion or 2.9% of total invested assets – Stable loan performance; minimal near-term maturities conservatively positioned • Limited maturities over next couple of years and the loans are high quality, diversified, and conservatively positioned with average office loan size of $13 million2 – Maturities 2024-25 = <2% of our CML portfolio ▪ 2024: $132 million with WA DSC 3.6x ▪ 2025: $177 million with WA DSC 3.5x 1Data on slide is as of March 31, 2024. 2Excludes assets managed by non-LFG third-party managers and fully amortizing loans. Apartment 32% Industrial 27% Office 19% Retail 15% Mixed Use 1% Other 6% $17B Portfolio statistics Total CMLs Office Invested Asset % 15% 2.9% Avg Loan Size 2 $12M $16M Fixed Rate 100% 100% Remaining Term 8 Years 8 Years Debt Service Coverage 2.5x 2.4x Loan to Value 45% 45% Occupancy 94% 86% Credit quality CM1 79% 81% CM2 21% 18% CM3-7 <1% 1% Property types
14©2024 Lincoln National Corporation Non-GAAP Financial Measures Appendix
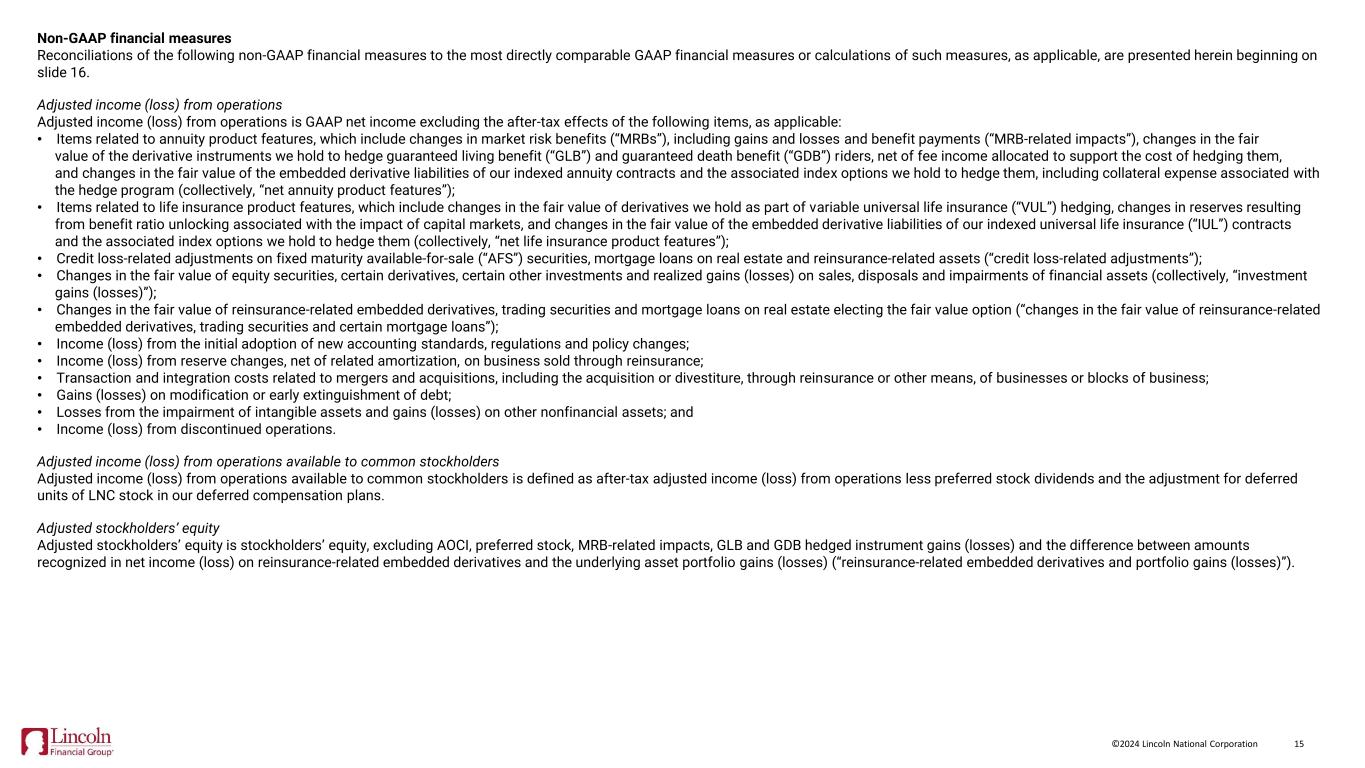
15©2024 Lincoln National Corporation Non-GAAP financial measures Reconciliations of the following non-GAAP financial measures to the most directly comparable GAAP financial measures or calculations of such measures, as applicable, are presented herein beginning on slide 16. Adjusted income (loss) from operations Adjusted income (loss) from operations is GAAP net income excluding the after-tax effects of the following items, as applicable: • Items related to annuity product features, which include changes in market risk benefits (“MRBs”), including gains and losses and benefit payments (“MRB-related impacts”), changes in the fair value of the derivative instruments we hold to hedge guaranteed living benefit (“GLB”) and guaranteed death benefit (“GDB”) riders, net of fee income allocated to support the cost of hedging them, and changes in the fair value of the embedded derivative liabilities of our indexed annuity contracts and the associated index options we hold to hedge them, including collateral expense associated with the hedge program (collectively, “net annuity product features”); • Items related to life insurance product features, which include changes in the fair value of derivatives we hold as part of variable universal life insurance (“VUL”) hedging, changes in reserves resulting from benefit ratio unlocking associated with the impact of capital markets, and changes in the fair value of the embedded derivative liabilities of our indexed universal life insurance (“IUL”) contracts and the associated index options we hold to hedge them (collectively, “net life insurance product features”); • Credit loss-related adjustments on fixed maturity available-for-sale (“AFS”) securities, mortgage loans on real estate and reinsurance-related assets (“credit loss-related adjustments”); • Changes in the fair value of equity securities, certain derivatives, certain other investments and realized gains (losses) on sales, disposals and impairments of financial assets (collectively, “investment gains (losses)”); • Changes in the fair value of reinsurance-related embedded derivatives, trading securities and mortgage loans on real estate electing the fair value option (“changes in the fair value of reinsurance-related embedded derivatives, trading securities and certain mortgage loans”); • Income (loss) from the initial adoption of new accounting standards, regulations and policy changes; • Income (loss) from reserve changes, net of related amortization, on business sold through reinsurance; • Transaction and integration costs related to mergers and acquisitions, including the acquisition or divestiture, through reinsurance or other means, of businesses or blocks of business; • Gains (losses) on modification or early extinguishment of debt; • Losses from the impairment of intangible assets and gains (losses) on other nonfinancial assets; and • Income (loss) from discontinued operations. Adjusted income (loss) from operations available to common stockholders Adjusted income (loss) from operations available to common stockholders is defined as after-tax adjusted income (loss) from operations less preferred stock dividends and the adjustment for deferred units of LNC stock in our deferred compensation plans. Adjusted stockholders’ equity Adjusted stockholders’ equity is stockholders’ equity, excluding AOCI, preferred stock, MRB-related impacts, GLB and GDB hedged instrument gains (losses) and the difference between amounts recognized in net income (loss) on reinsurance-related embedded derivatives and the underlying asset portfolio gains (losses) (“reinsurance-related embedded derivatives and portfolio gains (losses)”).
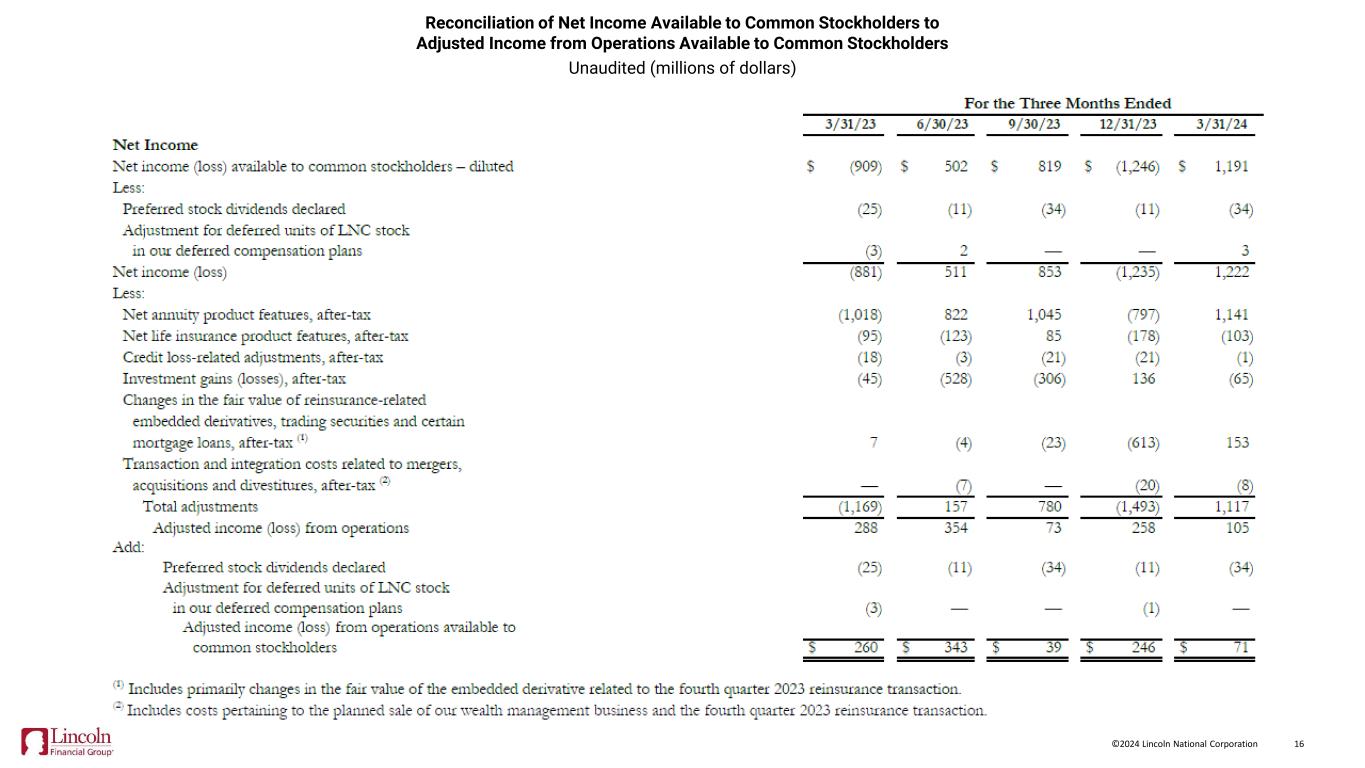
16©2024 Lincoln National Corporation Reconciliation of Net Income Available to Common Stockholders to Adjusted Income from Operations Available to Common Stockholders Unaudited (millions of dollars)
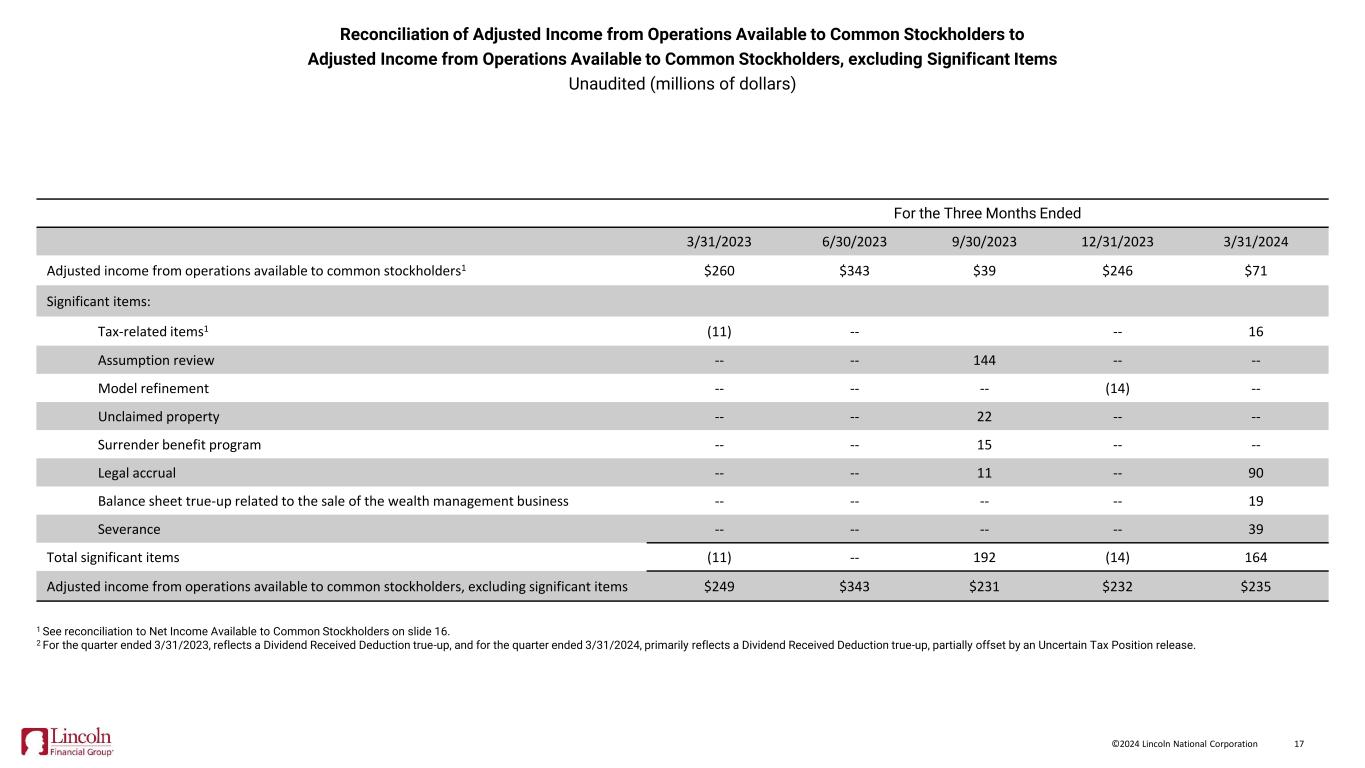
17©2024 Lincoln National Corporation Reconciliation of Adjusted Income from Operations Available to Common Stockholders to Adjusted Income from Operations Available to Common Stockholders, excluding Significant Items Unaudited (millions of dollars) For the Three Months Ended 3/31/2023 6/30/2023 9/30/2023 12/31/2023 3/31/2024 Adjusted income from operations available to common stockholders1 $260 $343 $39 $246 $71 Significant items: Tax-related items1 (11) -- -- 16 Assumption review -- -- 144 -- -- Model refinement -- -- -- (14) -- Unclaimed property -- -- 22 -- -- Surrender benefit program -- -- 15 -- -- Legal accrual -- -- 11 -- 90 Balance sheet true-up related to the sale of the wealth management business -- -- -- -- 19 Severance -- -- -- -- 39 Total significant items (11) -- 192 (14) 164 Adjusted income from operations available to common stockholders, excluding significant items $249 $343 $231 $232 $235 1 See reconciliation to Net Income Available to Common Stockholders on slide 16. 2 For the quarter ended 3/31/2023, reflects a Dividend Received Deduction true-up, and for the quarter ended 3/31/2024, primarily reflects a Dividend Received Deduction true-up, partially offset by an Uncertain Tax Position release.