
PLAB 8-K
Photronics Inc (PLAB)
8-K
2020-05-27
For: 2020-05-27
View Original
Added on
April 07, 2026
UNITED STATES
SECURITIES AND EXCHANGE COMMISSION
Washington, D.C. 20549
FORM 8-K
CURRENT REPORT

Pursuant To Section 13 Or 15(d) Of The Securities Exchange Act Of 1934
|
Date of report (Date of earliest event reported)
|
|
(Exact name of registrant as specified in its charter)
|
|
||
|
(State or Other Jurisdiction of) Incorporation
|
(Commission File Number)
|
(IRS Employer Identification No.)
|
|
|
||
|
(Address of principal executive offices)
|
(Zip Code)
|
|
Registrant’s Telephone Number, including area code
|
(
|
(Former name or former address, if changed since last report)
Check the appropriate box below if the Form 8-K filing is intended to simultaneously satisfy the filing obligation of the registrant under any of the following provisions:
|
Written communications pursuant to Rule 425 under the Securities Act (17 CFR 230.425)
|
|
Soliciting material pursuant to Rule 14a-12 under the Exchange Act (17 CFR 240.14a-12)
|
|
Pre-commencement communications pursuant to Rule 14d-2(b) under the Exchange Act (17 CFR 240.14d-2(b))
|
|
Pre-commencement communications pursuant to Rule 13e-4(c) under the Exchange Act (17 CFR 240.13e-4(c))
|
Indicate by check mark whether the registrant is an emerging growth company as defined in Rule 405 of the Securities Act of 1933 (§230.405 of this chapter) or Rule 12b-2 of the Securities Exchange Act of 1934
(§240.12b-2 of this chapter).
Emerging growth company ☐
If an emerging growth company, indicate by check mark if the registrant has elected not to use the extended transition period for complying with any new or revised financial accounting standards provided pursuant to
Section 13(a) of the Exchange Act. ☐
Securities registered pursuant to Section 12(b) of the Act:
|
Title of each class
|
Trading Symbol(s)
|
Name of each exchange on which registered
|
|
N/A
|
| Item 2.02. |
Results of Operations and Financial Condition.
|
On May 27, 2020, Photronics, Inc. (the “Company”) issued a press release reporting second quarter fiscal 2020 results.
A copy of the press release is furnished as Exhibit 99.1 to this report. The information contained in this Item 2.02 and the attached Exhibits 99.1, 99.2, 99.3, 99.4, and 99.5, shall not be deemed “filed” for
purposes of Section 18 of the Securities Exchange Act of 1934 and shall not be incorporated by reference in any filing under the Securities Act of 1933 except as shall be expressly set forth by specific reference in such filing.
|
Item 9.01.
|
Financial Statements and Exhibits.
|
|
(d)
|
Exhibits
|
|
|
Press Release dated May 27, 2020.
|
|
Condensed Consolidated Statements of Income.
|
|
Condensed Consolidated Balance Sheets.
|
|
Condensed Consolidated Statements of Cash Flows.
|
|
Photronics Q2 2020 Financial Results Conference Call May 27, 2020 slides.
|
SIGNATURE
Pursuant to the requirements of the Securities Exchange Act of 1934, the Registrant has duly caused this report to be signed on its behalf by the undersigned hereunto duly authorized.
|
PHOTRONICS, INC.
(Registrant)
|
||
| By : | /s/ Richelle E. Burr | |
|
Name:
|
Richelle E. Burr
|
|
|
Title:
|
Executive Vice President,
|
|
|
Chief Administrative Officer,
|
||
|
General Counsel and Secretary
|
||
|
Date: May 27, 2020
|
Exhibit 99.1

Press Release
|
For Further Information:
R. Troy Dewar, CFA
Vice President, Investor Relations
(203) 740-5610
|
Photronics Reports Second Quarter Fiscal 2020 Results
| • |
Second quarter 2020 revenue was $142.8 million, down 11% sequentially and up 9% year-over-year
|
| • |
Net income attributable to Photronics, Inc. shareholders was $6.3 million, or $0.10 per diluted share
|
| • |
Cash provided by operating activities was $30.5 million, resulting in a cash balance of $237.8 million
|
| • |
Third quarter 2020 guidance: revenue between $145 and $155 million with diluted EPS between $0.11 and $0.17
|
BROOKFIELD, Conn. May 27, 2020 (GLOBE NEWSWIRE) — Photronics, Inc. (NASDAQ:PLAB), a worldwide leader in photomask technologies and solutions, today reported financial results for its fiscal 2020 second quarter
ended May 3, 2020.
Second quarter revenue was $142.8 million, 11% lower than the previous quarter and 9% better than the same quarter last year. Integrated circuit (IC) revenue was $96.8 million, down 9% sequentially and down 2% compared
with the second quarter of last year. Flat panel display (FPD) revenue was $45.9 million, down 13% compared with last quarter and up 39% compared with the same period last year.
Net income attributable to Photronics, Inc. shareholders was $6.3 million ($0.10 per diluted share), compared with $10.3 million ($0.16 per diluted share) for the first quarter of 2020 and $8.5 million ($0.13 per
diluted share) for the second quarter of 2019.
“Our entire organization performed well, working hard to meet customer needs during an unprecedented period characterized by supply chain challenges and growing uncertainty,” said Peter Kirlin, chief executive officer.
“Our business was soft in China, due primarily to shelter-in-place directives that caused some customers to push out orders, particularly for IC foundries and high-end display panel production. As we ended the quarter, most of these directives were
lifted and demand began strengthening. Our low-cost focus and strong balance sheet are helping us to navigate the uncertainty. We remain focused on compelling long-term growth opportunities and are committed to investing to expand market share and
maintain technology leadership, primarily in mobile display applications, which we anticipate will continue to grow.”
Third Quarter 2020 Guidance
For the third quarter of 2020, Photronics expects revenue to be between $145 million and $155 million, and net income attributable to Photronics, Inc. shareholders to be between $0.11 and $0.17 per diluted share.
Conference Call
A conference call to discuss these results is scheduled for 8:30 a.m. Eastern time on Wednesday, May 27, 2020. The call can be accessed by logging onto Photronics’ website at www.photronics.com. The live
dial-in number is (877) 377-7095 or (408) 774-4601 outside of the United States and Canada. The call will be archived on Photronics’ website.
About Photronics
Photronics is a leading worldwide manufacturer of integrated circuit (IC) and flat panel display (FPD) photomasks. High precision quartz plates that contain microscopic images of electronic circuits,
photomasks are a key element in the IC and FPD manufacturing process. Founded in 1969, Photronics has been a trusted photomask supplier for 50 years. As of October 31, 2019, the company had 1,775 employees. The company has 11 strategically located manufacturing
facilities in Asia, Europe, and North America. Additional information on the company can be accessed at www.photronics.com.
Forward-Looking Statements
Certain statements in this press release constitute “forward-looking statements” within the meaning of the Private Securities Litigation Reform Act of 1995. The Private Securities Litigation Reform Act of 1995 provides
a “safe harbor” for forward-looking statements made by or on behalf of the company and its subsidiaries. Such forward-looking statements involve known and unknown risks, uncertainties and other factors which may cause the actual results, performance
or achievements of Photronics to be materially different from any future results, performance or achievements expressed or implied by such forward-looking statements. Statements preceded by, followed by or that otherwise include the words “believes,”
“expects,” “anticipates,” “intends,” “projects,” “estimates,” “plans,” “may increase,” “may fluctuate,” “will,” “should,” “would,” “may” and “could” or similar words or expressions are generally forward-looking in nature and not historical facts. Any
statements that refer to outlook, expectations or other characterizations of future events, circumstances or results are also forward-looking statements. Important risks, assumptions and other important factors that could cause future results to
differ materially from those expressed in the forward-looking statements are specified in Photronics’ Annual and Quarterly filings with the Securities and Exchange Commission under headings such as “Forward-Looking Statements”, “Risk Factors” and
“Management’s Discussion and Analysis of Financial Condition and Results of Operations” and in other filings and furnishings made by Photronics with the Securities and Exchange Commission from time to time. These risks and uncertainties include, but
are not limited to, the current pandemic and future recurrences and other developments with respect thereto, governmental responses to the pandemic and related matters, changes in end markets resulting therefrom, changes in investment, tax, trade,
exchange and other laws and regulations, as well as economic, competitive, legal, governmental, political, monetary and fiscal policy, and technological factors and decisions we may make in the future regarding our business, capital structure and
other matters. Photronics undertakes no obligation to release publicly any revisions to any forward-looking statements or, except as required to be disclosed in filings or furnishings with the Securities and Exchange Commission, to report events or
to report the occurrence of unanticipated events. There is no assurance that Photronics’ expectations will be realized.
Exhibit 99.2
PHOTRONICS, INC.
Condensed Consolidated Statements of Income
(in thousands, except per share amounts)
(Unaudited)
|
Three Months Ended
|
Six Months Ended
|
|||||||||||||||||||
|
May 3,
2020
|
February 2,
2020
|
April 28,
2019
|
May 3,
2020
|
April 28,
2019
|
||||||||||||||||
|
Revenue
|
$
|
142,774
|
$
|
159,736
|
$
|
131,580
|
$
|
302,510
|
$
|
256,291
|
||||||||||
|
Cost of goods sold
|
112,341
|
125,134
|
105,570
|
237,475
|
204,179
|
|||||||||||||||
|
Gross profit
|
30,433
|
34,602
|
26,010
|
65,035
|
52,112
|
|||||||||||||||
|
Operating Expenses:
|
||||||||||||||||||||
|
Selling, general and administrative
|
13,267
|
14,219
|
13,269
|
27,486
|
27,061
|
|||||||||||||||
|
Research and development
|
4,462
|
4,080
|
3,542
|
8,541
|
7,805
|
|||||||||||||||
|
Total Operating Expenses
|
17,729
|
18,299
|
16,811
|
36,027
|
34,866
|
|||||||||||||||
|
Operating income
|
12,704
|
16,303
|
9,199
|
29,008
|
17,246
|
|||||||||||||||
|
Other income (expense), net
|
(951
|
)
|
3,697
|
3,931
|
2,745
|
5,039
|
||||||||||||||
|
Income before income taxes
|
11,753
|
20,000
|
13,130
|
31,753
|
22,285
|
|||||||||||||||
|
Income tax provision
|
3,781
|
9,072
|
3,278
|
12,853
|
4,665
|
|||||||||||||||
|
Net income
|
7,972
|
10,928
|
9,852
|
18,900
|
17,620
|
|||||||||||||||
|
Net income attributable to noncontrolling interests
|
1,688
|
628
|
1,373
|
2,316
|
3,874
|
|||||||||||||||
|
Net income attributable to Photronics, Inc. shareholders
|
$
|
6,284
|
$
|
10,300
|
$
|
8,479
|
$
|
16,584
|
$
|
13,746
|
||||||||||
|
Earnings per share:
|
||||||||||||||||||||
|
Basic
|
$
|
0.10
|
$
|
0.16
|
$
|
0.13
|
$
|
0.25
|
$
|
0.21
|
||||||||||
|
Diluted
|
$
|
0.10
|
$
|
0.16
|
$
|
0.13
|
$
|
0.25
|
$
|
0.20
|
||||||||||
|
Weighted-average number of common shares outstanding:
|
||||||||||||||||||||
|
Basic
|
64,937
|
65,554
|
66,261
|
65,246
|
66,422
|
|||||||||||||||
|
Diluted
|
65,417
|
66,449
|
70,597
|
65,933
|
71,593
|
|||||||||||||||
Exhibit 99.3
PHOTRONICS, INC.
Condensed Consolidated Balance Sheets
(in thousands)
(Unaudited)
|
May 3,
2020
|
October 31,
2019
|
|||||||
|
Assets
|
||||||||
|
Current assets:
|
||||||||
|
Cash and cash equivalents
|
$
|
237,790
|
$
|
206,530
|
||||
|
Accounts receivable
|
135,035
|
134,454
|
||||||
|
Inventories
|
56,968
|
48,155
|
||||||
|
Other current assets
|
42,478
|
38,388
|
||||||
|
Total current assets
|
472,271
|
427,527
|
||||||
|
Property, plant and equipment, net
|
604,545
|
632,441
|
||||||
|
Intangible assets, net
|
5,690
|
7,870
|
||||||
|
Other assets
|
51,382
|
50,827
|
||||||
|
Total assets
|
$
|
1,133,888
|
$
|
1,118,665
|
||||
|
Liabilities and Equity
|
||||||||
|
Current liabilities:
|
||||||||
|
Debt
|
$
|
17,671
|
$
|
10,873
|
||||
|
Accounts payable and accrued liabilities
|
135,701
|
141,081
|
||||||
|
Total current liabilities
|
153,372
|
151,954
|
||||||
|
Long-term debt
|
35,783
|
41,887
|
||||||
|
Other liabilities
|
23,075
|
13,732
|
||||||
|
Photronics, Inc. shareholders’ equity
|
769,191
|
769,892
|
||||||
|
Noncontrolling interests
|
152,467
|
141,200
|
||||||
|
Total equity
|
921,658
|
911,092
|
||||||
|
Total liabilities and equity
|
$
|
1,133,888
|
$
|
1,118,665
|
||||
Exhibit 99.4
PHOTRONICS, INC.
Condensed Consolidated Statements of Cash Flows
(in thousands)
(Unaudited)
|
Six Months Ended
|
||||||||
|
May 3,
2020
|
April 28,
2019
|
|||||||
|
Cash flows from operating activities:
|
||||||||
|
Net income
|
$
|
18,900
|
$
|
17,620
|
||||
|
Adjustments to reconcile net income to net cash provided by operating activities:
|
||||||||
|
Depreciation and amortization
|
47,896
|
38,515
|
||||||
|
Share-based compensation
|
2,576
|
1,962
|
||||||
|
Changes in operating assets, liabilities and other
|
(8,049
|
)
|
(60,384
|
)
|
||||
|
Net cash provided by (used in) operating activities
|
61,323
|
(2,287
|
)
|
|||||
|
Cash flows from investing activities:
|
||||||||
|
Purchases of property, plant and equipment
|
(30,127
|
)
|
(140,436
|
)
|
||||
|
Government incentive
|
5,260
|
5,698
|
||||||
|
Other
|
(139
|
)
|
(23
|
)
|
||||
|
Net cash used in investing activities
|
(25,006
|
)
|
(134,761
|
)
|
||||
|
Cash flows from financing activities:
|
||||||||
|
Proceeds from long-term debt
|
1,140
|
39,633
|
||||||
|
Contribution from noncontrolling interest
|
7,600
|
29,394
|
||||||
|
Purchase of treasury stock
|
(16,894
|
)
|
(10,696
|
)
|
||||
|
Repayments of long-term debt
|
(389
|
)
|
(61,220
|
)
|
||||
|
Proceeds from share-based arrangements
|
3,423
|
1,033
|
||||||
|
Dividends paid to noncontrolling interests
|
-
|
(26,102
|
)
|
|||||
|
Other
|
(251
|
)
|
(45
|
)
|
||||
|
Net cash used in financing activities
|
(5,371
|
)
|
(28,003
|
)
|
||||
|
Effect of exchange rate changes on cash, cash equivalents, and restricted cash
|
475
|
2,843
|
||||||
|
Net increase (decrease) in cash, cash equivalents, and restrcited cash
|
31,421
|
(162,208
|
)
|
|||||
|
Cash, cash equivalents, and restricted cash, beginning of period
|
209,291
|
331,989
|
||||||
|
Cash, cash equivalents, and restricted cash, end of period
|
$
|
240,712
|
$
|
169,781
|
||||
Exhibit 99.5

Photronics, Inc. Q2 2020 Financial Results Conference CallMay 27, 2020

Safe Harbor Statement 2 This presentation and some of our comments may contain
projections or other forward-looking statements regarding future events, our future financial performance, and/or the future performance of the industry. These statements are predictions, and contain risks and uncertainties. Actual events or
results may differ materially from those presented. These statements include words like “anticipate”, “believe”, “estimate”, “expect”, “forecast”, “may”, “plan”, “project”, “in our view” or the negative thereto. We cannot guarantee the
accuracy of any forecasts or estimates, and we are not obligated to update any forward-looking statements if our expectations change. If you would like more information on the risks involved in forward-looking statements, please see the
documents we file from time to time with the Securities and Exchange Commission.

Employee healthHealth monitoringAdoption of best practicesGlobal visitor policyRaw material
supplyWeekly meetings to monitor global supply chainConstant contact with suppliersCustomer supportOpen communications with customers to understand needsConstant contact with logistic partnersTool maintenanceEngagement with virtual service
technicians where feasibleReliance on self-service expertise Response to COVID-19: Four Key Focus Areas 3

Revenue was $142.8M, down 11% Q/Q and up 9% Y/YFPD production remained at capacity, with
sequential mix shift away from G10.5+ and AMOLED as customers in China pushed out ordersIC revenue impacted by order push out from China customersRevenue of products shipped to China improved 39% Y/Y, but fell 20% Q/QNet income attributable
to Photronics, Inc. shareholders of $6.3M ($0.10/share)Cash balance grew to $238M; $31M operating cash generationRepurchased 0.5M shares for $6M; program terminated 3/26/2020China production contributed $17M to revenue; Hefei facility
generated operating profit and positive operating cash flow despite significant drop in G10.5+ demandRemain committed to growth strategy with commencement of next phase of FPD investment Q2 2020 Summary 4 Successfully repositioned the
business; China investments driving long-term, profitable growth

$M (except EPS) Q220 Q120 Q/Q Q219 Y/Y Revenue $ 142.8 $ 159.7 (11%) $
131.6 9% Gross Profit $ 30.4 $ 34.6 (12%) $ 26.0 17% Gross Margin 21.3% 21.7% (40 bps) 19.8% 150 bps Operating Income $ 12.7 $ 16.3 (22%) $ 9.2 38% Operating Margin 8.9% 10.2% (130 bps) 7.0% 190 bps Other income
(expense) ($ 1.0) $ 3.7 ($ 4.6) $ 3.9 ($ 4.9) Income tax provision $ 3.8 $ 9.1 ($ 5.3) $ 3.3 $ 0.5 Minority interest $ 1.7 $ 0.6 $ 1.1 $ 1.4 $ 0.3 Net Income* $ 6.3 $ 10.3 (39%) $ 8.5 (26%) Diluted EPS* $ 0.10 $
0.16 ($ 0.06) $ 0.13 ($ 0.03) Days in quarter 91 94 (3) 91 - Gross and operating margin moved in line with revenue (up Y/Y; down Q/Q)China operations were $1.0M negative impact to operating incomeOther income / (expense) primarily
due to FX gain / (loss)Minority interest reflects Taiwan JV gain offset by China JV loss Income Statement Summary 5 *Net income attributable to Photronics, Inc. shareholders
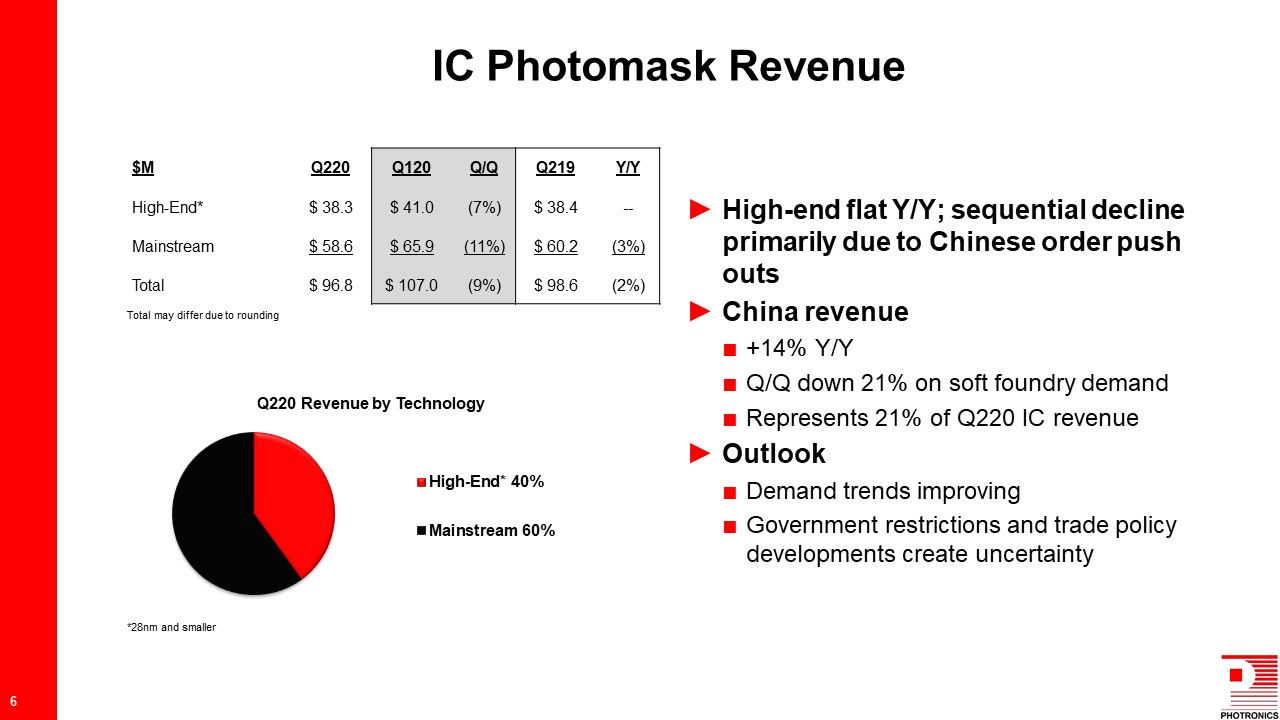
High-end flat Y/Y; sequential decline primarily due to Chinese order push outsChina revenue
+14% Y/YQ/Q down 21% on soft foundry demandRepresents 21% of Q220 IC revenueOutlookDemand trends improvingGovernment restrictions and trade policy developments create uncertainty $M Q220 Q120 Q/Q Q219 Y/Y High-End* $ 38.3 $
41.0 (7%) $ 38.4 -- Mainstream $ 58.6 $ 65.9 (11%) $ 60.2 (3%) Total $ 96.8 $ 107.0 (9%) $ 98.6 (2%) IC Photomask Revenue 6 *28nm and smaller Total may differ due to rounding
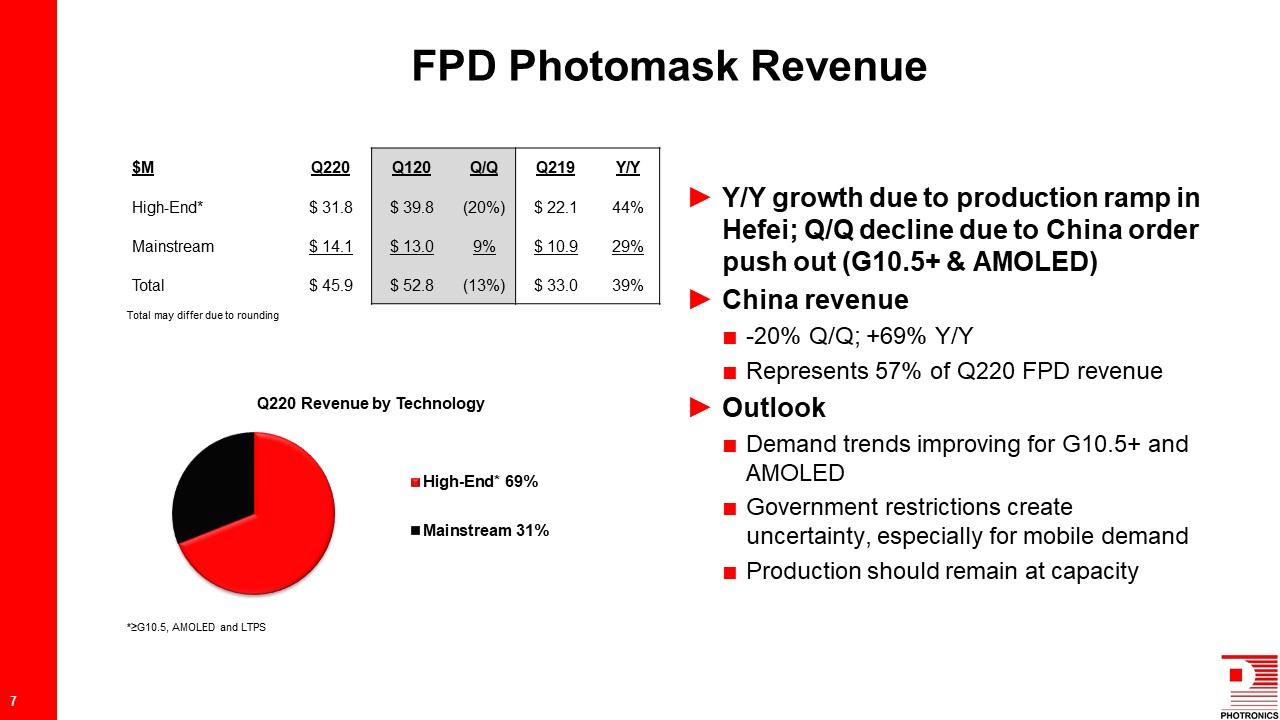
Y/Y growth due to production ramp in Hefei; Q/Q decline due to China order push out (G10.5+
& AMOLED)China revenue -20% Q/Q; +69% Y/YRepresents 57% of Q220 FPD revenueOutlookDemand trends improving for G10.5+ and AMOLEDGovernment restrictions create uncertainty, especially for mobile demandProduction should remain at
capacity $M Q220 Q120 Q/Q Q219 Y/Y High-End* $ 31.8 $ 39.8 (20%) $ 22.1 44% Mainstream $ 14.1 $ 13.0 9% $ 10.9 29% Total $ 45.9 $ 52.8 (13%) $ 33.0 39% FPD Photomask Revenue 7 *≥G10.5, AMOLED and LTPS Total may
differ due to rounding
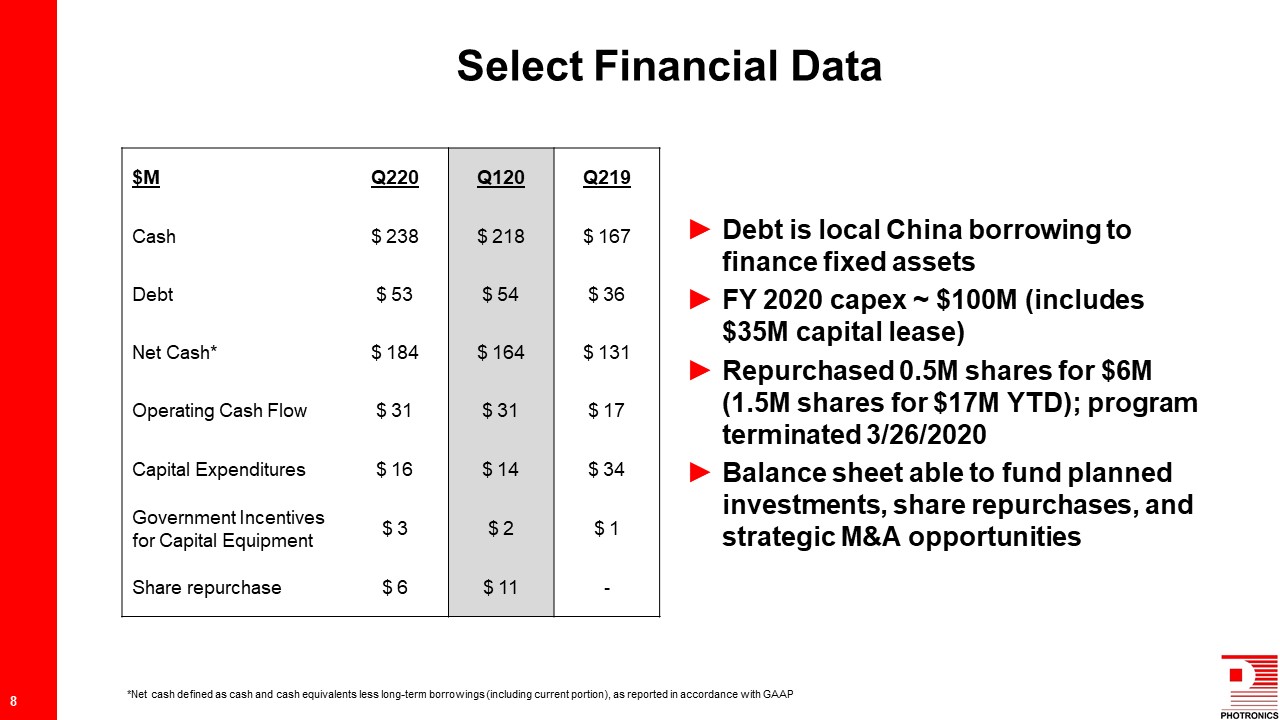
$M Q220 Q120 Q219 Cash $ 238 $ 218 $ 167 Debt $ 53 $ 54 $ 36 Net Cash* $
184 $ 164 $ 131 Operating Cash Flow $ 31 $ 31 $ 17 Capital Expenditures $ 16 $ 14 $ 34 Government Incentives for Capital Equipment $ 3 $ 2 $ 1 Share repurchase $ 6 $ 11 - Debt is local China borrowing to finance fixed
assetsFY 2020 capex ~ $100M (includes $35M capital lease)Repurchased 0.5M shares for $6M (1.5M shares for $17M YTD); program terminated 3/26/2020Balance sheet able to fund planned investments, share repurchases, and strategic M&A
opportunities Select Financial Data 8 *Net cash defined as cash and cash equivalents less long-term borrowings (including current portion), as reported in accordance with GAAP
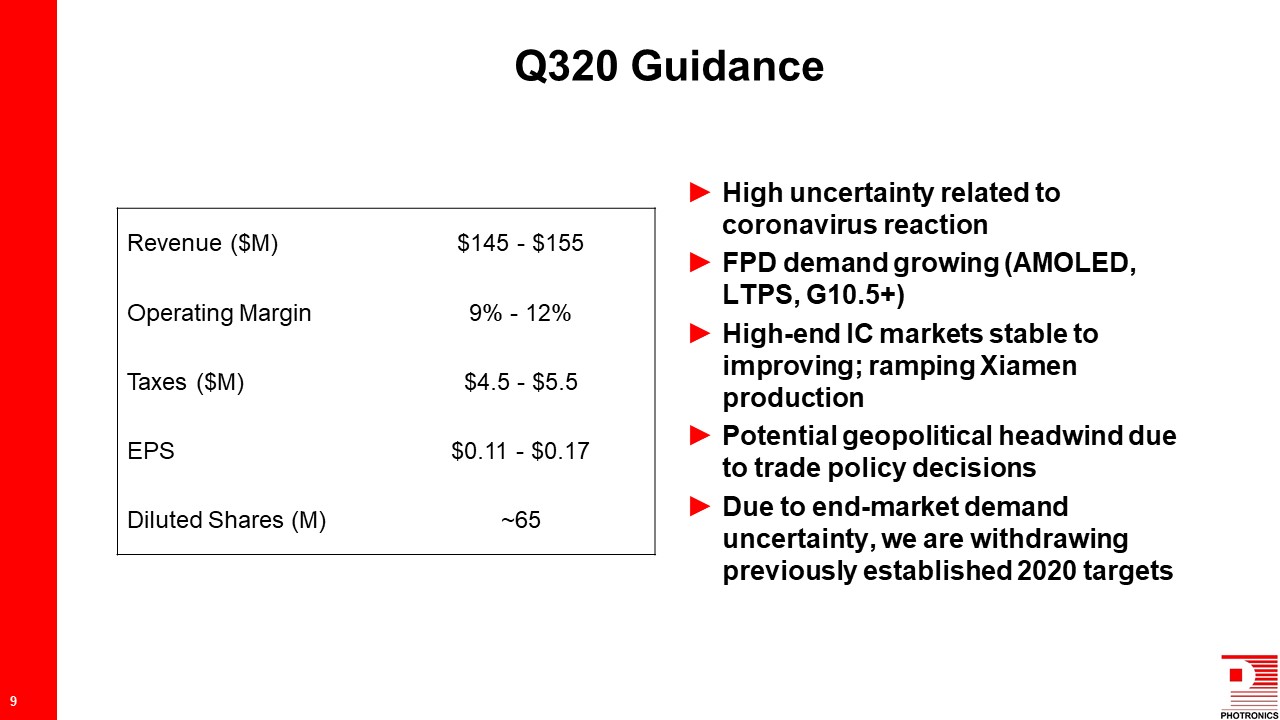
Revenue ($M) $145 - $155 Operating Margin 9% - 12% Taxes ($M) $4.5 - $5.5 EPS $0.11
- $0.17 Diluted Shares (M) ~65 High uncertainty related to coronavirus reactionFPD demand growing (AMOLED, LTPS, G10.5+)High-end IC markets stable to improving; ramping Xiamen productionPotential geopolitical headwind due to trade policy
decisionsDue to end-market demand uncertainty, we are withdrawing previously established 2020 targets Q320 Guidance 9

Thank you for your interest! For Additional Information:R. Troy Dewar, CFAVice President,
Investor [email protected]

Appendix
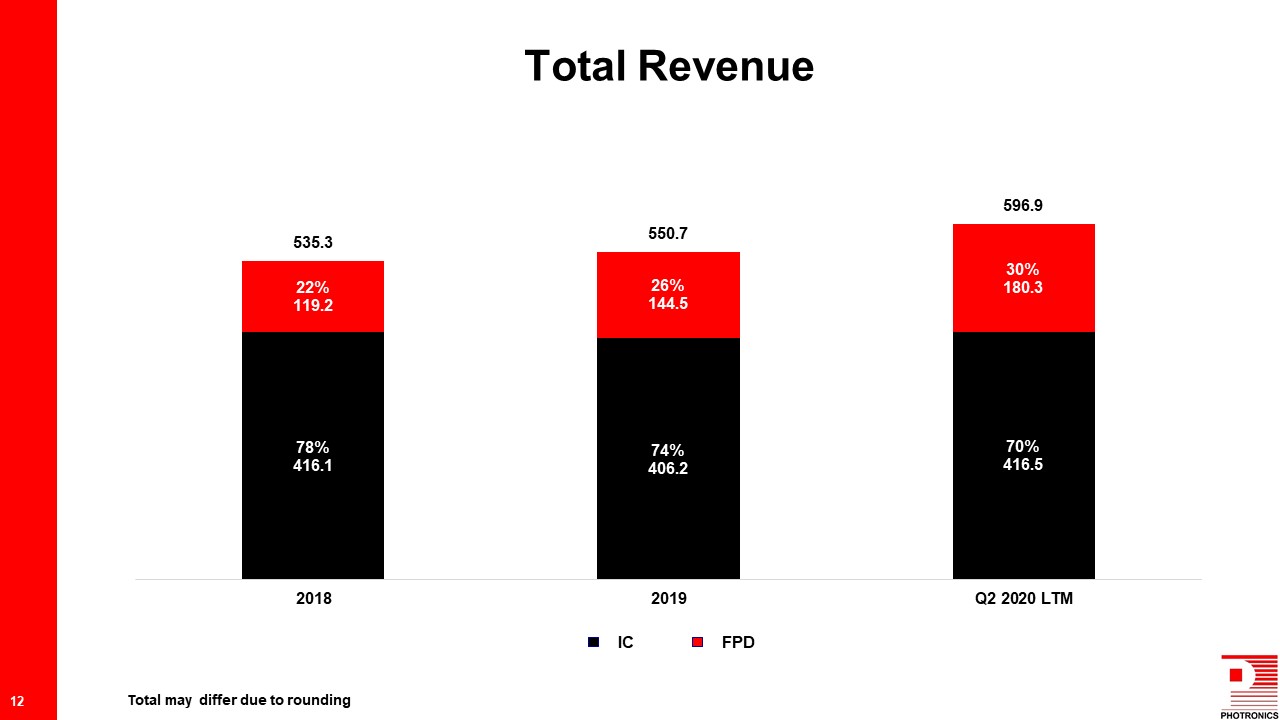
Total Revenue 12 IC FPD Total may differ due to rounding
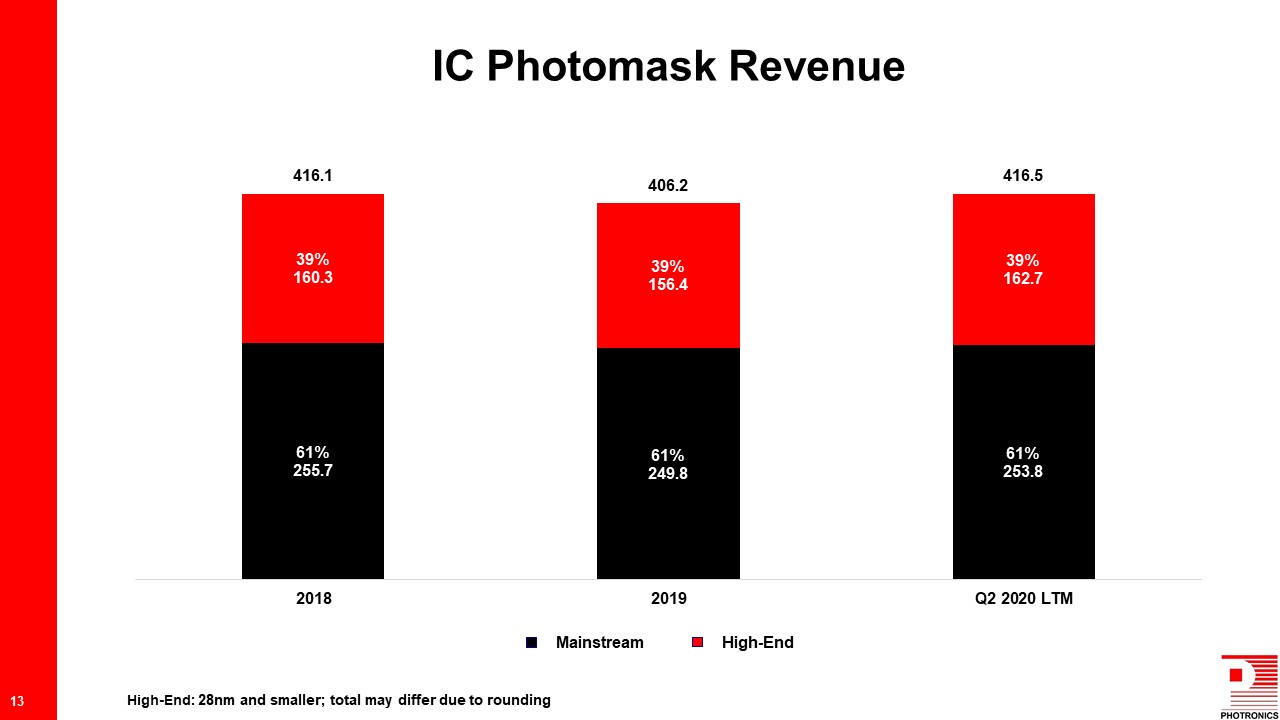
IC Photomask Revenue 13 Mainstream High-End High-End: 28nm and smaller; total may
differ due to rounding
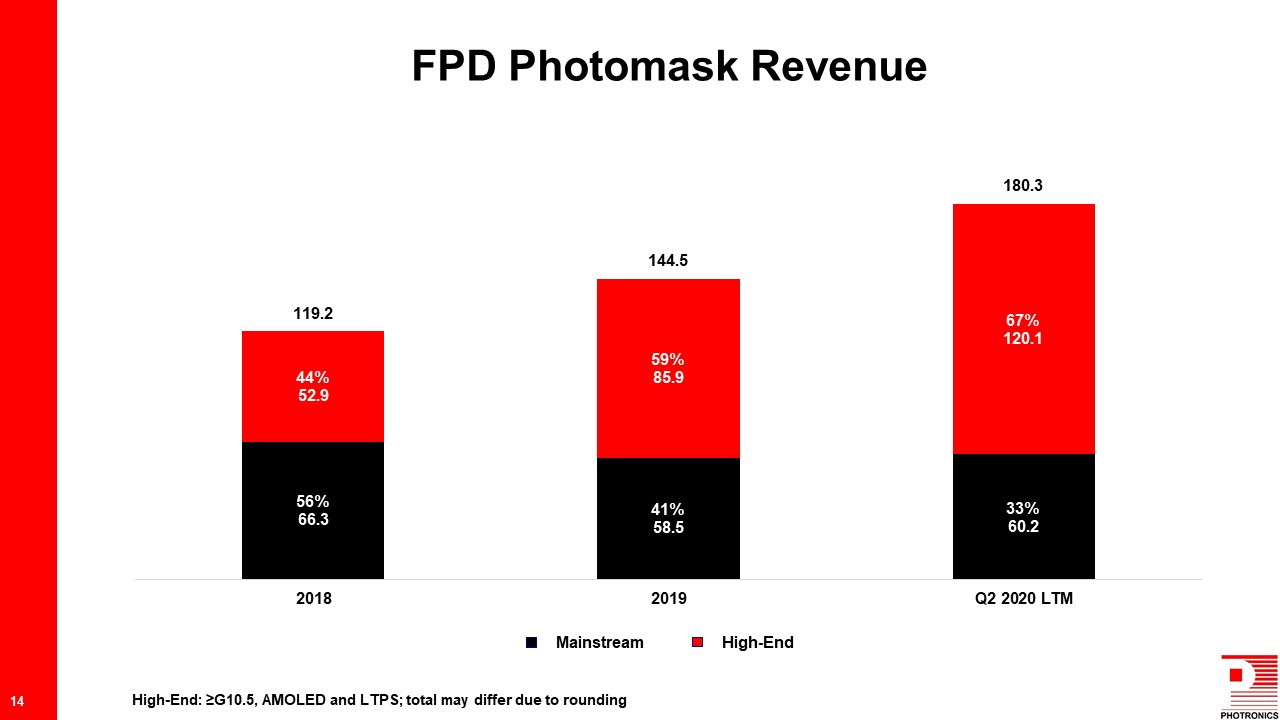
FPD Photomask Revenue 14 Mainstream High-End High-End: ≥G10.5, AMOLED and LTPS;
total may differ due to rounding