
R 8-K
Ryder System Inc (R)
8-K
2020-10-28
For: 2020-10-28
View Original
Added on
April 10, 2026
UNITED STATES
SECURITIES AND EXCHANGE COMMISSION
Washington, D.C. 20549
FORM 8-K
CURRENT REPORT
Pursuant to Section 13 OR 15(d) of The Securities Exchange Act of 1934
Date of Report (Date of earliest event reported): October 28, 2020
RYDER SYSTEM, INC.
(Exact name of registrant as specified in its charter)
| (State or other jurisdiction of incorporation) | (Commission File Number) | (I.R.S. Employer Identification No.) | ||||||
| (Zip Code) | |||||||||||
| (Address of principal executive offices) | |||||||||||
Registrant’s telephone number, including area code: (305 ) 500-3726
Not Applicable
(Former name or former address, if changed since last report.)
Check the appropriate box below if the Form 8-K filing is intended to simultaneously satisfy the filing obligation of the registrant under any of the following provisions (see General Instruction A.2. below):
| Written communications pursuant to Rule 425 under the Securities Act (17 CFR 230.425) | |||||
| Soliciting material pursuant to Rule 14a-12 under the Exchange Act (17 CFR 240.14a-12) | |||||
| Pre-commencement communications pursuant to Rule 14d-2(b) under the Exchange Act (17 CFR 240.14d-2(b)) | |||||
| Pre-commencement communications pursuant to Rule 13e-4(c) under the Exchange Act (17 CFR 240.13e-4(c)) | |||||
Securities registered pursuant to Section 12(b) of the Act:
| Title of each class | Trading Symbol(s) | Name of each exchange on which registered | ||||||
Indicate by check mark whether the registrant is an emerging growth company as defined in Rule 405 of the Securities Act of 1933 (§230.405 of this chapter) or Rule 12b-2 of the Securities Exchange Act of 1934 (§240.12b-2 of this chapter).
Emerging growth company ☐
If an emerging growth company, indicate by check mark if the registrant has elected not to use the extended transition period for complying with any new or revised financial accounting standards provided pursuant to Section 13(a) of the Exchange Act. ☐
Item 2.02 Results of Operations and Financial Condition
On October 28, 2020, we issued a press release reporting our financial results for the three months ended September 30, 2020 (the “Press Release”). The Press Release is available on our website at http://investors.ryder.com.
Item 7.01 Regulation FD Disclosure
We are hosting a conference call and webcast on October 28, 2020 during which we will make a presentation on our financial results for the three months ended September 30, 2020 (the "Presentation"). The Presentation has been made available on our website at http://investors.ryder.com.
The information in this Report, including Exhibit 99.1 and Exhibit 99.2, are being furnished pursuant to Item 2.02 of Form 8-K, and General Instruction B.2 thereunder and shall not be deemed to be incorporated by reference in any filing under the Securities Act of 1933 or the Securities Exchange Act of 1934, except as expressly set forth by specific reference to such filing.
Item 9.01(d) Exhibits
The following exhibits are furnished as part of this report on Form 8-K:
| Exhibit 99.1 | |||||
| Exhibit 99.2 | |||||
| Exhibit 104 | Cover Page Interactive Data File - The Cover page of this Current Report on Form 8-K, formatted in Inline XBRL. | ||||
SIGNATURE
Pursuant to the requirements of the Securities Exchange Act of 1934, the registrant has duly caused this report to be signed on its behalf by the undersigned hereunto duly authorized.
Date: | RYDER SYSTEM, INC. (Registrant) | |||||||
| By: | /s/ Scott T. Parker | |||||||
| Scott T. Parker Executive Vice President, Chief Financial Officer | ||||||||
News Release
Ryder Reports Third Quarter 2020 Results
•Q3 total revenue of $2.2 billion, down 3%, reflecting lower fuel revenue
•Q3 operating revenue (non-GAAP) of $1.8 billion, unchanged as higher revenues in supply chain solutions and lease were offset by lower revenues in commercial rental and dedicated transportation solutions
•Q3 GAAP EPS from continuing operations of $0.85 versus a loss of $(1.75) in prior year, primarily reflecting declining depreciation impact from prior residual value estimate changes as well as improved lease performance and higher supply chain solutions results
•Q3 comparable EPS (non-GAAP) from continuing operations of $1.21 versus a loss of $(1.49) in prior year
•Improvement in areas impacted by COVID-19:
◦Used vehicle sales results benefited from record sales volume and higher sequential truck and tractor pricing
◦Commercial rental demand and utilization improved throughout the quarter, with September utilization above same month in prior year
◦Supply chain automotive revenue returned to pre-pandemic levels
MIAMI, October 28, 2020 – Ryder System, Inc. (NYSE: R), a leader in supply chain, dedicated transportation, and commercial fleet management solutions, reported results for the three months ended September 30 as follows:
| (In millions, except EPS) | Earnings (Loss) Before Taxes | Earnings (Loss) | Diluted Earnings (Loss) Per Share | ||||||||||||||||||||||||||||||||
| 2020 | 2019 | 2020 | 2019 | 2020 | 2019 | ||||||||||||||||||||||||||||||
| Continuing operations (GAAP) | $ | 54.8 | $ | (91.3) | $ | 45.1 | $ | (91.5) | $ | 0.85 | $ | (1.75) | |||||||||||||||||||||||
| Non-operating pension costs | 7.2 | 6.9 | 4.7 | 4.9 | 0.09 | 0.09 | |||||||||||||||||||||||||||||
| Restructuring and other, net | 13.8 | 5.2 | 11.2 | 4.0 | 0.21 | 0.08 | |||||||||||||||||||||||||||||
| ERP implementation costs | 5.8 | 6.1 | 4.3 | 4.5 | 0.08 | 0.09 | |||||||||||||||||||||||||||||
| Gains on sale of properties | (3.7) | — | (3.4) | — | (0.06) | — | |||||||||||||||||||||||||||||
| Tax adjustments | — | — | 2.1 | — | 0.04 | — | |||||||||||||||||||||||||||||
| Comparable (non-GAAP) | $ | 77.8 | $ | (73.0) | $ | 63.8 | $ | (78.1) | $ | 1.21 | $ | (1.49) | |||||||||||||||||||||||
Note: Amounts may not be additive due to rounding. | |||||||||||||||||||||||||||||||||||
Total and operating revenue for the three months ended September 30 were as follows:
| (In millions) | Total Revenue | Operating Revenue (non-GAAP) | |||||||||||||||||||||||||||||||||
| 2020 | 2019 | Change | 2020 | 2019 | Change | ||||||||||||||||||||||||||||||
| Total | $ | 2,151 | 2,224 | (3)% | $ | 1,790 | 1,796 | —% | |||||||||||||||||||||||||||
| Fleet Management Solutions (FMS) | $ | 1,297 | 1,397 | (7)% | $ | 1,153 | 1,190 | (3)% | |||||||||||||||||||||||||||
| Supply Chain Solutions (SCS) | $ | 685 | 618 | 11% | $ | 492 | 454 | 9% | |||||||||||||||||||||||||||
| Dedicated Transportation Solutions (DTS) | $ | 300 | 359 | (17)% | $ | 234 | 248 | (6)% | |||||||||||||||||||||||||||
CEO Comment
Commenting on the company's third quarter results, response to the challenges of COVID-19, and the current business environment, Ryder Chairman and CEO Robert Sanchez said, "Over the last year, we've taken significant actions to address a historic downturn in the used vehicle market and the impacts from COVID-19 on our used vehicle sales, commercial rental, and automotive supply chain businesses. These actions include adjusting our vehicle residual values, reducing the size of our rental fleet, and lowering operating and overhead costs. In addition, we have remained focused on our strategic initiatives to achieve our goal of 15% adjusted return on equity.
"In the third quarter, we saw improvement in the areas of our business most directly impacted by the pandemic. An improved freight environment contributed to the stabilization of used vehicle and rental market conditions in the quarter. Strong automotive production activity benefited our supply chain automotive business. We also continued to see the positive results of the actions we are taking.
"Fleet management results benefited from a declining impact from prior residual value estimate changes as well as improved lease performance. Lease performance benefited from higher pricing on lease vehicles reflecting our lease pricing initiative, and lower maintenance costs, including benefits from our cost-savings initiative. We realized gains on used vehicle sales from higher sequential pricing and lowered our inventory from the second quarter, driven by record used vehicle sales volume. We now expect our used vehicle inventory at year-end to be within our target range. We also continue to see solid momentum in the recovery of commercial rental due to increased freight activity, as well as actions taken to downsize the fleet. Utilization in the third quarter of 71% was up significantly from 56% in the prior quarter and October utilization to date is trending higher sequentially. Utilization for the fourth quarter is expected to be in line with the prior year.
"In our supply chain business, automotive revenue exceeded pre-COVID levels during the quarter, primarily reflecting higher automotive production support activity following shutdowns earlier this year. We're seeing strong sales in our supply chain business driven by favorable outsourcing trends. Growth with new and existing supply chain customers, as well as high COVID-19 related volumes and temporary cost benefits, resulted in pre-tax margins above our target range. Our supply chain business is also benefiting from accelerating trends in areas such as last-mile delivery of big-and-bulky goods and e-commerce fulfillment. Ryder Last Mile revenues were up nearly 30%, delivering returns in the quarter well above our overall target for SCS. These results were driven by new business as well as higher volumes partially due to COVID-19. We recently expanded our e-fulfillment distribution network and deployed automation technology.
"Looking ahead to the fourth quarter, we anticipate returns in supply chain and dedicated to moderate, reflecting seasonality and lower COVID-related activity, and to be within their target ranges for the full year. Also in the fourth quarter, we will be awarding our front-line employees a special recognition and retention bonus for their extraordinary efforts as essential workers during this pandemic, resulting in a one-time expense of approximately $30 million. We expect these sequential headwinds to be partially offset by a declining impact from depreciation due to prior residual value estimate changes and other items. In rental, we expect return improvements to accelerate in the fourth quarter due to higher demand and improved utilization. In lease, we expect the fleet to continue to decline; however, pricing is expected to be higher reflecting our pricing initiative. We anticipate record free cash flow of $1.4 to $1.5 billion in 2020, significantly above the prior year negative free cash flow of $(1.1) billion. Additionally, in the fourth quarter we expect to resume our anti-dilutive share repurchase program which was temporarily paused due to COVID-19.
2
"I would also like to highlight our recent announcement of RyderVentures, a corporate venture capital fund aimed at investing $50 million over the next five years. The fund plans to invest in and partner with start-up companies that are developing new technologies that address disruptions in the supply chain, driven by accelerating demand for e-commerce fulfillment, asset sharing, next-generation vehicles, automation, and data analytics, among others."
Third Quarter Business Segment Operating Results
Fleet Management Solutions: Earnings Improved Primarily Reflecting Declining Impact of Depreciation Expense from Prior Residual Value Estimate Changes and Improved Lease Performance
| (In millions) | 3Q20 | 3Q19 | Change | ||||||||||||||
| Total Revenue | $ | 1,297 | 1,397 | (7)% | |||||||||||||
Operating Revenue (1) | $ | 1,153 | 1,190 | (3)% | |||||||||||||
Earnings Before Tax (EBT) (2) | $ | 16 | (109) | NM | |||||||||||||
| FMS EBT as a % of FMS total revenue | 1.2 | % | (7.8) | % | 900 bps | ||||||||||||
FMS EBT as a % of FMS operating revenue (1) | 1.4 | % | (9.1) | % | 1,050 bps | ||||||||||||
(1) Non-GAAP financial measure excluding fuel and lease liability insurance revenue. (2) EBT in 3Q20 and 3Q19 included $100M and $208M of depreciation expense, respectively, from the impact of policy and accelerated depreciation due to 2020 and 2019 residual values estimate changes. NM - Not Meaningful | |||||||||||||||||
3Q20 earnings impact from residual value estimate changes | |||||||||||||||||
| 3Q20 Estimated | 3Q20 Actual | ||||||||||||||||
EBT impact from residual value estimate changes(1) | $115 | $100 | |||||||||||||||
(1) In the second quarter of 2020, we projected that the 3Q20 estimated impact from policy and accelerated depreciation due to residual value estimate changes made in 2019 and 2020 would be $115M of depreciation expense. The actual impact was $100M which included $13M in gains on used vehicle sales, net, as an offset to the depreciation expense. The difference between the estimated impact and the actual impact was $15M, primarily due to gains of $13M on used vehicle sales, net, which was not included in 3Q20 estimates. | |||||||||||||||||
In the Fleet Management Solutions (FMS) business segment, total revenue and operating revenue declined primarily due to a 16% decrease in commercial rental revenue resulting from lower demand, partially offset by higher pricing on lease vehicles.
FMS EBT increased by $125 million reflecting a declining impact of depreciation expense from prior vehicle residual value estimate changes and higher gains on used vehicles sold together totaling $108 million. Results also benefited from higher pricing on lease vehicles and lower maintenance costs, including benefits from our cost-savings initiative. Used vehicle sales results improved from the prior year from lower inventory valuation adjustments and higher gains on used vehicles sold. These benefits were partially offset by lower commercial rental results. Rental power fleet utilization in the quarter was 71% as compared to 56% in the second quarter and 74% in the prior year. Utilization increased throughout the third quarter due to improving economic conditions and actions taken to reduce the rental fleet size. FMS earnings before tax as a percentage of FMS operating revenue is below the company's
3
long-term target of high single digits, reflecting depreciation from prior residual value estimate changes and lower rental results.
Supply Chain Solutions: Strong Results from Growth and Improved Operating Performance
| (In millions) | 3Q20 | 3Q19 | Change | ||||||||||||||
| Total Revenue | $ | 685 | 618 | 11% | |||||||||||||
Operating Revenue (1) | $ | 492 | 454 | 9% | |||||||||||||
| Earnings Before Tax (EBT) | $ | 58 | 35 | 67% | |||||||||||||
| EBT as a % of total revenue | 8.4% | 5.6% | 280 bps | ||||||||||||||
EBT as a % of operating revenue (1) | 11.8% | 7.6% | 420 bps | ||||||||||||||
(1) Non-GAAP financial measure excluding fuel and subcontracted transportation. | |||||||||||||||||
In the Supply Chain Solutions (SCS) business segment, total revenue and operating revenue increased primarily due to new business, higher volumes, and increased pricing. Increased volumes were partly due to higher automotive production support following shutdowns earlier in the year, as well as COVID-19 related freight increases in the consumer packaged goods vertical and Ryder Last Mile.
SCS earnings before tax increased due to new business, higher pricing, and improved operating performance. SCS EBT as a percentage of SCS operating revenue is above the company's long-term target of high single digits.
Dedicated Transportation Solutions: Higher Earnings Due to Declining Impact from Prior Vehicle Residual Value Estimate Changes, a One-Time Item, and Improved Operating Performance
| (In millions) | 3Q20 | 3Q19 | Change | ||||||||||||||
| Total Revenue | $ | 300 | 359 | (17)% | |||||||||||||
Operating Revenue (1) | $ | 234 | 248 | (6)% | |||||||||||||
| Earnings Before Tax (EBT) | $ | 25 | 18 | 34% | |||||||||||||
| EBT as a % of total revenue | 8.3% | 5.1% | 320 bps | ||||||||||||||
EBT as a % of operating revenue (1) | 10.6% | 7.5% | 310 bps | ||||||||||||||
(1) Non-GAAP financial measure excluding fuel and subcontracted transportation. | |||||||||||||||||
In the Dedicated Transportation Solutions (DTS) business segment, total revenue and operating revenue declined primarily due to non-renewed business and lower volumes.
DTS earnings before tax increased due to a declining impact associated with prior residual value estimate changes, a one-time benefit from a customer contract termination, and improved operating performance. DTS EBT as a percentage of DTS operating revenue is above the company's long-term target of high single digits.
4
Corporate Financial Information
Income Taxes
Our effective income tax rate from continuing operations for the third quarter of 2020 was an expense of 17.7% as compared to an expense of 0.3% in the prior year. The tax rate was impacted by additional depreciation expense in both periods. The comparable effective income tax rate (a non-GAAP measure) from continuing operations for the third quarter of 2020 was an expense of 17.9% as compared to an expense of 7.0% in the prior year.
Capital Expenditures, Cash Flow, and Leverage
Year-to-date gross capital expenditures decreased to $0.8 billion in 2020 compared with $3.0 billion in 2019 due to lower investments in the lease and rental fleets. The company now expects full year 2020 gross capital expenditures of $1.0 billion to $1.1 billion versus the prior forecast of $1.0 billion to $1.3 billion.
Year-to-date operating cash flow was $1.7 billion in 2020, up from $1.6 billion in 2019. Free cash flow (a non-GAAP measure) was positive $1.2 billion, compared with negative $(965) million in 2019, reflecting decreased capital spending. The company expects full year 2020 operating cash flow of $2.0 to $2.1 billion. Due to lower capital spending, the company expects full year 2020 free cash flow of $1.4 billion to $1.5 billion as compared with negative free cash flow of $(1.1) billion in the prior year.
Debt-to-equity as of September 30, 2020 was 346%, compared with 377% at the end of the second quarter and 320% at year-end 2019, and above the company's long-term target of 250-300%. The increase in debt-to-equity from year-end 2019 reflects the reduction in equity related to higher depreciation expense, a higher cash balance due to the uncertainty of the economic environment, and a pension equity charge. These items were partially offset by a reduction in debt due to higher free cash flow. A higher than normal cash balance and the pension equity charge increased debt-to-equity by approximately 25 and 10 percentage points, respectively.
5
Supplemental Company Information
Third Quarter Net Earnings
| (In millions, except EPS) | Earnings | Diluted EPS | |||||||||||||||||||||
| 2020 | 2019 | 2020 | 2019 | ||||||||||||||||||||
| Earnings (loss) from continuing operations | $ | 45.1 | (91.5) | $ | 0.85 | (1.75) | |||||||||||||||||
| Discontinued operations | (9.3) | 0.1 | (0.17) | — | |||||||||||||||||||
| Net earnings (loss) | $ | 35.8 | (91.5) | $ | 0.68 | (1.75) | |||||||||||||||||
Year-to-Date Operating Results
| (In millions, except EPS) | Nine months ended September 30, | ||||||||||||||||
| 2020 | 2019 | Change | |||||||||||||||
| Total revenue | $ | 6,207 | 6,649 | (7) | % | ||||||||||||
| Operating revenue (non-GAAP) | $ | 5,185 | 5,350 | (3) | % | ||||||||||||
| Earnings (loss) from continuing operations | $ | (137.7) | 29.8 | NM | |||||||||||||
| Comparable earnings (loss) from continuing operations (non-GAAP) | $ | (57.7) | 54.2 | NM | |||||||||||||
| Net earnings (loss) | $ | (147.9) | 29.1 | NM | |||||||||||||
| Earnings (loss) per common share (EPS) - Diluted | |||||||||||||||||
| Continuing operations | $ | (2.64) | 0.56 | NM | |||||||||||||
| Comparable (non-GAAP) | $ | (1.11) | 1.03 | NM | |||||||||||||
| Net earnings (loss) | $ | (2.83) | 0.55 | NM | |||||||||||||
Business Description
Ryder System, Inc. is a leading supply chain, dedicated transportation, and commercial fleet management solutions company. Ryder’s stock (NYSE: R) is a component of the Dow Jones Transportation Average and the S&P MidCap 400® index. The company’s financial performance is reported in the following three, inter-related business segments:
•Supply Chain Solutions – Ryder’s SCS business segment optimizes logistics networks to make them more responsive and able to be leveraged as a competitive advantage. Globally-recognized brands in the automotive, consumer goods, food and beverage, healthcare, industrial, oil and gas, technology, and retail industries rely on Ryder’s leading-edge technologies and world-class logistics engineers to help them deliver the goods that consumers use every day.
•Dedicated Transportation Solutions – Ryder’s DTS business segment combines the best of Ryder’s leasing and maintenance capability with the safest and most professional drivers in the industry. With a dedicated transportation solution, Ryder helps customers increase their competitive position, reduce risk, and integrate their transportation needs with their overall supply chain.
•Fleet Management Solutions – Ryder’s FMS business segment provides a broad range of services to help businesses of all sizes, across virtually every industry, deliver for their customers. From leasing, maintenance, and fueling, to commercial rental and used vehicle sales, customers rely on Ryder’s expertise to help them lower their costs, redirect capital to other parts of their business, and focus on what they do best – so they can grow.
For more information on Ryder System, Inc., visit investors.ryder.com and ryder.com.
###
6
Note: Regarding Forward-Looking Statements
Certain statements and information included in this news release are “forward-looking statements” under the Federal Private Securities Litigation Reform Act of 1995, including our forecast, outlook, expectations regarding market trends and economic environment; impact of the COVID-19 pandemic on earnings, depreciation, commercial rental demand and utilization, used vehicle sales volume and pricing, and automotive supply chain volumes; the adequacy of steps we have taken to mitigate the negative impacts of COVID-19 on our operations; expected benefits from our strategic initiatives and our multi-year maintenance cost-savings initiatives; our ability to implement our asset management strategy to right size our fleet; performance in our product lines and segments; residual values and depreciation expense; used vehicle inventory; rental utilization; free cash flow; operating cash flow; capital expenditures; fleet growth; profitability of our Ryder Last Mile operations; resumption of the anti-dilutive share repurchase program; and our ability to obtain our projected benefits from our investments and partnerships through the RyderVentures capital fund. Our forward-looking statements also include our estimates of the impact of our changes to residual value estimates on earnings and depreciation expense. The expected impact of the change in residual value estimates is based on our current assessment of the residual values and useful lives of revenue-earning equipment based on multi-year trends and our outlook for the expected near-term used vehicle market. Our assessment is subject to risks, uncertainties, and assumptions as to future events that may not prove to be accurate. Factors that could cause actual results related to vehicle residual values to materially differ from estimates include, but are not limited to, changes in supply and demand, competitor pricing, regulatory requirements, driver shortages, requirements and preferences, as well as changes in underlying assumption factors.
All of our forward-looking statements should be evaluated with consideration given to the many risks and uncertainties inherent in our business that could cause actual results and events to differ materially from those in the forward-looking statements. Important factors that could cause such differences include, among others, the duration and severity of the COVID-19 pandemic and governmental responses thereto; our ability to adapt to changing market conditions, lower than expected contractual sales, decreases in commercial rental demand or utilization or poor acceptance of rental pricing, worsening of market demand for or excess supply of used vehicles impacting current and/or estimated pricing and our anticipated proportion of retail versus wholesale sales, lack of customer demand for our services, higher than expected maintenance costs, lower than expected benefits from our cost-savings initiatives, lower than expected benefits from our sales, marketing and new product initiatives, higher than expected costs related to our ERP implementation, setbacks or uncertainty in the economic market or in our ability to grow and retain profitable customer accounts, implementation or enforcement of regulations, decreases in freight demand or volumes, used vehicle inventory levels, poor operational execution including with respect to new accounts and product launches, our difficulty in obtaining adequate profit margins for our services, our inability to maintain current pricing levels due to soft economic conditions, business interruptions or expenditures due to labor disputes, severe weather or natural occurrences, competition from other service providers and new entrants, lower than anticipated customer retention levels, loss of key customers, driver and technician shortages resulting in higher procurement costs and turnover rates, higher than expected bad debt reserves or write-offs, changes in customers' business environments that will limit their ability to commit to long-term vehicle leases, a decrease in credit ratings, increased debt costs, adequacy of accounting estimates, higher than expected reserves and accruals particularly with respect to pension, taxes, depreciation, insurance and revenue, impact of changes in our residual value estimates and accounting policies, including our depreciation policy, the sudden or unusual changes in fuel prices, unanticipated currency exchange rate fluctuations, our ability to manage our cost structure, and the risks described in our filings with the Securities and Exchange Commission (SEC). The risks included here are not exhaustive. New risks emerge from time to time and it is not possible for management to predict all such risk factors or to assess the impact of such risks on our business. Accordingly, we undertake no obligation to publicly update or revise any forward-looking statements, whether as a result of new information, future events, or otherwise.
Note: Regarding Non-GAAP Financial Measures
This news release includes certain non-GAAP financial measures as defined under SEC rules. Refer to Appendix - Non-GAAP Financial Measure Reconciliations at the end of the tables following this press release for reconciliations of the non-GAAP financial measures contained in this release to the nearest GAAP measure and why management believes that presentation of each measure provides useful information to investors. Additional information regarding non-GAAP financial measures as required by Regulation G and Item 10(e) of Regulation S-K can be found in our most recent Form 10-K, Form 10-Q and our Form 8-K filed as of the date of this release with the SEC, which are available at http://investors.ryder.com.
7
CONFERENCE CALL AND WEBCAST INFORMATION
Ryder’s earnings conference call and webcast is scheduled for October 28, 2020 at 11:00 a.m. ET. To join, click here.
LIVE AUDIO VIA PHONE
Toll Free Number: 888-352-6803
USA Toll Number: 323-701-0225
Audio Passcode: Ryder
Conference Leader: Bob Brunn
AUDIO REPLAY VIA PHONE
An audio replay of the call will be available one hour after call ends for 30 days.
Toll Free Number: 888-203-1112
USA Toll Number: 719-457-0820
Replay Passcode: 1420126
AUDIO REPLAY VIA MP3 DOWNLOAD
A podcast will be available within 24 hours after the end of the call. Click here then select Financials/Quarterly Reports and the date.
AUDIO & SLIDE REPLAY VIA INTERNET
An audio replay including the slide presentation will be available on the Internet within two hours following the call. Click here then select Financials/Quarterly Reports and the date.
Contacts: Media: Investor Relations:
Amy Federman Bob Brunn
(305) 500-4989 (305) 500-4053
ryder-financial
ryder-usa
8
RYDER SYSTEM, INC. AND SUBSIDIARIES
CONDENSED CONSOLIDATED STATEMENTS OF EARNINGS - UNAUDITED
Periods ended September 30, 2020 and 2019
(In millions, except per share amounts)
| Three Months | Nine Months | ||||||||||||||||||||||
| 2020 | 2019 | 2020 | 2019 | ||||||||||||||||||||
| Lease & related maintenance and rental revenues | $ | 933.8 | 959.2 | $ | 2,730.2 | 2,792.6 | |||||||||||||||||
| Services revenue | 1,120.5 | 1,120.9 | 3,175.0 | 3,412.0 | |||||||||||||||||||
| Fuel services revenue | 96.3 | 143.8 | 302.0 | 444.6 | |||||||||||||||||||
| Total revenues | 2,150.6 | 2,223.9 | 6,207.2 | 6,649.3 | |||||||||||||||||||
| Cost of lease & related maintenance and rental | 758.4 | 877.8 | 2,352.0 | 2,229.6 | |||||||||||||||||||
| Cost of services | 932.5 | 948.1 | 2,680.3 | 2,896.2 | |||||||||||||||||||
| Cost of fuel services | 92.9 | 140.2 | 291.4 | 431.9 | |||||||||||||||||||
| Other operating expenses | 30.0 | 28.9 | 93.4 | 92.2 | |||||||||||||||||||
| Selling, general and administrative expenses | 211.2 | 216.0 | 643.9 | 673.8 | |||||||||||||||||||
| Non-operating pension costs | 7.2 | 6.9 | 9.4 | 20.1 | |||||||||||||||||||
| Used vehicle sales, net | (12.9) | 22.7 | 17.3 | 49.1 | |||||||||||||||||||
| Interest expense | 62.6 | 62.5 | 192.5 | 178.6 | |||||||||||||||||||
| Miscellaneous (income) loss, net | (10.6) | 0.7 | (11.8) | (29.5) | |||||||||||||||||||
| Restructuring and other items, net | 24.5 | 11.4 | 92.6 | 27.4 | |||||||||||||||||||
| 2,095.8 | 2,315.2 | 6,360.8 | 6,569.3 | ||||||||||||||||||||
| Earnings (loss) from continuing operations before income taxes | 54.8 | (91.3) | (153.6) | 80.0 | |||||||||||||||||||
| Provision for (benefit from) income taxes | 9.7 | 0.3 | (15.9) | 50.2 | |||||||||||||||||||
| Earnings (loss) from continuing operations | 45.1 | (91.5) | (137.7) | 29.8 | |||||||||||||||||||
| Income (loss) from discontinued operations, net of tax | (9.3) | 0.1 | (10.1) | (0.7) | |||||||||||||||||||
| Net earnings (loss) | $ | 35.8 | (91.5) | $ | (147.9) | 29.1 | |||||||||||||||||
| Earnings (loss) per common share — Diluted | |||||||||||||||||||||||
| Continuing operations | $ | 0.85 | (1.75) | $ | (2.64) | 0.56 | |||||||||||||||||
| Discontinued operations | (0.17) | — | (0.20) | (0.02) | |||||||||||||||||||
| Net earnings | $ | 0.68 | (1.75) | $ | (2.83) | 0.55 | |||||||||||||||||
| Earnings (loss) per share information — Diluted | |||||||||||||||||||||||
| Earnings from continuing operations | $ | 45.1 | (91.5) | $ | (137.7) | 29.8 | |||||||||||||||||
| Less: Distributed and undistributed earnings allocated to unvested stock | (0.2) | (0.1) | (0.4) | (0.3) | |||||||||||||||||||
| Earnings from continuing operations available to common stockholders | $ | 44.9 | (91.7) | $ | (138.1) | 29.5 | |||||||||||||||||
| Weighted-average common shares outstanding — Diluted | 52.7 | 52.3 | 52.4 | 52.6 | |||||||||||||||||||
| EPS from continuing operations | $ | 0.85 | (1.75) | $ | (2.64) | 0.56 | |||||||||||||||||
| Non-operating pension costs | 0.09 | 0.09 | 0.09 | 0.27 | |||||||||||||||||||
| Restructuring and other, net | 0.21 | 0.08 | 0.69 | 0.21 | |||||||||||||||||||
| ERP implementation costs | 0.08 | 0.09 | 0.38 | 0.19 | |||||||||||||||||||
| Gains on sale of properties | (0.06) | — | (0.06) | (0.26) | |||||||||||||||||||
| Tax adjustments, net | 0.04 | — | 0.43 | 0.06 | |||||||||||||||||||
| Comparable EPS from continuing operations * | $ | 1.21 | (1.49) | $ | (1.11) | 1.03 | |||||||||||||||||
*Non-GAAP financial measure. A reconciliation of GAAP EPS from continuing operations to comparable EPS from continuing operations is set forth in this table.
Note: Amounts may not be additive due to rounding.
9
RYDER SYSTEM, INC. AND SUBSIDIARIES
CONDENSED CONSOLIDATED BALANCE SHEETS - UNAUDITED
(In millions)
| September 30, 2020 | December 31, 2019 | ||||||||||
| Assets: | |||||||||||
| Cash and cash equivalents | $ | 684.2 | 73.6 | ||||||||
| Other current assets | 1,348.6 | 1,488.5 | |||||||||
| Revenue earning equipment, net | 9,082.6 | 10,427.7 | |||||||||
| Operating property and equipment, net | 913.4 | 917.8 | |||||||||
| Other assets | 1,613.2 | 1,567.8 | |||||||||
| $ | 13,642.0 | 14,475.3 | |||||||||
| Liabilities and shareholders' equity: | |||||||||||
| Current liabilities | $ | 1,385.2 | 1,470.8 | ||||||||
| Total debt (including current portion) | 7,436.6 | 7,924.8 | |||||||||
| Other non-current liabilities (including deferred income taxes) | 2,669.7 | 2,603.4 | |||||||||
| Shareholders' equity | 2,150.6 | 2,476.3 | |||||||||
| $ | 13,642.0 | 14,475.3 | |||||||||
SELECTED KEY RATIOS AND METRICS
| September 30, 2020 | December 31, 2019 | ||||||||||
| Debt to equity | 346 | % | 320 | % | |||||||
| Effective interest rate (average cost of debt) | 3.2 | % | 3.2 | % | |||||||
| Three months ended September 30, | Nine months ended September 30, | ||||||||||||||||||||||
| 2020 | 2019 | 2020 | 2019 | ||||||||||||||||||||
| Comparable EBITDA* | $ | 640.3 | 592.2 | $ | 1,708.1 | 1,704.3 | |||||||||||||||||
| Nine months ended September 30, | |||||||||||
| 2020 | 2019 | ||||||||||
| Net cash provided by operating activities from continuing operations | $ | 1,696.6 | 1,589.2 | ||||||||
| Free cash flow * | 1,217.9 | (964.6) | |||||||||
| Capital expenditures paid | 879.4 | 2,957.2 | |||||||||
| Capital expenditures (accrual basis) | $ | 765.0 | 2,999.0 | ||||||||
| Less: Proceeds from sales (primarily revenue earning equipment) | (400.7) | (403.5) | |||||||||
| Net capital expenditures | $ | 364.3 | 2,595.5 | ||||||||
| Twelve months ended September 30, | |||||||||||
| 2020 | 2019 | ||||||||||
| Adjusted return on equity * | (4.4) | % | 5.3 | % | |||||||
| Adjusted return on capital * | 1.0 | % | 3.2 | % | |||||||
| Weighted average cost of capital | 4.5 | % | 4.6 | % | |||||||
| Adjusted return on capital spread ** | (3.5) | % | (1.4) | % | |||||||
* Non-GAAP financial measure. See reconciliation of the non-GAAP elements of this calculation reconciled to the corresponding GAAP measures included in the Appendix - Non-GAAP Financial Measures section at the end of this release.
** Non-GAAP financial measure. Adjusted return on capital spread is calculated as the difference of the adjusted return on capital and the weighted average cost of capital.
Note: Amounts may not be additive due to rounding.
10
RYDER SYSTEM, INC. AND SUBSIDIARIES
BUSINESS SEGMENT REVENUE AND EARNINGS - UNAUDITED
Periods ended September 30, 2020 and 2019
(In millions)
| Three Months | Nine Months | ||||||||||||||||||||||||||||||||||
| 2020 | 2019 | B(W) | 2020 | 2019 | B(W) | ||||||||||||||||||||||||||||||
| Total Revenue: | |||||||||||||||||||||||||||||||||||
| Fleet Management Solutions: | |||||||||||||||||||||||||||||||||||
| ChoiceLease | $ | 788.2 | 770.7 | 2 | % | $ | 2,346.5 | 2,268.0 | 3 | % | |||||||||||||||||||||||||
| SelectCare | 128.4 | 133.4 | (4) | % | 390.4 | 405.6 | (4) | % | |||||||||||||||||||||||||||
| Commercial rental | 220.1 | 263.0 | (16) | % | 595.0 | 753.0 | (21) | % | |||||||||||||||||||||||||||
| Other | 16.7 | 22.5 | (25) | % | 52.5 | 68.7 | (24) | % | |||||||||||||||||||||||||||
| Fuel services revenue | 138.9 | 198.7 | (30) | % | 429.5 | 618.9 | (31) | % | |||||||||||||||||||||||||||
| ChoiceLease liability insurance revenue | 5.0 | 9.1 | (45) | % | 21.7 | 25.7 | (15) | % | |||||||||||||||||||||||||||
| Total Fleet Management Solutions | 1,297.2 | 1,397.3 | (7) | % | 3,835.6 | 4,139.9 | (7) | % | |||||||||||||||||||||||||||
| Supply Chain Solutions | 685.4 | 617.6 | 11 | % | 1,833.2 | 1,902.6 | (4) | % | |||||||||||||||||||||||||||
| Dedicated Transportation Solutions | 299.7 | 359.2 | (17) | % | 928.5 | 1,071.1 | (13) | % | |||||||||||||||||||||||||||
| Eliminations | (131.7) | (150.2) | 12 | % | (390.2) | (464.3) | 16 | % | |||||||||||||||||||||||||||
| Total revenue | $ | 2,150.6 | 2,223.9 | (3) | % | $ | 6,207.2 | 6,649.3 | (7) | % | |||||||||||||||||||||||||
| Operating Revenue: * | |||||||||||||||||||||||||||||||||||
| Fleet Management Solutions | $ | 1,153.4 | 1,189.6 | (3) | % | $ | 3,384.4 | 3,495.3 | (3) | % | |||||||||||||||||||||||||
| Supply Chain Solutions | 492.3 | 453.7 | 9 | % | 1,364.7 | 1,413.6 | (3) | % | |||||||||||||||||||||||||||
| Dedicated Transportation Solutions | 233.6 | 247.7 | (6) | % | 698.2 | 731.4 | (5) | % | |||||||||||||||||||||||||||
| Eliminations | (89.1) | (95.4) | 7 | % | (262.7) | (290.0) | 9 | % | |||||||||||||||||||||||||||
| Operating revenue | $ | 1,790.2 | 1,795.6 | — | % | $ | 5,184.7 | 5,350.3 | (3) | % | |||||||||||||||||||||||||
| Business Segment Earnings: | |||||||||||||||||||||||||||||||||||
| Earnings (loss) from continuing operations | |||||||||||||||||||||||||||||||||||
| before income taxes: | |||||||||||||||||||||||||||||||||||
| Fleet Management Solutions | $ | 16.2 | (108.6) | NM | $ | (202.2) | 10.1 | NM | |||||||||||||||||||||||||||
| Supply Chain Solutions | 57.8 | 34.6 | 67 | % | 125.8 | 112.7 | 12 | % | |||||||||||||||||||||||||||
| Dedicated Transportation Solutions | 24.7 | 18.5 | 34 | % | 58.1 | 63.0 | (8) | % | |||||||||||||||||||||||||||
| Eliminations | (12.9) | (6.1) | NM | (30.8) | (42.6) | 28 | % | ||||||||||||||||||||||||||||
| 85.8 | (61.6) | NM | (49.0) | 143.2 | NM | ||||||||||||||||||||||||||||||
| Unallocated Central Support Services | (8.0) | (11.4) | 30 | % | (28.1) | (34.5) | 18 | % | |||||||||||||||||||||||||||
| Non-operating pension costs | (7.2) | (6.9) | (5) | % | (9.4) | (20.1) | 53 | % | |||||||||||||||||||||||||||
| Other items impacting comparability, net | (15.8) | (11.4) | (39) | % | (67.2) | (8.8) | NM | ||||||||||||||||||||||||||||
| Earnings (loss) from continuing operations before income taxes | 54.8 | (91.3) | NM | (153.6) | 80.0 | NM | |||||||||||||||||||||||||||||
| Provision for (benefit from) income taxes | 9.7 | 0.3 | NM | (15.9) | 50.2 | NM | |||||||||||||||||||||||||||||
| Earnings (loss) from continuing operations | $ | 45.1 | (91.5) | NM | $ | (137.7) | 29.8 | NM | |||||||||||||||||||||||||||
* Non-GAAP financial measure. See reconciliation of GAAP total revenue to operating revenue in the Appendix - Non-GAAP Financial Measures section at the end of this release.
Note: Amounts may not be additive due to rounding.
NM - Not Meaningful
11
RYDER SYSTEM, INC. AND SUBSIDIARIES
BUSINESS SEGMENT INFORMATION - UNAUDITED
Periods ended September 30, 2020 and 2019
(in millions)
| Three Months | Nine Months | ||||||||||||||||||||||||||||||||||
| 2020 | 2019 | B(W) | 2020 | 2019 | B(W) | ||||||||||||||||||||||||||||||
| Fleet Management Solutions | |||||||||||||||||||||||||||||||||||
| FMS total revenue | $ | 1,297.2 | 1,397.3 | (7) | % | $ | 3,835.6 | 4,139.9 | (7) | % | |||||||||||||||||||||||||
Fuel services revenue(a) | (138.9) | (198.7) | (30) | % | (429.5) | (618.9) | (31) | % | |||||||||||||||||||||||||||
| ChoiceLease liability insurance revenue | (5.0) | (9.1) | (45) | % | (21.7) | (25.7) | (15) | % | |||||||||||||||||||||||||||
| FMS operating revenue * | $ | 1,153.4 | 1,189.6 | (3) | % | $ | 3,384.4 | 3,495.3 | (3) | % | |||||||||||||||||||||||||
| Segment earnings (loss) before income taxes | $ | 16.2 | (108.6) | NM | $ | (202.2) | 10.1 | NM | |||||||||||||||||||||||||||
| FMS earnings (loss) before income taxes as % of FMS total revenue | 1.2% | (7.8)% | (5.3)% | 0.2% | |||||||||||||||||||||||||||||||
| FMS earnings (loss) before income taxes as % of FMS operating revenue * | 1.4% | (9.1)% | (6.0)% | 0.3% | |||||||||||||||||||||||||||||||
| Supply Chain Solutions | |||||||||||||||||||||||||||||||||||
| SCS total revenue | $ | 685.4 | 617.6 | 11 | % | $ | 1,833.2 | 1,902.6 | (4) | % | |||||||||||||||||||||||||
| Subcontracted transportation | (172.0) | (136.9) | 26 | % | (409.9) | (400.4) | 2 | % | |||||||||||||||||||||||||||
| Fuel | (21.1) | (27.0) | (22) | % | (58.6) | (88.6) | (34) | % | |||||||||||||||||||||||||||
| SCS operating revenue * | $ | 492.3 | 453.7 | 9 | % | $ | 1,364.7 | 1,413.6 | (3) | % | |||||||||||||||||||||||||
| Segment earnings before income taxes | $ | 57.8 | 34.6 | 67 | % | $ | 125.8 | 112.7 | 12 | % | |||||||||||||||||||||||||
| SCS earnings before income taxes as % of SCS total revenue | 8.4% | 5.6% | 6.9% | 5.9% | |||||||||||||||||||||||||||||||
| SCS earnings before income taxes as % of SCS operating revenue * | 11.8% | 7.6% | 9.2% | 8.0% | |||||||||||||||||||||||||||||||
| Dedicated Transportation Solutions | |||||||||||||||||||||||||||||||||||
| DTS total revenue | $ | 299.7 | 359.2 | (17) | % | $ | 928.5 | 1,071.1 | (13) | % | |||||||||||||||||||||||||
| Subcontracted transportation | (40.5) | (76.2) | (47) | % | (148.6) | (229.9) | (35) | % | |||||||||||||||||||||||||||
| Fuel | (25.6) | (35.3) | (28) | % | (81.7) | (109.8) | (26) | % | |||||||||||||||||||||||||||
| DTS operating revenue * | $ | 233.6 | 247.7 | (6) | % | $ | 698.2 | 731.4 | (5) | % | |||||||||||||||||||||||||
| Segment earnings before income taxes | $ | 24.7 | 18.5 | 34 | % | $ | 58.1 | 63.0 | (8) | % | |||||||||||||||||||||||||
| DTS earnings before income taxes as % of DTS total revenue | 8.3% | 5.1% | 6.3% | 5.9% | |||||||||||||||||||||||||||||||
| DTS earnings before income taxes as % of DTS operating revenue * | 10.6% | 7.5% | 8.3% | 8.6% | |||||||||||||||||||||||||||||||
* Non-GAAP financial measure. A reconciliation of (1) GAAP total revenue to operating revenue for each business segment (FMS, SCS and DTS) and (2) segment earnings before taxes (EBT) as % of segment total revenue to segment EBT as % of segment operating revenue for each business segment is set forth in this table.
Note: Amounts may not be additive due to rounding.
(a) Includes intercompany fuel sales from FMS to SCS and DTS.
12
RYDER SYSTEM, INC. AND SUBSIDIARIES
BUSINESS SEGMENT INFORMATION - UNAUDITED
KEY PERFORMANCE INDICATORS
| Three months ended September 30, | Nine months ended September 30, | 2020/2019 | |||||||||||||||||||||||||||||||||
| 2020 | 2019 | 2020 | 2019 | Three Months | Nine Months | ||||||||||||||||||||||||||||||
| ChoiceLease | |||||||||||||||||||||||||||||||||||
| Average fleet count | 152,400 | 159,000 | 156,300 | 154,900 | (4)% | 1% | |||||||||||||||||||||||||||||
| End of period fleet count | 150,900 | 160,200 | 150,900 | 160,200 | (6)% | (6)% | |||||||||||||||||||||||||||||
Miles/unit per day change - % (a) | (1.7) | % | 2.0 | % | (3.0) | % | 0.7 | % | |||||||||||||||||||||||||||
Average Active ChoiceLease vehicles (b) | 144,100 | 145,200 | 146,300 | 143,500 | (1)% | 2% | |||||||||||||||||||||||||||||
Revenue per active ChoiceLease vehicle (c) | $ | 5,500 | $ | 5,300 | $ | 16,000 | $ | 15,800 | 4% | 1% | |||||||||||||||||||||||||
| Commercial rental | |||||||||||||||||||||||||||||||||||
| Average fleet count | 36,000 | 45,200 | 38,200 | 44,100 | (20)% | (13)% | |||||||||||||||||||||||||||||
| End of period fleet count | 35,400 | 44,800 | 35,400 | 44,800 | (21)% | (21)% | |||||||||||||||||||||||||||||
| Rental utilization - power units | 70.8 | % | 74.0 | % | 63.7 | % | 74.7 | % | (320)bps | (1,100)bps | |||||||||||||||||||||||||
Rental rate change - % (d) | 5.8 | % | 2.0 | % | 3.8 | % | 2.4 | % | |||||||||||||||||||||||||||
| Customer vehicles under | |||||||||||||||||||||||||||||||||||
| SelectCare contracts | |||||||||||||||||||||||||||||||||||
| Average fleet count | 56,500 | 56,400 | 55,200 | 55,500 | —% | (1)% | |||||||||||||||||||||||||||||
| End of period fleet count | 55,000 | 56,800 | 55,000 | 56,800 | (3)% | (3)% | |||||||||||||||||||||||||||||
| Customer vehicles under | |||||||||||||||||||||||||||||||||||
SelectCare on-demand (e) | |||||||||||||||||||||||||||||||||||
| Fleet serviced during the period | 6,200 | 8,300 | 15,400 | 19,400 | (25)% | (21)% | |||||||||||||||||||||||||||||
| SCS | |||||||||||||||||||||||||||||||||||
Average fleet count (f) | 9,600 | 9,700 | 9,600 | 9,700 | (1)% | (1)% | |||||||||||||||||||||||||||||
End of period fleet count (f) | 9,500 | 9,700 | 9,500 | 9,700 | (2)% | (2)% | |||||||||||||||||||||||||||||
| DTS | |||||||||||||||||||||||||||||||||||
Average fleet count (f) | 9,300 | 9,600 | 9,400 | 9,600 | (3)% | (2)% | |||||||||||||||||||||||||||||
End of period fleet count (f) | 9,300 | 9,600 | 9,300 | 9,600 | (3)% | (3)% | |||||||||||||||||||||||||||||
| Used vehicle sales (UVS) | |||||||||||||||||||||||||||||||||||
| Average UVS inventory | 12,800 | 7,700 | 12,000 | 7,600 | 66% | 58% | |||||||||||||||||||||||||||||
| End of period fleet count | 10,700 | 7,300 | 10,700 | 7,300 | 47% | 47% | |||||||||||||||||||||||||||||
| Used vehicles sold | 8,800 | 5,300 | 20,600 | 15,300 | 66% | 35% | |||||||||||||||||||||||||||||
UVS pricing change (g) | |||||||||||||||||||||||||||||||||||
| Tractors | (11) | % | (8) | % | (23) | % | 7 | % | |||||||||||||||||||||||||||
| Trucks | 1 | % | (10) | % | (4) | % | (5) | % | |||||||||||||||||||||||||||
Notes:
| (a) | Represents percentage change compared to prior year period in miles driven per vehicle per workday on US lease power units. | ||||
| (b) | Active ChoiceLease vehicles are calculated as those units currently earning revenue and not classified as not yet earning or no longer earning units. | ||||
| (c) | Calculated based on the reported quarterly and year-to-date ChoiceLease revenue. | ||||
| (d) | Represents percentage change compared to prior year period in average global rental rate per day on power units using constant currency. | ||||
| (e) | Comprised of the number of vehicles serviced under on-demand maintenance agreements. Vehicles included in the end of period count may have been serviced more than one time during the respective period. | ||||
| (f) | These vehicle counts are also included within the average fleet counts for ChoiceLease, Commercial rental and SelectCare. | ||||
| (g) | Represents percentage change compared to prior year period in average sales proceeds on used vehicle sales using constant currency. | ||||
13
RYDER SYSTEM, INC. AND SUBSIDIARIES
APPENDIX - NON-GAAP FINANCIAL MEASURE RECONCILIATIONS - UNAUDITED
This press release and accompanying tables include “non-GAAP financial measures” as defined by SEC rules. As required by SEC rules, we provide a reconciliation of each non-GAAP financial measure to the most comparable GAAP measure. Non-GAAP financial measures should be considered in addition to, but not as a substitute for or superior to, other measures of financial performance prepared in accordance with GAAP.
Specifically, the following non-GAAP financial measures are included in this press release:
| Non-GAAP Financial Measure | Comparable GAAP Measure | Reconciliation in Section Entitled | ||||||
| Operating Revenue Measures: | ||||||||
| Operating Revenue | Total Revenue | Appendix - Non-GAAP Financial Measure Reconciliations | ||||||
| FMS Operating Revenue | FMS Total Revenue | Business Segment Information - Unaudited | ||||||
| SCS Operating Revenue | SCS Total Revenue | |||||||
| DTS Operating Revenue | DTS Total Revenue | |||||||
| FMS EBT as a % of FMS Operating Revenue | FMS EBT as a % of FMS Total Revenue | Business Segment Information - Unaudited | ||||||
| SCS EBT as a % of SCS Operating Revenue | SCS EBT as a % of SCS Total Revenue | |||||||
| DTS EBT as a % of DTS Operating Revenue | DTS EBT as a % of DTS Total Revenue | |||||||
| Comparable Earnings Measures: | ||||||||
| Comparable Earnings (Loss) Before Income Tax and Comparable Tax Rate | Earnings (Loss) Before Income Tax and Effective Tax Rate from Continuing Operations | Appendix - Non-GAAP Financial Measure Reconciliations | ||||||
| Comparable Earnings (Loss) | Earnings (Loss) from Continuing Operations | Appendix - Non-GAAP Financial Measure Reconciliations | ||||||
| Comparable EPS | EPS from Continuing Operations | Condensed Consolidated Statements of Earnings - Unaudited | ||||||
| Adjusted Return on Equity (ROE) | Not Applicable. However, the non-GAAP elements of the calculation have been reconciled to the corresponding GAAP measures. A numerical reconciliation of net earnings to adjusted net earnings and average shareholders' equity to adjusted average equity is provided in the following reconciliations. | Appendix - Non-GAAP Financial Measure Reconciliations | ||||||
| Adjusted Return on Capital (ROC) and Adjusted ROC Spread | Not Applicable. However, non-GAAP elements of the calculation have been reconciled to the corresponding GAAP measures. A numerical reconciliation of net earnings to adjusted net earnings and average total debt and average shareholders' equity to adjusted average total capital is provided. | Appendix - Non-GAAP Financial Measure Reconciliations | ||||||
| Comparable Earnings Before Interest, Taxes, Depreciation and Amortization | Earnings (Loss) from Continuing Operations | Appendix - Non-GAAP Financial Measure Reconciliations | ||||||
| Cash Flow Measures: | ||||||||
| Total Cash Generated and Free Cash Flow | Cash Provided by Operating Activities | Appendix - Non-GAAP Financial Measure Reconciliations | ||||||
14
RYDER SYSTEM, INC. AND SUBSIDIARIES
APPENDIX - NON-GAAP FINANCIAL MEASURE RECONCILIATIONS - UNAUDITED
Set forth in the table below is an overview of each non-GAAP financial measure and why management believes that presentation of each non-GAAP financial measure provides useful information to investors. See reconciliations for each of these measures following this table.
| Operating Revenue Measures: | |||||||||||
| Operating Revenue FMS Operating Revenue SCS Operating Revenue DTS Operating Revenue FMS EBT as a % of FMS Operating Revenue SCS EBT as a % of SCS Operating Revenue DTS EBT as a % of DTS Operating Revenue | Operating revenue is defined as total revenue for Ryder System, Inc. or each business segment (FMS, SCS and DTS) excluding any (1) fuel and (2) subcontracted transportation, as well as (3) revenue from our ChoiceLease liability insurance program which was discontinued in early 2020. We believe operating revenue provides useful information to investors as we use it to evaluate the operating performance of our core businesses and as a measure of sales activity at the consolidated level for Ryder System, Inc., as well as for each of our business segments. We also use segment EBT as a percentage of segment operating revenue for each business segment for the same reason. Note: FMS EBT, SCS EBT and DTS EBT, our primary measures of segment performance, are not non-GAAP measures. Fuel: We exclude FMS, SCS and DTS fuel from the calculation of our operating revenue measures, as fuel is an ancillary service that we provide our customers, which is impacted by fluctuations in market fuel prices and the costs are largely a pass-through to our customers, resulting in minimal changes in our profitability during periods of steady market fuel prices. However, profitability may be positively or negatively impacted by rapid changes in market fuel prices during a short period of time, as customer pricing for fuel services is established based on trailing market fuel costs. Subcontracted transportation: We also exclude subcontracted transportation from the calculation of our operating revenue measures, as these services are also typically a pass-through to our customers and, therefore, fluctuations result in minimal changes to our profitability. While our SCS and DTS business segments subcontract certain transportation services to third party providers, our FMS business segment does not engage in subcontracted transportation and, therefore, this item is not applicable to FMS. ChoiceLease liability Insurance: We exclude ChoiceLease liability insurance as we announced our plan in the first quarter of 2020 to exit the extension of our liability insurance coverage for ChoiceLease customers. The exit of this program is estimated to be completed in the second quarter of 2021. We are excluding the revenues associated with this program for better comparability of our on-going operations. | ||||||||||
15
| Comparable Earnings Measures: | |||||||||||
| Comparable Earnings (Loss) Before Income Taxes (EBT) and Comparable Tax Rate Comparable Earnings Comparable Earnings per Diluted Common Share (EPS) Adjusted Return on Equity (ROE) Adjusted Return on Capital (ROC) and Adjusted ROC Spread | Comparable EBT, comparable earnings and comparable EPS are defined, respectively, as GAAP EBT, earnings and EPS, all from continuing operations, excluding (1) non-operating pension costs and (2) any other significant items that are not representative of our business operations. We believe these comparable earnings measures provide useful information to investors and allow for better year-over-year comparison of operating performance. Non-operating pension costs: Our comparable earnings measures exclude non-operating pension costs, which include the amortization of net actuarial loss and prior service cost, interest cost and expected return on plan assets components of pension and postretirement benefit costs, as well as a settlement or curtailment of a plan if one has occurred. We exclude non-operating pension costs because we consider these to be impacted by financial market performance and outside the operational performance of our business. Other Items Impacting Comparability: Our comparable and adjusted earnings measures also exclude other significant items that are not representative of our business operations as detailed in the reconciliation table below. These other significant items vary from period to period and, in some periods, there may be no such significant items. Calculation of comparable tax rate: The comparable provision for income taxes is computed using the same methodology as the GAAP provision for income taxes. Income tax effects of non-GAAP adjustments are calculated based on the statutory tax rates of the jurisdictions to which the non-GAAP adjustments relate. Adjusted ROE: Adjusted ROE is defined as adjusted net earnings divided by adjusted average shareholders' equity and represents the rate of return on shareholders' investment. Other items impacting comparability described above are excluded, as applicable, from the calculation of net earnings and average shareholders' equity. We use adjusted ROE as an internal measure of how effectively we use the owned capital invested in our operations. Adjusted ROC: Adjusted ROC is defined as adjusted net earnings divided by average total capital and represents the rate of return generated by the capital deployed in our business. Other items impacting comparability described above are excluded, as applicable, from the calculation of net earnings and average shareholders' equity (a component of average total capital).We use adjusted ROC as an internal measure of how effectively we use the capital invested (borrowed or owned) in our operations. Adjusted return on capital spread is calculated as the difference of the adjusted return on capital and the weighted average cost of capital. | ||||||||||
| Comparable Earnings Before Interest, Taxes, Depreciation and Amortization | Comparable EBITDA is defined as earnings from continuing operations, net of tax, first adjusted to exclude the following items, all from continuing operations: (1) non-operating pension costs and (2) any other items that are not representative of our business operations (these items are the same items that are excluded from comparable earnings measures for the relevant periods and are described under Comparable Earnings Measures above) and then adjusted further for (1) interest expense, (2) income taxes, (3) depreciation, (4) losses from used vehicle fair value adjustments and (5) amortization. We believe comparable EBITDA provides investors with useful information, as it is a standard measure commonly reported and widely used by analysts, investors and other interested parties to measure financial performance and our ability to service debt and meet our payment obligations. In addition, we believe that the inclusion of comparable EBITDA provides consistency in financial reporting and enables analysts and investors to perform meaningful comparisons of past, present and future operating results. Other companies may calculate comparable EBITDA differently; therefore, our presentation of comparable EBITDA may not be comparable to similarly-titled measures used by other companies. Comparable EBITDA should not be considered as an alternative to earnings from continuing operations before income taxes or earnings from continuing operations determined in accordance with GAAP, as an indicator of the Company’s operating performance, as an alternative to cash flows from operating activities (determined in accordance with GAAP), as an indicator of cash flows, or as a measure of liquidity. | ||||||||||
16
| Cash Flow Measures: | |||||||||||
Total Cash Generated Free Cash Flow | We consider total cash generated and free cash flow to be important measures of comparative operating performance, as our principal sources of operating liquidity are cash from operations and proceeds from the sale of revenue earning equipment. Total Cash Generated: Total cash generated is defined as the sum of (1) net cash provided by operating activities, (2) net cash provided by the sale of revenue earning equipment, (3) net cash provided by the sale of operating property and equipment, and (4) other cash inflows from investing activities. We believe total cash generated is an important measure of total cash flows generated from our ongoing business activities. Free Cash Flow: We refer to the net amount of cash generated from operating activities and investing activities (excluding acquisitions) from continuing operations as “free cash flow”. We calculate free cash flow as the sum of (1) net cash provided by operating activities, (2) net cash provided by the sale of revenue earning equipment, (3) net cash provided by the sale of operating property and equipment, and (4) other cash inflows from investing activities, less (5) purchases of property and revenue earning equipment. We believe free cash flow provides investors with an important perspective on the cash available for debt service and for shareholders, after making capital investments required to support ongoing business operations. Our calculation of free cash flow may be different from the calculation used by other companies and, therefore, comparability may be limited. | ||||||||||
17
RYDER SYSTEM, INC. AND SUBSIDIARIES
APPENDIX - NON-GAAP FINANCIAL MEASURE RECONCILIATIONS - UNAUDITED
(In millions)
| OPERATING REVENUE RECONCILIATION | |||||||||||||||||||||||
| Three months ended September 30, | Nine months ended September 30, | ||||||||||||||||||||||
| 2020 | 2019 | 2020 | 2019 | ||||||||||||||||||||
| Total revenue | $ | 2,150.6 | 2,223.9 | $ | 6,207.2 | 6,649.3 | |||||||||||||||||
| Fuel | (142.9) | (206.1) | (442.3) | (643.0) | |||||||||||||||||||
| Subcontracted transportation | (212.5) | (213.1) | (558.5) | (630.4) | |||||||||||||||||||
| ChoiceLease liability insurance revenue | (5.0) | (9.1) | (21.7) | (25.7) | |||||||||||||||||||
| Operating revenue * | $ | 1,790.2 | 1,795.6 | $ | 5,184.7 | 5,350.3 | |||||||||||||||||
| TOTAL CASH GENERATED / FREE CASH FLOW RECONCILIATION | |||||||||||
| Nine months ended September 30, | |||||||||||
| 2020 | 2019 | ||||||||||
| Net cash provided by operating activities from continuing operations | $ | 1,696.6 | 1,589.2 | ||||||||
Proceeds from sales (primarily revenue earning equipment) (a) | 390.8 | 353.7 | |||||||||
| Sales of operating property and equipment | 9.9 | 49.7 | |||||||||
| Total cash generated * | 2,097.3 | 1,992.7 | |||||||||
Purchases of property and revenue earning equipment (a) | (879.4) | (2,957.2) | |||||||||
| Free cash flow * | $ | 1,217.9 | (964.6) | ||||||||
| Memo: | |||||||||||
| Net cash used in investing activities | $ | (484.4) | (2,553.8) | ||||||||
| Net cash provided by (used in) financing activities | $ | (603.7) | 976.6 | ||||||||
Notes:
| (a) | Included in cash flows from investing activities. | ||||
* Non-GAAP financial measure. See definition above.
Note: Amounts may not be additive due to rounding.
18
RYDER SYSTEM, INC. AND SUBSIDIARIES
APPENDIX - NON-GAAP FINANCIAL MEASURE RECONCILIATIONS - UNAUDITED
(In millions)
| ADJUSTED RETURN ON EQUITY RECONCILIATION | |||||||||||
| Twelve months ended September 30, | |||||||||||
| 2020 | 2019 | ||||||||||
| Net earnings (12-month rolling period) | $ | (201.4) | 141.1 | ||||||||
| + Other items impacting comparability * | 96.4 | 13.3 | |||||||||
+ Income taxes (a) | (85.0) | 54.5 | |||||||||
| Adjusted earnings before income taxes | (190.1) | 208.8 | |||||||||
- Adjusted income taxes (b) | 85.8 | (73.5) | |||||||||
| = Adjusted net earnings for ROE (numerator)** [A] | $ | (104.3) | 135.3 | ||||||||
| Average shareholders' equity | $ | 2,301.1 | 2,545.6 | ||||||||
Adjustment to equity (c) | 43.1 | 16.4 | |||||||||
| Adjusted average total equity (denominator)** [B] | $ | 2,344.2 | 2,562.0 | ||||||||
| Adjusted ROE ** [A]/[B] | (4.4) | % | 5.3 | % | |||||||
Notes:
| (a) | Includes income taxes on discontinued operations. | ||||
| (b) | Represents the tax provision on adjusted earnings before income taxes. | ||||
| (c) | Represents the impact to equity of items to arrive at adjusted earnings. | ||||
* Other items impacting comparability includes the following:
| Twelve months ended September 30, | |||||||||||
| 2020 | 2019 | ||||||||||
| Restructuring and other, net | $ | 65.4 | 17.6 | ||||||||
| ERP implementation costs | 34.7 | 14.3 | |||||||||
| Gains on sale of properties | (3.7) | (18.6) | |||||||||
| Other items impacting comparability | $ | 96.4 | 13.3 | ||||||||
** Non-GAAP financial measure. Non-GAAP elements of the calculation have been reconciled to the corresponding GAAP measures. A numerical reconciliation of net earnings to adjusted net earnings and average shareholders' equity to adjusted average total equity set forth in this table.
Note: Amounts may not be additive due to rounding.
19
RYDER SYSTEM, INC. AND SUBSIDIARIES
APPENDIX - NON-GAAP FINANCIAL MEASURE RECONCILIATIONS - UNAUDITED
(In millions)
| ADJUSTED RETURN ON CAPITAL RECONCILIATION | |||||||||||
| Twelve months ended September 30, | |||||||||||
| 2020 | 2019 | ||||||||||
| Net earnings (12-month rolling period) | $ | (201.4) | 141.1 | ||||||||
| + Other items impacting comparability * | 96.4 | 13.3 | |||||||||
+ Income taxes (a) | (85.0) | 54.5 | |||||||||
| Adjusted earnings before income taxes | (190.1) | 208.8 | |||||||||
| + Interest expense | 255.3 | 230.3 | |||||||||
- Adjusted income taxes (b) | 36.4 | (130.5) | |||||||||
| = Adjusted net earnings for ROC (numerator)** [A] | $ | 101.7 | 308.5 | ||||||||
| Average total debt | $ | 7,886.0 | 7,105.9 | ||||||||
| Average shareholders' equity | 2,301.1 | 2,545.6 | |||||||||
Adjustment to equity (c) | 43.1 | 16.4 | |||||||||
| Adjusted average total capital (denominator)** [B] | $ | 10,230.2 | 9,667.9 | ||||||||
| Adjusted ROC ** [A]/[B] | 1.0 | % | 3.2 | % | |||||||
| Weighted average cost of capital | 4.5 | % | 4.6 | % | |||||||
| Adjusted return on capital spread*** | (3.5) | % | (1.4) | % | |||||||
Notes:
| (a) | Includes income taxes on discontinued operations. | ||||
| (b) | Represents the tax provision on adjusted earnings before income taxes and adjusted interest expense. | ||||
| (c) | Represents the impact to equity of items to arrive at adjusted earnings. | ||||
* See our Adjusted Return on Equity Reconciliation on the previous page for further details regarding other items impacting comparability.
** Non-GAAP financial measure. Non-GAAP elements of the calculation have been reconciled to the corresponding GAAP measures. A numerical reconciliation of net earnings to adjusted net earnings and average total debt and average shareholders' equity to adjusted average total capital set forth in this table.
*** Non-GAAP financial measure. Adjusted return on capital spread is calculated as the difference of the adjusted return on capital and the weighted average cost of capital.
Note: Amounts may not be additive due to rounding.
20
RYDER SYSTEM, INC. AND SUBSIDIARIES
APPENDIX - NON-GAAP FINANCIAL MEASURE RECONCILIATIONS - UNAUDITED
(In millions)
| COMPARABLE EARNINGS BEFORE INTEREST, TAXES, DEPRECIATION AND AMORTIZATION | |||||||||||
| Three months ended September 30, | Nine months ended September 30, | ||||||||||||||||||||||
| 2020 | 2019 | 2020 | 2019 | ||||||||||||||||||||
| Earnings (loss) from continuing operations | $ | 45.1 | (91.5) | $ | (137.7) | 29.8 | |||||||||||||||||
| + Provision for (benefit from) income taxes | 9.7 | 0.3 | (15.9) | 50.2 | |||||||||||||||||||
| Earnings before income taxes from continuing operations | 54.8 | (91.3) | (153.6) | 80.0 | |||||||||||||||||||
| + Non-operating pension costs | 7.2 | 6.9 | 9.4 | 20.1 | |||||||||||||||||||
| + Restructuring and other, net | 13.8 | 5.2 | 43.8 | 13.8 | |||||||||||||||||||
| + ERP implementation costs | 5.8 | 6.1 | 27.1 | 13.6 | |||||||||||||||||||
| - Gains on sale of properties | (3.7) | — | (3.7) | (18.6) | |||||||||||||||||||
Comparable earnings (loss) before income taxes from continuing operations | 77.8 | (73.0) | (77.1) | 108.8 | |||||||||||||||||||
| + Interest expense | 62.6 | 62.5 | 192.5 | 178.6 | |||||||||||||||||||
| + Depreciation | 496.1 | 574.7 | 1,552.3 | 1,342.7 | |||||||||||||||||||
| + Losses from used vehicle fair value adjustments | 1.9 | 25.9 | 34.5 | 67.9 | |||||||||||||||||||
| + Amortization | 1.9 | 2.1 | 5.9 | 6.3 | |||||||||||||||||||
| Comparable EBITDA * | $ | 640.3 | 592.2 | $ | 1,708.1 | 1,704.3 | |||||||||||||||||
* Non-GAAP financial measure. Non-GAAP elements of the calculation have been reconciled to the corresponding GAAP measures. A numerical reconciliation of earnings before income taxes from continuing operations to comparable earnings before income taxes from continuing operations is set forth in this table.
Note: Amounts may not be additive due to rounding.
21
RYDER SYSTEM, INC. AND SUBSIDIARIES
APPENDIX - NON-GAAP FINANCIAL MEASURE RECONCILIATIONS - UNAUDITED
(In millions)
| COMPARABLE EARNINGS BEFORE INCOME TAXES / EARNINGS / TAX RATE RECONCILIATION | |||||||||||||||||
| 2020 | |||||||||||||||||
| Condensed Consolidated Statements of Earnings Line Item | Three Months | Nine Months | |||||||||||||||
| Earnings (loss) from continuing operations before income taxes | $ | 54.8 | (153.6) | ||||||||||||||
| Non-operating pension costs | Non-operating pension costs | 7.2 | 9.4 | ||||||||||||||
| Restructuring and other, net | Revenue and Restructuring and other items, net | 13.8 | 43.8 | ||||||||||||||
| ERP implementation costs | Restructuring and other items, net | 5.8 | 27.1 | ||||||||||||||
| Gains on sale of properties | Miscellaneous (income) loss, net | (3.7) | (3.7) | ||||||||||||||
| Comparable earnings (loss) from continuing operations before income taxes* | $ | 77.8 | (77.1) | ||||||||||||||
| Provision for (benefit from) income taxes | $ | 9.7 | (15.9) | ||||||||||||||
| Tax adjustments | (2.1) | (22.4) | |||||||||||||||
| Income tax effects of non-GAAP adjustments** | 6.3 | 18.9 | |||||||||||||||
Comparable provision for (benefit from) income taxes | $ | 13.9 | (19.4) | ||||||||||||||
| Earnings (loss) from continuing operations | $ | 45.1 | (137.7) | ||||||||||||||
| Non-operating pension costs | Non-operating pension costs | 4.7 | 4.7 | ||||||||||||||
| Restructuring and other, net | Revenue and Restructuring and other items, net | 11.2 | 36.2 | ||||||||||||||
| ERP implementation costs | Restructuring and other items, net | 4.3 | 20.1 | ||||||||||||||
| Gains on sale of properties | Miscellaneous (income) loss, net | (3.4) | (3.4) | ||||||||||||||
| Tax adjustments | Provision for (benefit from) income taxes | 2.1 | 22.4 | ||||||||||||||
| Comparable earnings (loss) from continuing operations* | $ | 63.8 | (57.7) | ||||||||||||||
| Tax rate on continuing operations | 17.7 | % | (10.3) | % | |||||||||||||
| Tax adjustments and income tax effects of non-GAAP adjustments** | 0.2 | % | (14.8) | % | |||||||||||||
| Comparable tax rate on continuing operations** | 17.9 | % | (25.1) | % | |||||||||||||
* Non-GAAP financial measure. See definition above.
** The comparable provision for income taxes is computed using the same methodology as the GAAP provision for income taxes. Income tax effects of non-GAAP adjustments are calculated based on the statutory tax rates of the jurisdictions to which the non-GAAP adjustments relate.
Note: Amounts may not be additive due to rounding.
22
RYDER SYSTEM, INC. AND SUBSIDIARIES
APPENDIX - NON-GAAP FINANCIAL MEASURE RECONCILIATIONS - UNAUDITED
(In millions)
| COMPARABLE EARNINGS BEFORE INCOME TAXES / EARNINGS / TAX RATE RECONCILIATION | |||||||||||||||||
| 2019 | |||||||||||||||||
| Condensed Consolidated Statements of Earnings Line Item | Three Months | Nine Months | |||||||||||||||
| Earnings from continuing operations before income taxes | $ | (91.3) | 80.0 | ||||||||||||||
| Non-operating pension costs | Non-operating pension costs | 6.9 | 20.1 | ||||||||||||||
| Restructuring and other, net | Restructuring and other items, net | 5.2 | 13.8 | ||||||||||||||
| ERP implementation costs | Restructuring and other items, net | 6.1 | 13.6 | ||||||||||||||
| Gains on sale of properties | Miscellaneous (income) loss, net | — | (18.6) | ||||||||||||||
| Comparable earnings from continuing operations before income taxes* | $ | (73.0) | 108.8 | ||||||||||||||
| Provision for (benefit from) income taxes | $ | 0.3 | 50.2 | ||||||||||||||
| Tax adjustments | — | (3.5) | |||||||||||||||
| Income tax effects of non-GAAP adjustments** | 4.8 | 7.9 | |||||||||||||||
| Comparable provision for (benefit from) income taxes* | $ | 5.1 | 54.6 | ||||||||||||||
| Earnings (loss) from continuing operations | $ | (91.5) | 29.8 | ||||||||||||||
| Non-operating pension costs | Non-operating pension costs | 4.9 | 14.3 | ||||||||||||||
| Restructuring and other, net | Restructuring and other items, net | 4.0 | 10.4 | ||||||||||||||
| ERP implementation costs | Restructuring and other items, net | 4.5 | 10.1 | ||||||||||||||
| Gains on sale of properties | Miscellaneous (income) loss, net | — | (13.8) | ||||||||||||||
| Tax adjustments | Provision for income taxes | — | 3.5 | ||||||||||||||
| Comparable earnings (loss) from continuing operations* | $ | (78.1) | 54.2 | ||||||||||||||
| Tax rate on continuing operations | 0.3 | % | 62.7 | % | |||||||||||||
| Tax adjustments and income tax effects of non-GAAP adjustments** | 6.7 | % | (12.5) | % | |||||||||||||
| Comparable tax rate on continuing operations** | 7.0 | % | 50.2 | % | |||||||||||||
* Non-GAAP financial measure. See definition above.
** The comparable provision for income taxes is computed using the same methodology as the GAAP provision for income taxes. Income tax effects of non-GAAP adjustments are calculated based on the statutory tax rates of the jurisdictions to which the non-GAAP adjustments relate.
Note: Amounts may not be additive due to rounding.
23
RYDER SYSTEM, INC. AND SUBSIDIARIES
APPENDIX - NON-GAAP FINANCIAL MEASURE RECONCILIATIONS - UNAUDITED
| FREE CASH FLOW FORECAST RECONCILIATION | |||||
| 2020 Forecast | |||||
| Net cash provided by operating activities from continuing operations | $2,000 - $2,100 | ||||
Sales of operating property and equipment (1) | 500 - 600 | ||||
Purchases of property and revenue earning equipment (1) | (1,100 - 1,200) | ||||
| Free cash flow * | $1,400 - $1,500 | ||||
(1) Included in cash flows from investing activities.
* Non-GAAP financial measure. See definition above.
24
Third Quarter 2020 Earnings Conference Call October 28, 2020 Proprietary and Confidential
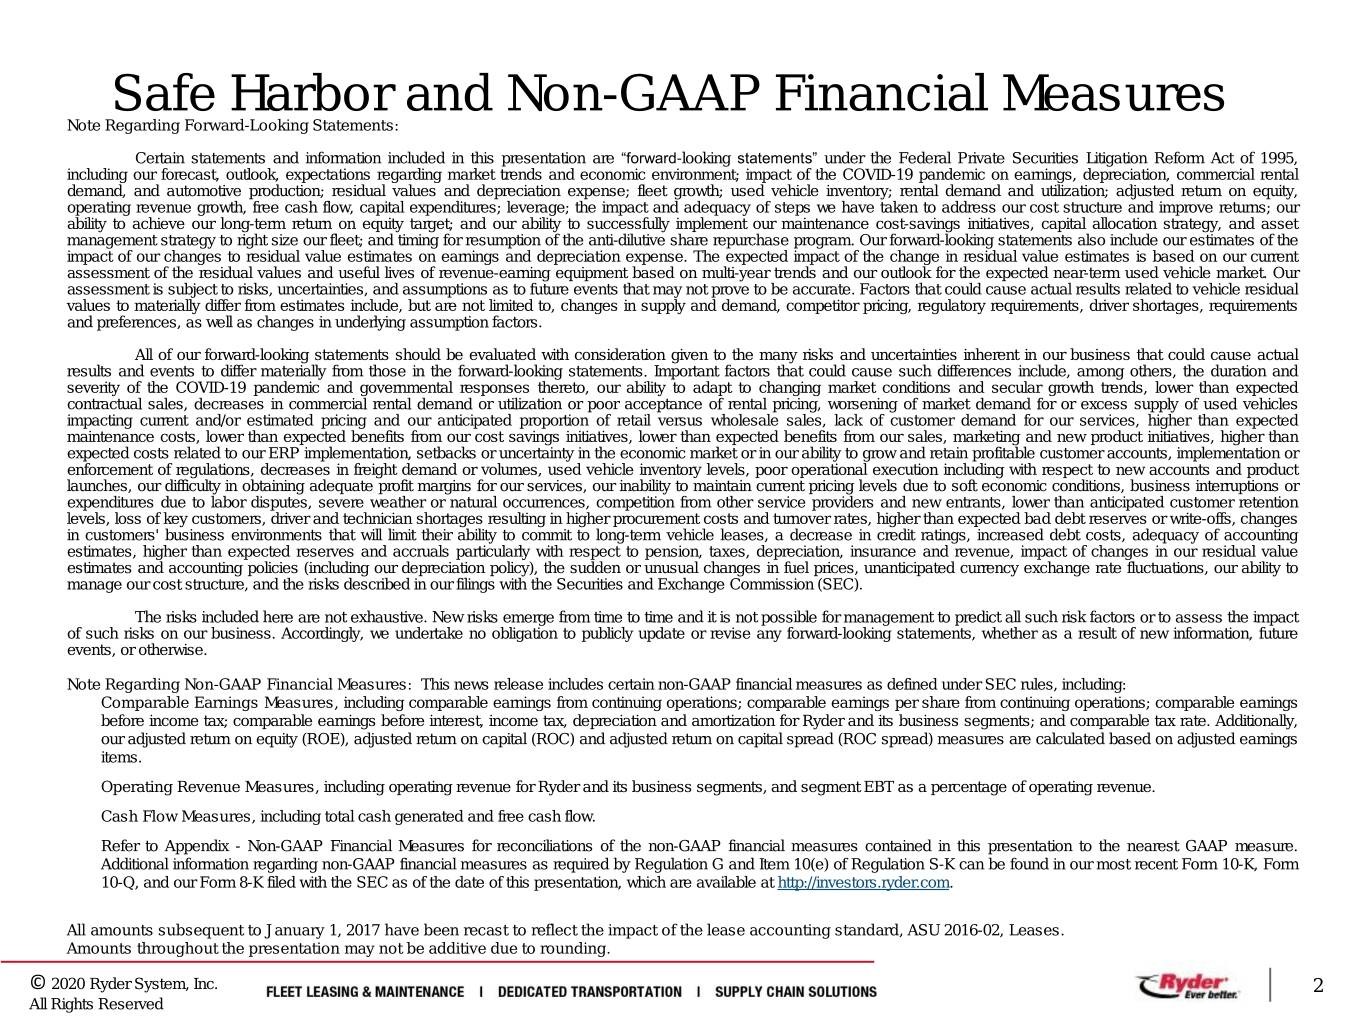
Safe Harbor and Non-GAAP Financial Measures Note Regarding Forward-Looking Statements: Certain statements and information included in this presentation are “forward-looking statements” under the Federal Private Securities Litigation Reform Act of 1995, including our forecast, outlook, expectations regarding market trends and economic environment; impact of the COVID-19 pandemic on earnings, depreciation, commercial rental demand, and automotive production; residual values and depreciation expense; fleet growth; used vehicle inventory; rental demand and utilization; adjusted return on equity, operating revenue growth, free cash flow, capital expenditures; leverage; the impact and adequacy of steps we have taken to address our cost structure and improve returns; our ability to achieve our long-term return on equity target; and our ability to successfully implement our maintenance cost-savings initiatives, capital allocation strategy, and asset management strategy to right size our fleet; and timing for resumption of the anti-dilutive share repurchase program. Our forward-looking statements also include our estimates of the impact of our changes to residual value estimates on earnings and depreciation expense. The expected impact of the change in residual value estimates is based on our current assessment of the residual values and useful lives of revenue-earning equipment based on multi-year trends and our outlook for the expected near-term used vehicle market. Our assessment is subject to risks, uncertainties, and assumptions as to future events that may not prove to be accurate. Factors that could cause actual results related to vehicle residual values to materially differ from estimates include, but are not limited to, changes in supply and demand, competitor pricing, regulatory requirements, driver shortages, requirements and preferences, as well as changes in underlying assumption factors. All of our forward-looking statements should be evaluated with consideration given to the many risks and uncertainties inherent in our business that could cause actual results and events to differ materially from those in the forward-looking statements. Important factors that could cause such differences include, among others, the duration and severity of the COVID-19 pandemic and governmental responses thereto, our ability to adapt to changing market conditions and secular growth trends, lower than expected contractual sales, decreases in commercial rental demand or utilization or poor acceptance of rental pricing, worsening of market demand for or excess supply of used vehicles impacting current and/or estimated pricing and our anticipated proportion of retail versus wholesale sales, lack of customer demand for our services, higher than expected maintenance costs, lower than expected benefits from our cost savings initiatives, lower than expected benefits from our sales, marketing and new product initiatives, higher than expected costs related to our ERP implementation, setbacks or uncertainty in the economic market or in our ability to grow and retain profitable customer accounts, implementation or enforcement of regulations, decreases in freight demand or volumes, used vehicle inventory levels, poor operational execution including with respect to new accounts and product launches, our difficulty in obtaining adequate profit margins for our services, our inability to maintain current pricing levels due to soft economic conditions, business interruptions or expenditures due to labor disputes, severe weather or natural occurrences, competition from other service providers and new entrants, lower than anticipated customer retention levels, loss of key customers, driver and technician shortages resulting in higher procurement costs and turnover rates, higher than expected bad debt reserves or write-offs, changes in customers' business environments that will limit their ability to commit to long-term vehicle leases, a decrease in credit ratings, increased debt costs, adequacy of accounting estimates, higher than expected reserves and accruals particularly with respect to pension, taxes, depreciation, insurance and revenue, impact of changes in our residual value estimates and accounting policies (including our depreciation policy), the sudden or unusual changes in fuel prices, unanticipated currency exchange rate fluctuations, our ability to manage our cost structure, and the risks described in our filings with the Securities and Exchange Commission (SEC). The risks included here are not exhaustive. New risks emerge from time to time and it is not possible for management to predict all such risk factors or to assess the impact of such risks on our business. Accordingly, we undertake no obligation to publicly update or revise any forward-looking statements, whether as a result of new information, future events, or otherwise. Note Regarding Non-GAAP Financial Measures: This news release includes certain non-GAAP financial measures as defined under SEC rules, including: Comparable Earnings Measures, including comparable earnings from continuing operations; comparable earnings per share from continuing operations; comparable earnings before income tax; comparable earnings before interest, income tax, depreciation and amortization for Ryder and its business segments; and comparable tax rate. Additionally, our adjusted return on equity (ROE), adjusted return on capital (ROC) and adjusted return on capital spread (ROC spread) measures are calculated based on adjusted earnings items. Operating Revenue Measures, including operating revenue for Ryder and its business segments, and segment EBT as a percentage of operating revenue. Cash Flow Measures, including total cash generated and free cash flow. Refer to Appendix - Non-GAAP Financial Measures for reconciliations of the non-GAAP financial measures contained in this presentation to the nearest GAAP measure. Additional information regarding non-GAAP financial measures as required by Regulation G and Item 10(e) of Regulation S-K can be found in our most recent Form 10-K, Form 10-Q, and our Form 8-K filed with the SEC as of the date of this presentation, which are available at http://investors.ryder.com. All amounts subsequent to January 1, 2017 have been recast to reflect the impact of the lease accounting standard, ASU 2016-02, Leases. Amounts throughout the presentation may not be additive due to rounding. © 2020 Ryder System, Inc. 2 All Rights Reserved
Contents • Third Quarter 2020 Results Overview • Outlook • Actions to Achieve ROE Target • Q & A © 2020 Ryder System, Inc. 3 All Rights Reserved
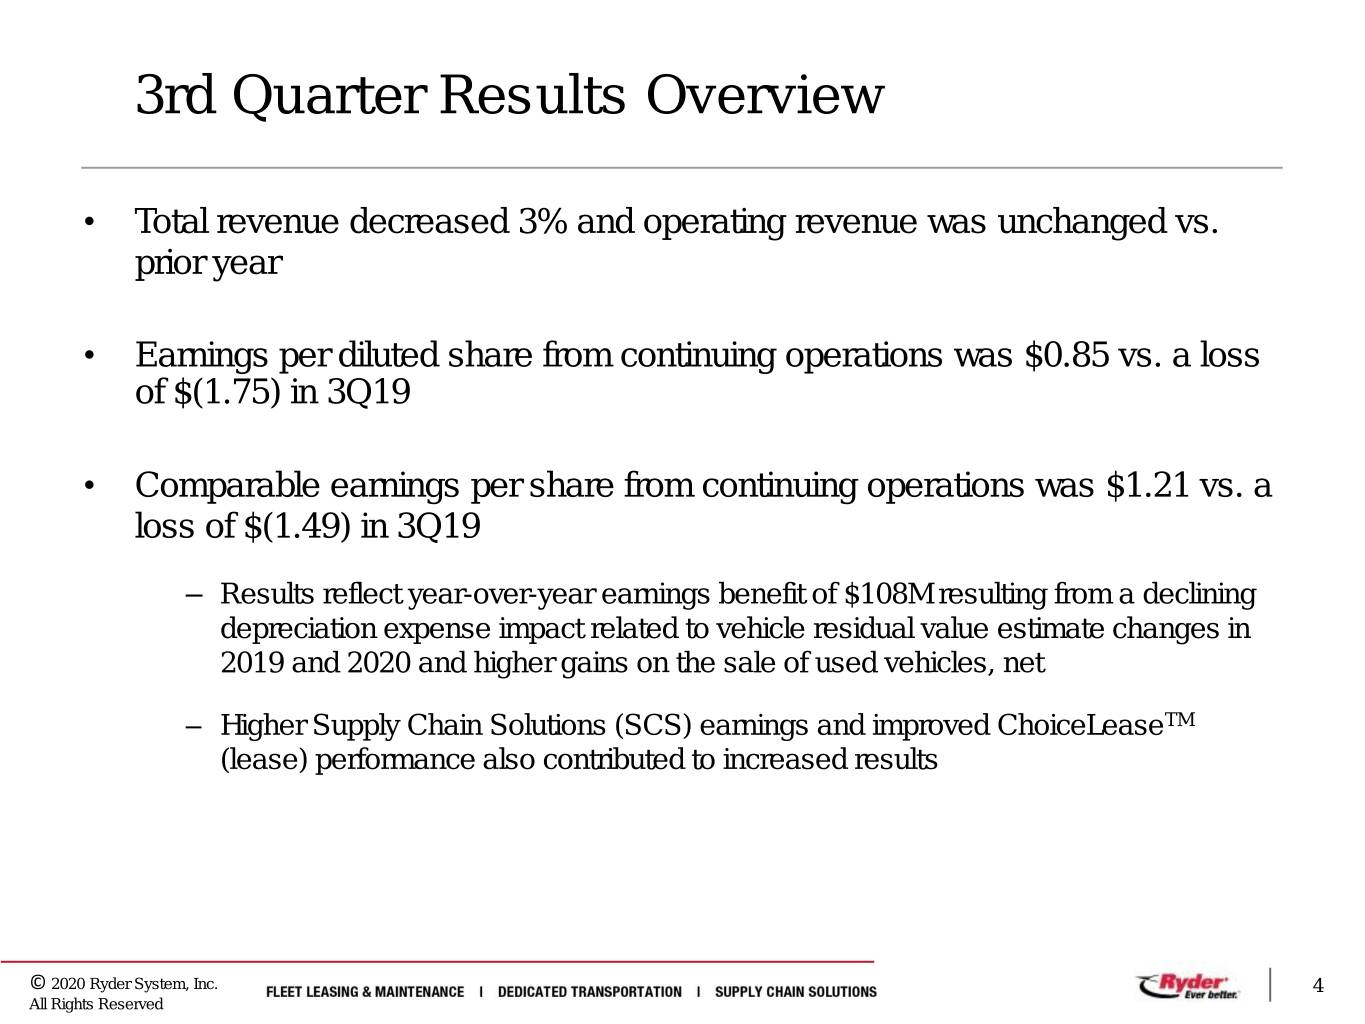
3rd Quarter Results Overview • Total revenue decreased 3% and operating revenue was unchanged vs. prior year • Earnings per diluted share from continuing operations was $0.85 vs. a loss of $(1.75) in 3Q19 • Comparable earnings per share from continuing operations was $1.21 vs. a loss of $(1.49) in 3Q19 – Results reflect year-over-year earnings benefit of $108M resulting from a declining depreciation expense impact related to vehicle residual value estimate changes in 2019 and 2020 and higher gains on the sale of used vehicles, net – Higher Supply Chain Solutions (SCS) earnings and improved ChoiceLeaseTM (lease) performance also contributed to increased results © 2020 Ryder System, Inc. 4 All Rights Reserved
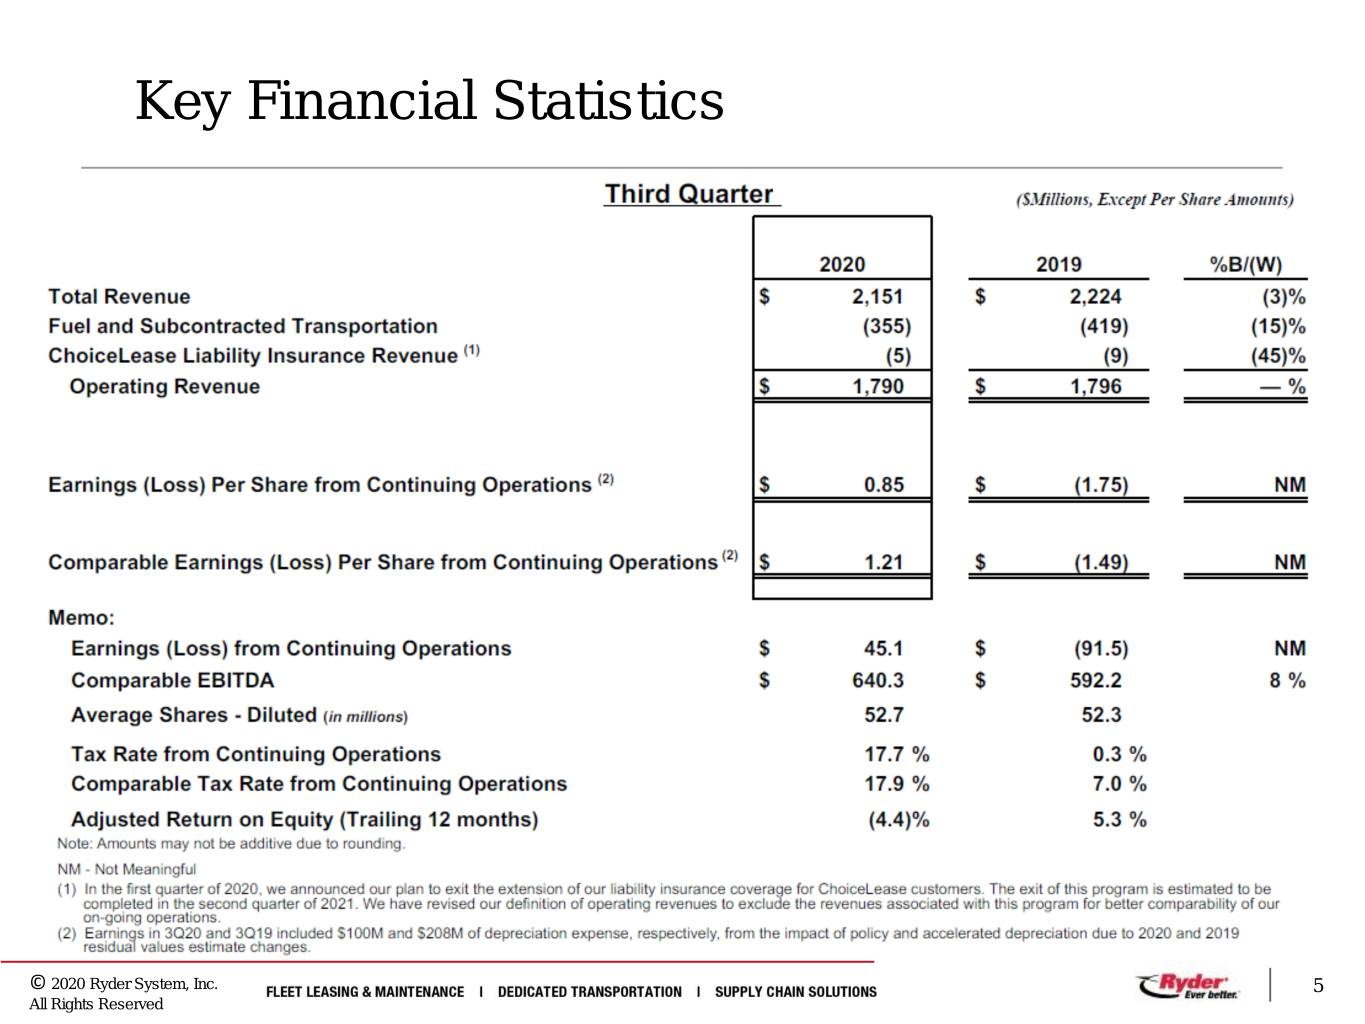
Key Financial Statistics © 2020 Ryder System, Inc. 5 All Rights Reserved
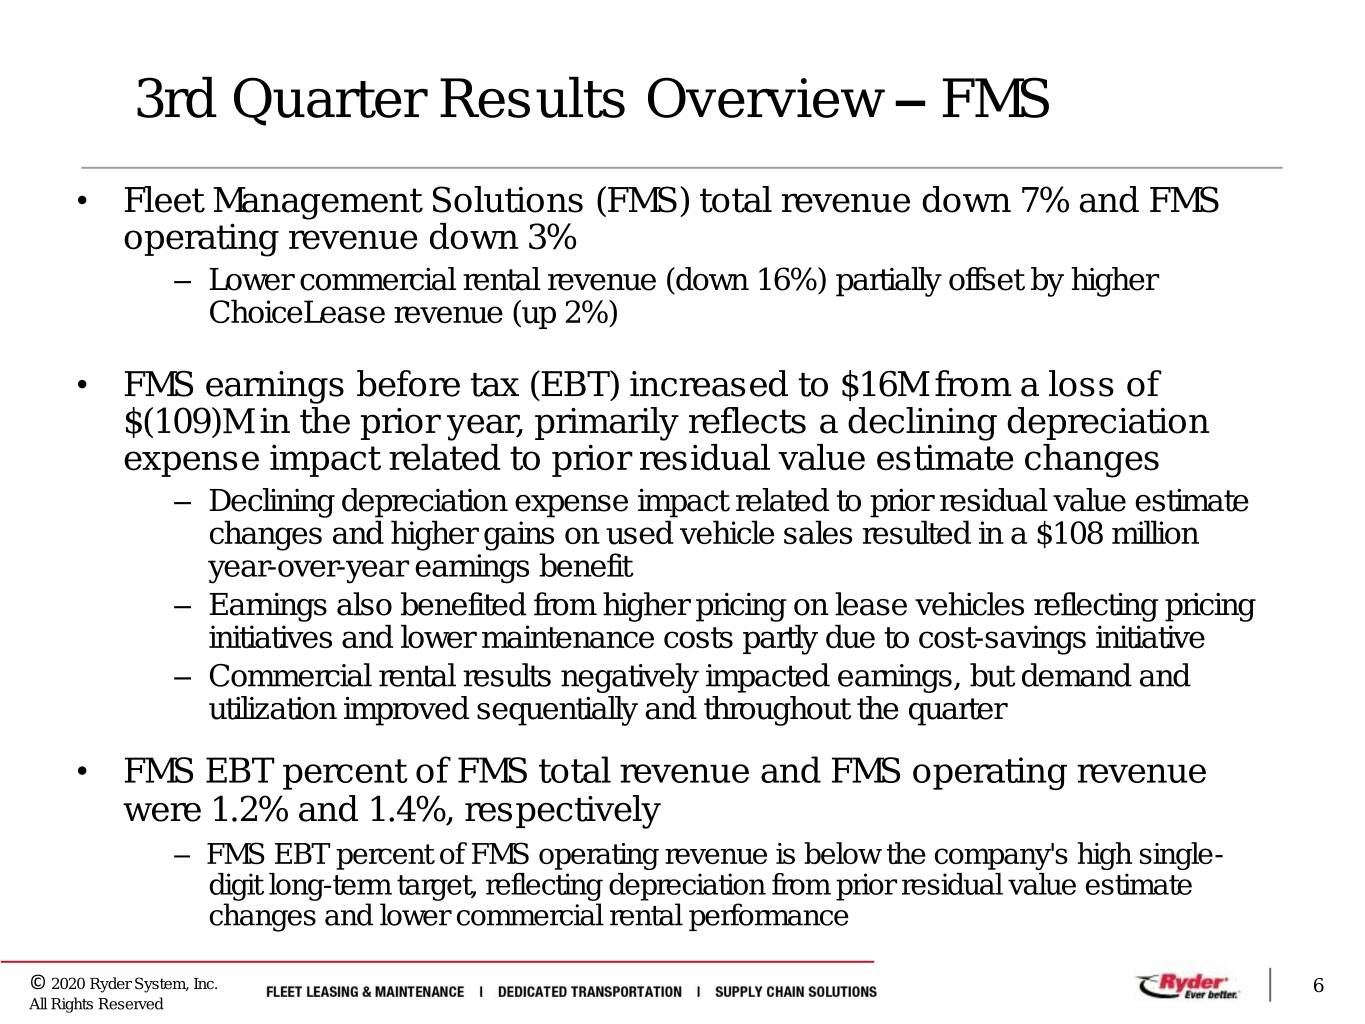
3rd Quarter Results Overview – FMS • Fleet Management Solutions (FMS) total revenue down 7% and FMS operating revenue down 3% – Lower commercial rental revenue (down 16%) partially offset by higher ChoiceLease revenue (up 2%) • FMS earnings before tax (EBT) increased to $16M from a loss of $(109)M in the prior year, primarily reflects a declining depreciation expense impact related to prior residual value estimate changes – Declining depreciation expense impact related to prior residual value estimate changes and higher gains on used vehicle sales resulted in a $108 million year-over-year earnings benefit – Earnings also benefited from higher pricing on lease vehicles reflecting pricing initiatives and lower maintenance costs partly due to cost-savings initiative – Commercial rental results negatively impacted earnings, but demand and utilization improved sequentially and throughout the quarter • FMS EBT percent of FMS total revenue and FMS operating revenue were 1.2% and 1.4%, respectively – FMS EBT percent of FMS operating revenue is below the company's high single- digit long-term target, reflecting depreciation from prior residual value estimate changes and lower commercial rental performance © 2020 Ryder System, Inc. 6 All Rights Reserved
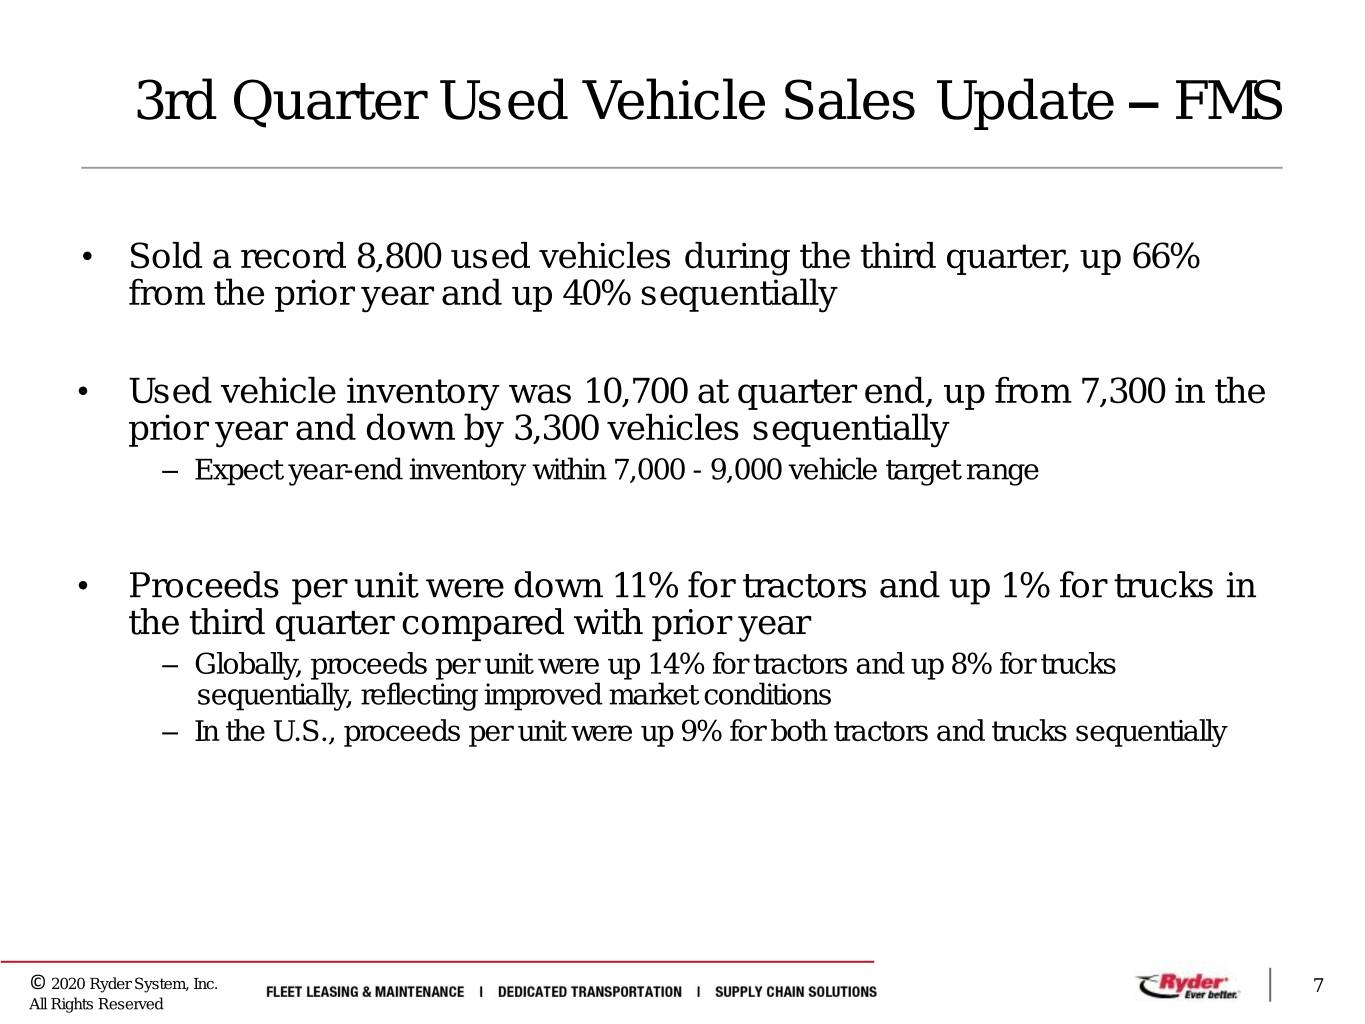
3rd Quarter Used Vehicle Sales Update – FMS • Sold a record 8,800 used vehicles during the third quarter, up 66% from the prior year and up 40% sequentially • Used vehicle inventory was 10,700 at quarter end, up from 7,300 in the prior year and down by 3,300 vehicles sequentially – Expect year-end inventory within 7,000 - 9,000 vehicle target range • Proceeds per unit were down 11% for tractors and up 1% for trucks in the third quarter compared with prior year – Globally, proceeds per unit were up 14% for tractors and up 8% for trucks sequentially, reflecting improved market conditions – In the U.S., proceeds per unit were up 9% for both tractors and trucks sequentially © 2020 Ryder System, Inc. 7 All Rights Reserved
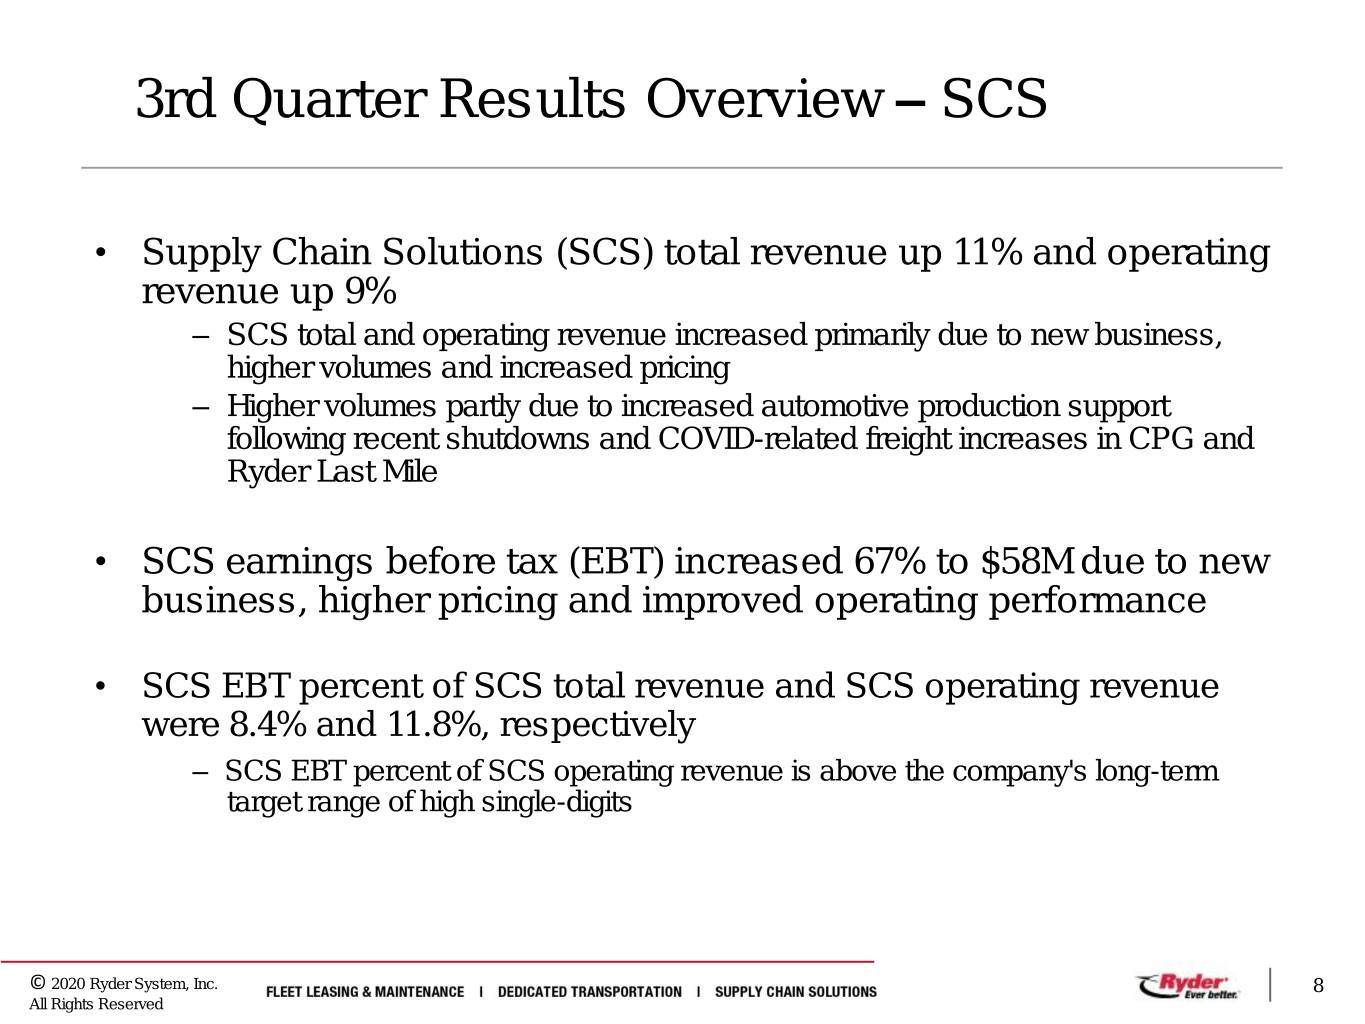
3rd Quarter Results Overview – SCS • Supply Chain Solutions (SCS) total revenue up 11% and operating revenue up 9% – SCS total and operating revenue increased primarily due to new business, higher volumes and increased pricing – Higher volumes partly due to increased automotive production support following recent shutdowns and COVID-related freight increases in CPG and Ryder Last Mile • SCS earnings before tax (EBT) increased 67% to $58M due to new business, higher pricing and improved operating performance • SCS EBT percent of SCS total revenue and SCS operating revenue were 8.4% and 11.8%, respectively – SCS EBT percent of SCS operating revenue is above the company's long-term target range of high single-digits © 2020 Ryder System, Inc. 8 All Rights Reserved
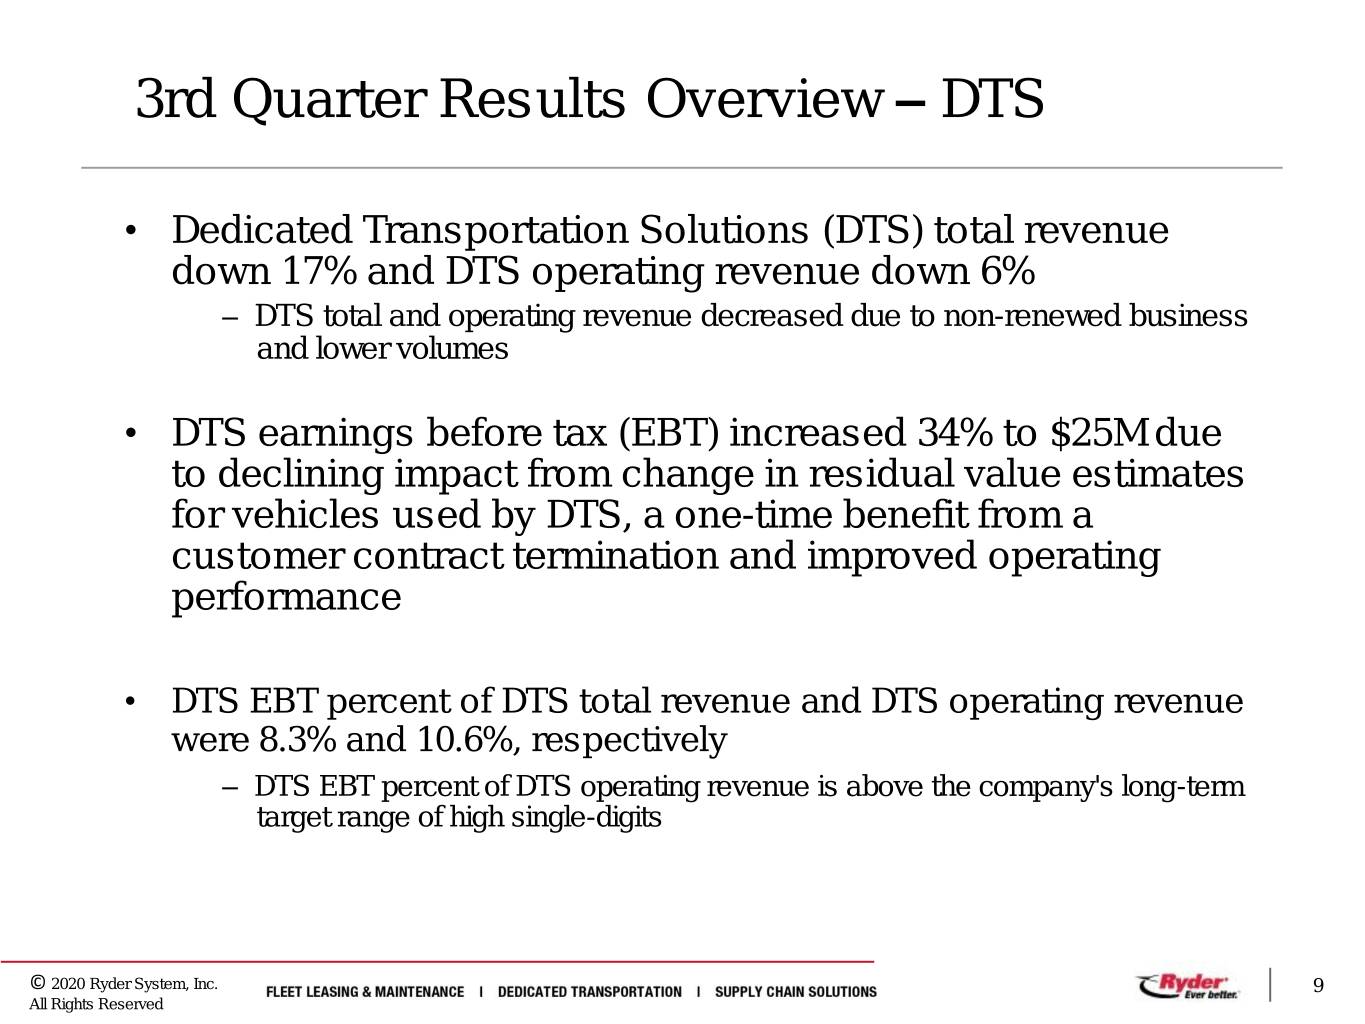
3rd Quarter Results Overview – DTS • Dedicated Transportation Solutions (DTS) total revenue down 17% and DTS operating revenue down 6% – DTS total and operating revenue decreased due to non-renewed business and lower volumes • DTS earnings before tax (EBT) increased 34% to $25M due to declining impact from change in residual value estimates for vehicles used by DTS, a one-time benefit from a customer contract termination and improved operating performance • DTS EBT percent of DTS total revenue and DTS operating revenue were 8.3% and 10.6%, respectively – DTS EBT percent of DTS operating revenue is above the company's long-term target range of high single-digits © 2020 Ryder System, Inc. 9 All Rights Reserved
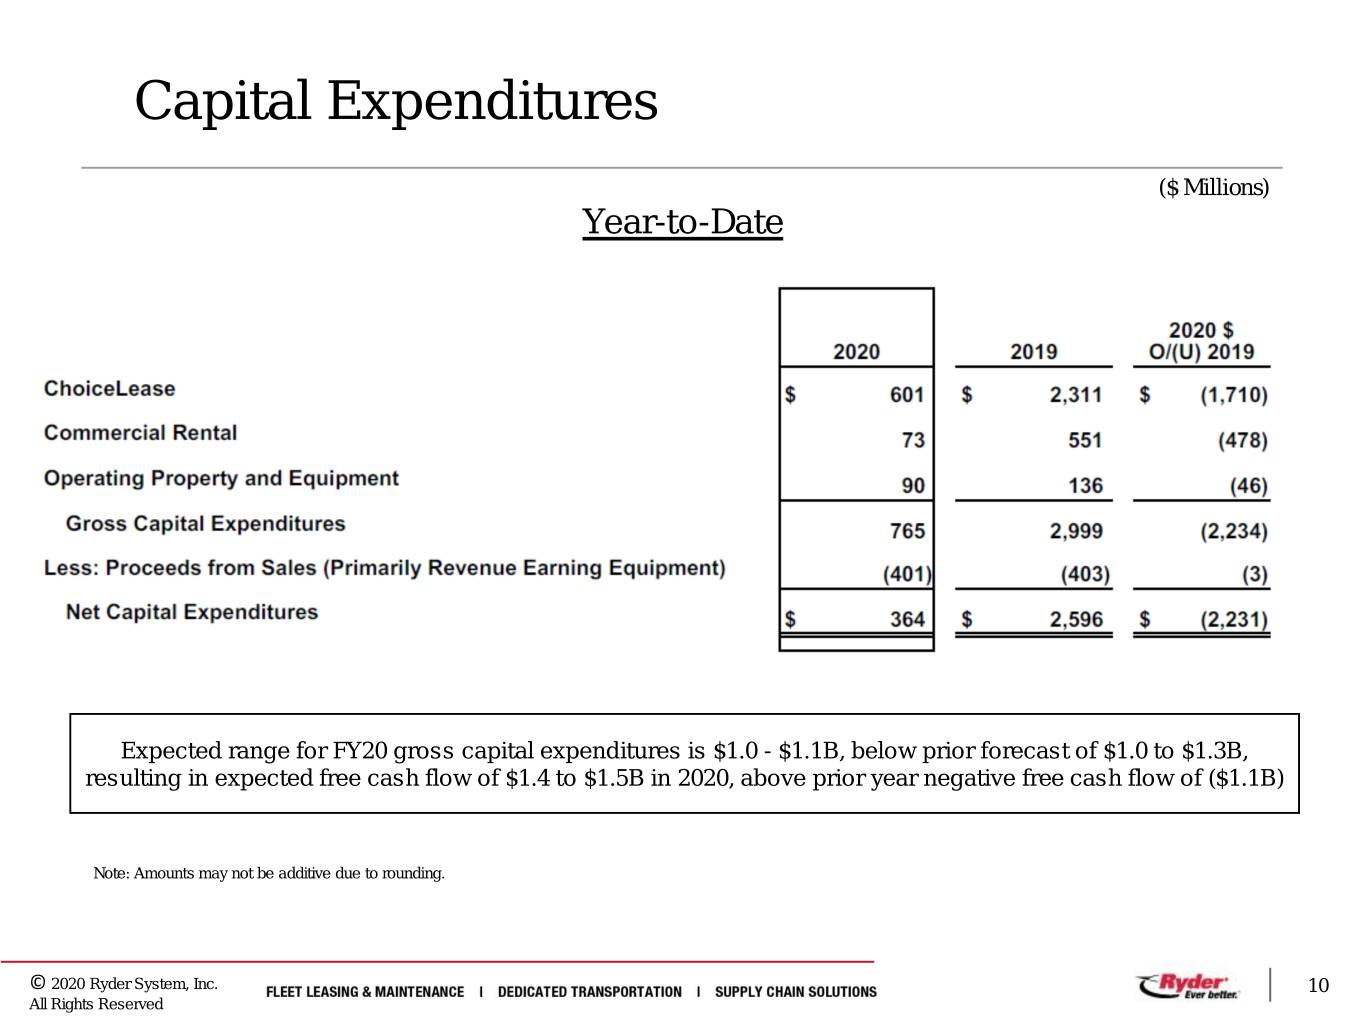
Capital Expenditures ($ Millions) Year-to-Date Expected range for FY20 gross capital expenditures is $1.0 - $1.1B, below prior forecast of $1.0 to $1.3B, resulting in expected free cash flow of $1.4 to $1.5B in 2020, above prior year negative free cash flow of ($1.1B) Note: Amounts may not be additive due to rounding. © 2020 Ryder System, Inc. 10 All Rights Reserved
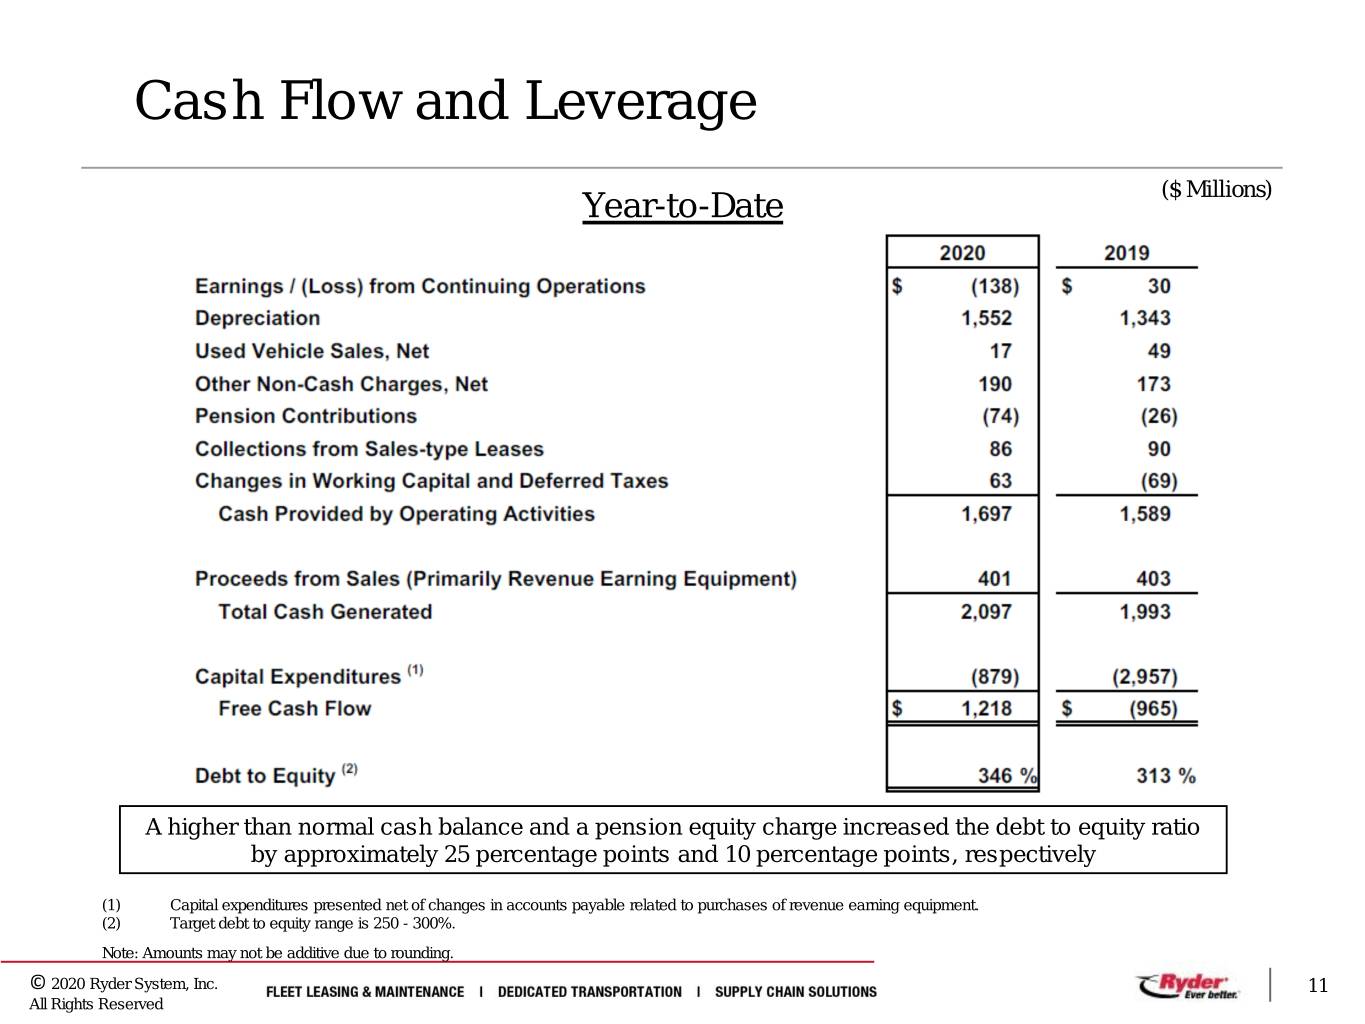
Cash Flow and Leverage Year-to-Date ($ Millions) A higher than normal cash balance and a pension equity charge increased the debt to equity ratio by approximately 25 percentage points and 10 percentage points, respectively (1) Capital expenditures presented net of changes in accounts payable related to purchases of revenue earning equipment. (2) Target debt to equity range is 250 - 300%. Note: Amounts may not be additive due to rounding. © 2020 Ryder System, Inc. 11 All Rights Reserved
Contents • Third Quarter 2020 Results Overview • Outlook • Actions to Achieve ROE Target • Q & A © 2020 Ryder System, Inc. 12 All Rights Reserved
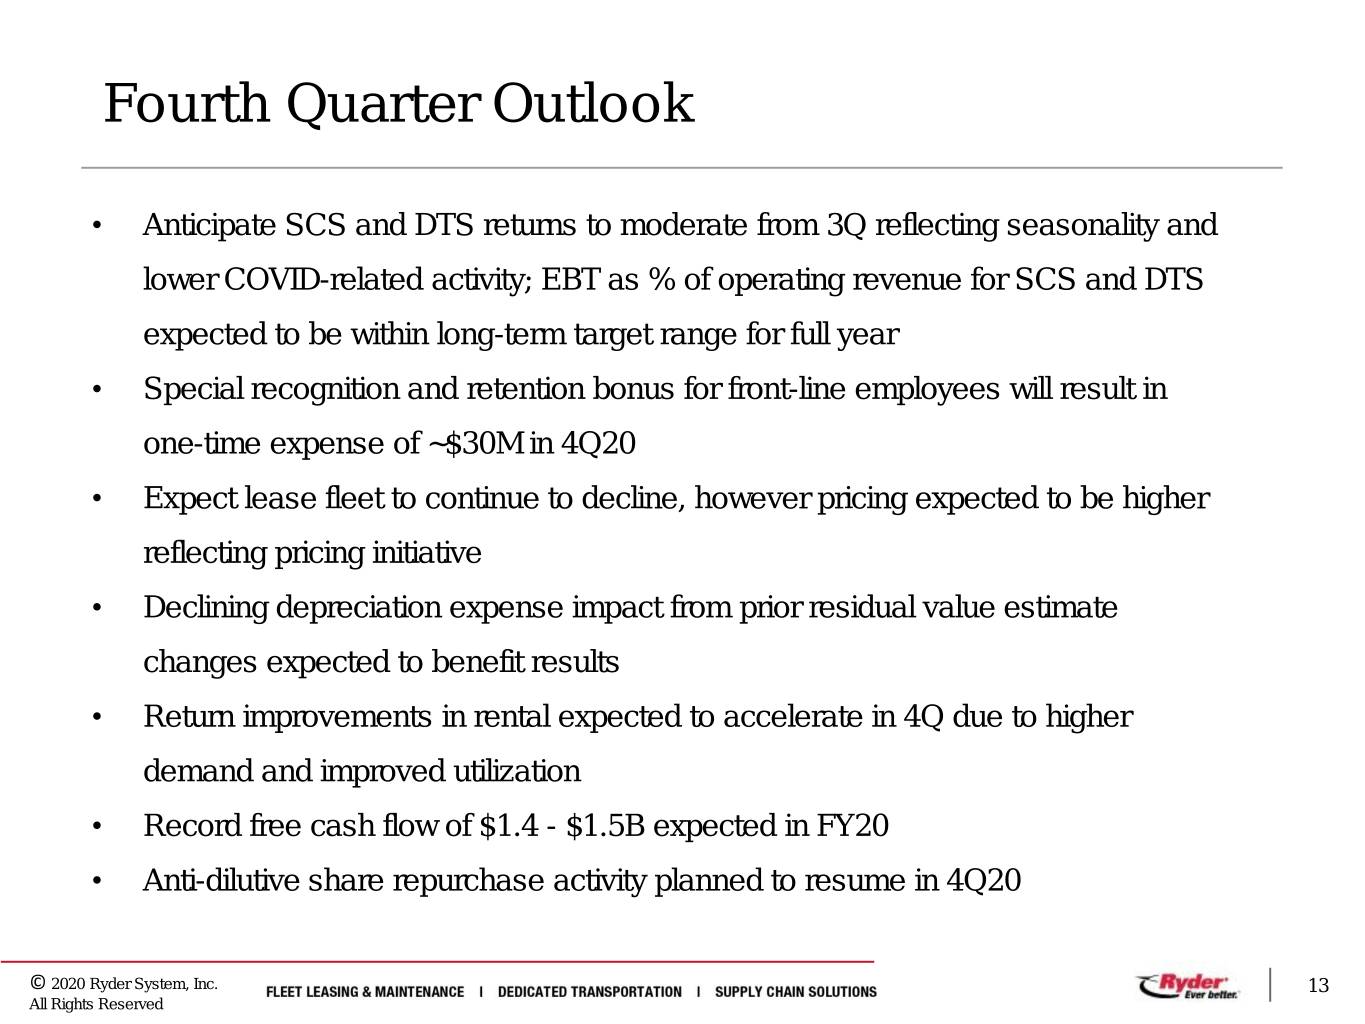
Fourth Quarter Outlook • Anticipate SCS and DTS returns to moderate from 3Q reflecting seasonality and lower COVID-related activity; EBT as % of operating revenue for SCS and DTS expected to be within long-term target range for full year • Special recognition and retention bonus for front-line employees will result in one-time expense of ~$30M in 4Q20 • Expect lease fleet to continue to decline, however pricing expected to be higher reflecting pricing initiative • Declining depreciation expense impact from prior residual value estimate changes expected to benefit results • Return improvements in rental expected to accelerate in 4Q due to higher demand and improved utilization • Record free cash flow of $1.4 - $1.5B expected in FY20 • Anti-dilutive share repurchase activity planned to resume in 4Q20 © 2020 Ryder System, Inc. 13 All Rights Reserved
Contents • Third Quarter 2020 Results Overview • Outlook • Actions to Achieve ROE Target • Q & A © 2020 Ryder System, Inc. 14 All Rights Reserved
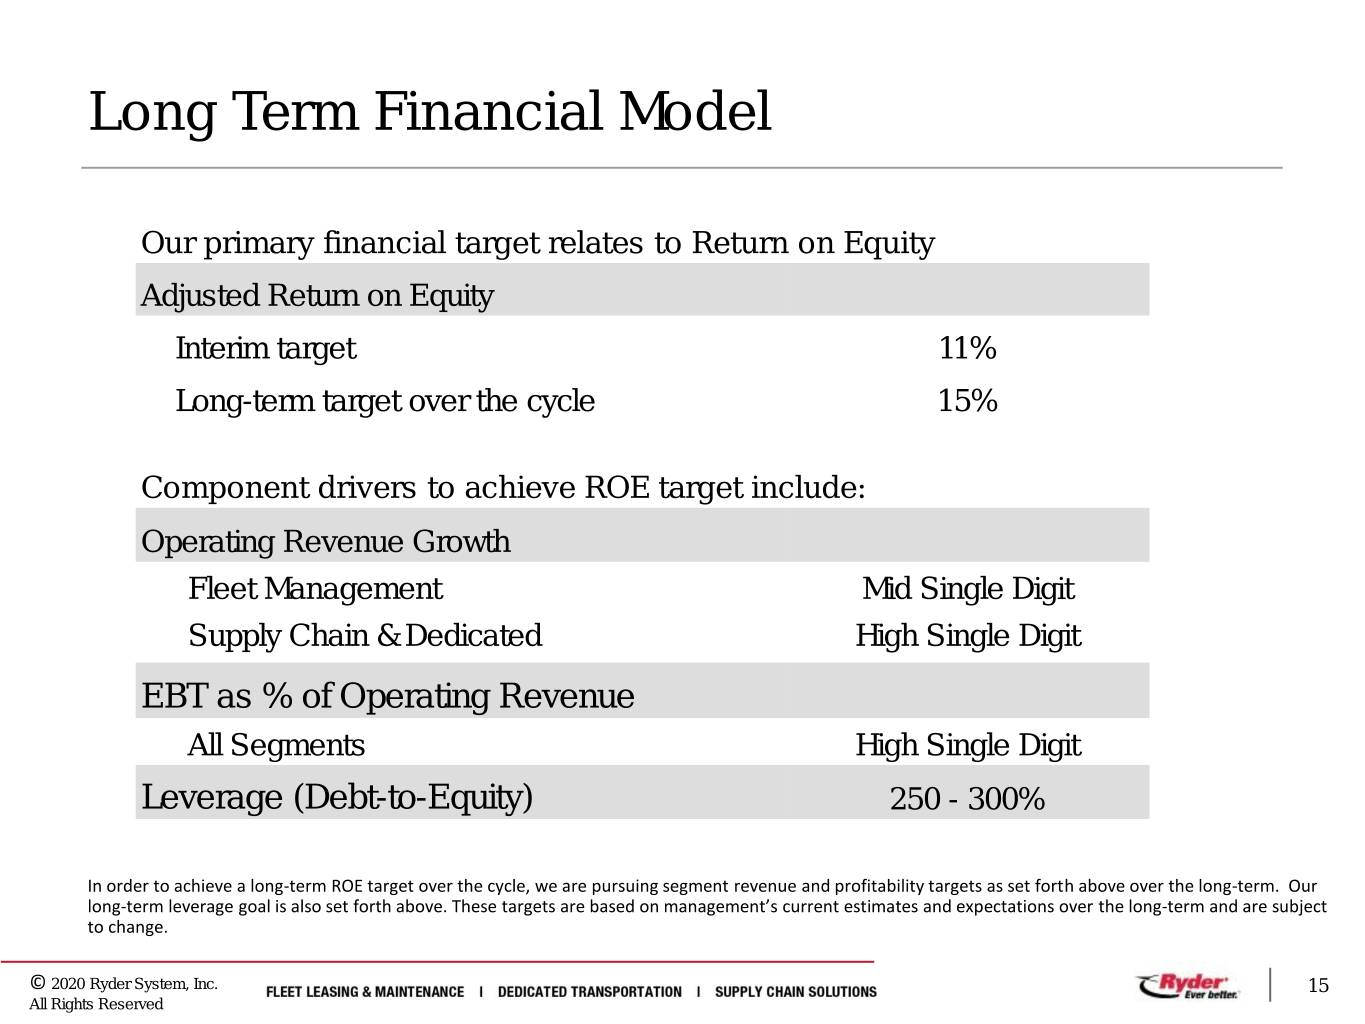
Long Term Financial Model Our primary financial target relates to Return on Equity Adjusted Return on Equity Interim target 11% Long-term target over the cycle 15% Component drivers to achieve ROE target include: Operating Revenue Growth Fleet Management Mid Single Digit Supply Chain & Dedicated High Single Digit EBT as % of Operating Revenue All Segments High Single Digit Leverage (Debt-to-Equity) 250 - 300% In order to achieve a long-term ROE target over the cycle, we are pursuing segment revenue and profitability targets as set forth above over the long-term. Our long-term leverage goal is also set forth above. These targets are based on management’s current estimates and expectations over the long-term and are subject to change. © 2020 Ryder System, Inc. 15 All Rights Reserved
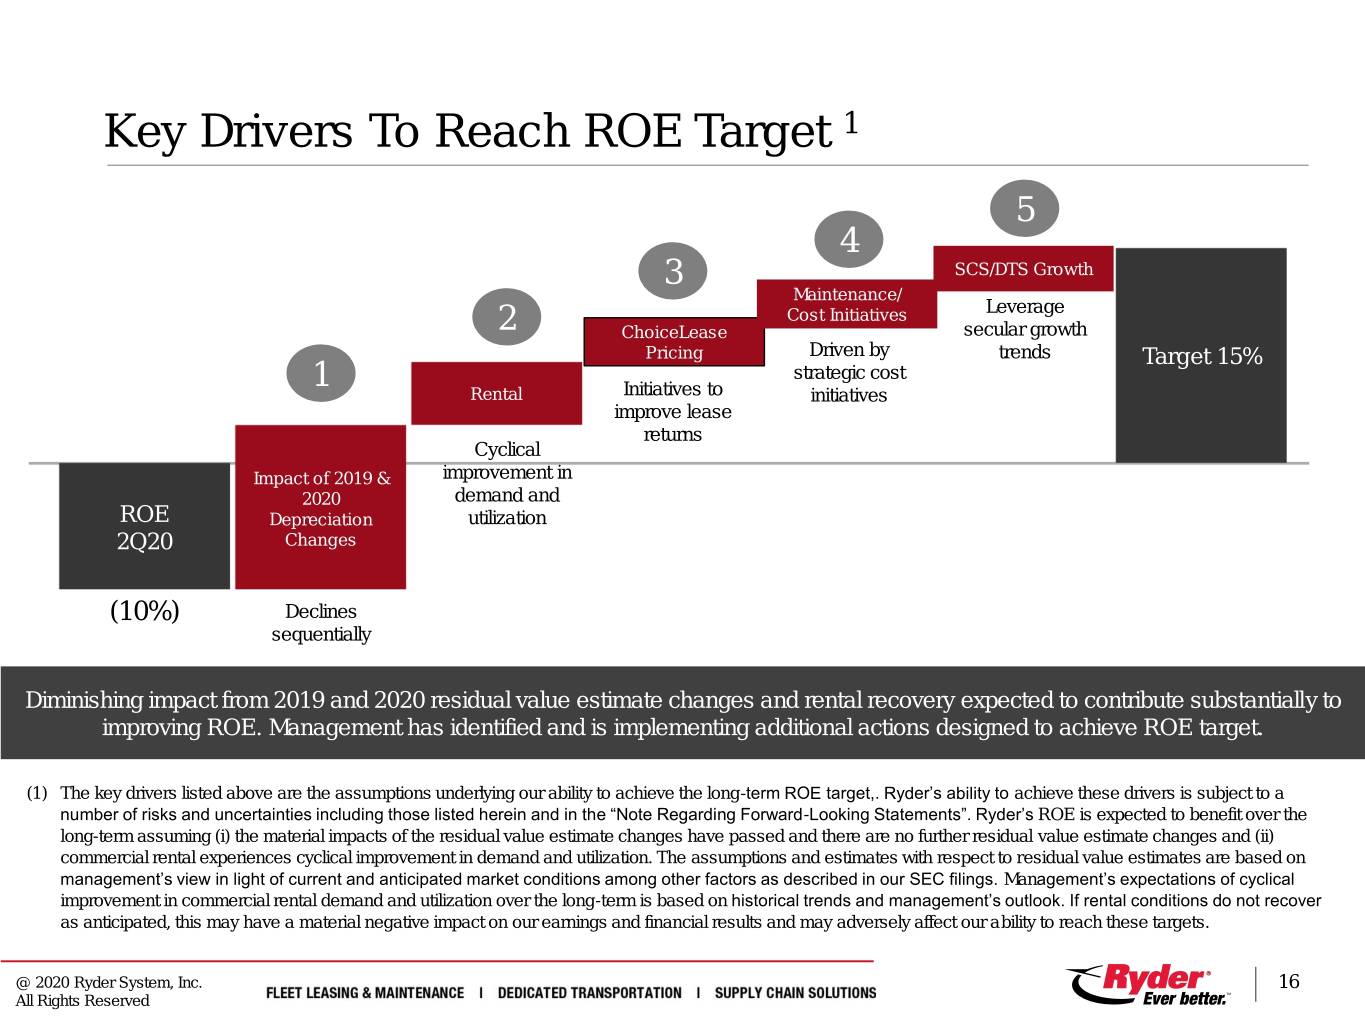
Key Drivers To Reach ROE Target 1 5 4 3 SCS/DTS Growth Maintenance/ Cost Initiatives Leverage 2 ChoiceLease secular growth Pricing Driven by trends Target 15% 1 strategic cost Rental Initiatives to initiatives improve lease returns Cyclical Impact of 2019 & improvement in 2020 demand and ROE Depreciation utilization 2Q20 Changes (10%) Declines sequentially Diminishing impact from 2019 and 2020 residual value estimate changes and rental recovery expected to contribute substantially to improving ROE. Management has identified and is implementing additional actions designed to achieve ROE target. (1) The key drivers listed above are the assumptions underlying our ability to achieve the long-term ROE target,. Ryder’s ability to achieve these drivers is subject to a number of risks and uncertainties including those listed herein and in the “Note Regarding Forward-Looking Statements”. Ryder’s ROE is expected to benefit over the long-term assuming (i) the material impacts of the residual value estimate changes have passed and there are no further residual value estimate changes and (ii) commercial rental experiences cyclical improvement in demand and utilization. The assumptions and estimates with respect to residual value estimates are based on management’s view in light of current and anticipated market conditions among other factors as described in our SEC filings. Management’s expectations of cyclical improvement in commercial rental demand and utilization over the long-term is based on historical trends and management’s outlook. If rental conditions do not recover as anticipated, this may have a material negative impact on our earnings and financial results and may adversely affect our ability to reach these targets. @ 2020 Ryder System, Inc. 16 All Rights Reserved
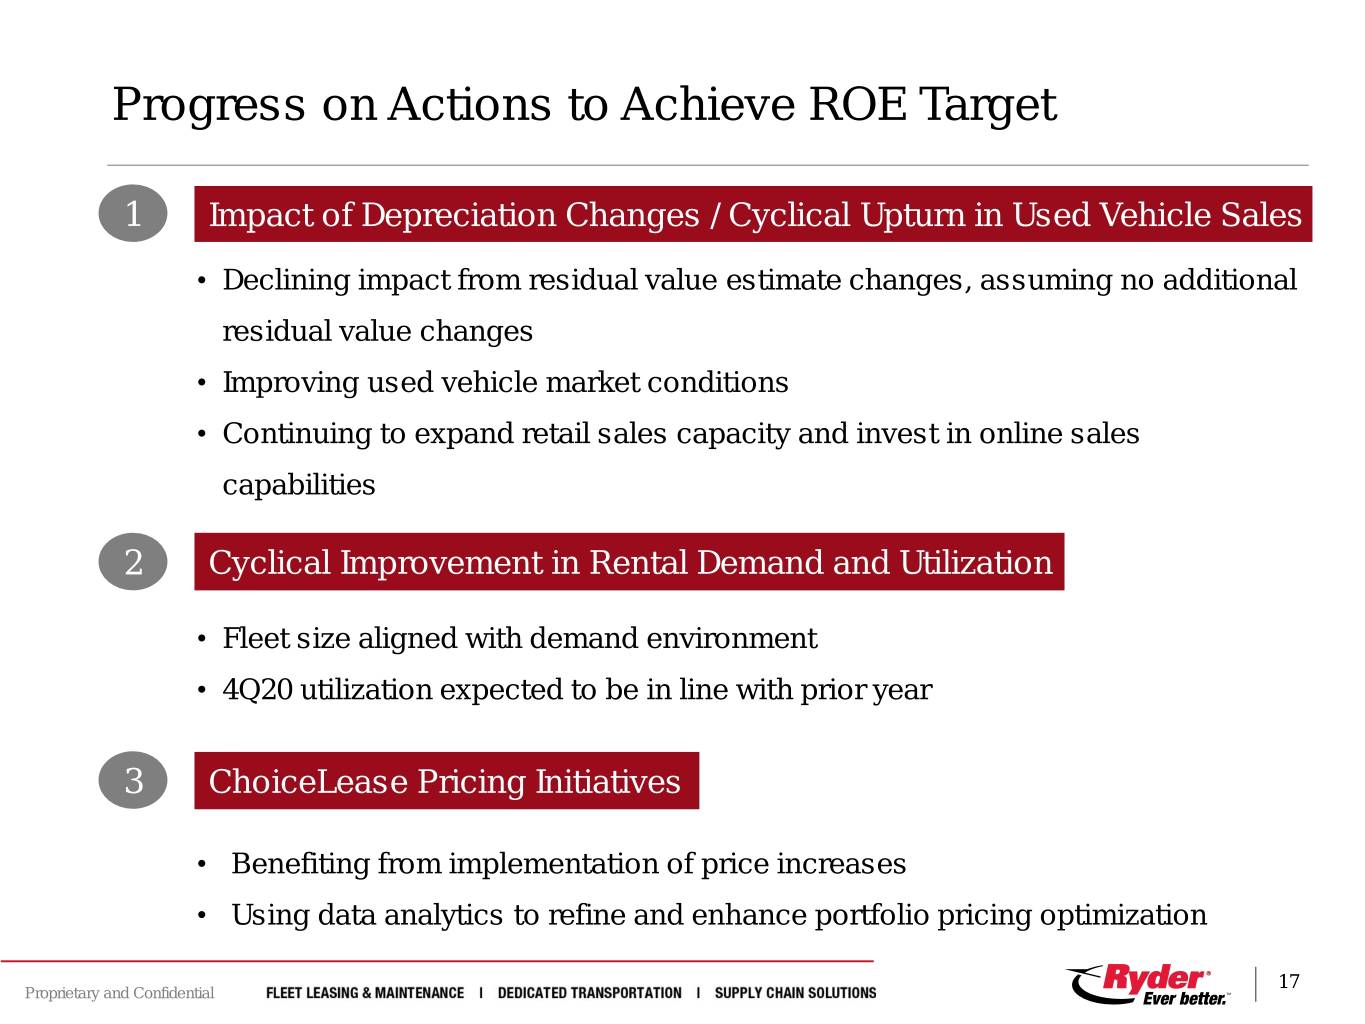
Progress on Actions to Achieve ROE Target 1 Impact of Depreciation Changes / Cyclical Upturn in Used Vehicle Sales • Declining impact from residual value estimate changes, assuming no additional residual value changes • Improving used vehicle market conditions • Continuing to expand retail sales capacity and invest in online sales capabilities 2 Cyclical Improvement in Rental Demand and Utilization • Fleet size aligned with demand environment • 4Q20 utilization expected to be in line with prior year 3 ChoiceLease Pricing Initiatives • Benefiting from implementation of price increases • Using data analytics to refine and enhance portfolio pricing optimization 17 Proprietary and Confidential
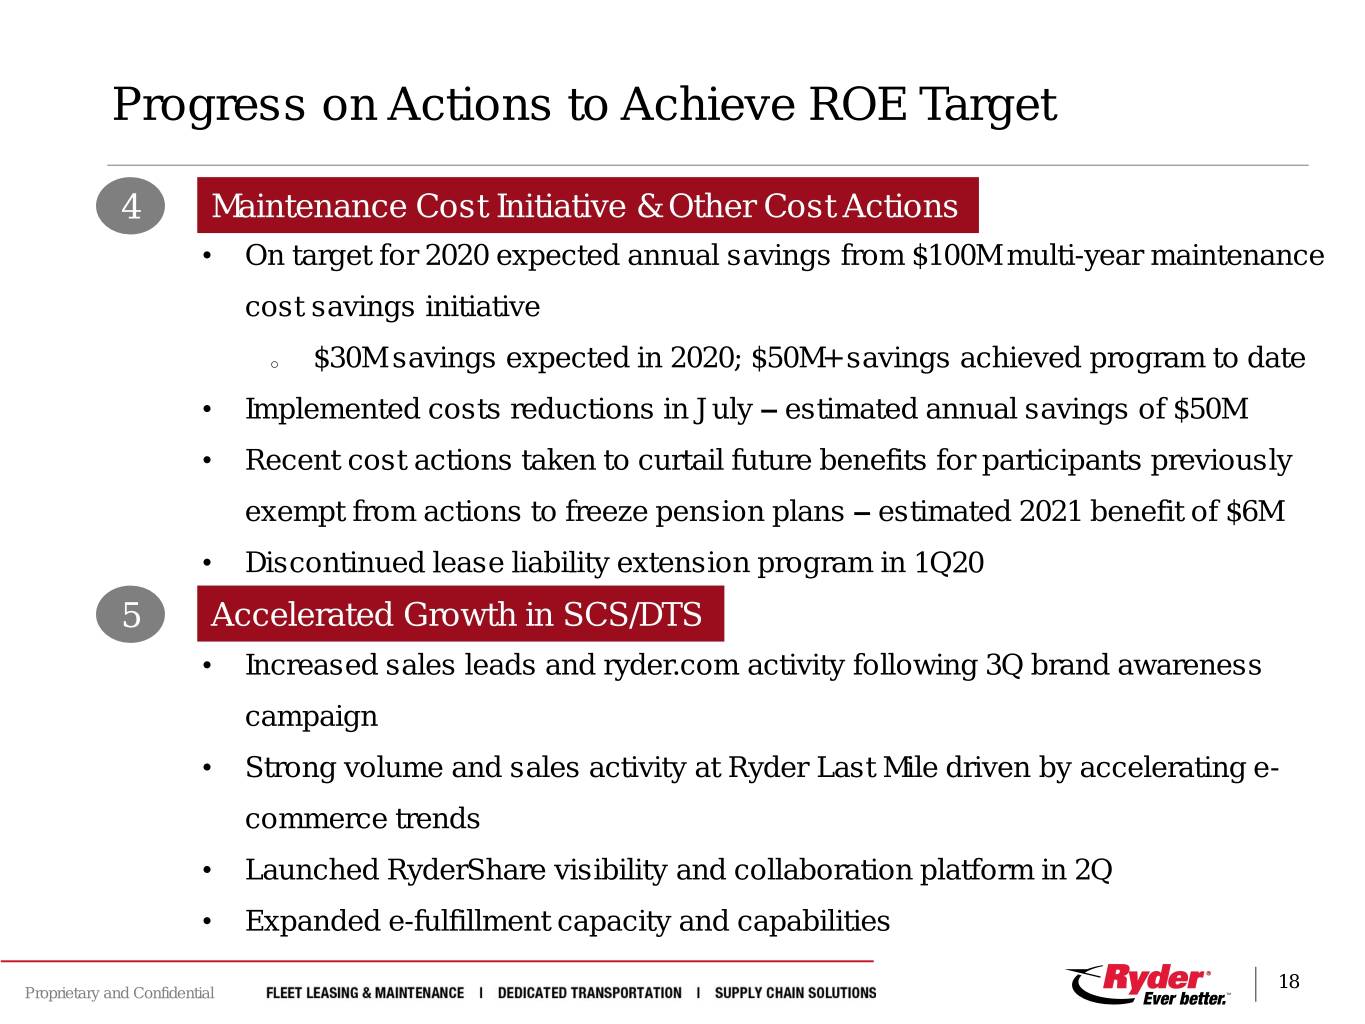
Progress on Actions to Achieve ROE Target 4 Maintenance Cost Initiative & Other Cost Actions • On target for 2020 expected annual savings from $100M multi-year maintenance cost savings initiative o $30M savings expected in 2020; $50M+ savings achieved program to date • Implemented costs reductions in July – estimated annual savings of $50M • Recent cost actions taken to curtail future benefits for participants previously exempt from actions to freeze pension plans – estimated 2021 benefit of $6M • Discontinued lease liability extension program in 1Q20 5 Accelerated Growth in SCS/DTS • Increased sales leads and ryder.com activity following 3Q brand awareness campaign • Strong volume and sales activity at Ryder Last Mile driven by accelerating e- commerce trends • Launched RyderShare visibility and collaboration platform in 2Q • Expanded e-fulfillment capacity and capabilities 18 Proprietary and Confidential
Contents • Third Quarter 2020 Results Overview • Outlook • Actions to Achieve ROE Target • Q & A © 2020 Ryder System, Inc. 19 All Rights Reserved
Q&A © 2020 Ryder System, Inc. 20 All Rights Reserved
Appendix Segment Comparable EBITDA ChoiceLease Fleet Count - Active Fleet Key Financial Statistics - YTD Business Segment Detail Central Support Services Balance Sheet Asset Management Non-GAAP Financial Measures & Reconciliations © 2020 Ryder System, Inc. 21 All Rights Reserved
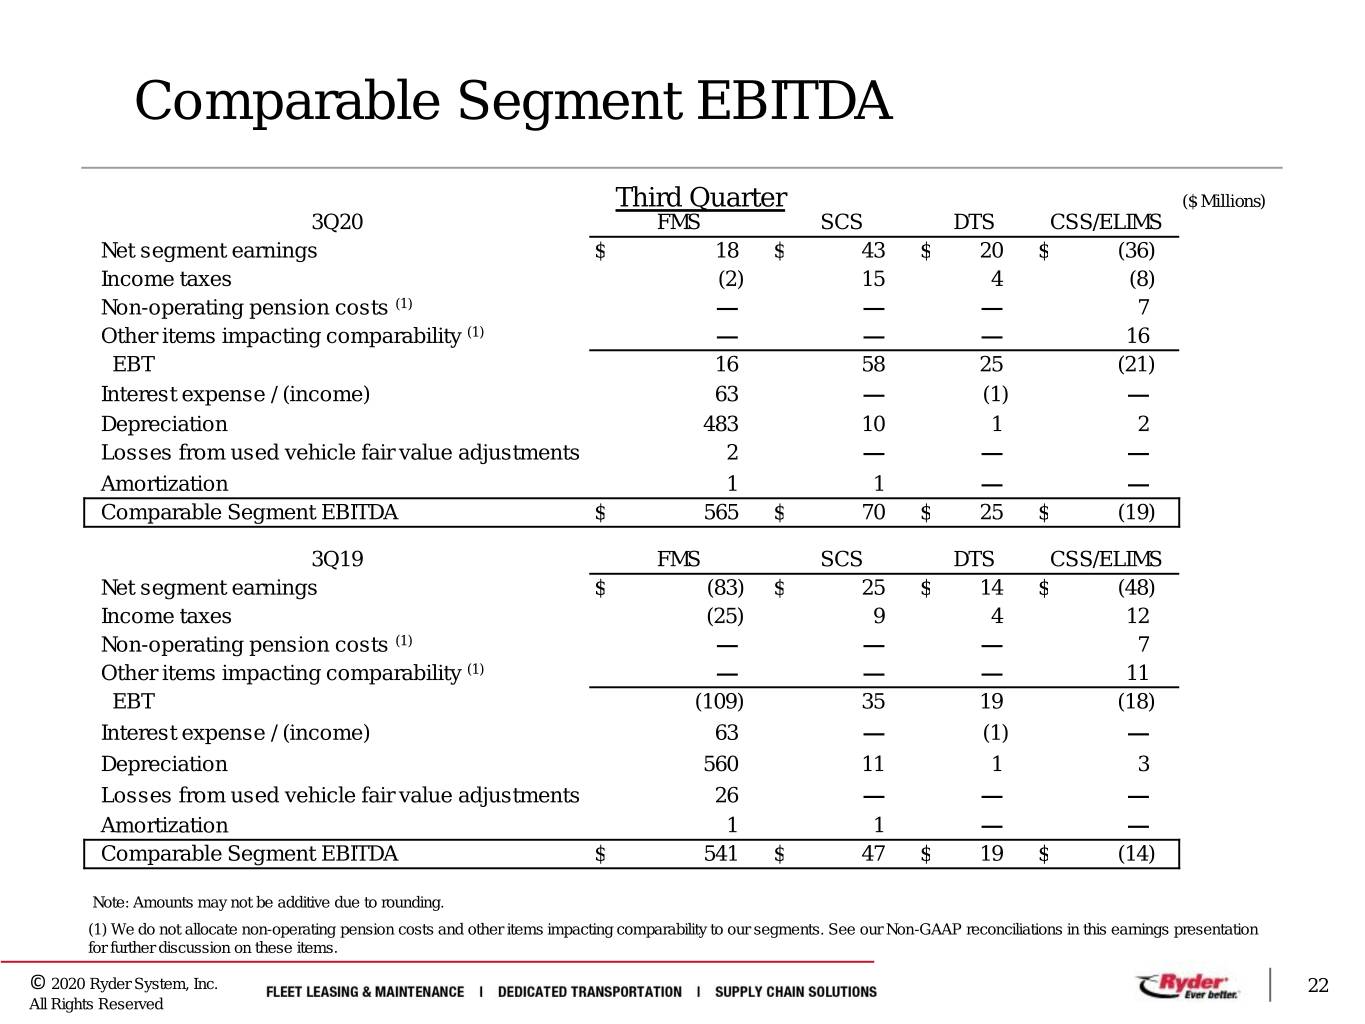
Comparable Segment EBITDA Third Quarter ($ Millions) 3Q20 FMS SCS DTS CSS/ELIMS Net segment earnings $ 18 $ 43 $ 20 $ (36) Income taxes (2) 15 4 (8) Non-operating pension costs (1) — — — 7 Other items impacting comparability (1) — — — 16 EBT 16 58 25 (21) Interest expense / (income) 63 — (1) — Depreciation 483 10 1 2 Losses from used vehicle fair value adjustments 2 — — — Amortization 1 1 — — Comparable Segment EBITDA $ 565 $ 70 $ 25 $ (19) 3Q19 FMS SCS DTS CSS/ELIMS Net segment earnings $ (83) $ 25 $ 14 $ (48) Income taxes (25) 9 4 12 Non-operating pension costs (1) — — — 7 Other items impacting comparability (1) — — — 11 EBT (109) 35 19 (18) Interest expense / (income) 63 — (1) — Depreciation 560 11 1 3 Losses from used vehicle fair value adjustments 26 — — — Amortization 1 1 — — Comparable Segment EBITDA $ 541 $ 47 $ 19 $ (14) Note: Amounts may not be additive due to rounding. (1) We do not allocate non-operating pension costs and other items impacting comparability to our segments. See our Non-GAAP reconciliations in this earnings presentation for further discussion on these items. © 2020 Ryder System, Inc. 22 All Rights Reserved
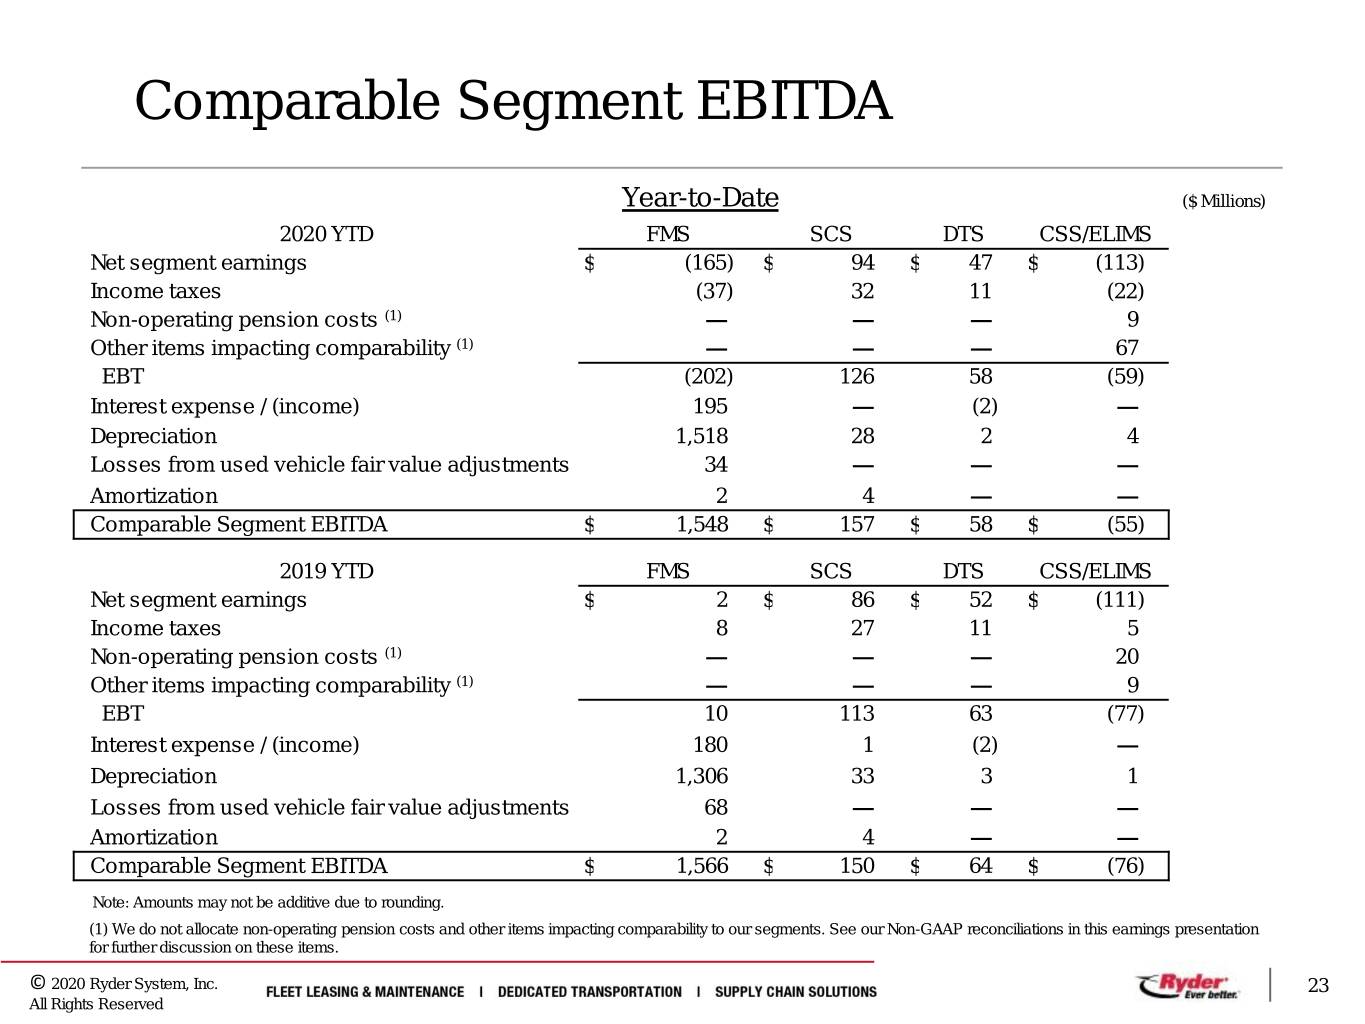
Comparable Segment EBITDA Year-to-Date ($ Millions) 2020 YTD FMS SCS DTS CSS/ELIMS Net segment earnings $ (165) $ 94 $ 47 $ (113) Income taxes (37) 32 11 (22) Non-operating pension costs (1) — — — 9 Other items impacting comparability (1) — — — 67 EBT (202) 126 58 (59) Interest expense / (income) 195 — (2) — Depreciation 1,518 28 2 4 Losses from used vehicle fair value adjustments 34 — — — Amortization 2 4 — — Comparable Segment EBITDA $ 1,548 $ 157 $ 58 $ (55) 2019 YTD FMS SCS DTS CSS/ELIMS Net segment earnings $ 2 $ 86 $ 52 $ (111) Income taxes 8 27 11 5 Non-operating pension costs (1) — — — 20 Other items impacting comparability (1) — — — 9 EBT 10 113 63 (77) Interest expense / (income) 180 1 (2) — Depreciation 1,306 33 3 1 Losses from used vehicle fair value adjustments 68 — — — Amortization 2 4 — — Comparable Segment EBITDA $ 1,566 $ 150 $ 64 $ (76) Note: Amounts may not be additive due to rounding. (1) We do not allocate non-operating pension costs and other items impacting comparability to our segments. See our Non-GAAP reconciliations in this earnings presentation for further discussion on these items. © 2020 Ryder System, Inc. 23 All Rights Reserved
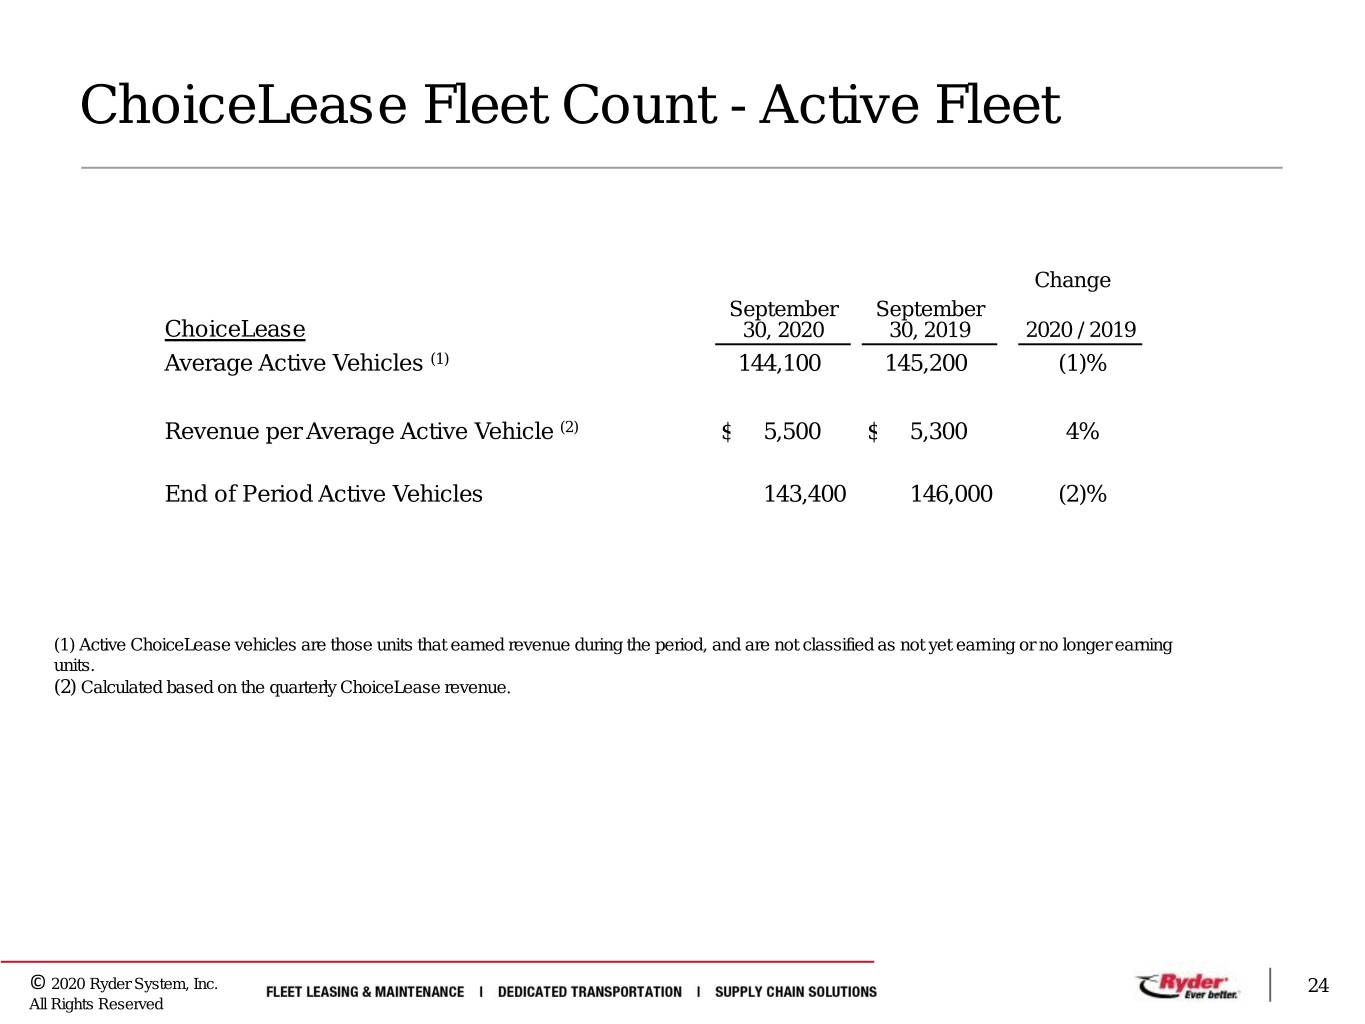
ChoiceLease Fleet Count - Active Fleet Change September September ChoiceLease 30, 2020 30, 2019 2020 / 2019 Average Active Vehicles (1) 144,100 145,200 (1)% Revenue per Average Active Vehicle (2) $ 5,500 $ 5,300 4% End of Period Active Vehicles 143,400 146,000 (2)% (1) Active ChoiceLease vehicles are those units that earned revenue during the period, and are not classified as not yet earning or no longer earning units. (2) Calculated based on the quarterly ChoiceLease revenue. © 2020 Ryder System, Inc. 24 All Rights Reserved
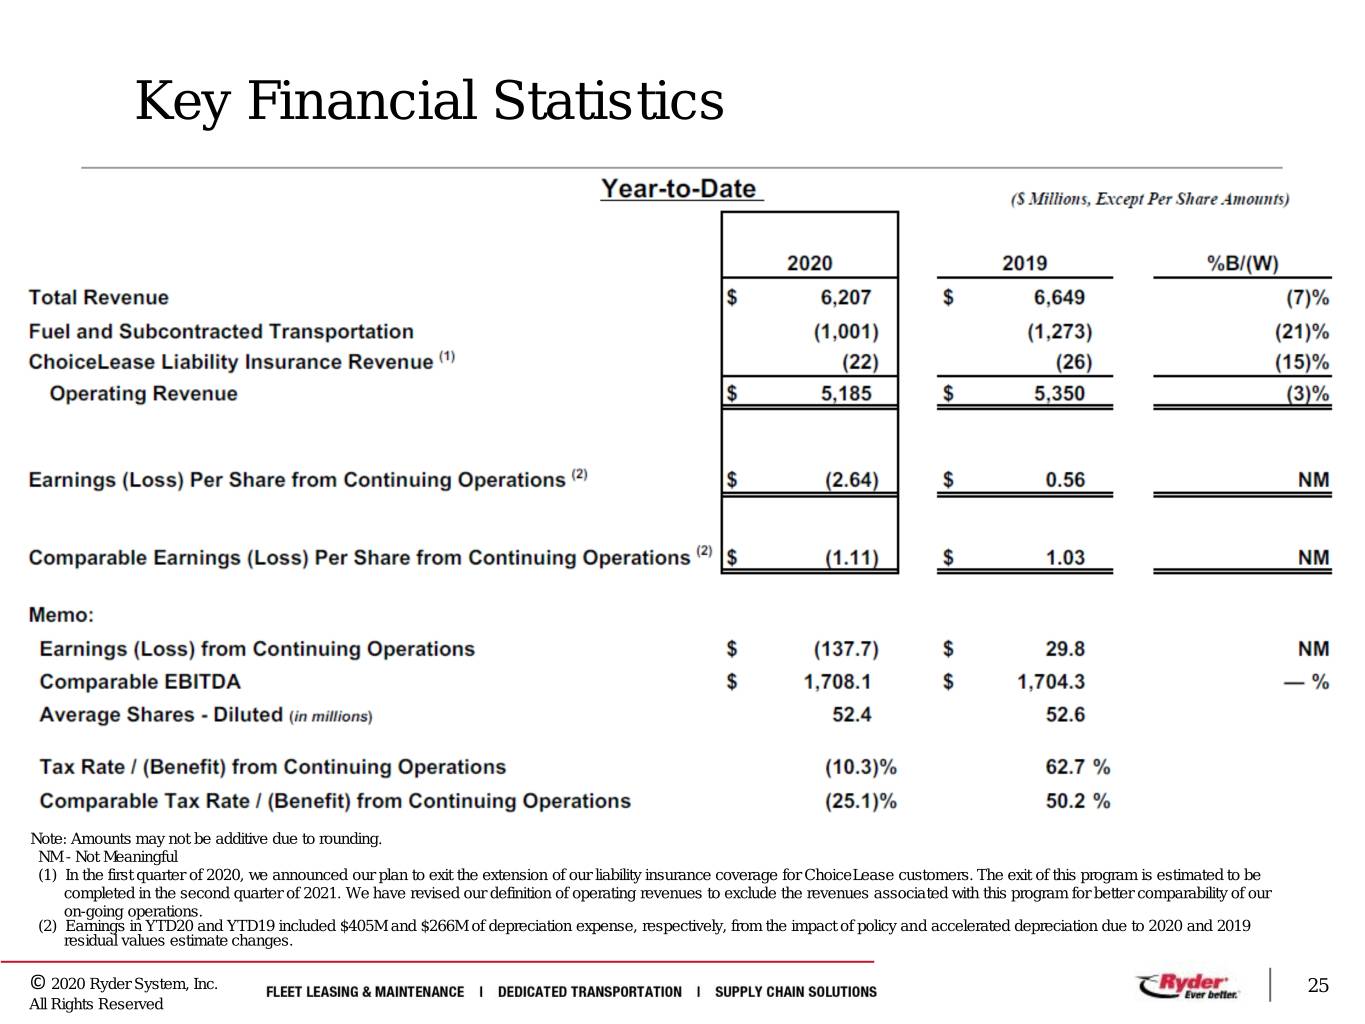
Key Financial Statistics Note: Amounts may not be additive due to rounding. NM - Not Meaningful (1) In the first quarter of 2020, we announced our plan to exit the extension of our liability insurance coverage for ChoiceLease customers. The exit of this program is estimated to be completed in the second quarter of 2021. We have revised our definition of operating revenues to exclude the revenues associated with this program for better comparability of our on-going operations. (2) Earnings in YTD20 and YTD19 included $405M and $266M of depreciation expense, respectively, from the impact of policy and accelerated depreciation due to 2020 and 2019 residual values estimate changes. © 2020 Ryder System, Inc. 25 All Rights Reserved
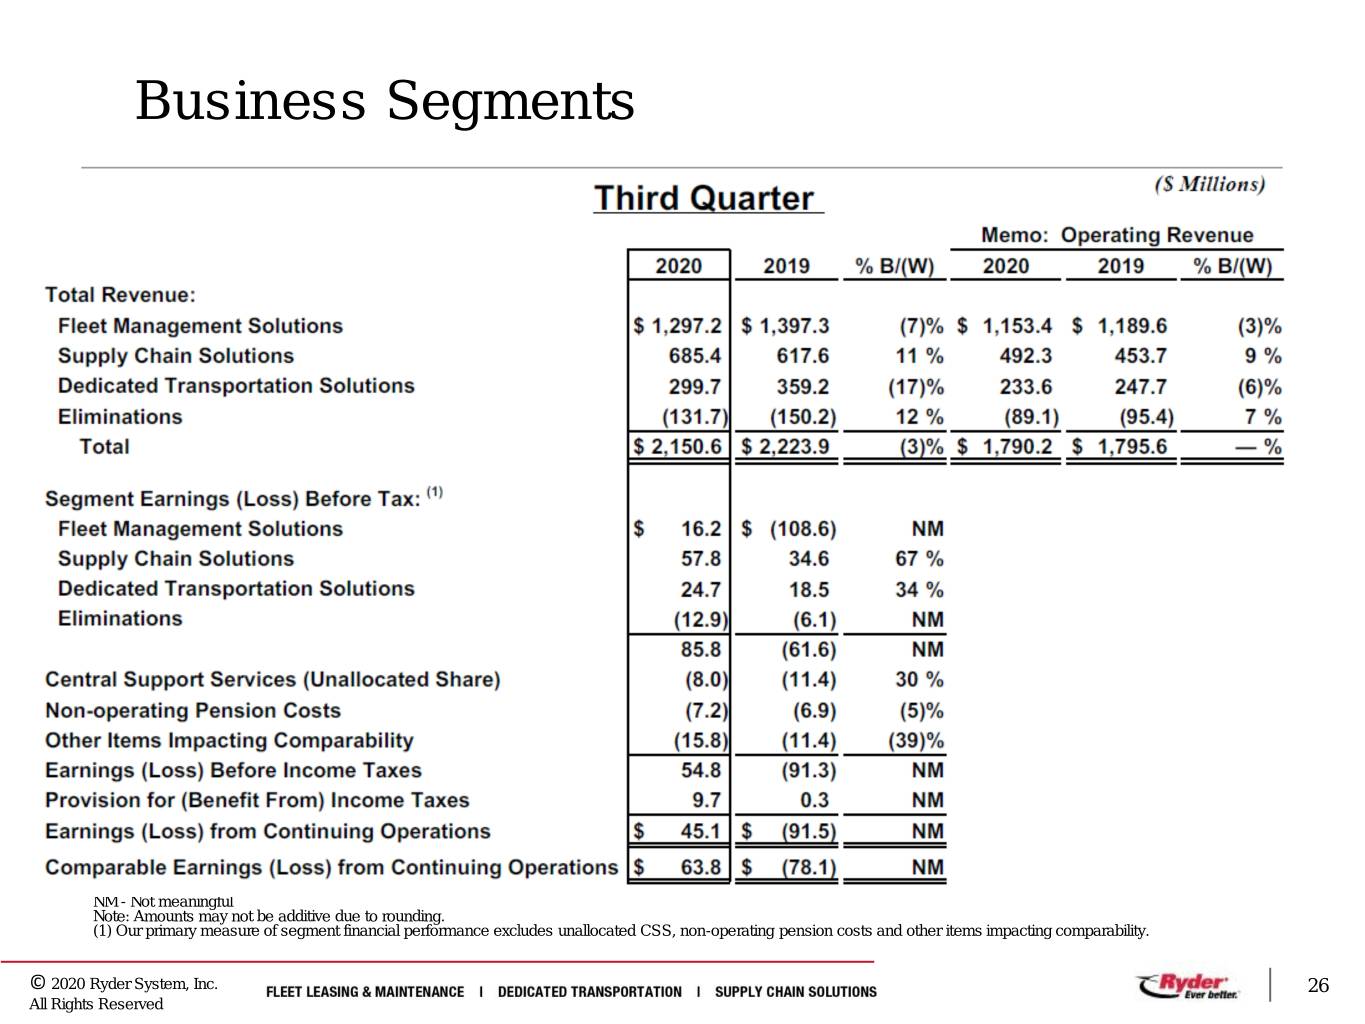
Business Segments NM - Not meaningful Note: Amounts may not be additive due to rounding. (1) Our primary measure of segment financial performance excludes unallocated CSS, non-operating pension costs and other items impacting comparability. © 2020 Ryder System, Inc. 26 All Rights Reserved
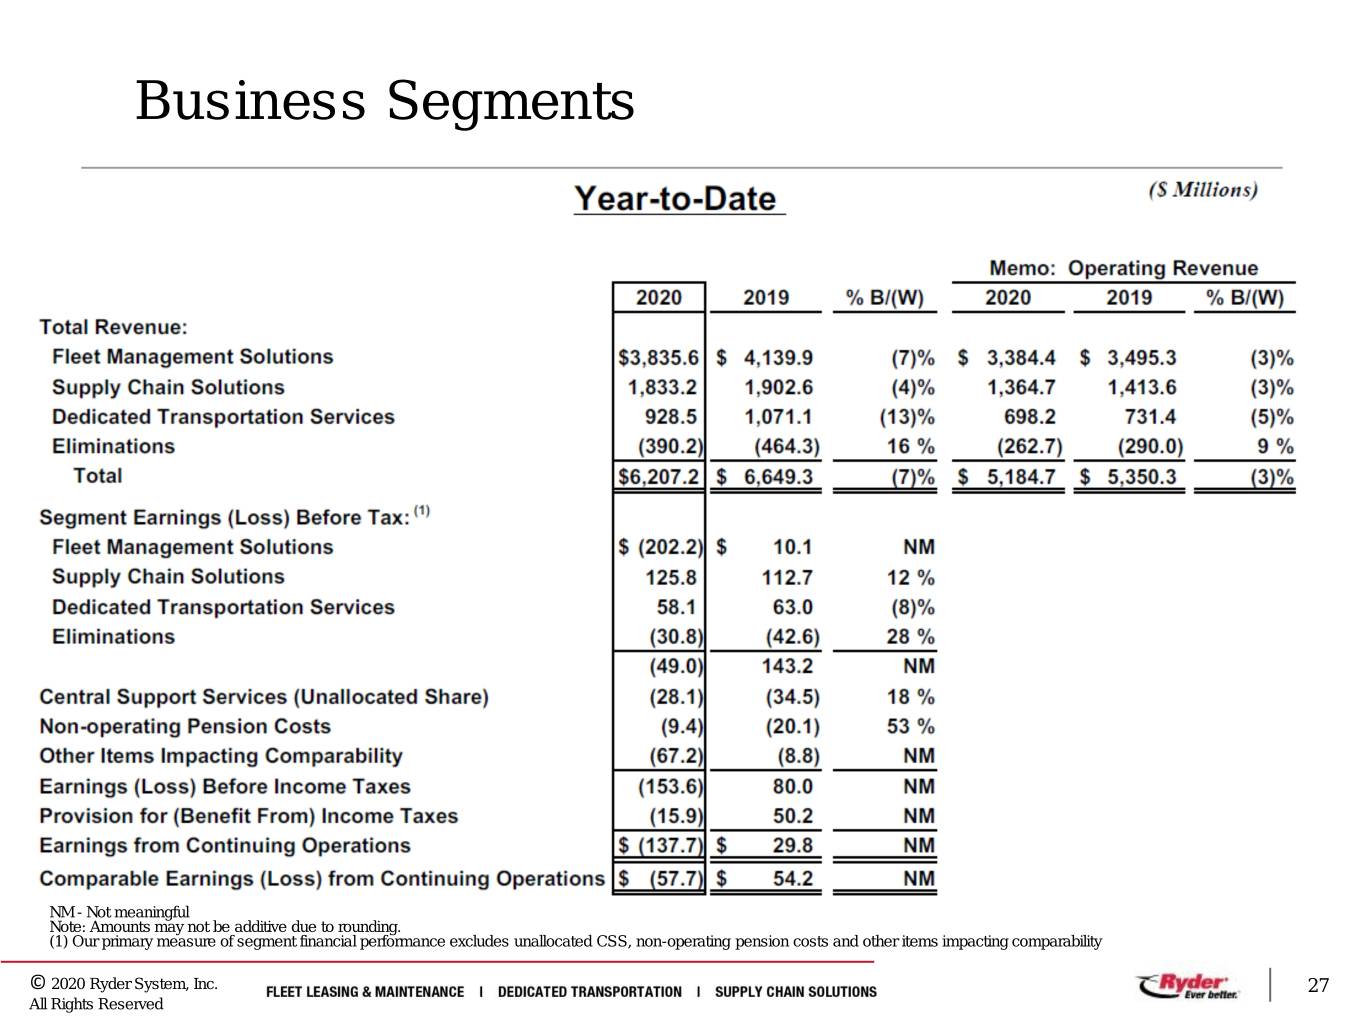
Business Segments NM - Not meaningful Note: Amounts may not be additive due to rounding. (1) Our primary measure of segment financial performance excludes unallocated CSS, non-operating pension costs and other items impacting comparability © 2020 Ryder System, Inc. 27 All Rights Reserved
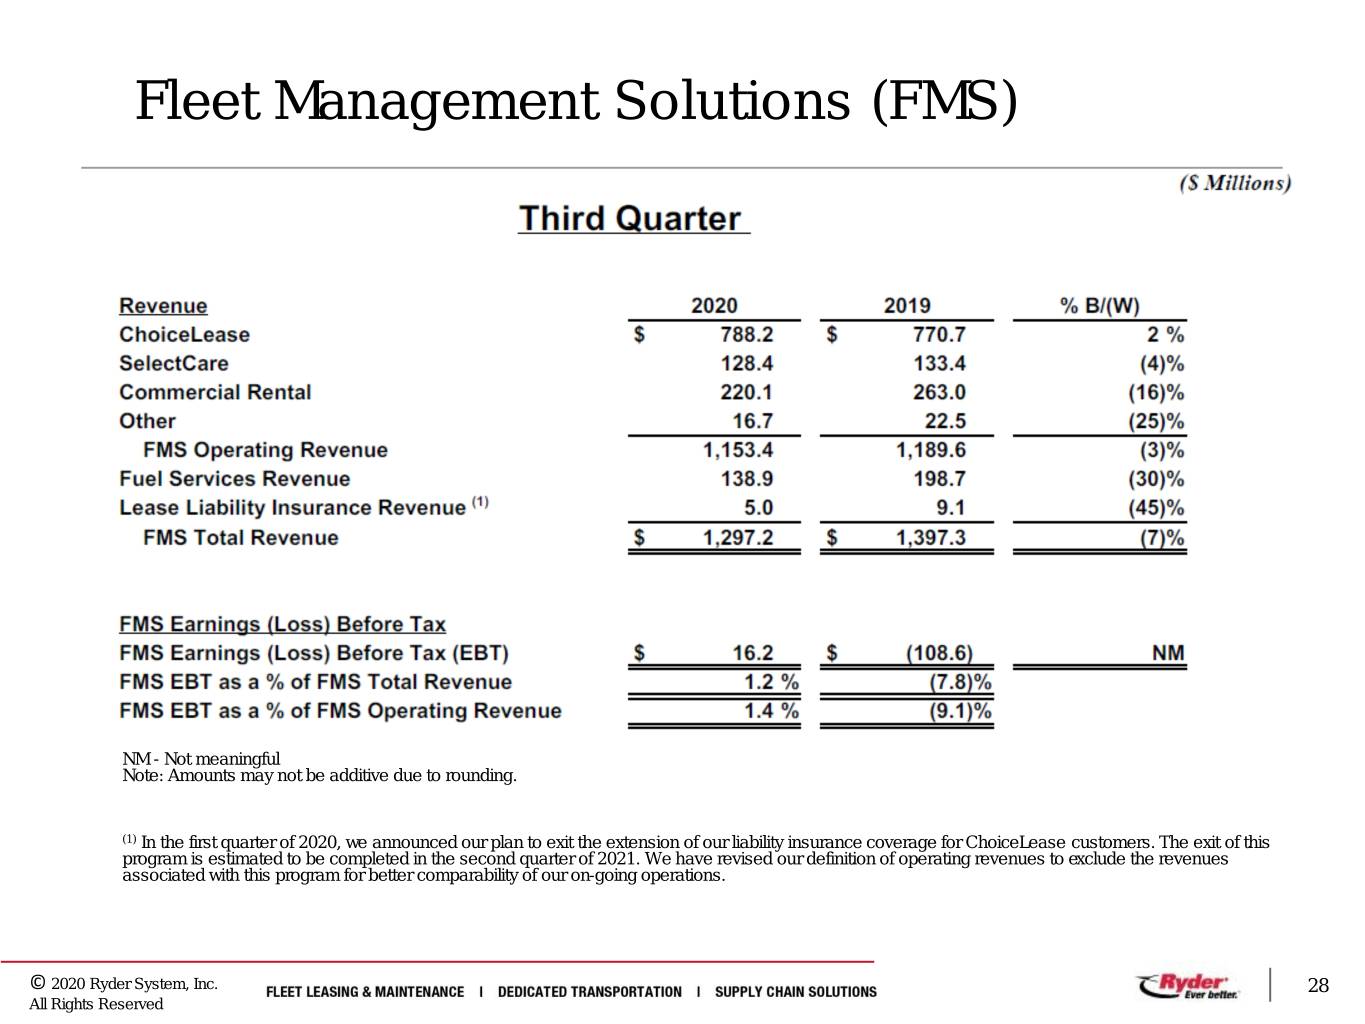
Fleet Management Solutions (FMS) NM - Not meaningful Note: Amounts may not be additive due to rounding. (1) In the first quarter of 2020, we announced our plan to exit the extension of our liability insurance coverage for ChoiceLease customers. The exit of this program is estimated to be completed in the second quarter of 2021. We have revised our definition of operating revenues to exclude the revenues associated with this program for better comparability of our on-going operations. © 2020 Ryder System, Inc. 28 All Rights Reserved
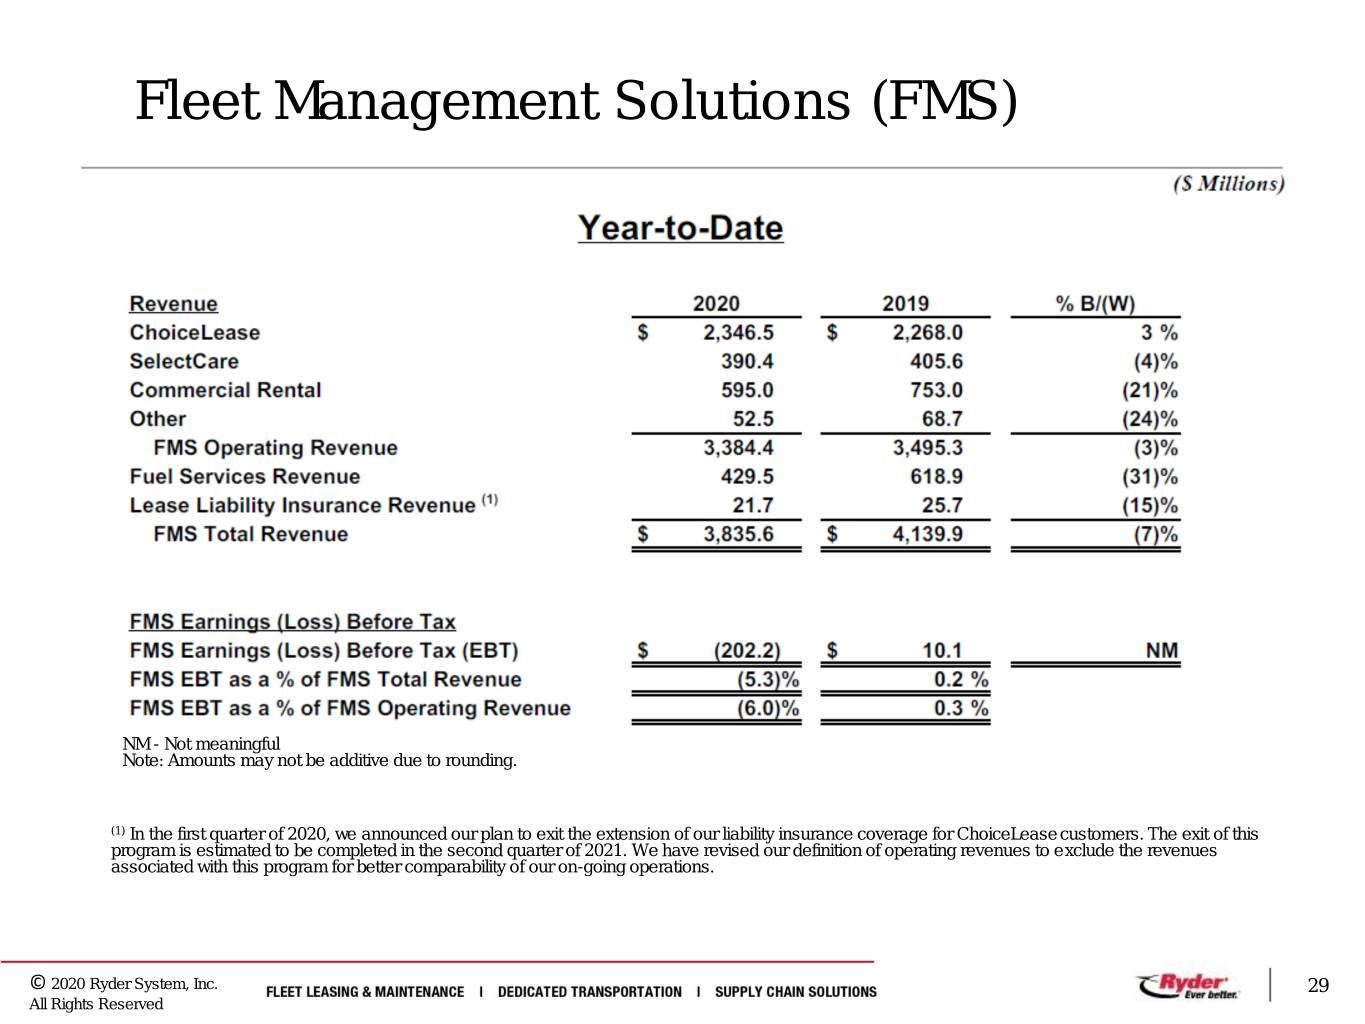
Fleet Management Solutions (FMS) NM - Not meaningful Note: Amounts may not be additive due to rounding. (1) In the first quarter of 2020, we announced our plan to exit the extension of our liability insurance coverage for ChoiceLease customers. The exit of this program is estimated to be completed in the second quarter of 2021. We have revised our definition of operating revenues to exclude the revenues associated with this program for better comparability of our on-going operations. © 2020 Ryder System, Inc. 29 All Rights Reserved
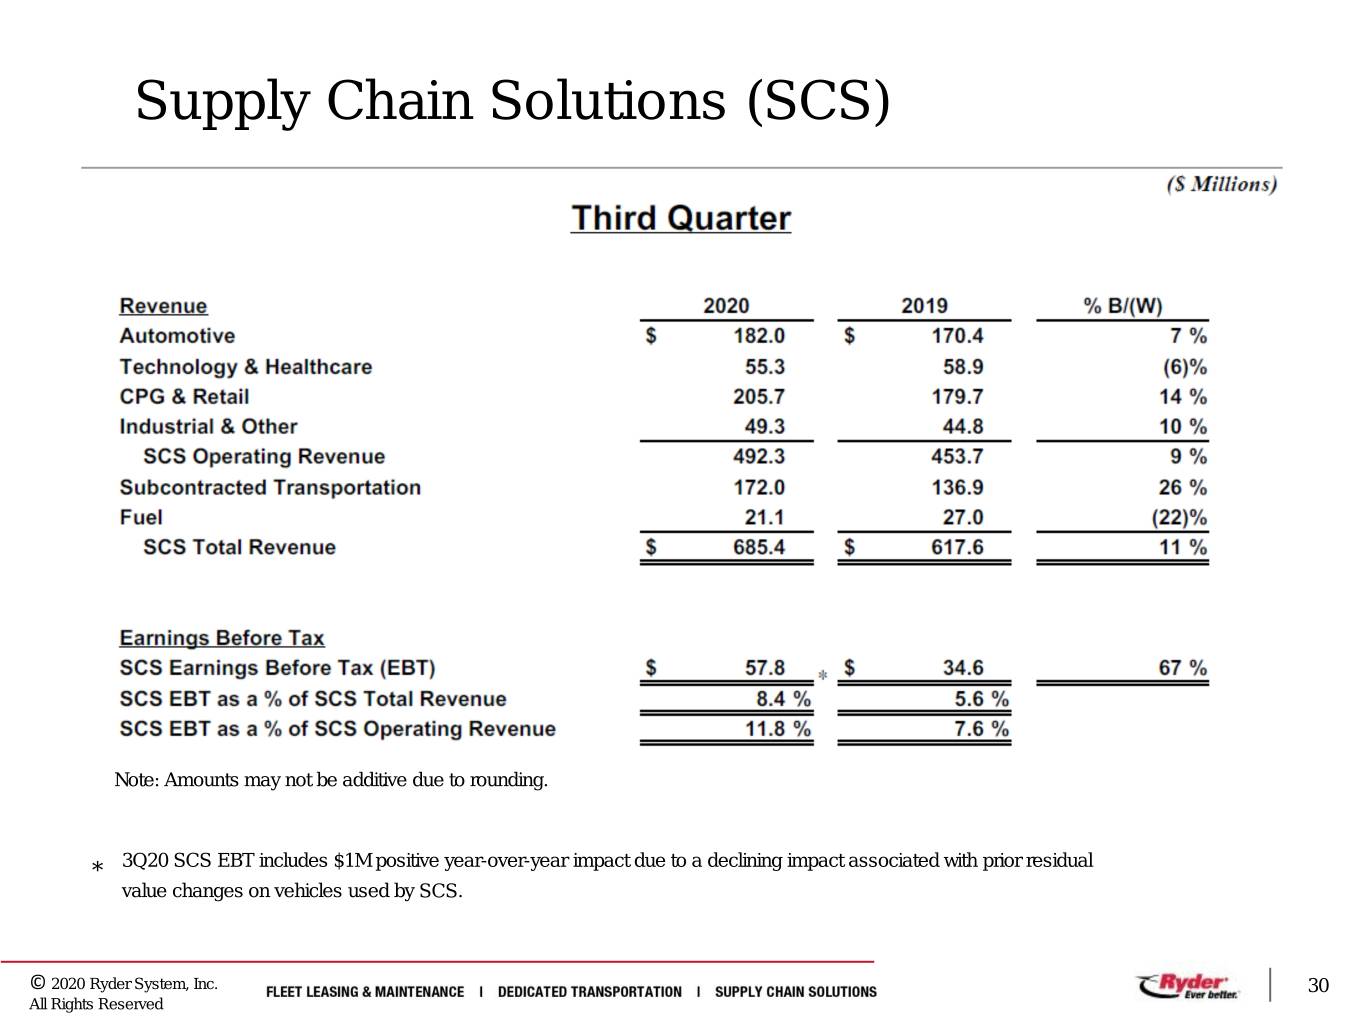
Supply Chain Solutions (SCS) * Note: Amounts may not be additive due to rounding. * 3Q20 SCS EBT includes $1M positive year-over-year impact due to a declining impact associated with prior residual value changes on vehicles used by SCS. © 2020 Ryder System, Inc. 30 All Rights Reserved
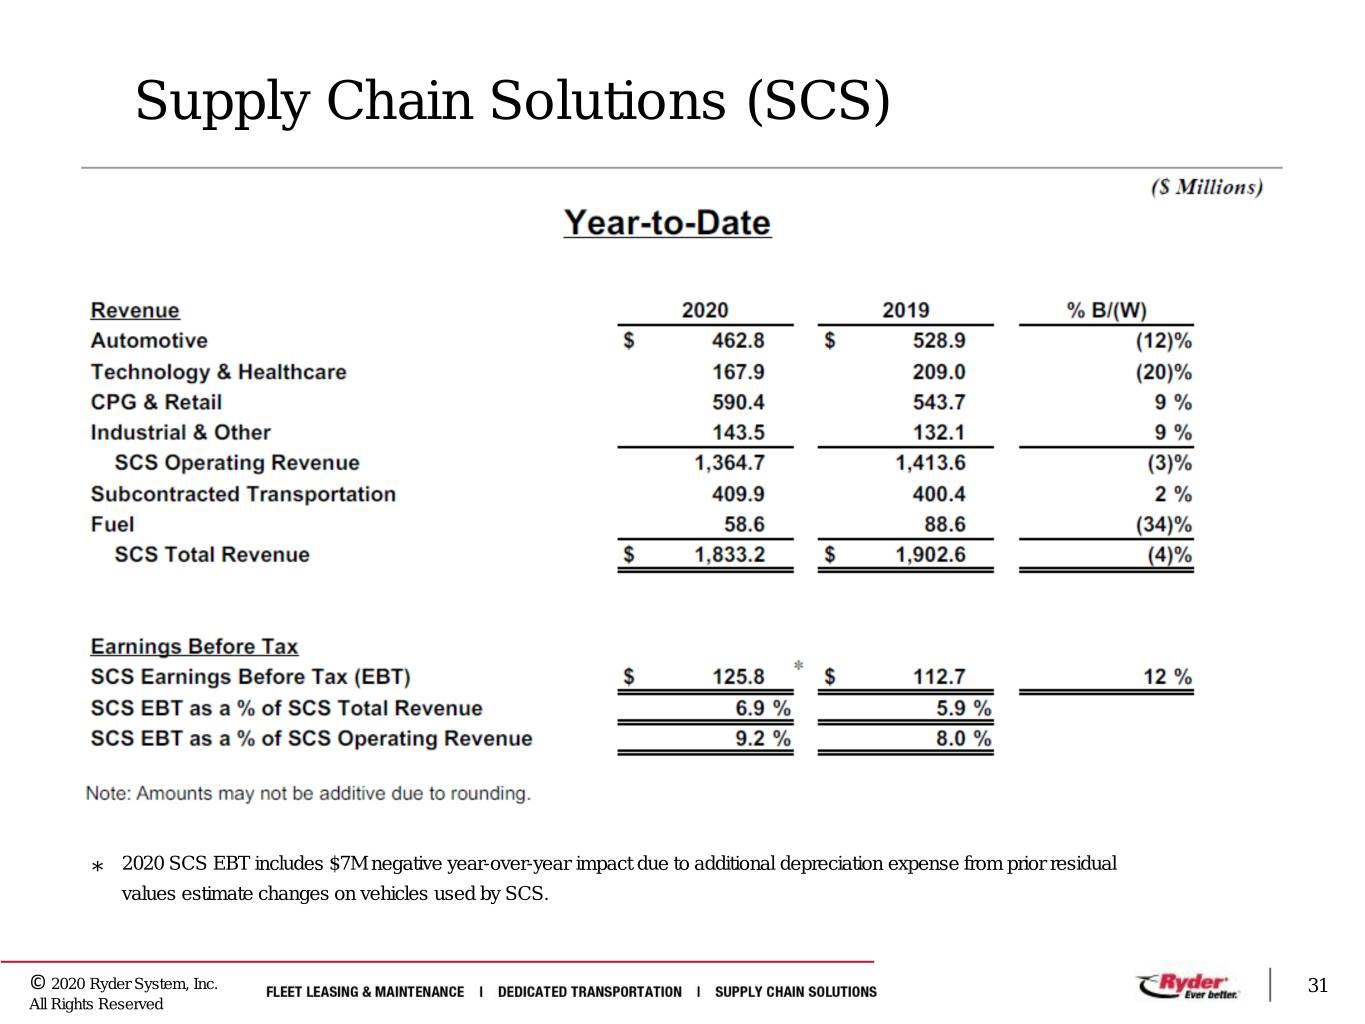
Supply Chain Solutions (SCS) * 2020 SCS EBT includes $7M negative year-over-year impact due to additional depreciation expense from prior residual values estimate changes on vehicles used by SCS. © 2020 Ryder System, Inc. 31 All Rights Reserved
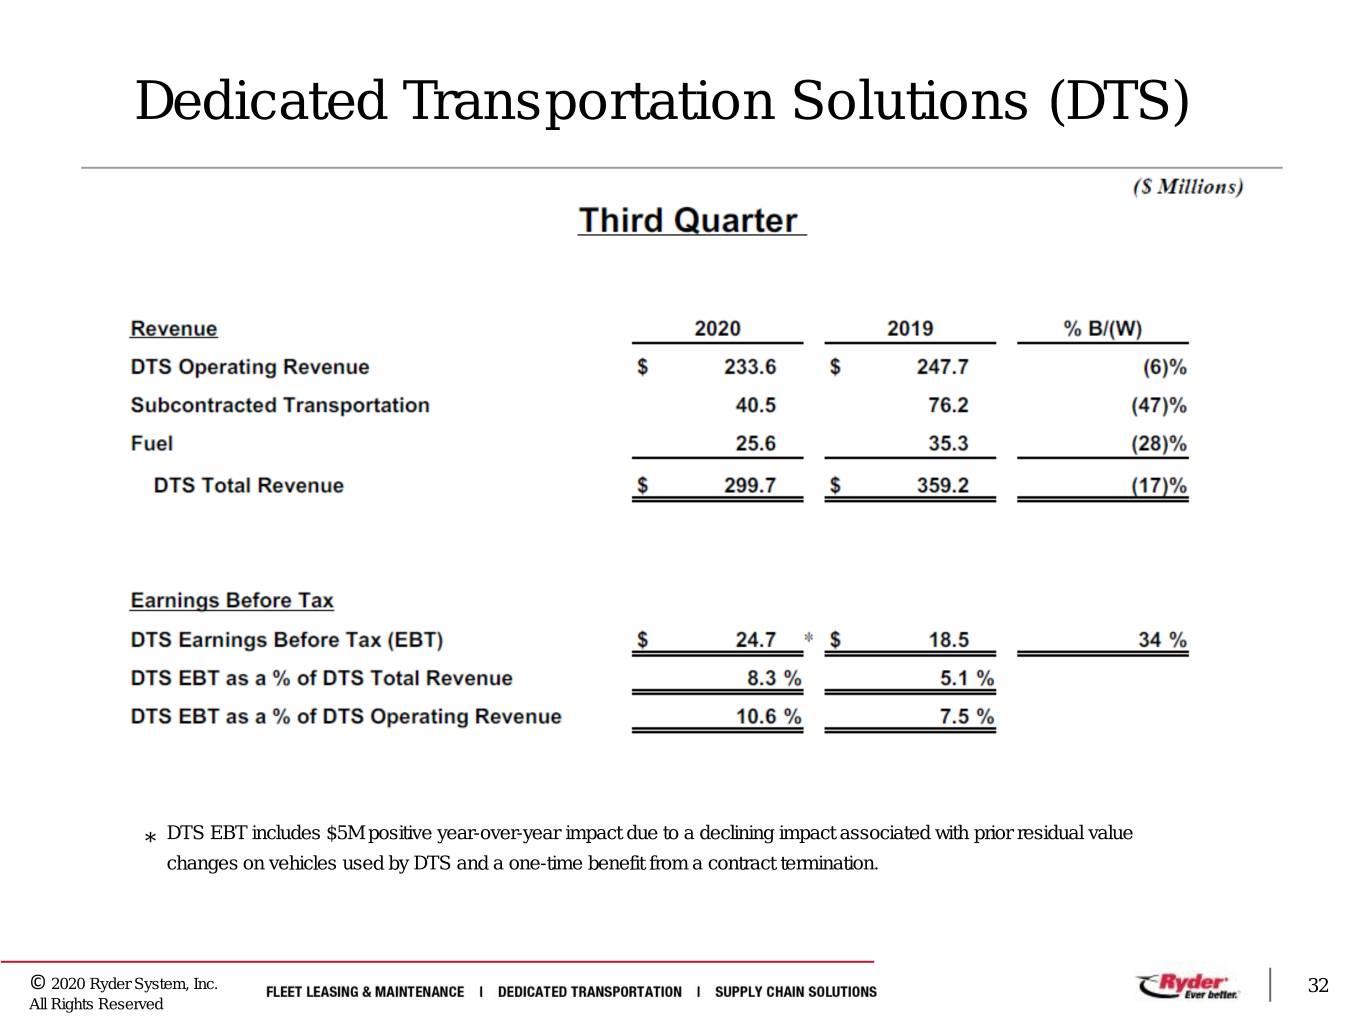
Dedicated Transportation Solutions (DTS) * DTS EBT includes $5M positive year-over-year impact due to a declining impact associated with prior residual value changes on vehicles used by DTS and a one-time benefit from a contract termination. © 2020 Ryder System, Inc. 32 All Rights Reserved
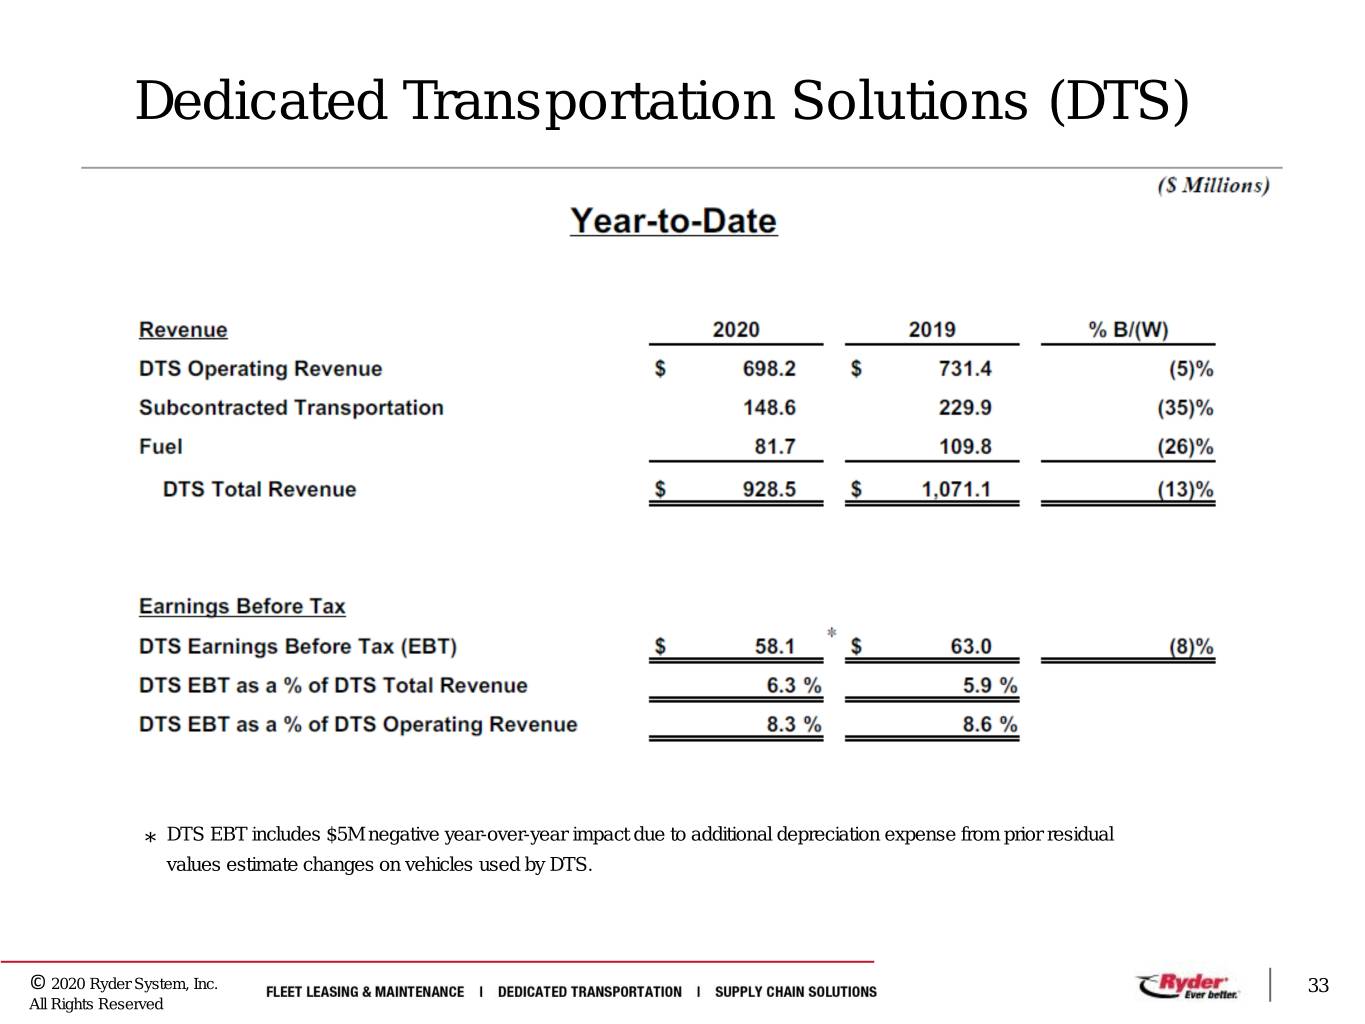
Dedicated Transportation Solutions (DTS) * DTS EBT includes $5M negative year-over-year impact due to additional depreciation expense from prior residual values estimate changes on vehicles used by DTS. © 2020 Ryder System, Inc. 33 All Rights Reserved
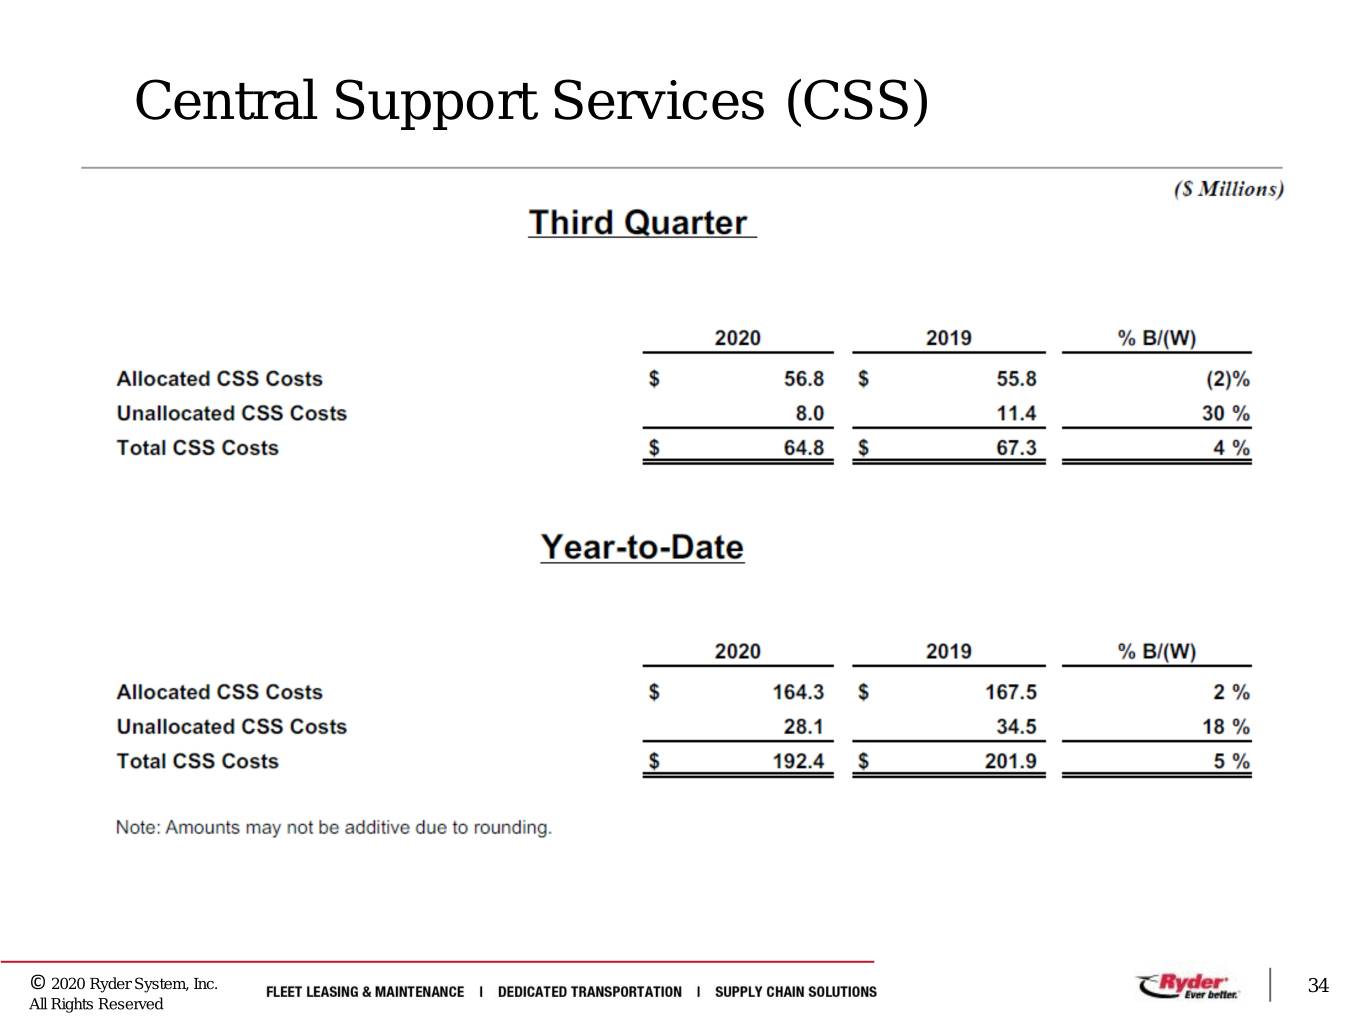
Central Support Services (CSS) Note: Amounts may not be additive due to rounding. © 2020 Ryder System, Inc. 34 All Rights Reserved
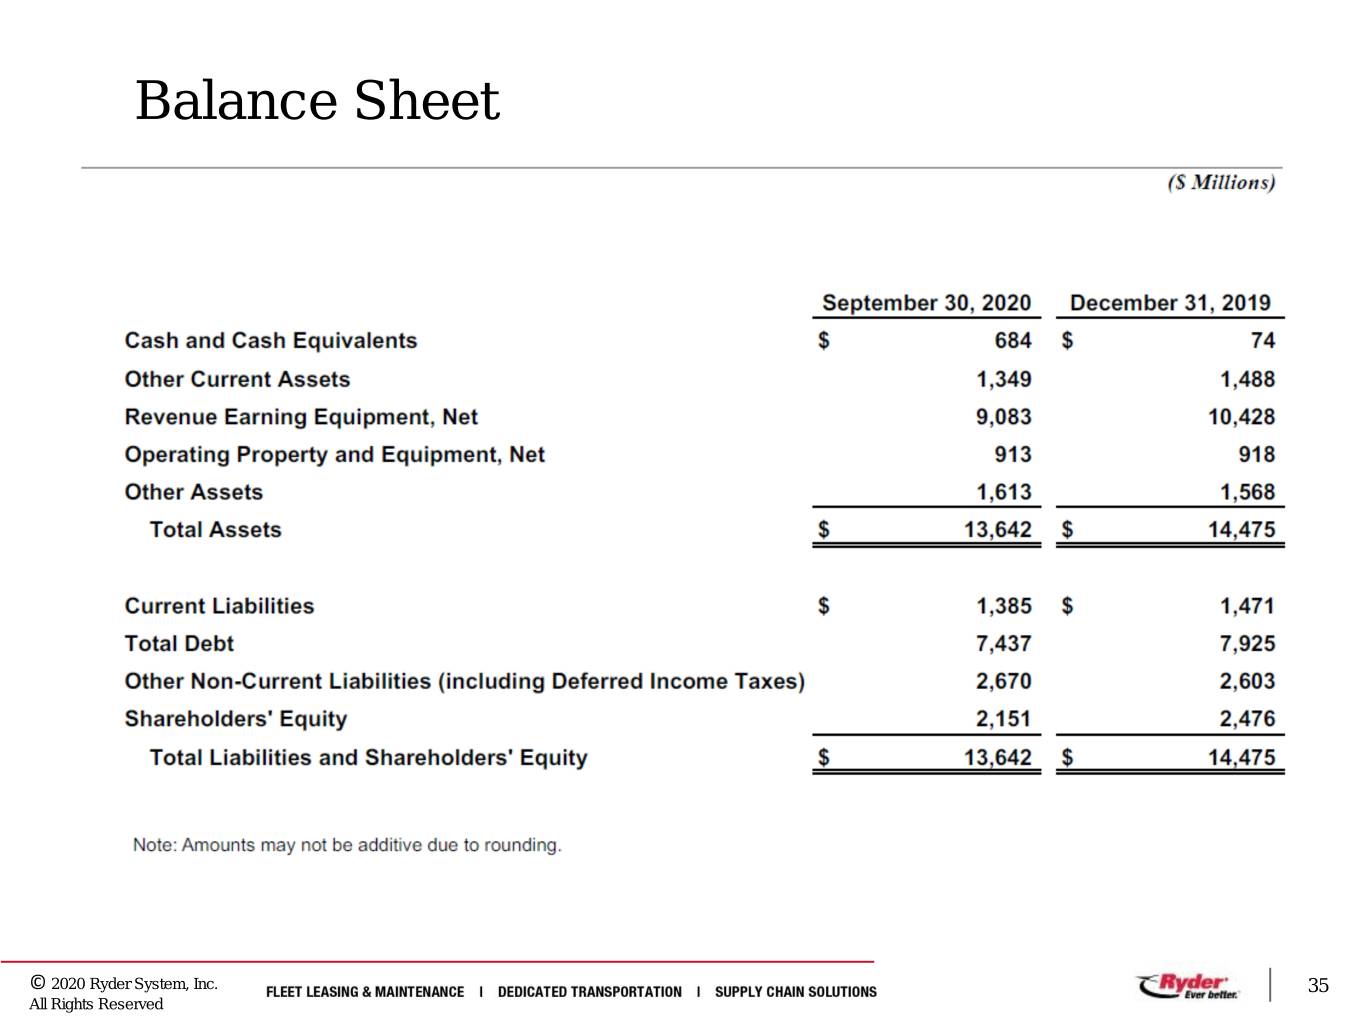
Balance Sheet Note: Amounts may not be additive due to rounding. © 2020 Ryder System, Inc. 35 All Rights Reserved
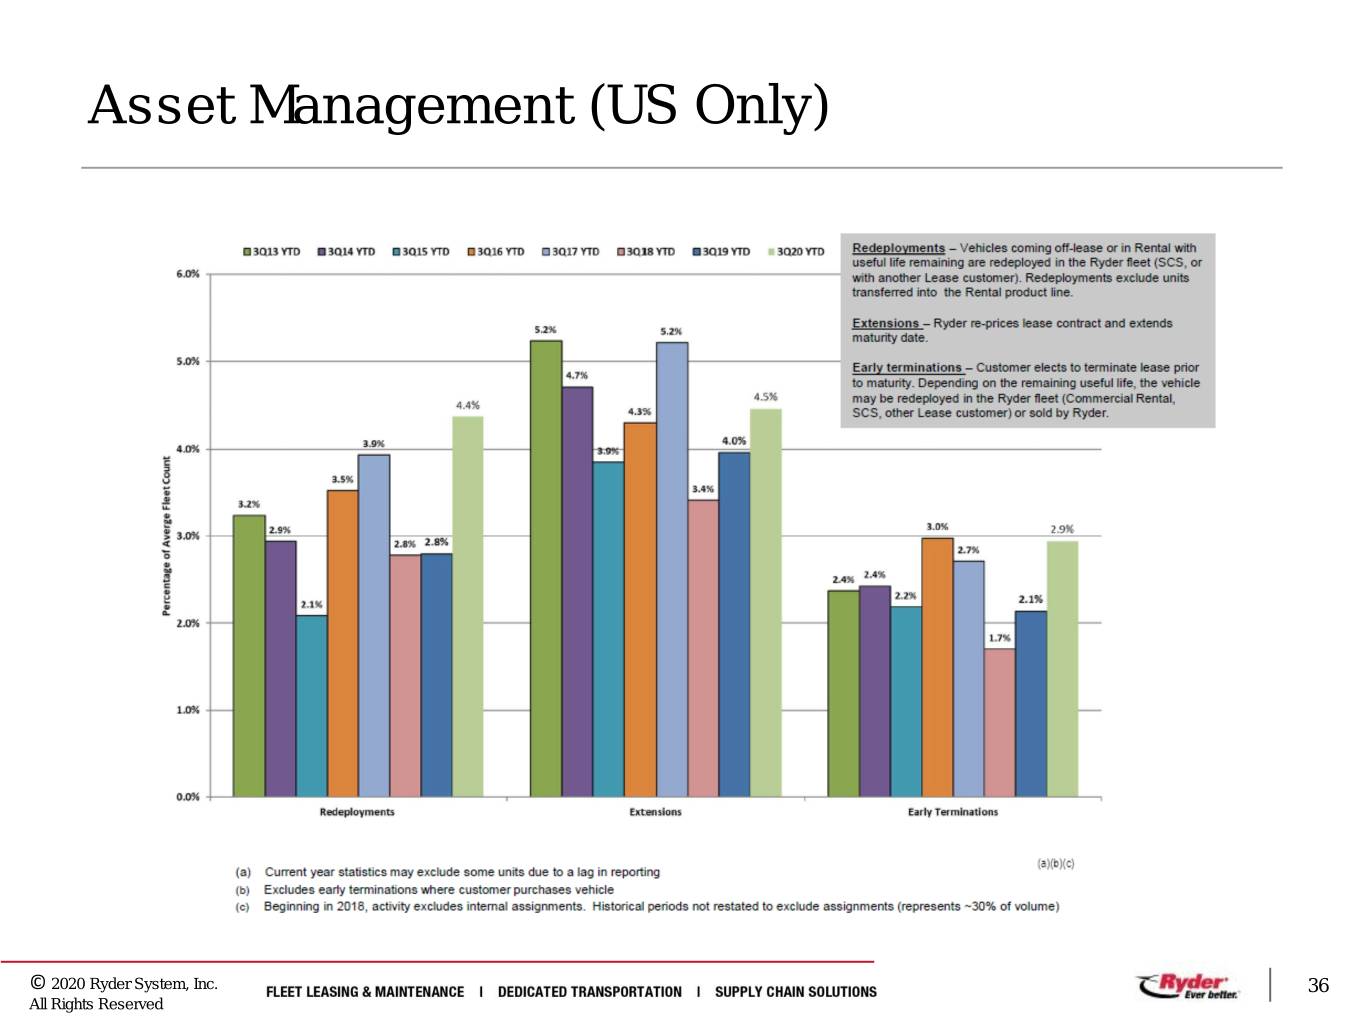
Asset Management (US Only) Asset Management (US Only) © 2020 Ryder System, Inc. 36 All Rights Reserved
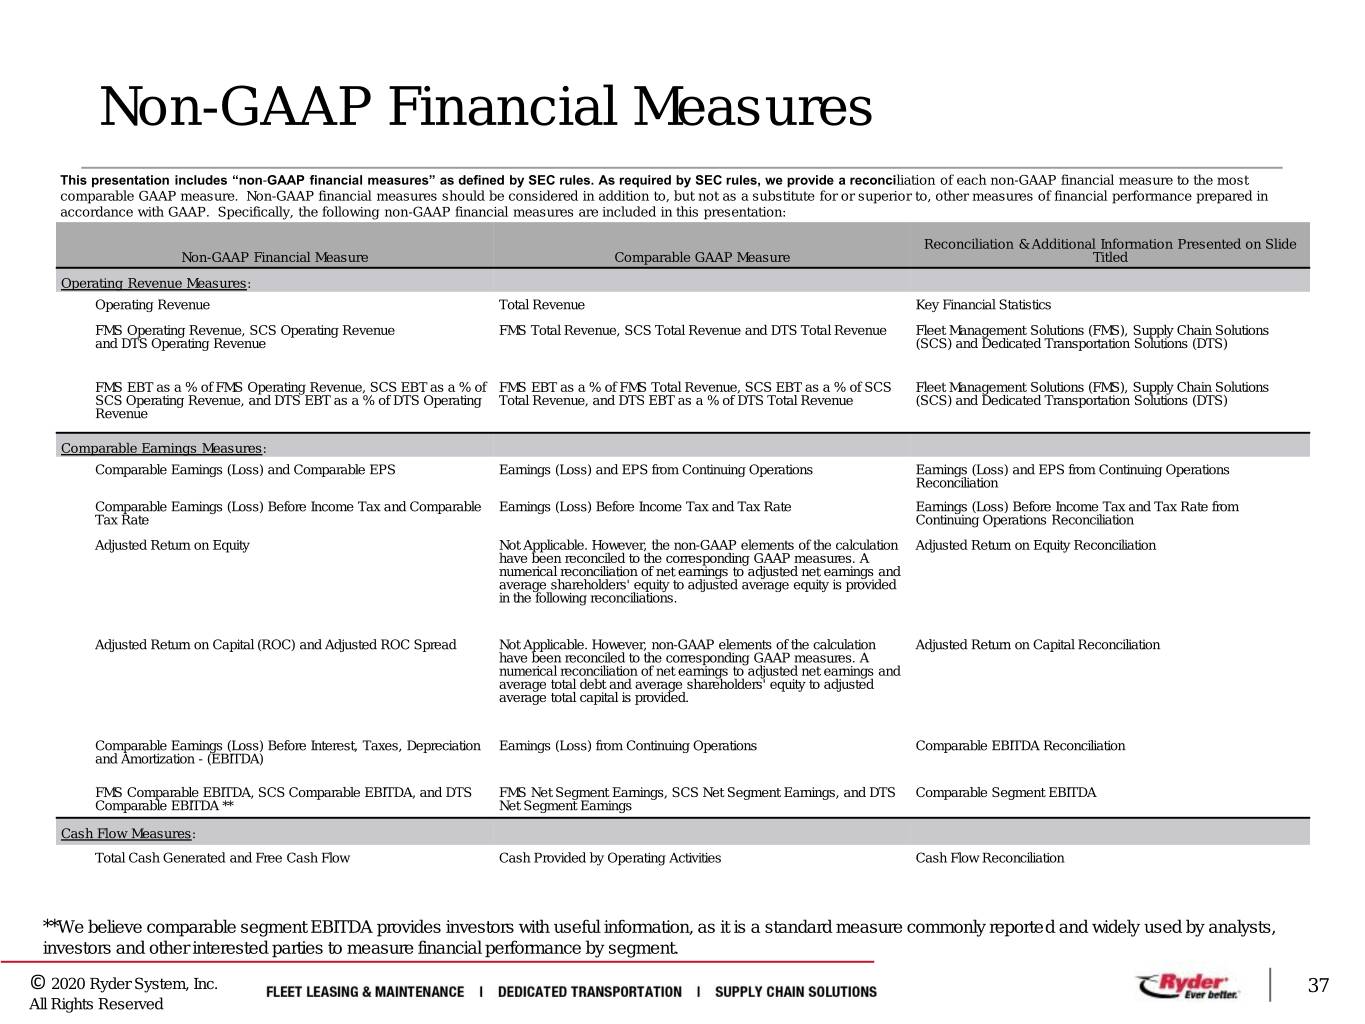
Non-GAAP Financial Measures This presentation includes “non-GAAP financial measures” as defined by SEC rules. As required by SEC rules, we provide a reconciliation of each non-GAAP financial measure to the most comparable GAAP measure. Non-GAAP financial measures should be considered in addition to, but not as a substitute for or superior to, other measures of financial performance prepared in accordance with GAAP. Specifically, the following non-GAAP financial measures are included in this presentation: Reconciliation & Additional Information Presented on Slide Non-GAAP Financial Measure Comparable GAAP Measure Titled Operating Revenue Measures: Operating Revenue Total Revenue Key Financial Statistics FMS Operating Revenue, SCS Operating Revenue FMS Total Revenue, SCS Total Revenue and DTS Total Revenue Fleet Management Solutions (FMS), Supply Chain Solutions and DTS Operating Revenue (SCS) and Dedicated Transportation Solutions (DTS) FMS EBT as a % of FMS Operating Revenue, SCS EBT as a % of FMS EBT as a % of FMS Total Revenue, SCS EBT as a % of SCS Fleet Management Solutions (FMS), Supply Chain Solutions SCS Operating Revenue, and DTS EBT as a % of DTS Operating Total Revenue, and DTS EBT as a % of DTS Total Revenue (SCS) and Dedicated Transportation Solutions (DTS) Revenue Comparable Earnings Measures: Comparable Earnings (Loss) and Comparable EPS Earnings (Loss) and EPS from Continuing Operations Earnings (Loss) and EPS from Continuing Operations Reconciliation Comparable Earnings (Loss) Before Income Tax and Comparable Earnings (Loss) Before Income Tax and Tax Rate Earnings (Loss) Before Income Tax and Tax Rate from Tax Rate Continuing Operations Reconciliation Adjusted Return on Equity Not Applicable. However, the non-GAAP elements of the calculation Adjusted Return on Equity Reconciliation have been reconciled to the corresponding GAAP measures. A numerical reconciliation of net earnings to adjusted net earnings and average shareholders' equity to adjusted average equity is provided in the following reconciliations. Adjusted Return on Capital (ROC) and Adjusted ROC Spread Not Applicable. However, non-GAAP elements of the calculation Adjusted Return on Capital Reconciliation have been reconciled to the corresponding GAAP measures. A numerical reconciliation of net earnings to adjusted net earnings and average total debt and average shareholders' equity to adjusted average total capital is provided. Comparable Earnings (Loss) Before Interest, Taxes, Depreciation Earnings (Loss) from Continuing Operations Comparable EBITDA Reconciliation and Amortization - (EBITDA) FMS Comparable EBITDA, SCS Comparable EBITDA, and DTS FMS Net Segment Earnings, SCS Net Segment Earnings, and DTS Comparable Segment EBITDA Comparable EBITDA ** Net Segment Earnings Cash Flow Measures: Total Cash Generated and Free Cash Flow Cash Provided by Operating Activities Cash Flow Reconciliation **We believe comparable segment EBITDA provides investors with useful information, as it is a standard measure commonly reported and widely used by analysts, investors and other interested parties to measure financial performance by segment. © 2020 Ryder System, Inc. 37 All Rights Reserved
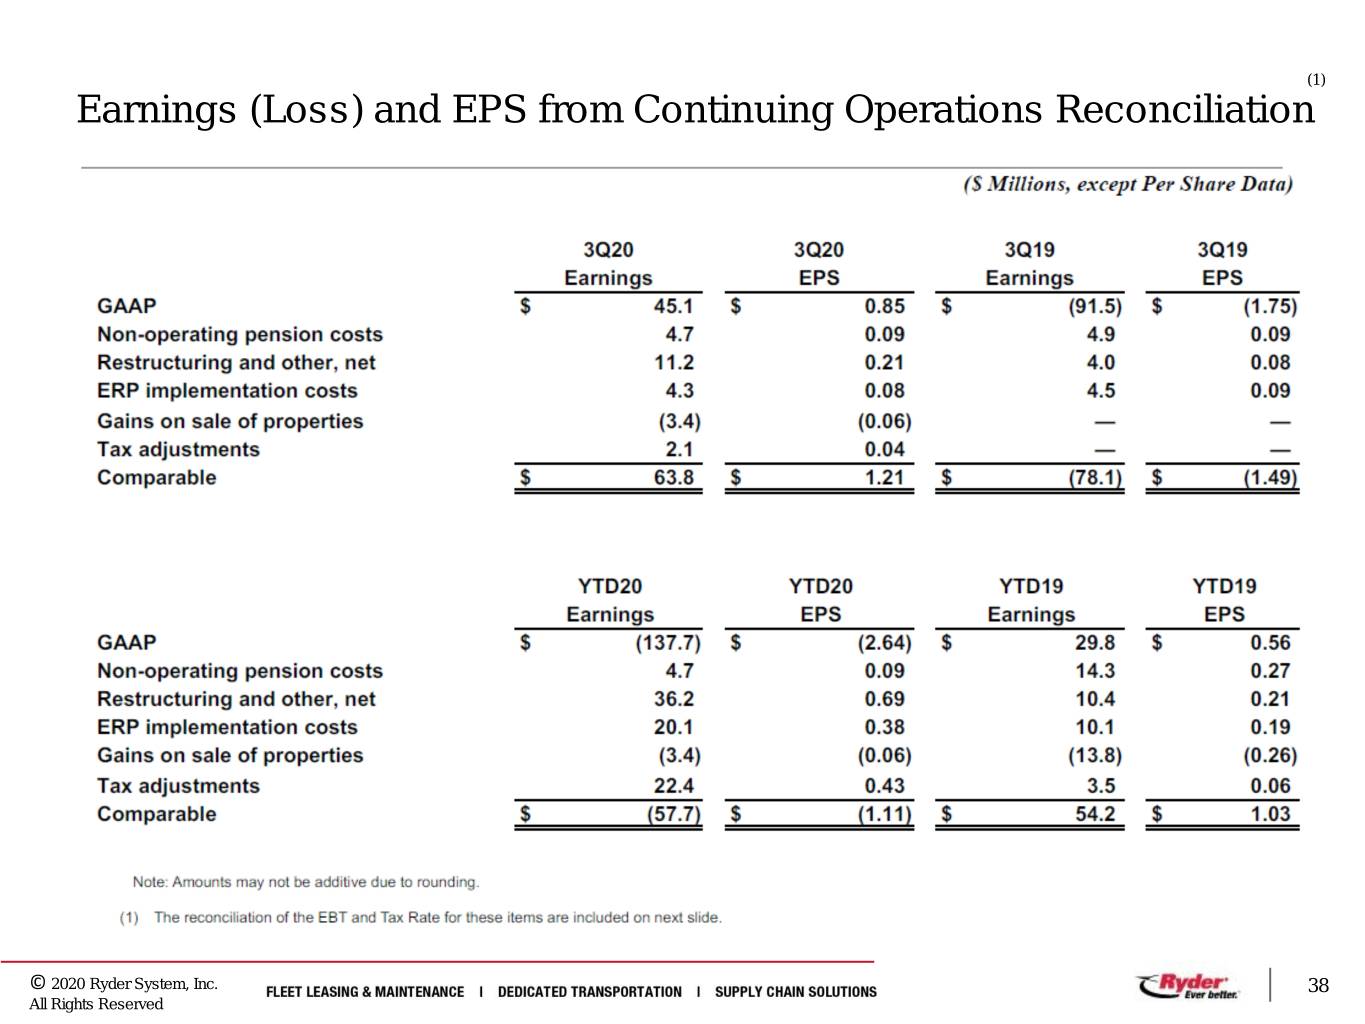
(1) Earnings (Loss) and EPS from Continuing Operations Reconciliation Note: Amounts may not be additive due to rounding. 1. The reconciliation of the EBT and Tax Rate for these items are included on next slide. © 2020 Ryder System, Inc. 38 All Rights Reserved
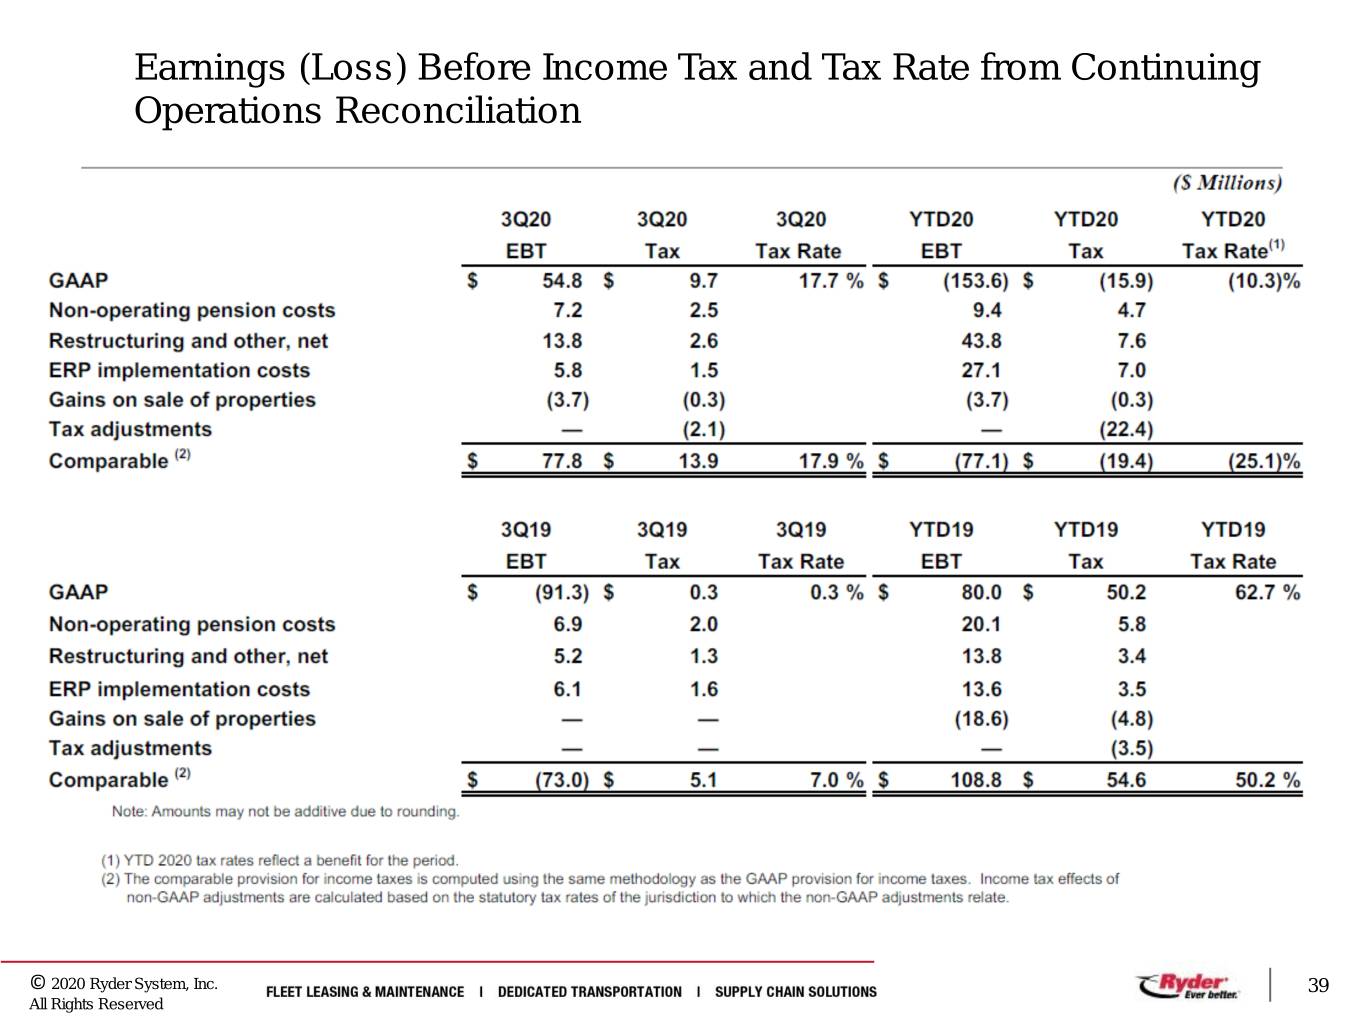
Earnings (Loss) Before Income Tax and Tax Rate from Continuing Operations Reconciliation (1) YTD 2020 tax rates reflect a benefit for the period. (2) The comparable provision for income taxes is computed using the same methodology as the GAAP provision for income taxes. Income tax effects of non-GAAP adjustments are calculated based on the statutory tax rates of the jurisdiction to which the non-GAAP adjustments relate. © 2020 Ryder System, Inc. 39 All Rights Reserved
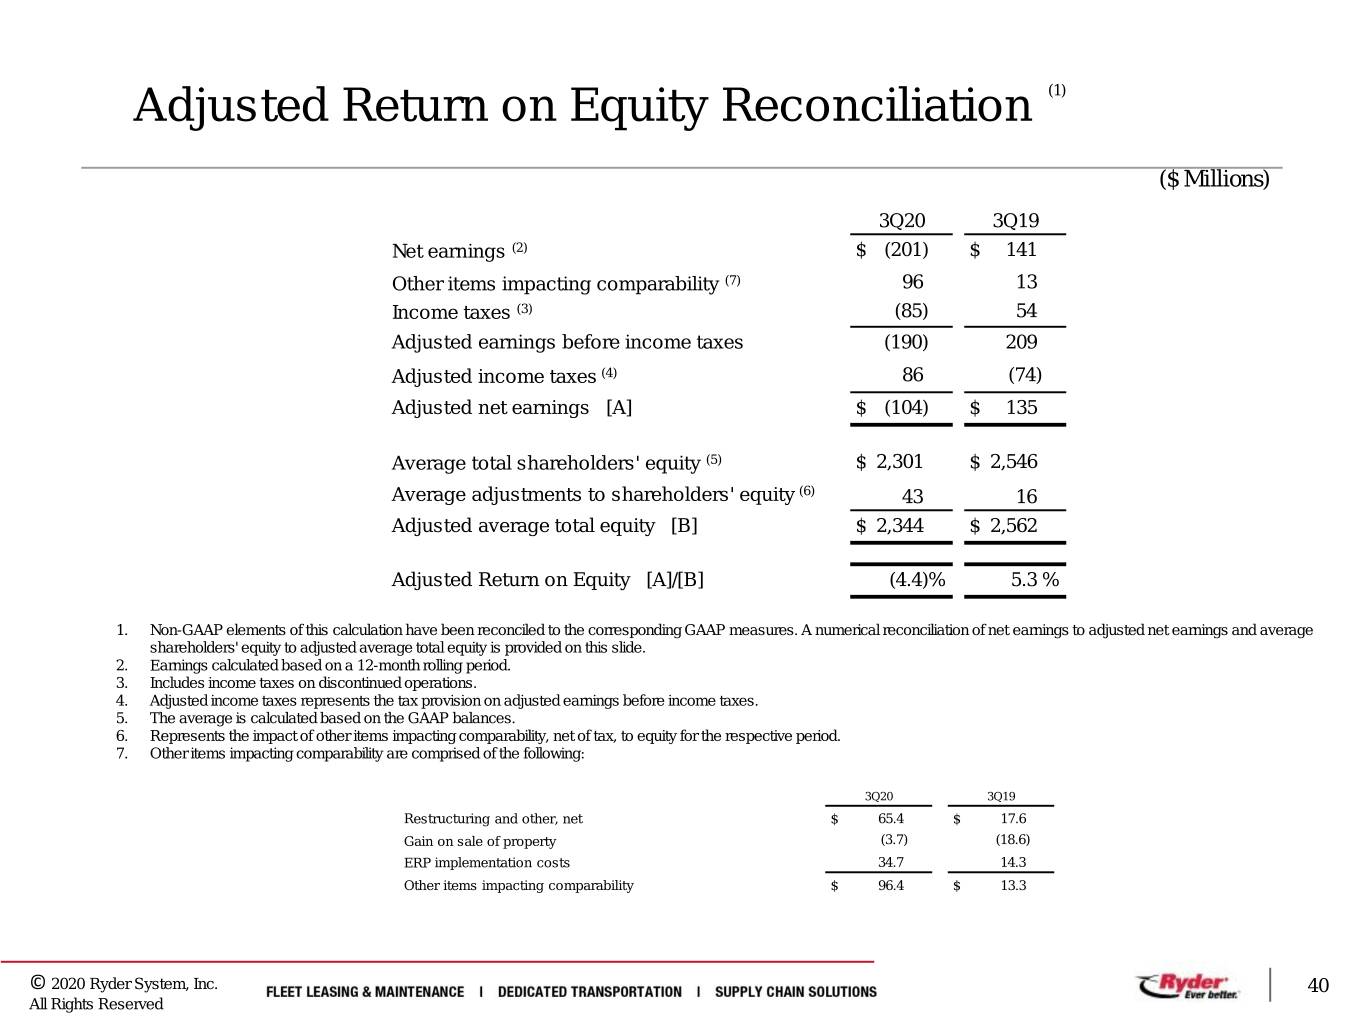
Adjusted Return on Equity Reconciliation (1) ($ Millions) 3Q20 3Q19 Net earnings (2) $ (201) $ 141 Other items impacting comparability (7) 96 13 Income taxes (3) (85) 54 Adjusted earnings before income taxes (190) 209 Adjusted income taxes (4) 86 (74) Adjusted net earnings [A] $ (104) $ 135 Average total shareholders' equity (5) $ 2,301 $ 2,546 Average adjustments to shareholders' equity (6) 43 16 Adjusted average total equity [B] $ 2,344 $ 2,562 Adjusted Return on Equity [A]/[B] (4.4)% 5.3 % 1. Non-GAAP elements of this calculation have been reconciled to the corresponding GAAP measures. A numerical reconciliation of net earnings to adjusted net earnings and average shareholders' equity to adjusted average total equity is provided on this slide. 2. Earnings calculated based on a 12-month rolling period. 3. Includes income taxes on discontinued operations. 4. Adjusted income taxes represents the tax provision on adjusted earnings before income taxes. 5. The average is calculated based on the GAAP balances. 6. Represents the impact of other items impacting comparability, net of tax, to equity for the respective period. 7. Other items impacting comparability are comprised of the following: 3Q20 3Q19 Restructuring and other, net $ 65.4 $ 17.6 Gain on sale of property (3.7) (18.6) ERP implementation costs 34.7 14.3 Other items impacting comparability $ 96.4 $ 13.3 © 2020 Ryder System, Inc. 40 All Rights Reserved
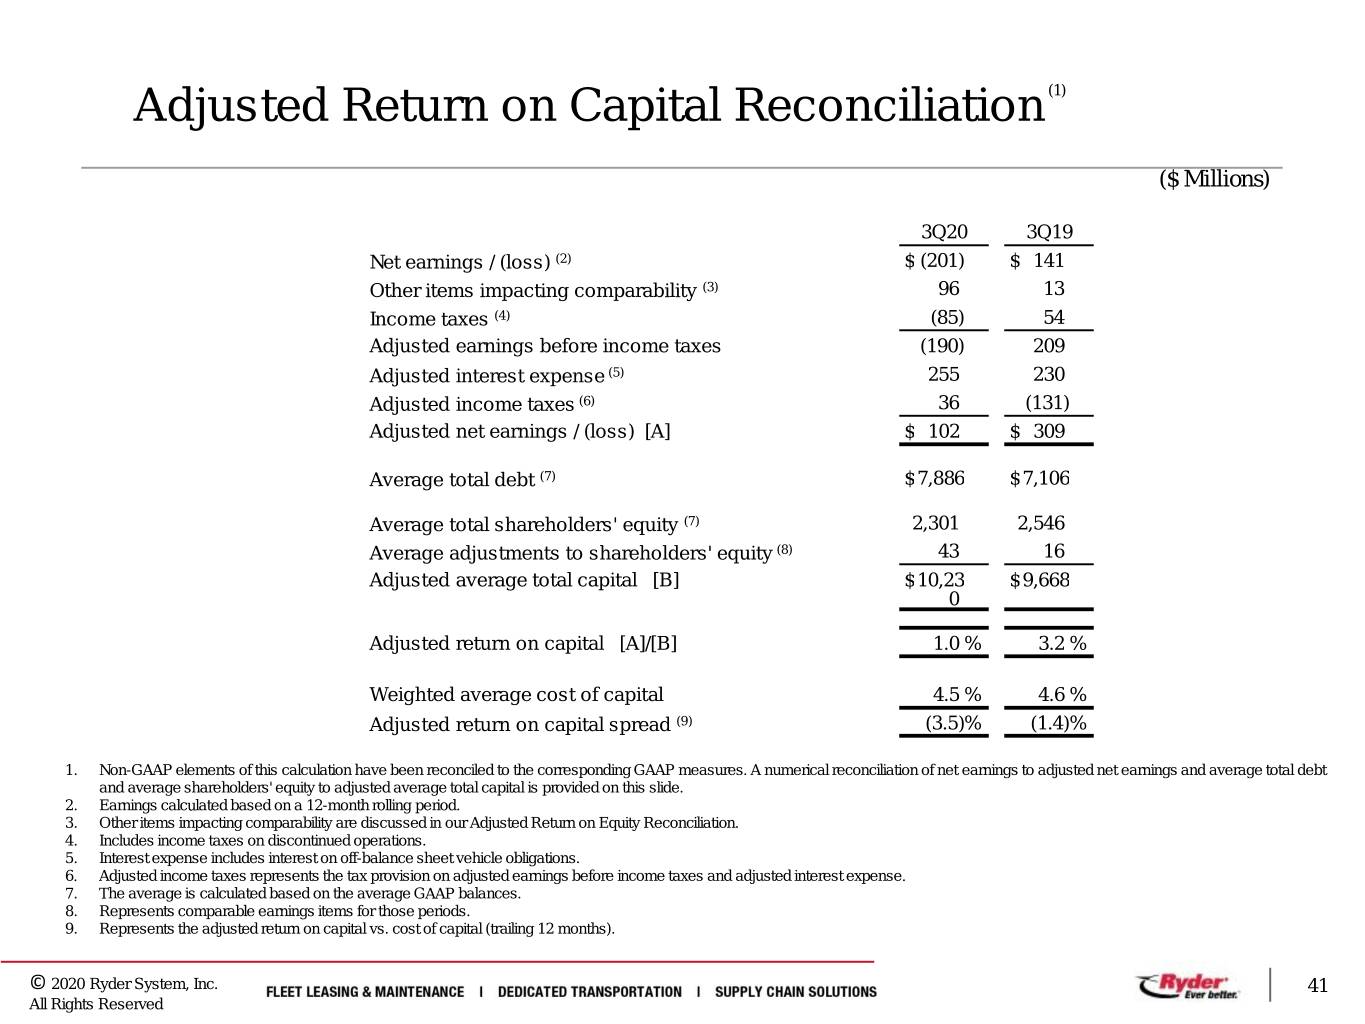
Adjusted Return on Capital Reconciliation (1) ($ Millions) 3Q20 3Q19 Net earnings / (loss) (2) $ (201) $ 141 Other items impacting comparability (3) 96 13 Income taxes (4) (85) 54 Adjusted earnings before income taxes (190) 209 Adjusted interest expense (5) 255 230 Adjusted income taxes (6) 36 (131) Adjusted net earnings / (loss) [A] $ 102 $ 309 Average total debt (7) $7,886 $7,106 Average total shareholders' equity (7) 2,301 2,546 Average adjustments to shareholders' equity (8) 43 16 Adjusted average total capital [B] $10,23 $9,668 0 Adjusted return on capital [A]/[B] 1.0 % 3.2 % Weighted average cost of capital 4.5 % 4.6 % Adjusted return on capital spread (9) (3.5)% (1.4)% 1. Non-GAAP elements of this calculation have been reconciled to the corresponding GAAP measures. A numerical reconciliation of net earnings to adjusted net earnings and average total debt and average shareholders' equity to adjusted average total capital is provided on this slide. 2. Earnings calculated based on a 12-month rolling period. 3. Other items impacting comparability are discussed in our Adjusted Return on Equity Reconciliation. 4. Includes income taxes on discontinued operations. 5. Interest expense includes interest on off-balance sheet vehicle obligations. 6. Adjusted income taxes represents the tax provision on adjusted earnings before income taxes and adjusted interest expense. 7. The average is calculated based on the average GAAP balances. 8. Represents comparable earnings items for those periods. 9. Represents the adjusted return on capital vs. cost of capital (trailing 12 months). © 2020 Ryder System, Inc. 41 All Rights Reserved
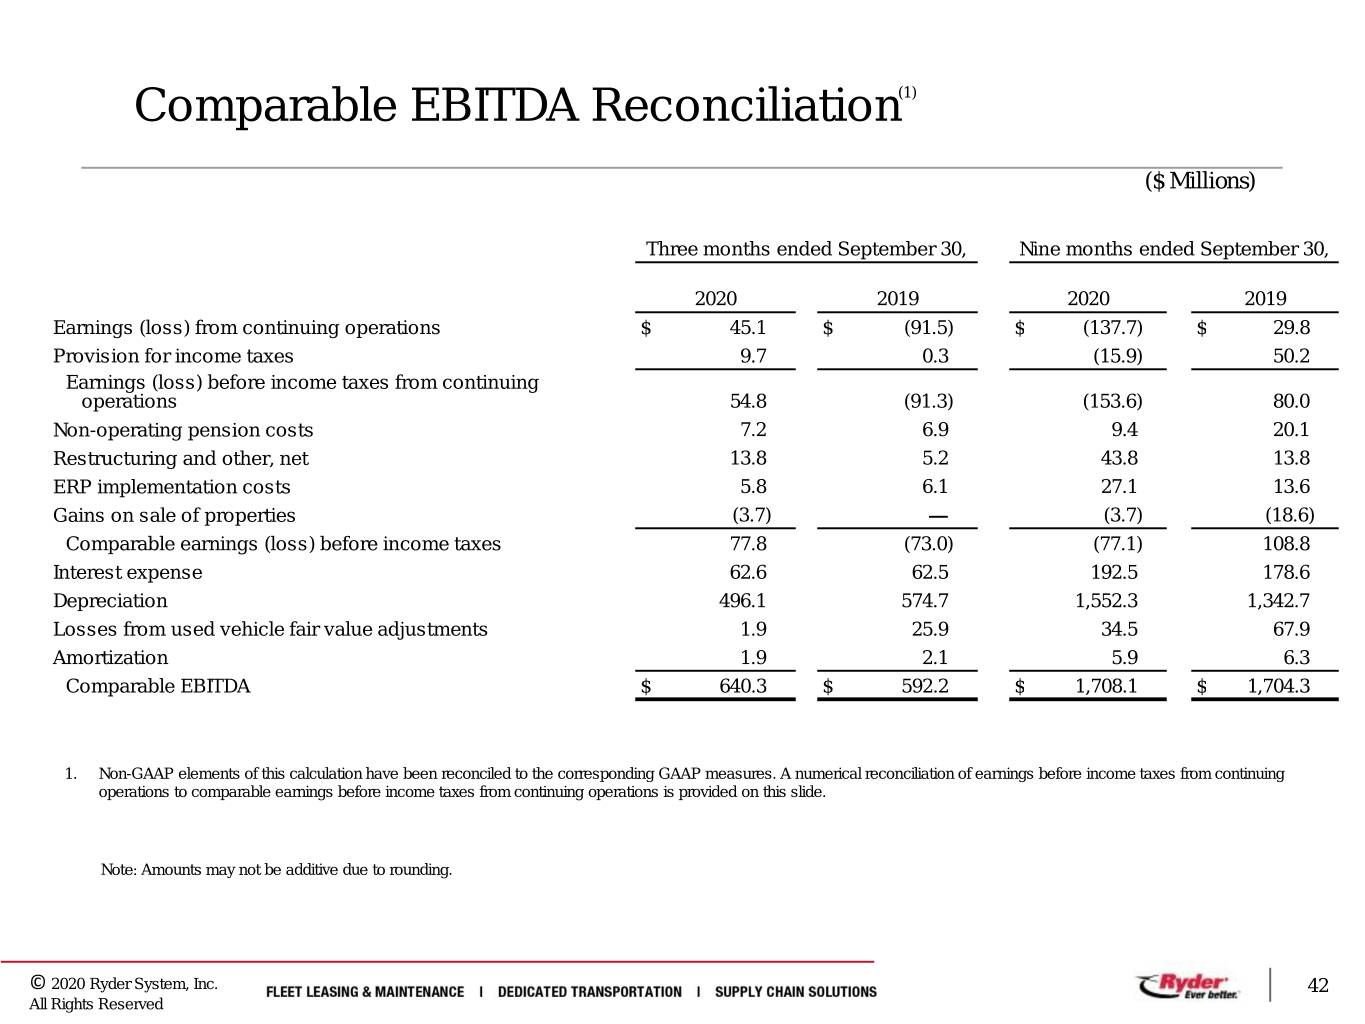
Comparable EBITDA Reconciliation(1) ($ Millions) Three months ended September 30, Nine months ended September 30, 2020 2019 2020 2019 Earnings (loss) from continuing operations $ 45.1 $ (91.5) $ (137.7) $ 29.8 Provision for income taxes 9.7 0.3 (15.9) 50.2 Earnings (loss) before income taxes from continuing operations 54.8 (91.3) (153.6) 80.0 Non-operating pension costs 7.2 6.9 9.4 20.1 Restructuring and other, net 13.8 5.2 43.8 13.8 ERP implementation costs 5.8 6.1 27.1 13.6 Gains on sale of properties (3.7) — (3.7) (18.6) Comparable earnings (loss) before income taxes 77.8 (73.0) (77.1) 108.8 Interest expense 62.6 62.5 192.5 178.6 Depreciation 496.1 574.7 1,552.3 1,342.7 Losses from used vehicle fair value adjustments 1.9 25.9 34.5 67.9 Amortization 1.9 2.1 5.9 6.3 Comparable EBITDA $ 640.3 $ 592.2 $ 1,708.1 $ 1,704.3 1. Non-GAAP elements of this calculation have been reconciled to the corresponding GAAP measures. A numerical reconciliation of earnings before income taxes from continuing operations to comparable earnings before income taxes from continuing operations is provided on this slide. Note: Amounts may not be additive due to rounding. © 2020 Ryder System, Inc. 42 All Rights Reserved
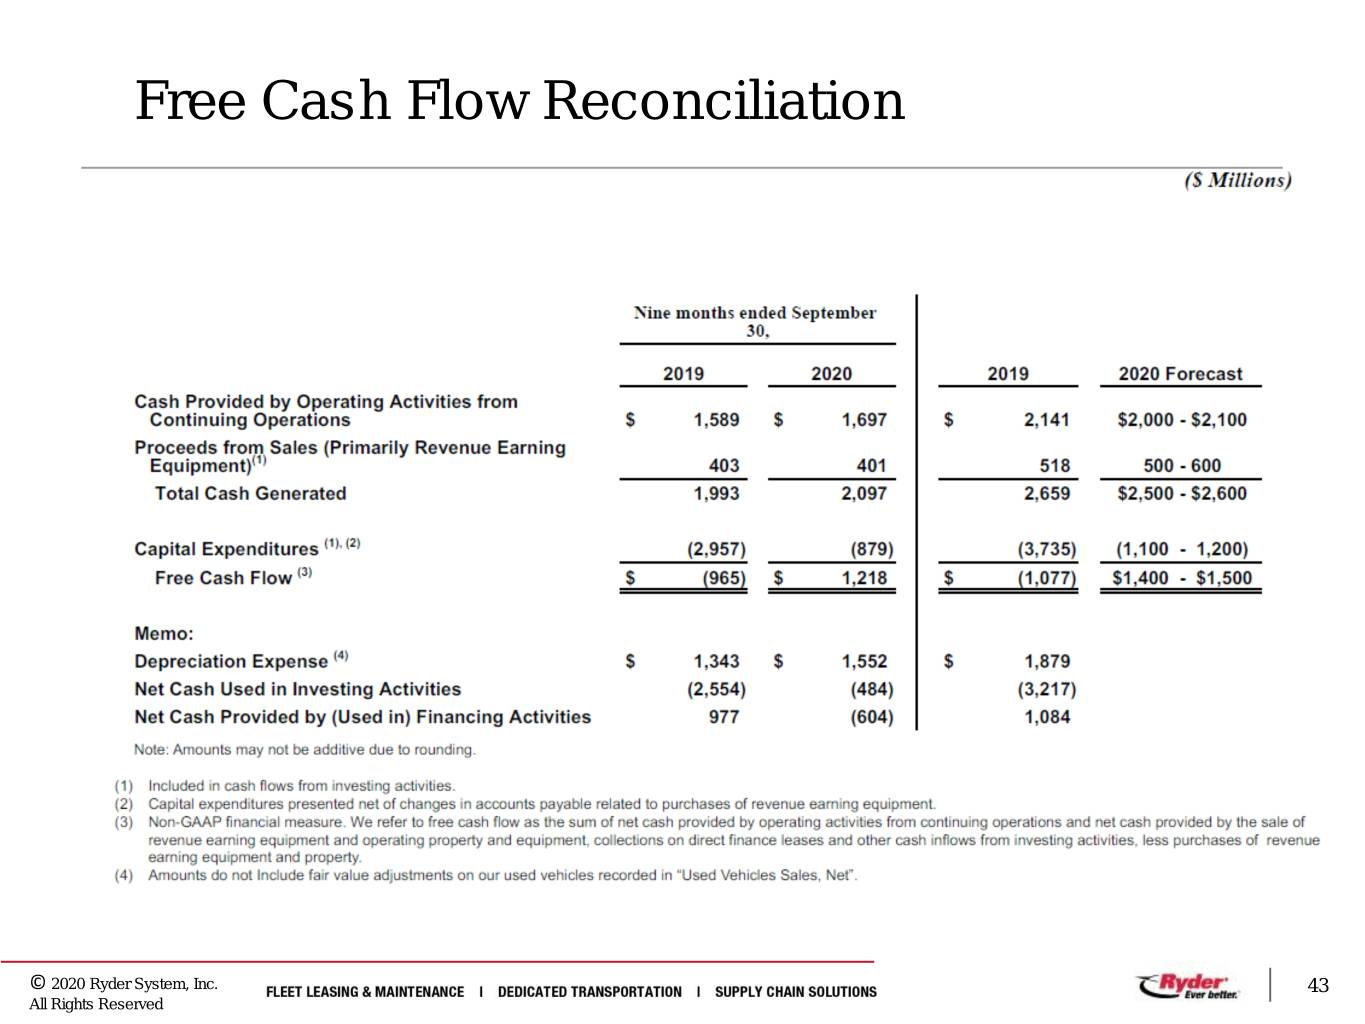
Free Cash Flow Reconciliation © 2020 Ryder System, Inc. 43 All Rights Reserved

© 2020 Ryder System, Inc. 44 All Rights Reserved