
VICI 8-K
Vici Properties Inc. (VICI)
8-K
2020-10-28
For: 2020-10-28
View Original
Added on
April 07, 2026
UNITED STATES
SECURITIES AND EXCHANGE COMMISSION
WASHINGTON, D.C. 20549
__________________________________________________
FORM 8-K
__________________________________________________
CURRENT REPORT PURSUANT TO
SECTION 13 OR 15(d) OF THE
SECURITIES EXCHANGE ACT OF 1934
Date of report (Date of earliest event reported): October 28, 2020
__________________________________________________
(Exact Name of Registrant as Specified in its Charter)
__________________________________________________
| (State or Other Jurisdiction of Incorporation) | (Commission File Number) | (IRS Employer Identification No.) | ||||||||||||
(Address of Principal Executive Offices) (Zip Code)
Registrant’s telephone number, including area code: (646 ) 949-4631
Not Applicable
(Former Name or Former Address, if Changed Since Last Report)
__________________________________________________
Check the appropriate box below if the Form 8-K filing is intended to simultaneously satisfy the filing obligation of the registrant under any of the following provisions:
| Written communications pursuant to Rule 425 under the Securities Act (17 CFR 230.425) | ||||||||
| Soliciting material pursuant to Rule 14a-12 under the Exchange Act (17 CFR 240.14a-12) | ||||||||
| Pre-commencement communications pursuant to Rule 14d-2(b) under the Exchange Act (17 CFR 240.14d-2(b)) | ||||||||
| Pre-commencement communications pursuant to Rule 13e-4(c) under the Exchange Act (17 CFR 240.13e-4(c)) | ||||||||
Securities registered pursuant to Section 12(b) of the Act:
| Title of each class | Trading Symbol | Name of each exchange on which registered | ||||||||||||
Indicate by check mark whether the registrant is an emerging growth company as defined in Rule 405 of the Securities Act of 1933 (§230.405 of this chapter) or Rule 12b-2 of the Securities Exchange Act of 1934 (§240.12b-2 of this chapter).
| Emerging growth company | |||||
If an emerging growth company, indicate by check mark if the registrant has elected not to use the extended transition period for complying with any new or revised financial accounting standards provided pursuant to Section 13(a) of the Exchange Act. ☐
| Item 2.02. | Results of Operations and Financial Condition. | ||||
On October 28, 2020, VICI Properties Inc. (the “Company”) issued a press release announcing its financial results for the three and nine months ended September 30, 2020, and made available supplemental financial and operating information concerning the Company as of September 30, 2020. A copy of the press release and a copy of this supplemental information are furnished herewith as Exhibit 99.1 and Exhibit 99.2, respectively, to this Current Report on Form 8-K and are incorporated herein by reference.
| Item 7.01. | Regulation FD Disclosure. | ||||
The disclosure contained in Item 2.02 is incorporated herein by reference.
The information included in Item 2.02 and Item 7.01 of this Current Report on Form 8-K, including Exhibit 99.1 and Exhibit 99.2, is being furnished and shall not be deemed “filed” for purposes of Section 18 of the Securities Exchange Act of 1934, as amended (the “Exchange Act”), or otherwise subject to the liabilities of that Section, nor shall it be deemed incorporated by reference into any of the Company’s filings under the Securities Act of 1933, as amended, or the Exchange Act, whether made before or after the date hereof and regardless of any general incorporation language in such filings, except to the extent expressly set forth by specific reference in such a filing. The furnishing of the information included in Item 7.01 of this Current Report on Form 8-K shall not be deemed an admission as to the materiality of any information herein that is required to be disclosed solely by reason of Regulation FD.
| Item 9.01. | Financial Statements and Exhibits. | ||||
(d) Exhibits
| Exhibit No. | Description | |||||||
| 104 | Cover Page Interactive Data File (embedded within the Inline XBRL document) | |||||||
SIGNATURES
Pursuant to the requirements of the Securities Exchange Act of 1934, the registrant has duly caused this report to be signed on its behalf by the undersigned hereunto duly authorized.
VICI PROPERTIES INC. | ||||||||
| Date: October 28, 2020 | By: | /s/ DAVID A. KIESKE | ||||||
| David A. Kieske | ||||||||
| Chief Financial Officer | ||||||||
Exhibit 99.1
VICI PROPERTIES INC. ANNOUNCES THIRD QUARTER 2020 RESULTS
NEW YORK, NY – October 28, 2020 – VICI Properties Inc. (NYSE: VICI) (“VICI Properties” or the “Company”), an experiential real estate investment trust, today reported results for the quarter ended September 30, 2020. All per share amounts included herein are on a per diluted share basis unless otherwise stated.
Third Quarter 2020 Financial and Operating Highlights
•Total revenues increased 52.6% year-over-year to $339.7 million
•Net income attributable to common stockholders was $398.3 million, or $0.74 per share
•FFO was $398.3 million, or $0.74 per share
•AFFO increased 38.4% year-over-year to $227.9 million
•AFFO per share increased 22.9% to $0.43
•Completed $3.7 billion of acquisitions and investments, including closure of our $3.2 billion transaction with Caesars, $400 million mortgage on Caesars Forum Convention Center, and VICI’s first investment outside of gaming through an $80 million mortgage loan to Chelsea Piers New York
•Declared a quarterly cash dividend of $0.33 per share, a 10.9% year-over-year increase
•Settled 3,000,000 shares of the Company's outstanding June 2020 forward sale agreement for net proceeds of approximately $63.0 million
CEO Comments
Edward Pitoniak, Chief Executive Officer of VICI Properties, said: “In the third quarter VICI’s investors — both equity and credit — were rewarded with the growth that they have endorsed and funded through our extensive acquisition and financing activities over the last 6 quarters. In Q3 2020 we grew AFFO 38.4% compared to prior year, while also rewarding shareholders with an 11% increase in our quarterly dividend.
“Additionally, we completed our first formal venture into asset classes beyond Gaming through our financing of an incomparable experiential asset, New York’s Chelsea Piers. Over the last 25 years the Chelsea Piers Team — led by Roland Betts, Tom Bernstein and David Tewksbury — has made Chelsea Piers the leading New York gathering space for recreation, entertainment and film production. We also entered into an agreement with Chelsea Piers that could lead to a longer-term financing partnership in the future. We’re honored to be in business with the Chelsea Piers team.”
Third Quarter 2020 Financial Results
Total Revenues
Total revenues were $339.7 million for the quarter, an increase of 52.6% compared to $222.5 million for the quarter ended September 30, 2019. Total revenues for the quarter included $26.2 million of non-cash items, comprised of $18.9 million of non-cash leasing and financing adjustments and $7.3 million of other income.
Net Income Attributable to Common Stockholders
Net income attributable to common stockholders was $398.3 million for the quarter, or $0.74 per share, compared to $144.4 million, or $0.31 per share for the quarter ended September 30, 2019.
Funds from Operations (“FFO”)
FFO attributable to common stockholders was $398.3 million for the quarter, or $0.74 per share, compared to $144.4 million, or $0.31 per share, for the quarter ended September 30, 2019.
Adjusted Funds from Operations (“AFFO”)
AFFO attributable to common stockholders was $227.9 million for the quarter, an increase of 38.4% compared to $164.6 million for the quarter ended September 30, 2019. AFFO was $0.43 per share for the quarter compared to $0.35 per share for the quarter ended September 30, 2019.
Third Quarter 2020 Acquisitions and Portfolio Activity
Acquisitions and Investments
On July 20, 2020, the Company announced the completion of the transactions contemplated in the Master Transaction Agreement with Caesars Entertainment, Inc. (“Caesars”, formerly known as Eldorado Resorts, Inc., or “Eldorado”) in connection with Eldorado’s acquisition of Caesars Entertainment Corporation originally announced on June 24, 2019. Per the terms of the Master Transaction Agreement, VICI Properties acquired the land and real estate assets associated with Harrah’s New Orleans, Harrah’s Laughlin, and Harrah’s Atlantic City and modified certain provisions of the Caesars lease agreements for total consideration of approximately $3.2 billion in cash. Combined rent under the Las Vegas Master Lease and Regional Master Lease between VICI Properties and Caesars increased $252.5 million per annum.
On August 31, 2020, the Company entered into an $80 million mortgage loan agreement with Chelsea Piers New York (“Chelsea Piers”) secured by the Chelsea Piers complex in New York City, pursuant to which the Company provided an initial $65 million term loan and a $15 million delayed draw term loan (which remains undrawn), subject to certain conditions. The loan bears interest at a rate of 7.0% per annum and has a term of 7 years.
On September 18, 2020, the Company entered into the previously disclosed $400 million mortgage loan agreement with Caesars secured by the Caesars Forum Convention Center in Las Vegas. The loan bears interest at a rate of 7.7% per annum, with annual interest payments subject to 2% escalation (resulting in a year two interest rate of 7.854%), and has a term of five years. The Caesars Forum Convention Center is subject to an amended Put/Call Agreement between Caesars and VICI, with VICI’s call option being accelerated to the maturity of the loan in 2025.
Dispositions
On September 3, 2020, the Company and Caesars entered into definitive agreements to sell Harrah’s Louisiana Downs Casino to a third party for $22.0 million. The Company is entitled to receive $5.5 million of such proceeds from the sale. Annual base rent payments under the Regional Master Lease Agreement will remain unchanged following completion of the disposition, which we anticipate will close in early 2021 and remains subject to regulatory approval and customary closing conditions.
On September 30, 2020, the Company and Caesars closed on the previously announced transaction to sell Harrah’s Reno to a third party. The purchase price for Harrah’s Reno was $41.5 million and the Company received approximately $31.1 million of the proceeds of the sale. Annual base rent payments under the Regional Master Lease Agreement remained unchanged following completion of the disposition.
2
Other Portfolio Activity
As previously disclosed, on July 16, 2020, the Company and JACK Ohio LLC (“JACK Entertainment”) entered into an amendment to the existing master triple-net lease agreement (the “JACK Lease Agreement Amendment”), pursuant to which, among other things, VICI agreed to fund $18.0 million for the construction of a new gaming patio amenity at JACK Thistledown Racino. In connection with the construction of the gaming patio, commencing on April 1, 2022, annual rent under the master lease will increase by an incremental $1.8 million. The JACK Lease Agreement Amendment also provides for relief with respect to certain existing covenants through March 31, 2022, adds an additional five years to the initial lease term, with JACK Entertainment having three five-year renewal options (instead of four) as a result of such extension of the initial lease term, and provides for annual rent escalation to begin in 2022 rather than 2021. The JACK Lease Agreement Amendment does not provide for a reduction or deferral of the tenant’s rent obligations.
Simultaneously with entry into the JACK Lease Agreement Amendment, the Company and affiliates of Rock Ohio Ventures LLC entered into an amendment and restatement of the existing $50.0 million term loan agreement pursuant to which, among other things, the Company increased the existing term loan to $70.0 million, bearing interest at a rate of 9.0% per annum, and added a $25.0 million revolving credit facility (which remains undrawn), bearing interest at a rate of LIBOR plus 2.75%. In connection with the amendment and restatement VICI received additional collateral so that the term loan and revolving credit facility are now secured by a first priority lien on substantially all gaming and non-gaming real and personal property of JACK Entertainment.
Third Quarter 2020 Capital Markets Activity
On September 16, 2020, we amended the forward sale agreement entered into in June 2020 relating to 29,900,000 shares of our common stock (the “June 2020 Forward Sale Agreement”) to extend the maturity date from September 17, 2020 to June 17, 2021.
On September 28, 2020, we partially settled the June 2020 Forward Sale Agreement by delivering 3,000,000 shares of our common stock to the forward purchaser, in exchange for total net proceeds of approximately $63.0 million. The remaining 26,900,000 shares remain subject to settlement pursuant to the terms of the June 2020 Forward Sale Agreement.
Balance Sheet and Liquidity
As of September 30, 2020, the Company had $6.9 billion in total debt. VICI Properties had approximately $1.7 billion in liquidity, comprised of $144.1 million in cash and cash equivalents, $20.0 million in short-term investments, $1.0 billion of availability under the Revolving Credit Facility (subject to continued compliance with the financial covenants of the facility) and approximately $557.0 million in proceeds available through the physical settlement of the remaining 26,900,000 shares that are subject to the June 2020 Forward Sale Agreement.
3
The Company’s outstanding indebtedness as of September 30, 2020 was as follows:
($ in millions) | September 30, 2020 | ||||
Revolving Credit Facility | $ | — | |||
Term Loan B Facility (2024 Maturity) | 2,100.0 | ||||
2025 Notes | 750.0 | ||||
2026 Notes | 1,250.0 | ||||
2027 Notes | 750.0 | ||||
2029 Notes | 1,000.0 | ||||
2030 Notes | 1,000.0 | ||||
Total Debt Outstanding, Face Value | $ | 6,850.0 | |||
Cash and Cash Equivalents | $ | 144.1 | |||
| Short-Term Investments | $ | 20.0 | |||
Net Debt | $ | 6,685.9 | |||
Dividends
On September 10, 2020, we declared a regular quarterly cash dividend of $0.33 per share, a 10.9% increase compared to our prior dividend. The Q3 2020 dividend was paid on October 8, 2020 to stockholders of record as of the close of business on September 30, 2020 and it totaled in aggregate approximately $177.0 million.
Impact of the COVID-19 Pandemic on Our Business
In connection with the COVID-19 pandemic, various state governments and/or regulatory authorities issued directives, mandates, orders or similar actions restricting non-essential business operations, resulting in the temporary closure of substantially all of our tenants’ operations at our properties (as well as our golf course properties). While all of our tenants’ facilities at our properties (and all four of our golf course properties) have reopened, they have reopened at reduced capacity and subject to additional operating restrictions, and we cannot predict how long they will be subject to such restrictions, or whether they will be subject to additional restrictions or future closures. As previously announced, in connection with the ongoing COVID-19 pandemic and its impact on our tenants’ operations and financial performance, we have provided certain short-term non-rent related relief under our lease agreements to some of our tenants. We continue to monitor the impact of the COVID-19 pandemic on our tenant's businesses, including with respect to their respective financial and operating situations, liquidity needs and contingency planning.
Supplemental Information
In addition to this release, the Company has furnished Supplemental Financial Information, which is available on our website in the “Investors” section, under the menu heading “Financials”. This additional information is being provided as a supplement to the information in this release and our other filings with the SEC. The Company has no obligation to update any of the information provided to conform to actual results or changes in the Company’s portfolio, capital structure or future expectations.
4
Conference Call and Webcast
The Company will host a conference call and audio webcast on Thursday, October 29, 2020 at 10:00 a.m. Eastern Time (ET). The conference call can be accessed by registering online at www.directeventreg.com/registration/event/6582856 at which time registrants will receive dial-in information as well as a passcode and registrant ID. At the time of the call, participants will dial in using the numbers in the confirmation email and enter their passcode and ID, upon which they will enter the conference call.
A live audio webcast of the conference call will be available through the “Investors” section of the Company’s website, www.viciproperties.com, on October 29, 2020, beginning at 10:00 a.m. ET. A replay of the webcast will be available shortly after the call on the Company’s website and will continue for one year.
About VICI Properties
VICI Properties is an experiential real estate investment trust that owns one of the largest portfolios of market-leading gaming, hospitality and entertainment destinations, including the world-renowned Caesars Palace. VICI Properties’ national, geographically diverse portfolio consists of 29 gaming facilities comprising over 48 million square feet and features approximately 19,200 hotel rooms and more than 200 restaurants, bars and nightclubs. Its properties are leased to industry leading gaming and hospitality operators, including Caesars Entertainment, Inc., Century Casinos Inc., Hard Rock International, JACK Entertainment and Penn National Gaming, Inc. VICI Properties also owns four championship golf courses and 34 acres of undeveloped land adjacent to the Las Vegas Strip. VICI Properties’ strategy is to create the nation’s highest quality and most productive experiential real estate portfolio. For additional information, please visit www.viciproperties.com.
Forward-Looking Statements
This press release contains forward-looking statements within the meaning of the federal securities laws. You can identify these statements by our use of the words “anticipates,” “assumes,” “believes,” “estimates,” “expects,” “guidance,” “intends,” “plans,” “projects,” and similar expressions that do not relate to historical matters. All statements other than statements of historical fact are forward-looking statements. You should exercise caution in interpreting and relying on forward-looking statements because they involve known and unknown risks, uncertainties, and other factors which are, in some cases, beyond the Company’s control and could materially affect actual results, performance, or achievements. Among those risks, uncertainties and other factors are the impact of changes in general economic conditions, including low consumer confidence, unemployment levels and depressed real estate prices resulting from the severity and duration of any downturn in the U.S. or global economy (including stemming from the COVID-19 pandemic and changes in the economic conditions as a result of the COVID-19 pandemic); the Company’s dependence on subsidiaries of Caesars Entertainment, Inc. (“Caesars”), Penn National Gaming, Inc. (“Penn”), Seminole Hard Rock Entertainment, Inc. (“Hard Rock”), Century Casinos, Inc. (“Century Casinos”) and Rock Ohio Ventures LLC (“JACK Entertainment”) as tenants of our properties and Caesars, Penn, Hard Rock, Century Casinos and JACK Entertainment or certain of their respective subsidiaries as guarantors of the lease payments and the negative consequences any material adverse effect on their respective businesses could have on the Company; risks that the Company may not achieve the benefits contemplated by its recently completed transactions and acquisitions of real estate assets; the possibility that the Company identifies significant environmental, tax, legal or other issues that materially and adversely impact the value of assets acquired or secured as collateral (or other benefits it expects to receive) in any of its recently completed transactions; and the effects of the Company’s recently
5
completed transactions on it, including the future impact on the Company’s financial condition, financial and operating results, cash flows, strategy and plans.
Currently, one of the most significant factors that could cause actual outcomes to differ materially from our forward-looking statements is the impact of the COVID-19 pandemic on the financial condition, results of operations, cash flows and performance of the Company and its tenants. The extent to which the COVID-19 pandemic impacts the Company and its tenants will largely depend on future developments that are highly uncertain and cannot be predicted with confidence, including the impact of the actions taken to contain the pandemic or mitigate its impact, and the direct and indirect economic effects of the pandemic and containment measures on our tenants, including various state governments and/or regulatory authorities issuing directives, mandates, orders or similar actions restricting freedom of movement and business operations, such as travel restrictions, border closures, business closures, limitations on public gatherings, quarantines and “shelter-at-home” orders that resulted in the temporary closure of our tenants’ operations at our properties, the ability of the Company’s tenants to successfully operate their businesses following the reopening of their respective facilities, including the costs of complying with regulatory requirements necessary to keep the facilities open, including compliance with operating restrictions and reduced capacity requirements, the need to close any of the facilities after reopening as a result of the COVID-19 pandemic and the effects of the negotiated capital expenditure reductions and other amendments to the lease agreements that the Company agreed to with certain of its tenants in response to the COVID-19 pandemic. Each of the foregoing could have a material adverse effect on our tenants’ ability to satisfy their obligations under their leases with us, including their continued ability to pay rent in a timely manner, or at all, and/or to fund capital expenditures or make other payments required under their leases. In addition, changes and instability in global, national and regional economic activity and financial markets as a result of the COVID-19 pandemic have negatively impacted consumer discretionary spending and travel and may continue to do so, which could have a material adverse effect on our tenants’ businesses.
Although the Company believes that in making such forward-looking statements its expectations are based upon reasonable assumptions, such statements may be influenced by factors that could cause actual outcomes and results to be materially different from those projected. The Company cannot assure you that the assumptions upon which these statements are based will prove to have been correct. Additional important factors that may affect the Company’s business, results of operations and financial position are described from time to time in the Company’s Annual Report on Form 10-K for the year ended December 31, 2019, Quarterly Reports on Form 10-Q and the Company’s other filings with the Securities and Exchange Commission. The Company does not undertake any obligation to update or revise any forward-looking statement, whether as a result of new information, future events, or otherwise, except as may be required by applicable law.
Non-GAAP Financial Measures
This press release presents Funds From Operations (“FFO”), FFO per share, Adjusted Funds From Operations (“AFFO”), AFFO per share and Adjusted EBITDA, which are not required by, or presented in accordance with, generally accepted accounting principles in the United States (“GAAP”). These are non-GAAP financial measures and should not be construed as alternatives to net income or as an indicator of operating performance (as determined in accordance with GAAP). We believe FFO, FFO per share, AFFO, AFFO per share and Adjusted EBITDA provide a meaningful perspective of the underlying operating performance of our business.
6
FFO is a non-GAAP financial measure that is considered a supplemental measure for the real estate industry and a supplement to GAAP measures. Consistent with the definition used by The National Association of Real Estate Investment Trusts (“NAREIT”), we define FFO as net income (or loss) attributable to common stockholders (computed in accordance with GAAP) excluding (i) gains (or losses) from sales of certain real estate assets, (ii) depreciation and amortization related to real estate, (iii) gains and losses from change in control and (iv) impairment write-downs of certain real estate assets and investments in entities when the impairment is directly attributable to decreases in the value of depreciable real estate held by the entity.
AFFO is a non-GAAP financial measure that we use as a supplemental operating measure to evaluate our performance. We calculate AFFO by adding or subtracting from FFO non-cash leasing and financing adjustments, non-cash change in allowance for credit losses, transaction costs incurred in connection with the acquisition of real estate investments, non-cash stock-based compensation expense, amortization of debt issuance costs and original issue discount, other non-cash interest expense, non-real estate depreciation (which is comprised of the depreciation related to our golf course operations), capital expenditures (which are comprised of additions to property, plant and equipment related to our golf course operations), impairment charges related to non-depreciable real estate, gains (or losses) on debt extinguishment, other non-recurring, non-cash gains or losses (such as non-cash gain upon lease modification) and non-cash adjustments attributable to non-controlling interest with respect to certain of the foregoing. The non-cash change in allowance for credit losses consists of estimated credit loss for our investments in leases - sales-type and direct financing, investments in leases - financing receivables and investments in loans as a result of our adoption of ASU No. 2016-13 - Financial Instruments-Credit Losses (Topic 326). No similar adjustments are reflected in prior periods because the accounting standard was adopted effective January 1, 2020 and does not require retrospective application. Please see Note 6 - Allowance for Credit Losses in our Quarterly Report on Form 10-Q for the quarter ended September 30, 2020 for further information.
We calculate Adjusted EBITDA by adding or subtracting from AFFO contractual interest expense and interest income (collectively, interest expense, net) and income tax expense.
These non-GAAP financial measures: (i) do not represent cash flow from operations as defined by GAAP; (ii) should not be considered as an alternative to net income as a measure of operating performance or to cash flows from operating, investing and financing activities; and (iii) are not alternatives to cash flow as a measure of liquidity. In addition, these measures should not be viewed as measures of liquidity, nor do they measure our ability to fund all of our cash needs, including our ability to make cash distributions to our stockholders, to fund capital improvements, or to make interest payments on our indebtedness. Investors are also cautioned that FFO, FFO per share, AFFO, AFFO per share and Adjusted EBITDA, as presented, may not be comparable to similarly titled measures reported by other real estate companies, including REITs, due to the fact that not all real estate companies use the same definitions. Our presentation of these measures does not replace the presentation of our financial results in accordance with GAAP.
Reconciliations of net income to FFO, FFO per share, AFFO, AFFO per share and Adjusted EBITDA are included in this release.
7
VICI Properties Inc.
Consolidated Balance Sheets
(In thousands)
| September 30, 2020 | December 31, 2019 | ||||||||||
| Assets | |||||||||||
| Real estate portfolio: | |||||||||||
| Investments in leases - sales-type and direct financing, net | $ | 13,009,966 | $ | 10,734,245 | |||||||
| Investments in leases - operating | — | 1,086,658 | |||||||||
| Investments in leases - financing receivables, net | 2,600,228 | — | |||||||||
| Investments in loans, net | 533,713 | — | |||||||||
| Land | 158,190 | 94,711 | |||||||||
| Cash and cash equivalents | 144,057 | 1,101,893 | |||||||||
| Short-term investments | 19,973 | 59,474 | |||||||||
| Other assets | 385,703 | 188,638 | |||||||||
| Total assets | $ | 16,851,830 | $ | 13,265,619 | |||||||
| Liabilities | |||||||||||
| Debt, net | $ | 6,761,832 | $ | 4,791,563 | |||||||
| Accrued interest | 47,106 | 20,153 | |||||||||
| Deferred financing liability | 73,600 | 73,600 | |||||||||
| Deferred revenue | 309 | 70,340 | |||||||||
| Dividends payable | 176,982 | 137,056 | |||||||||
| Other liabilities | 422,462 | 123,918 | |||||||||
| Total liabilities | 7,482,291 | 5,216,630 | |||||||||
| Stockholders’ equity | |||||||||||
| Common stock | 5,367 | 4,610 | |||||||||
| Preferred stock | — | — | |||||||||
| Additional paid in capital | 9,361,526 | 7,817,582 | |||||||||
| Accumulated other comprehensive loss | (104,258) | (65,078) | |||||||||
| Retained earnings | 29,338 | 208,069 | |||||||||
| Total VICI stockholders’ equity | 9,291,973 | 7,965,183 | |||||||||
| Non-controlling interests | 77,566 | 83,806 | |||||||||
| Total stockholders’ equity | 9,369,539 | 8,048,989 | |||||||||
| Total liabilities and stockholders’ equity | $ | 16,851,830 | $ | 13,265,619 | |||||||
_______________________________________________________
Note: As of September 30, 2020, our Investments in leases - sales-type and direct financing, Investments in leases - financing receivables and Investments in loans and Other assets (sales-type sub-leases)are net of $467.0 million, $93.0 million, $3.2 million and $7.2 million of Allowance for credit losses, respectively. The credit loss standard does not require retrospective application and as such there is no corresponding allowance as of December 31, 2019.
8
VICI Properties Inc.
Consolidated Statement of Operations
(In thousands, except share and per share data)
| Three Months Ended September 30, | Nine Months Ended September 30, | ||||||||||||||||||||||
| 2020 | 2019 | 2020 | 2019 | ||||||||||||||||||||
Revenues | |||||||||||||||||||||||
Income from sales-type and direct financing leases | $ | 270,274 | $ | 206,001 | $ | 718,421 | $ | 603,300 | |||||||||||||||
Income from operating leases | 3,638 | 10,913 | 25,464 | 32,740 | |||||||||||||||||||
Income from lease financing receivables and loans | 52,827 | — | 82,696 | — | |||||||||||||||||||
Other income | 7,276 | — | 8,702 | — | |||||||||||||||||||
Golf operations | 5,638 | 5,599 | 17,273 | 21,221 | |||||||||||||||||||
Revenues | 339,653 | 222,513 | 852,556 | 657,261 | |||||||||||||||||||
Operating expenses | |||||||||||||||||||||||
General and administrative | 8,047 | 6,717 | 22,560 | 19,460 | |||||||||||||||||||
Depreciation | 910 | 1,000 | 2,990 | 2,948 | |||||||||||||||||||
Other expenses | 7,263 | — | 8,702 | — | |||||||||||||||||||
Golf operations | 4,672 | 5,423 | 13,181 | 14,363 | |||||||||||||||||||
Change in allowance for credit losses | 177,052 | — | 261,080 | — | |||||||||||||||||||
Transaction and acquisition expenses | 2,026 | 993 | 7,703 | 4,749 | |||||||||||||||||||
Total operating expenses | 199,970 | 14,133 | 316,216 | 41,520 | |||||||||||||||||||
Operating income | 139,683 | 208,380 | 536,340 | 615,741 | |||||||||||||||||||
Interest expense | (77,399) | (68,531) | (231,185) | (176,936) | |||||||||||||||||||
Interest income | 214 | 6,690 | 6,743 | 15,861 | |||||||||||||||||||
Loss from extinguishment of debt | — | — | (39,059) | — | |||||||||||||||||||
| Gain upon lease modification | 333,352 | — | 333,352 | — | |||||||||||||||||||
Income before income taxes | 395,850 | 146,539 | 606,191 | 454,666 | |||||||||||||||||||
Income tax benefit (expense) | 368 | (24) | (395) | (1,098) | |||||||||||||||||||
Net income | 396,218 | 146,515 | 605,796 | 453,568 | |||||||||||||||||||
Less: Net loss (income) attributable to non-controlling interests | 2,056 | (2,080) | (2,132) | (6,235) | |||||||||||||||||||
Net income attributable to common stockholders | $ | 398,274 | $ | 144,435 | $ | 603,664 | $ | 447,333 | |||||||||||||||
Net income per common share | |||||||||||||||||||||||
Basic | $ | 0.75 | $ | 0.31 | $ | 1.22 | $ | 1.05 | |||||||||||||||
Diluted | $ | 0.74 | $ | 0.31 | $ | 1.21 | $ | 1.04 | |||||||||||||||
Weighted average number of common shares outstanding | |||||||||||||||||||||||
Basic | 533,407,916 | 460,666,295 | 496,002,850 | 426,437,889 | |||||||||||||||||||
Diluted | 536,180,175 | 465,771,668 | 499,982,269 | 428,366,146 | |||||||||||||||||||
9
VICI Properties Inc.
Reconciliation of Net Income to FFO, FFO per Share, AFFO, AFFO per Share and Adjusted EBITDA
(In thousands, except share and per share data)
| Three Months Ended September 30, | Nine Months Ended September 30, | ||||||||||||||||||||||
| 2020 | 2019 | 2020 | 2019 | ||||||||||||||||||||
| Net income attributable to common stockholders | $ | 398,274 | $ | 144,435 | $ | 603,664 | $ | 447,333 | |||||||||||||||
| Real estate depreciation | — | — | — | — | |||||||||||||||||||
| FFO | 398,274 | 144,435 | 603,664 | 447,333 | |||||||||||||||||||
| Non-cash leasing and financing adjustments | (18,919) | 2,494 | (11,826) | (2,295) | |||||||||||||||||||
| Non-cash change in allowance for credit losses | 177,052 | — | 261,080 | — | |||||||||||||||||||
| Transaction and acquisition expenses | 2,026 | 993 | 7,703 | 4,749 | |||||||||||||||||||
| Non-cash stock-based compensation | 2,013 | 1,404 | 5,375 | 3,821 | |||||||||||||||||||
| Amortization of debt issuance costs and original issue discount | 4,368 | 14,816 | 15,504 | 18,180 | |||||||||||||||||||
| Other depreciation | 879 | 997 | 2,905 | 2,940 | |||||||||||||||||||
| Capital expenditures | (337) | (588) | (1,982) | (1,991) | |||||||||||||||||||
| Loss on extinguishment of debt | — | — | 39,059 | — | |||||||||||||||||||
| Non-cash gain upon lease modification | (333,352) | — | (333,352) | — | |||||||||||||||||||
| Non-cash adjustments attributable to non-controlling interests | (4,097) | 69 | (3,990) | 202 | |||||||||||||||||||
| AFFO | 227,907 | 164,620 | 584,140 | 472,939 | |||||||||||||||||||
| Interest expense, net | 72,817 | 47,025 | 208,938 | 142,895 | |||||||||||||||||||
| Income tax (benefit) expense | (368) | 24 | 395 | 1,098 | |||||||||||||||||||
| Adjusted EBITDA | $ | 300,356 | $ | 211,669 | $ | 793,473 | $ | 616,932 | |||||||||||||||
| Net income per common share | |||||||||||||||||||||||
| Basic | $ | 0.75 | $ | 0.31 | $ | 1.22 | $ | 1.05 | |||||||||||||||
| Diluted | $ | 0.74 | $ | 0.31 | $ | 1.21 | $ | 1.04 | |||||||||||||||
| FFO per common share | |||||||||||||||||||||||
| Basic | $ | 0.75 | $ | 0.31 | $ | 1.22 | $ | 1.05 | |||||||||||||||
| Diluted | $ | 0.74 | $ | 0.31 | $ | 1.21 | $ | 1.04 | |||||||||||||||
| AFFO per common share | |||||||||||||||||||||||
| Basic | $ | 0.43 | $ | 0.36 | $ | 1.18 | $ | 1.11 | |||||||||||||||
| Diluted | $ | 0.43 | $ | 0.35 | $ | 1.17 | $ | 1.10 | |||||||||||||||
| Weighted average number of shares of common stock outstanding | |||||||||||||||||||||||
| Basic | 533,407,916 | 460,666,295 | 496,002,850 | 426,437,889 | |||||||||||||||||||
| Diluted | 536,180,175 | 465,771,668 | 499,982,269 | 428,366,146 | |||||||||||||||||||
10
VICI Properties Inc.
Revenue Breakdown
(In thousands)
| Three Months Ended September 30, | Nine Months Ended September 30, | ||||||||||||||||||||||
| 2020 | 2019 | 2020 | 2019 | ||||||||||||||||||||
| Contractual leasing revenues (cash rent) | |||||||||||||||||||||||
Caesars Las Vegas Master Lease(1) | $ | 93,819 | $ | 73,158 | $ | 242,269 | $ | 219,474 | |||||||||||||||
Caesars Regional Master Lease & Joliet Lease(2) | 157,768 | 125,255 | 412,035 | 375,765 | |||||||||||||||||||
| Margaritaville Lease | 5,886 | 5,800 | 17,629 | 17,338 | |||||||||||||||||||
| Greektown Lease | 13,889 | 13,889 | 41,667 | 19,862 | |||||||||||||||||||
| Hard Rock Lease | 10,687 | 1,306 | 32,062 | 1,306 | |||||||||||||||||||
| Century Master Lease | 6,250 | — | 18,750 | — | |||||||||||||||||||
JACK Entertainment Master Lease(2) | 16,470 | — | 45,337 | — | |||||||||||||||||||
| Total contractual leasing revenues (cash rent) | 304,769 | 219,408 | 809,749 | 633,745 | |||||||||||||||||||
| Income from loans | |||||||||||||||||||||||
| JACK Entertainment Loan | 1,547 | — | 3,502 | — | |||||||||||||||||||
| Caesars Forum Convention Center Loan | 1,112 | — | 1,112 | — | |||||||||||||||||||
| Chelsea Piers Loan | 392 | — | 392 | — | |||||||||||||||||||
| Total income from loans | 3,051 | — | 5,006 | — | |||||||||||||||||||
| Golf operations | 5,638 | 5,599 | 17,273 | 21,221 | |||||||||||||||||||
| Total cash revenue | 313,458 | 225,007 | 832,028 | 654,966 | |||||||||||||||||||
Non-cash lease adjustments(3) | |||||||||||||||||||||||
Caesars Las Vegas Master Lease(1) | 8,064 | (1,957) | 1,956 | (5,793) | |||||||||||||||||||
Caesars Regional Master Lease & Joliet Lease(2) | 15,214 | 4,935 | 22,227 | 14,406 | |||||||||||||||||||
| Margaritaville Lease | (1,142) | (2,536) | (3,311) | (3,112) | |||||||||||||||||||
| Greektown Lease | (2,549) | (2,936) | (7,467) | (3,206) | |||||||||||||||||||
| Hard Rock Lease | (237) | — | (685) | — | |||||||||||||||||||
| Century Master Lease | 254 | — | 744 | — | |||||||||||||||||||
JACK Entertainment Master Lease(2) | (662) | — | (1,585) | — | |||||||||||||||||||
| Total non-cash lease adjustments | 18,942 | (2,494) | 11,879 | 2,295 | |||||||||||||||||||
| Income from loans non-cash adjustment | (23) | — | (53) | — | |||||||||||||||||||
| Total non-cash adjustments | 18,919 | (2,494) | 11,826 | 2,295 | |||||||||||||||||||
| Other income | 7,276 | — | 8,702 | — | |||||||||||||||||||
| Total GAAP revenues | $ | 339,653 | $ | 222,513 | $ | 852,556 | $ | 657,261 | |||||||||||||||
____________________
(1) Includes income from operating leases.
(2) The JACK Entertainment Master Lease Agreement and Harrah's New Orleans, Harrah's Atlantic City, and Harrah's Laughlin properties under the Caesars Regional Master Lease Agreement are classified as lease financing receivables.
(3) Amounts represent the non-cash adjustment to income from direct financing leases, sales-type leases and lease financing receivables in order to recognize income on an effective interest basis at a constant rate of return over the term of the leases.
11
Investor Contacts:
(646) 949-4631
Or
David Kieske
EVP, Chief Financial Officer
Danny Valoy
Vice President, Finance
12
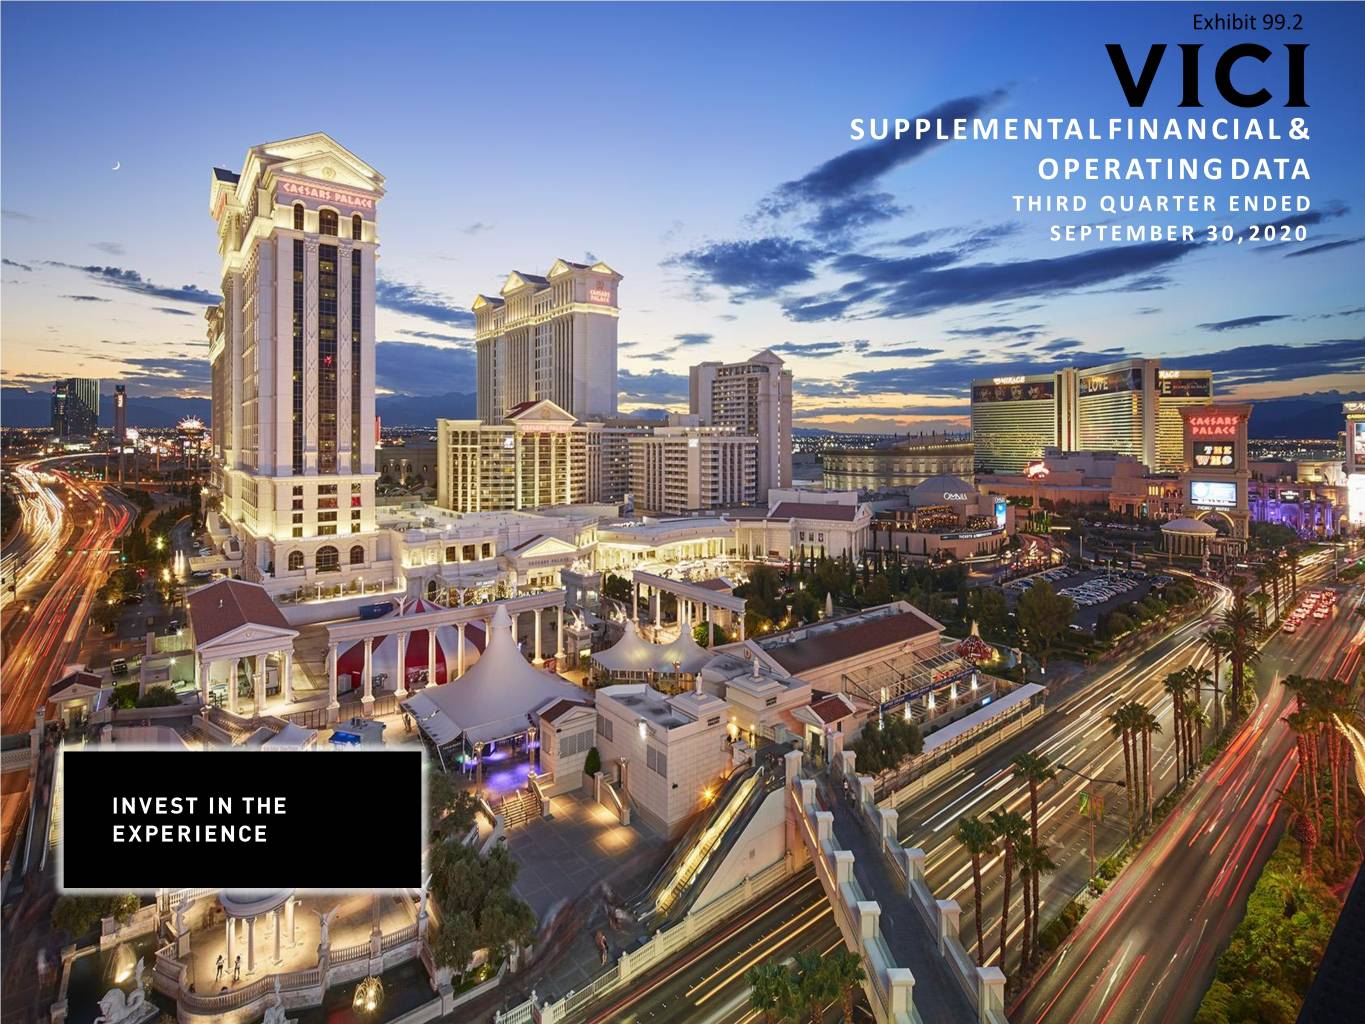
Exhibit 99.2 SUPPLEMENTAL FINANCIAL & OPERATING DATA T H I R D Q U A R T E R ENDE D SEPTEMBER 30 , 2020
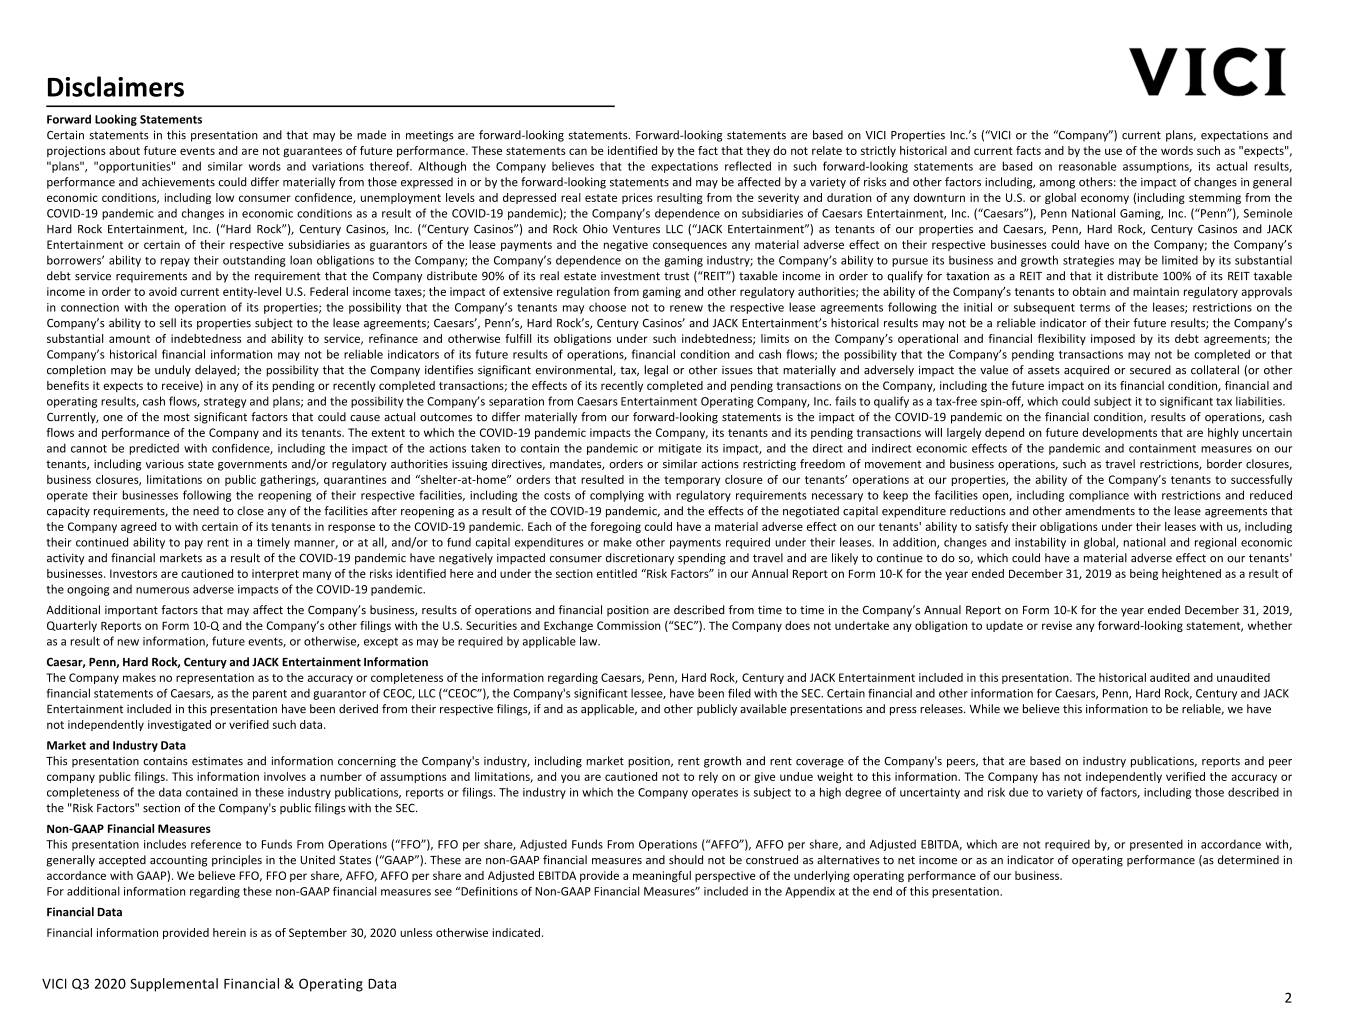
Disclaimers Forward Looking Statements Certain statements in this presentation and that may be made in meetings are forward-looking statements. Forward-looking statements are based on VICI Properties Inc.’s (“VICI or the “Company”) current plans, expectations and projections about future events and are not guarantees of future performance. These statements can be identified by the fact that they do not relate to strictly historical and current facts and by the use of the words such as "expects", "plans", "opportunities" and similar words and variations thereof. Although the Company believes that the expectations reflected in such forward-looking statements are based on reasonable assumptions, its actual results, performance and achievements could differ materially from those expressed in or by the forward-looking statements and may be affected by a variety of risks and other factors including, among others: the impact of changes in general economic conditions, including low consumer confidence, unemployment levels and depressed real estate prices resulting from the severity and duration of any downturn in the U.S. or global economy (including stemming from the COVID-19 pandemic and changes in economic conditions as a result of the COVID-19 pandemic); the Company’s dependence on subsidiaries of Caesars Entertainment, Inc. (“Caesars”), Penn National Gaming, Inc. (“Penn”), Seminole Hard Rock Entertainment, Inc. (“Hard Rock”), Century Casinos, Inc. (“Century Casinos”) and Rock Ohio Ventures LLC (“JACK Entertainment”) as tenants of our properties and Caesars, Penn, Hard Rock, Century Casinos and JACK Entertainment or certain of their respective subsidiaries as guarantors of the lease payments and the negative consequences any material adverse effect on their respective businesses could have on the Company; the Company’s borrowers’ ability to repay their outstanding loan obligations to the Company; the Company’s dependence on the gaming industry; the Company’s ability to pursue its business and growth strategies may be limited by its substantial debt service requirements and by the requirement that the Company distribute 90% of its real estate investment trust (“REIT”) taxable income in order to qualify for taxation as a REIT and that it distribute 100% of its REIT taxable income in order to avoid current entity-level U.S. Federal income taxes; the impact of extensive regulation from gaming and other regulatory authorities; the ability of the Company’s tenants to obtain and maintain regulatory approvals in connection with the operation of its properties; the possibility that the Company’s tenants may choose not to renew the respective lease agreements following the initial or subsequent terms of the leases; restrictions on the Company’s ability to sell its properties subject to the lease agreements; Caesars’, Penn’s, Hard Rock’s, Century Casinos’ and JACK Entertainment’s historical results may not be a reliable indicator of their future results; the Company’s substantial amount of indebtedness and ability to service, refinance and otherwise fulfill its obligations under such indebtedness; limits on the Company’s operational and financial flexibility imposed by its debt agreements; the Company’s historical financial information may not be reliable indicators of its future results of operations, financial condition and cash flows; the possibility that the Company’s pending transactions may not be completed or that completion may be unduly delayed; the possibility that the Company identifies significant environmental, tax, legal or other issues that materially and adversely impact the value of assets acquired or secured as collateral (or other benefits it expects to receive) in any of its pending or recently completed transactions; the effects of its recently completed and pending transactions on the Company, including the future impact on its financial condition, financial and operating results, cash flows, strategy and plans; and the possibility the Company’s separation from Caesars Entertainment Operating Company, Inc. fails to qualify as a tax-free spin-off, which could subject it to significant tax liabilities. Currently, one of the most significant factors that could cause actual outcomes to differ materially from our forward-looking statements is the impact of the COVID-19 pandemic on the financial condition, results of operations, cash flows and performance of the Company and its tenants. The extent to which the COVID-19 pandemic impacts the Company, its tenants and its pending transactions will largely depend on future developments that are highly uncertain and cannot be predicted with confidence, including the impact of the actions taken to contain the pandemic or mitigate its impact, and the direct and indirect economic effects of the pandemic and containment measures on our tenants, including various state governments and/or regulatory authorities issuing directives, mandates, orders or similar actions restricting freedom of movement and business operations, such as travel restrictions, border closures, business closures, limitations on public gatherings, quarantines and “shelter-at-home” orders that resulted in the temporary closure of our tenants’ operations at our properties, the ability of the Company’s tenants to successfully operate their businesses following the reopening of their respective facilities, including the costs of complying with regulatory requirements necessary to keep the facilities open, including compliance with restrictions and reduced capacity requirements, the need to close any of the facilities after reopening as a result of the COVID-19 pandemic, and the effects of the negotiated capital expenditure reductions and other amendments to the lease agreements that the Company agreed to with certain of its tenants in response to the COVID-19 pandemic. Each of the foregoing could have a material adverse effect on our tenants' ability to satisfy their obligations under their leases with us, including their continued ability to pay rent in a timely manner, or at all, and/or to fund capital expenditures or make other payments required under their leases. In addition, changes and instability in global, national and regional economic activity and financial markets as a result of the COVID-19 pandemic have negatively impacted consumer discretionary spending and travel and are likely to continue to do so, which could have a material adverse effect on our tenants' businesses. Investors are cautioned to interpret many of the risks identified here and under the section entitled “Risk Factors” in our Annual Report on Form 10-K for the year ended December 31, 2019 as being heightened as a result of the ongoing and numerous adverse impacts of the COVID-19 pandemic. Additional important factors that may affect the Company’s business, results of operations and financial position are described from time to time in the Company’s Annual Report on Form 10‐K for the year ended December 31, 2019, Quarterly Reports on Form 10-Q and the Company’s other filings with the U.S. Securities and Exchange Commission (“SEC”). The Company does not undertake any obligation to update or revise any forward‐looking statement, whether as a result of new information, future events, or otherwise, except as may be required by applicable law. Caesar, Penn, Hard Rock, Century and JACK Entertainment Information The Company makes no representation as to the accuracy or completeness of the information regarding Caesars, Penn, Hard Rock, Century and JACK Entertainment included in this presentation. The historical audited and unaudited financial statements of Caesars, as the parent and guarantor of CEOC, LLC (“CEOC”), the Company's significant lessee, have been filed with the SEC. Certain financial and other information for Caesars, Penn, Hard Rock, Century and JACK Entertainment included in this presentation have been derived from their respective filings, if and as applicable, and other publicly available presentations and press releases. While we believe this information to be reliable, we have not independently investigated or verified such data. Market and Industry Data This presentation contains estimates and information concerning the Company's industry, including market position, rent growth and rent coverage of the Company's peers, that are based on industry publications, reports and peer company public filings. This information involves a number of assumptions and limitations, and you are cautioned not to rely on or give undue weight to this information. The Company has not independently verified the accuracy or completeness of the data contained in these industry publications, reports or filings. The industry in which the Company operates is subject to a high degree of uncertainty and risk due to variety of factors, including those described in the "Risk Factors" section of the Company's public filings with the SEC. Non‐GAAP Financial Measures This presentation includes reference to Funds From Operations (“FFO”), FFO per share, Adjusted Funds From Operations (“AFFO”), AFFO per share, and Adjusted EBITDA, which are not required by, or presented in accordance with, generally accepted accounting principles in the United States (“GAAP”). These are non-GAAP financial measures and should not be construed as alternatives to net income or as an indicator of operating performance (as determined in accordance with GAAP). We believe FFO, FFO per share, AFFO, AFFO per share and Adjusted EBITDA provide a meaningful perspective of the underlying operating performance of our business. For additional information regarding these non-GAAP financial measures see “Definitions of Non-GAAP Financial Measures” included in the Appendix at the end of this presentation. Financial Data Financial information provided herein is as of September 30, 2020 unless otherwise indicated. VICI Q3 2020 Supplemental Financial & Operating Data 2
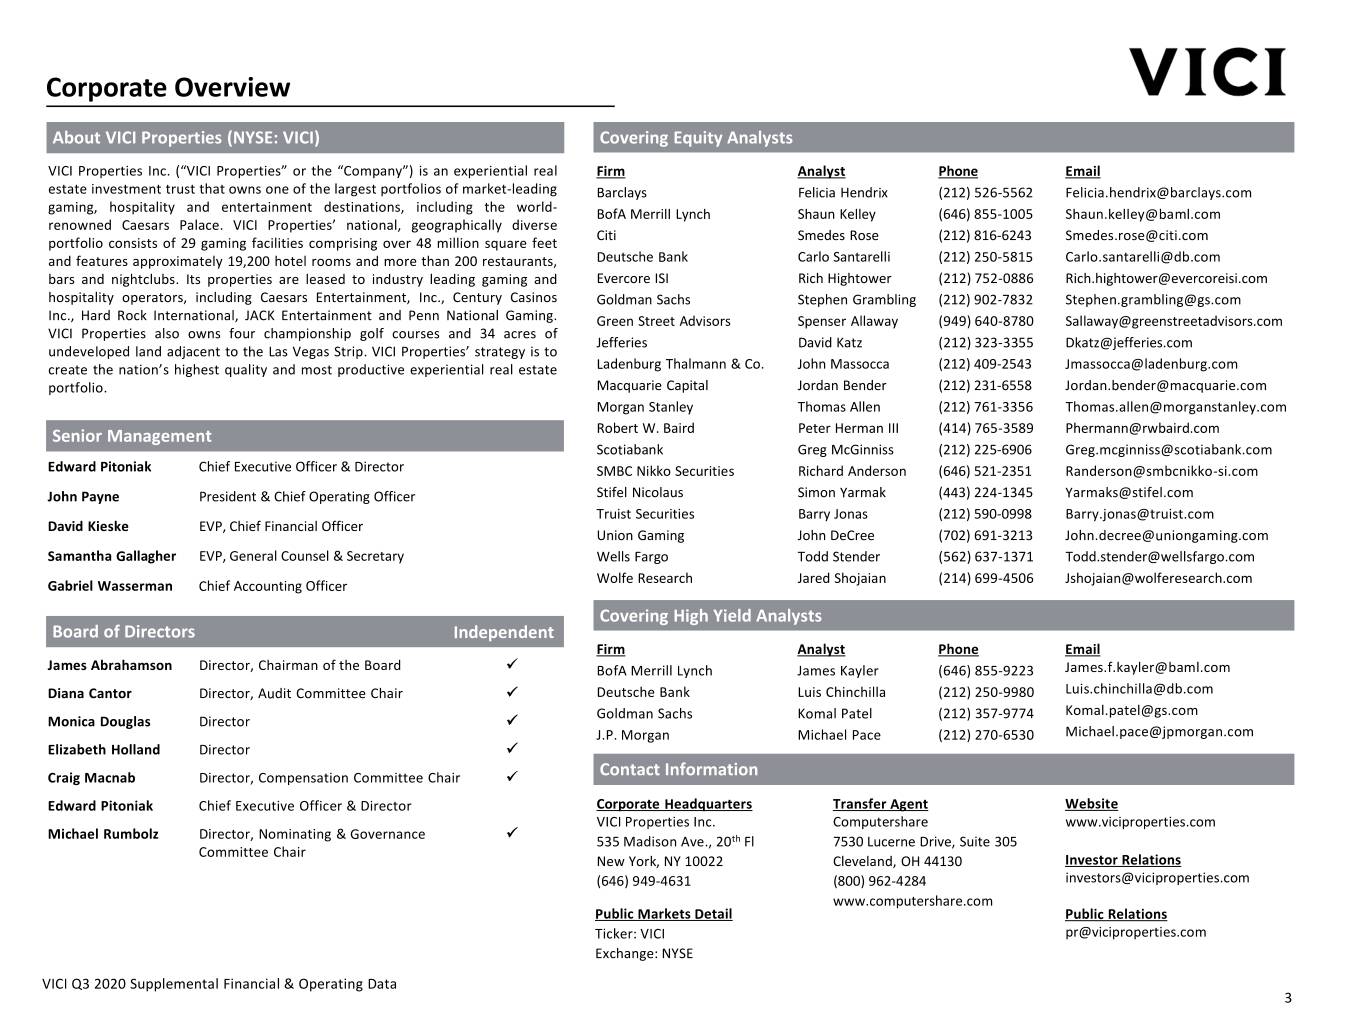
Corporate Overview About VICI Properties (NYSE: VICI) Covering Equity Analysts VICI Properties Inc. (“VICI Properties” or the “Company”) is an experiential real Firm Analyst Phone Email estate investment trust that owns one of the largest portfolios of market-leading Barclays Felicia Hendrix (212) 526‐5562 [email protected] gaming, hospitality and entertainment destinations, including the world- BofA Merrill Lynch Shaun Kelley (646) 855‐1005 [email protected] renowned Caesars Palace. VICI Properties’ national, geographically diverse Citi Smedes Rose (212) 816-6243 [email protected] portfolio consists of 29 gaming facilities comprising over 48 million square feet and features approximately 19,200 hotel rooms and more than 200 restaurants, Deutsche Bank Carlo Santarelli (212) 250‐5815 [email protected] bars and nightclubs. Its properties are leased to industry leading gaming and Evercore ISI Rich Hightower (212) 752-0886 [email protected] hospitality operators, including Caesars Entertainment, Inc., Century Casinos Goldman Sachs Stephen Grambling (212) 902‐7832 [email protected] Inc., Hard Rock International, JACK Entertainment and Penn National Gaming. Green Street Advisors Spenser Allaway (949) 640-8780 [email protected] VICI Properties also owns four championship golf courses and 34 acres of Jefferies David Katz (212) 323-3355 [email protected] undeveloped land adjacent to the Las Vegas Strip. VICI Properties’ strategy is to create the nation’s highest quality and most productive experiential real estate Ladenburg Thalmann & Co. John Massocca (212) 409-2543 [email protected] portfolio. Macquarie Capital Jordan Bender (212) 231-6558 [email protected] Morgan Stanley Thomas Allen (212) 761‐3356 [email protected] Senior Management Robert W. Baird Peter Herman III (414) 765-3589 [email protected] Scotiabank Greg McGinniss (212) 225-6906 [email protected] Edward Pitoniak Chief Executive Officer & Director SMBC Nikko Securities Richard Anderson (646) 521-2351 [email protected] John Payne President & Chief Operating Officer Stifel Nicolaus Simon Yarmak (443) 224‐1345 [email protected] Truist Securities Barry Jonas (212) 590-0998 [email protected] David Kieske EVP, Chief Financial Officer Union Gaming John DeCree (702) 691‐3213 [email protected] Samantha Gallagher EVP, General Counsel & Secretary Wells Fargo Todd Stender (562) 637-1371 [email protected] Wolfe Research Jared Shojaian (214) 699-4506 [email protected] Gabriel Wasserman Chief Accounting Officer Covering High Yield Analysts Board of Directors Independent Firm Analyst Phone Email James Abrahamson Director, Chairman of the Board ✓ BofA Merrill Lynch James Kayler (646) 855‐9223 [email protected] Diana Cantor Director, Audit Committee Chair ✓ Deutsche Bank Luis Chinchilla (212) 250-9980 [email protected] Goldman Sachs Komal Patel (212) 357‐9774 [email protected] Monica Douglas Director ✓ J.P. Morgan Michael Pace (212) 270‐6530 [email protected] Elizabeth Holland Director ✓ Craig Macnab Director, Compensation Committee Chair ✓ Contact Information Edward Pitoniak Chief Executive Officer & Director Corporate Headquarters Transfer Agent Website VICI Properties Inc. Computershare www.viciproperties.com Michael Rumbolz Director, Nominating & Governance ✓ 535 Madison Ave., 20th Fl 7530 Lucerne Drive, Suite 305 Committee Chair New York, NY 10022 Cleveland, OH 44130 Investor Relations (646) 949‐4631 (800) 962‐4284 [email protected] www.computershare.com Public Markets Detail Public Relations Ticker: VICI [email protected] Exchange: NYSE VICI Q3 2020 Supplemental Financial & Operating Data 3
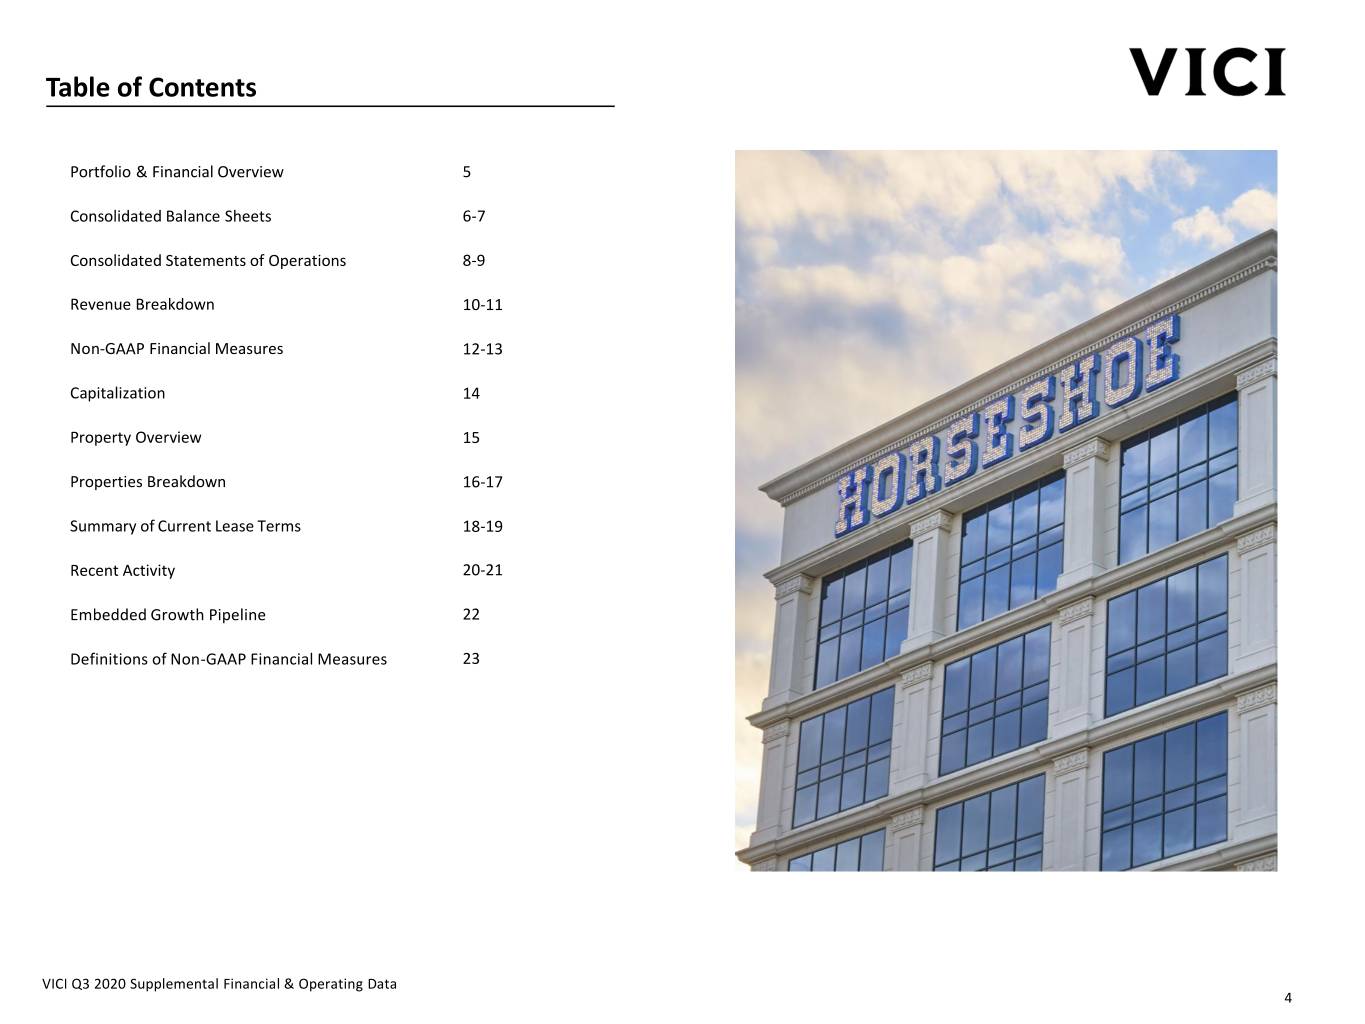
Table of Contents Portfolio & Financial Overview 5 Consolidated Balance Sheets 6-7 Consolidated Statements of Operations 8-9 Revenue Breakdown 10-11 Non‐GAAP Financial Measures 12-13 Capitalization 14 Property Overview 15 Properties Breakdown 16-17 Summary of Current Lease Terms 18-19 Recent Activity 20-21 Embedded Growth Pipeline 22 Definitions of Non-GAAP Financial Measures 23 VICI Q3 2020 Supplemental Financial & Operating Data 4
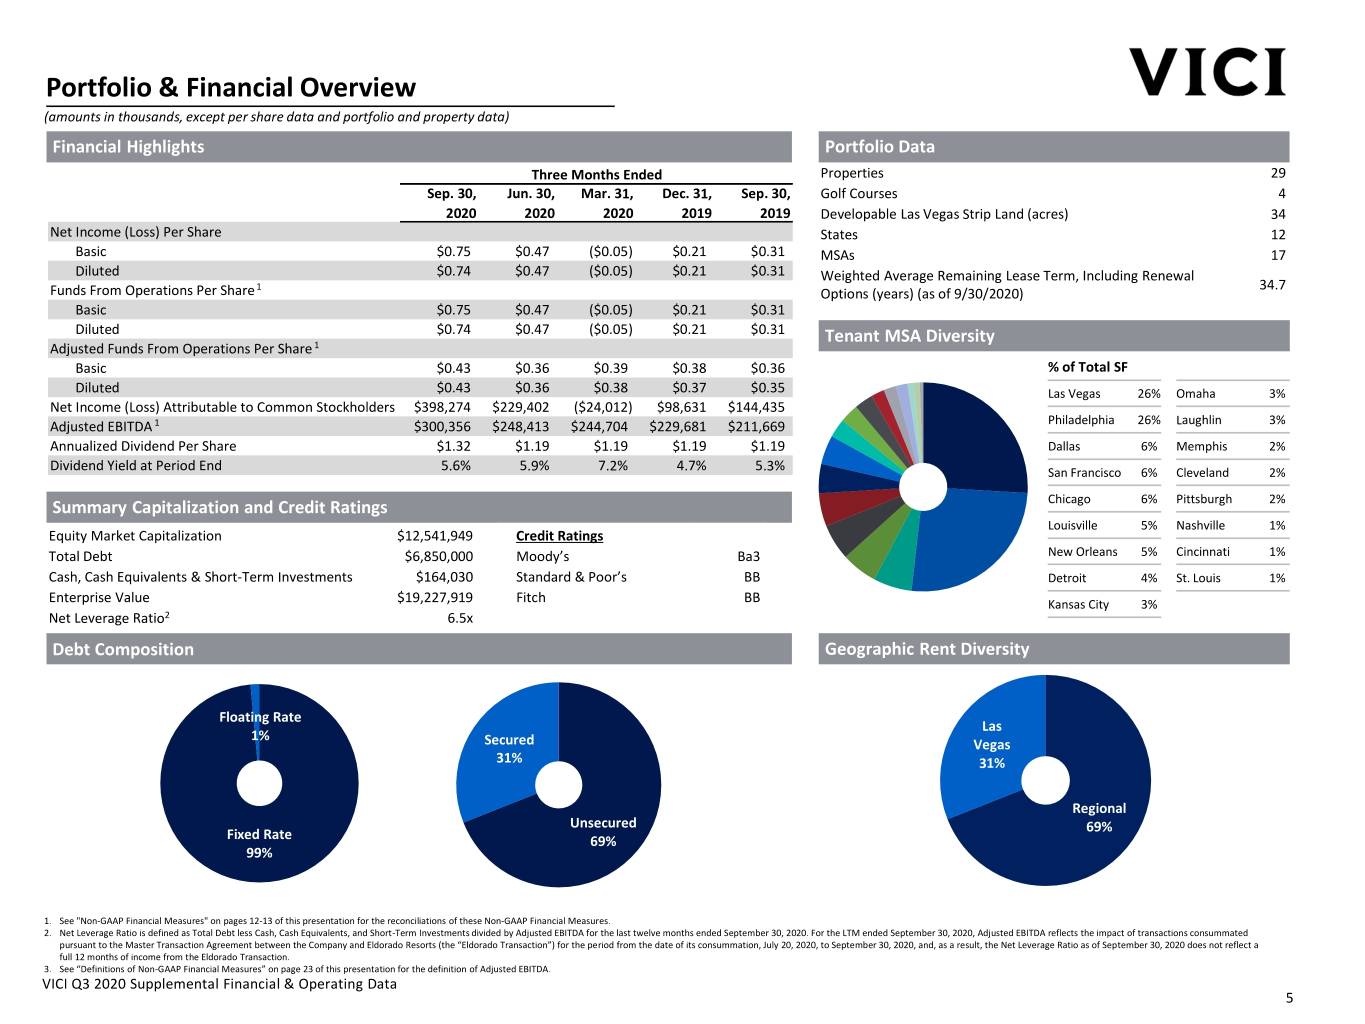
Portfolio & Financial Overview (amounts in thousands, except per share data and portfolio and property data) Financial Highlights Portfolio Data Three Months Ended Properties 29 Sep. 30, Jun. 30, Mar. 31, Dec. 31, Sep. 30, Golf Courses 4 2020 2020 2020 2019 2019 Developable Las Vegas Strip Land (acres) 34 Net Income (Loss) Per Share States 12 Basic $0.75 $0.47 ($0.05) $0.21 $0.31 MSAs 17 Diluted $0.74 $0.47 ($0.05) $0.21 $0.31 Weighted Average Remaining Lease Term, Including Renewal 1 34.7 Funds From Operations Per Share Options (years) (as of 9/30/2020) Basic $0.75 $0.47 ($0.05) $0.21 $0.31 Diluted $0.74 $0.47 ($0.05) $0.21 $0.31 Tenant MSA Diversity Adjusted Funds From Operations Per Share 1 Basic $0.43 $0.36 $0.39 $0.38 $0.36 % of Total SF Diluted $0.43 $0.36 $0.38 $0.37 $0.35 Las Vegas 26% Omaha 3% Net Income (Loss) Attributable to Common Stockholders $398,274 $229,402 ($24,012) $98,631 $144,435 Adjusted EBITDA 1 $300,356 $248,413 $244,704 $229,681 $211,669 Philadelphia 26% Laughlin 3% Annualized Dividend Per Share $1.32 $1.19 $1.19 $1.19 $1.19 Dallas 6% Memphis 2% Dividend Yield at Period End 5.6% 5.9% 7.2% 4.7% 5.3% San Francisco 6% Cleveland 2% Summary Capitalization and Credit Ratings Chicago 6% Pittsburgh 2% Louisville 5% Nashville 1% Equity Market Capitalization $12,541,949 Credit Ratings Total Debt $6,850,000 Moody’s Ba3 New Orleans 5% Cincinnati 1% Cash, Cash Equivalents & Short-Term Investments $164,030 Standard & Poor’s BB Detroit 4% St. Louis 1% Enterprise Value $19,227,919 Fitch BB Kansas City 3% Net Leverage Ratio2 6.5x Debt Composition Geographic Rent Diversity Floating Rate Las 1% Secured Vegas 31% 31% Regional Unsecured 69% Fixed Rate 69% 99% 1. See "Non‐GAAP Financial Measures" on pages 12-13 of this presentation for the reconciliations of these Non‐GAAP Financial Measures. 2. Net Leverage Ratio is defined as Total Debt less Cash, Cash Equivalents, and Short-Term Investments divided by Adjusted EBITDA for the last twelve months ended September 30, 2020. For the LTM ended September 30, 2020, Adjusted EBITDA reflects the impact of transactions consummated pursuant to the Master Transaction Agreement between the Company and Eldorado Resorts (the “Eldorado Transaction”) for the period from the date of its consummation, July 20, 2020, to September 30, 2020, and, as a result, the Net Leverage Ratio as of September 30, 2020 does not reflect a full 12 months of income from the Eldorado Transaction. 3. See “Definitions of Non-GAAP Financial Measures” on page 23 of this presentation for the definition of Adjusted EBITDA. VICI Q3 2020 Supplemental Financial & Operating Data 5
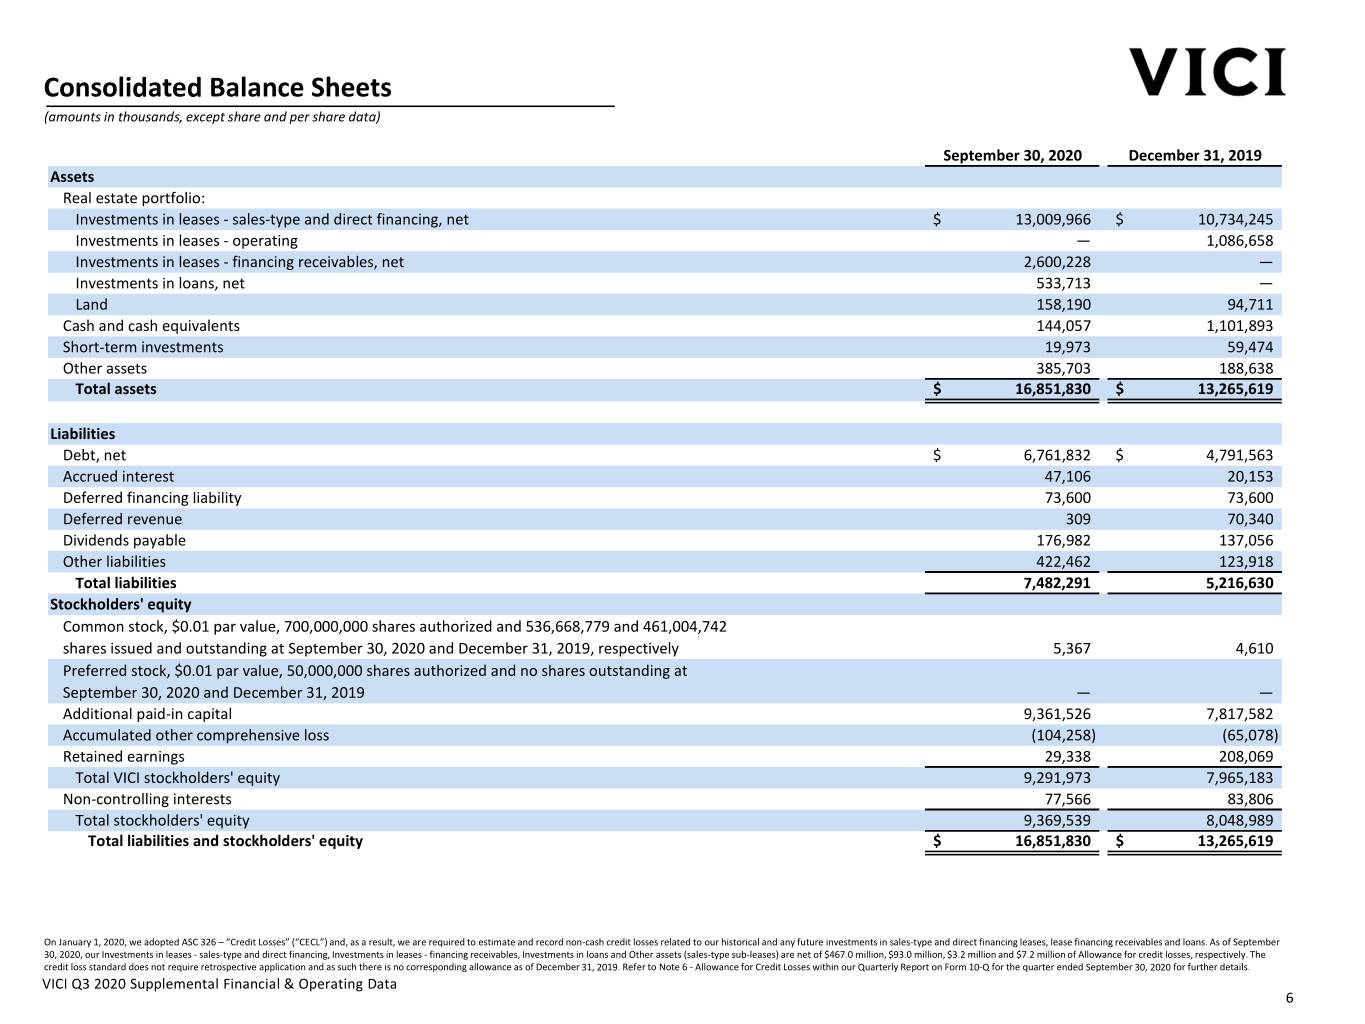
Consolidated Balance Sheets (amounts in thousands, except share and per share data) September 30, 2020 December 31, 2019 Assets Real estate portfolio: Investments in leases - sales-type and direct financing, net $ 13,009,966 $ 10,734,245 Investments in leases - operating — 1,086,658 Investments in leases - financing receivables, net 2,600,228 — Investments in loans, net 533,713 — Land 158,190 94,711 Cash and cash equivalents 144,057 1,101,893 Short-term investments 19,973 59,474 Other assets 385,703 188,638 Total assets $ 16,851,830 $ 13,265,619 Liabilities Debt, net $ 6,761,832 $ 4,791,563 Accrued interest 47,106 20,153 Deferred financing liability 73,600 73,600 Deferred revenue 309 70,340 Dividends payable 176,982 137,056 Other liabilities 422,462 123,918 Total liabilities 7,482,291 5,216,630 Stockholders' equity Common stock, $0.01 par value, 700,000,000 shares authorized and 536,668,779 and 461,004,742 shares issued and outstanding at September 30, 2020 and December 31, 2019, respectively 5,367 4,610 Preferred stock, $0.01 par value, 50,000,000 shares authorized and no shares outstanding at September 30, 2020 and December 31, 2019 — — Additional paid-in capital 9,361,526 7,817,582 Accumulated other comprehensive loss (104,258) (65,078) Retained earnings 29,338 208,069 Total VICI stockholders' equity 9,291,973 7,965,183 Non-controlling interests 77,566 83,806 Total stockholders' equity 9,369,539 8,048,989 Total liabilities and stockholders' equity $ 16,851,830 $ 13,265,619 On January 1, 2020, we adopted ASC 326 – “Credit Losses” (“CECL”) and, as a result, we are required to estimate and record non-cash credit losses related to our historical and any future investments in sales-type and direct financing leases, lease financing receivables and loans. As of September 30, 2020, our Investments in leases - sales-type and direct financing, Investments in leases - financing receivables, Investments in loans and Other assets (sales-type sub-leases) are net of $467.0 million, $93.0 million, $3.2 million and $7.2 million of Allowance for credit losses, respectively. The credit loss standard does not require retrospective application and as such there is no corresponding allowance as of December 31, 2019. Refer to Note 6 - Allowance for Credit Losses within our Quarterly Report on Form 10-Q for the quarter ended September 30, 2020 for further details. VICI Q3 2020 Supplemental Financial & Operating Data 6
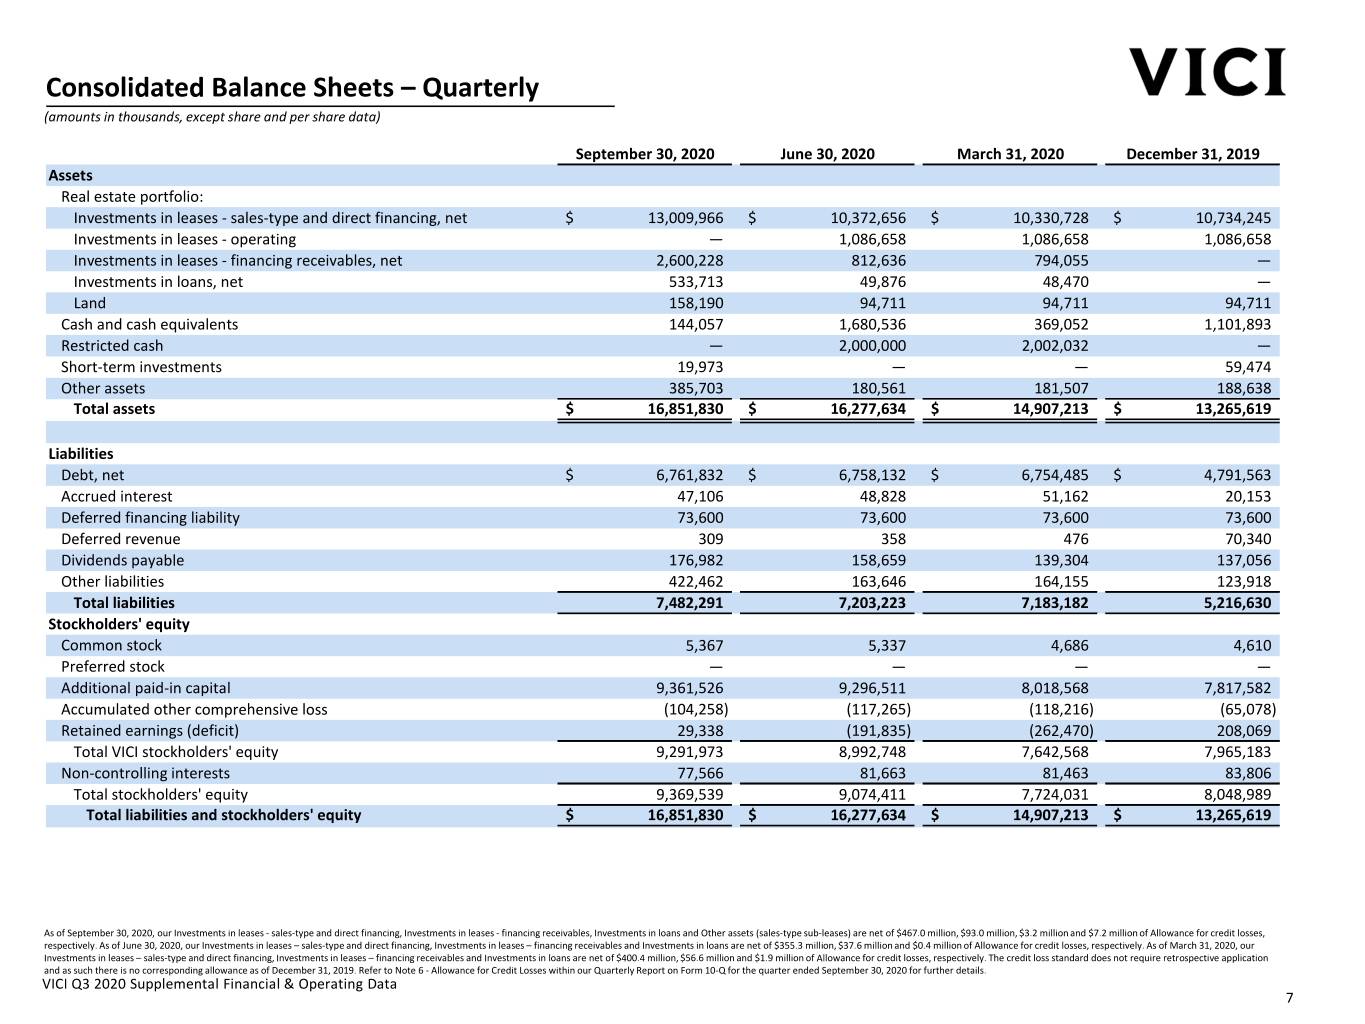
Consolidated Balance Sheets – Quarterly (amounts in thousands, except share and per share data) September 30, 2020 June 30, 2020 March 31, 2020 December 31, 2019 Assets Real estate portfolio: Investments in leases - sales-type and direct financing, net $ 13,009,966 $ 10,372,656 $ 10,330,728 $ 10,734,245 Investments in leases - operating — 1,086,658 1,086,658 1,086,658 Investments in leases - financing receivables, net 2,600,228 812,636 794,055 — Investments in loans, net 533,713 49,876 48,470 — Land 158,190 94,711 94,711 94,711 Cash and cash equivalents 144,057 1,680,536 369,052 1,101,893 Restricted cash — 2,000,000 2,002,032 — Short-term investments 19,973 — — 59,474 Other assets 385,703 180,561 181,507 188,638 Total assets $ 16,851,830 $ 16,277,634 $ 14,907,213 $ 13,265,619 Liabilities Debt, net $ 6,761,832 $ 6,758,132 $ 6,754,485 $ 4,791,563 Accrued interest 47,106 48,828 51,162 20,153 Deferred financing liability 73,600 73,600 73,600 73,600 Deferred revenue 309 358 476 70,340 Dividends payable 176,982 158,659 139,304 137,056 Other liabilities 422,462 163,646 164,155 123,918 Total liabilities 7,482,291 7,203,223 7,183,182 5,216,630 Stockholders' equity Common stock 5,367 5,337 4,686 4,610 Preferred stock — — — — Additional paid-in capital 9,361,526 9,296,511 8,018,568 7,817,582 Accumulated other comprehensive loss (104,258) (117,265) (118,216) (65,078) Retained earnings (deficit) 29,338 (191,835) (262,470) 208,069 Total VICI stockholders' equity 9,291,973 8,992,748 7,642,568 7,965,183 Non-controlling interests 77,566 81,663 81,463 83,806 Total stockholders' equity 9,369,539 9,074,411 7,724,031 8,048,989 Total liabilities and stockholders' equity $ 16,851,830 $ 16,277,634 $ 14,907,213 $ 13,265,619 As of September 30, 2020, our Investments in leases - sales-type and direct financing, Investments in leases - financing receivables, Investments in loans and Other assets (sales-type sub-leases) are net of $467.0 million, $93.0 million, $3.2 million and $7.2 million of Allowance for credit losses, respectively. As of June 30, 2020, our Investments in leases – sales-type and direct financing, Investments in leases – financing receivables and Investments in loans are net of $355.3 million, $37.6 million and $0.4 million of Allowance for credit losses, respectively. As of March 31, 2020, our Investments in leases – sales-type and direct financing, Investments in leases – financing receivables and Investments in loans are net of $400.4 million, $56.6 million and $1.9 million of Allowance for credit losses, respectively. The credit loss standard does not require retrospective application and as such there is no corresponding allowance as of December 31, 2019. Refer to Note 6 - Allowance for Credit Losses within our Quarterly Report on Form 10-Q for the quarter ended September 30, 2020 for further details. VICI Q3 2020 Supplemental Financial & Operating Data 7
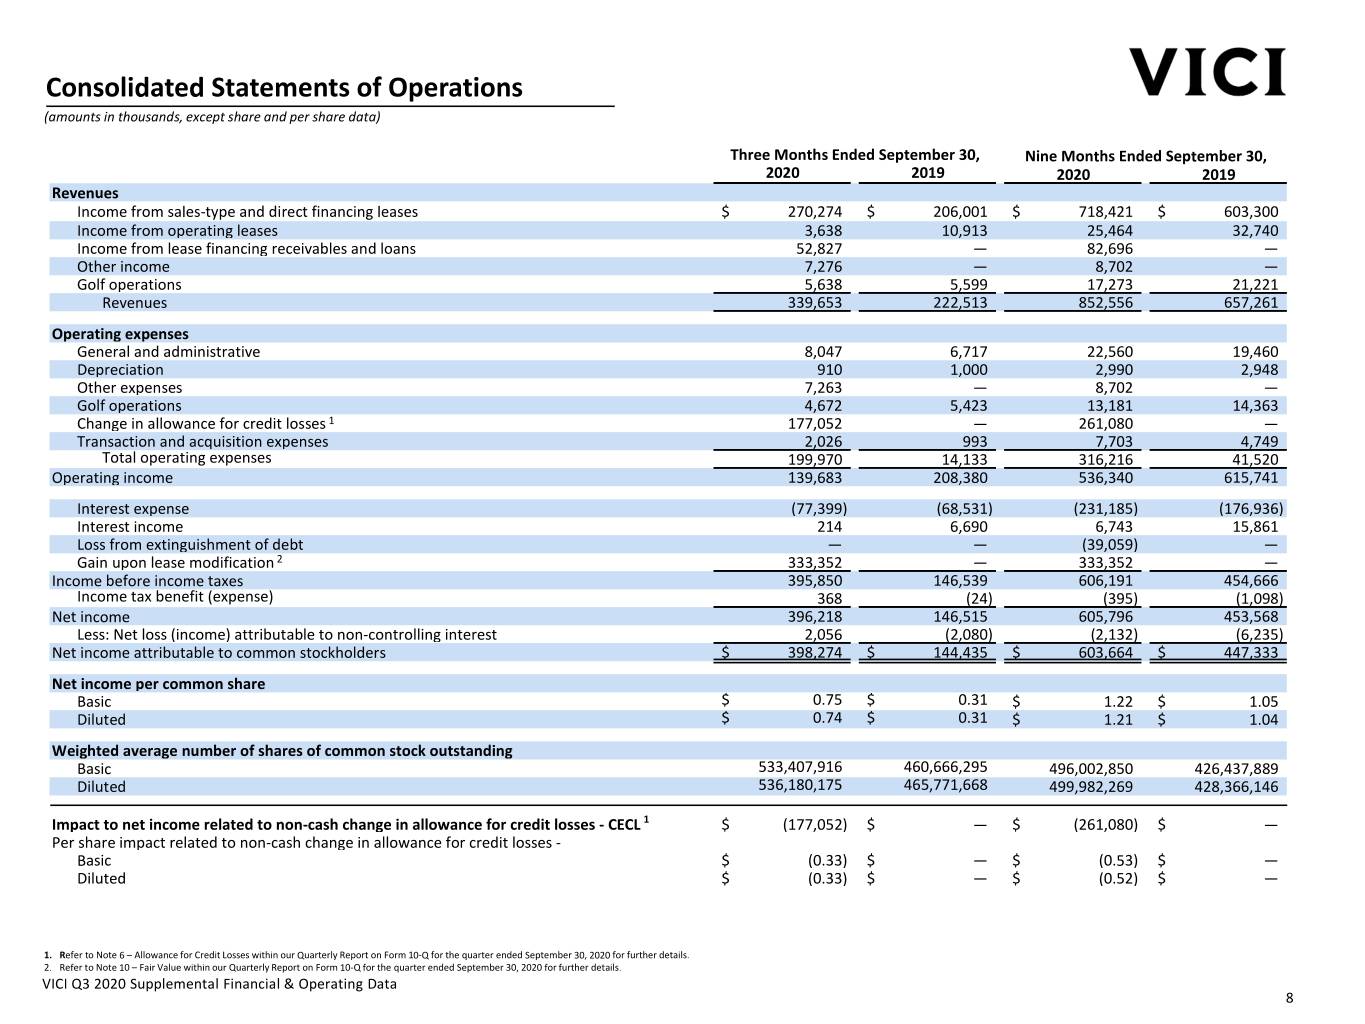
Consolidated Statements of Operations (amounts in thousands, except share and per share data) Three Months Ended September 30, Nine Months Ended September 30, 2020 2019 2020 2019 Revenues Income from sales-type and direct financing leases $ 270,274 $ 206,001 $ 718,421 $ 603,300 Income from operating leases 3,638 10,913 25,464 32,740 Income from lease financing receivables and loans 52,827 — 82,696 — Other income 7,276 — 8,702 — Golf operations 5,638 5,599 17,273 21,221 Revenues 339,653 222,513 852,556 657,261 Operating expenses General and administrative 8,047 6,717 22,560 19,460 Depreciation 910 1,000 2,990 2,948 Other expenses 7,263 — 8,702 — Golf operations 4,672 5,423 13,181 14,363 Change in allowance for credit losses 1 177,052 — 261,080 — Transaction and acquisition expenses 2,026 993 7,703 4,749 Total operating expenses 199,970 14,133 316,216 41,520 Operating income 139,683 208,380 536,340 615,741 Interest expense (77,399) (68,531) (231,185) (176,936) Interest income 214 6,690 6,743 15,861 Loss from extinguishment of debt — — (39,059) — Gain upon lease modification 2 333,352 — 333,352 — Income before income taxes 395,850 146,539 606,191 454,666 Income tax benefit (expense) 368 (24) (395) (1,098) Net income 396,218 146,515 605,796 453,568 Less: Net loss (income) attributable to non-controlling interest 2,056 (2,080) (2,132) (6,235) Net income attributable to common stockholders $ 398,274 $ 144,435 $ 603,664 $ 447,333 Net income per common share Basic $ 0.75 $ 0.31 $ 1.22 $ 1.05 Diluted $ 0.74 $ 0.31 $ 1.21 $ 1.04 Weighted average number of shares of common stock outstanding Basic 533,407,916 460,666,295 496,002,850 426,437,889 Diluted 536,180,175 465,771,668 499,982,269 428,366,146 Impact to net income related to non-cash change in allowance for credit losses - CECL 1 $ (177,052) $ — $ (261,080) $ — Per share impact related to non-cash change in allowance for credit losses - Basic $ (0.33) $ — $ (0.53) $ — Diluted $ (0.33) $ — $ (0.52) $ — 1. Refer to Note 6 – Allowance for Credit Losses within our Quarterly Report on Form 10-Q for the quarter ended September 30, 2020 for further details. 2. Refer to Note 10 – Fair Value within our Quarterly Report on Form 10-Q for the quarter ended September 30, 2020 for further details. VICI Q3 2020 Supplemental Financial & Operating Data 8
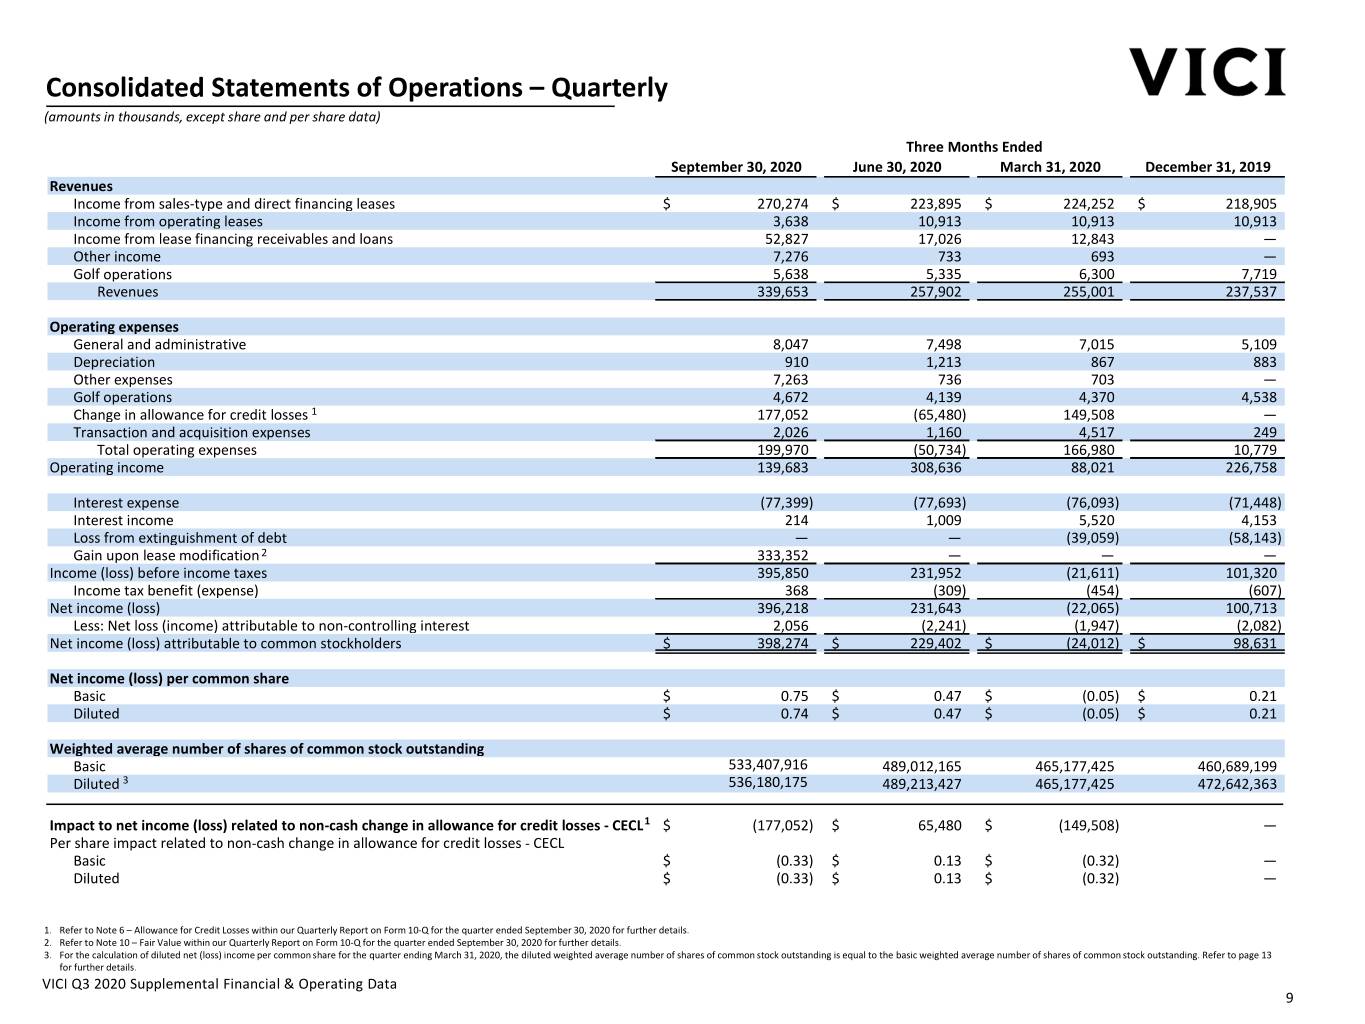
Consolidated Statements of Operations – Quarterly (amounts in thousands, except share and per share data) Three Months Ended September 30, 2020 June 30, 2020 March 31, 2020 December 31, 2019 Revenues Income from sales-type and direct financing leases $ 270,274 $ 223,895 $ 224,252 $ 218,905 Income from operating leases 3,638 10,913 10,913 10,913 Income from lease financing receivables and loans 52,827 17,026 12,843 — Other income 7,276 733 693 — Golf operations 5,638 5,335 6,300 7,719 Revenues 339,653 257,902 255,001 237,537 Operating expenses General and administrative 8,047 7,498 7,015 5,109 Depreciation 910 1,213 867 883 Other expenses 7,263 736 703 — Golf operations 4,672 4,139 4,370 4,538 Change in allowance for credit losses 1 177,052 (65,480) 149,508 — Transaction and acquisition expenses 2,026 1,160 4,517 249 Total operating expenses 199,970 (50,734) 166,980 10,779 Operating income 139,683 308,636 88,021 226,758 Interest expense (77,399) (77,693) (76,093) (71,448) Interest income 214 1,009 5,520 4,153 Loss from extinguishment of debt — — (39,059) (58,143) Gain upon lease modification 2 333,352 — — — Income (loss) before income taxes 395,850 231,952 (21,611) 101,320 Income tax benefit (expense) 368 (309) (454) (607) Net income (loss) 396,218 231,643 (22,065) 100,713 Less: Net loss (income) attributable to non-controlling interest 2,056 (2,241) (1,947) (2,082) Net income (loss) attributable to common stockholders $ 398,274 $ 229,402 $ (24,012) $ 98,631 Net income (loss) per common share Basic $ 0.75 $ 0.47 $ (0.05) $ 0.21 Diluted $ 0.74 $ 0.47 $ (0.05) $ 0.21 Weighted average number of shares of common stock outstanding Basic 533,407,916 489,012,165 465,177,425 460,689,199 Diluted 3 536,180,175 489,213,427 465,177,425 472,642,363 Impact to net income (loss) related to non-cash change in allowance for credit losses - CECL1 $ (177,052) $ 65,480 $ (149,508) — Per share impact related to non-cash change in allowance for credit losses - CECL Basic $ (0.33) $ 0.13 $ (0.32) — Diluted $ (0.33) $ 0.13 $ (0.32) — 1. Refer to Note 6 – Allowance for Credit Losses within our Quarterly Report on Form 10-Q for the quarter ended September 30, 2020 for further details. 2. Refer to Note 10 – Fair Value within our Quarterly Report on Form 10-Q for the quarter ended September 30, 2020 for further details. 3. For the calculation of diluted net (loss) income per common share for the quarter ending March 31, 2020, the diluted weighted average number of shares of common stock outstanding is equal to the basic weighted average number of shares of common stock outstanding. Refer to page 13 for further details. VICI Q3 2020 Supplemental Financial & Operating Data 9
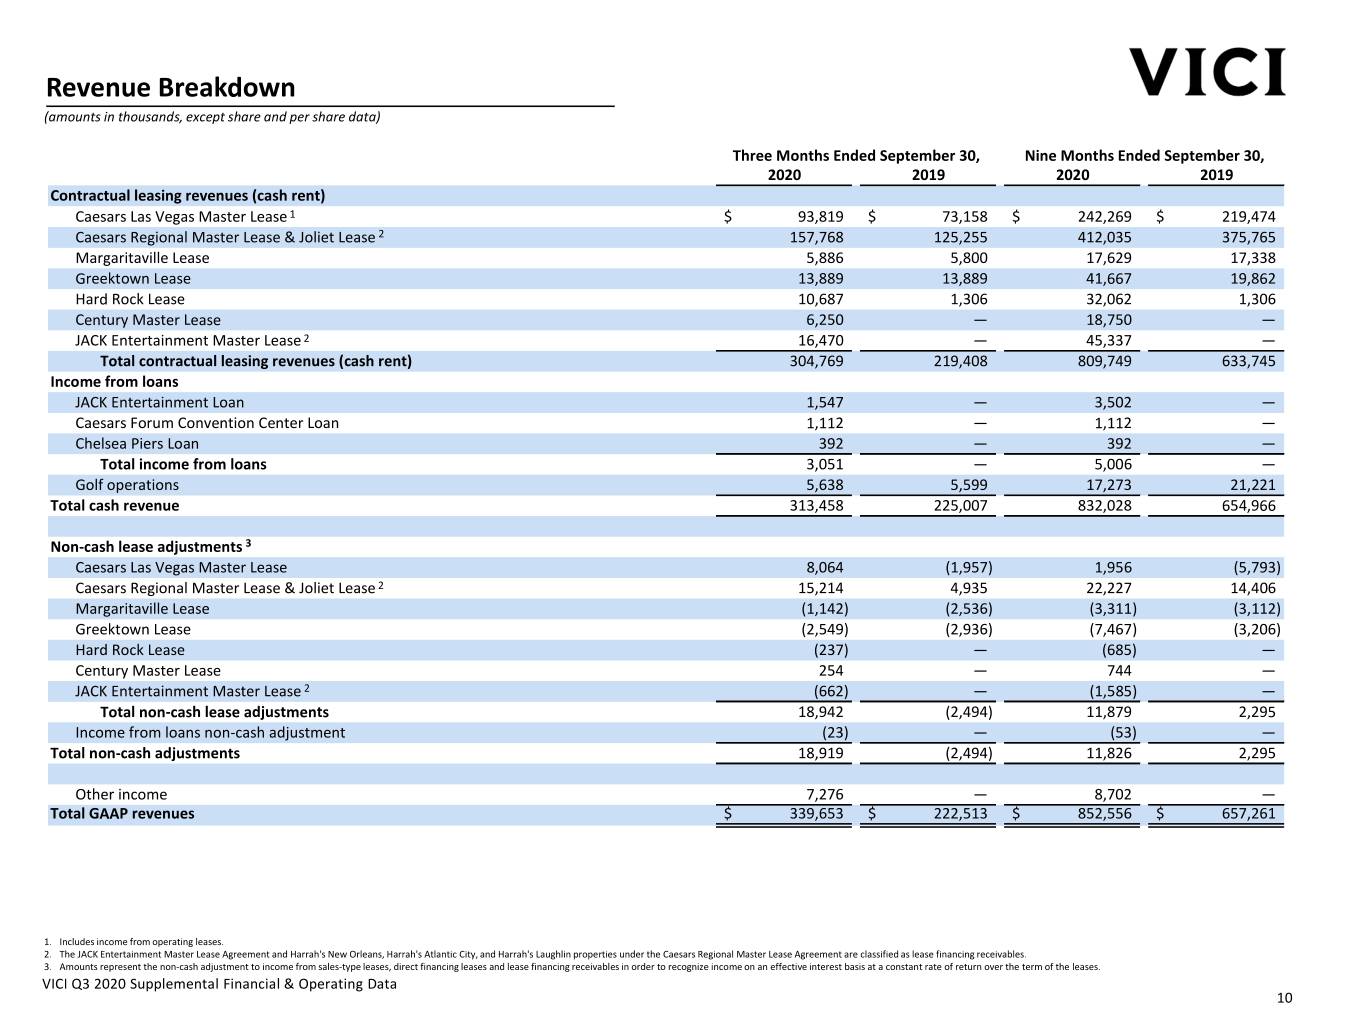
Revenue Breakdown (amounts in thousands, except share and per share data) Three Months Ended September 30, Nine Months Ended September 30, 2020 2019 2020 2019 Contractual leasing revenues (cash rent) Caesars Las Vegas Master Lease 1 $ 93,819 $ 73,158 $ 242,269 $ 219,474 Caesars Regional Master Lease & Joliet Lease 2 157,768 125,255 412,035 375,765 Margaritaville Lease 5,886 5,800 17,629 17,338 Greektown Lease 13,889 13,889 41,667 19,862 Hard Rock Lease 10,687 1,306 32,062 1,306 Century Master Lease 6,250 — 18,750 — JACK Entertainment Master Lease 2 16,470 — 45,337 — Total contractual leasing revenues (cash rent) 304,769 219,408 809,749 633,745 Income from loans JACK Entertainment Loan 1,547 — 3,502 — Caesars Forum Convention Center Loan 1,112 — 1,112 — Chelsea Piers Loan 392 — 392 — Total income from loans 3,051 — 5,006 — Golf operations 5,638 5,599 17,273 21,221 Total cash revenue 313,458 225,007 832,028 654,966 Non-cash lease adjustments 3 Caesars Las Vegas Master Lease 8,064 (1,957) 1,956 (5,793) Caesars Regional Master Lease & Joliet Lease 2 15,214 4,935 22,227 14,406 Margaritaville Lease (1,142) (2,536) (3,311) (3,112) Greektown Lease (2,549) (2,936) (7,467) (3,206) Hard Rock Lease (237) — (685) — Century Master Lease 254 — 744 — JACK Entertainment Master Lease 2 (662) — (1,585) — Total non-cash lease adjustments 18,942 (2,494) 11,879 2,295 Income from loans non-cash adjustment (23) — (53) — Total non-cash adjustments 18,919 (2,494) 11,826 2,295 Other income 7,276 — 8,702 — Total GAAP revenues $ 339,653 $ 222,513 $ 852,556 $ 657,261 1. Includes income from operating leases. 2. The JACK Entertainment Master Lease Agreement and Harrah's New Orleans, Harrah's Atlantic City, and Harrah's Laughlin properties under the Caesars Regional Master Lease Agreement are classified as lease financing receivables. 3. Amounts represent the non-cash adjustment to income from sales-type leases, direct financing leases and lease financing receivables in order to recognize income on an effective interest basis at a constant rate of return over the term of the leases. VICI Q3 2020 Supplemental Financial & Operating Data 10
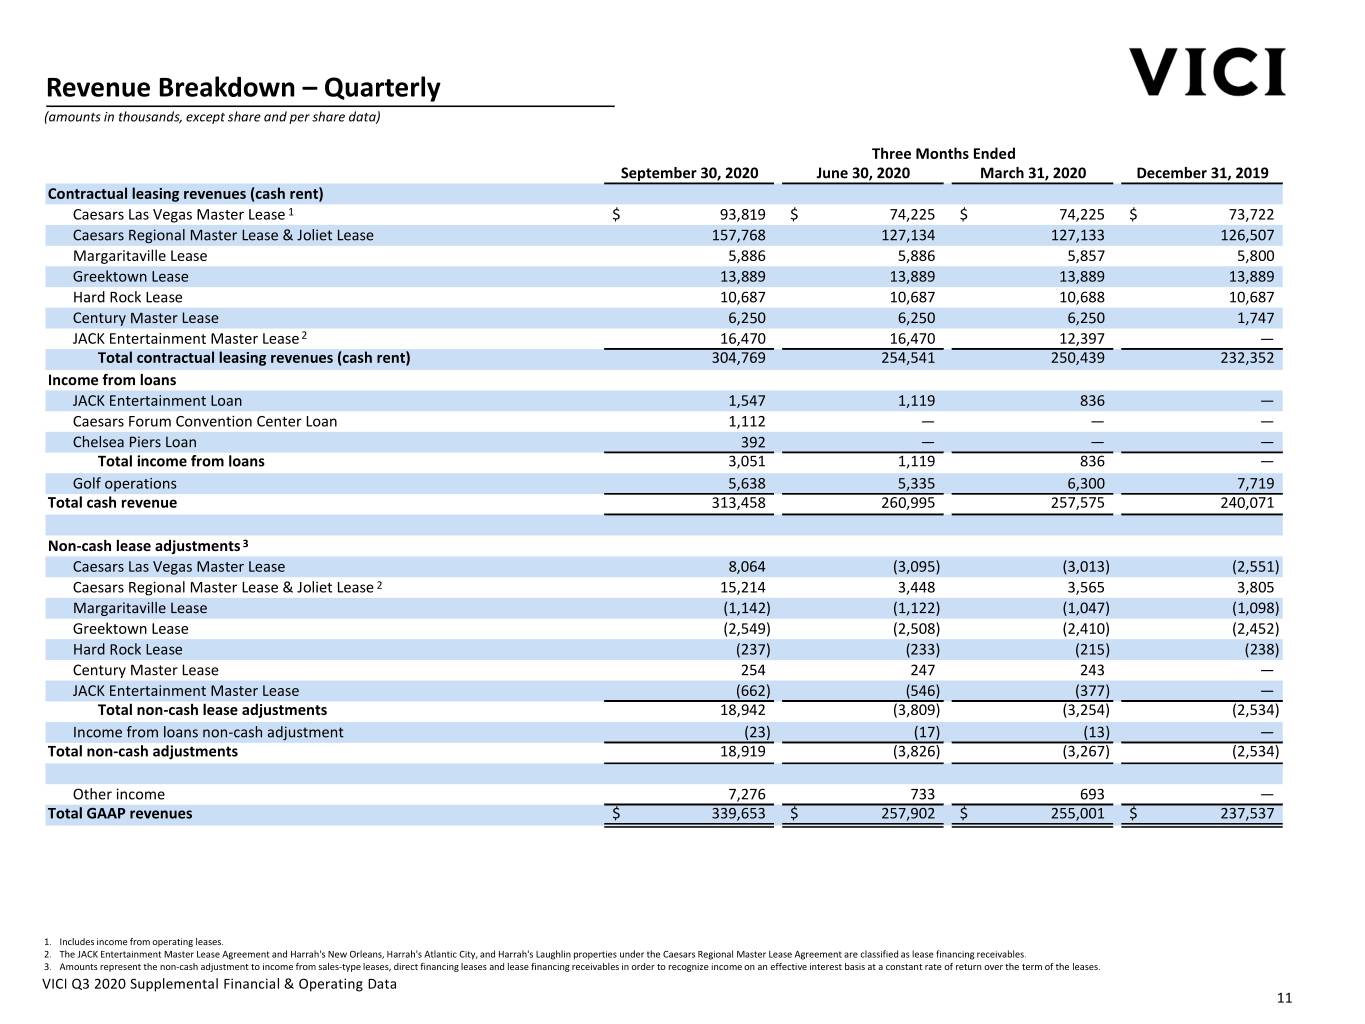
Revenue Breakdown – Quarterly (amounts in thousands, except share and per share data) Three Months Ended September 30, 2020 June 30, 2020 March 31, 2020 December 31, 2019 Contractual leasing revenues (cash rent) Caesars Las Vegas Master Lease 1 $ 93,819 $ 74,225 $ 74,225 $ 73,722 Caesars Regional Master Lease & Joliet Lease 2 157,768 127,134 127,133 126,507 Margaritaville Lease 5,886 5,886 5,857 5,800 Greektown Lease 13,889 13,889 13,889 13,889 Hard Rock Lease 10,687 10,687 10,688 10,687 Century Master Lease 6,250 6,250 6,250 1,747 JACK Entertainment Master Lease 2 16,470 16,470 12,397 — Total contractual leasing revenues (cash rent) 304,769 254,541 250,439 232,352 Income from loans JACK Entertainment Loan 1,547 1,119 836 — Caesars Forum Convention Center Loan 1,112 — — — Chelsea Piers Loan 392 — — — Total income from loans 3,051 1,119 836 — Golf operations 5,638 5,335 6,300 7,719 Total cash revenue 313,458 260,995 257,575 240,071 Non-cash lease adjustments 3 Caesars Las Vegas Master Lease 8,064 (3,095) (3,013) (2,551) Caesars Regional Master Lease & Joliet Lease 2 15,214 3,448 3,565 3,805 Margaritaville Lease (1,142) (1,122) (1,047) (1,098) Greektown Lease (2,549) (2,508) (2,410) (2,452) Hard Rock Lease (237) (233) (215) (238) Century Master Lease 254 247 243 — JACK Entertainment Master Lease 2 (662) (546) (377) — Total non-cash lease adjustments 18,942 (3,809) (3,254) (2,534) Income from loans non-cash adjustment (23) (17) (13) — Total non-cash adjustments 18,919 (3,826) (3,267) (2,534) Other income 7,276 733 693 — Total GAAP revenues $ 339,653 $ 257,902 $ 255,001 $ 237,537 1. Includes income from operating leases. 2. The JACK Entertainment Master Lease Agreement and Harrah's New Orleans, Harrah's Atlantic City, and Harrah's Laughlin properties under the Caesars Regional Master Lease Agreement are classified as lease financing receivables. 3. Amounts represent the non-cash adjustment to income from sales-type leases, direct financing leases and lease financing receivables in order to recognize income on an effective interest basis at a constant rate of return over the term of the leases. VICI Q3 2020 Supplemental Financial & Operating Data 11
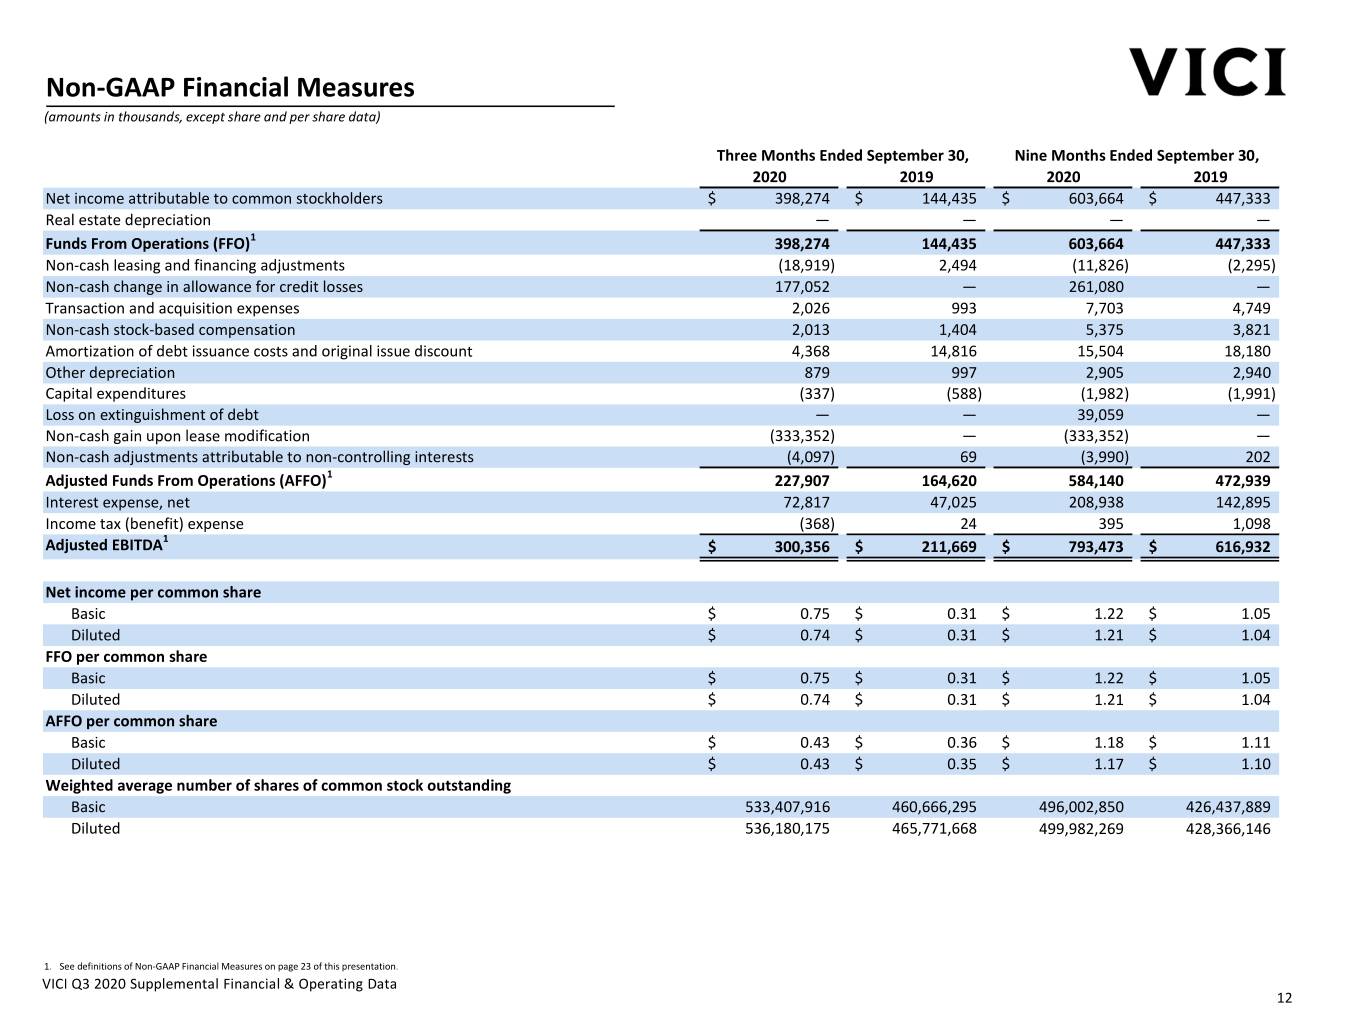
Non‐GAAP Financial Measures (amounts in thousands, except share and per share data) Three Months Ended September 30, Nine Months Ended September 30, 2020 2019 2020 2019 Net income attributable to common stockholders $ 398,274 $ 144,435 $ 603,664 $ 447,333 Real estate depreciation — — — — Funds From Operations (FFO)1 398,274 144,435 603,664 447,333 Non-cash leasing and financing adjustments (18,919) 2,494 (11,826) (2,295) Non-cash change in allowance for credit losses 177,052 — 261,080 — Transaction and acquisition expenses 2,026 993 7,703 4,749 Non-cash stock-based compensation 2,013 1,404 5,375 3,821 Amortization of debt issuance costs and original issue discount 4,368 14,816 15,504 18,180 Other depreciation 879 997 2,905 2,940 Capital expenditures (337) (588) (1,982) (1,991) Loss on extinguishment of debt — — 39,059 — Non-cash gain upon lease modification (333,352) — (333,352) — Non-cash adjustments attributable to non-controlling interests (4,097) 69 (3,990) 202 Adjusted Funds From Operations (AFFO)1 227,907 164,620 584,140 472,939 Interest expense, net 72,817 47,025 208,938 142,895 Income tax (benefit) expense (368) 24 395 1,098 1 Adjusted EBITDA $ 300,356 $ 211,669 $ 793,473 $ 616,932 Net income per common share Basic $ 0.75 $ 0.31 $ 1.22 $ 1.05 Diluted $ 0.74 $ 0.31 $ 1.21 $ 1.04 FFO per common share Basic $ 0.75 $ 0.31 $ 1.22 $ 1.05 Diluted $ 0.74 $ 0.31 $ 1.21 $ 1.04 AFFO per common share Basic $ 0.43 $ 0.36 $ 1.18 $ 1.11 Diluted $ 0.43 $ 0.35 $ 1.17 $ 1.10 Weighted average number of shares of common stock outstanding Basic 533,407,916 460,666,295 496,002,850 426,437,889 Diluted 536,180,175 465,771,668 499,982,269 428,366,146 1. See definitions of Non-GAAP Financial Measures on page 23 of this presentation. VICI Q3 2020 Supplemental Financial & Operating Data 12
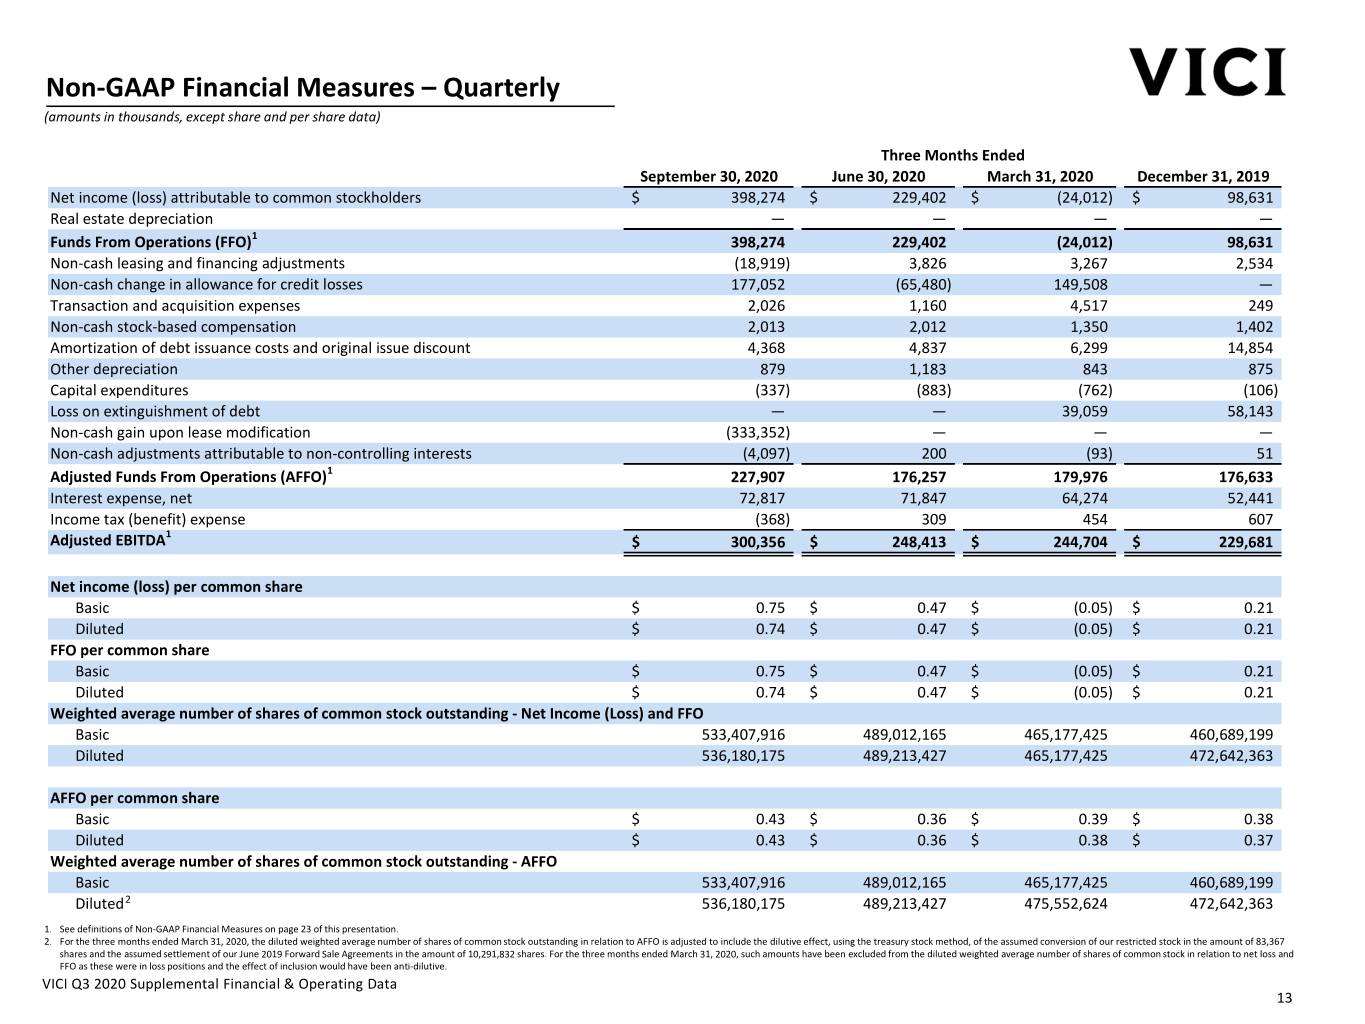
Non‐GAAP Financial Measures – Quarterly (amounts in thousands, except share and per share data) Three Months Ended September 30, 2020 June 30, 2020 March 31, 2020 December 31, 2019 Net income (loss) attributable to common stockholders $ 398,274 $ 229,402 $ (24,012) $ 98,631 Real estate depreciation — — — — Funds From Operations (FFO)1 398,274 229,402 (24,012) 98,631 Non-cash leasing and financing adjustments (18,919) 3,826 3,267 2,534 Non-cash change in allowance for credit losses 177,052 (65,480) 149,508 — Transaction and acquisition expenses 2,026 1,160 4,517 249 Non-cash stock-based compensation 2,013 2,012 1,350 1,402 Amortization of debt issuance costs and original issue discount 4,368 4,837 6,299 14,854 Other depreciation 879 1,183 843 875 Capital expenditures (337) (883) (762) (106) Loss on extinguishment of debt — — 39,059 58,143 Non-cash gain upon lease modification (333,352) — — — Non-cash adjustments attributable to non-controlling interests (4,097) 200 (93) 51 Adjusted Funds From Operations (AFFO)1 227,907 176,257 179,976 176,633 Interest expense, net 72,817 71,847 64,274 52,441 Income tax (benefit) expense (368) 309 454 607 1 Adjusted EBITDA $ 300,356 $ 248,413 $ 244,704 $ 229,681 Net income (loss) per common share Basic $ 0.75 $ 0.47 $ (0.05) $ 0.21 Diluted $ 0.74 $ 0.47 $ (0.05) $ 0.21 FFO per common share Basic $ 0.75 $ 0.47 $ (0.05) $ 0.21 Diluted $ 0.74 $ 0.47 $ (0.05) $ 0.21 Weighted average number of shares of common stock outstanding - Net Income (Loss) and FFO Basic 533,407,916 489,012,165 465,177,425 460,689,199 Diluted 536,180,175 489,213,427 465,177,425 472,642,363 AFFO per common share Basic $ 0.43 $ 0.36 $ 0.39 $ 0.38 Diluted $ 0.43 $ 0.36 $ 0.38 $ 0.37 Weighted average number of shares of common stock outstanding - AFFO Basic 533,407,916 489,012,165 465,177,425 460,689,199 Diluted2 536,180,175 489,213,427 475,552,624 472,642,363 1. See definitions of Non-GAAP Financial Measures on page 23 of this presentation. 2. For the three months ended March 31, 2020, the diluted weighted average number of shares of common stock outstanding in relation to AFFO is adjusted to include the dilutive effect, using the treasury stock method, of the assumed conversion of our restricted stock in the amount of 83,367 shares and the assumed settlement of our June 2019 Forward Sale Agreements in the amount of 10,291,832 shares. For the three months ended March 31, 2020, such amounts have been excluded from the diluted weighted average number of shares of common stock in relation to net loss and FFO as these were in loss positions and the effect of inclusion would have been anti-dilutive. VICI Q3 2020 Supplemental Financial & Operating Data 13
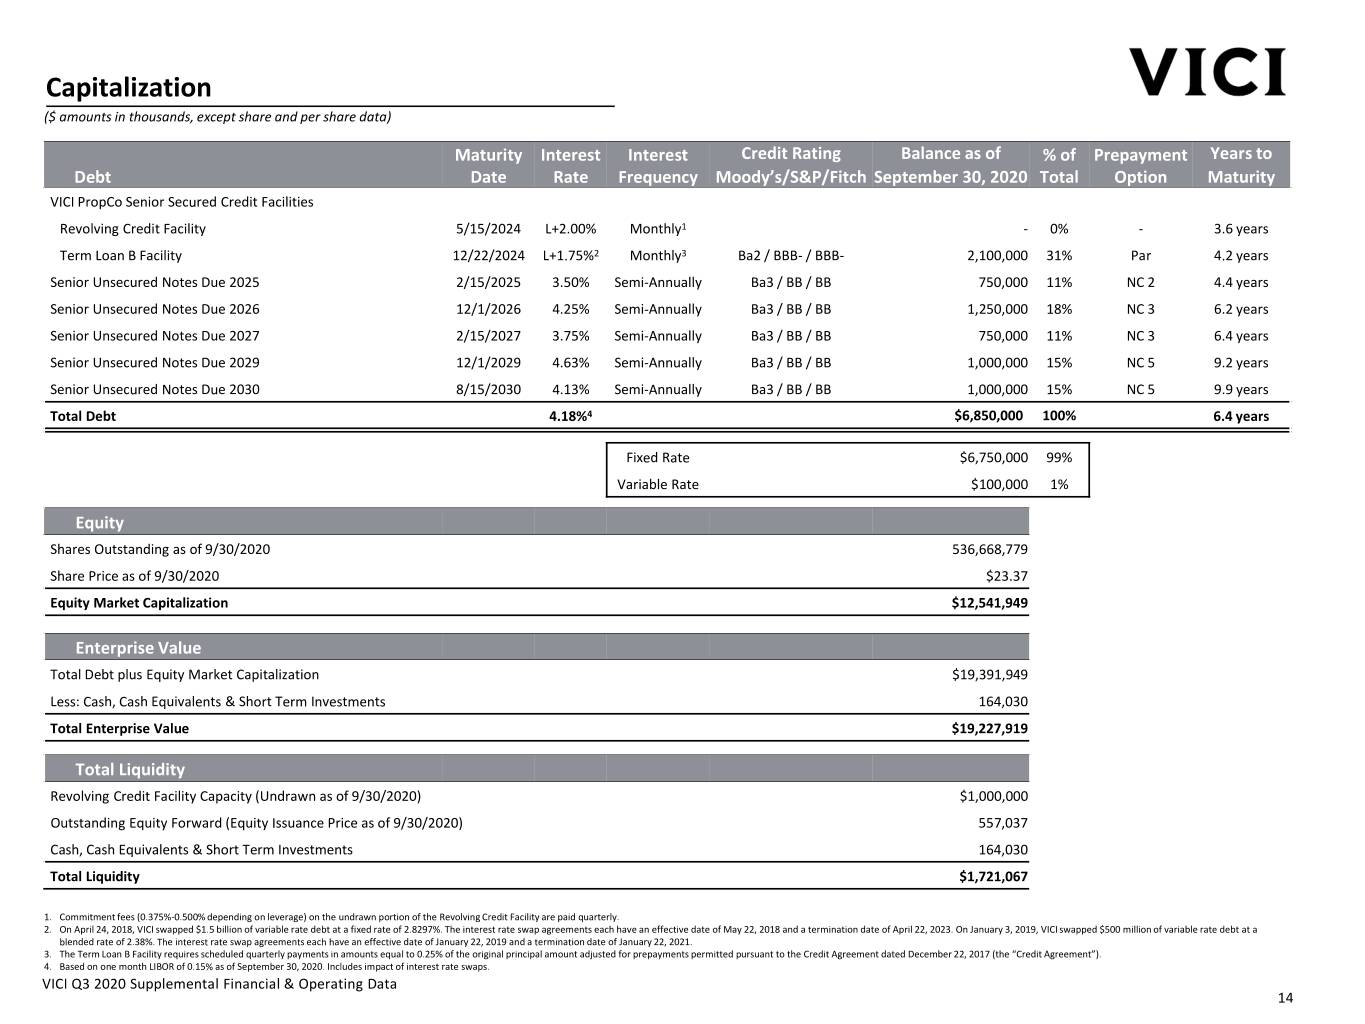
Capitalization ($ amounts in thousands, except share and per share data) Maturity Interest Interest Credit Rating Balance as of % of Prepayment Years to Debt Date Rate Frequency Moody’s/S&P/Fitch September 30, 2020 Total Option Maturity VICI PropCo Senior Secured Credit Facilities Revolving Credit Facility 5/15/2024 L+2.00% Monthly1 - 0% ‐ 3.6 years Term Loan B Facility 12/22/2024 L+1.75%2 Monthly3 Ba2 / BBB- / BBB- 2,100,000 31% Par 4.2 years Senior Unsecured Notes Due 2025 2/15/2025 3.50% Semi-Annually Ba3 / BB / BB 750,000 11% NC 2 4.4 years Senior Unsecured Notes Due 2026 12/1/2026 4.25% Semi‐Annually Ba3 / BB / BB 1,250,000 18% NC 3 6.2 years Senior Unsecured Notes Due 2027 2/15/2027 3.75% Semi-Annually Ba3 / BB / BB 750,000 11% NC 3 6.4 years Senior Unsecured Notes Due 2029 12/1/2029 4.63% Semi‐Annually Ba3 / BB / BB 1,000,000 15% NC 5 9.2 years Senior Unsecured Notes Due 2030 8/15/2030 4.13% Semi-Annually Ba3 / BB / BB 1,000,000 15% NC 5 9.9 years Total Debt 4.18%4 $6,850,000 100% 6.4 years Fixed Rate $6,750,000 99% Variable Rate $100,000 1% Equity Shares Outstanding as of 9/30/2020 536,668,779 Share Price as of 9/30/2020 $23.37 Equity Market Capitalization $12,541,949 Enterprise Value Total Debt plus Equity Market Capitalization $19,391,949 Less: Cash, Cash Equivalents & Short Term Investments 164,030 Total Enterprise Value $19,227,919 Total Liquidity Revolving Credit Facility Capacity (Undrawn as of 9/30/2020) $1,000,000 Outstanding Equity Forward (Equity Issuance Price as of 9/30/2020) 557,037 Cash, Cash Equivalents & Short Term Investments 164,030 Total Liquidity $1,721,067 1. Commitment fees (0.375%-0.500% depending on leverage) on the undrawn portion of the Revolving Credit Facility are paid quarterly. 2. On April 24, 2018, VICI swapped $1.5 billion of variable rate debt at a fixed rate of 2.8297%. The interest rate swap agreements each have an effective date of May 22, 2018 and a termination date of April 22, 2023. On January 3, 2019, VICI swapped $500 million of variable rate debt at a blended rate of 2.38%. The interest rate swap agreements each have an effective date of January 22, 2019 and a termination date of January 22, 2021. 3. The Term Loan B Facility requires scheduled quarterly payments in amounts equal to 0.25% of the original principal amount adjusted for prepayments permitted pursuant to the Credit Agreement dated December 22, 2017 (the “Credit Agreement”). 4. Based on one month LIBOR of 0.15% as of September 30, 2020. Includes impact of interest rate swaps. VICI Q3 2020 Supplemental Financial & Operating Data 14
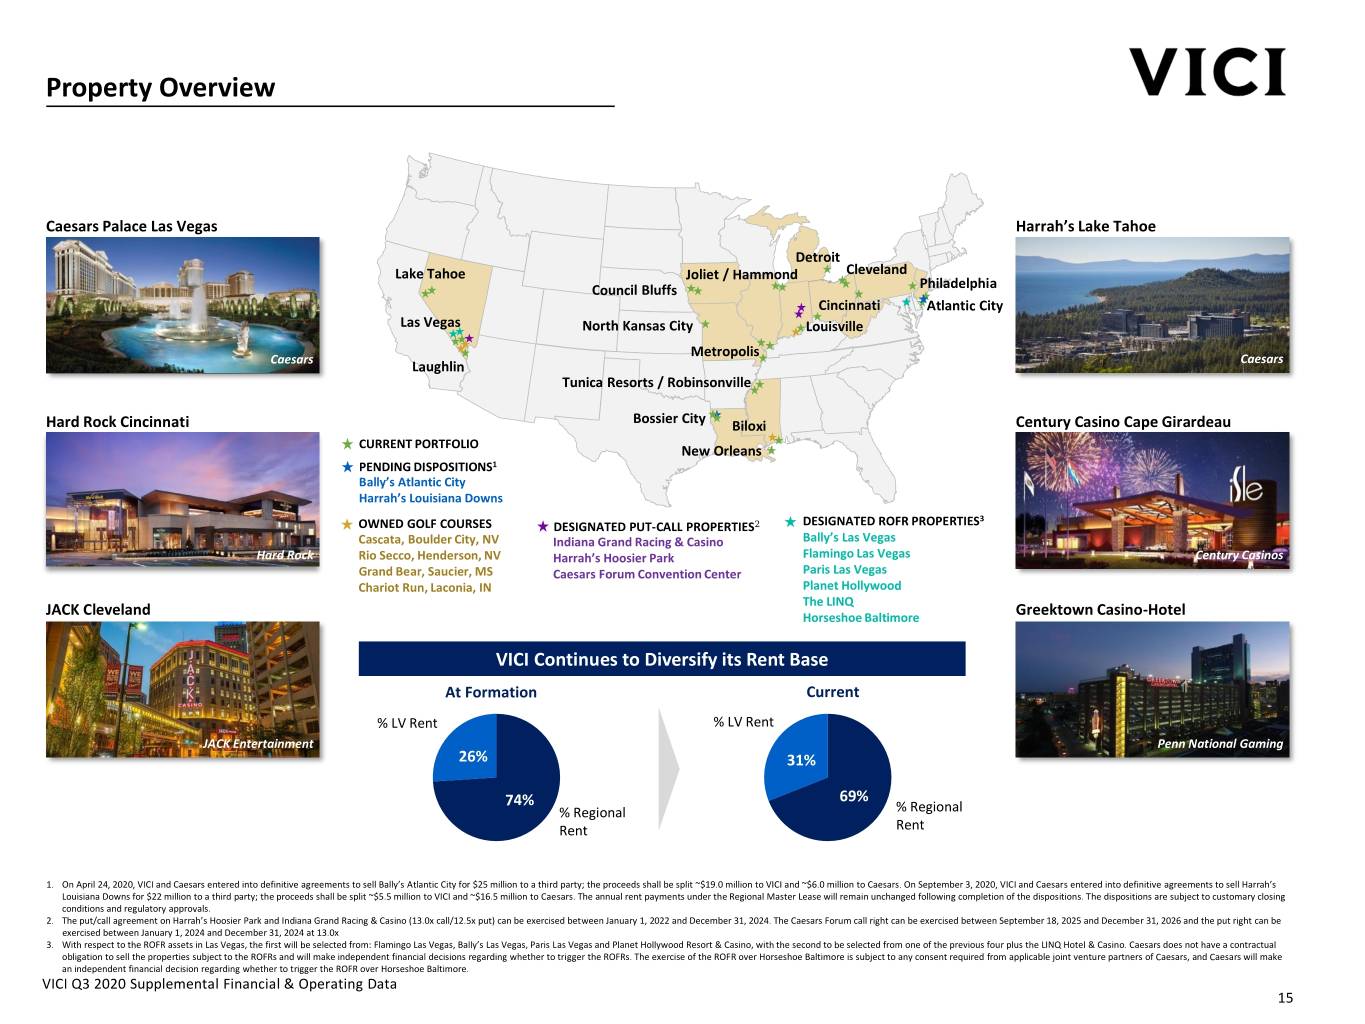
Property Overview Caesars Palace Las Vegas Harrah’s Lake Tahoe Detroit Lake Tahoe Joliet / Hammond Cleveland Council Bluffs Philadelphia Cincinnati Atlantic City Las Vegas North Kansas City Louisville Metropolis Caesars Caesars Laughlin Tunica Resorts / Robinsonville Bossier City Hard Rock Cincinnati Biloxi Century Casino Cape Girardeau CURRENT PORTFOLIO New Orleans PENDING DISPOSITIONS1 Bally’s Atlantic City Harrah’s Louisiana Downs 3 OWNED GOLF COURSES DESIGNATED PUT-CALL PROPERTIES2 DESIGNATED ROFR PROPERTIES Cascata, Boulder City, NV Indiana Grand Racing & Casino Bally’s Las Vegas Hard Rock Rio Secco, Henderson, NV Harrah’s Hoosier Park Flamingo Las Vegas Century Casinos Grand Bear, Saucier, MS Caesars Forum Convention Center Paris Las Vegas Chariot Run, Laconia, IN Planet Hollywood The LINQ JACK Cleveland Horseshoe Baltimore Greektown Casino-Hotel VICI Continues to Diversify its Rent Base At Formation Current % LV Rent % LV Rent JACK Entertainment Penn National Gaming 26% 31% 74% 69% % Regional % Regional Rent Rent 1. On April 24, 2020, VICI and Caesars entered into definitive agreements to sell Bally’s Atlantic City for $25 million to a third party; the proceeds shall be split ~$19.0 million to VICI and ~$6.0 million to Caesars. On September 3, 2020, VICI and Caesars entered into definitive agreements to sell Harrah’s Louisiana Downs for $22 million to a third party; the proceeds shall be split ~$5.5 million to VICI and ~$16.5 million to Caesars. The annual rent payments under the Regional Master Lease will remain unchanged following completion of the dispositions. The dispositions are subject to customary closing conditions and regulatory approvals. 2. The put/call agreement on Harrah’s Hoosier Park and Indiana Grand Racing & Casino (13.0x call/12.5x put) can be exercised between January 1, 2022 and December 31, 2024. The Caesars Forum call right can be exercised between September 18, 2025 and December 31, 2026 and the put right can be exercised between January 1, 2024 and December 31, 2024 at 13.0x 3. With respect to the ROFR assets in Las Vegas, the first will be selected from: Flamingo Las Vegas, Bally’s Las Vegas, Paris Las Vegas and Planet Hollywood Resort & Casino, with the second to be selected from one of the previous four plus the LINQ Hotel & Casino. Caesars does not have a contractual obligation to sell the properties subject to the ROFRs and will make independent financial decisions regarding whether to trigger the ROFRs. The exercise of the ROFR over Horseshoe Baltimore is subject to any consent required from applicable joint venture partners of Caesars, and Caesars will make an independent financial decision regarding whether to trigger the ROFR over Horseshoe Baltimore. VICI Q3 2020 Supplemental Financial & Operating Data 15
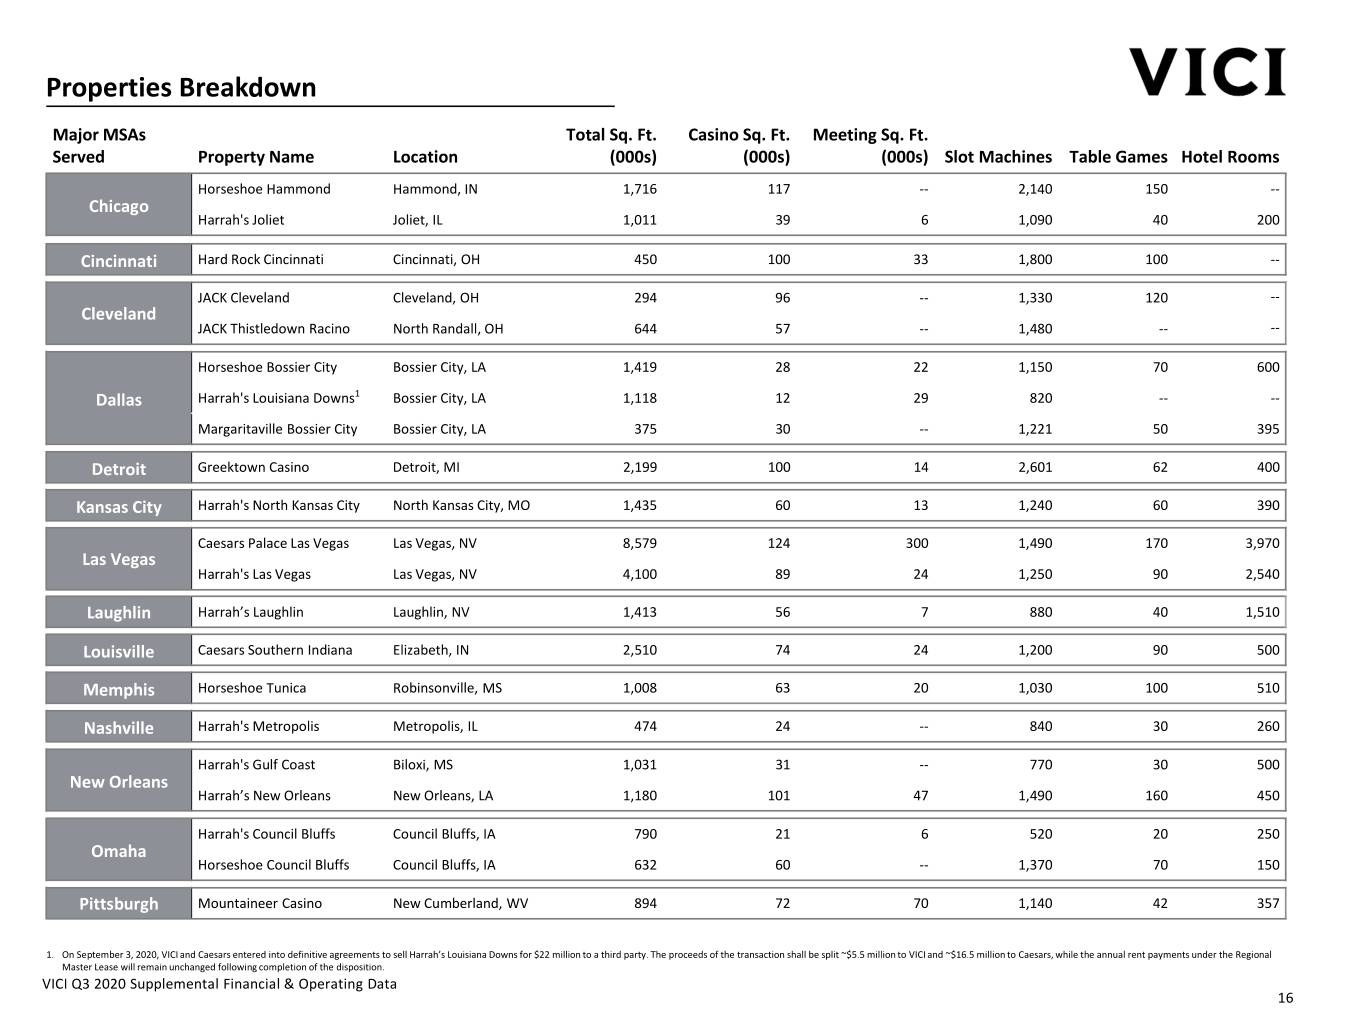
Properties Breakdown Major MSAs Total Sq. Ft. Casino Sq. Ft. Meeting Sq. Ft. Served Property Name Location (000s) (000s) (000s) Slot Machines Table Games Hotel Rooms Horseshoe Hammond Hammond, IN 1,716 117 -- 2,140 150 -- Chicago Harrah's Joliet Joliet, IL 1,011 39 6 1,090 40 200 Cincinnati Hard Rock Cincinnati Cincinnati, OH 450 100 33 1,800 100 -- JACK Cleveland Cleveland, OH 294 96 -- 1,330 120 -- Cleveland JACK Thistledown Racino North Randall, OH 644 57 -- 1,480 -- -- Horseshoe Bossier City Bossier City, LA 1,419 28 22 1,150 70 600 Dallas Harrah's Louisiana Downs1 Bossier City, LA 1,118 12 29 820 -- -- Margaritaville Bossier City Bossier City, LA 375 30 -- 1,221 50 395 Detroit Greektown Casino Detroit, MI 2,199 100 14 2,601 62 400 Kansas City Harrah's North Kansas City North Kansas City, MO 1,435 60 13 1,240 60 390 Caesars Palace Las Vegas Las Vegas, NV 8,579 124 300 1,490 170 3,970 Las Vegas Harrah's Las Vegas Las Vegas, NV 4,100 89 24 1,250 90 2,540 Laughlin Harrah’s Laughlin Laughlin, NV 1,413 56 7 880 40 1,510 Louisville Caesars Southern Indiana Elizabeth, IN 2,510 74 24 1,200 90 500 Memphis Horseshoe Tunica Robinsonville, MS 1,008 63 20 1,030 100 510 Nashville Harrah's Metropolis Metropolis, IL 474 24 -- 840 30 260 Harrah's Gulf Coast Biloxi, MS 1,031 31 -- 770 30 500 New Orleans Harrah’s New Orleans New Orleans, LA 1,180 101 47 1,490 160 450 Harrah's Council Bluffs Council Bluffs, IA 790 21 6 520 20 250 Omaha Horseshoe Council Bluffs Council Bluffs, IA 632 60 -- 1,370 70 150 Pittsburgh Mountaineer Casino New Cumberland, WV 894 72 70 1,140 42 357 1. On September 3, 2020, VICI and Caesars entered into definitive agreements to sell Harrah’s Louisiana Downs for $22 million to a third party. The proceeds of the transaction shall be split ~$5.5 million to VICI and ~$16.5 million to Caesars, while the annual rent payments under the Regional Master Lease will remain unchanged following completion of the disposition. VICI Q3 2020 Supplemental Financial & Operating Data 16
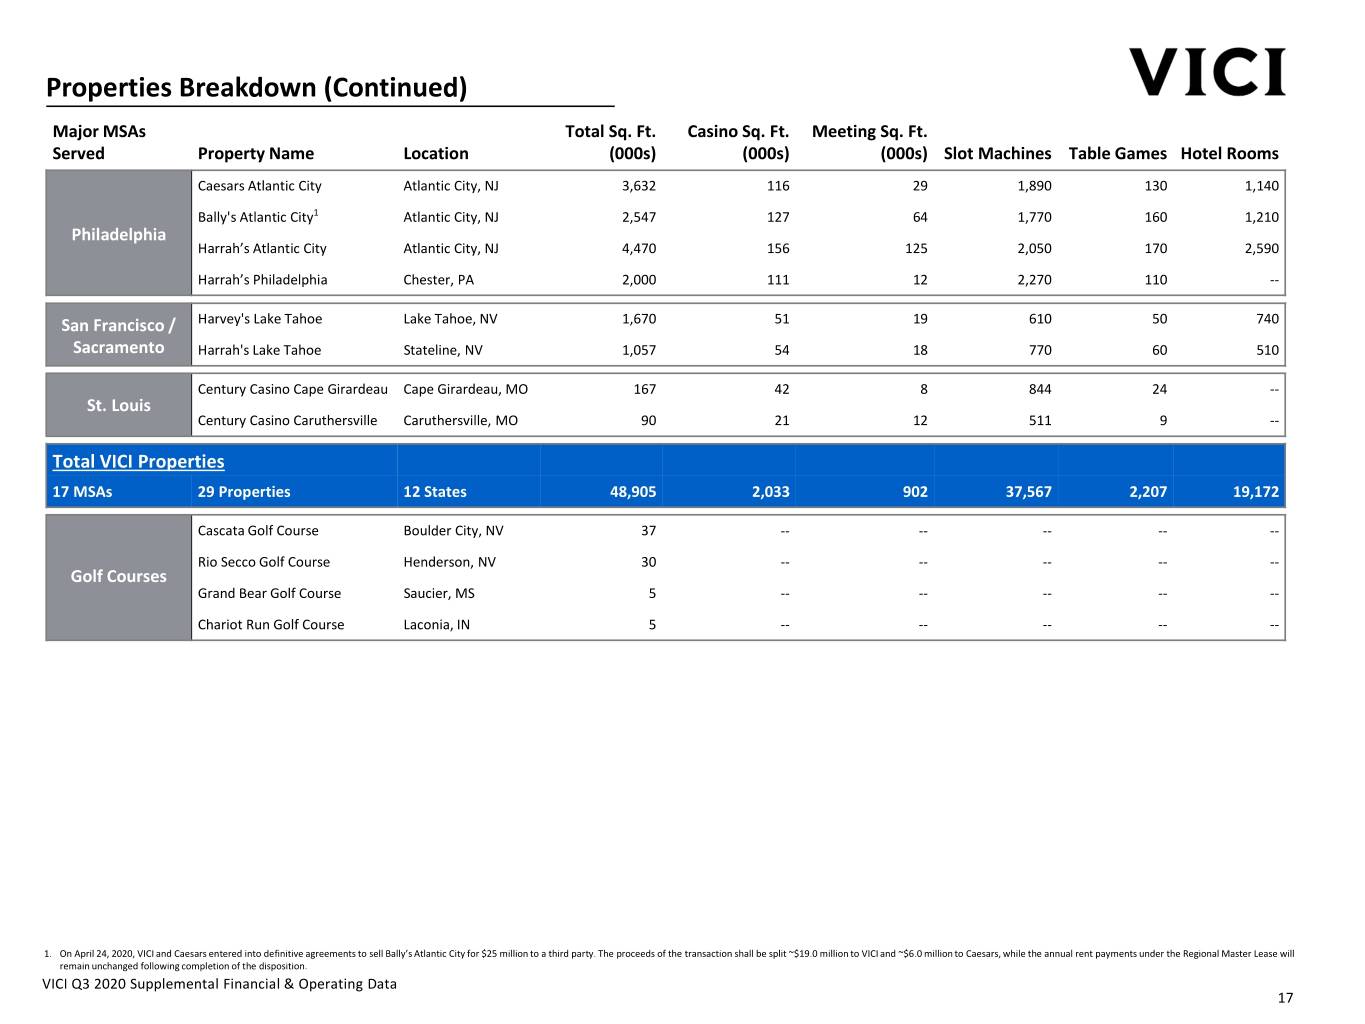
Properties Breakdown (Continued) Major MSAs Total Sq. Ft. Casino Sq. Ft. Meeting Sq. Ft. Served Property Name Location (000s) (000s) (000s) Slot Machines Table Games Hotel Rooms Caesars Atlantic City Atlantic City, NJ 3,632 116 29 1,890 130 1,140 Bally's Atlantic City1 Atlantic City, NJ 2,547 127 64 1,770 160 1,210 Philadelphia Harrah’s Atlantic City Atlantic City, NJ 4,470 156 125 2,050 170 2,590 Harrah’s Philadelphia Chester, PA 2,000 111 12 2,270 110 -- San Francisco / Harvey's Lake Tahoe Lake Tahoe, NV 1,670 51 19 610 50 740 Sacramento Harrah's Lake Tahoe Stateline, NV 1,057 54 18 770 60 510 Century Casino Cape Girardeau Cape Girardeau, MO 167 42 8 844 24 -- St. Louis Century Casino Caruthersville Caruthersville, MO 90 21 12 511 9 -- Total VICI Properties 17 MSAs 29 Properties 12 States 48,905 2,033 902 37,567 2,207 19,172 Cascata Golf Course Boulder City, NV 37 -- -- -- -- -- Rio Secco Golf Course Henderson, NV 30 -- -- -- -- -- Golf Courses Grand Bear Golf Course Saucier, MS 5 -- -- -- -- -- Chariot Run Golf Course Laconia, IN 5 -- -- -- -- -- 1. On April 24, 2020, VICI and Caesars entered into definitive agreements to sell Bally’s Atlantic City for $25 million to a third party. The proceeds of the transaction shall be split ~$19.0 million to VICI and ~$6.0 million to Caesars, while the annual rent payments under the Regional Master Lease will remain unchanged following completion of the disposition. VICI Q3 2020 Supplemental Financial & Operating Data 17
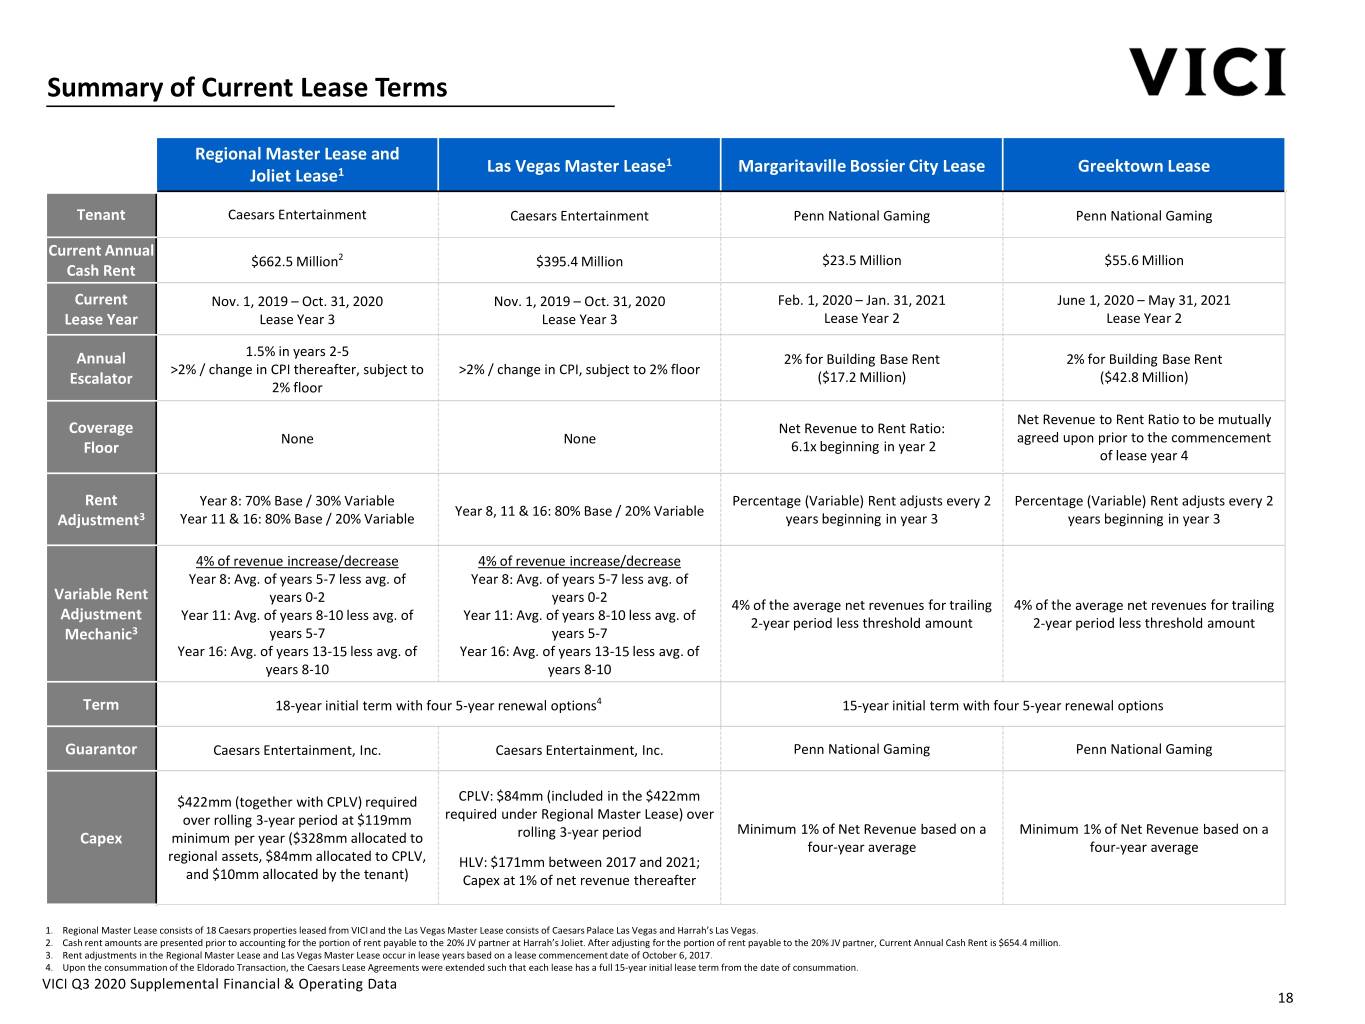
Summary of Current Lease Terms Regional Master Lease and Las Vegas Master Lease1 Margaritaville Bossier City Lease Greektown Lease Joliet Lease1 Tenant Caesars Entertainment Caesars Entertainment Penn National Gaming Penn National Gaming Current Annual 2 $23.5 Million $55.6 Million Cash Rent $662.5 Million $395.4 Million Current Nov. 1, 2019 – Oct. 31, 2020 Nov. 1, 2019 – Oct. 31, 2020 Feb. 1, 2020 – Jan. 31, 2021 June 1, 2020 – May 31, 2021 Lease Year Lease Year 3 Lease Year 3 Lease Year 2 Lease Year 2 1.5% in years 2-5 Annual 2% for Building Base Rent 2% for Building Base Rent >2% / change in CPI thereafter, subject to >2% / change in CPI, subject to 2% floor Escalator ($17.2 Million) ($42.8 Million) 2% floor Net Revenue to Rent Ratio to be mutually Coverage Net Revenue to Rent Ratio: None None agreed upon prior to the commencement Floor 6.1x beginning in year 2 of lease year 4 Rent Year 8: 70% Base / 30% Variable Percentage (Variable) Rent adjusts every 2 Percentage (Variable) Rent adjusts every 2 Year 8, 11 & 16: 80% Base / 20% Variable Adjustment3 Year 11 & 16: 80% Base / 20% Variable years beginning in year 3 years beginning in year 3 4% of revenue increase/decrease 4% of revenue increase/decrease Year 8: Avg. of years 5-7 less avg. of Year 8: Avg. of years 5-7 less avg. of Variable Rent years 0-2 years 0-2 4% of the average net revenues for trailing 4% of the average net revenues for trailing Adjustment Year 11: Avg. of years 8-10 less avg. of Year 11: Avg. of years 8-10 less avg. of 2-year period less threshold amount 2-year period less threshold amount Mechanic3 years 5-7 years 5-7 Year 16: Avg. of years 13-15 less avg. of Year 16: Avg. of years 13-15 less avg. of years 8-10 years 8-10 Term 18-year initial term with four 5-year renewal options4 15-year initial term with four 5-year renewal options Guarantor Caesars Entertainment, Inc. Caesars Entertainment, Inc. Penn National Gaming Penn National Gaming $422mm (together with CPLV) required CPLV: $84mm (included in the $422mm over rolling 3-year period at $119mm required under Regional Master Lease) over Minimum 1% of Net Revenue based on a Minimum 1% of Net Revenue based on a Capex minimum per year ($328mm allocated to rolling 3-year period four-year average four-year average regional assets, $84mm allocated to CPLV, HLV: $171mm between 2017 and 2021; and $10mm allocated by the tenant) Capex at 1% of net revenue thereafter 1. Regional Master Lease consists of 18 Caesars properties leased from VICI and the Las Vegas Master Lease consists of Caesars Palace Las Vegas and Harrah’s Las Vegas. 2. Cash rent amounts are presented prior to accounting for the portion of rent payable to the 20% JV partner at Harrah’s Joliet. After adjusting for the portion of rent payable to the 20% JV partner, Current Annual Cash Rent is $654.4 million. 3. Rent adjustments in the Regional Master Lease and Las Vegas Master Lease occur in lease years based on a lease commencement date of October 6, 2017. 4. Upon the consummation of the Eldorado Transaction, the Caesars Lease Agreements were extended such that each lease has a full 15-year initial lease term from the date of consummation. VICI Q3 2020 Supplemental Financial & Operating Data 18
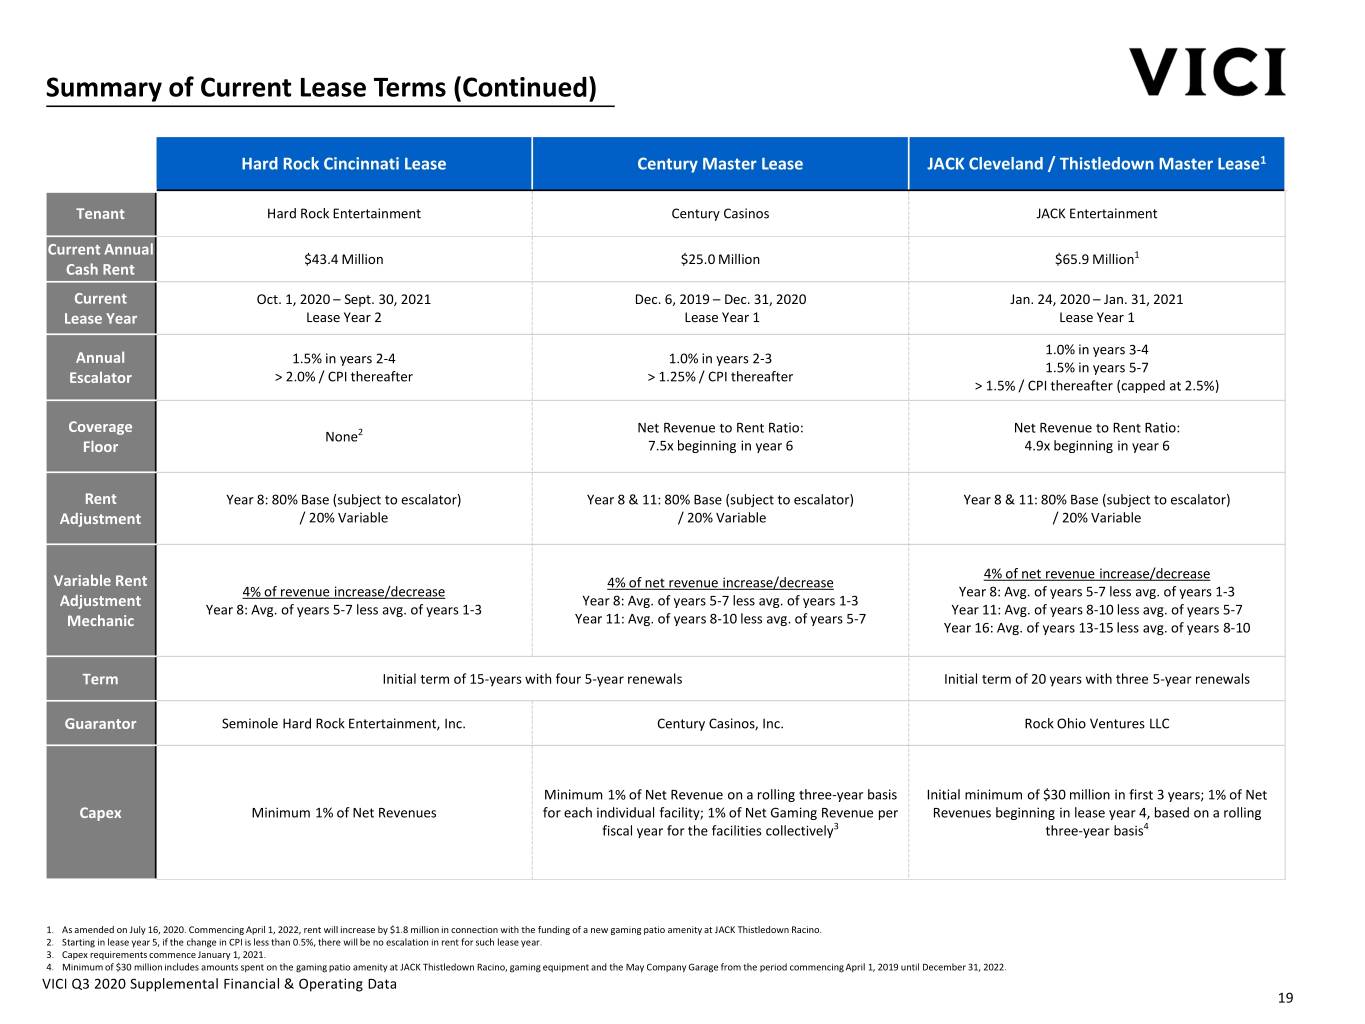
Summary of Current Lease Terms (Continued) Hard Rock Cincinnati Lease Century Master Lease JACK Cleveland / Thistledown Master Lease1 Tenant Hard Rock Entertainment Century Casinos JACK Entertainment Current Annual $43.4 Million $25.0 Million $65.9 Million1 Cash Rent Current Oct. 1, 2020 – Sept. 30, 2021 Dec. 6, 2019 – Dec. 31, 2020 Jan. 24, 2020 – Jan. 31, 2021 Lease Year Lease Year 2 Lease Year 1 Lease Year 1 1.0% in years 3-4 Annual 1.5% in years 2-4 1.0% in years 2-3 1.5% in years 5-7 Escalator > 2.0% / CPI thereafter > 1.25% / CPI thereafter > 1.5% / CPI thereafter (capped at 2.5%) Coverage Net Revenue to Rent Ratio: Net Revenue to Rent Ratio: None2 Floor 7.5x beginning in year 6 4.9x beginning in year 6 Rent Year 8: 80% Base (subject to escalator) Year 8 & 11: 80% Base (subject to escalator) Year 8 & 11: 80% Base (subject to escalator) Adjustment / 20% Variable / 20% Variable / 20% Variable 4% of net revenue increase/decrease Variable Rent 4% of net revenue increase/decrease 4% of revenue increase/decrease Year 8: Avg. of years 5-7 less avg. of years 1-3 Adjustment Year 8: Avg. of years 5-7 less avg. of years 1-3 Year 8: Avg. of years 5-7 less avg. of years 1-3 Year 11: Avg. of years 8-10 less avg. of years 5-7 Year 11: Avg. of years 8-10 less avg. of years 5-7 Mechanic Year 16: Avg. of years 13-15 less avg. of years 8-10 Term Initial term of 15-years with four 5-year renewals Initial term of 20 years with three 5-year renewals Guarantor Seminole Hard Rock Entertainment, Inc. Century Casinos, Inc. Rock Ohio Ventures LLC Minimum 1% of Net Revenue on a rolling three-year basis Initial minimum of $30 million in first 3 years; 1% of Net Capex Minimum 1% of Net Revenues for each individual facility; 1% of Net Gaming Revenue per Revenues beginning in lease year 4, based on a rolling fiscal year for the facilities collectively3 three-year basis4 1. As amended on July 16, 2020. Commencing April 1, 2022, rent will increase by $1.8 million in connection with the funding of a new gaming patio amenity at JACK Thistledown Racino. 2. Starting in lease year 5, if the change in CPI is less than 0.5%, there will be no escalation in rent for such lease year. 3. Capex requirements commence January 1, 2021. 4. Minimum of $30 million includes amounts spent on the gaming patio amenity at JACK Thistledown Racino, gaming equipment and the May Company Garage from the period commencing April 1, 2019 until December 31, 2022. VICI Q3 2020 Supplemental Financial & Operating Data 19
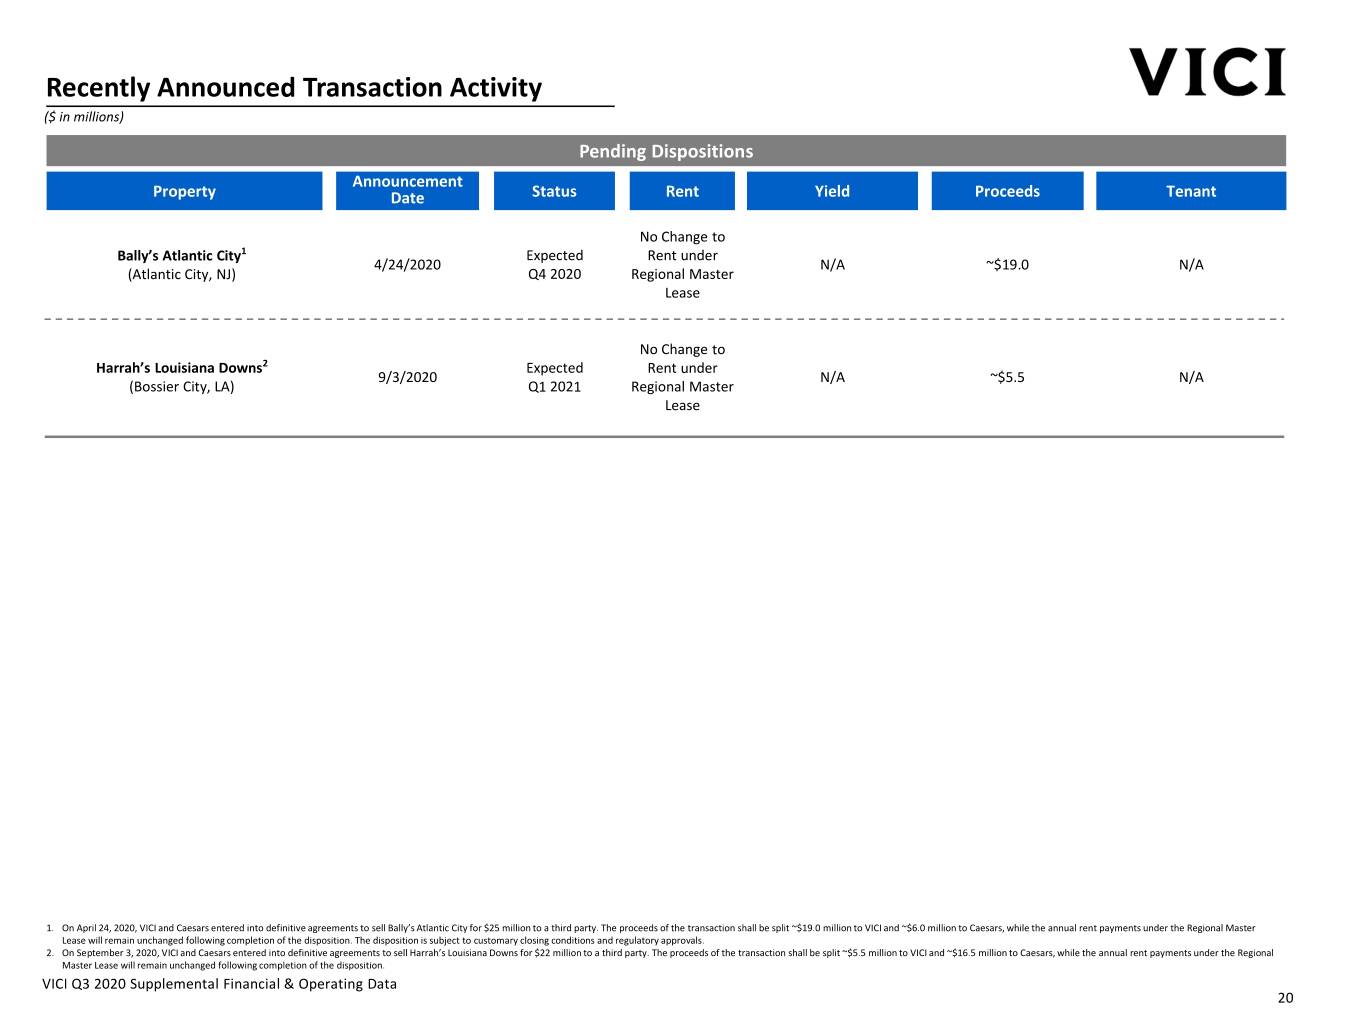
Recently Announced Transaction Activity ($ in millions) Pending Dispositions Announcement Property Date Status Rent Yield Proceeds Tenant No Change to Bally’s Atlantic City1 Expected Rent under 4/24/2020 N/A ~$19.0 N/A (Atlantic City, NJ) Q4 2020 Regional Master Lease No Change to Harrah’s Louisiana Downs2 Expected Rent under 9/3/2020 N/A ~$5.5 N/A (Bossier City, LA) Q1 2021 Regional Master Lease 1. On April 24, 2020, VICI and Caesars entered into definitive agreements to sell Bally’s Atlantic City for $25 million to a third party. The proceeds of the transaction shall be split ~$19.0 million to VICI and ~$6.0 million to Caesars, while the annual rent payments under the Regional Master Lease will remain unchanged following completion of the disposition. The disposition is subject to customary closing conditions and regulatory approvals. 2. On September 3, 2020, VICI and Caesars entered into definitive agreements to sell Harrah’s Louisiana Downs for $22 million to a third party. The proceeds of the transaction shall be split ~$5.5 million to VICI and ~$16.5 million to Caesars, while the annual rent payments under the Regional Master Lease will remain unchanged following completion of the disposition. VICI Q3 2020 Supplemental Financial & Operating Data 20
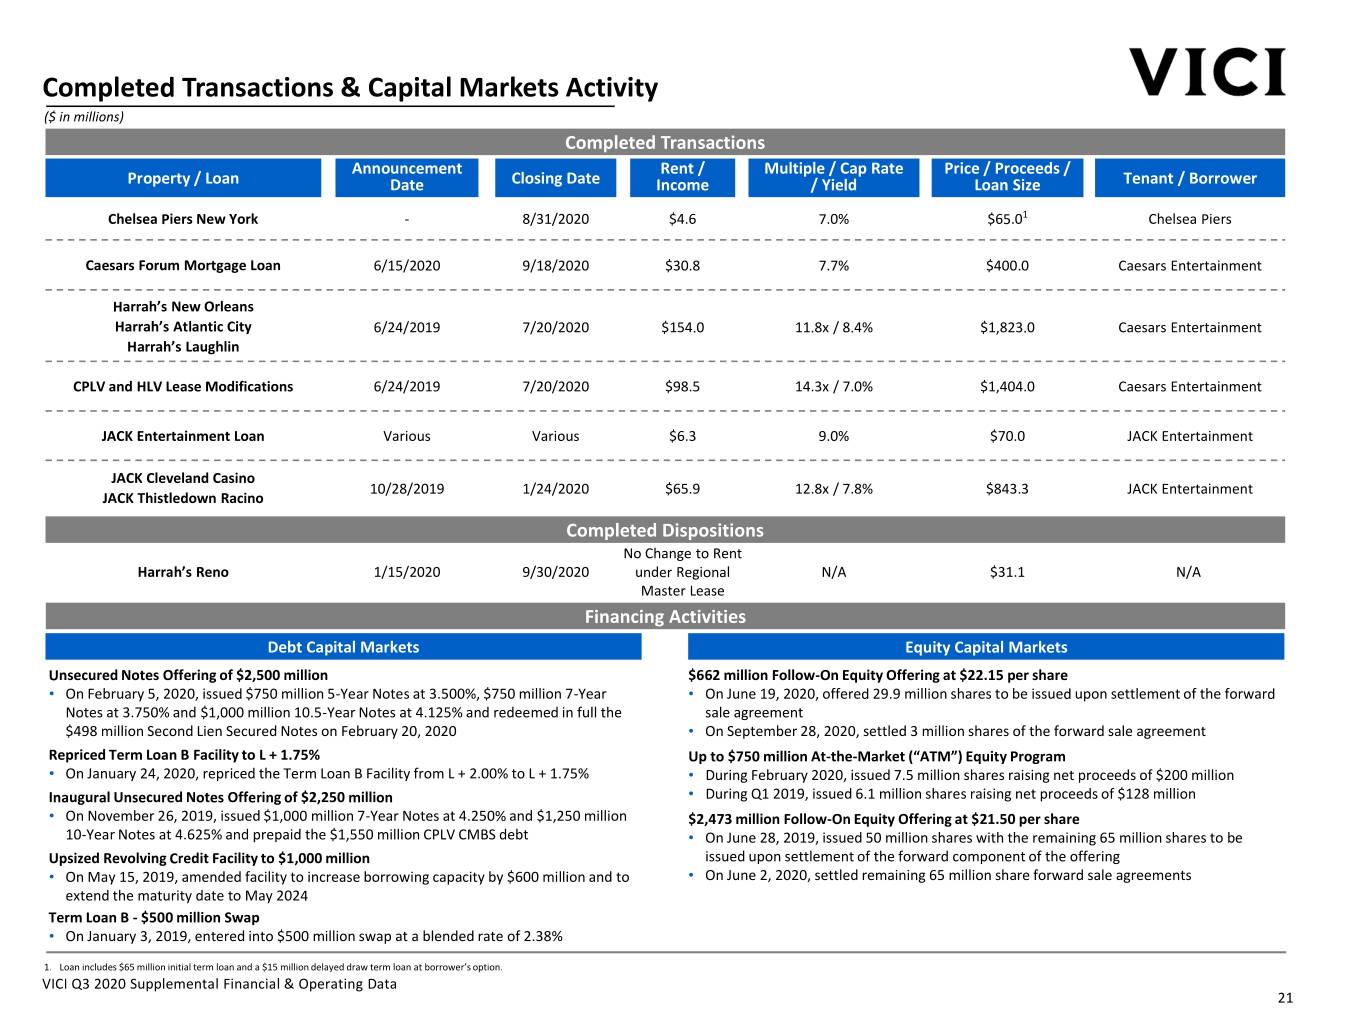
Completed Transactions & Capital Markets Activity ($ in millions) Completed Transactions Announcement Rent / Multiple / Cap Rate Price / Proceeds / Property / Loan Date Closing Date Income / Yield Loan Size Tenant / Borrower Chelsea Piers New York - 8/31/2020 $4.6 7.0% $65.01 Chelsea Piers Caesars Forum Mortgage Loan 6/15/2020 9/18/2020 $30.8 7.7% $400.0 Caesars Entertainment Harrah’s New Orleans Harrah’s Atlantic City 6/24/2019 7/20/2020 $154.0 11.8x / 8.4% $1,823.0 Caesars Entertainment Harrah’s Laughlin CPLV and HLV Lease Modifications 6/24/2019 7/20/2020 $98.5 14.3x / 7.0% $1,404.0 Caesars Entertainment JACK Entertainment Loan Various Various $6.3 9.0% $70.0 JACK Entertainment JACK Cleveland Casino 10/28/2019 1/24/2020 $65.9 12.8x / 7.8% $843.3 JACK Entertainment JACK Thistledown Racino Completed Dispositions No Change to Rent Harrah’s Reno 1/15/2020 9/30/2020 under Regional N/A $31.1 N/A Master Lease Financing Activities Debt Capital Markets Equity Capital Markets Unsecured Notes Offering of $2,500 million $662 million Follow-On Equity Offering at $22.15 per share • On February 5, 2020, issued $750 million 5-Year Notes at 3.500%, $750 million 7-Year • On June 19, 2020, offered 29.9 million shares to be issued upon settlement of the forward Notes at 3.750% and $1,000 million 10.5-Year Notes at 4.125% and redeemed in full the sale agreement $498 million Second Lien Secured Notes on February 20, 2020 • On September 28, 2020, settled 3 million shares of the forward sale agreement Repriced Term Loan B Facility to L + 1.75% Up to $750 million At-the-Market (“ATM”) Equity Program • On January 24, 2020, repriced the Term Loan B Facility from L + 2.00% to L + 1.75% • During February 2020, issued 7.5 million shares raising net proceeds of $200 million Inaugural Unsecured Notes Offering of $2,250 million • During Q1 2019, issued 6.1 million shares raising net proceeds of $128 million • On November 26, 2019, issued $1,000 million 7-Year Notes at 4.250% and $1,250 million $2,473 million Follow-On Equity Offering at $21.50 per share 10-Year Notes at 4.625% and prepaid the $1,550 million CPLV CMBS debt • On June 28, 2019, issued 50 million shares with the remaining 65 million shares to be Upsized Revolving Credit Facility to $1,000 million issued upon settlement of the forward component of the offering • On May 15, 2019, amended facility to increase borrowing capacity by $600 million and to • On June 2, 2020, settled remaining 65 million share forward sale agreements extend the maturity date to May 2024 Term Loan B - $500 million Swap • On January 3, 2019, entered into $500 million swap at a blended rate of 2.38% 1. Loan includes $65 million initial term loan and a $15 million delayed draw term loan at borrower’s option. VICI Q3 2020 Supplemental Financial & Operating Data 21
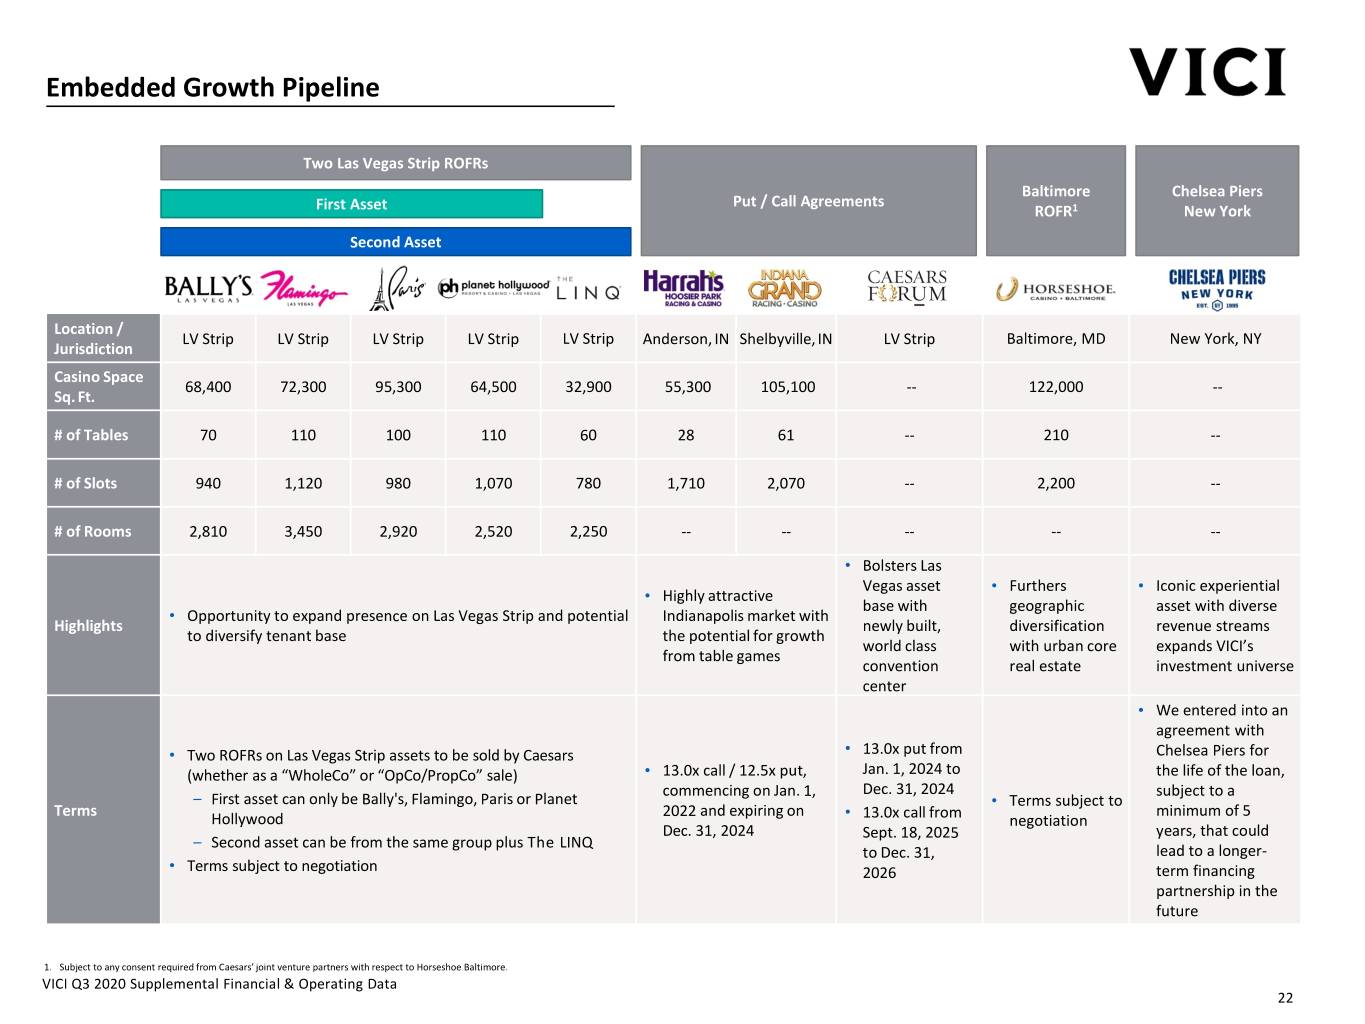
Embedded Growth Pipeline Two Las Vegas Strip ROFRs Baltimore Chelsea Piers Put / Call Agreements First Asset ROFR1 New York Second Asset Location / LV Strip LV Strip LV Strip LV Strip LV Strip Anderson, IN Shelbyville,IN LV Strip Baltimore, MD New York, NY Jurisdiction Casino Space 68,400 72,300 95,300 64,500 32,900 55,300 105,100 -- 122,000 -- Sq. Ft. # of Tables 70 110 100 110 60 28 61 -- 210 -- # of Slots 940 1,120 980 1,070 780 1,710 2,070 -- 2,200 -- # of Rooms 2,810 3,450 2,920 2,520 2,250 -- -- -- -- -- • Bolsters Las Vegas asset • Furthers • Iconic experiential • Highly attractive base with geographic asset with diverse • Opportunity to expand presence on Las Vegas Strip and potential Indianapolis market with Highlights newly built, diversification revenue streams to diversify tenant base the potential for growth world class with urban core expands VICI’s from table games convention real estate investment universe center • We entered into an agreement with • • Two ROFRs on Las Vegas Strip assets to be sold by Caesars 13.0x put from Chelsea Piers for (whether as a “WholeCo” or “OpCo/PropCo” sale) • 13.0x call / 12.5x put, Jan. 1, 2024 to the life of the loan, commencing on Jan. 1, Dec. 31, 2024 subject to a – First asset can only be Bally's, Flamingo, Paris or Planet • Terms subject to Terms 2022 and expiring on • minimum of 5 Hollywood 13.0x call from negotiation Dec. 31, 2024 Sept. 18, 2025 years, that could – Second asset can be from the same group plus The LINQ to Dec. 31, lead to a longer- • Terms subject to negotiation 2026 term financing partnership in the future 1. Subject to any consent required from Caesars’ joint venture partners with respect to Horseshoe Baltimore. VICI Q3 2020 Supplemental Financial & Operating Data 22
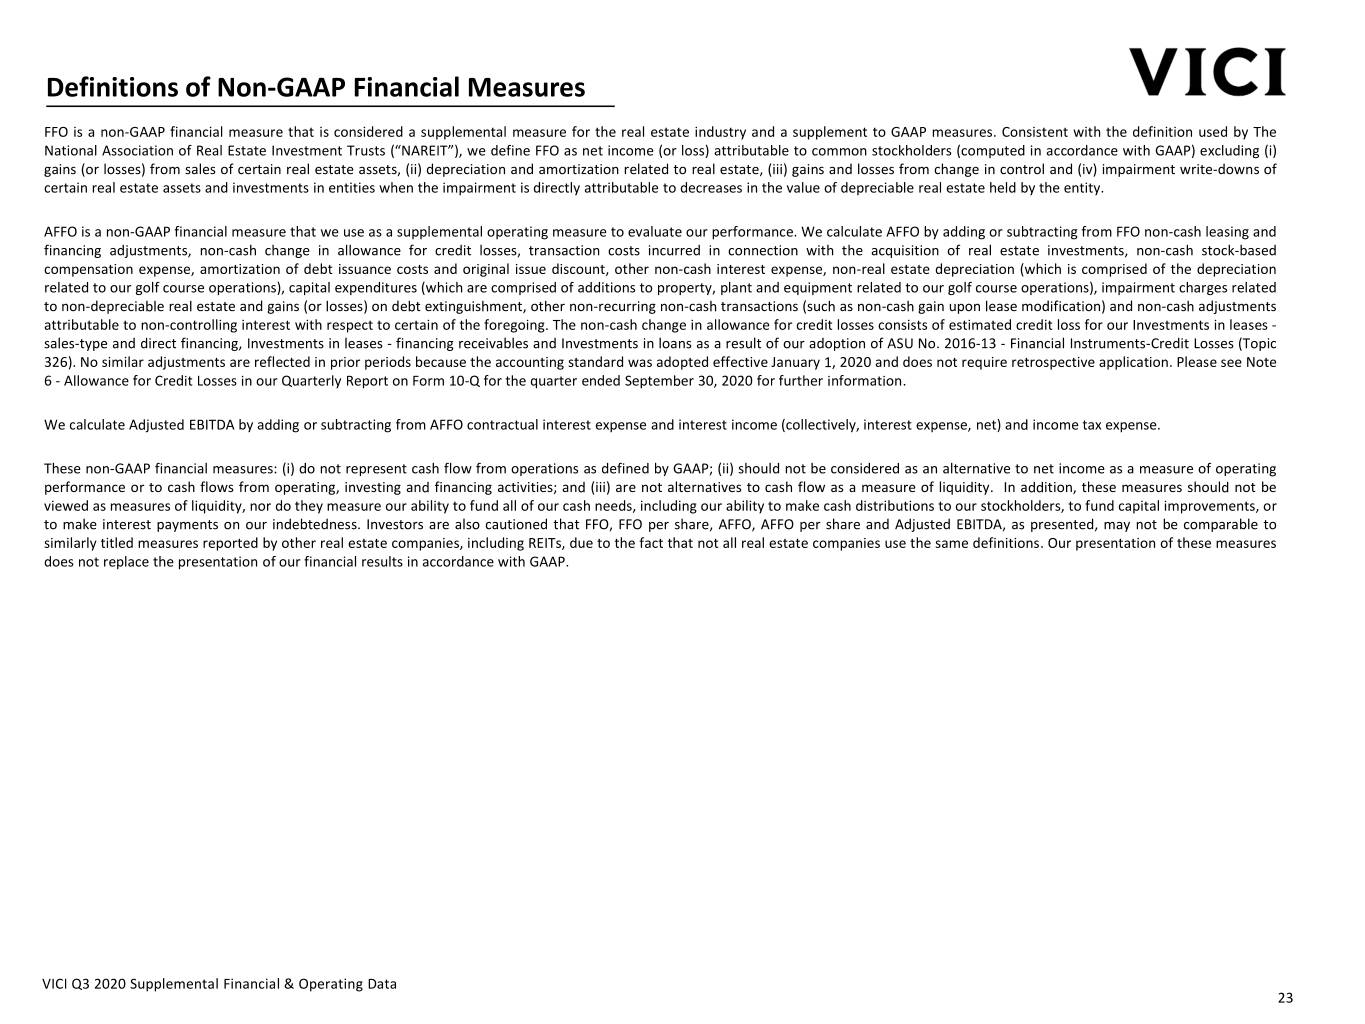
Definitions of Non-GAAP Financial Measures FFO is a non-GAAP financial measure that is considered a supplemental measure for the real estate industry and a supplement to GAAP measures. Consistent with the definition used by The National Association of Real Estate Investment Trusts (“NAREIT”), we define FFO as net income (or loss) attributable to common stockholders (computed in accordance with GAAP) excluding (i) gains (or losses) from sales of certain real estate assets, (ii) depreciation and amortization related to real estate, (iii) gains and losses from change in control and (iv) impairment write-downs of certain real estate assets and investments in entities when the impairment is directly attributable to decreases in the value of depreciable real estate held by the entity. AFFO is a non-GAAP financial measure that we use as a supplemental operating measure to evaluate our performance. We calculate AFFO by adding or subtracting from FFO non-cash leasing and financing adjustments, non-cash change in allowance for credit losses, transaction costs incurred in connection with the acquisition of real estate investments, non-cash stock-based compensation expense, amortization of debt issuance costs and original issue discount, other non-cash interest expense, non-real estate depreciation (which is comprised of the depreciation related to our golf course operations), capital expenditures (which are comprised of additions to property, plant and equipment related to our golf course operations), impairment charges related to non-depreciable real estate and gains (or losses) on debt extinguishment, other non-recurring non-cash transactions (such as non-cash gain upon lease modification) and non-cash adjustments attributable to non-controlling interest with respect to certain of the foregoing. The non-cash change in allowance for credit losses consists of estimated credit loss for our Investments in leases - sales-type and direct financing, Investments in leases - financing receivables and Investments in loans as a result of our adoption of ASU No. 2016-13 - Financial Instruments-Credit Losses (Topic 326). No similar adjustments are reflected in prior periods because the accounting standard was adopted effective January 1, 2020 and does not require retrospective application. Please see Note 6 - Allowance for Credit Losses in our Quarterly Report on Form 10-Q for the quarter ended September 30, 2020 for further information. We calculate Adjusted EBITDA by adding or subtracting from AFFO contractual interest expense and interest income (collectively, interest expense, net) and income tax expense. These non-GAAP financial measures: (i) do not represent cash flow from operations as defined by GAAP; (ii) should not be considered as an alternative to net income as a measure of operating performance or to cash flows from operating, investing and financing activities; and (iii) are not alternatives to cash flow as a measure of liquidity. In addition, these measures should not be viewed as measures of liquidity, nor do they measure our ability to fund all of our cash needs, including our ability to make cash distributions to our stockholders, to fund capital improvements, or to make interest payments on our indebtedness. Investors are also cautioned that FFO, FFO per share, AFFO, AFFO per share and Adjusted EBITDA, as presented, may not be comparable to similarly titled measures reported by other real estate companies, including REITs, due to the fact that not all real estate companies use the same definitions. Our presentation of these measures does not replace the presentation of our financial results in accordance with GAAP. VICI Q3 2020 Supplemental Financial & Operating Data 23
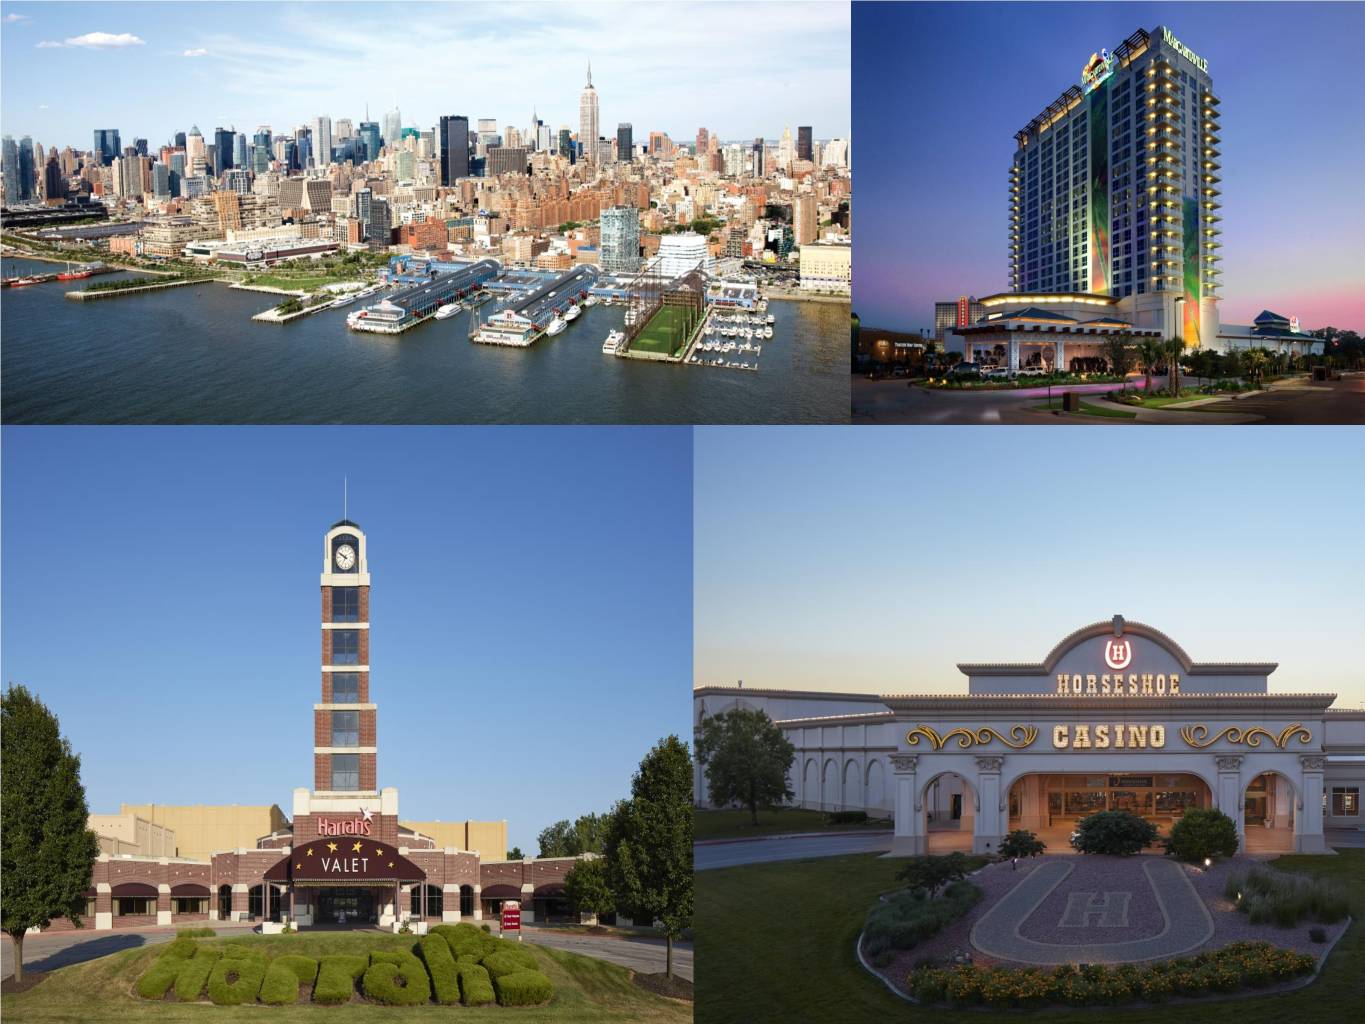
VICI Q3 2020 Supplemental Financial & Operating Data VICI Q4 2018 Supplemental Financial & Operating Data