ARHS $11.70 +1.47%
ARHS logo
ARHS · Arhaus, Inc.
Track ARHS — free
$11.70 +0.17 (+1.47%) At close · Oct 23
Market Cap
$1.66B
Shares
141.75M
Volume · Oct 23 2.11M Avg daily vol (3M) 1.53M
All webcasts

Earnings call · FY2026 Q2

Arhaus, Inc. (ARHS) Q2 2026 Earnings Call

Concluded Aug 6, 2026
Aug 6, 2026 0 turns
Period
FY2026 Q2
Runtime
—
Sources
3 artifacts
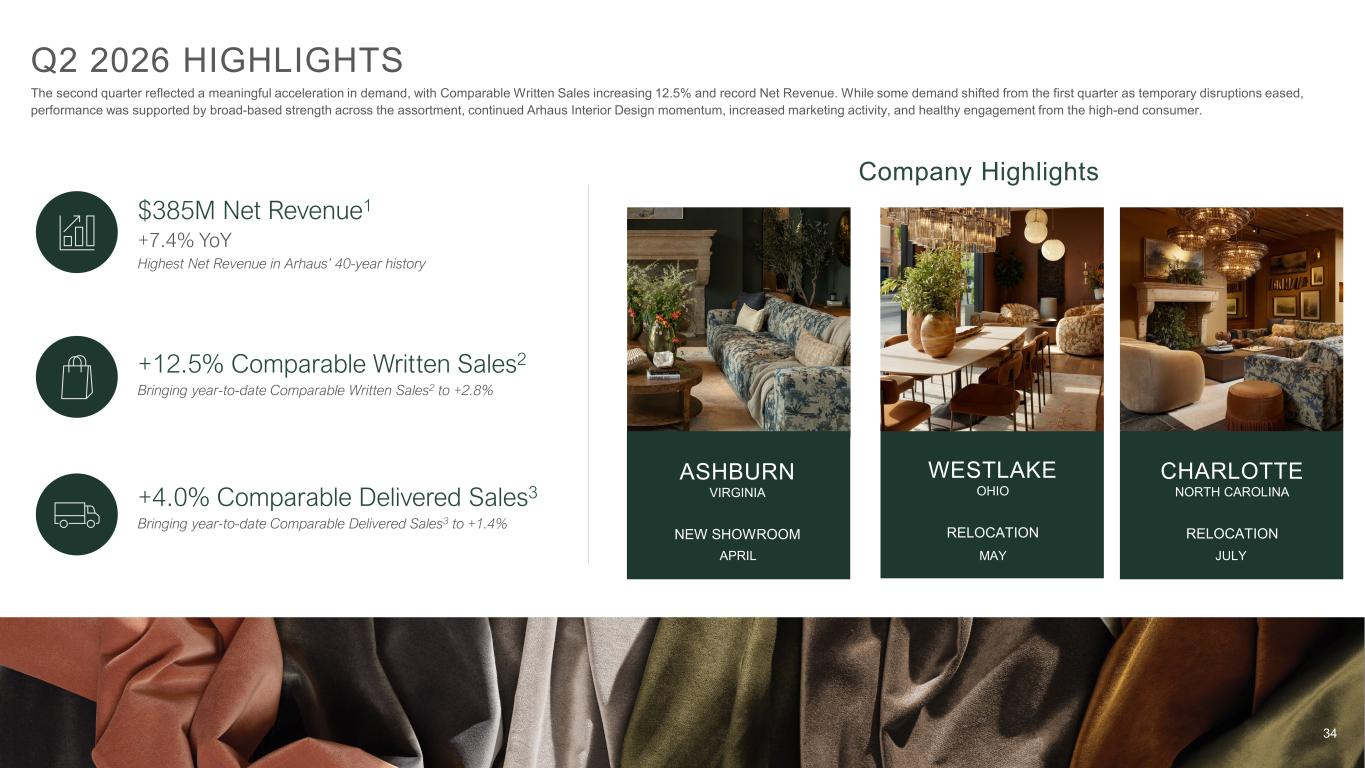
Revenue $384.90M +7.4% YoY
Diluted EPS $0.28 +12% YoY
Gross margin 44.7% +3.3 pp YoY
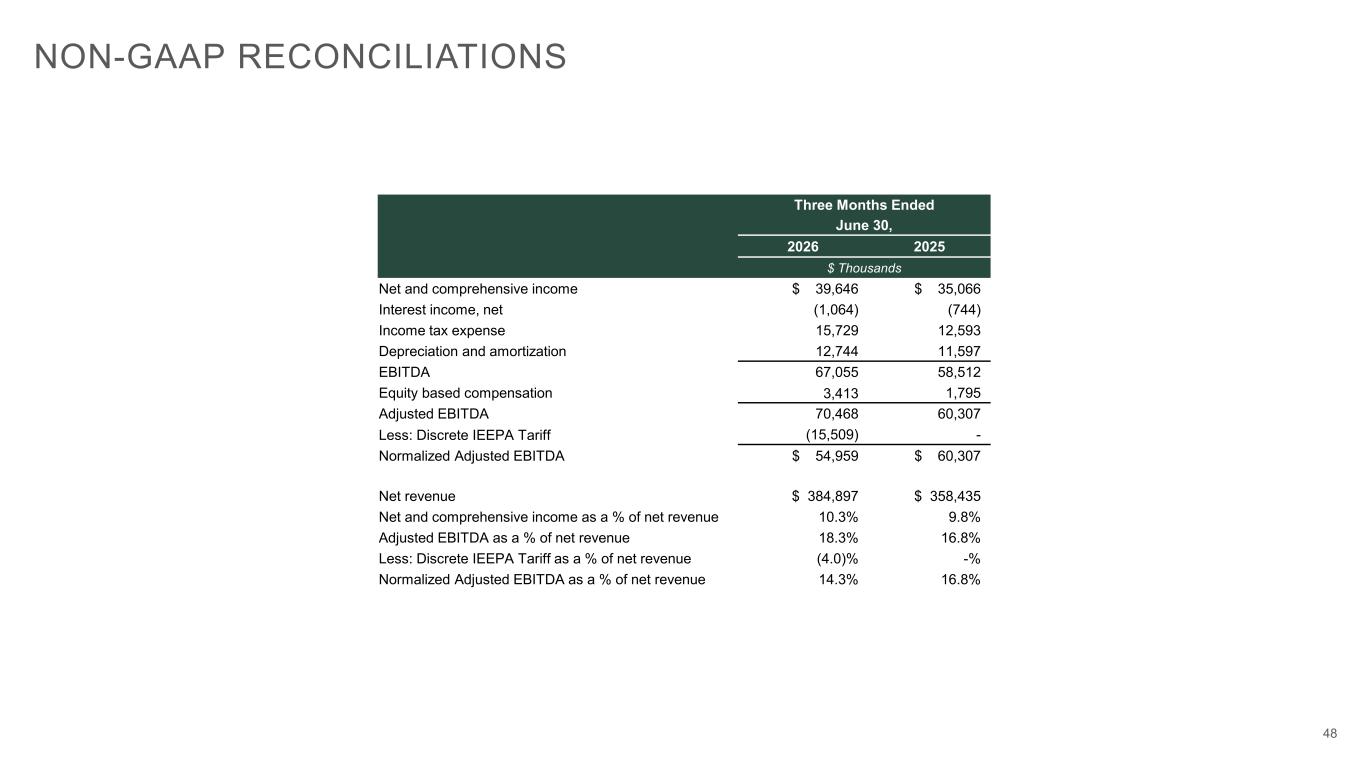
Net income $39.65M +13.1% YoY
Open full screen Slides 49 8-K 10-Q

Executive readout · one minute

What matters this quarter

Arhaus delivered record Q2 net revenue of $385M and 12.5% comparable written sales growth, beating the high end of guidance, while raising full-year net income and adjusted EBITDA guidance to reflect a $37.8M IEEPA tariff refund benefit; normalized margins still compressed on fuel, shipping, and investment costs.

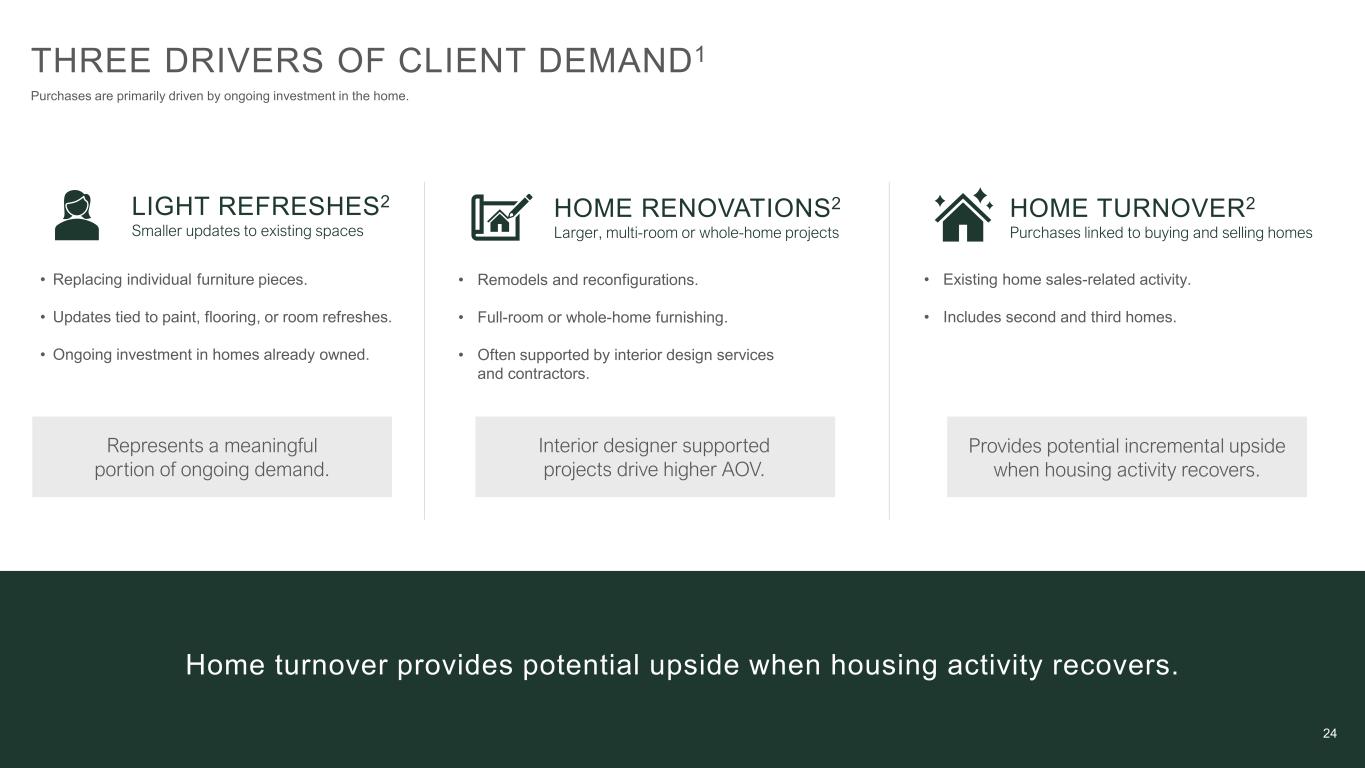
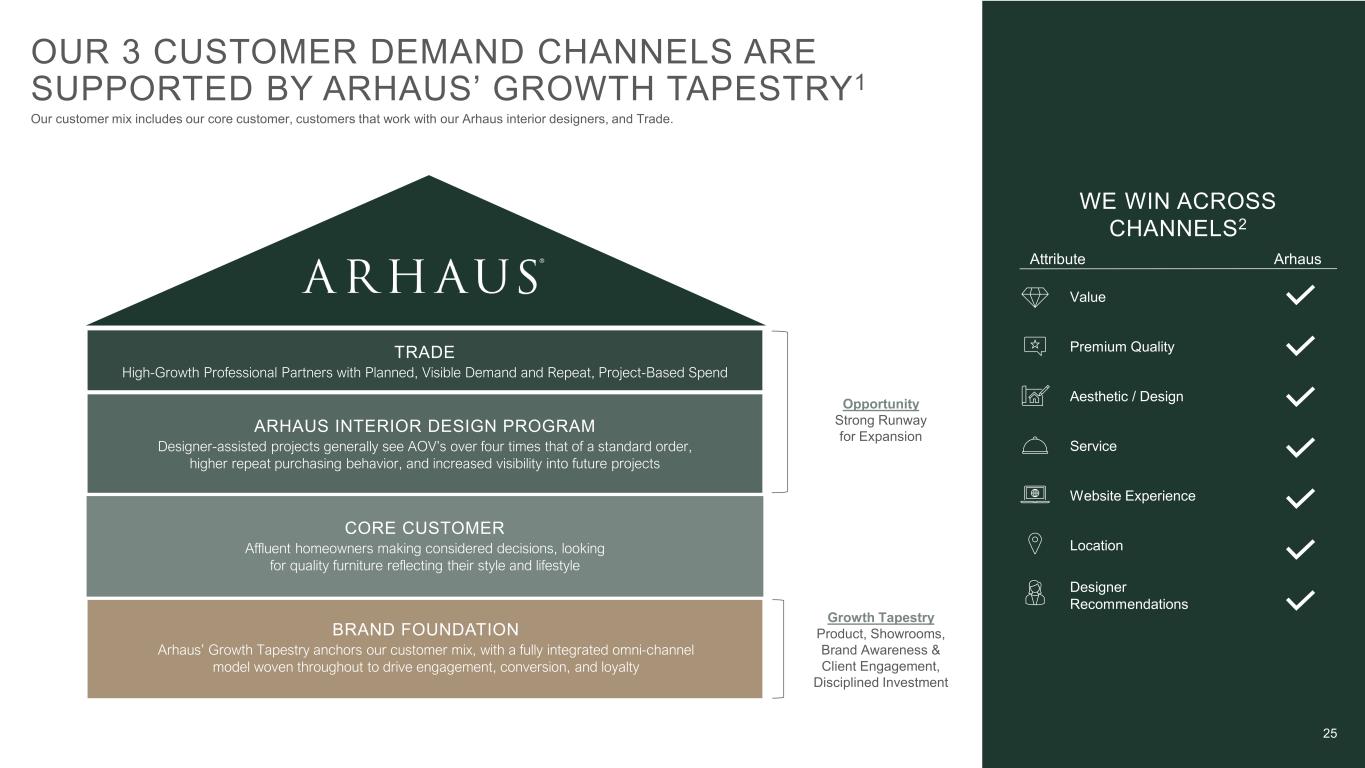
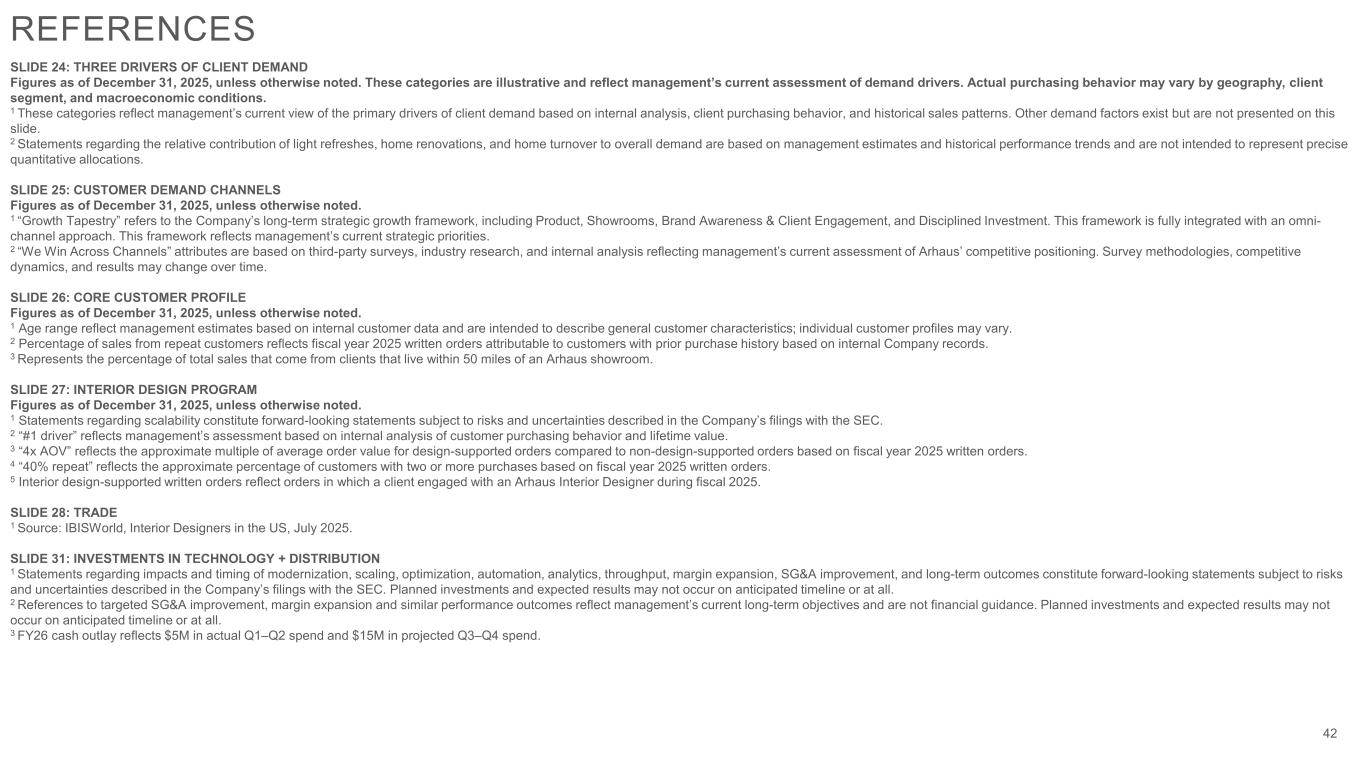
Customer demand channels (core, interior design, trade) 26 Tariff refunds and reinvestment 22 Record revenue and comparable written sales 19 Product assortment and craftsmanship 17 SG&A investment cycle and full-year outlook 17 Catalog investment and marketing spend 10

Management tone

Confident

Net tone +72 · low hedging

Grounding quotes
  • “We delivered record net revenue of $385 million above the high end of our guidance range.”
  • “the high-end consumer continues to demonstrate resilience supported by a relatively healthy U.S. economy, solid consumer spending, and the positive wealth effects of higher stock prices”
  • “This breadth gives us confidence that demand is not dependent on a single geography or market and that our product and brand resonates with clients from coast to coast”
  • “it's kind of a steady point right now for this year and have no plans to change it”

Forward guidance

8 guided metrics

Management's latest ranges and targets are included below.

Research coverage

3 live sources

Open each available source without leaving this research workspace.

Research materials

Open the source you need; every reader stays inside this workspace.

Key takeaways

What improved, and what deserves a closer read.

↑ Constructive signals

  • Record Q2 net revenue of $385M, up 7.4% YoY and above the high end of guidance
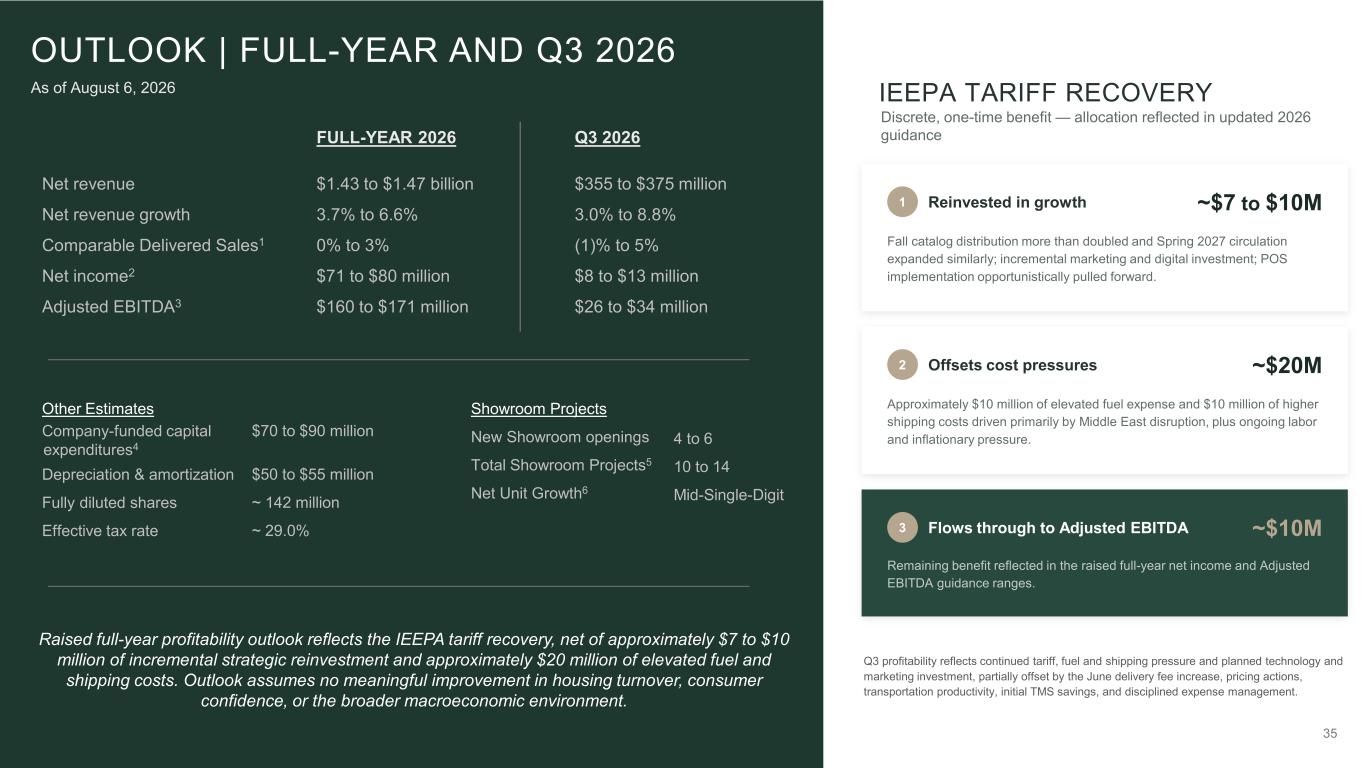
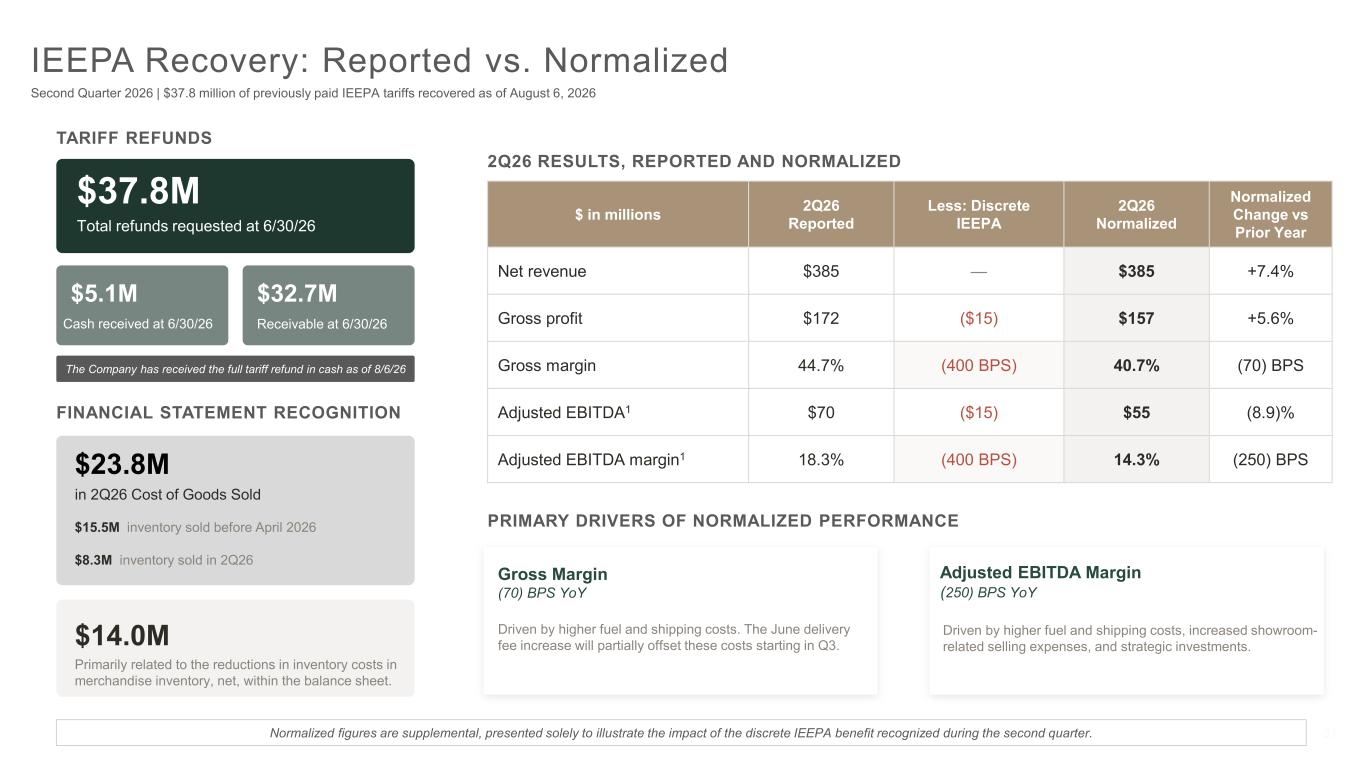
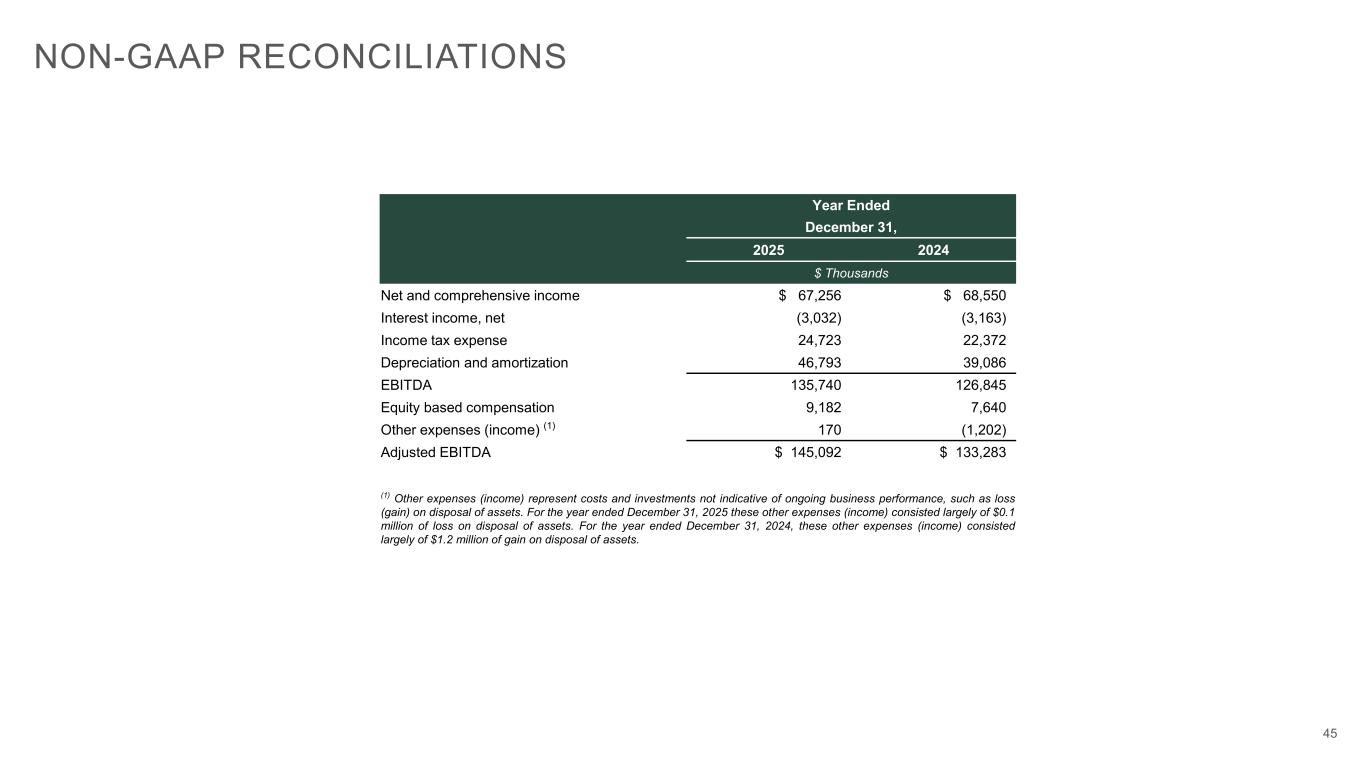
  • Raised full-year net income guidance to $71–$80M and adjusted EBITDA to $160–$171M to reflect IEEPA tariff refund benefit

↓ Risks & pressure points

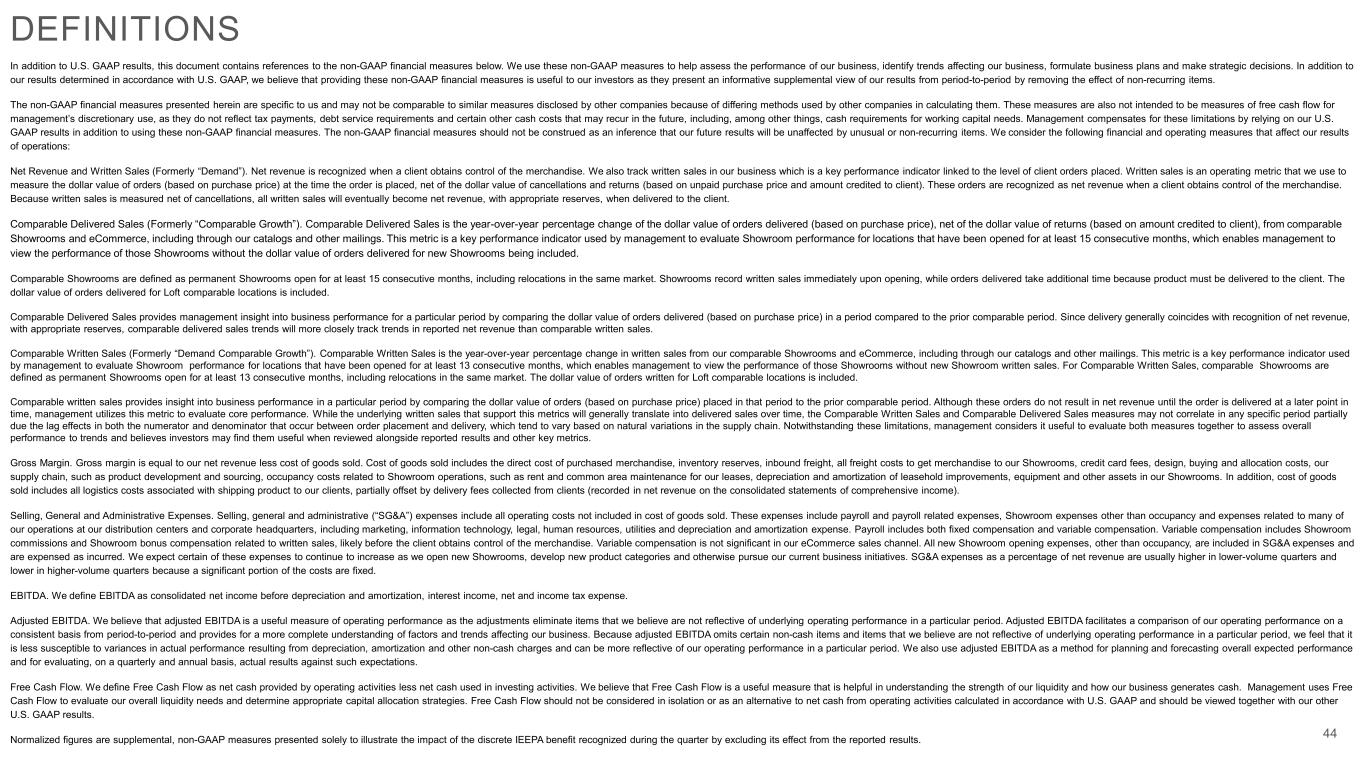
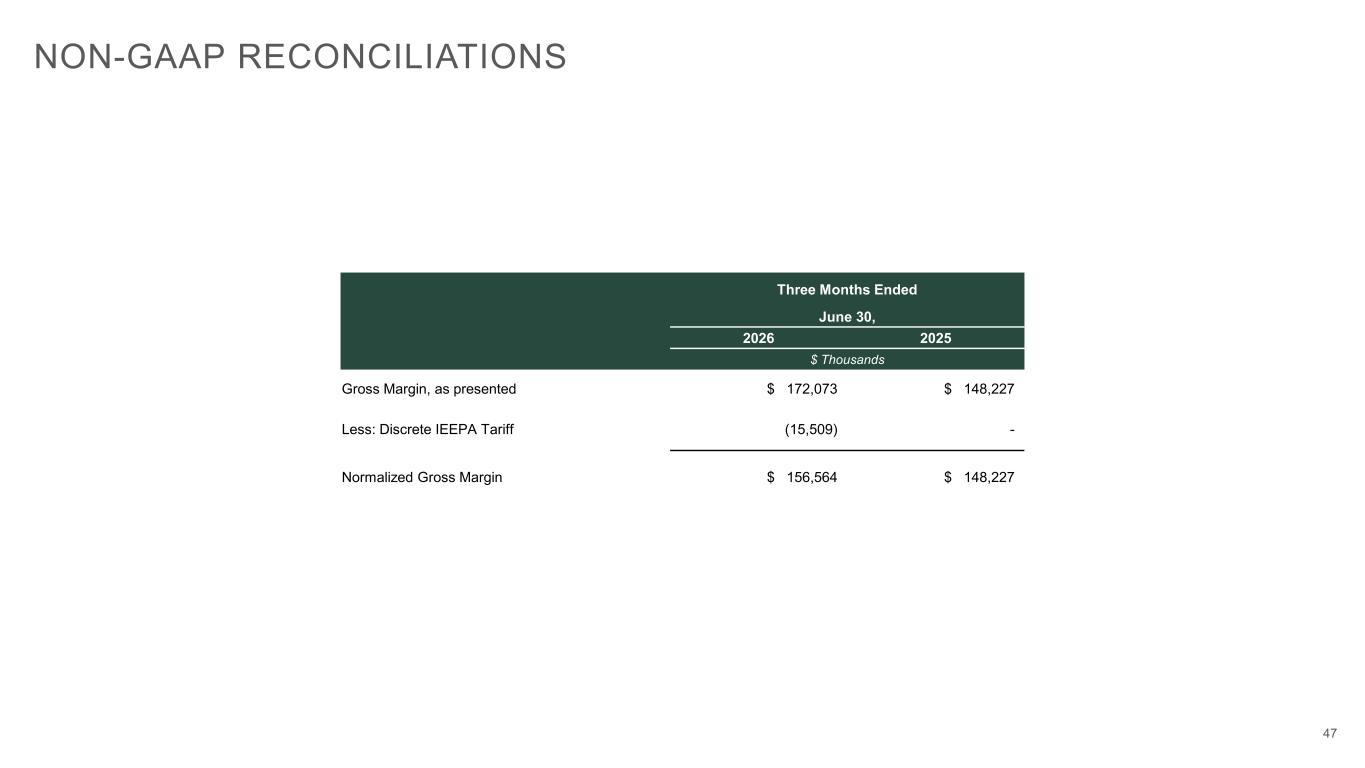
  • Normalized gross margin compressed 70 bps YoY (40.7% vs. 41.4%) on higher fuel and shipping costs
  • Normalized adjusted EBITDA fell 8.9% YoY ($55M vs. $60M) and margin contracted 250 bps on cost pressures and investments
  • Estimated 2026 tariff impact of $30–$40M under new Section 301 framework

Key moments

Read the management remarks selected from the transcript.

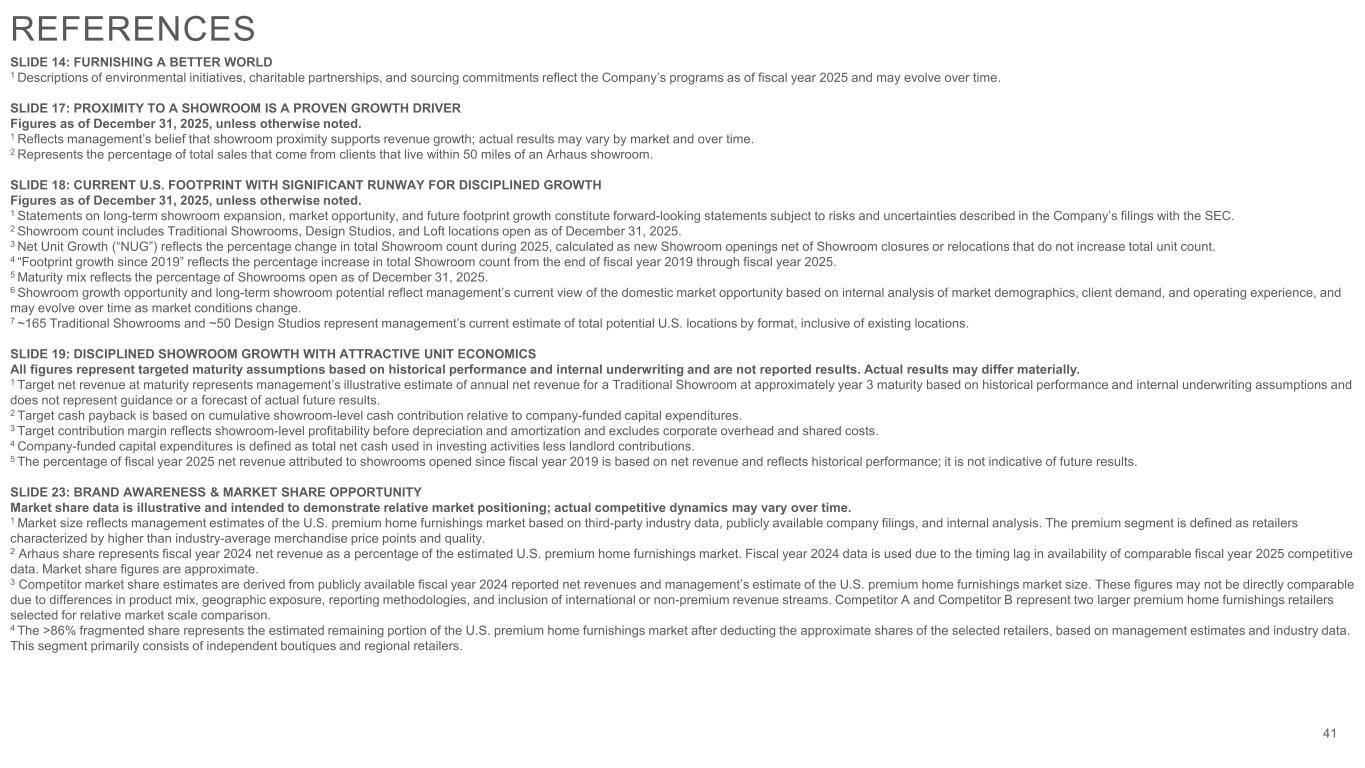
“We delivered results above the high end of our guidance range across all our key financial metrics and generated strong comparable written sales, reinforcing our confidence in the full year outlook. This marked our seventh consecutive quarter of delivering results at or above our guidance.” Michael Lee, CFO
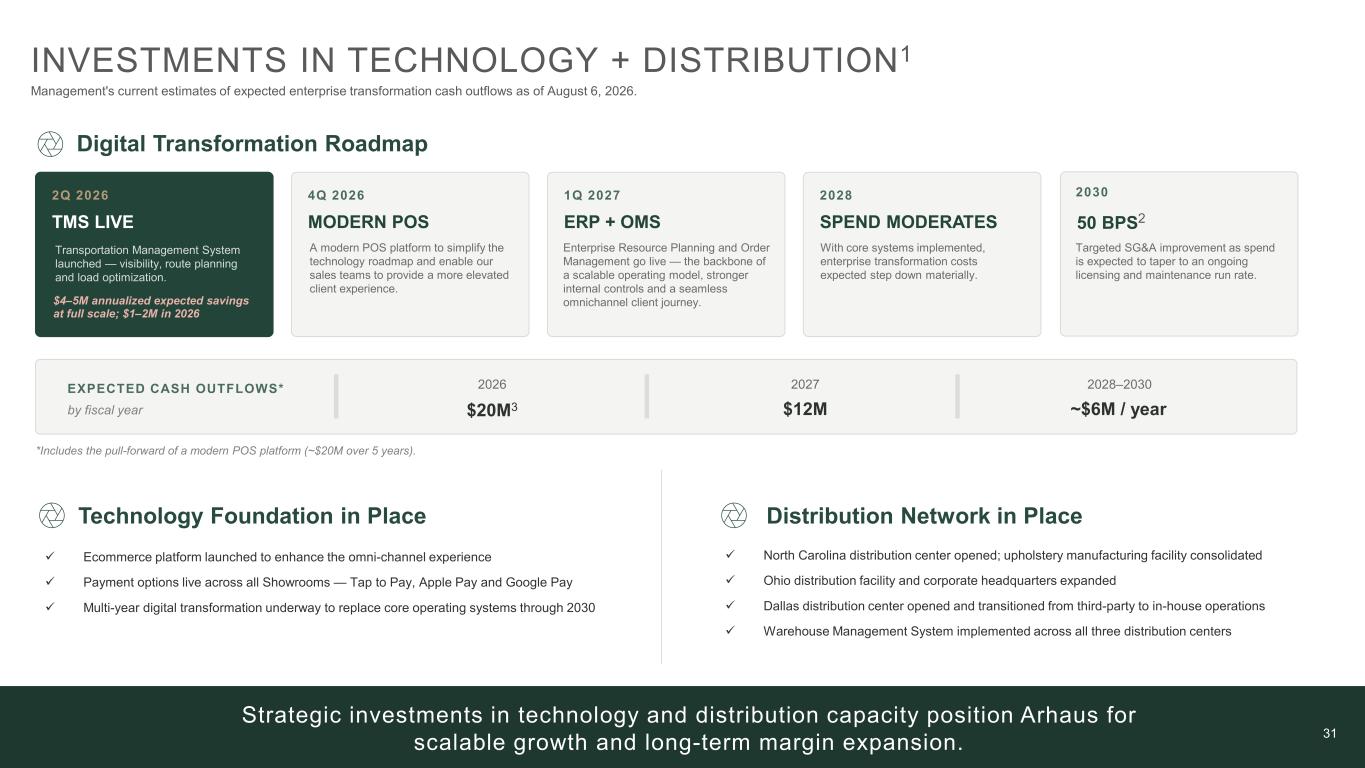
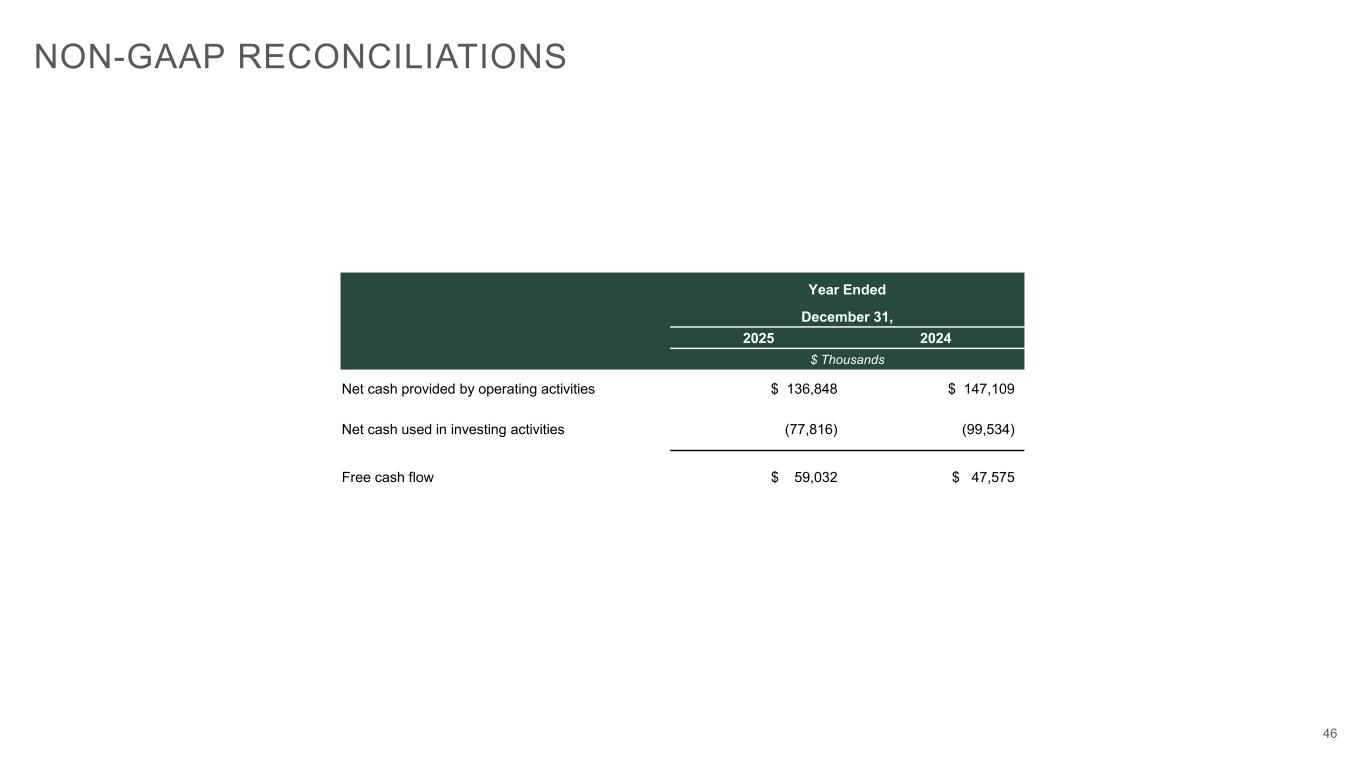
“just overall tariff refunds were the $38 million, recognizing $24 million in Q2 and forecasting $5 to $7 million of additional benefit in Q3 and Q4, respectively. You know, we're going to reinvest about $5 million back into marketing, really to accelerate growth further.” Michael Lee, CFO

Forward guidance

From the 8-K filed Aug 6, 2026.

Metric Guided
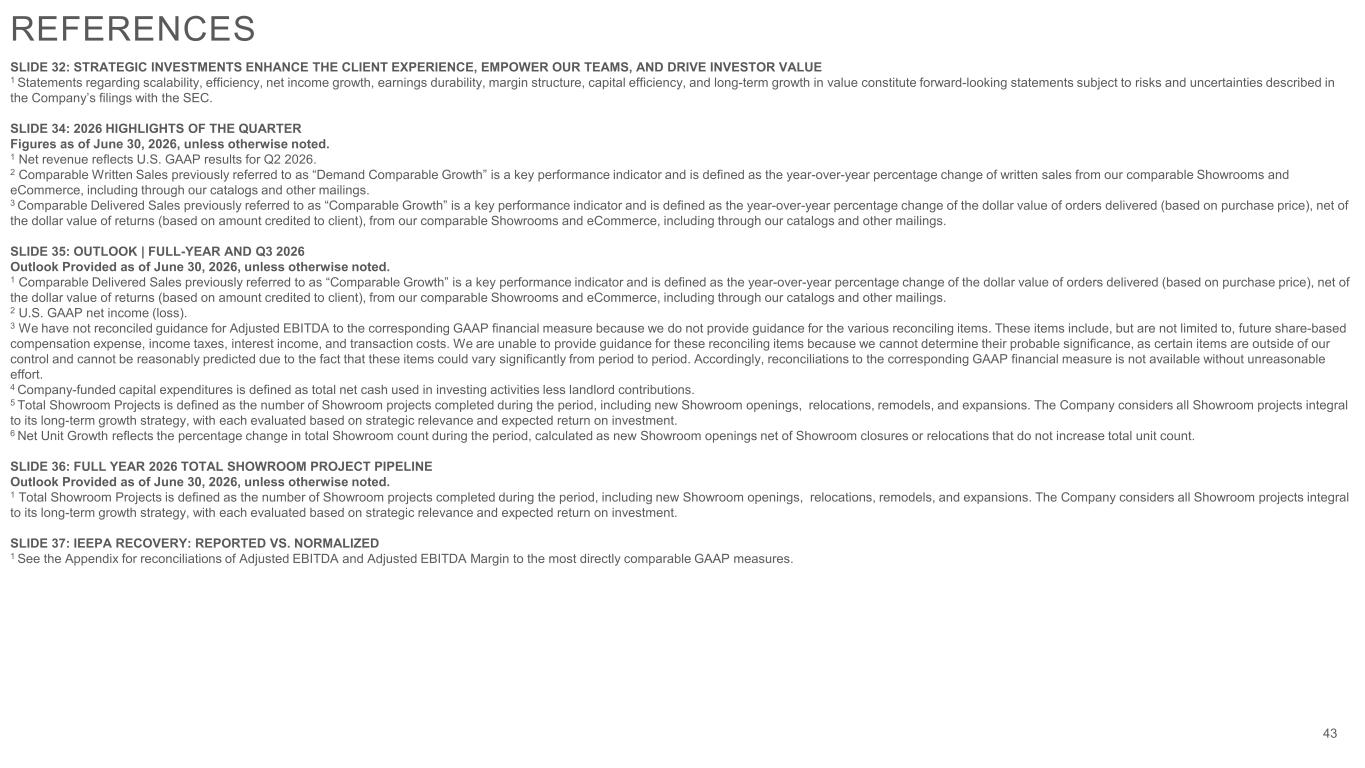
Net revenue growth table Maintained
Full-Year 2026
3.7% – 6.6%
Net revenue growth table
Q3 2026
3% – 8.8%
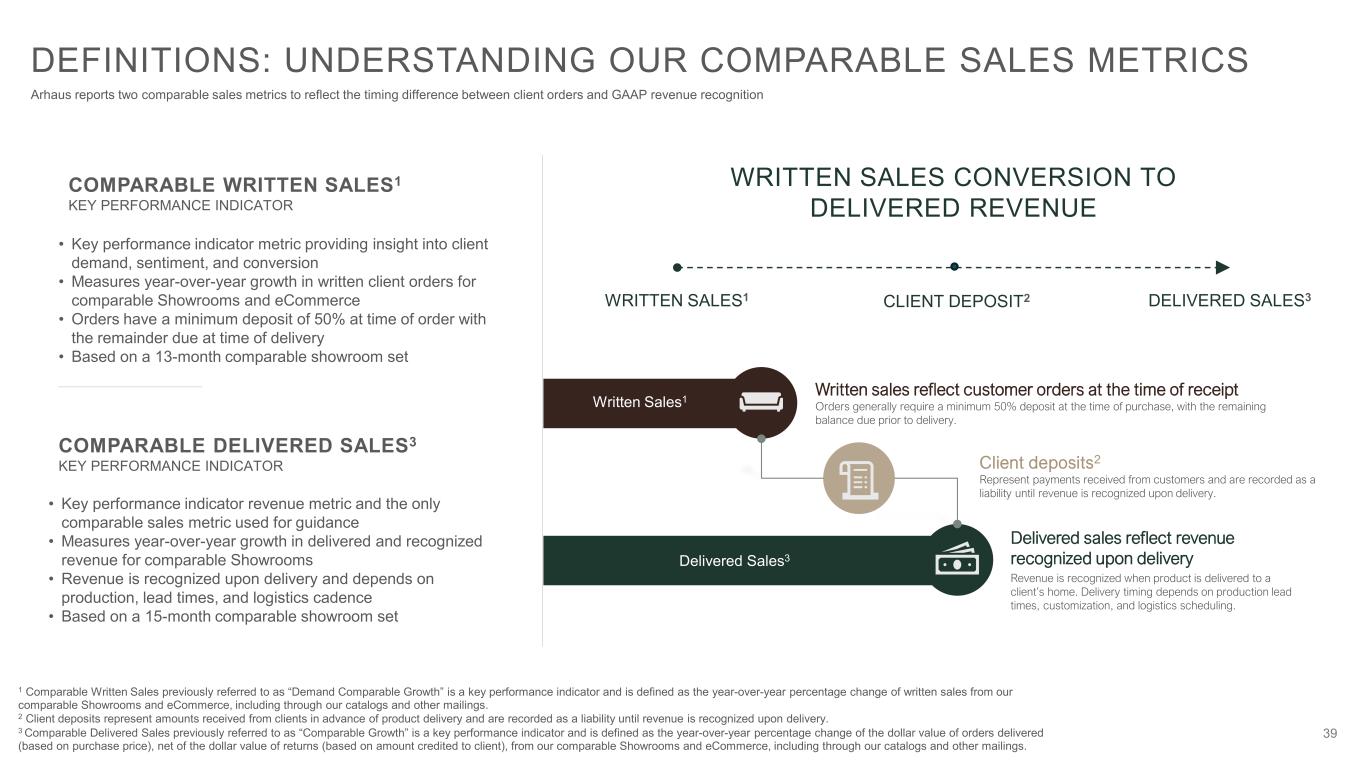
Comparable delivered sales table Maintained
Full-Year 2026
0% – 3%
Comparable delivered sales table
Q3 2026
-1% – 5%
Adjusted EBITDA table Raised
Full-Year 2026
$160M – $171M
Adjusted EBITDA table
Q3 2026
$26M – $34M
Effective tax rate table Raised
Full-Year 2026
29%
Net revenue Maintained
Full-Year 2026
$1.43B – $1.47B

Quarter detail

How the reported period landed and where the business moved.

Result vs. guidance

Revenue Above
Full-screen source Call document