
BFH 8-K
Bread Financial Holdings, Inc. (BFH)
8-K
2020-01-30
For: 2020-01-30
View Original
Added on
April 10, 2026
SECURITIES AND EXCHANGE COMMISSION
WASHINGTON, D.C. 20549
FORM 8-K
CURRENT REPORT
PURSUANT TO SECTION 13 OR 15(d) OF THE
SECURITIES EXCHANGE ACT OF 1934
Date of report (Date of earliest event reported):
(Exact Name of Registrant as Specified in Charter)
|
|
|
|
|
|
|
(State or Other Jurisdiction
|
|
(Commission
|
|
(IRS Employer
|
|
of Incorporation)
|
|
File Number)
|
|
Identification No.)
|
(Address and Zip Code of Principal Executive Offices)
(614 ) 729-4000
(Registrant’s Telephone Number, including Area Code)
NOT APPLICABLE
(Former name or former address, if changed since last report)
Check the appropriate box below if the Form 8-K is intended to simultaneously satisfy the filing obligation of the Registrant under any of the following
provisions:
|
|
Written communications pursuant to Rule 425 under the Securities Act (17 CFR 230.425)
|
|
|
|
Soliciting material pursuant to Rule 14a-12 under the Exchange Act (17 CFR 240.14a-12)
|
|
|
|
Pre-commencement communications pursuant to Rule 14d-2(b) under the Exchange Act (17 CFR 240.14d-2(b))
|
|
|
|
Pre-commencement communications pursuant to Rule 13e-4(c) under the Exchange Act (17 CFR 240.13e-4(c))
|
Securities registered pursuant to Section 12(b) of the Act:
|
Title of each class
|
Trading symbol
|
Name of each exchange on which registered
|
||
|
|
|
|
Indicate by check mark whether the registrant is an emerging growth company as defined in Rule 405 of the Securities Act of 1933 (§230.405 of this
chapter) or Rule 12b-2 of the Securities Exchange Act of 1934 (§240.12b-2 of this chapter).
Emerging growth company ☐
If an emerging growth company, indicate by check mark if the registrant has elected not to use the extended transition period for complying with any new or
revised financial accounting standards provided pursuant to Section 13(a) of the Exchange Act. [ ]
Item 2.02 Results of Operations and Financial Condition.
On January 30, 2020, Alliance Data Systems Corporation (the "Company") issued a press release regarding its results of
operations for the fourth quarter and fiscal year ended December 31, 2019. A copy of this press release is furnished as Exhibit 99.1.
On January 30, 2020, the Company issued a press release regarding its results of operations for the fourth quarter and fiscal year ended
December 31, 2019. A copy of this press release is furnished as Exhibit 99.1.
Attached as Exhibit 99.2 is a presentation to be given to investors and others by senior officers of the Company.
Item 9.01 Financial Statements and Exhibits.
(d) Exhibits
|
Exhibit No.
|
Document Description
|
|
|
Press Release dated January 30, 2020 announcing the results of operations for the fourth quarter and fiscal year ended December 31, 2019.
|
||
| 99.2 |
Investor Presentation Materials.
|
|
| 104 | Cover Page Interactive Data File (embedded within the Inline XBRL document). |
Note: The information contained in this report (including
Exhibits 99.1 and 99.2) shall not be deemed “filed” for purposes of Section 18 of the Securities Exchange Act of 1934, as amended, or otherwise subject to the liabilities of that section, nor shall it be deemed incorporated by reference in any
filing under the Securities Act of 1933, as amended, except as expressly set forth by specific reference in such a filing.
SIGNATURES
Pursuant to the requirements of the Securities Exchange Act of 1934, as amended, the Registrant has duly caused this report to be signed on its behalf by
the undersigned hereunto duly authorized.
|
Alliance Data Systems Corporation
|
|||
|
Date:January 30, 2020
|
By:
|
/s/ Joseph L. Motes III
|
|
|
Joseph L. Motes III
|
|||
|
Executive Vice President, Chief
Administrative Officer, General
Counsel and Secretary
|
|||
Exhibit 99.1

|
Contacts:
|
Investors/Analysts
|
|
Tiffany Louder
|
|
|
Alliance Data
|
|
|
214-494-3048
|
|
|
Media
|
|
|
Shelley Whiddon
|
|
|
Alliance Data
|
|
|
214-494-3811
|
|
Alliance Data Reports Full-Year 2019 Results
|
•
|
Revenue Decreases 2 Percent to $5.6 Billion
|
|
•
|
EPS Decreases 35 Percent to $11.24
|
|
•
|
Core EPS Decreases 14 Percent to $16.77
|
COLUMBUS, Ohio, January 30, 2020 – Alliance Data Systems
Corporation (NYSE: ADS), a leading global provider of data-driven marketing and loyalty solutions, today announced results for the year ended December 31, 2019.
|
SUMMARY
|
Quarter Ended December 31,
|
Year Ended December 31,
|
|||||||||||||||||||||||
|
(in millions, except per share amounts)
|
2019
|
2018
|
% Change
|
2019
|
2018
|
% Change
|
|||||||||||||||||||
|
Revenue
|
$
|
1,461
|
$
|
1,465
|
0
|
%
|
$
|
5,581
|
$
|
5,667
|
-2
|
%
|
|||||||||||||
|
Income from continuing operations
|
$
|
130
|
$
|
253
|
-48
|
%
|
$
|
573
|
$
|
946
|
-39
|
%
|
|||||||||||||
|
Net income
|
$
|
130
|
$
|
285
|
-54
|
%
|
$
|
311
|
$
|
963
|
-68
|
%
|
|||||||||||||
|
Income from continuing operations per diluted share (“EPS”)
|
$
|
2.74
|
$
|
4.67
|
-41
|
%
|
$
|
11.24
|
$
|
17.17
|
-35
|
%
|
|||||||||||||
|
Net income per diluted share
|
$
|
2.74
|
$
|
5.25
|
-48
|
%
|
$
|
6.10
|
$
|
17.49
|
-65
|
%
|
|||||||||||||
|
Diluted shares outstanding
|
47.6
|
54.2
|
50.9
|
55.1
|
|||||||||||||||||||||
|
*******************************
|
|
||||||||||||||||||||||||
|
Supplemental Non-GAAP Metrics (a):
|
|||||||||||||||||||||||||
|
Adjusted EBITDA
|
$
|
392
|
$
|
565
|
-31
|
%
|
$
|
1,710
|
$
|
1,995
|
-14
|
%
|
|||||||||||||
|
Adjusted EBITDA, net of funding costs
(“adjusted EBITDA, net”)
|
$
|
278
|
$
|
458
|
-39
|
%
|
$
|
1,271
|
$
|
1,609
|
-21
|
%
|
|||||||||||||
|
Core earnings per diluted share (“core EPS”)
|
$
|
4.12
|
$
|
5.76
|
-29
|
%
|
$
|
16.77
|
$
|
19.49
|
-14
|
%
|
|||||||||||||
|
(a)
|
See “Financial Measures” for a discussion of non-GAAP financial measures.
|
1
Alliance Data Systems Corporation
January 30, 2020
|
•
|
Shifted our client base in Card Services toward faster growing companies and verticals by selling approximately $2.1 billion in non-strategic
receivables;
|
|
•
|
Simplified our story and returned capital to our shareholders by divesting Epsilon and Precima (January 2020);
|
|
•
|
Streamlined the parent company cost structure eliminating over $100 million in annual operating costs;
|
|
•
|
Changed the leadership and cost structure at LoyaltyOne, which contributed to a 21 percent increase in constant currency adjusted EBITDA for the fourth
quarter;
|
|
•
|
Extended the debt maturity ladder at the parent company providing liquidity that can be used to re-invest in the company; and
|
|
•
|
Hired a seasoned industry veteran from Citigroup, Ralph Andretta, to lead the company going forward.
|
“During 2020, management and the board of directors will continue to evaluate strategic opportunities to better position the
company moving forward.”
CONSOLIDATED RESULTS
FOURTH-QUARTER CONSOLIDATED RESULTS
Revenue decreased less than 1 percent to $1.46 billion for the fourth quarter of 2019. EPS decreased 41 percent to $2.74 for
the fourth quarter of 2019, negatively impacted by ($0.65) in restructuring and strategic transaction costs. Core EPS decreased 29 percent to $4.12 and adjusted EBITDA, net decreased 39 percent to $278 million for the fourth quarter of 2019. EPS,
core EPS and adjusted EBITDA were negatively impacted by a 59 percent decrease in earnings before taxes at Card Services.
FULL-YEAR CONSOLIDATED RESULTS
Revenue decreased 2 percent to $5.58 billion for 2019. EPS decreased 35 percent to $11.24 for 2019, negatively impacted by
($3.07) in loss on extinguishment of debt and restructuring and strategic transaction costs. Core EPS decreased 14 percent to $16.77 and adjusted EBITDA, net decreased 21 percent to $1.27 billion for 2019.
FULL-YEAR SEGMENT RESULTS
LoyaltyOne®: Constant currency revenue increased 1 percent to $1.08 billion while constant currency adjusted EBITDA was flat at $253 million for 2019. AIR MILES® reward miles issued increased less than 1 percent for 2019. Changes to the collector value proposition during 2019 are expected to stimulate issuance growth in 2020. BrandLoyalty returned to double-digit adjusted EBITDA growth for
the year as a result of better program mix and cost containment initiatives undertaken in 2019.
2
Alliance Data Systems Corporation
January 30, 2020
Card Services: Revenue
decreased 1 percent to $4.55 billion due to nominal growth in normalized receivables coupled with a 50 basis points decline in gross yields. Adjusted EBITDA, net decreased 25 percent to $1.12 billion for 2019, primarily a result of an additional $90
million negative adjustment to the carrying value of held-for-sale receivables and a $172 million increase to the loan loss provision, as principal loss rates stabilized in 2019 as compared to improving in 2018.
Net principal loss rates were 6.1 percent in 2019, 3 basis points better than 2018, while delinquency rates increased
slightly to 5.8 percent at December 31, 2019 primarily due to the turn of receivables acquired in the second quarter of 2019.
2020 Guidance
Revenue of $5.6 billion, essentially flat with 2019. Core EPS of $20.50, up 22 percent compared with 2019.
Forward-Looking Statements
This release contains forward-looking statements within the meaning of Section 27A of the Securities Act of 1933 and Section
21E of the Securities Exchange Act of 1934. Forward-looking statements give our expectations or forecasts of future events and can generally be identified by the use of words such as “believe,” “expect,” “anticipate,” “estimate,” “intend,” “project,”
“plan,” “likely,” “may,” “should” or other words or phrases of similar import. Similarly, statements that describe our business strategy, outlook, objectives, plans, intentions or goals also are forward-looking statements. Examples of forward-looking
statements include, but are not limited to, statements we make regarding strategic initiatives, our expected operating results, future economic conditions including currency exchange rates, future dividend declarations and the guidance we give with
respect to our anticipated financial performance.
We believe that our expectations are based on reasonable assumptions. Forward-looking statements, however, are subject to a
number of risks and uncertainties that could cause actual results to differ materially from the projections, anticipated results or other expectations expressed in this release, and no assurances can be given that our expectations will prove to have
been correct. These risks and uncertainties include, but are not limited to, factors set forth in the Risk Factors section in our Annual Report on Form 10-K for the most recently ended fiscal year, which may be updated in Item 1A of, or elsewhere in,
our Quarterly Reports on Form 10-Q filed for periods subsequent to such Form 10-K. Further risks and uncertainties include, but are not limited to, the impact of strategic initiatives on us or our business if any transactions are undertaken, and
whether the anticipated benefits of such transactions can be realized as well as whether or if any share repurchases are completed.
Our forward-looking statements speak only as of the date made, and we undertake no obligation, other than as required by
applicable law, to update or revise any forward-looking statements, whether as a result of new information, subsequent events, anticipated or unanticipated circumstances or otherwise.
3
Alliance Data Systems Corporation
January 30, 2020
Financial Measures
In addition to the results presented in accordance with generally accepted accounting principles, or GAAP, the Company may
present financial measures that are non-GAAP measures, such as constant currency financial measures, adjusted EBITDA, adjusted EBITDA margin, adjusted EBITDA, net of funding costs, core earnings and core earnings per diluted share (core EPS).
Constant currency excludes the impact of fluctuations in foreign exchange rates. The Company calculates constant currency by converting our current period local currency financial results using the prior period exchange rates. The Company uses
adjusted EBITDA and adjusted EBITDA, net as an integral part of internal reporting to measure the performance and operational strength of reportable segments and to evaluate the performance of senior management. Adjusted EBITDA eliminates the uneven
effect across all reportable segments of non-cash depreciation of tangible assets and amortization of intangible assets, including certain intangible assets that were recognized in business combinations, and the non-cash effect of stock compensation
expense. Similarly, core earnings and core EPS eliminate non-cash or non-operating items, including, but not limited to, stock compensation expense, amortization of purchased intangibles, restructuring or strategic transaction costs, loss on the
extinguishment of debt, amortization of debt issuance and hedging costs. The Company believes that these non-GAAP financial measures, viewed in addition to and not in lieu of the Company’s reported GAAP results, provide useful information to
investors regarding the Company’s performance and overall results of operations.
Reconciliation of Non-GAAP Financial Measures
Reconciliations to comparable GAAP financial measures are available in the accompanying schedules, which are posted as part
of this earnings release in both the News and Investors sections on the Company’s website (www.alliancedata.com). No reconciliation is provided with respect to
forward-looking annual guidance for 2020 core EPS as the Company cannot reliably predict all necessary components or their impact to reconcile core EPS to GAAP EPS without unreasonable effort. The events necessitating a non-GAAP adjustment are
inherently unpredictable and may have a material impact on the Company’s future results.
The financial measures presented are consistent with the Company’s historical financial reporting practices. Core earnings
and core EPS represent performance measures and are not intended to represent liquidity measures. The non-GAAP financial measures presented herein may not be comparable to similarly titled measures presented by other companies, and are not identical
to corresponding measures used in other various agreements or public filings.
Conference Call
Alliance Data will host a conference call on Thursday, January 30, 2020 at 8:30 a.m. (Eastern Time) to discuss the Company’s
year-end 2019 results. The conference call will be available via the Internet at www.alliancedata.com. There will be several slides accompanying the webcast. Please go to the website at least 15 minutes prior to the call to register, download and
install any necessary software. The recorded webcast will also be available on the Company’s website.
4
Alliance Data Systems Corporation
January 30, 2020
If you are unable to participate in the conference call, a replay will be available. To access the replay, please dial (800)
585-8367 or (416) 624-4642 and enter “8696499”. The replay will be available at approximately 11:45 a.m. (Eastern Time) on Thursday, January 30, 2020.
About Alliance Data®
(NYSE: ADS) is a leading global provider of data-driven marketing and loyalty solutions serving large, consumer-based industries. The Company creates and deploys customized solutions, enhancing the critical customer marketing experience; the result
is measurably changing consumer behavior while driving business growth and profitability for some of today's most recognizable brands. Alliance Data helps its clients create and increase customer loyalty through solutions that engage millions of
customers each day across multiple touch points using traditional, digital, mobile and emerging technologies. An S&P 500, FORTUNE 500 and FORTUNE 100 Best Companies to Work For company headquartered in Columbus, Ohio, Alliance Data consists of
businesses that together employ over 9,000 associates at more than 50 locations worldwide.
Alliance Data’s card services business is a provider of market-leading private label, co-brand, and business credit card
programs. LoyaltyOne® owns and operates the AIR MILES® Reward Program, Canada’s most recognized loyalty program, and Netherlands-based BrandLoyalty, a global provider of tailor-made loyalty programs for grocers.
Follow Alliance Data on Twitter, Facebook, LinkedIn, Instagram and YouTube.
5
Alliance Data Systems Corporation
January 30, 2020
CONDENSED CONSOLIDATED STATEMENTS OF INCOME
(In millions, except per share amounts)
(Unaudited)
|
|
Three Months Ended
December 31,
|
Year Ended
December 31,
|
|||||||||||||||
|
|
2019
|
2018
|
2019
|
2018
|
|||||||||||||
|
Revenue
|
$
|
1,461.0
|
$
|
1,464.6
|
$
|
5,581.3
|
$
|
5,666.6
|
|||||||||
|
Operating expenses:
|
|||||||||||||||||
|
Cost of operations
|
728.3
|
739.0
|
2,838.4
|
2,699.7
|
|||||||||||||
|
Provision for loan loss
|
380.7
|
169.6
|
1,187.5
|
1,016.0
|
|||||||||||||
|
Depreciation and amortization
|
43.0
|
47.4
|
176.1
|
193.6
|
|||||||||||||
|
Loss on extinguishment of debt
|
—
|
—
|
71.9
|
—
|
|||||||||||||
|
Total operating expenses
|
1,152.0
|
956.0
|
4,273.9
|
3,909.3
|
|||||||||||||
|
Operating income
|
309.0
|
508.6
|
1,307.4
|
1,757.3
|
|||||||||||||
|
Interest expense, net:
|
|||||||||||||||||
|
Securitization funding costs
|
53.1
|
56.8
|
213.4
|
220.2
|
|||||||||||||
|
Interest expense on deposits
|
61.3
|
50.0
|
225.6
|
165.7
|
|||||||||||||
|
Interest expense on long-term and other debt, net
|
27.2
|
38.0
|
130.0
|
156.4
|
|||||||||||||
|
Total interest expense, net
|
141.6
|
144.8
|
569.0
|
542.3
|
|||||||||||||
|
Income from continuing operations before income taxes
|
$
|
167.4
|
$
|
363.8
|
$
|
738.4
|
$
|
1,215.0
|
|||||||||
|
Income tax expense
|
37.0
|
110.7
|
165.8
|
269.5
|
|||||||||||||
|
Income from continuing operations
|
130.4
|
253.1
|
572.6
|
945.5
|
|||||||||||||
|
Income (loss) from discontinued operations, net of taxes (1)
|
—
|
31.8
|
(261.7
|
)
|
17.6
|
||||||||||||
|
Net income
|
$
|
130.4
|
$
|
284.9
|
$
|
310.9
|
$
|
963.1
|
|||||||||
|
Per share data:
|
|||||||||||||||||
|
Weighted average shares outstanding – basic
|
47.1
|
54.0
|
50.0
|
54.9
|
|||||||||||||
|
Weighted average shares outstanding – diluted
|
47.6
|
54.2
|
50.9
|
55.1
|
|||||||||||||
|
Basic – Income from continuing operations
|
$
|
2.73
|
$
|
4.69
|
$
|
11.25
|
$
|
17.24
|
|||||||||
|
Basic – Income (loss) from discontinued operations
|
—
|
0.59
|
(5.23
|
)
|
0.32
|
||||||||||||
|
Basic – Net income
|
$
|
2.73
|
$
|
5.28
|
$
|
6.02
|
$
|
17.56
|
|||||||||
|
Diluted – Income from continuing operations
|
$
|
2.74
|
$
|
4.67
|
$
|
11.24
|
$
|
17.17
|
|||||||||
|
Diluted – Income (loss) from discontinued operations
|
—
|
0.58
|
(5.14
|
)
|
0.32
|
||||||||||||
|
Diluted – Net income
|
$
|
2.74
|
$
|
5.25
|
$
|
6.10
|
$
|
17.49
|
|||||||||
|
(1)
|
Reflects the results of operations of the Company’s former Epsilon segment, which was sold on July 1, 2019, direct costs identifiable to the Epsilon segment and
the allocation of interest expense on corporate debt.
|
6
Alliance Data Systems Corporation
January 30, 2020
CONDENSED CONSOLIDATED BALANCE SHEETS
(In millions)
(Unaudited)
|
December 31,
2019
|
December 31,
2018
|
|||||||
|
Assets
|
||||||||
|
Cash and cash equivalents
|
$
|
3,874.4
|
$
|
3,817.4
|
||||
|
Credit card and loan receivables:
|
||||||||
|
Credit card and loan receivables
|
19,463.1
|
17,855.0
|
||||||
|
Allowance for loan loss
|
(1,171.1
|
)
|
(1,038.3
|
)
|
||||
|
Credit card and loan receivables, net
|
18,292.0
|
16,816.7
|
||||||
|
Credit card receivables held for sale
|
408.0
|
1,951.6
|
||||||
|
Redemption settlement assets, restricted
|
600.8
|
558.6
|
||||||
|
Right of use assets - operating
|
264.3
|
—
|
||||||
|
Intangible assets, net
|
153.3
|
217.4
|
||||||
|
Goodwill
|
954.9
|
954.8
|
||||||
|
Other assets
|
1,947.1
|
1,913.8
|
||||||
|
Assets of discontinued operations
|
—
|
4,157.4
|
||||||
|
Total assets
|
$
|
26,494.8
|
$
|
30,387.7
|
||||
|
Liabilities and Stockholders’ Equity
|
||||||||
|
Deferred revenue
|
$
|
922.0
|
$
|
875.3
|
||||
|
Deposits
|
12,151.7
|
11,793.7
|
||||||
|
Non-recourse borrowings of consolidated securitization entities
|
7,284.0
|
7,651.7
|
||||||
|
Long-term and other debt
|
2,849.9
|
5,725.4
|
||||||
|
Operating lease liabilities
|
314.3
|
—
|
||||||
|
Other liabilities
|
1,351.7
|
1,749.1
|
||||||
|
Liabilities of discontinued operations
|
—
|
260.4
|
||||||
|
Total liabilities
|
24,873.6
|
28,055.6
|
||||||
|
Stockholders’ equity
|
1,621.2
|
2,332.1
|
||||||
|
Total liabilities and stockholders’ equity
|
$
|
26,494.8
|
$
|
30,387.7
|
||||
7
Alliance Data Systems Corporation
January 30, 2020
ALLIANCE DATA SYSTEMS CORPORATION
CONDENSED CONSOLIDATED STATEMENTS OF CASH FLOWS
(In millions)
(Unaudited)
|
|
Year Ended
December 31,
|
||||||||
|
|
2019
|
2018
|
|||||||
|
|
|||||||||
|
Cash Flows from Operating Activities:
|
|||||||||
|
Net income
|
$
|
310.9
|
$
|
963.1
|
|||||
|
Adjustments to reconcile net income to net cash provided by operating activities:
|
|||||||||
|
Depreciation and amortization
|
249.3
|
487.3
|
|||||||
|
Deferred income taxes
|
(178.9
|
)
|
16.3
|
||||||
|
Provision for loan loss
|
1,187.5
|
1,016.0
|
|||||||
|
Non-cash stock compensation
|
54.8
|
80.8
|
|||||||
|
Amortization of deferred financing costs
|
43.4
|
47.3
|
|||||||
|
Gain on sale of business
|
(512.2
|
)
|
—
|
||||||
|
Loss on extinguishment of debt
|
71.9
|
—
|
|||||||
|
Asset impairment charges
|
52.0
|
—
|
|||||||
|
Change in operating assets and liabilities, net of sale of business
|
(302.0
|
)
|
(184.2
|
)
|
|||||
|
Originations of loan receivables held for sale
|
—
|
(4,799.0
|
)
|
||||||
|
Sales of loan receivables held for sale
|
—
|
4,928.8
|
|||||||
|
Other
|
241.0
|
198.5
|
|||||||
|
Net cash provided by operating activities
|
1,217.7
|
2,754.9
|
|||||||
|
Cash Flows from Investing Activities:
|
|||||||||
|
Change in redemption settlement assets
|
(9.5
|
)
|
(42.2
|
)
|
|||||
|
Change in credit card and loan receivables
|
(2,586.8
|
)
|
(2,749.6
|
)
|
|||||
|
Proceeds from sale of business
|
4,409.7
|
—
|
|||||||
|
Purchase of credit card portfolios
|
(924.8
|
)
|
—
|
||||||
|
Sale of credit card portfolios
|
2,061.8
|
1,153.5
|
|||||||
|
Capital expenditures
|
(142.3
|
)
|
(199.8
|
)
|
|||||
|
Other
|
52.7
|
(33.9
|
)
|
||||||
|
Net cash provided by (used in) investing activities
|
2,860.8
|
(1,872.0
|
)
|
||||||
|
Cash Flows from Financing Activities:
|
|||||||||
|
Borrowings under debt agreements
|
3,111.3
|
4,575.3
|
|||||||
|
Repayments of borrowings
|
(5,981.8
|
)
|
(4,893.0
|
)
|
|||||
|
Net increase in deposits
|
355.6
|
864.1
|
|||||||
|
Non-recourse borrowings of consolidated securitization entities
|
4,851.8
|
3,714.6
|
|||||||
|
Repayments/maturities of non-recourse borrowings of consolidated securitization entities
|
(5,219.0
|
)
|
(4,871.0
|
)
|
|||||
|
Payment of debt extinguishment costs
|
(46.1
|
)
|
—
|
||||||
|
Payment of deferred financing costs
|
(45.4
|
)
|
(25.8
|
)
|
|||||
|
Purchase of treasury shares
|
(976.1
|
)
|
(443.2
|
)
|
|||||
|
Dividends paid
|
(127.4
|
)
|
(125.2
|
)
|
|||||
|
Other
|
(14.6
|
)
|
(13.7
|
)
|
|||||
|
Net cash used in financing activities
|
(4,091.7
|
)
|
(1,217.9
|
)
|
|||||
|
Effect of exchange rate changes on cash, cash equivalents and restricted cash
|
3.6
|
(12.0
|
)
|
||||||
|
Change in cash, cash equivalents and restricted cash
|
(9.6
|
)
|
(347.0
|
)
|
|||||
|
Cash, cash equivalents and restricted cash at beginning of period
|
3,967.7
|
4,314.7
|
|||||||
|
Cash, cash equivalents and restricted cash at end of period
|
$
|
3,958.1
|
$
|
3,967.7
|
|||||
Note: The cash flow statement is presented with the combined
cash flows from discontinued operations with cash flows from continuing operations within each cash flow statement category.
8
Alliance Data Systems Corporation
January 30, 2020
ALLIANCE DATA SYSTEMS CORPORATION
SUMMARY FINANCIAL HIGHLIGHTS
(In millions)
(Unaudited)
|
Three Months Ended
December 31,
|
Year Ended
December 31,
|
|||||||||||||||||||||||
|
2019
|
2018
|
Change
|
2019
|
2018
|
Change
|
|||||||||||||||||||
|
Segment Revenue:
|
||||||||||||||||||||||||
|
LoyaltyOne
|
$
|
332.4
|
$
|
333.3
|
—
|
%
|
$
|
1,033.1
|
$
|
1,068.4
|
(3
|
)%
|
||||||||||||
|
Card Services
|
1,128.4
|
1,131.1
|
—
|
4,547.8
|
4,597.6
|
(1
|
)
|
|||||||||||||||||
|
Corporate/Other
|
0.2
|
0.2
|
nm*
|
0.4
|
0.6
|
nm*
|
||||||||||||||||||
|
Total
|
$
|
1,461.0
|
$
|
1,464.6
|
—
|
%
|
$
|
5,581.3
|
$
|
5,666.6
|
(2
|
)%
|
||||||||||||
|
Segment Adjusted EBITDA, net:
|
||||||||||||||||||||||||
|
LoyaltyOne
|
$
|
80.3
|
$
|
67.4
|
19
|
%
|
$
|
244.5
|
$
|
254.2
|
(4
|
)%
|
||||||||||||
|
Card Services
|
209.6
|
427.4
|
(51
|
)
|
1,119.7
|
1,496.0
|
(25
|
)
|
||||||||||||||||
|
Corporate/Other
|
(12.1
|
)
|
(36.4
|
)
|
(67
|
)
|
(92.9
|
)
|
(140.8
|
)
|
(34
|
)
|
||||||||||||
|
Total
|
$
|
277.8
|
$
|
458.4
|
(39
|
)%
|
$
|
1,271.3
|
$
|
1,609.4
|
(21
|
)%
|
||||||||||||
|
Key Performance Indicators:
|
||||||||||||||||||||||||
|
Credit sales
|
$
|
9,297
|
$
|
8,953
|
4
|
%
|
$
|
30,987
|
$
|
30,702
|
1
|
%
|
||||||||||||
|
Credit sales - active
|
$
|
8,602
|
$
|
7,774
|
11
|
%
|
$
|
27,832
|
$
|
25,376
|
10
|
%
|
||||||||||||
|
Average receivables
|
$
|
18,096
|
$
|
16,775
|
8
|
%
|
$
|
17,298
|
$
|
17,412
|
(1
|
)%
|
||||||||||||
|
Gross yield
|
23.3
|
%
|
23.6
|
%
|
(0.3
|
)%
|
24.0
|
%
|
24.5
|
%
|
(0.5
|
)%
|
||||||||||||
|
Net principal loss rate
|
6.3
|
%
|
5.5
|
%
|
0.8
|
%
|
6.1
|
%
|
6.1
|
%
|
—
|
%
|
||||||||||||
|
Delinquency rate
|
5.8
|
%
|
5.7
|
%
|
0.1
|
%
|
5.8
|
%
|
5.7
|
%
|
0.1
|
%
|
||||||||||||
|
AIR MILES reward miles issued
|
1,486
|
1,468
|
1
|
%
|
5,511
|
5,500
|
—
|
%
|
||||||||||||||||
|
AIR MILES reward miles redeemed
|
1,199
|
1,160
|
3
|
%
|
4,416
|
4,482
|
(1
|
)%
|
||||||||||||||||
* nm-not meaningful
9
Alliance Data Systems Corporation
January 30, 2020
ALLIANCE DATA SYSTEMS CORPORATION
RECONCILIATION OF NON-GAAP FINANCIAL MEASURES
(In millions, except per share amounts)
(Unaudited)
|
|
Three Months Ended
December 31,
|
Year Ended
December 31,
|
|||||||||||||||
|
|
2019
|
2018
|
2019
|
2018
|
|||||||||||||
|
Adjusted EBITDA and Adjusted EBITDA, net:
|
|||||||||||||||||
|
Income from continuing operations
|
$
|
130.4
|
$
|
253.1
|
$
|
572.6
|
$
|
945.5
|
|||||||||
|
Income tax expense
|
37.0
|
110.7
|
165.8
|
269.5
|
|||||||||||||
|
Total interest expense, net
|
141.6
|
144.8
|
569.0
|
542.3
|
|||||||||||||
|
Depreciation and other amortization
|
20.1
|
21.0
|
79.9
|
80.7
|
|||||||||||||
|
Amortization of purchased intangibles
|
22.9
|
26.4
|
96.2
|
112.9
|
|||||||||||||
|
Stock compensation expense
|
0.5
|
9.2
|
25.1
|
44.4
|
|||||||||||||
|
Strategic transaction costs (1)
|
6.7
|
—
|
11.7
|
—
|
|||||||||||||
|
Restructuring and other charges (2)
|
33.0
|
—
|
118.1
|
—
|
|||||||||||||
|
Loss on extinguishment of debt (3)
|
—
|
—
|
71.9
|
—
|
|||||||||||||
|
Adjusted EBITDA
|
$
|
392.2
|
$
|
565.2
|
$
|
1,710.3
|
$
|
1,995.3
|
|||||||||
|
Less: Funding costs (4)
|
114.4
|
106.8
|
439.0
|
385.9
|
|||||||||||||
|
Adjusted EBITDA, net of funding costs
|
$
|
277.8
|
$
|
458.4
|
$
|
1,271.3
|
$
|
1,609.4
|
|||||||||
|
Core Earnings:
|
|||||||||||||||||
|
Income from continuing operations
|
$
|
130.4
|
$
|
253.1
|
$
|
572.6
|
$
|
945.5
|
|||||||||
|
Add back: non-cash/ non-operating items:
|
|||||||||||||||||
|
Stock compensation expense
|
0.5
|
9.2
|
25.1
|
44.4
|
|||||||||||||
|
Amortization of purchased intangibles
|
22.9
|
26.4
|
96.2
|
112.9
|
|||||||||||||
|
Non-cash interest (5)
|
10.7
|
9.3
|
39.9
|
40.3
|
|||||||||||||
|
Strategic transaction costs (1)
|
6.7
|
—
|
11.7
|
—
|
|||||||||||||
|
Restructuring and other charges (2)
|
33.0
|
—
|
118.1
|
—
|
|||||||||||||
|
Loss on extinguishment of debt (3)
|
—
|
—
|
71.9
|
—
|
|||||||||||||
|
Income tax effect (6)
|
(8.1
|
)
|
14.6
|
(81.4
|
)
|
(69.6
|
)
|
||||||||||
|
Core earnings
|
$
|
196.1
|
$
|
312.6
|
$
|
854.1
|
$
|
1,073.5
|
|||||||||
|
Weighted average shares outstanding – diluted
|
47.6
|
54.2
|
50.9
|
55.1
|
|||||||||||||
|
Core earnings per share – diluted
|
$
|
4.12
|
$
|
5.76
|
$
|
16.77
|
$
|
19.49
|
|||||||||
|
(1)
|
Represents costs for professional services associated with strategic initiatives.
|
|
(2)
|
Represents costs associated with restructuring or other exit activities.
|
|
(3)
|
Represents loss on extinguishment of debt resulting from the redemption price of the senior notes and the write-off of deferred issuance costs
related to the July 2019 extinguishment of $1.9 billion outstanding senior notes and a mandatory payment of $500.0 million of the Company’s revolving credit facility.
|
|
(4)
|
Represents interest expense on deposits and securitization funding costs.
|
|
(5)
|
Represents amortization of debt issuance costs.
|
|
(6)
|
Represents the tax effect including the related non-GAAP measure adjustments using the effective tax rate.
|
10
Alliance Data Systems Corporation
January 30, 2020
|
Three Months Ended December 31, 2019
|
||||||||||||||||
|
|
LoyaltyOne
|
Card
Services
|
Corporate/
Other
|
Total
|
||||||||||||
|
Operating income (loss)
|
$
|
57.4
|
$
|
276.3
|
$
|
(24.7
|
)
|
$
|
309.0
|
|||||||
|
Depreciation and amortization
|
20.5
|
20.9
|
1.6
|
43.0
|
||||||||||||
|
Stock compensation expense
|
0.8
|
(0.5
|
)
|
0.2
|
0.5
|
|||||||||||
|
Strategic transaction costs
|
0.7
|
—
|
6.0
|
6.7
|
||||||||||||
|
Restructuring and other charges
|
0.9
|
27.3
|
4.8
|
33.0
|
||||||||||||
|
Adjusted EBITDA
|
80.3
|
324.0
|
(12.1
|
)
|
392.2
|
|||||||||||
|
Less: Funding costs
|
—
|
114.4
|
—
|
114.4
|
||||||||||||
|
Adjusted EBITDA, net
|
$
|
80.3
|
$
|
209.6
|
$
|
(12.1
|
)
|
$
|
277.8
|
|||||||
|
Three Months Ended December 31, 2018
|
||||||||||||||||
|
|
LoyaltyOne
|
Card
Services
|
Corporate/
Other
|
Total
|
||||||||||||
|
Operating income (loss)
|
$
|
45.1
|
$
|
506.3
|
$
|
(42.8
|
)
|
$
|
508.6
|
|||||||
|
Depreciation and amortization
|
20.3
|
25.1
|
2.0
|
47.4
|
||||||||||||
|
Stock compensation expense
|
2.0
|
2.8
|
4.4
|
9.2
|
||||||||||||
|
Adjusted EBITDA
|
67.4
|
534.2
|
(36.4
|
)
|
565.2
|
|||||||||||
|
Less: Funding costs
|
—
|
106.8
|
—
|
106.8
|
||||||||||||
|
Adjusted EBITDA, net
|
$
|
67.4
|
$
|
427.4
|
$
|
(36.4
|
)
|
$
|
458.4
|
|||||||
|
Year Ended December 31, 2019
|
||||||||||||||||
|
|
LoyaltyOne
|
Card
Services
|
Corporate/
Other
|
Total
|
||||||||||||
|
Operating income (loss)
|
$
|
105.4
|
$
|
1,430.7
|
$
|
(228.7
|
)
|
$
|
1,307.4
|
|||||||
|
Depreciation and amortization
|
80.1
|
89.3
|
6.7
|
176.1
|
||||||||||||
|
Stock compensation expense
|
7.2
|
9.3
|
8.6
|
25.1
|
||||||||||||
|
Strategic transaction costs
|
1.0
|
—
|
10.7
|
11.7
|
||||||||||||
|
Restructuring and other charges
|
50.8
|
29.4
|
37.9
|
118.1
|
||||||||||||
|
Loss on extinguishment of debt
|
—
|
—
|
71.9
|
71.9
|
||||||||||||
|
Adjusted EBITDA
|
244.5
|
1,558.7
|
(92.9
|
)
|
1,710.3
|
|||||||||||
|
Less: Funding costs
|
—
|
439.0
|
—
|
439.0
|
||||||||||||
|
Adjusted EBITDA, net
|
$
|
244.5
|
$
|
1,119.7
|
$
|
(92.9
|
)
|
$
|
1,271.3
|
|||||||
|
Year Ended December 31, 2018
|
||||||||||||||||
|
|
LoyaltyOne
|
Card
Services
|
Corporate/
Other
|
Total
|
||||||||||||
|
Operating income (loss)
|
$
|
159.4
|
$
|
1,767.5
|
$
|
(169.6
|
)
|
$
|
1,757.3
|
|||||||
|
Depreciation and amortization
|
84.8
|
101.1
|
7.7
|
193.6
|
||||||||||||
|
Stock compensation expense
|
10.0
|
13.3
|
21.1
|
44.4
|
||||||||||||
|
Adjusted EBITDA
|
254.2
|
1,881.9
|
(140.8
|
)
|
1,995.3
|
|||||||||||
|
Less: Funding costs
|
—
|
385.9
|
—
|
385.9
|
||||||||||||
|
Adjusted EBITDA, net
|
$
|
254.2
|
$
|
1,496.0
|
$
|
(140.8
|
)
|
$
|
1,609.4
|
|||||||
11
Exhibit 99.2
Alliance Data NYSE: ADS Full Year 2019 ResultsJanuary 30, 2020
2 Forward-Looking StatementsThis presentation contains forward-looking statements within the meaning of
Section 27A of the Securities Act of 1933 and Section 21E of the Securities Exchange Act of 1934. Forward-looking statements give our expectations or forecasts of future events and can generally be identified by the use of words such as
“believe,” “expect,” “anticipate,” “estimate,” “intend,” “project,” “plan,” “likely,” “may,” “should” or other words or phrases of similar import. Similarly, statements that describe our business strategy, outlook, objectives, plans, intentions
or goals also are forward-looking statements. Examples of forward-looking statements include, but are not limited to, statements we make regarding strategic initiatives, our expected operating results, future economic conditions including
currency exchange rates, future dividend declarations and the guidance we give with respect to our anticipated financial performance.We believe that our expectations are based on reasonable assumptions. Forward-looking statements, however, are
subject to a number of risks and uncertainties that could cause actual results to differ materially from the projections, anticipated results or other expectations expressed in this release, and no assurances can be given that our expectations
will prove to have been correct. These risks and uncertainties include, but are not limited to, factors set forth in the Risk Factors section in our Annual Report on Form 10-K for the most recently ended fiscal year, which may be updated in
Item 1A of, or elsewhere in, our Quarterly Reports on Form 10-Q filed for periods subsequent to such Form 10-K. Further risks and uncertainties include, but are not limited to, the impact of strategic initiatives on us or our business if any
transactions are undertaken, and whether the anticipated benefits of such transactions can be realized as well as whether or if any share repurchases are undertaken.Our forward-looking statements speak only as of the date made, and we undertake
no obligation, other than as required by applicable law, to update or revise any forward-looking statements, whether as a result of new information, subsequent events, anticipated or unanticipated circumstances or otherwise.
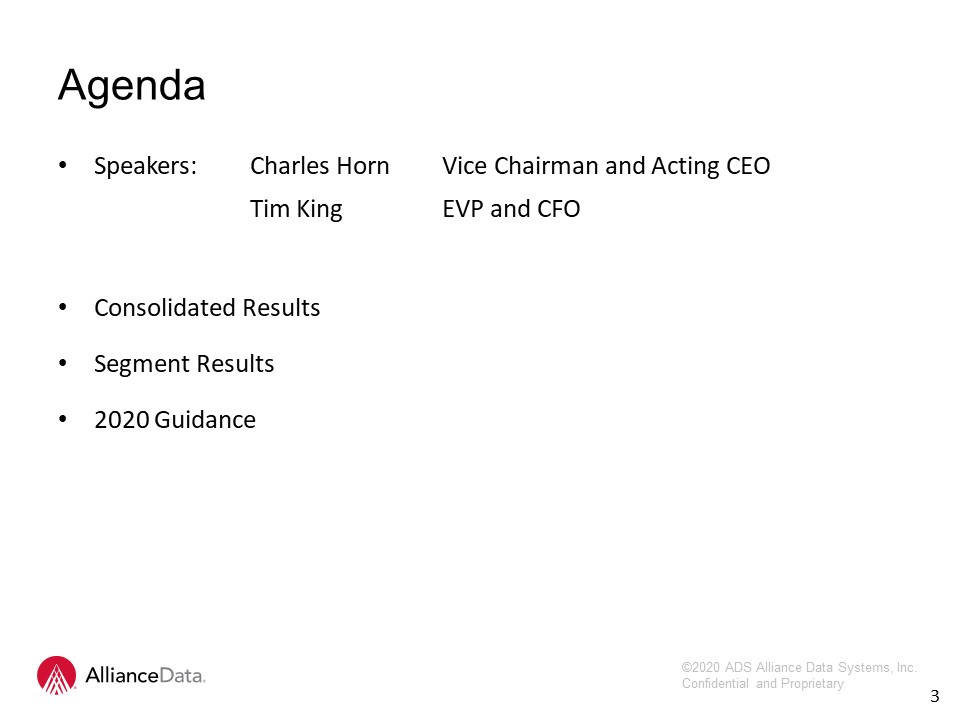
Agenda Speakers: Charles Horn Vice Chairman and Acting CEO Tim King EVP and CFO Consolidated
ResultsSegment Results2020 Guidance 3
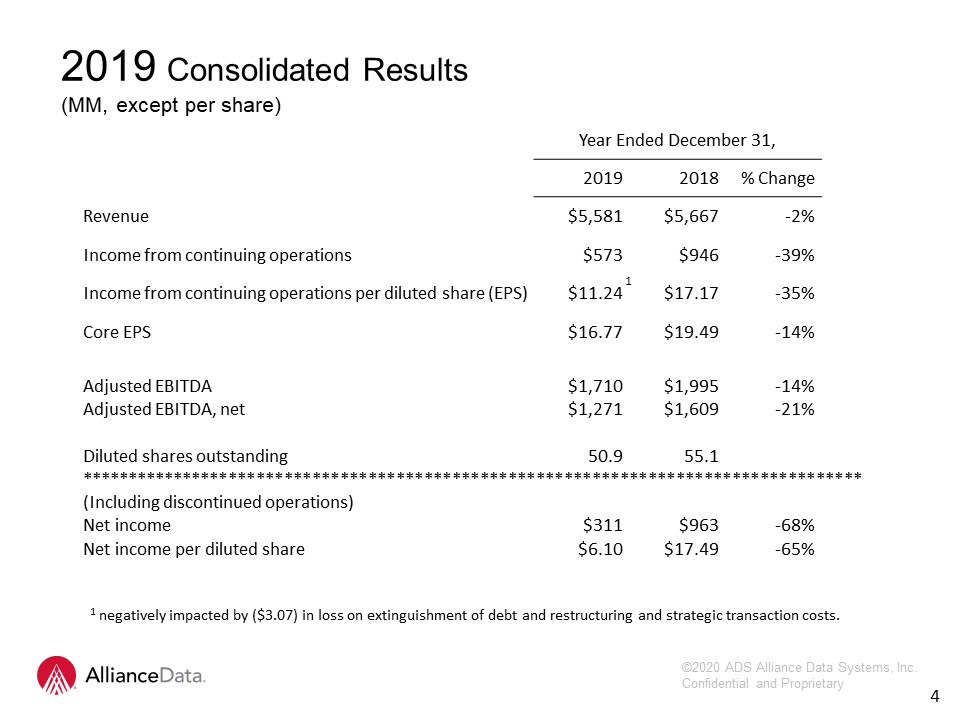
2019 Consolidated Results(MM, except per share) 4 Year Ended December 31, 2019 2018 %
Change Revenue $5,581 $5,667 -2% Income from continuing operations $573 $946 -39% Income from continuing operations per diluted share (EPS) $11.24 $17.17 -35% Core EPS $16.77 $19.49 -14%
Adjusted EBITDA $1,710 $1,995 -14% Adjusted EBITDA, net $1,271 $1,609 -21% Diluted shares
outstanding 50.9 55.1 ************************************************************************************ (Including discontinued operations) Net income $311 $963 -68% Net income per diluted share $6.10
$17.49 -65% 1 1 negatively impacted by ($3.07) in loss on extinguishment of debt and restructuring and strategic transaction costs.
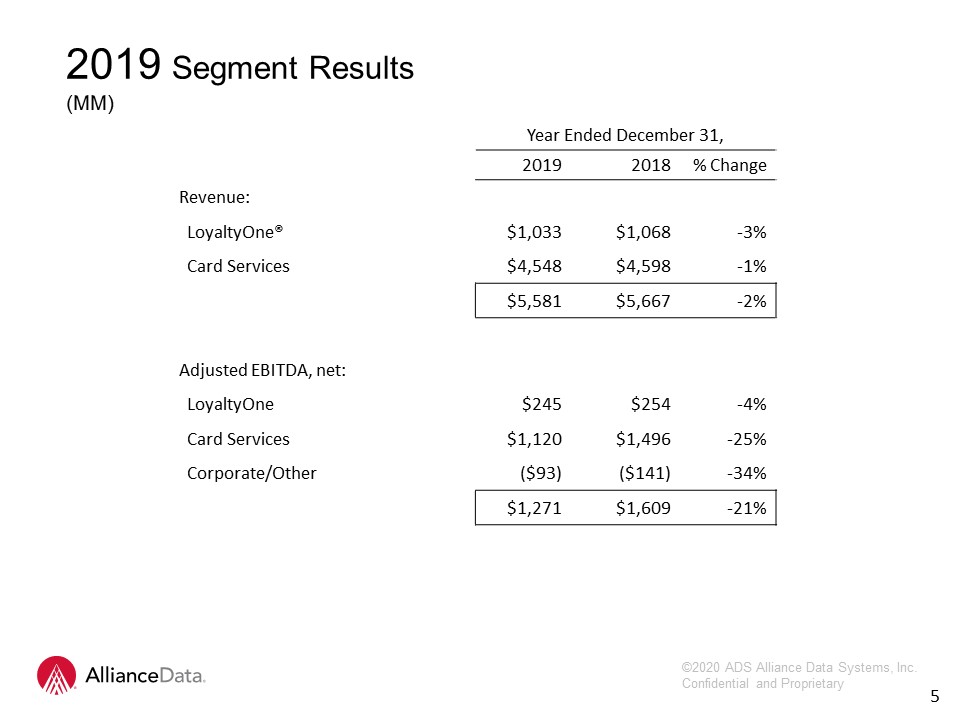
2019 Segment Results(MM) 5 Year Ended December 31, 2019 2018 %
Change Revenue: LoyaltyOne® $1,033 $1,068 -3% Card Services $4,548 $4,598 -1% $5,581 $5,667 -2% Adjusted EBITDA, net: LoyaltyOne $245 $254 -4% Card
Services $1,120 $1,496 -25% Corporate/Other ($93) ($141) -34% $1,271 $1,609 -21%
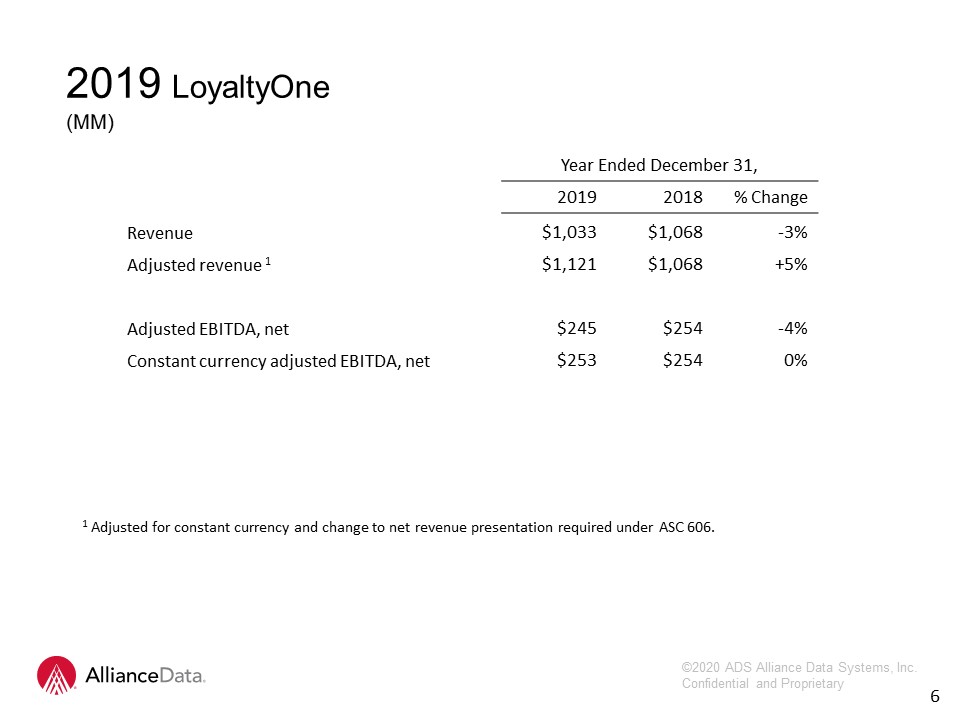
Year Ended December 31, 2019 2018 % Change Revenue $1,033 $1,068 -3% Adjusted
revenue 1 $1,121 $1,068 +5% Adjusted EBITDA, net $245 $254 -4% Constant currency adjusted EBITDA, net $253 $254 0% 2019 LoyaltyOne(MM) 1 Adjusted for constant currency and change to net revenue
presentation required under ASC 606. 6
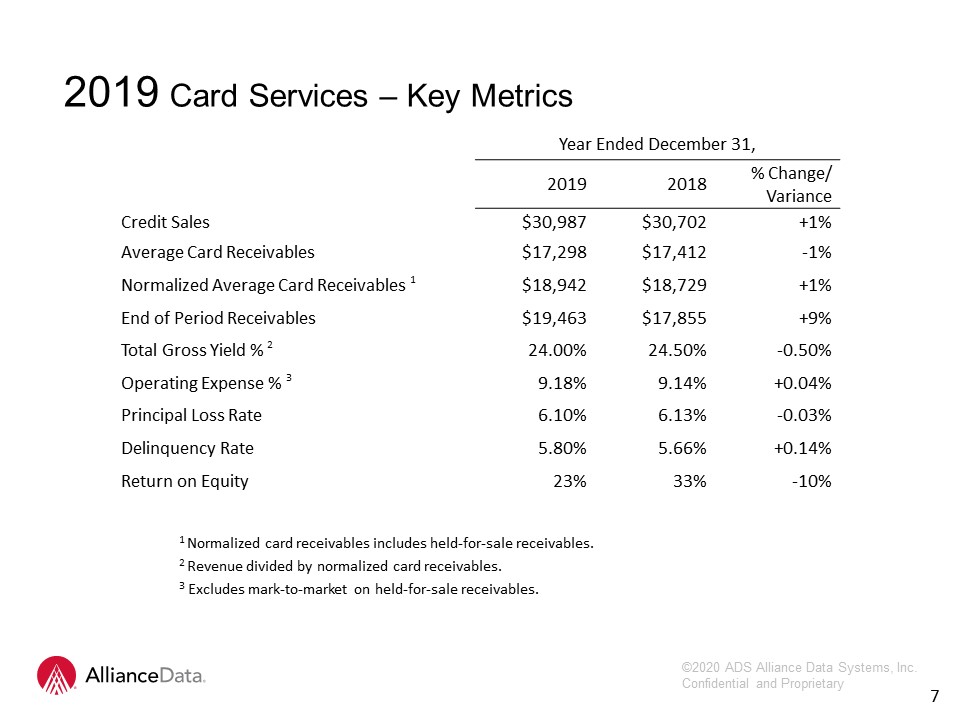
2019 Card Services – Key Metrics 7 1 Normalized card receivables includes held-for-sale receivables.2
Revenue divided by normalized card receivables.3 Excludes mark-to-market on held-for-sale receivables. Year Ended December 31, 2019 2018 % Change/Variance Credit Sales $30,987 $30,702 +1% Average Card Receivables $17,298
$17,412 -1% Normalized Average Card Receivables 1 $18,942 $18,729 +1% End of Period Receivables $19,463 $17,855 +9% Total Gross Yield % 2 24.00% 24.50% -0.50% Operating Expense % 3 9.18% 9.14% +0.04% Principal Loss
Rate 6.10% 6.13% -0.03% Delinquency Rate 5.80% 5.66% +0.14% Return on Equity 23% 33% -10%
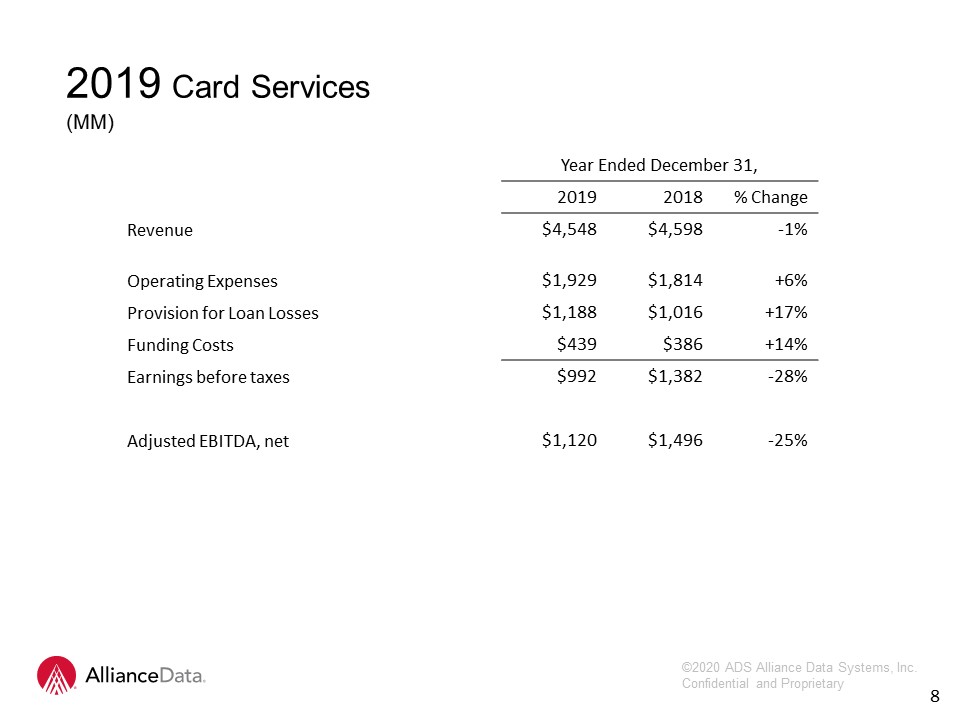
Year Ended December 31, 2019 2018 %
Change Revenue $4,548 $4,598 -1% Operating Expenses $1,929 $1,814 +6% Provision for Loan Losses $1,188 $1,016 +17% Funding Costs $439 $386 +14% Earnings before taxes $992 $1,382 -28% Adjusted
EBITDA, net $1,120 $1,496 -25% 2019 Card Services(MM) 8
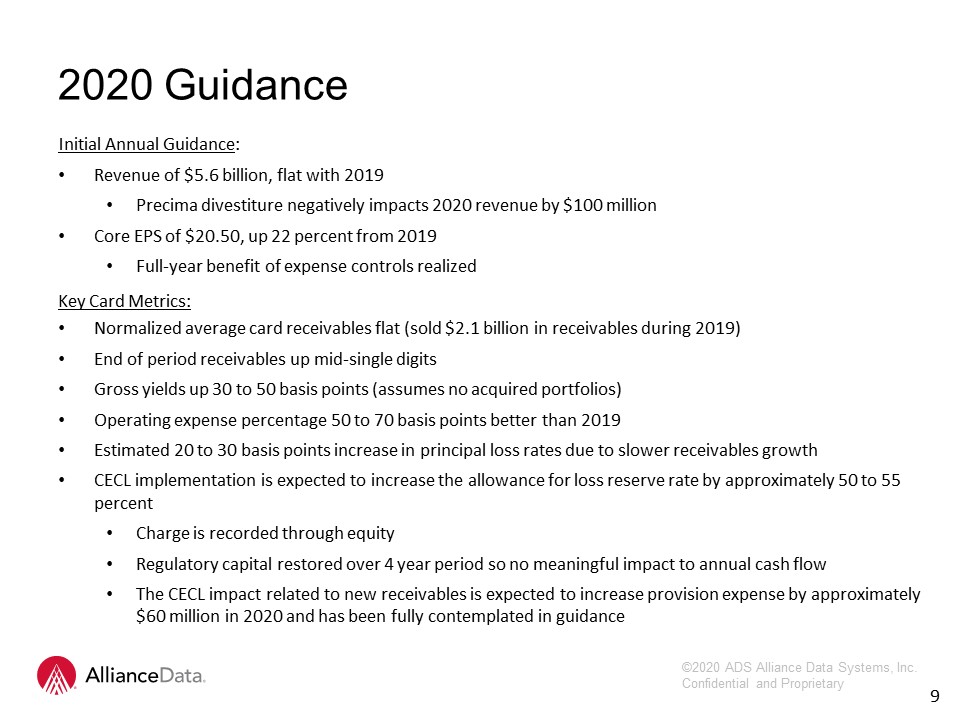
Initial Annual Guidance:Revenue of $5.6 billion, flat with 2019Precima divestiture negatively impacts
2020 revenue by $100 millionCore EPS of $20.50, up 22 percent from 2019Full-year benefit of expense controls realizedKey Card Metrics:Normalized average card receivables flat (sold $2.1 billion in receivables during 2019) End of period
receivables up mid-single digitsGross yields up 30 to 50 basis points (assumes no acquired portfolios)Operating expense percentage 50 to 70 basis points better than 2019 Estimated 20 to 30 basis points increase in principal loss rates due to
slower receivables growthCECL implementation is expected to increase the allowance for loss reserve rate by approximately 50 to 55 percentCharge is recorded through equityRegulatory capital restored over 4 year period so no meaningful impact to
annual cash flowThe CECL impact related to new receivables is expected to increase provision expense by approximately $60 million in 2020 and has been fully contemplated in guidance 9 2020 Guidance
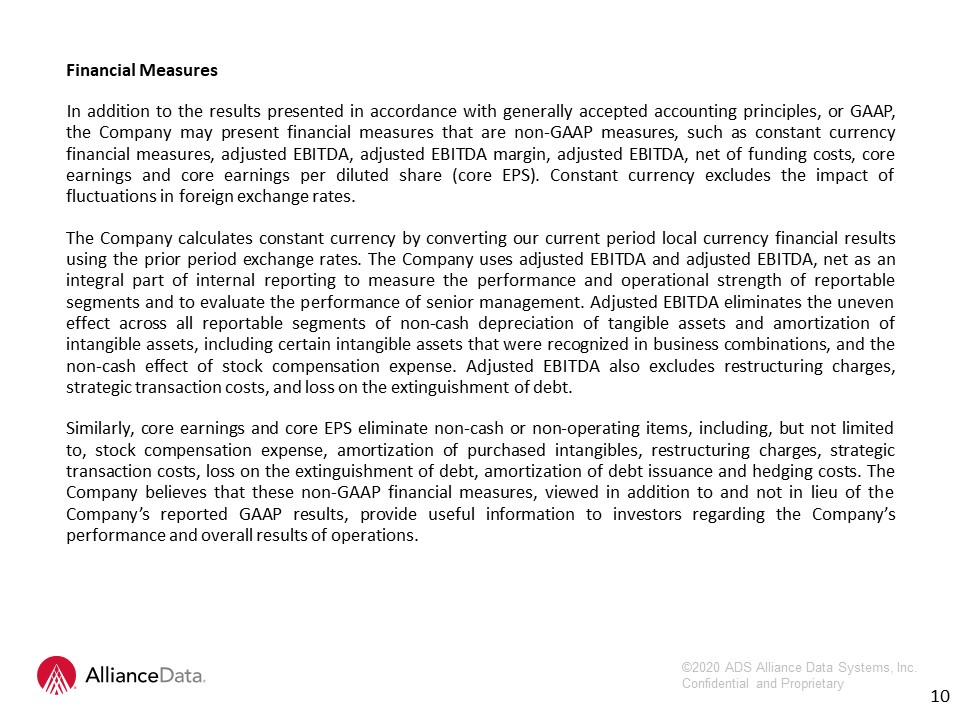
10 Financial MeasuresIn addition to the results presented in accordance with generally accepted
accounting principles, or GAAP, the Company may present financial measures that are non-GAAP measures, such as constant currency financial measures, adjusted EBITDA, adjusted EBITDA margin, adjusted EBITDA, net of funding costs, core earnings
and core earnings per diluted share (core EPS). Constant currency excludes the impact of fluctuations in foreign exchange rates. The Company calculates constant currency by converting our current period local currency financial results using
the prior period exchange rates. The Company uses adjusted EBITDA and adjusted EBITDA, net as an integral part of internal reporting to measure the performance and operational strength of reportable segments and to evaluate the performance of
senior management. Adjusted EBITDA eliminates the uneven effect across all reportable segments of non-cash depreciation of tangible assets and amortization of intangible assets, including certain intangible assets that were recognized in
business combinations, and the non-cash effect of stock compensation expense. Adjusted EBITDA also excludes restructuring charges, strategic transaction costs, and loss on the extinguishment of debt.Similarly, core earnings and core EPS
eliminate non-cash or non-operating items, including, but not limited to, stock compensation expense, amortization of purchased intangibles, restructuring charges, strategic transaction costs, loss on the extinguishment of debt, amortization of
debt issuance and hedging costs. The Company believes that these non-GAAP financial measures, viewed in addition to and not in lieu of the Company’s reported GAAP results, provide useful information to investors regarding the Company’s
performance and overall results of operations.

Q & A 11