Bank of New York Mellon Corp 8-K, filed Oct 16, 2025
Bank of New York Mellon Corp (BNY)
8-K
2025-10-16
For: 2025-10-16
View Original
Added on
April 09, 2026
About this 8-K
Bank of New York Mellon Corp filed this 8-K on October 16, 2025.
Items reported
- Item 2.02: Financial results
- Item 7.01: Regulation FD disclosure
- Item 9.01: Financial statements and exhibits
UNITED STATES
SECURITIES AND EXCHANGE COMMISSION
Washington, D.C. 20549
FORM 8-K
CURRENT REPORT
Pursuant to Section 13 or 15(d) of the Securities Exchange Act of 1934
Date of Report (Date of earliest event reported) – October 16, 2025
(Exact name of registrant as specified in its charter)
| (State or other jurisdiction of incorporation) | (Commission File Number) | (I.R.S. Employer Identification No.) | ||||||
(Address of principal executive offices) (Zip Code)
Registrant’s telephone number, including area code – (212 ) 495-1784
Not Applicable
(Former name or former address, if changed since last report)
Check the appropriate box below if the Form 8-K filing is intended to simultaneously satisfy the filing obligation of the registrant under any of the following provisions:
Securities registered pursuant to Section 12(b) of the Act:
Title of each class | Trading symbol(s) | Name of each exchange on which registered | ||||||
| (fully and unconditionally guaranteed by The Bank of New York Mellon Corporation) | ||||||||
| Perpetual Preferred Stock | ||||||||
Indicate by check mark whether the registrant is an emerging growth company as defined in Rule 405 of the Securities Act of 1933 (§230.405 of this chapter) or Rule 12b-2 under the Securities Exchange Act of 1934 (§240.12b-2 of this chapter).
Emerging growth company ☐
If an emerging growth company, indicate by check mark if the registrant has elected not to use the extended transition period for complying with any new or revised financial accounting standards provided pursuant to Section 13(a) of the Exchange Act. ☐
ITEM 2.02. RESULTS OF OPERATIONS AND FINANCIAL CONDITION.
On October 16, 2025, The Bank of New York Mellon Corporation (“BNY”) released information on its financial results for the third quarter ended September 30, 2025. Copies of the Earnings Release and the Financial Supplement are attached hereto as Exhibit 99.1 and Exhibit 99.2, respectively, and are incorporated herein by reference.
ITEM 7.01. REGULATION FD DISCLOSURE.
On October 16, 2025, BNY will hold a conference call and webcast to discuss its financial results for the third quarter ended September 30, 2025 and outlook. A copy of the Quarterly Update Presentation for the conference call and webcast is attached hereto as Exhibit 99.3.
ITEM 9.01. FINANCIAL STATEMENTS AND EXHIBITS.
(d) EXHIBITS.
| Exhibit | ||||||||
| Number | Description | |||||||
| 99.1 | ||||||||
| The quotation in Exhibit 99.1 (the “Excluded Section”) shall not be deemed “filed” for purposes of Section 18 of the Securities Exchange Act of 1934 (“Exchange Act”) or otherwise subject to the liabilities under that Section and shall not be deemed to be incorporated by reference into any filing of BNY under the Securities Act of 1933 or the Exchange Act. The information included in Exhibit 99.1, other than in the Excluded Section, shall be deemed “filed” for purposes of the Exchange Act. | ||||||||
| 99.2 | ||||||||
| The information included in Exhibit 99.2 shall be deemed “filed” for purposes of the Exchange Act. | ||||||||
| 99.3 | ||||||||
| The information included in Exhibit 99.3 shall not be deemed “filed” for purposes of Section 18 of the Exchange Act or otherwise subject to the liabilities under that Section and shall not be deemed to be incorporated by reference into any filing of BNY under the Securities Act of 1933 or the Exchange Act. | ||||||||
| 104 | Cover Page Interactive Data File - the cover page XBRL tags are embedded within the Inline XBRL document. | |||||||
2
SIGNATURES
Pursuant to the requirements of the Securities Exchange Act of 1934, the Registrant has duly caused this report to be signed on its behalf by the undersigned hereunto duly authorized.
The Bank of New York Mellon Corporation (Registrant) | |||||||||||
| Date: October 16, 2025 | By: | /s/ Jean Weng | |||||||||
| Name: Title: | Jean Weng Secretary | ||||||||||
3
 | 3Q25 | FINANCIALRESULTS | ||||||||||||
BNY Reports Third Quarter 2025
Earnings Per Common Share of $1.88
NEW YORK, October 16, 2025 – The Bank of New York Mellon Corporation (“BNY”) (NYSE: BK) today has reported financial results for the third quarter of 2025.
| CEO COMMENTARY | ||||||||
 | BNY delivered another quarter of strong results. Record revenue of $5.1 billion was up 9% year-over-year on the back of broad-based growth across the platforms that make up our Securities Services and Market and Wealth Services segments, and we continued to drive significant positive operating leverage. Taken together, we reported a pre-tax margin of 36%, generated an ROTCE of 26%, and earnings per share of $1.88 were up 25% year-over-year. | |||||||
Our two core transformation programs are showing results. The new commercial model is enabling greater sales momentum and multi-product solutioning, and as we continue to transition additional parts of the company into our platforms operating model, we see the benefits of this new way of working starting to materialize. In addition, we are embracing the power of AI, which, we believe, is for everyone, everywhere and for everything. Last month we launched for all our people the next version of BNY’s AI platform, Eliza – smarter, faster and easier to use. | ||||||||
| It is our people and culture that propel us forward on our mission to unlock BNY’s full potential for our clients and shareholders. The clear signs of progress across the company give us confidence that the strategy is working. |  | |||||||
– Robin Vince, Chief Executive Officer | ||||||||
| EPS | Pre-tax margin | ROE | ROTCE | |||||||||||||||||||||||||||||||||||||||||||||||||||||
$1.88 | 36% | 13.7% | 25.6% (a) | |||||||||||||||||||||||||||||||||||||||||||||||||||||
| KEY FINANCIAL INFORMATION | |||||||||||
| (dollars in millions, except per share amounts and unless otherwise noted) | 3Q25 vs. | ||||||||||
| 3Q25 | 2Q25 | 3Q24 | |||||||||
| Selected income statement data: | |||||||||||
| Total fee revenue | $ | 3,637 | — | % | 7 | % | |||||
| Investment and other revenue | 208 | N/M | N/M | ||||||||
| Net interest income | 1,236 | 3 | % | 18 | % | ||||||
| Total revenue | $ | 5,081 | 1 | % | 9 | % | |||||
| Provision for credit losses | (7) | N/M | N/M | ||||||||
| Noninterest expense | $ | 3,236 | 1 | % | 4 | % | |||||
| Net income applicable to common shareholders | $ | 1,339 | (4) | % | 21 | % | |||||
| Diluted EPS | $ | 1.88 | (3) | % | 25 | % | |||||
| Selected metrics: | |||||||||||
AUC/A (in trillions) | $ | 57.8 | 4 | % | 11 | % | |||||
AUM (in trillions) | $ | 2.1 | 2 | % | — | % | |||||
| Financial ratios: | 3Q25 | 2Q25 | 3Q24 | ||||||||
| Pre-tax operating margin | 36 | % | 37 | % | 33 | % | |||||
| ROE | 13.7 | % | 14.7 | % | 12.0 | % | |||||
ROTCE (a) | 25.6 | % | 27.8 | % | 22.8 | % | |||||
| Capital ratios: | |||||||||||
| Tier 1 leverage ratio | 6.1 | % | 6.1 | % | 6.0 | % | |||||
| CET1 ratio | 11.7 | % | 11.5 | % | 11.9 | % | |||||
| HIGHLIGHTS | ||
Results
•Total revenue of $5.1 billion, increased 9%
•Noninterest expense of $3.2 billion, increased 4%
•Diluted EPS of $1.88, increased 25%
Profitability
•Pre-tax operating margin of 36%
•ROTCE of 25.6% (a)
Balance sheet
•Average deposits of $299 billion, increased 5% year-over-year and were flat sequentially
•Tier 1 leverage ratio of 6.1%, increased 6 bps year-over-year and 2 bps sequentially
Capital distribution
•Returned $1.2 billion of capital to common shareholders
•$381 million of dividends
•$849 million of share repurchases
•Total payout ratio of 92% year-to-date
(a) For information on the Non-GAAP measures, see “Explanation of GAAP and Non-GAAP financial measures” beginning on page 9. | |||||
| Note: Above comparisons are 3Q25 vs. 3Q24, unless otherwise noted. | |||||
Media: Anneliese Diedrichs + 1 646 468 6026 | Investors: Marius Merz +1 212 298 1480 | ||||
BNY 3Q25 Financial Results | ||
CONSOLIDATED FINANCIAL HIGHLIGHTS
| (dollars in millions, except per share amounts and unless otherwise noted; not meaningful - N/M) | 3Q25 vs. | ||||||||||||||||
| 3Q25 | 2Q25 | 3Q24 | 2Q25 | 3Q24 | |||||||||||||
| Fee revenue | $ | 3,637 | $ | 3,641 | $ | 3,404 | — | % | 7 | % | |||||||
| Investment and other revenue | 208 | 184 | 196 | N/M | N/M | ||||||||||||
| Total fee and other revenue | 3,845 | 3,825 | 3,600 | 1 | 7 | ||||||||||||
| Net interest income | 1,236 | 1,203 | 1,048 | 3 | 18 | ||||||||||||
| Total revenue | 5,081 | 5,028 | 4,648 | 1 | 9 | ||||||||||||
| Provision for credit losses | (7) | (17) | 23 | N/M | N/M | ||||||||||||
| Noninterest expense | 3,236 | 3,206 | 3,100 | 1 | 4 | ||||||||||||
| Income before taxes | 1,852 | 1,839 | 1,525 | 1 | 21 | ||||||||||||
| Provision for income taxes | 395 | 404 | 336 | (2) | 18 | ||||||||||||
| Net income | $ | 1,457 | $ | 1,435 | $ | 1,189 | 2 | % | 23 | % | |||||||
| Net income applicable to common shareholders of The Bank of New York Mellon Corporation | $ | 1,339 | $ | 1,391 | $ | 1,110 | (4) | % | 21 | % | |||||||
Operating leverage (a) | 11 | bps | 493 | bps | |||||||||||||
| Diluted earnings per common share | $ | 1.88 | $ | 1.93 | $ | 1.50 | (3) | % | 25 | % | |||||||
Average common shares and equivalents outstanding - diluted (in thousands) | 712,854 | 720,007 | 742,080 | ||||||||||||||
| Pre-tax operating margin | 36 | % | 37 | % | 33 | % | |||||||||||
| Metrics: | |||||||||||||||||
| Average loans | $ | 72,692 | $ | 71,265 | $ | 69,205 | 2 | % | 5 | % | |||||||
| Average deposits | 299,326 | 300,298 | 284,686 | — | 5 | ||||||||||||
AUC/A at period end (in trillions) (current period is preliminary) | 57.8 | 55.8 | 52.1 | 4 | 11 | ||||||||||||
AUM at period end (in trillions) (current period is preliminary) | 2.1 | 2.1 | 2.1 | 2 | — | ||||||||||||
Non-GAAP measures, excluding notable items: (b) | |||||||||||||||||
| Adjusted total revenue | $ | 5,069 | $ | 5,028 | $ | 4,648 | 1 | % | 9 | % | |||||||
| Adjusted noninterest expense | 3,197 | 3,194 | 3,075 | — | 4 | ||||||||||||
Adjusted operating leverage (a) | 73 | bps | 509 | bps | |||||||||||||
| Adjusted diluted earnings per common share | $ | 1.91 | $ | 1.94 | $ | 1.52 | (2) | % | 26 | % | |||||||
| Adjusted pre-tax operating margin | 37 | % | 37 | % | 33 | % | |||||||||||
(a) Operating leverage is the rate of increase (decrease) in total revenue less the rate of increase (decrease) in total noninterest expense.
(b) See “Explanation of GAAP and Non-GAAP financial measures” beginning on page 9 for additional information.
bps – basis points.
KEY DRIVERS (comparisons are 3Q25 vs. 3Q24, unless otherwise noted)
•Total revenue increased 9%, primarily reflecting:
•Fee revenue increased 7%, primarily reflecting net new business, higher client activity and market values, and the favorable impact of a weaker U.S. dollar, partially offset by the mix of AUM flows.
•Investment and other revenue increased primarily reflecting a disposal gain and other investment gains, partially offset by higher net securities losses.
•Net interest income increased 18%, primarily reflecting the continued reinvestment of maturing investment securities at higher yields and balance sheet growth, partially offset by changes in deposit mix.
•Provision for credit losses was a benefit of $7 million, primarily driven by changes in the macroeconomic forecast, partially offset by higher reserves related to commercial real estate exposure.
•Noninterest expense increased 4%, primarily reflecting higher investments, employee merit increases, higher revenue-related expenses and the unfavorable impact of the weaker U.S. dollar, partially offset by efficiency savings.
•Effective tax rate of 21.3%.
Assets under custody and/or administration (“AUC/A”) and Assets under management (“AUM”)
•AUC/A increased 11%, primarily reflecting client inflows and higher market values.
•AUM was flat primarily reflecting higher market values, partially offset by cumulative net outflows.
Capital and liquidity
•$381 million of dividends to common shareholders (a); $849 million of common share repurchases.
•Return on common equity (“ROE”) – 13.7%; Return on tangible common equity (“ROTCE”) – 25.6% (b).
•Common Equity Tier 1 (“CET1”) ratio – 11.7%; Tier 1 leverage ratio – 6.1%.
•Average liquidity coverage ratio (“LCR”) – 112%; Average net stable funding ratio (“NSFR”) – 130%.
•Total Loss Absorbing Capacity (“TLAC”) ratios exceed minimum requirements.
(a) Including dividend-equivalents on share-based awards.
(b) See “Explanation of GAAP and Non-GAAP financial measures” beginning on page 9 for additional information.
Note: Throughout this document, sequential growth rates are unannualized.
2 | ||
BNY 3Q25 Financial Results | ||
SECURITIES SERVICES BUSINESS SEGMENT HIGHLIGHTS
| (dollars in millions, unless otherwise noted; not meaningful - N/M) | 3Q25 vs. | |||||||||||||||||||||||||
| 3Q25 | 2Q25 | 3Q24 | 2Q25 | 3Q24 | ||||||||||||||||||||||
| Investment services fees: | ||||||||||||||||||||||||||
| Asset Servicing | $ | 1,141 | $ | 1,094 | $ | 1,021 | 4 | % | 12 | % | ||||||||||||||||
| Issuer Services | 313 | 376 | 285 | (17) | 10 | |||||||||||||||||||||
| Total investment services fees | 1,454 | 1,470 | 1,306 | (1) | 11 | |||||||||||||||||||||
| Foreign exchange revenue | 143 | 175 | 137 | (18) | 4 | |||||||||||||||||||||
Other fees (a) | 73 | 60 | 57 | 22 | 28 | |||||||||||||||||||||
| Total fee revenue | 1,670 | 1,705 | 1,500 | (2) | 11 | |||||||||||||||||||||
| Investment and other revenue | 119 | 94 | 105 | N/M | N/M | |||||||||||||||||||||
| Total fee and other revenue | 1,789 | 1,799 | 1,605 | (1) | 11 | |||||||||||||||||||||
| Net interest income | 670 | 675 | 609 | (1) | 10 | |||||||||||||||||||||
| Total revenue | 2,459 | 2,474 | 2,214 | (1) | 11 | |||||||||||||||||||||
| Provision for credit losses | (3) | (13) | 15 | N/M | N/M | |||||||||||||||||||||
| Noninterest expense | 1,656 | 1,620 | 1,557 | 2 | 6 | |||||||||||||||||||||
| Income before taxes | $ | 806 | $ | 867 | $ | 642 | (7) | % | 26 | % | ||||||||||||||||
| Total revenue by line of business: | ||||||||||||||||||||||||||
| Asset Servicing | $ | 1,915 | $ | 1,870 | $ | 1,720 | 2 | % | 11 | % | ||||||||||||||||
| Issuer Services | 544 | 604 | 494 | (10) | 10 | |||||||||||||||||||||
| Total revenue by line of business | $ | 2,459 | $ | 2,474 | $ | 2,214 | (1) | % | 11 | % | ||||||||||||||||
| Pre-tax operating margin | 33 | % | 35 | % | 29 | % | ||||||||||||||||||||
Securities lending revenue (b) | $ | 62 | $ | 56 | $ | 47 | 11 | % | 32 | % | ||||||||||||||||
| Metrics: | ||||||||||||||||||||||||||
| Average loans | $ | 10,706 | $ | 11,327 | $ | 11,077 | (5) | % | (3) | % | ||||||||||||||||
| Average deposits | $ | 183,081 | $ | 185,831 | $ | 180,500 | (1) | % | 1 | % | ||||||||||||||||
AUC/A at period end (in trillions) (current period is preliminary) (c) | $ | 41.7 | $ | 40.1 | $ | 37.5 | 4 | % | 11 | % | ||||||||||||||||
Market value of securities on loan at period end (in billions) (d) | $ | 554 | $ | 516 | $ | 484 | 7 | % | 14 | % | ||||||||||||||||
(a) Other fees primarily include financing-related fees.
(b) Included in investment services fees reported in the Asset Servicing line of business.
(c) Consists of AUC/A primarily from the Asset Servicing line of business and, to a lesser extent, the Issuer Services line of business. Includes the AUC/A of CIBC Mellon Trust Company (“CIBC Mellon”), a joint venture with the Canadian Imperial Bank of Commerce, of $2.1 trillion at Sept. 30, 2025, $2.0 trillion at June 30, 2025 and $1.9 trillion at Sept. 30, 2024.
(d) Represents the total amount of securities on loan in our agency securities lending program. Excludes securities for which BNY acts as agent on behalf of CIBC Mellon clients, which totaled $81 billion at Sept. 30, 2025, $68 billion at June 30, 2025 and $67 billion at Sept. 30, 2024.
KEY DRIVERS
•The drivers of the total revenue variances by line of business are indicated below.
•Asset Servicing – The year-over-year increase primarily reflects higher client activity, net interest income, market values and a disposal gain. The sequential increase primarily reflects higher client activity, market values and a disposal gain, partially offset by lower foreign exchange revenue.
•Issuer Services – The year-over-year increase primarily reflects higher Depositary Receipts revenue and net interest income in Corporate Trust. The sequential decrease primarily reflects lower Depositary Receipts revenue.
•Noninterest expense increased year-over-year primarily reflecting higher investments, severance expense and revenue-related expenses, and employee merit increases, partially offset by efficiency savings. The sequential increase primarily reflects higher severance expense, investments and litigation reserves, partially offset by lower revenue-related expenses.
3 | ||
BNY 3Q25 Financial Results | ||
MARKET AND WEALTH SERVICES BUSINESS SEGMENT HIGHLIGHTS
| (dollars in millions, unless otherwise noted; not meaningful - N/M) | 3Q25 vs. | ||||||||||||||||
| 3Q25 | 2Q25 | 3Q24 | 2Q25 | 3Q24 | |||||||||||||
| Investment services fees: | |||||||||||||||||
| Pershing | $ | 508 | $ | 513 | $ | 475 | (1) | % | 7 | % | |||||||
| Treasury Services | 214 | 209 | 200 | 2 | 7 | ||||||||||||
| Clearance and Collateral Management | 398 | 385 | 354 | 3 | 12 | ||||||||||||
| Total investment services fees | 1,120 | 1,107 | 1,029 | 1 | 9 | ||||||||||||
| Foreign exchange revenue | 31 | 30 | 23 | 3 | 35 | ||||||||||||
Other fees (a) | 70 | 63 | 58 | 11 | 21 | ||||||||||||
| Total fee revenue | 1,221 | 1,200 | 1,110 | 2 | 10 | ||||||||||||
| Investment and other revenue | 22 | 36 | 20 | N/M | N/M | ||||||||||||
| Total fee and other revenue | 1,243 | 1,236 | 1,130 | 1 | 10 | ||||||||||||
| Net interest income | 524 | 506 | 415 | 4 | 26 | ||||||||||||
| Total revenue | 1,767 | 1,742 | 1,545 | 1 | 14 | ||||||||||||
| Provision for credit losses | (3) | (6) | 7 | N/M | N/M | ||||||||||||
| Noninterest expense | 895 | 897 | 834 | — | 7 | ||||||||||||
| Income before taxes | $ | 875 | $ | 851 | $ | 704 | 3 | % | 24 | % | |||||||
| Total revenue by line of business: | |||||||||||||||||
| Pershing | $ | 729 | $ | 739 | $ | 649 | (1) | % | 12 | % | |||||||
| Treasury Services | 510 | 490 | 424 | 4 | 20 | ||||||||||||
| Clearance and Collateral Management | 528 | 513 | 472 | 3 | 12 | ||||||||||||
| Total revenue by line of business | $ | 1,767 | $ | 1,742 | $ | 1,545 | 1 | % | 14 | % | |||||||
| Pre-tax operating margin | 50 | % | 49 | % | 46 | % | |||||||||||
| Metrics: | |||||||||||||||||
| Average loans | $ | 46,278 | $ | 44,262 | $ | 42,730 | 5 | % | 8 | % | |||||||
| Average deposits | $ | 97,497 | $ | 96,566 | $ | 88,856 | 1 | % | 10 | % | |||||||
AUC/A at period end (in trillions) (current period is preliminary) (b) | $ | 15.8 | $ | 15.4 | $ | 14.3 | 3 | % | 10 | % | |||||||
(a) Other fees primarily include financing-related fees.
(b) Consists of AUC/A from the Clearance and Collateral Management and Pershing lines of business.
KEY DRIVERS
•The drivers of the total revenue variances by line of business are indicated below.
•Pershing – The year-over-year increase primarily reflects higher net interest income, market values and client activity. The sequential decrease primarily reflects lower client activity.
•Treasury Services – The year-over-year and sequential increases primarily reflect higher net interest income and net new business.
•Clearance and Collateral Management – The year-over-year increase primarily reflects higher collateral management balances, clearance volumes and net interest income. The sequential increase primarily reflects higher collateral management balances.
•Noninterest expense increased year-over-year primarily reflecting higher investments, employee merit increases and higher revenue-related expenses, partially offset by efficiency savings.
4 | ||
BNY 3Q25 Financial Results | ||
INVESTMENT AND WEALTH MANAGEMENT BUSINESS SEGMENT HIGHLIGHTS
| (dollars in millions, unless otherwise noted; not meaningful - N/M) | 3Q25 vs. | |||||||||||||||||||||||||||||||
| 3Q25 | 2Q25 | 3Q24 | (a) | 2Q25 | 3Q24 | (a) | ||||||||||||||||||||||||||
Investment management fees (a) | $ | 776 | $ | 748 | $ | 782 | 4 | % | (1) | % | ||||||||||||||||||||||
| Performance fees | 6 | 10 | 13 | N/M | N/M | |||||||||||||||||||||||||||
| Investment management and performance fees | 782 | 758 | 795 | 3 | (2) | |||||||||||||||||||||||||||
| Distribution and servicing fees | 69 | 69 | 68 | — | 1 | |||||||||||||||||||||||||||
Other fees (b) | (78) | (76) | (68) | N/M | N/M | |||||||||||||||||||||||||||
| Total fee revenue | 773 | 751 | 795 | 3 | (3) | |||||||||||||||||||||||||||
Investment and other revenue (c) | 10 | 9 | 9 | N/M | N/M | |||||||||||||||||||||||||||
Total fee and other revenue (c) | 783 | 760 | 804 | 3 | (3) | |||||||||||||||||||||||||||
| Net interest income | 41 | 41 | 45 | — | (9) | |||||||||||||||||||||||||||
| Total revenue | 824 | 801 | 849 | 3 | (3) | |||||||||||||||||||||||||||
| Provision for credit losses | — | — | 1 | N/M | N/M | |||||||||||||||||||||||||||
Noninterest expense (a) | 640 | 653 | 672 | (2) | (5) | |||||||||||||||||||||||||||
| Income before taxes | $ | 184 | $ | 148 | $ | 176 | 24 | % | 5 | % | ||||||||||||||||||||||
| Total revenue by line of business: | ||||||||||||||||||||||||||||||||
Investment Management (a) | $ | 546 | $ | 531 | $ | 569 | 3 | % | (4) | % | ||||||||||||||||||||||
| Wealth Management | 278 | 270 | 280 | 3 | (1) | |||||||||||||||||||||||||||
| Total revenue by line of business | $ | 824 | $ | 801 | $ | 849 | 3 | % | (3) | % | ||||||||||||||||||||||
| Pre-tax operating margin | 22 | % | 19 | % | 21 | % | ||||||||||||||||||||||||||
Adjusted pre-tax operating margin – Non-GAAP (d) | 24 | % | 20 | % | 23 | % | ||||||||||||||||||||||||||
| Metrics: | ||||||||||||||||||||||||||||||||
| Average loans | $ | 14,143 | $ | 13,991 | $ | 13,648 | 1 | % | 4 | % | ||||||||||||||||||||||
| Average deposits | $ | 9,201 | $ | 9,216 | $ | 10,032 | — | % | (8) | % | ||||||||||||||||||||||
AUM (in billions) (current period is preliminary) (e) | $ | 2,142 | $ | 2,106 | $ | 2,144 | 2 | % | — | % | ||||||||||||||||||||||
Wealth Management client assets (in billions) (current period is preliminary) (f) | $ | 348 | $ | 339 | $ | 333 | 3 | % | 5 | % | ||||||||||||||||||||||
(a) Effective 1Q25, an adjustment for certain rebates, which were previously recorded as distribution and servicing expense, began to be reflected as a reduction of investment management fees. These amounts totaled approximately $20 million for all periods presented and impacted the year-over-year variances for investment management fees and related revenue subtotals, noninterest expense and Investment Management total revenue in the table above.
(b) Other fees primarily include investment services fees.
(c) Investment and other revenue and total fee and other revenue are net of income (loss) attributable to noncontrolling interests related to consolidated investment management funds.
(d) Net of distribution and servicing expense. See “Explanation of GAAP and Non-GAAP financial measures” beginning on page 9 for information on this Non-GAAP measure.
(e) Represents assets managed in the Investment and Wealth Management business segment.
(f) Includes AUM and AUC/A in the Wealth Management line of business.
KEY DRIVERS
•The drivers of the total revenue variances by line of business are indicated below.
•Investment Management – The year-over-year decrease primarily reflects the mix of AUM flows and the adjustment for certain rebates (offset in noninterest expense) (a), partially offset by higher market values and the favorable impact of the weaker U.S. dollar. The sequential increase primarily reflects higher market values.
•Wealth Management – The sequential increase primarily reflects higher market values.
•Noninterest expense decreased year-over-year primarily reflecting lower revenue-related expenses (including the adjustment for certain rebates (a)) and efficiency savings, partially offset by employee merit increases, higher investments and the unfavorable impact of the weaker U.S. dollar. The sequential decrease primarily reflects lower severance expense.
5 | ||
BNY 3Q25 Financial Results | ||
OTHER SEGMENT
The Other segment primarily includes the leasing portfolio, corporate treasury activities, including our securities portfolio, derivatives and other trading activity, tax credit investments and other corporate investments, certain business exits and other corporate revenue and expense items.
| (dollars in millions) | 3Q25 | 2Q25 | 3Q24 | ||||||||
| Fee revenue | $ | (27) | $ | (15) | $ | (1) | |||||
| Investment and other revenue | 45 | 33 | 55 | ||||||||
| Total fee and other revenue | 18 | 18 | 54 | ||||||||
| Net interest income (expense) | 1 | (19) | (21) | ||||||||
| Total revenue | 19 | (1) | 33 | ||||||||
| Provision for credit losses | (1) | 2 | — | ||||||||
| Noninterest expense | 45 | 36 | 37 | ||||||||
| (Loss) before taxes | $ | (25) | $ | (39) | $ | (4) | |||||
KEY DRIVERS
•Total revenue includes corporate treasury and other investment activity, including hedging activity which has an offsetting impact between fee and other revenue and net interest expense. The year-over-year decrease was primarily driven by higher net securities losses. The sequential increase primarily reflects gains realized on the sale of real estate.
•Noninterest expense increased year-over-year primarily driven by higher staff expense. The sequential increase primarily reflects higher litigation reserves.
6 | ||
BNY 3Q25 Financial Results | ||
CAPITAL AND LIQUIDITY
| Capital and liquidity ratios | Sept. 30, 2025 | June 30, 2025 | Dec. 31, 2024 | ||||||||
Consolidated regulatory capital ratios: (a) | |||||||||||
| CET1 ratio | 11.7 | % | 11.5 | % | 11.2 | % | |||||
| Tier 1 capital ratio | 14.4 | 14.5 | 13.7 | ||||||||
| Total capital ratio | 15.3 | 15.5 | 14.8 | ||||||||
Tier 1 leverage ratio (a) | 6.1 | 6.1 | 5.7 | ||||||||
Supplementary leverage ratio (a) | 6.7 | 6.9 | 6.5 | ||||||||
| BNY shareholders’ equity to total assets ratio | 9.6 | % | 9.0 | % | 9.9 | % | |||||
| BNY common shareholders’ equity to total assets ratio | 8.6 | % | 7.9 | % | 8.9 | % | |||||
Average LCR (a) | 112 | % | 112 | % | 115 | % | |||||
Average NSFR (a) | 130 | % | 131 | % | 132 | % | |||||
| Book value per common share | $ | 55.99 | $ | 54.76 | $ | 51.52 | |||||
Tangible book value per common share – Non-GAAP (b) | $ | 30.60 | $ | 29.57 | $ | 27.05 | |||||
Common shares outstanding (in thousands) | 697,349 | 705,241 | 717,680 | ||||||||
(a) Regulatory capital and liquidity ratios for Sept. 30, 2025 are preliminary. For our CET1, Tier 1 capital and Total capital ratios, our effective capital ratios under the U.S. capital rules are the lower of the ratios as calculated under the Standardized and Advanced Approaches, which for Sept. 30, 2025, June 30, 2025 and for Dec. 31, 2024 was the Standardized Approach.
(b) Tangible book value per common share – Non-GAAP excludes goodwill and intangible assets, net of deferred tax liabilities. See “Explanation of GAAP and Non-GAAP financial measures” beginning on page 9 for information on this Non-GAAP measure.
•CET1 capital totaled $20.6 billion and Tier 1 capital totaled $25.5 billion at Sept. 30, 2025. CET1 capital increased compared with June 30, 2025, primarily reflecting capital generated through earnings and a net increase in accumulated other comprehensive income, partially offset by capital returned through common stock repurchases and dividends. Tier 1 capital was flat as the CET1 capital increase was offset by a net reduction in preferred stock. The CET1 ratio increased compared with June 30, 2025 reflecting the increase in capital, partially offset by higher risk-weighted assets. The Tier 1 leverage ratio increased slightly compared with June 30, 2025 reflecting lower average assets.
NET INTEREST INCOME
| Net interest income | 3Q25 vs. | ||||||||||||||||
| (dollars in millions; not meaningful - N/M) | 3Q25 | 2Q25 | 3Q24 | 2Q25 | 3Q24 | ||||||||||||
| Net interest income | $ | 1,236 | $ | 1,203 | $ | 1,048 | 3% | 18% | |||||||||
| Add: Tax equivalent adjustment | — | 1 | — | N/M | N/M | ||||||||||||
Net interest income, on a fully taxable equivalent (“FTE”) basis – Non-GAAP (a) | $ | 1,236 | $ | 1,204 | $ | 1,048 | 3% | 18% | |||||||||
| Average interest-earning assets | $ | 374,493 | $ | 375,542 | $ | 356,934 | —% | 5% | |||||||||
| Net interest margin | 1.31 | % | 1.27 | % | 1.16 | % | 4 | bps | 15 | bps | |||||||
Net interest margin (FTE) – Non-GAAP (a) | 1.31 | % | 1.27 | % | 1.16 | % | 4 | bps | 15 | bps | |||||||
(a) Net interest income (FTE) – Non-GAAP and net interest margin (FTE) – Non-GAAP include the tax equivalent adjustments on tax-exempt income. See “Explanation of GAAP and Non-GAAP financial measures” beginning on page 9 for information on this Non-GAAP measure.
bps – basis points.
•Net interest income increased year-over-year primarily reflecting the continued reinvestment of maturing investment securities at higher yields and balance sheet growth, partially offset by changes in deposit mix.
•Net interest income increased sequentially primarily reflecting the continued reinvestment of maturing investment securities at higher yields, partially offset by changes in deposit mix.
7 | ||
BNY 3Q25 Financial Results | ||
THE BANK OF NEW YORK MELLON CORPORATION
Condensed Consolidated Income Statement
| (dollars in millions) | Quarter ended | Year-to-date | ||||||||||||||||||
| Sept. 30, 2025 | June 30, 2025 | Sept. 30, 2024 | Sept. 30, 2025 | Sept. 30, 2024 | ||||||||||||||||
| Fee and other revenue | ||||||||||||||||||||
| Investment services fees | $ | 2,585 | $ | 2,583 | $ | 2,344 | $ | 7,579 | $ | 6,981 | ||||||||||
| Investment management and performance fees | 782 | 758 | 794 | 2,279 | 2,331 | |||||||||||||||
| Foreign exchange revenue | 166 | 213 | 175 | 535 | 511 | |||||||||||||||
| Financing-related fees | 67 | 51 | 53 | 178 | 163 | |||||||||||||||
| Distribution and servicing fees | 37 | 36 | 38 | 110 | 121 | |||||||||||||||
| Total fee revenue | 3,637 | 3,641 | 3,404 | 10,681 | 10,107 | |||||||||||||||
| Investment and other revenue | 208 | 184 | 196 | 622 | 547 | |||||||||||||||
| Total fee and other revenue | 3,845 | 3,825 | 3,600 | 11,303 | 10,654 | |||||||||||||||
| Net interest income | ||||||||||||||||||||
| Interest income | 6,594 | 6,602 | 6,652 | 19,319 | 19,140 | |||||||||||||||
| Interest expense | 5,358 | 5,399 | 5,604 | 15,721 | 16,022 | |||||||||||||||
| Net interest income | 1,236 | 1,203 | 1,048 | 3,598 | 3,118 | |||||||||||||||
| Total revenue | 5,081 | 5,028 | 4,648 | 14,901 | 13,772 | |||||||||||||||
| Provision for credit losses | (7) | (17) | 23 | (6) | 50 | |||||||||||||||
| Noninterest expense | ||||||||||||||||||||
| Staff | 1,745 | 1,768 | 1,736 | 5,347 | 5,313 | |||||||||||||||
| Software and equipment | 542 | 527 | 491 | 1,582 | 1,442 | |||||||||||||||
| Professional, legal and other purchased services | 404 | 388 | 370 | 1,158 | 1,093 | |||||||||||||||
| Sub-custodian and clearing | 141 | 150 | 117 | 422 | 370 | |||||||||||||||
| Net occupancy | 140 | 132 | 130 | 408 | 388 | |||||||||||||||
| Distribution and servicing | 68 | 63 | 90 | 196 | 274 | |||||||||||||||
| Business development | 45 | 53 | 48 | 146 | 134 | |||||||||||||||
| Bank assessment charges | 6 | 22 | 10 | 66 | 20 | |||||||||||||||
| Amortization of intangible assets | 12 | 11 | 12 | 34 | 37 | |||||||||||||||
| Other | 133 | 92 | 96 | 335 | 275 | |||||||||||||||
| Total noninterest expense | 3,236 | 3,206 | 3,100 | 9,694 | 9,346 | |||||||||||||||
| Income | ||||||||||||||||||||
| Income before taxes | 1,852 | 1,839 | 1,525 | 5,213 | 4,376 | |||||||||||||||
| Provision for income taxes | 395 | 404 | 336 | 1,099 | 990 | |||||||||||||||
| Net income | 1,457 | 1,435 | 1,189 | 4,114 | 3,386 | |||||||||||||||
| Net (income) attributable to noncontrolling interests related to consolidated investment management funds | (12) | (12) | (7) | (26) | (11) | |||||||||||||||
| Net income applicable to shareholders of The Bank of New York Mellon Corporation | 1,445 | 1,423 | 1,182 | 4,088 | 3,375 | |||||||||||||||
| Preferred stock dividends | (106) | (32) | (72) | (209) | (169) | |||||||||||||||
| Net income applicable to common shareholders of The Bank of New York Mellon Corporation | $ | 1,339 | $ | 1,391 | $ | 1,110 | $ | 3,879 | $ | 3,206 | ||||||||||
| Earnings per share applicable to the common shareholders of The Bank of New York Mellon Corporation | Quarter ended | Year-to-date | ||||||||||||||||||
| Sept. 30, 2025 | June 30, 2025 | Sept. 30, 2024 | Sept. 30, 2025 | Sept. 30, 2024 | ||||||||||||||||
| (in dollars) | ||||||||||||||||||||
| Basic | $ | 1.90 | $ | 1.95 | $ | 1.51 | $ | 5.43 | $ | 4.29 | ||||||||||
| Diluted | $ | 1.88 | $ | 1.93 | $ | 1.50 | $ | 5.39 | $ | 4.26 | ||||||||||
8 | ||
BNY 3Q25 Financial Results | ||
EXPLANATION OF GAAP AND NON-GAAP FINANCIAL MEASURES
BNY has included in this Earnings Release certain Non-GAAP financial measures on a tangible basis as a supplement to GAAP information, which exclude goodwill and intangible assets, net of deferred tax liabilities. We believe that the return on tangible common equity – Non-GAAP is additional useful information for investors because it presents a measure of those assets that can generate income, and the tangible book value per common share – Non-GAAP is additional useful information because it presents the level of tangible assets in relation to shares of common stock outstanding.
Net interest income, on a fully taxable equivalent (“FTE”) basis – Non-GAAP and net interest margin (FTE) – Non-GAAP and other FTE measures include the tax equivalent adjustments on tax-exempt income which allows for the comparison of amounts arising from both taxable and tax-exempt sources and is consistent with industry practice. The adjustment to an FTE basis has no impact on net income.
BNY has included the adjusted pre-tax operating margin – Non-GAAP, which is the pre-tax operating margin for the Investment and Wealth Management business segment, net of distribution and servicing expense that was passed to third parties who distribute or service our managed funds. We believe that this measure is useful when evaluating the performance of the Investment and Wealth Management business segment relative to industry competitors.
See “Explanation of GAAP and Non-GAAP Financial Measures” in the Financial Supplement available at www.bny.com for additional reconciliations of Non-GAAP measures.
BNY has also included revenue measures excluding notable items, including a disposal gain. Expense measures, excluding notable items, including severance expense, litigation reserves and the FDIC special assessment, are also presented. Litigation reserves represent accruals for loss contingencies that are both probable and reasonably estimable, but exclude standard business-related legal fees. Net income applicable to common shareholders of The Bank of New York Mellon Corporation, diluted earnings per share, operating leverage, return on common equity, return on tangible common equity and pre-tax operating margin, excluding the notable items mentioned above, are also provided. These measures are provided to permit investors to view the financial measures on a basis consistent with how management views the businesses.
| Reconciliation of Non-GAAP measures, excluding notable items | 3Q25 vs. | |||||||||||||||||||||||||
| (dollars in millions, except per share amounts) | 3Q25 | 2Q25 | 3Q24 | 2Q25 | 3Q24 | |||||||||||||||||||||
| Total revenue – GAAP | $ | 5,081 | $ | 5,028 | $ | 4,648 | 1 | % | 9 | % | ||||||||||||||||
Less: Disposal gain (a) | 12 | — | — | |||||||||||||||||||||||
| Adjusted total revenue – Non-GAAP | $ | 5,069 | $ | 5,028 | $ | 4,648 | 1 | % | 9 | % | ||||||||||||||||
| Noninterest expense – GAAP | $ | 3,236 | $ | 3,206 | $ | 3,100 | 1 | % | 4 | % | ||||||||||||||||
Less: Severance expense (b) | 50 | 34 | 40 | |||||||||||||||||||||||
Litigation reserves (b) | 3 | (16) | 2 | |||||||||||||||||||||||
FDIC special assessment (b) | (14) | (6) | (17) | |||||||||||||||||||||||
| Adjusted noninterest expense – Non-GAAP | $ | 3,197 | $ | 3,194 | $ | 3,075 | — | % | 4 | % | ||||||||||||||||
| Net income applicable to common shareholders of The Bank of New York Mellon Corporation – GAAP | $ | 1,339 | $ | 1,391 | $ | 1,110 | (4) | % | 21 | % | ||||||||||||||||
Less: Disposal gain (a) | 9 | — | — | |||||||||||||||||||||||
Severance expense (b) | (39) | (27) | (31) | |||||||||||||||||||||||
Litigation reserves (b) | (2) | 16 | (2) | |||||||||||||||||||||||
FDIC special assessment (b) | 11 | 5 | 13 | |||||||||||||||||||||||
| Adjusted net income applicable to common shareholders of The Bank of New York Mellon Corporation – Non-GAAP | $ | 1,360 | $ | 1,397 | $ | 1,130 | (3) | % | 20 | % | ||||||||||||||||
| Diluted earnings per common share – GAAP | $ | 1.88 | $ | 1.93 | $ | 1.50 | (3) | % | 25 | % | ||||||||||||||||
Less: Disposal gain (a) | 0.01 | — | — | |||||||||||||||||||||||
Severance expense (b) | (0.05) | (0.04) | (0.04) | |||||||||||||||||||||||
Litigation reserves (b) | — | 0.02 | — | |||||||||||||||||||||||
FDIC special assessment (b) | 0.01 | 0.01 | 0.02 | |||||||||||||||||||||||
| Total diluted earnings per common share impact of notable items | (0.03) | (0.01) | (0.03) | (c) | ||||||||||||||||||||||
| Adjusted diluted earnings per common share – Non-GAAP | $ | 1.91 | $ | 1.94 | $ | 1.52 | (c) | (2) | % | 26 | % | |||||||||||||||
Operating leverage – GAAP (d) | 11 | bps | 493 | bps | ||||||||||||||||||||||
Adjusted operating leverage – Non-GAAP (d) | 73 | bps | 509 | bps | ||||||||||||||||||||||
(a) Reflected in Investment and other revenue.
(b) Severance expense is reflected in Staff expense, Litigation reserves in Other expense, and FDIC special assessment in Bank assessment charges, respectively.
(c) Does not foot due to rounding.
(d) Operating leverage is the rate of increase (decrease) in total revenue less the rate of increase (decrease) in total noninterest expense.
bps - basis points.
9 | ||
BNY 3Q25 Financial Results | ||
| Pre-tax operating margin reconciliation | ||||||||||||||||||||
| (dollars in millions) | 3Q25 | 2Q25 | 3Q24 | |||||||||||||||||
| Income before taxes – GAAP | $ | 1,852 | $ | 1,839 | $ | 1,525 | ||||||||||||||
Impact of notable items (a) | (27) | (12) | (25) | |||||||||||||||||
| Adjusted income before taxes, excluding notable items – Non-GAAP | $ | 1,879 | $ | 1,851 | $ | 1,550 | ||||||||||||||
| Total revenue – GAAP | $ | 5,081 | $ | 5,028 | $ | 4,648 | ||||||||||||||
Impact of notable items (a) | 12 | — | — | |||||||||||||||||
| Adjusted total revenue, excluding notable items – Non-GAAP | $ | 5,069 | $ | 5,028 | $ | 4,648 | ||||||||||||||
Pre-tax operating margin – GAAP (b) | 36 | % | 37 | % | 33 | % | ||||||||||||||
Adjusted pre-tax operating margin – Non-GAAP (b) | 37 | % | 37 | % | 33 | % | ||||||||||||||
(a) See page 9 for details of notable items and line items impacted.
(b) Income before taxes divided by total revenue.
| Return on common equity and return on tangible common equity reconciliation | ||||||||||||||||||||
| (dollars in millions) | 3Q25 | 2Q25 | 3Q24 | |||||||||||||||||
| Net income applicable to common shareholders of The Bank of New York Mellon Corporation – GAAP | $ | 1,339 | $ | 1,391 | $ | 1,110 | ||||||||||||||
| Add: Amortization of intangible assets | 12 | 11 | 12 | |||||||||||||||||
| Less: Tax impact of amortization of intangible assets | 3 | 2 | 3 | |||||||||||||||||
| Adjusted net income applicable to common shareholders of The Bank of New York Mellon Corporation, excluding amortization of intangible assets – Non-GAAP | $ | 1,348 | $ | 1,400 | $ | 1,119 | ||||||||||||||
Impact of notable items (a) | (21) | (6) | (20) | |||||||||||||||||
| Adjusted net income applicable to common shareholders of The Bank of New York Mellon Corporation, excluding amortization of intangible assets and notable items – Non-GAAP | $ | 1,369 | $ | 1,406 | $ | 1,139 | ||||||||||||||
| Average common shareholders’ equity | $ | 38,626 | $ | 37,892 | $ | 36,772 | ||||||||||||||
| Less: Average goodwill | 16,787 | 16,748 | 16,281 | |||||||||||||||||
| Average intangible assets | 2,842 | 2,850 | 2,827 | |||||||||||||||||
| Add: Deferred tax liability – tax deductible goodwill | 1,236 | 1,236 | 1,220 | |||||||||||||||||
| Deferred tax liability – intangible assets | 665 | 668 | 656 | |||||||||||||||||
| Average tangible common shareholders’ equity – Non-GAAP | $ | 20,898 | $ | 20,198 | $ | 19,540 | ||||||||||||||
Return on common equity – GAAP (b) | 13.7 | % | 14.7 | % | 12.0 | % | ||||||||||||||
Adjusted return on common equity – Non-GAAP (b) | 14.0 | % | 14.8 | % | 12.2 | % | ||||||||||||||
Return on tangible common equity – Non-GAAP (b) | 25.6 | % | 27.8 | % | 22.8 | % | ||||||||||||||
Adjusted return on tangible common equity – Non-GAAP (b) | 26.0 | % | 27.9 | % | 23.2 | % | ||||||||||||||
(a) See page 9 for details of notable items and line items impacted.
(b) Returns are annualized.
CAUTIONARY STATEMENT ON FORWARD-LOOKING STATEMENTS
A number of statements in this Earnings Release and in our Financial Supplement may constitute “forward-looking statements” within the meaning of the Private Securities Litigation Reform Act of 1995, including statements about our strategic priorities, financial performance and financial targets. Preliminary business metrics and regulatory capital ratios are subject to change, possibly materially, as we complete our Quarterly Report on Form 10-Q for the quarter ended Sept. 30, 2025. Forward-looking statements are not guarantees of future results or occurrences, are inherently uncertain and are based upon current beliefs and expectations of future events, many of which are, by their nature, difficult to predict, outside of our control and subject to change.
By identifying these statements for you in this manner, we are alerting you to the possibility that our actual results may differ, possibly materially, from the anticipated results expressed or implied in these forward-looking statements as a result of a number of important factors, including the risk factors and other uncertainties set forth in our Annual Report on Form 10-K for the year ended Dec. 31, 2024 and our other filings with the Securities and Exchange Commission.
You should not place undue reliance on any forward-looking statement. All forward-looking statements speak only as of the date on which they were made, and we undertake no obligation to update any forward-looking statement to reflect events or circumstances after such date or to reflect the occurrence of unanticipated events.
10 | ||
BNY 3Q25 Financial Results | ||
ABOUT BNY
BNY is a global financial services company that helps make money work for the world – managing it, moving it and keeping it safe. For more than 240 years BNY has partnered alongside clients, putting its expertise and platforms to work to help them achieve their ambitions. Today BNY helps over 90% of Fortune 100 companies and nearly all the top 100 banks globally access the money they need. BNY supports governments in funding local projects and works with over 90% of the top 100 pension plans to safeguard investments for millions of individuals, and so much more. As of Sept. 30, 2025, BNY oversees $57.8 trillion in assets under custody and/or administration and $2.1 trillion in assets under management.
BNY is the corporate brand of The Bank of New York Mellon Corporation (NYSE: BK). Headquartered in New York City, BNY has been named among Fortune’s World’s Most Admired Companies and Fast Company’s Best Workplaces for Innovators. Additional information is available on www.bny.com. Follow on LinkedIn or visit the BNY Newsroom for the latest company news.
CONFERENCE CALL INFORMATION
Robin Vince, Chief Executive Officer, and Dermot McDonogh, Chief Financial Officer, will host a conference call and simultaneous live audio webcast at 7:30 a.m. ET on Oct. 16, 2025. This conference call and audio webcast will include forward-looking statements and may include other material information.
Investors and analysts wishing to access the conference call and audio webcast may do so by dialing +1 (800) 390-5696 (U.S.) or +1 (720) 452-9082 (International), and using the passcode: 200200, or by logging onto www.bny.com/investorrelations. Earnings materials will be available at www.bny.com/investorrelations beginning at approximately 6:30 a.m. ET on Oct. 16, 2025.
An archived version of the third quarter conference call and audio webcast will be available beginning on Oct. 16, 2025 at approximately 12:00 p.m. ET through Nov. 14, 2025 at www.bny.com/investorrelations.
11 | ||

| The Bank of New York Mellon Corporation | ||
| Financial Supplement | ||
| Third Quarter 2025 | ||
| Table of Contents | | |||||||
| Consolidated Results | Page | |||||||
| Consolidated Financial Highlights | ||||||||
| Condensed Consolidated Income Statement | ||||||||
| Condensed Consolidated Balance Sheet | ||||||||
| Fee and Other Revenue | ||||||||
| Average Balances and Interest Rates | ||||||||
| Capital and Liquidity | ||||||||
| Business Segment Results | ||||||||
| Securities Services Business Segment | ||||||||
| Market and Wealth Services Business Segment | ||||||||
| Investment and Wealth Management Business Segment | ||||||||
| AUM by Product Type, Changes in AUM and Wealth Management Client Assets | ||||||||
| Other Segment | ||||||||
| Other | ||||||||
| Securities Portfolio | ||||||||
| Allowance for Credit Losses and Nonperforming Assets | ||||||||
| Supplemental Information | ||||||||
| Explanation of GAAP and Non-GAAP Financial Measures | ||||||||
| THE BANK OF NEW YORK MELLON CORPORATION | | |||||||||||||||||||||||||||||||||||||||||||||||||||||||||||||
| CONSOLIDATED FINANCIAL HIGHLIGHTS | ||||||||||||||||||||||||||||||||||||||||||||||||||||||||||||||
| (dollars in millions, except per common share amounts, or unless otherwise noted) | 3Q25 vs. | YTD25 vs. | ||||||||||||||||||||||||||||||||||||||||||||||||||||||||||||
| 3Q25 | 2Q25 | 1Q25 | 4Q24 | 3Q24 | 2Q25 | 3Q24 | YTD25 | YTD24 | YTD24 | |||||||||||||||||||||||||||||||||||||||||||||||||||||
| Selected income statement data | ||||||||||||||||||||||||||||||||||||||||||||||||||||||||||||||
| Fee and other revenue | $ | 3,845 | $ | 3,825 | $ | 3,633 | $ | 3,653 | $ | 3,600 | 1 | % | 7 | % | $ | 11,303 | $ | 10,654 | 6 | % | ||||||||||||||||||||||||||||||||||||||||||
| Net interest income | 1,236 | 1,203 | 1,159 | 1,194 | 1,048 | 3 | 18 | 3,598 | 3,118 | 15 | ||||||||||||||||||||||||||||||||||||||||||||||||||||
| Total revenue | 5,081 | 5,028 | 4,792 | 4,847 | 4,648 | 1 | 9 | 14,901 | 13,772 | 8 | ||||||||||||||||||||||||||||||||||||||||||||||||||||
| Provision for credit losses | (7) | (17) | 18 | 20 | 23 | N/M | N/M | (6) | 50 | N/M | ||||||||||||||||||||||||||||||||||||||||||||||||||||
| Noninterest expense | 3,236 | 3,206 | 3,252 | 3,355 | 3,100 | 1 | 4 | 9,694 | 9,346 | 4 | ||||||||||||||||||||||||||||||||||||||||||||||||||||
| Income before income taxes | 1,852 | 1,839 | 1,522 | 1,472 | 1,525 | 1 | 21 | 5,213 | 4,376 | 19 | ||||||||||||||||||||||||||||||||||||||||||||||||||||
| Provision for income taxes | 395 | 404 | 300 | 315 | 336 | (2) | 18 | 1,099 | 990 | 11 | ||||||||||||||||||||||||||||||||||||||||||||||||||||
| Net income | $ | 1,457 | $ | 1,435 | $ | 1,222 | $ | 1,157 | $ | 1,189 | 2 | % | 23 | % | $ | 4,114 | $ | 3,386 | 22 | % | ||||||||||||||||||||||||||||||||||||||||||
| Net income applicable to common shareholders of The Bank of New York Mellon Corporation | $ | 1,339 | $ | 1,391 | $ | 1,149 | $ | 1,130 | $ | 1,110 | (4) | % | 21 | % | $ | 3,879 | $ | 3,206 | 21 | % | ||||||||||||||||||||||||||||||||||||||||||
| Diluted earnings per common share | $ | 1.88 | $ | 1.93 | $ | 1.58 | $ | 1.54 | $ | 1.50 | (3) | % | 25 | % | $ | 5.39 | $ | 4.26 | 27 | % | ||||||||||||||||||||||||||||||||||||||||||
Average common shares and equivalents outstanding – diluted (in thousands) | 712,854 | 720,007 | 727,398 | 733,720 | 742,080 | (1) | % | (4) | % | 720,344 | 752,555 | (4) | % | |||||||||||||||||||||||||||||||||||||||||||||||||
Financial ratios (Returns are annualized) | ||||||||||||||||||||||||||||||||||||||||||||||||||||||||||||||
| Pre-tax operating margin | 36 | % | 37 | % | 32 | % | 30 | % | 33 | % | 35 | % | 32 | % | ||||||||||||||||||||||||||||||||||||||||||||||||
| Return on common equity | 13.7 | % | 14.7 | % | 12.6 | % | 12.2 | % | 12.0 | % | 13.7 | % | 11.8 | % | ||||||||||||||||||||||||||||||||||||||||||||||||
Return on tangible common equity – Non-GAAP (a) | 25.6 | % | 27.8 | % | 24.2 | % | 23.3 | % | 22.8 | % | 25.9 | % | 22.7 | % | ||||||||||||||||||||||||||||||||||||||||||||||||
| Non-U.S. revenue as a percentage of total revenue | 35 | % | 36 | % | 33 | % | 35 | % | 35 | % | 35 | % | 35 | % | ||||||||||||||||||||||||||||||||||||||||||||||||
| Period end | ||||||||||||||||||||||||||||||||||||||||||||||||||||||||||||||
Assets under custody and/or administration (“AUC/A”) (in trillions) (b) | $ | 57.8 | $ | 55.8 | $ | 53.1 | $ | 52.1 | $ | 52.1 | 4 | % | 11 | % | ||||||||||||||||||||||||||||||||||||||||||||||||
Assets under management (“AUM”) (in trillions) | $ | 2.1 | $ | 2.1 | $ | 2.0 | $ | 2.0 | $ | 2.1 | 2 | % | — | % | ||||||||||||||||||||||||||||||||||||||||||||||||
| Full-time employees | 49,200 | 49,900 | 51,000 | 51,800 | 52,600 | (1) | % | (6) | % | |||||||||||||||||||||||||||||||||||||||||||||||||||||
| Book value per common share | $ | 55.99 | $ | 54.76 | $ | 52.82 | $ | 51.52 | $ | 51.78 | ||||||||||||||||||||||||||||||||||||||||||||||||||||
Tangible book value per common share – Non-GAAP (a) | $ | 30.60 | $ | 29.57 | $ | 28.20 | $ | 27.05 | $ | 28.01 | ||||||||||||||||||||||||||||||||||||||||||||||||||||
| Cash dividends per common share | $ | 0.53 | $ | 0.47 | $ | 0.47 | $ | 0.47 | $ | 0.47 | ||||||||||||||||||||||||||||||||||||||||||||||||||||
| Common dividend payout ratio | 28 | % | 25 | % | 30 | % | 31 | % | 32 | % | ||||||||||||||||||||||||||||||||||||||||||||||||||||
| Closing stock price per common share | $ | 108.96 | $ | 91.11 | $ | 83.87 | $ | 76.83 | $ | 71.86 | ||||||||||||||||||||||||||||||||||||||||||||||||||||
| Market capitalization | $ | 75,983 | $ | 64,254 | $ | 60,003 | $ | 55,139 | $ | 52,248 | ||||||||||||||||||||||||||||||||||||||||||||||||||||
Common shares outstanding (in thousands) | 697,349 | 705,241 | 715,434 | 717,680 | 727,078 | |||||||||||||||||||||||||||||||||||||||||||||||||||||||||
Capital ratios at period end (c) | ||||||||||||||||||||||||||||||||||||||||||||||||||||||||||||||
| Common Equity Tier 1 (“CET1”) ratio | 11.7 | % | 11.5 | % | 11.5 | % | 11.2 | % | 11.9 | % | ||||||||||||||||||||||||||||||||||||||||||||||||||||
| Tier 1 capital ratio | 14.4 | % | 14.5 | % | 14.6 | % | 13.7 | % | 14.5 | % | ||||||||||||||||||||||||||||||||||||||||||||||||||||
| Total capital ratio | 15.3 | % | 15.5 | % | 15.7 | % | 14.8 | % | 15.6 | % | ||||||||||||||||||||||||||||||||||||||||||||||||||||
| Tier 1 leverage ratio | 6.1 | % | 6.1 | % | 6.2 | % | 5.7 | % | 6.0 | % | ||||||||||||||||||||||||||||||||||||||||||||||||||||
| Supplementary leverage ratio (“SLR”) | 6.7 | % | 6.9 | % | 6.9 | % | 6.5 | % | 7.0 | % | ||||||||||||||||||||||||||||||||||||||||||||||||||||
(a) Non-GAAP information, for all periods presented, excludes goodwill and intangible assets, net of deferred tax liabilities. See “Explanation of GAAP and Non-GAAP Financial Measures” beginning on page 18 for the reconciliation of Non-GAAP measures. | ||||||||||||||||||||||||||||||||||||||||||||||||||||||||||||||
(b) Includes the AUC/A of CIBC Mellon Trust Company (“CIBC Mellon”), a joint venture with the Canadian Imperial Bank of Commerce, of $2.1 trillion at Sept, 30, 2025, $2.0 trillion at June 30, 2025, $1.9 trillion at March 31, 2025, $1.8 trillion at Dec. 31, 2024 and $1.9 trillion at Sept. 30, 2024. | ||||||||||||||||||||||||||||||||||||||||||||||||||||||||||||||
(c) Regulatory capital ratios for Sept. 30, 2025 are preliminary. For our CET1, Tier 1 capital and Total capital ratios, our effective capital ratios under the U.S. capital rules are the lower of the ratios as calculated under the Standardized and Advanced Approaches, which for Sept. 30, 2025, June 30, 2025, March 31, 2025 and Dec. 31, 2024 was the Standardized Approach, and for Sept. 30, 2024 was the Standardized Approach for the CET1 and Tier 1 capital ratios and the Advanced Approaches for the Total capital ratio. | ||||||||||||||||||||||||||||||||||||||||||||||||||||||||||||||
| N/M – Not meaningful. | ||||||||||||||||||||||||||||||||||||||||||||||||||||||||||||||
3
| THE BANK OF NEW YORK MELLON CORPORATION | | |||||||||||||||||||||||||||||||||||||||||||||||||||||||||||||
| CONDENSED CONSOLIDATED INCOME STATEMENT | ||||||||||||||||||||||||||||||||||||||||||||||||||||||||||||||
| (dollars in millions, except per share amounts; common shares in thousands) | 3Q25 vs. | YTD25 vs. | ||||||||||||||||||||||||||||||||||||||||||||||||||||||||||||
| 3Q25 | 2Q25 | 1Q25 | 4Q24 | 3Q24 | 2Q25 | 3Q24 | YTD25 | YTD24 | YTD24 | |||||||||||||||||||||||||||||||||||||||||||||||||||||
| Revenue | ||||||||||||||||||||||||||||||||||||||||||||||||||||||||||||||
| Investment services fees | $ | 2,585 | $ | 2,583 | $ | 2,411 | $ | 2,438 | $ | 2,344 | — | % | 10 | % | $ | 7,579 | $ | 6,981 | 9 | % | ||||||||||||||||||||||||||||||||||||||||||
| Investment management and performance fees | 782 | 758 | 739 | 808 | 794 | 3 | (2) | 2,279 | 2,331 | (2) | ||||||||||||||||||||||||||||||||||||||||||||||||||||
| Foreign exchange revenue | 166 | 213 | 156 | 177 | 175 | (22) | (5) | 535 | 511 | 5 | ||||||||||||||||||||||||||||||||||||||||||||||||||||
| Financing-related fees | 67 | 51 | 60 | 53 | 53 | 31 | 26 | 178 | 163 | 9 | ||||||||||||||||||||||||||||||||||||||||||||||||||||
| Distribution and servicing fees | 37 | 36 | 37 | 37 | 38 | 3 | (3) | 110 | 121 | (9) | ||||||||||||||||||||||||||||||||||||||||||||||||||||
| Total fee revenue | 3,637 | 3,641 | 3,403 | 3,513 | 3,404 | — | 7 | 10,681 | 10,107 | 6 | ||||||||||||||||||||||||||||||||||||||||||||||||||||
| Investment and other revenue | 208 | 184 | 230 | 140 | 196 | N/M | N/M | 622 | 547 | N/M | ||||||||||||||||||||||||||||||||||||||||||||||||||||
| Total fee and other revenue | 3,845 | 3,825 | 3,633 | 3,653 | 3,600 | 1 | 7 | 11,303 | 10,654 | 6 | ||||||||||||||||||||||||||||||||||||||||||||||||||||
| Net interest income | 1,236 | 1,203 | 1,159 | 1,194 | 1,048 | 3 | 18 | 3,598 | 3,118 | 15 | ||||||||||||||||||||||||||||||||||||||||||||||||||||
| Total revenue | 5,081 | 5,028 | 4,792 | 4,847 | 4,648 | 1 | 9 | 14,901 | 13,772 | 8 | ||||||||||||||||||||||||||||||||||||||||||||||||||||
| Provision for credit losses | (7) | (17) | 18 | 20 | 23 | N/M | N/M | (6) | 50 | N/M | ||||||||||||||||||||||||||||||||||||||||||||||||||||
| Noninterest expense | ||||||||||||||||||||||||||||||||||||||||||||||||||||||||||||||
| Staff | 1,745 | 1,768 | 1,834 | 1,817 | 1,736 | (1) | 1 | 5,347 | 5,313 | 1 | ||||||||||||||||||||||||||||||||||||||||||||||||||||
| Software and equipment | 542 | 527 | 513 | 520 | 491 | 3 | 10 | 1,582 | 1,442 | 10 | ||||||||||||||||||||||||||||||||||||||||||||||||||||
| Professional, legal and other purchased services | 404 | 388 | 366 | 410 | 370 | 4 | 9 | 1,158 | 1,093 | 6 | ||||||||||||||||||||||||||||||||||||||||||||||||||||
| Sub-custodian and clearing | 141 | 150 | 131 | 128 | 117 | (6) | 21 | 422 | 370 | 14 | ||||||||||||||||||||||||||||||||||||||||||||||||||||
| Net occupancy | 140 | 132 | 136 | 149 | 130 | 6 | 8 | 408 | 388 | 5 | ||||||||||||||||||||||||||||||||||||||||||||||||||||
| Distribution and servicing | 68 | 63 | 65 | 87 | 90 | 8 | (24) | 196 | 274 | (28) | ||||||||||||||||||||||||||||||||||||||||||||||||||||
| Business development | 45 | 53 | 48 | 54 | 48 | (15) | (6) | 146 | 134 | 9 | ||||||||||||||||||||||||||||||||||||||||||||||||||||
| Bank assessment charges | 6 | 22 | 38 | 16 | 10 | N/M | N/M | 66 | 20 | N/M | ||||||||||||||||||||||||||||||||||||||||||||||||||||
| Amortization of intangible assets | 12 | 11 | 11 | 13 | 12 | 9 | — | 34 | 37 | (8) | ||||||||||||||||||||||||||||||||||||||||||||||||||||
| Other | 133 | 92 | 110 | 161 | 96 | 45 | 39 | 335 | 275 | 22 | ||||||||||||||||||||||||||||||||||||||||||||||||||||
| Total noninterest expense | 3,236 | 3,206 | 3,252 | 3,355 | 3,100 | 1 | 4 | 9,694 | 9,346 | 4 | ||||||||||||||||||||||||||||||||||||||||||||||||||||
| Income before income taxes | 1,852 | 1,839 | 1,522 | 1,472 | 1,525 | 1 | 21 | 5,213 | 4,376 | 19 | ||||||||||||||||||||||||||||||||||||||||||||||||||||
| Provision for income taxes | 395 | 404 | 300 | 315 | 336 | (2) | 18 | 1,099 | 990 | 11 | ||||||||||||||||||||||||||||||||||||||||||||||||||||
| Net income | 1,457 | 1,435 | 1,222 | 1,157 | 1,189 | 2 | 23 | 4,114 | 3,386 | 22 | ||||||||||||||||||||||||||||||||||||||||||||||||||||
| Net (income) attributable to noncontrolling interests | (12) | (12) | (2) | (2) | (7) | N/M | N/M | (26) | (11) | N/M | ||||||||||||||||||||||||||||||||||||||||||||||||||||
| Preferred stock dividends | (106) | (32) | (71) | (25) | (72) | N/M | N/M | (209) | (169) | N/M | ||||||||||||||||||||||||||||||||||||||||||||||||||||
| Net income applicable to common shareholders of The Bank of New York Mellon Corporation | $ | 1,339 | $ | 1,391 | $ | 1,149 | $ | 1,130 | $ | 1,110 | (4) | % | 21 | % | $ | 3,879 | $ | 3,206 | 21 | % | ||||||||||||||||||||||||||||||||||||||||||
| Average common shares and equivalents outstanding: Basic | 705,873 | 714,799 | 720,951 | 726,568 | 736,547 | (1) | % | (4) | % | 714,135 | 747,766 | (4) | % | |||||||||||||||||||||||||||||||||||||||||||||||||
| Diluted | 712,854 | 720,007 | 727,398 | 733,720 | 742,080 | (1) | % | (4) | % | 720,344 | 752,555 | (4) | % | |||||||||||||||||||||||||||||||||||||||||||||||||
| Earnings per common share: Basic | $ | 1.90 | $ | 1.95 | $ | 1.59 | $ | 1.56 | $ | 1.51 | (3) | % | 26 | % | $ | 5.43 | $ | 4.29 | 27 | % | ||||||||||||||||||||||||||||||||||||||||||
| Diluted | $ | 1.88 | $ | 1.93 | $ | 1.58 | $ | 1.54 | $ | 1.50 | (3) | % | 25 | % | $ | 5.39 | $ | 4.26 | 27 | % | ||||||||||||||||||||||||||||||||||||||||||
| N/M – Not meaningful. | ||||||||||||||||||||||||||||||||||||||||||||||||||||||||||||||
4
| THE BANK OF NEW YORK MELLON CORPORATION | | |||||||||||||||||||||||||||||||
| CONDENSED CONSOLIDATED BALANCE SHEET | ||||||||||||||||||||||||||||||||
| 2025 | 2024 | |||||||||||||||||||||||||||||||
| (dollars in millions) | Sept. 30 | June 30 | March 31 | Dec. 31 | Sept. 30 | |||||||||||||||||||||||||||
| Assets | ||||||||||||||||||||||||||||||||
| Cash and due from banks | $ | 5,055 | $ | 5,699 | $ | 5,354 | $ | 4,178 | $ | 6,234 | ||||||||||||||||||||||
| Interest-bearing deposits with the Federal Reserve and other central banks | 106,368 | 135,602 | 102,303 | 89,546 | 102,231 | |||||||||||||||||||||||||||
| Interest-bearing deposits with banks | 11,027 | 12,069 | 11,945 | 9,612 | 9,354 | |||||||||||||||||||||||||||
| Federal funds sold and securities purchased under resale agreements | 41,863 | 45,547 | 41,316 | 41,146 | 36,164 | |||||||||||||||||||||||||||
| Securities | 149,528 | 147,068 | 145,385 | 136,627 | 141,876 | |||||||||||||||||||||||||||
| Trading assets | 13,625 | 12,610 | 11,978 | 13,981 | 12,459 | |||||||||||||||||||||||||||
| Loans | 75,195 | 73,096 | 71,404 | 71,570 | 69,451 | |||||||||||||||||||||||||||
| Allowance for loan losses | (272) | (275) | (295) | (294) | (296) | |||||||||||||||||||||||||||
Net loans | 74,923 | 72,821 | 71,109 | 71,276 | 69,155 | |||||||||||||||||||||||||||
| Premises and equipment | 3,549 | 3,289 | 3,257 | 3,266 | 3,380 | |||||||||||||||||||||||||||
| Accrued interest receivable | 1,426 | 1,348 | 1,302 | 1,293 | 1,319 | |||||||||||||||||||||||||||
| Goodwill | 16,773 | 16,823 | 16,661 | 16,598 | 16,338 | |||||||||||||||||||||||||||
| Intangible assets | 2,834 | 2,849 | 2,846 | 2,851 | 2,824 | |||||||||||||||||||||||||||
| Other assets | 28,341 | 30,056 | 27,235 | 25,690 | 26,127 | |||||||||||||||||||||||||||
Total assets | $ | 455,312 | $ | 485,781 | $ | 440,691 | $ | 416,064 | $ | 427,461 | ||||||||||||||||||||||
| Liabilities | ||||||||||||||||||||||||||||||||
| Deposits | $ | 314,697 | $ | 346,393 | $ | 308,644 | $ | 289,524 | $ | 296,438 | ||||||||||||||||||||||
| Federal funds purchased and securities sold under repurchase agreements | 16,585 | 15,492 | 15,663 | 14,064 | 14,574 | |||||||||||||||||||||||||||
| Trading liabilities | 3,499 | 6,134 | 4,580 | 4,865 | 4,553 | |||||||||||||||||||||||||||
| Payables to customers and broker-dealers | 23,638 | 21,273 | 22,244 | 20,073 | 19,741 | |||||||||||||||||||||||||||
| Commercial paper | 2,364 | 2,361 | 1,662 | 301 | 301 | |||||||||||||||||||||||||||
| Other borrowed funds | 283 | 293 | 212 | 225 | 401 | |||||||||||||||||||||||||||
| Accrued taxes and other expenses | 4,920 | 4,634 | 4,438 | 5,270 | 5,138 | |||||||||||||||||||||||||||
| Other liabilities | 12,678 | 11,233 | 8,756 | 9,124 | 10,726 | |||||||||||||||||||||||||||
| Long-term debt | 32,287 | 33,429 | 30,869 | 30,854 | 33,199 | |||||||||||||||||||||||||||
Total liabilities | 410,951 | 441,242 | 397,068 | 374,300 | 385,071 | |||||||||||||||||||||||||||
| Temporary equity | ||||||||||||||||||||||||||||||||
| Redeemable noncontrolling interests | 111 | 111 | 94 | 87 | 107 | |||||||||||||||||||||||||||
| Permanent equity | ||||||||||||||||||||||||||||||||
| Preferred stock | 4,836 | 5,331 | 5,331 | 4,343 | 4,343 | |||||||||||||||||||||||||||
| Common stock | 14 | 14 | 14 | 14 | 14 | |||||||||||||||||||||||||||
| Additional paid-in capital | 29,795 | 29,659 | 29,535 | 29,321 | 29,230 | |||||||||||||||||||||||||||
| Retained earnings | 45,346 | 44,388 | 43,343 | 42,537 | 41,756 | |||||||||||||||||||||||||||
| Accumulated other comprehensive loss, net of tax | (3,362) | (3,549) | (4,115) | (4,656) | (3,867) | |||||||||||||||||||||||||||
Less: Treasury stock, at cost | (32,750) | (31,893) | (30,989) | (30,241) | (29,484) | |||||||||||||||||||||||||||
| Total The Bank of New York Mellon Corporation shareholders’ equity | 43,879 | 43,950 | 43,119 | 41,318 | 41,992 | |||||||||||||||||||||||||||
Nonredeemable noncontrolling interests of consolidated investment management funds | 371 | 478 | 410 | 359 | 291 | |||||||||||||||||||||||||||
Total permanent equity | 44,250 | 44,428 | 43,529 | 41,677 | 42,283 | |||||||||||||||||||||||||||
Total liabilities, temporary equity and permanent equity | $ | 455,312 | $ | 485,781 | $ | 440,691 | $ | 416,064 | $ | 427,461 | ||||||||||||||||||||||
5
| THE BANK OF NEW YORK MELLON CORPORATION | | |||||||||||||||||||||||||||||||||||||||||||||||||||||||||||||
| FEE AND OTHER REVENUE | ||||||||||||||||||||||||||||||||||||||||||||||||||||||||||||||
| 3Q25 vs. | YTD25 vs. | |||||||||||||||||||||||||||||||||||||||||||||||||||||||||||||
| (dollars in millions) | 3Q25 | 2Q25 | 1Q25 | 4Q24 | 3Q24 | 2Q25 | 3Q24 | YTD25 | YTD24 | YTD24 | ||||||||||||||||||||||||||||||||||||||||||||||||||||
| Investment services fees | $ | 2,585 | $ | 2,583 | $ | 2,411 | $ | 2,438 | $ | 2,344 | — | % | 10 | % | $ | 7,579 | $ | 6,981 | 9 | % | ||||||||||||||||||||||||||||||||||||||||||
| Investment management and performance fees: | ||||||||||||||||||||||||||||||||||||||||||||||||||||||||||||||
Investment management fees (a) | 776 | 748 | 734 | 788 | 781 | 4 | (1) | 2,258 | 2,300 | (2) | ||||||||||||||||||||||||||||||||||||||||||||||||||||
| Performance fees | 6 | 10 | 5 | 20 | 13 | N/M | N/M | 21 | 31 | N/M | ||||||||||||||||||||||||||||||||||||||||||||||||||||
Total investment management and performance fees (b) | 782 | 758 | 739 | 808 | 794 | 3 | (2) | 2,279 | 2,331 | (2) | ||||||||||||||||||||||||||||||||||||||||||||||||||||
| Foreign exchange revenue | 166 | 213 | 156 | 177 | 175 | (22) | (5) | 535 | 511 | 5 | ||||||||||||||||||||||||||||||||||||||||||||||||||||
| Financing-related fees | 67 | 51 | 60 | 53 | 53 | 31 | 26 | 178 | 163 | 9 | ||||||||||||||||||||||||||||||||||||||||||||||||||||
| Distribution and servicing fees | 37 | 36 | 37 | 37 | 38 | 3 | (3) | 110 | 121 | (9) | ||||||||||||||||||||||||||||||||||||||||||||||||||||
| Total fee revenue | 3,637 | 3,641 | 3,403 | 3,513 | 3,404 | — | 7 | 10,681 | 10,107 | 6 | ||||||||||||||||||||||||||||||||||||||||||||||||||||
| Investment and other revenue: | ||||||||||||||||||||||||||||||||||||||||||||||||||||||||||||||
| Income (loss) from consolidated investment management funds | 23 | 35 | 6 | (5) | 28 | N/M | N/M | 64 | 51 | N/M | ||||||||||||||||||||||||||||||||||||||||||||||||||||
Seed capital gains (losses) (c) | 8 | 8 | (6) | 3 | 3 | N/M | N/M | 10 | 17 | N/M | ||||||||||||||||||||||||||||||||||||||||||||||||||||
| Other trading revenue | 73 | 59 | 71 | 89 | 79 | N/M | N/M | 203 | 225 | N/M | ||||||||||||||||||||||||||||||||||||||||||||||||||||
| Renewable energy investment gains | 19 | 15 | 15 | 5 | 6 | N/M | N/M | 49 | 20 | N/M | ||||||||||||||||||||||||||||||||||||||||||||||||||||
| Corporate/bank-owned life insurance | 41 | 35 | 38 | 47 | 36 | N/M | N/M | 114 | 90 | N/M | ||||||||||||||||||||||||||||||||||||||||||||||||||||
Other investments gains (d) | 7 | 26 | 24 | 8 | 12 | N/M | N/M | 57 | 59 | N/M | ||||||||||||||||||||||||||||||||||||||||||||||||||||
| Disposal gains | 12 | — | 40 | — | — | N/M | N/M | 52 | — | N/M | ||||||||||||||||||||||||||||||||||||||||||||||||||||
| Expense reimbursements from joint venture | 36 | 34 | 31 | 29 | 32 | N/M | N/M | 101 | 89 | N/M | ||||||||||||||||||||||||||||||||||||||||||||||||||||
| Other income | 19 | 7 | 11 | 14 | 17 | N/M | N/M | 37 | 31 | N/M | ||||||||||||||||||||||||||||||||||||||||||||||||||||
| Net securities (losses) | (30) | (35) | — | (50) | (17) | N/M | N/M | (65) | (35) | N/M | ||||||||||||||||||||||||||||||||||||||||||||||||||||
| Total investment and other revenue | 208 | 184 | 230 | 140 | 196 | N/M | N/M | 622 | 547 | N/M | ||||||||||||||||||||||||||||||||||||||||||||||||||||
| Total fee and other revenue | $ | 3,845 | $ | 3,825 | $ | 3,633 | $ | 3,653 | $ | 3,600 | 1 | % | 7 | % | $ | 11,303 | $ | 10,654 | 6 | % | ||||||||||||||||||||||||||||||||||||||||||
(a) Excludes seed capital gains (losses) related to consolidated investment management funds. | ||||||||||||||||||||||||||||||||||||||||||||||||||||||||||||||
(b) On a constant currency basis, investment management and performance fees decreased 2% (Non-GAAP) compared with 3Q24. See “Explanation of GAAP and Non-GAAP Financial Measures” beginning on page 18 for the reconciliation of this Non-GAAP measure. | ||||||||||||||||||||||||||||||||||||||||||||||||||||||||||||||
| (c) Includes gains (losses) on investments in BNY funds which hedge deferred incentive awards. | ||||||||||||||||||||||||||||||||||||||||||||||||||||||||||||||
| (d) Includes strategic equity, private equity and other investments. | ||||||||||||||||||||||||||||||||||||||||||||||||||||||||||||||
| N/M – Not meaningful. | ||||||||||||||||||||||||||||||||||||||||||||||||||||||||||||||
6
| THE BANK OF NEW YORK MELLON CORPORATION | | |||||||||||||||||||||||||||||||||||||||||||||||||||||||||||||
| AVERAGE BALANCES AND INTEREST RATES | ||||||||||||||||||||||||||||||||||||||||||||||||||||||||||||||
| 3Q25 | 2Q25 | 1Q25 | 4Q24 | 3Q24 | ||||||||||||||||||||||||||||||||||||||||||||||||||||||||||
| Average balance | Average rate | Average balance | Average rate | Average balance | Average rate | Average balance | Average rate | Average balance | Average rate | |||||||||||||||||||||||||||||||||||||||||||||||||||||
| (dollars in millions; average rates are annualized) | ||||||||||||||||||||||||||||||||||||||||||||||||||||||||||||||
| Assets | ||||||||||||||||||||||||||||||||||||||||||||||||||||||||||||||
| Interest-earning assets: | ||||||||||||||||||||||||||||||||||||||||||||||||||||||||||||||
| Interest-bearing deposits with the Federal Reserve and other central banks | $ | 94,533 | 3.69 | % | $ | 99,426 | 3.73 | % | $ | 86,038 | 3.84 | % | $ | 94,337 | 4.18 | % | $ | 100,611 | 4.62 | % | ||||||||||||||||||||||||||||||||||||||||||
| Interest-bearing deposits with banks | 10,980 | 2.97 | 11,199 | 3.10 | 10,083 | 3.39 | 10,479 | 3.54 | 10,559 | 4.15 | ||||||||||||||||||||||||||||||||||||||||||||||||||||
| Federal funds sold and securities purchased under resale agreements | 40,885 | 30.66 | (a) | 39,522 | 32.23 | (a) | 41,166 | 28.79 | (a) | 37,939 | 31.22 | (a) | 31,183 | 36.65 | (a) | |||||||||||||||||||||||||||||||||||||||||||||||
| Loans | 72,692 | 5.80 | 71,265 | 5.81 | 69,670 | 5.80 | 69,211 | 6.17 | 69,205 | 6.57 | ||||||||||||||||||||||||||||||||||||||||||||||||||||
| Securities: | ||||||||||||||||||||||||||||||||||||||||||||||||||||||||||||||
| U.S. government obligations | 31,754 | 3.59 | 29,279 | 3.63 | 26,614 | 3.49 | 27,223 | 3.47 | 28,490 | 3.71 | ||||||||||||||||||||||||||||||||||||||||||||||||||||
| U.S. government agency obligations | 61,174 | 3.40 | 62,874 | 3.36 | 63,514 | 3.27 | 63,166 | 3.31 | 62,572 | 3.26 | ||||||||||||||||||||||||||||||||||||||||||||||||||||
| Other securities | 54,986 | 3.61 | 54,610 | 3.58 | 51,403 | 3.62 | 49,675 | 3.76 | 48,647 | 4.00 | ||||||||||||||||||||||||||||||||||||||||||||||||||||
| Total investment securities | 147,914 | 3.52 | 146,763 | 3.49 | 141,531 | 3.44 | 140,064 | 3.50 | 139,709 | 3.61 | ||||||||||||||||||||||||||||||||||||||||||||||||||||
Trading securities (b) | 7,489 | 5.02 | 7,367 | 4.84 | 6,199 | 5.29 | 5,738 | 6.13 | 5,667 | 5.33 | ||||||||||||||||||||||||||||||||||||||||||||||||||||
Total securities (b) | 155,403 | 3.59 | 154,130 | 3.56 | 147,730 | 3.52 | 145,802 | 3.61 | 145,376 | 3.68 | ||||||||||||||||||||||||||||||||||||||||||||||||||||
Total interest-earning assets (b) | $ | 374,493 | 6.98 | % | $ | 375,542 | 7.03 | % | $ | 354,687 | 6.97 | % | $ | 357,768 | 7.18 | % | $ | 356,934 | 7.40 | % | ||||||||||||||||||||||||||||||||||||||||||
| Noninterest-earning assets | 62,998 | 63,066 | 61,157 | 62,576 | 59,463 | |||||||||||||||||||||||||||||||||||||||||||||||||||||||||
| Total assets | $ | 437,491 | $ | 438,608 | $ | 415,844 | $ | 420,344 | $ | 416,397 | ||||||||||||||||||||||||||||||||||||||||||||||||||||
| Liabilities and equity | ||||||||||||||||||||||||||||||||||||||||||||||||||||||||||||||
| Interest-bearing liabilities: | ||||||||||||||||||||||||||||||||||||||||||||||||||||||||||||||
| Interest-bearing deposits | $ | 248,016 | 2.90 | % | $ | 250,688 | 2.95 | % | $ | 234,394 | 2.98 | % | $ | 235,281 | 3.27 | % | $ | 236,724 | 3.82 | % | ||||||||||||||||||||||||||||||||||||||||||
| Federal funds purchased and securities sold under repurchase agreements | 16,242 | 69.11 | (a) | 17,485 | 65.95 | (a) | 17,566 | 60.25 | (a) | 17,599 | 60.52 | (a) | 16,584 | 62.85 | (a) | |||||||||||||||||||||||||||||||||||||||||||||||
| Trading liabilities | 3,333 | 4.40 | 2,821 | 4.94 | 2,063 | 4.56 | 1,887 | 4.61 | 1,844 | 4.83 | ||||||||||||||||||||||||||||||||||||||||||||||||||||
| Other borrowed funds | 243 | 4.63 | 432 | 5.06 | 288 | 5.93 | 484 | 2.32 | 418 | 3.15 | ||||||||||||||||||||||||||||||||||||||||||||||||||||
| Commercial paper | 3,268 | 4.63 | 2,511 | 4.56 | 1,279 | 4.51 | 2,336 | 4.83 | 1,474 | 5.50 | ||||||||||||||||||||||||||||||||||||||||||||||||||||
| Payables to customers and broker-dealers | 16,434 | 4.34 | 15,494 | 4.19 | 15,142 | 4.21 | 13,672 | 4.77 | 12,737 | 5.29 | ||||||||||||||||||||||||||||||||||||||||||||||||||||
| Long-term debt | 32,503 | 5.53 | 31,805 | 5.64 | 31,216 | 5.57 | 31,506 | 5.58 | 33,154 | 5.93 | ||||||||||||||||||||||||||||||||||||||||||||||||||||
| Total interest-bearing liabilities | $ | 320,039 | 6.64 | % | $ | 321,236 | 6.74 | % | $ | 301,948 | 6.66 | % | $ | 302,765 | 6.92 | % | $ | 302,935 | 7.36 | % | ||||||||||||||||||||||||||||||||||||||||||
| Total noninterest-bearing deposits | 51,310 | 49,610 | 48,141 | 51,207 | 47,962 | |||||||||||||||||||||||||||||||||||||||||||||||||||||||||
| Other noninterest-bearing liabilities | 21,674 | 24,073 | 23,808 | 24,790 | 24,122 | |||||||||||||||||||||||||||||||||||||||||||||||||||||||||
| Total The Bank of New York Mellon Corporation shareholders’ equity | 43,974 | 43,223 | 41,542 | 41,266 | 41,115 | |||||||||||||||||||||||||||||||||||||||||||||||||||||||||
| Noncontrolling interests | 494 | 466 | 405 | 316 | 263 | |||||||||||||||||||||||||||||||||||||||||||||||||||||||||
| Total liabilities and equity | $ | 437,491 | $ | 438,608 | $ | 415,844 | $ | 420,344 | $ | 416,397 | ||||||||||||||||||||||||||||||||||||||||||||||||||||
| Net interest margin | 1.31 | % | 1.27 | % | 1.30 | % | 1.32 | % | 1.16 | % | ||||||||||||||||||||||||||||||||||||||||||||||||||||
Net interest margin (FTE) – Non-GAAP (c) | 1.31 | % | 1.27 | % | 1.30 | % | 1.32 | % | 1.16 | % | ||||||||||||||||||||||||||||||||||||||||||||||||||||
(a) Includes the average impact of offsetting under enforceable netting agreements of approximately $241 billion for 3Q25, $247 billion for 2Q25, $224 billion for 1Q25, $208 billion for 4Q24 and $179 billion for 3Q24. On a Non-GAAP basis, excluding the impact of offsetting, the yield on federal funds sold and securities purchased under resale agreements would have been 4.45% for 3Q25, 4.45% for 2Q25, 4.46% for 1Q25, 4.82% for 4Q24 and 5.43% for 3Q24. On a Non-GAAP basis, excluding the impact of offsetting, the rate on federal funds purchased and securities sold under repurchase agreements would have been 4.36% for 3Q25, 4.36% for 2Q25, 4.37% for 1Q25, 4.73% for 4Q24 and 5.32% for 3Q24. We believe providing the rates excluding the impact of netting is useful to investors as it is more reflective of the actual rates earned and paid. | ||||||||||||||||||||||||||||||||||||||||||||||||||||||||||||||
| (b) Average rates were calculated on an FTE basis, at tax rates of approximately 21%. | ||||||||||||||||||||||||||||||||||||||||||||||||||||||||||||||
(c) See “Explanation of GAAP and Non-GAAP Financial Measures” beginning on page 18 for the reconciliation of this Non-GAAP measure. | ||||||||||||||||||||||||||||||||||||||||||||||||||||||||||||||
7
| THE BANK OF NEW YORK MELLON CORPORATION | | ||||||||||||||||||||||||||||||||||||||||
| CAPITAL AND LIQUIDITY | |||||||||||||||||||||||||||||||||||||||||
| 2025 | 2024 | ||||||||||||||||||||||||||||||||||||||||
| (dollars in millions) | Sept. 30 | June 30 | March 31 | Dec. 31 | Sept. 30 | ||||||||||||||||||||||||||||||||||||
Consolidated regulatory capital ratios: (a) | |||||||||||||||||||||||||||||||||||||||||
| Standardized Approach: | |||||||||||||||||||||||||||||||||||||||||
| CET1 capital | $ | 20,645 | $ | 20,149 | $ | 19,505 | $ | 18,759 | $ | 19,687 | |||||||||||||||||||||||||||||||
| Tier 1 capital | 25,471 | 25,472 | 24,783 | 23,039 | 23,972 | ||||||||||||||||||||||||||||||||||||
| Total capital | 27,079 | 27,243 | 26,581 | 24,818 | 25,865 | ||||||||||||||||||||||||||||||||||||
| Risk-weighted assets | 176,645 | 175,668 | 169,262 | 167,786 | 165,652 | ||||||||||||||||||||||||||||||||||||
| CET1 ratio | 11.7 | % | 11.5 | % | 11.5 | % | 11.2 | % | 11.9 | % | |||||||||||||||||||||||||||||||
| Tier 1 capital ratio | 14.4 | 14.5 | 14.6 | 13.7 | 14.5 | ||||||||||||||||||||||||||||||||||||
| Total capital ratio | 15.3 | 15.5 | 15.7 | 14.8 | 15.6 | ||||||||||||||||||||||||||||||||||||
| Advanced Approaches: | |||||||||||||||||||||||||||||||||||||||||
| CET1 capital | $ | 20,645 | $ | 20,149 | $ | 19,505 | $ | 18,759 | $ | 19,687 | |||||||||||||||||||||||||||||||
| Tier 1 capital | 25,471 | 25,472 | 24,783 | 23,039 | 23,972 | ||||||||||||||||||||||||||||||||||||
| Total capital | 26,733 | 26,897 | 26,246 | 24,535 | 25,534 | ||||||||||||||||||||||||||||||||||||
| Risk-weighted assets | 169,017 | 168,748 | 162,234 | 160,472 | 163,858 | ||||||||||||||||||||||||||||||||||||
| CET1 ratio | 12.2 | % | 11.9 | % | 12.0 | % | 11.7 | % | 12.0 | % | |||||||||||||||||||||||||||||||
| Tier 1 capital ratio | 15.1 | 15.1 | 15.3 | 14.4 | 14.6 | ||||||||||||||||||||||||||||||||||||
| Total capital ratio | 15.8 | 15.9 | 16.2 | 15.3 | 15.6 | ||||||||||||||||||||||||||||||||||||
Tier 1 leverage ratio: (a) | |||||||||||||||||||||||||||||||||||||||||
| Average assets for Tier 1 leverage ratio | $ | 419,077 | $ | 420,131 | $ | 397,513 | $ | 402,069 | $ | 398,381 | |||||||||||||||||||||||||||||||
| Tier 1 leverage ratio | 6.1 | % | 6.1 | % | 6.2 | % | 5.7 | % | 6.0 | % | |||||||||||||||||||||||||||||||
SLR: (a) | |||||||||||||||||||||||||||||||||||||||||
| Leverage exposure | $ | 377,574 | $ | 369,838 | $ | 359,666 | $ | 353,523 | $ | 342,942 | |||||||||||||||||||||||||||||||
| SLR | 6.7 | % | 6.9 | % | 6.9 | % | 6.5 | % | 7.0 | % | |||||||||||||||||||||||||||||||
Average liquidity coverage ratio (a) | 112 | % | 112 | % | 116 | % | 115 | % | 116 | % | |||||||||||||||||||||||||||||||
Average net stable funding ratio (a) | 130 | % | 131 | % | 132 | % | 132 | % | 132 | % | |||||||||||||||||||||||||||||||
(a) Regulatory capital and liquidity ratios for Sept. 30, 2025 are preliminary. For our CET1, Tier 1 capital and Total capital ratios, our effective capital ratios under the U.S. capital rules are the lower of the ratios as calculated under the Standardized and Advanced Approaches, which for Sept. 30, 2025, June 30, 2025, March 31, 2025 and Dec. 31, 2024 was the Standardized Approach, and for Sept. 30, 2024 was the Standardized Approach for the CET1 and Tier 1 capital ratios and the Advanced Approaches for the Total capital ratio. | |||||||||||||||||||||||||||||||||||||||||
8
| THE BANK OF NEW YORK MELLON CORPORATION | | |||||||||||||||||||||||||||||||||||||||||||||||||||||||||||||
| SECURITIES SERVICES BUSINESS SEGMENT | ||||||||||||||||||||||||||||||||||||||||||||||||||||||||||||||
| 3Q25 vs. | YTD25 vs. | |||||||||||||||||||||||||||||||||||||||||||||||||||||||||||||
| (dollars in millions) | 3Q25 | 2Q25 | 1Q25 | 4Q24 | 3Q24 | 2Q25 | 3Q24 | YTD25 | YTD24 | YTD24 | ||||||||||||||||||||||||||||||||||||||||||||||||||||
| Revenue: | ||||||||||||||||||||||||||||||||||||||||||||||||||||||||||||||
| Investment services fees: | ||||||||||||||||||||||||||||||||||||||||||||||||||||||||||||||
| Asset Servicing | $ | 1,141 | $ | 1,094 | $ | 1,062 | $ | 1,042 | $ | 1,021 | 4 | % | 12 | % | $ | 3,297 | $ | 3,052 | 8 | % | ||||||||||||||||||||||||||||||||||||||||||
| Issuer Services | 313 | 376 | 267 | 295 | 285 | (17) | 10 | 956 | 868 | 10 | ||||||||||||||||||||||||||||||||||||||||||||||||||||
| Total investment services fees | 1,454 | 1,470 | 1,329 | 1,337 | 1,306 | (1) | 11 | 4,253 | 3,920 | 8 | ||||||||||||||||||||||||||||||||||||||||||||||||||||
| Foreign exchange revenue | 143 | 175 | 136 | 147 | 137 | (18) | 4 | 454 | 405 | 12 | ||||||||||||||||||||||||||||||||||||||||||||||||||||
Other fees (a) | 73 | 60 | 65 | 62 | 57 | 22 | 28 | 198 | 172 | 15 | ||||||||||||||||||||||||||||||||||||||||||||||||||||
| Total fee revenue | 1,670 | 1,705 | 1,530 | 1,546 | 1,500 | (2) | 11 | 4,905 | 4,497 | 9 | ||||||||||||||||||||||||||||||||||||||||||||||||||||
| Investment and other revenue | 119 | 94 | 140 | 97 | 105 | N/M | N/M | 353 | 308 | N/M | ||||||||||||||||||||||||||||||||||||||||||||||||||||
| Total fee and other revenue | 1,789 | 1,799 | 1,670 | 1,643 | 1,605 | (1) | 11 | 5,258 | 4,805 | 9 | ||||||||||||||||||||||||||||||||||||||||||||||||||||
| Net interest income | 670 | 675 | 630 | 681 | 609 | (1) | 10 | 1,975 | 1,787 | 11 | ||||||||||||||||||||||||||||||||||||||||||||||||||||
| Total revenue | 2,459 | 2,474 | 2,300 | 2,324 | 2,214 | (1) | 11 | 7,233 | 6,592 | 10 | ||||||||||||||||||||||||||||||||||||||||||||||||||||
| Provision for credit losses | (3) | (13) | 8 | 15 | 15 | N/M | N/M | (8) | 23 | N/M | ||||||||||||||||||||||||||||||||||||||||||||||||||||
| Noninterest expense (ex. amortization of intangible assets) | 1,649 | 1,613 | 1,578 | 1,659 | 1,550 | 2 | 6 | 4,840 | 4,627 | 5 | ||||||||||||||||||||||||||||||||||||||||||||||||||||
| Amortization of intangible assets | 7 | 7 | 6 | 7 | 7 | — | — | 20 | 21 | (5) | ||||||||||||||||||||||||||||||||||||||||||||||||||||
| Total noninterest expense | 1,656 | 1,620 | 1,584 | 1,666 | 1,557 | 2 | 6 | 4,860 | 4,648 | 5 | ||||||||||||||||||||||||||||||||||||||||||||||||||||
| Income before income taxes | $ | 806 | $ | 867 | $ | 708 | $ | 643 | $ | 642 | (7) | % | 26 | % | $ | 2,381 | $ | 1,921 | 24 | % | ||||||||||||||||||||||||||||||||||||||||||
| Total revenue by line of business: | ||||||||||||||||||||||||||||||||||||||||||||||||||||||||||||||
| Asset Servicing | $ | 1,915 | $ | 1,870 | $ | 1,786 | $ | 1,797 | $ | 1,720 | 2 | % | 11 | % | $ | 5,571 | $ | 5,075 | 10 | % | ||||||||||||||||||||||||||||||||||||||||||
| Issuer Services | 544 | 604 | 514 | 527 | 494 | (10) | 10 | 1,662 | 1,517 | 10 | ||||||||||||||||||||||||||||||||||||||||||||||||||||
| Total revenue by line of business | $ | 2,459 | $ | 2,474 | $ | 2,300 | $ | 2,324 | $ | 2,214 | (1) | % | 11 | % | $ | 7,233 | $ | 6,592 | 10 | % | ||||||||||||||||||||||||||||||||||||||||||
| Financial ratios: | ||||||||||||||||||||||||||||||||||||||||||||||||||||||||||||||
| Pre-tax operating margin | 33 | % | 35 | % | 31 | % | 28 | % | 29 | % | 33 | % | 29 | % | ||||||||||||||||||||||||||||||||||||||||||||||||
Memo: Securities lending revenue (b) | $ | 62 | $ | 56 | $ | 52 | $ | 52 | $ | 47 | 11 | % | 32 | % | $ | 170 | $ | 139 | 22 | % | ||||||||||||||||||||||||||||||||||||||||||
| (a) Other fees primarily include financing-related fees. | ||||||||||||||||||||||||||||||||||||||||||||||||||||||||||||||
| (b) Included in investment services fees reported in the Asset Servicing line of business. | ||||||||||||||||||||||||||||||||||||||||||||||||||||||||||||||
| N/M – Not meaningful. | ||||||||||||||||||||||||||||||||||||||||||||||||||||||||||||||
9
| THE BANK OF NEW YORK MELLON CORPORATION | | |||||||||||||||||||||||||||||||||||||||||||||||||||||||||||||
| SECURITIES SERVICES BUSINESS SEGMENT | ||||||||||||||||||||||||||||||||||||||||||||||||||||||||||||||
| 3Q25 vs. | YTD25 vs. | |||||||||||||||||||||||||||||||||||||||||||||||||||||||||||||
| (dollars in millions, unless otherwise noted) | 3Q25 | 2Q25 | 1Q25 | 4Q24 | 3Q24 | 2Q25 | 3Q24 | YTD25 | YTD24 | YTD24 | ||||||||||||||||||||||||||||||||||||||||||||||||||||
| Selected balance sheet data: | ||||||||||||||||||||||||||||||||||||||||||||||||||||||||||||||
| Average loans | $ | 10,706 | $ | 11,327 | $ | 11,347 | $ | 11,553 | $ | 11,077 | (5) | % | (3) | % | $ | 11,124 | $ | 11,128 | — | % | ||||||||||||||||||||||||||||||||||||||||||
Average assets (a) | $ | 202,454 | $ | 206,552 | $ | 194,901 | $ | 200,277 | $ | 199,057 | (2) | % | 2 | % | $ | 201,330 | $ | 195,552 | 3 | % | ||||||||||||||||||||||||||||||||||||||||||
| Average deposits | $ | 183,081 | $ | 185,831 | $ | 175,854 | $ | 180,843 | $ | 180,500 | (1) | % | 1 | % | $ | 181,615 | $ | 177,904 | 2 | % | ||||||||||||||||||||||||||||||||||||||||||
| Selected metrics: | ||||||||||||||||||||||||||||||||||||||||||||||||||||||||||||||
AUC/A at period end (in trillions) (b)(c) | $ | 41.7 | $ | 40.1 | $ | 38.1 | $ | 37.7 | $ | 37.5 | 4 | % | 11 | % | ||||||||||||||||||||||||||||||||||||||||||||||||
Market value of securities on loan at period end (in billions) (d) | $ | 554 | $ | 516 | $ | 504 | $ | 488 | $ | 484 | 7 | % | 14 | % | ||||||||||||||||||||||||||||||||||||||||||||||||
| Issuer Services | ||||||||||||||||||||||||||||||||||||||||||||||||||||||||||||||
Total debt serviced at period end (in trillions) | $ | 14.5 | $ | 14.3 | $ | 13.9 | $ | 14.1 | $ | 14.3 | 1 | % | 1 | % | ||||||||||||||||||||||||||||||||||||||||||||||||
| Number of sponsored Depositary Receipts programs at period end | 477 | 482 | 488 | 499 | 507 | (1) | % | (6) | % | |||||||||||||||||||||||||||||||||||||||||||||||||||||
(a) In business segments where average deposits are greater than average loans, average assets include an allocation of investment securities equal to the difference. | ||||||||||||||||||||||||||||||||||||||||||||||||||||||||||||||
(b) Sept. 30, 2025 information is preliminary. | ||||||||||||||||||||||||||||||||||||||||||||||||||||||||||||||
(c) Consists of AUC/A primarily from the Asset Servicing line of business and, to a lesser extent, the Issuer Services line of business. Includes the AUC/A of CIBC Mellon of $2.1 trillion at Sept. 30, 2025, $2.0 trillion at June 30, 2025, $1.9 trillion at March 31, 2025, $1.8 trillion at Dec. 31, 2024 and $1.9 trillion at Sept. 30, 2024. | ||||||||||||||||||||||||||||||||||||||||||||||||||||||||||||||
(d) Represents the total amount of securities on loan in our agency securities lending program. Excludes securities for which BNY acts as agent on behalf of CIBC Mellon clients, which totaled $81 billion at Sept. 30, 2025, $68 billion at June 30, 2025, $62 billion at March 31, 2025, $60 billion at Dec. 31, 2024 and $67 billion at Sept. 30, 2024. | ||||||||||||||||||||||||||||||||||||||||||||||||||||||||||||||
10
| THE BANK OF NEW YORK MELLON CORPORATION | | |||||||||||||||||||||||||||||||||||||||||||||||||||||||||||||
| MARKET AND WEALTH SERVICES BUSINESS SEGMENT | ||||||||||||||||||||||||||||||||||||||||||||||||||||||||||||||
| 3Q25 vs. | YTD25 vs. | |||||||||||||||||||||||||||||||||||||||||||||||||||||||||||||
| (dollars in millions) | 3Q25 | 2Q25 | 1Q25 | 4Q24 | 3Q24 | 2Q25 | 3Q24 | YTD25 | YTD24 | YTD24 | ||||||||||||||||||||||||||||||||||||||||||||||||||||
| Revenue: | ||||||||||||||||||||||||||||||||||||||||||||||||||||||||||||||
| Investment services fees: | ||||||||||||||||||||||||||||||||||||||||||||||||||||||||||||||
| Pershing | $ | 508 | $ | 513 | $ | 503 | $ | 516 | $ | 475 | (1) | % | 7 | % | $ | 1,524 | $ | 1,431 | 6 | % | ||||||||||||||||||||||||||||||||||||||||||
| Treasury Services | 214 | 209 | 209 | 206 | 200 | 2 | 7 | 632 | 586 | 8 | ||||||||||||||||||||||||||||||||||||||||||||||||||||
| Clearance and Collateral Management | 398 | 385 | 362 | 364 | 354 | 3 | 12 | 1,145 | 1,021 | 12 | ||||||||||||||||||||||||||||||||||||||||||||||||||||
| Total investment services fees | 1,120 | 1,107 | 1,074 | 1,086 | 1,029 | 1 | 9 | 3,301 | 3,038 | 9 | ||||||||||||||||||||||||||||||||||||||||||||||||||||
| Foreign exchange revenue | 31 | 30 | 29 | 27 | 23 | 3 | 35 | 90 | 70 | 29 | ||||||||||||||||||||||||||||||||||||||||||||||||||||
Other fees (a) | 70 | 63 | 65 | 61 | 58 | 11 | 21 | 198 | 174 | 14 | ||||||||||||||||||||||||||||||||||||||||||||||||||||
| Total fee revenue | 1,221 | 1,200 | 1,168 | 1,174 | 1,110 | 2 | 10 | 3,589 | 3,282 | 9 | ||||||||||||||||||||||||||||||||||||||||||||||||||||
| Investment and other revenue | 22 | 36 | 21 | 19 | 20 | N/M | N/M | 79 | 60 | N/M | ||||||||||||||||||||||||||||||||||||||||||||||||||||
| Total fee and other revenue | 1,243 | 1,236 | 1,189 | 1,193 | 1,130 | 1 | 10 | 3,668 | 3,342 | 10 | ||||||||||||||||||||||||||||||||||||||||||||||||||||
| Net interest income | 524 | 506 | 497 | 474 | 415 | 4 | 26 | 1,527 | 1,255 | 22 | ||||||||||||||||||||||||||||||||||||||||||||||||||||
| Total revenue | 1,767 | 1,742 | 1,686 | 1,667 | 1,545 | 1 | 14 | 5,195 | 4,597 | 13 | ||||||||||||||||||||||||||||||||||||||||||||||||||||
| Provision for credit losses | (3) | (6) | 4 | 9 | 7 | N/M | N/M | (5) | 10 | N/M | ||||||||||||||||||||||||||||||||||||||||||||||||||||
| Noninterest expense (ex. amortization of intangible assets) | 894 | 897 | 865 | 851 | 833 | — | 7 | 2,656 | 2,498 | 6 | ||||||||||||||||||||||||||||||||||||||||||||||||||||
| Amortization of intangible assets | 1 | — | 1 | 1 | 1 | N/M | N/M | 2 | 3 | N/M | ||||||||||||||||||||||||||||||||||||||||||||||||||||
| Total noninterest expense | 895 | 897 | 866 | 852 | 834 | — | 7 | 2,658 | 2,501 | 6 | ||||||||||||||||||||||||||||||||||||||||||||||||||||
| Income before income taxes | $ | 875 | $ | 851 | $ | 816 | $ | 806 | $ | 704 | 3 | % | 24 | % | $ | 2,542 | $ | 2,086 | 22 | % | ||||||||||||||||||||||||||||||||||||||||||
| Total revenue by line of business: | ||||||||||||||||||||||||||||||||||||||||||||||||||||||||||||||
| Pershing | $ | 729 | $ | 739 | $ | 719 | $ | 705 | $ | 649 | (1) | % | 12 | % | $ | 2,187 | $ | 1,982 | 10 | % | ||||||||||||||||||||||||||||||||||||||||||
| Treasury Services | 510 | 490 | 477 | 471 | 424 | 4 | 20 | 1,477 | 1,266 | 17 | ||||||||||||||||||||||||||||||||||||||||||||||||||||
| Clearance and Collateral Management | 528 | 513 | 490 | 491 | 472 | 3 | 12 | 1,531 | 1,349 | 13 | ||||||||||||||||||||||||||||||||||||||||||||||||||||
| Total revenue by line of business | $ | 1,767 | $ | 1,742 | $ | 1,686 | $ | 1,667 | $ | 1,545 | 1 | % | 14 | % | $ | 5,195 | $ | 4,597 | 13 | % | ||||||||||||||||||||||||||||||||||||||||||
| Financial ratios: | ||||||||||||||||||||||||||||||||||||||||||||||||||||||||||||||
| Pre-tax operating margin | 50 | % | 49 | % | 48 | % | 48 | % | 46 | % | 49 | % | 45 | % | ||||||||||||||||||||||||||||||||||||||||||||||||
| (a) Other fees primarily include financing-related fees. | ||||||||||||||||||||||||||||||||||||||||||||||||||||||||||||||
| N/M – Not meaningful. | ||||||||||||||||||||||||||||||||||||||||||||||||||||||||||||||
11
| THE BANK OF NEW YORK MELLON CORPORATION | | |||||||||||||||||||||||||||||||||||||||||||||||||||||||||||||
| MARKET AND WEALTH SERVICES BUSINESS SEGMENT | ||||||||||||||||||||||||||||||||||||||||||||||||||||||||||||||
| 3Q25 vs. | YTD25 vs. | |||||||||||||||||||||||||||||||||||||||||||||||||||||||||||||
| (dollars in millions, unless otherwise noted) | 3Q25 | 2Q25 | 1Q25 | 4Q24 | 3Q24 | 2Q25 | 3Q24 | YTD25 | YTD24 | YTD24 | ||||||||||||||||||||||||||||||||||||||||||||||||||||
| Selected balance sheet data: | ||||||||||||||||||||||||||||||||||||||||||||||||||||||||||||||
| Average loans | $ | 46,278 | $ | 44,262 | $ | 42,986 | $ | 42,217 | $ | 42,730 | 5 | % | 8 | % | $ | 44,520 | $ | 41,303 | 8 | % | ||||||||||||||||||||||||||||||||||||||||||
Average assets (a) | $ | 137,103 | $ | 135,119 | $ | 129,244 | $ | 126,919 | $ | 122,526 | 1 | % | 12 | % | $ | 133,851 | $ | 123,619 | 8 | % | ||||||||||||||||||||||||||||||||||||||||||
| Average deposits | $ | 97,497 | $ | 96,566 | $ | 91,905 | $ | 90,980 | $ | 88,856 | 1 | % | 10 | % | $ | 95,343 | $ | 89,918 | 6 | % | ||||||||||||||||||||||||||||||||||||||||||
| Selected metrics: | ||||||||||||||||||||||||||||||||||||||||||||||||||||||||||||||
AUC/A at period end (in trillions) (b)(c) | $ | 15.8 | $ | 15.4 | $ | 14.7 | $ | 14.1 | $ | 14.3 | 3 | % | 10 | % | ||||||||||||||||||||||||||||||||||||||||||||||||
| Pershing | ||||||||||||||||||||||||||||||||||||||||||||||||||||||||||||||
AUC/A at period end (in trillions) (b) | $ | 3.0 | $ | 2.8 | $ | 2.7 | $ | 2.7 | $ | 2.7 | 7 | % | 11 | % | ||||||||||||||||||||||||||||||||||||||||||||||||
Net new assets (U.S. platform) (in billions) (d) | $ | 3 | $ | (10) | $ | 11 | $ | 41 | $ | (22) | N/M | N/M | ||||||||||||||||||||||||||||||||||||||||||||||||||
Daily average revenue trades (“DARTs”) (U.S. platform) (in thousands) | 269 | 334 | 298 | 254 | 251 | (19) | % | 7 | % | |||||||||||||||||||||||||||||||||||||||||||||||||||||
Average active clearing accounts (in thousands) | 8,387 | 8,405 | 8,406 | 8,260 | 8,085 | — | % | 4 | % | |||||||||||||||||||||||||||||||||||||||||||||||||||||
| Treasury Services | ||||||||||||||||||||||||||||||||||||||||||||||||||||||||||||||
| Average daily U.S. dollar payment volumes | 246,286 | 246,250 | 244,673 | 250,714 | 242,243 | — | % | 2 | % | |||||||||||||||||||||||||||||||||||||||||||||||||||||
| Clearance and Collateral Management | ||||||||||||||||||||||||||||||||||||||||||||||||||||||||||||||
Average collateral balances (in billions) | $ | 7,275 | $ | 7,061 | $ | 6,576 | $ | 6,463 | $ | 6,380 | 3 | % | 14 | % | ||||||||||||||||||||||||||||||||||||||||||||||||
(a) In business segments where average deposits are greater than average loans, average assets include an allocation of investment securities equal to the difference. | ||||||||||||||||||||||||||||||||||||||||||||||||||||||||||||||
(b) Sept. 30, 2025 information is preliminary. | ||||||||||||||||||||||||||||||||||||||||||||||||||||||||||||||
(c) Consists of AUC/A from the Clearance and Collateral Management and Pershing lines of business. | ||||||||||||||||||||||||||||||||||||||||||||||||||||||||||||||
(d) Net new assets represent net flows of assets (e.g., net cash deposits and net securities transfers, including dividends and interest) in customer accounts in Pershing LLC, a U.S. broker-dealer. | ||||||||||||||||||||||||||||||||||||||||||||||||||||||||||||||
| N/M – Not meaningful. | ||||||||||||||||||||||||||||||||||||||||||||||||||||||||||||||
12
| THE BANK OF NEW YORK MELLON CORPORATION | | |||||||||||||||||||||||||||||||||||||||||||||||||||||||||||||
| INVESTMENT AND WEALTH MANAGEMENT BUSINESS SEGMENT | ||||||||||||||||||||||||||||||||||||||||||||||||||||||||||||||
| 3Q25 vs. | YTD25 vs. | |||||||||||||||||||||||||||||||||||||||||||||||||||||||||||||
| (dollars in millions) | 3Q25 | 2Q25 | 1Q25 | 4Q24 | 3Q24 | 2Q25 | 3Q24 | YTD25 | YTD24 | YTD24 | ||||||||||||||||||||||||||||||||||||||||||||||||||||
| Revenue: | ||||||||||||||||||||||||||||||||||||||||||||||||||||||||||||||
Investment management fees (a) | $ | 776 | $ | 748 | $ | 735 | $ | 789 | $ | 782 | 4 | % | (1) | % | $ | 2,259 | $ | 2,304 | (2) | % | ||||||||||||||||||||||||||||||||||||||||||
| Performance fees | 6 | 10 | 5 | 20 | 13 | N/M | N/M | 21 | 31 | N/M | ||||||||||||||||||||||||||||||||||||||||||||||||||||
Investment management and performance fees (b) | 782 | 758 | 740 | 809 | 795 | 3 | (2) | 2,280 | 2,335 | (2) | ||||||||||||||||||||||||||||||||||||||||||||||||||||
| Distribution and servicing fees | 69 | 69 | 68 | 68 | 68 | — | 1 | 206 | 207 | — | ||||||||||||||||||||||||||||||||||||||||||||||||||||
Other fees (c) | (78) | (76) | (75) | (64) | (68) | N/M | N/M | (229) | (192) | N/M | ||||||||||||||||||||||||||||||||||||||||||||||||||||
| Total fee revenue | 773 | 751 | 733 | 813 | 795 | 3 | (3) | 2,257 | 2,350 | (4) | ||||||||||||||||||||||||||||||||||||||||||||||||||||
Investment and other revenue (d) | 10 | 9 | 5 | 13 | 9 | N/M | N/M | 24 | 37 | N/M | ||||||||||||||||||||||||||||||||||||||||||||||||||||
Total fee and other revenue (d) | 783 | 760 | 738 | 826 | 804 | 3 | (3) | 2,281 | 2,387 | (4) | ||||||||||||||||||||||||||||||||||||||||||||||||||||
| Net interest income | 41 | 41 | 41 | 47 | 45 | — | (9) | 123 | 129 | (5) | ||||||||||||||||||||||||||||||||||||||||||||||||||||
| Total revenue | 824 | 801 | 779 | 873 | 849 | 3 | (3) | 2,404 | 2,516 | (4) | ||||||||||||||||||||||||||||||||||||||||||||||||||||
| Provision for credit losses | — | — | 2 | — | 1 | N/M | N/M | 2 | 4 | N/M | ||||||||||||||||||||||||||||||||||||||||||||||||||||
Noninterest expense (ex. amortization of intangible assets) (a) | 636 | 649 | 710 | 695 | 668 | (2) | (5) | 1,995 | 2,067 | (3) | ||||||||||||||||||||||||||||||||||||||||||||||||||||
| Amortization of intangible assets | 4 | 4 | 4 | 5 | 4 | — | — | 12 | 13 | (8) | ||||||||||||||||||||||||||||||||||||||||||||||||||||
| Total noninterest expense | 640 | 653 | 714 | 700 | 672 | (2) | (5) | 2,007 | 2,080 | (4) | ||||||||||||||||||||||||||||||||||||||||||||||||||||
| Income before income taxes | $ | 184 | $ | 148 | $ | 63 | $ | 173 | $ | 176 | 24 | % | 5 | % | $ | 395 | $ | 432 | (9) | % | ||||||||||||||||||||||||||||||||||||||||||
| Total revenue by line of business: | ||||||||||||||||||||||||||||||||||||||||||||||||||||||||||||||
Investment Management (a) | $ | 546 | $ | 531 | $ | 505 | $ | 585 | $ | 569 | 3 | % | (4) | % | $ | 1,582 | $ | 1,694 | (7) | % | ||||||||||||||||||||||||||||||||||||||||||
| Wealth Management | 278 | 270 | 274 | 288 | 280 | 3 | (1) | 822 | 822 | — | ||||||||||||||||||||||||||||||||||||||||||||||||||||
| Total revenue by line of business | $ | 824 | $ | 801 | $ | 779 | $ | 873 | $ | 849 | 3 | % | (3) | % | $ | 2,404 | $ | 2,516 | (4) | % | ||||||||||||||||||||||||||||||||||||||||||
| Financial ratios: | ||||||||||||||||||||||||||||||||||||||||||||||||||||||||||||||
| Pre-tax operating margin | 22 | % | 19 | % | 8 | % | 20 | % | 21 | % | 16 | % | 17 | % | ||||||||||||||||||||||||||||||||||||||||||||||||
Adjusted pre-tax operating margin – Non-GAAP (e) | 24 | % | 20 | % | 9 | % | 22 | % | 23 | % | 18 | % | 19 | % | ||||||||||||||||||||||||||||||||||||||||||||||||
| Selected balance sheet data: | ||||||||||||||||||||||||||||||||||||||||||||||||||||||||||||||
| Average loans | $ | 14,143 | $ | 13,991 | $ | 13,537 | $ | 13,718 | $ | 13,648 | 1 | % | 4 | % | $ | 13,892 | $ | 13,574 | 2 | % | ||||||||||||||||||||||||||||||||||||||||||
Average assets (f) | $ | 27,247 | $ | 27,114 | $ | 26,402 | $ | 26,706 | $ | 26,525 | — | % | 3 | % | $ | 26,924 | $ | 26,277 | 2 | % | ||||||||||||||||||||||||||||||||||||||||||
| Average deposits | $ | 9,201 | $ | 9,216 | $ | 9,917 | $ | 9,967 | $ | 10,032 | — | % | (8) | % | $ | 9,442 | $ | 10,798 | (13) | % | ||||||||||||||||||||||||||||||||||||||||||
| (a) Effective 1Q25, an adjustment for certain rebates, which were previously recorded as distribution and servicing expense, began to be reflected as a reduction of investment management fees. These amounts totaled approximately $20 million for all quarterly periods presented and impacted the year-over-year variances for investment management fees and related revenue subtotals, noninterest expense and Investment Management total revenue in the table above. | ||||||||||||||||||||||||||||||||||||||||||||||||||||||||||||||
(b) On a constant currency basis, investment management and performance fees decreased 2% (Non-GAAP) compared with 3Q24. See “Explanation of GAAP and Non-GAAP Financial Measures” beginning on page 18 for the reconciliation of this Non-GAAP measure. | ||||||||||||||||||||||||||||||||||||||||||||||||||||||||||||||
| (c) Other fees primarily include investment services fees. | ||||||||||||||||||||||||||||||||||||||||||||||||||||||||||||||
(d) Investment and other revenue and total fee and other revenue are net of income (loss) attributable to noncontrolling interests related to consolidated investment management funds. | ||||||||||||||||||||||||||||||||||||||||||||||||||||||||||||||
(e) Net of distribution and servicing expense. See “Explanation of GAAP and Non-GAAP Financial Measures” beginning on page 18 for the reconciliation of this Non-GAAP measure. | ||||||||||||||||||||||||||||||||||||||||||||||||||||||||||||||
(f) In business segments where average deposits are greater than average loans, average assets include an allocation of investment securities equal to the difference. | ||||||||||||||||||||||||||||||||||||||||||||||||||||||||||||||
| N/M – Not meaningful. | ||||||||||||||||||||||||||||||||||||||||||||||||||||||||||||||
13
| THE BANK OF NEW YORK MELLON CORPORATION | | |||||||||||||||||||||||||||||||||||||||||||||||||||||||||||||||||||||||||||||||
| AUM BY PRODUCT TYPE, CHANGES IN AUM AND WEALTH MANAGEMENT CLIENT ASSETS | ||||||||||||||||||||||||||||||||||||||||||||||||||||||||||||||||||||||||||||||||
| 3Q25 vs. | YTD25 vs. | |||||||||||||||||||||||||||||||||||||||||||||||||||||||||||||||||||||||||||||||
| (dollars in billions) | 3Q25 | 2Q25 | 1Q25 | 4Q24 | 3Q24 | 2Q25 | 3Q24 | YTD25 | YTD24 | YTD24 | ||||||||||||||||||||||||||||||||||||||||||||||||||||||||||||||||||||||
AUM by product type: (a)(b) | ||||||||||||||||||||||||||||||||||||||||||||||||||||||||||||||||||||||||||||||||
| Equity | $ | 180 | $ | 168 | $ | 156 | $ | 162 | $ | 173 | 7 | % | 4 | % | ||||||||||||||||||||||||||||||||||||||||||||||||||||||||||||||||||
| Fixed income | 257 | 248 | 234 | 221 | 235 | 4 | 9 | |||||||||||||||||||||||||||||||||||||||||||||||||||||||||||||||||||||||||
| Index | 512 | 488 | 470 | 491 | 498 | 5 | 3 | |||||||||||||||||||||||||||||||||||||||||||||||||||||||||||||||||||||||||
| Liability-driven investments | 537 | 588 | 549 | 548 | 637 | (9) | (16) | |||||||||||||||||||||||||||||||||||||||||||||||||||||||||||||||||||||||||
| Multi-asset and alternative investments | 181 | 173 | 167 | 171 | 175 | 5 | 3 | |||||||||||||||||||||||||||||||||||||||||||||||||||||||||||||||||||||||||
| Cash | 475 | 441 | 432 | 436 | 426 | 8 | 12 | |||||||||||||||||||||||||||||||||||||||||||||||||||||||||||||||||||||||||
| Total AUM | $ | 2,142 | $ | 2,106 | $ | 2,008 | $ | 2,029 | $ | 2,144 | 2 | % | — | % | ||||||||||||||||||||||||||||||||||||||||||||||||||||||||||||||||||
Changes in AUM: (a)(b) | ||||||||||||||||||||||||||||||||||||||||||||||||||||||||||||||||||||||||||||||||
| Beginning balance of AUM | $ | 2,106 | $ | 2,008 | $ | 2,029 | $ | 2,144 | $ | 2,045 | $ | 2,029 | $ | 1,974 | ||||||||||||||||||||||||||||||||||||||||||||||||||||||||||||||||||
| Net inflows (outflows): | ||||||||||||||||||||||||||||||||||||||||||||||||||||||||||||||||||||||||||||||||
| Long-term strategies: | ||||||||||||||||||||||||||||||||||||||||||||||||||||||||||||||||||||||||||||||||
| Equity | (8) | (3) | (3) | (5) | (2) | (14) | (10) | |||||||||||||||||||||||||||||||||||||||||||||||||||||||||||||||||||||||||
| Fixed income | 7 | 5 | 2 | (2) | 4 | 14 | 20 | |||||||||||||||||||||||||||||||||||||||||||||||||||||||||||||||||||||||||
| Liability-driven investments | (23) | — | 1 | (11) | (4) | (22) | 13 | |||||||||||||||||||||||||||||||||||||||||||||||||||||||||||||||||||||||||
| Multi-asset and alternative investments | (1) | (4) | (2) | (2) | (6) | (7) | (13) | |||||||||||||||||||||||||||||||||||||||||||||||||||||||||||||||||||||||||
| Total long-term active strategies (outflows) inflows | (25) | (2) | (2) | (20) | (8) | (29) | 10 | |||||||||||||||||||||||||||||||||||||||||||||||||||||||||||||||||||||||||
| Index | (8) | (22) | (11) | (7) | (16) | (41) | (35) | |||||||||||||||||||||||||||||||||||||||||||||||||||||||||||||||||||||||||
| Total long-term strategies (outflows) | (33) | (24) | (13) | (27) | (24) | (70) | (25) | |||||||||||||||||||||||||||||||||||||||||||||||||||||||||||||||||||||||||
| Short-term strategies: | ||||||||||||||||||||||||||||||||||||||||||||||||||||||||||||||||||||||||||||||||
| Cash | 34 | 7 | (5) | 12 | 24 | 36 | 33 | |||||||||||||||||||||||||||||||||||||||||||||||||||||||||||||||||||||||||
| Total net inflows (outflows) | 1 | (17) | (18) | (15) | — | (34) | 8 | |||||||||||||||||||||||||||||||||||||||||||||||||||||||||||||||||||||||||
| Net market impact | 30 | 70 | (25) | (45) | 58 | 75 | 114 | |||||||||||||||||||||||||||||||||||||||||||||||||||||||||||||||||||||||||
| Net currency impact | (10) | 45 | 22 | (55) | 41 | 57 | 30 | |||||||||||||||||||||||||||||||||||||||||||||||||||||||||||||||||||||||||
| Other | 15 | (c) | — | — | — | — | 15 | (c) | 18 | (d) | ||||||||||||||||||||||||||||||||||||||||||||||||||||||||||||||||||||||
| Ending balance of AUM | $ | 2,142 | $ | 2,106 | $ | 2,008 | $ | 2,029 | $ | 2,144 | 2 | % | — | % | $ | 2,142 | $ | 2,144 | — | % | ||||||||||||||||||||||||||||||||||||||||||||||||||||||||||||
Wealth Management client assets (a)(e) | $ | 348 | $ | 339 | $ | 327 | $ | 327 | $ | 333 | 3 | % | 5 | % | ||||||||||||||||||||||||||||||||||||||||||||||||||||||||||||||||||
(a) Sept. 30, 2025 information is preliminary. | ||||||||||||||||||||||||||||||||||||||||||||||||||||||||||||||||||||||||||||||||
(b) Represents assets managed in the Investment and Wealth Management business segment. | ||||||||||||||||||||||||||||||||||||||||||||||||||||||||||||||||||||||||||||||||
(c) Reflects a change in methodology beginning in the third quarter of 2025 to include assets under advisement. | ||||||||||||||||||||||||||||||||||||||||||||||||||||||||||||||||||||||||||||||||
(d) Reflects the realignment of similar products and services within our lines of business. Refer to Form 8-K dated March 26, 2024 for further information. | ||||||||||||||||||||||||||||||||||||||||||||||||||||||||||||||||||||||||||||||||
(e) Includes AUM and AUC/A in the Wealth Management line of business. | ||||||||||||||||||||||||||||||||||||||||||||||||||||||||||||||||||||||||||||||||
14
| THE BANK OF NEW YORK MELLON CORPORATION | | |||||||||||||||||||||||||||||||||||||||||||
| OTHER SEGMENT | ||||||||||||||||||||||||||||||||||||||||||||
| (dollars in millions) | 3Q25 | 2Q25 | 1Q25 | 4Q24 | 3Q24 | YTD25 | YTD24 | |||||||||||||||||||||||||||||||||||||
| Revenue: | ||||||||||||||||||||||||||||||||||||||||||||
| Fee revenue | $ | (27) | $ | (15) | $ | (28) | $ | (20) | $ | (1) | $ | (70) | $ | (22) | ||||||||||||||||||||||||||||||
| Investment and other revenue | 45 | 33 | 62 | 9 | 55 | 140 | 131 | |||||||||||||||||||||||||||||||||||||
| Total fee and other revenue | 18 | 18 | 34 | (11) | 54 | 70 | 109 | |||||||||||||||||||||||||||||||||||||
| Net interest income (expense) | 1 | (19) | (9) | (8) | (21) | (27) | (53) | |||||||||||||||||||||||||||||||||||||
| Total revenue | 19 | (1) | 25 | (19) | 33 | 43 | 56 | |||||||||||||||||||||||||||||||||||||
| Provision for credit losses | (1) | 2 | 4 | (4) | — | 5 | 13 | |||||||||||||||||||||||||||||||||||||
| Noninterest expense | 45 | 36 | 88 | 137 | 37 | 169 | 117 | |||||||||||||||||||||||||||||||||||||
| (Loss) before income taxes | $ | (25) | $ | (39) | $ | (67) | $ | (152) | $ | (4) | $ | (131) | $ | (74) | ||||||||||||||||||||||||||||||
| Selected balance sheet data: | ||||||||||||||||||||||||||||||||||||||||||||
| Average loans and leases | $ | 1,565 | $ | 1,685 | $ | 1,800 | $ | 1,723 | $ | 1,750 | $ | 1,684 | $ | 1,777 | ||||||||||||||||||||||||||||||
| Average assets | $ | 70,687 | $ | 69,823 | $ | 65,297 | $ | 66,442 | $ | 68,289 | $ | 68,622 | $ | 65,532 | ||||||||||||||||||||||||||||||
15
| THE BANK OF NEW YORK MELLON CORPORATION | | ||||||||||||||||||||||||||||||||||||||||||||||||||||
| SECURITIES PORTFOLIO | |||||||||||||||||||||||||||||||||||||||||||||||||||||
| (dollars in millions) | June 30, 2025 | 3Q25 change in unrealized gain (loss) | Sept. 30, 2025 | Fair value as a % of amortized cost (a) | Unrealized gain (loss) | % Floating rate (b) | Ratings (c) | ||||||||||||||||||||||||||||||||||||||||||||||
Amortized cost (a) | Fair value | AAA/ AA- | A+/ A- | BBB+/ BBB- | BB+ and lower | Not rated | |||||||||||||||||||||||||||||||||||||||||||||||
| Fair value | |||||||||||||||||||||||||||||||||||||||||||||||||||||
| Agency RMBS | $ | 44,277 | $ | 497 | $ | 47,630 | $ | 44,964 | 94 | % | $ | (2,666) | 17 | % | 100 | % | — | % | — | % | — | % | — | % | |||||||||||||||||||||||||||||
Non-U.S. government (d) | 34,047 | (48) | 34,405 | 34,314 | 100 | (91) | 22 | 94 | 5 | — | 1 | — | |||||||||||||||||||||||||||||||||||||||||
| U.S. Treasury | 29,732 | 125 | 33,050 | 32,839 | 99 | (211) | 40 | 100 | — | — | — | — | |||||||||||||||||||||||||||||||||||||||||
| Agency commercial MBS | 9,935 | 66 | 9,937 | 9,666 | 97 | (271) | 44 | 100 | — | — | — | — | |||||||||||||||||||||||||||||||||||||||||
Foreign covered bonds | 8,443 | 3 | 8,513 | 8,499 | 100 | (14) | 33 | 100 | — | — | — | — | |||||||||||||||||||||||||||||||||||||||||
| CLOs | 8,061 | 5 | 8,093 | 8,097 | 100 | 4 | 100 | 100 | — | — | — | — | |||||||||||||||||||||||||||||||||||||||||
U.S. government agencies | 4,906 | 39 | 4,289 | 4,095 | 95 | (194) | 27 | 100 | — | — | — | — | |||||||||||||||||||||||||||||||||||||||||
Non-agency commercial MBS | 2,369 | 22 | 2,305 | 2,210 | 96 | (95) | 46 | 100 | — | — | — | — | |||||||||||||||||||||||||||||||||||||||||
| Non-agency RMBS | 1,427 | 11 | 1,536 | 1,407 | 92 | (129) | 39 | 100 | — | — | — | — | |||||||||||||||||||||||||||||||||||||||||
Other asset-backed securities | 426 | 4 | 426 | 402 | 94 | (24) | 21 | 100 | — | — | — | — | |||||||||||||||||||||||||||||||||||||||||
| Other debt securities | 10 | — | 11 | 10 | 91 | (1) | — | — | — | — | — | 100 | |||||||||||||||||||||||||||||||||||||||||
| Total securities | $ | 143,633 | $ | 724 | $ | 150,195 | $ | 146,503 | (e) | 98 | % | $ | (3,692) | (f) | 31 | % | 99 | % | 1 | % | — | % | — | % | — | % | |||||||||||||||||||||||||||
| (a) Amortized cost includes the impact of hedged item basis adjustments, which was a net decrease of $801 million, and is net of allowance for credit losses. | |||||||||||||||||||||||||||||||||||||||||||||||||||||
| (b) Includes the impact of hedges. | |||||||||||||||||||||||||||||||||||||||||||||||||||||
(c) Represents ratings by S&P, or the equivalent. | |||||||||||||||||||||||||||||||||||||||||||||||||||||
| (d) Includes supranational securities. | |||||||||||||||||||||||||||||||||||||||||||||||||||||
(e) The fair value of available-for-sale securities totaled $99,989 million at Sept. 30, 2025, or 68% of the securities portfolio. The fair value of the held-to-maturity securities totaled $46,514 million at Sept. 30, 2025, or 32% of the securities portfolio. | |||||||||||||||||||||||||||||||||||||||||||||||||||||
| (f) At Sept. 30, 2025, includes pre-tax net unrealized losses of $667 million related to available-for-sale securities, net of hedges, and $3,025 million related to held-to-maturity securities. The after-tax unrealized losses, net of hedges, related to available-for-sale securities was $506 million and the after-tax equivalent related to held-to-maturity securities was $2,307 million. | |||||||||||||||||||||||||||||||||||||||||||||||||||||
| Note: At Sept. 30, 2025, the accretable discount relating to securities was $1,614 million. Including the discontinued hedges, net accretion was $106 million in 3Q25. | |||||||||||||||||||||||||||||||||||||||||||||||||||||
16
| THE BANK OF NEW YORK MELLON CORPORATION | | |||||||||||||||||||||||||||||||
| ALLOWANCE FOR CREDIT LOSSES AND NONPERFORMING ASSETS | ||||||||||||||||||||||||||||||||
| 2025 | 2024 | |||||||||||||||||||||||||||||||
| (dollars in millions) | Sept. 30 | June 30 | March 31 | Dec. 31 | Sept. 30 | |||||||||||||||||||||||||||
| Allowance for credit losses – beginning of period: | ||||||||||||||||||||||||||||||||
| Allowance for loan losses | $ | 275 | $ | 295 | $ | 294 | $ | 296 | $ | 286 | ||||||||||||||||||||||
| Allowance for lending-related commitments | 70 | 75 | 72 | 75 | 73 | |||||||||||||||||||||||||||
Allowance for other financial instruments (a) | 34 | 31 | 26 | 30 | 37 | |||||||||||||||||||||||||||
| Allowance for credit losses – beginning of period | $ | 379 | $ | 401 | $ | 392 | $ | 401 | $ | 396 | ||||||||||||||||||||||
| Net (charge-offs) recoveries: | ||||||||||||||||||||||||||||||||
| Charge-offs | (5) | (10) | (10) | (30) | (18) | |||||||||||||||||||||||||||
| Recoveries | 1 | 5 | 1 | 1 | — | |||||||||||||||||||||||||||
| Total net (charge-offs) | (4) | (5) | (9) | (29) | (18) | |||||||||||||||||||||||||||
Provision for credit losses (b) | (7) | (17) | 18 | 20 | 23 | |||||||||||||||||||||||||||
| Allowance for credit losses – end of period | $ | 368 | $ | 379 | $ | 401 | $ | 392 | $ | 401 | ||||||||||||||||||||||
| Allowance for credit losses – end of period: | ||||||||||||||||||||||||||||||||
| Allowance for loan losses | $ | 272 | $ | 275 | $ | 295 | $ | 294 | $ | 296 | ||||||||||||||||||||||
| Allowance for lending-related commitments | 63 | 70 | 75 | 72 | 75 | |||||||||||||||||||||||||||
Allowance for other financial instruments (a) | 33 | 34 | 31 | 26 | 30 | |||||||||||||||||||||||||||
| Allowance for credit losses – end of period | $ | 368 | $ | 379 | $ | 401 | $ | 392 | $ | 401 | ||||||||||||||||||||||
| Allowance for loan losses as a percentage of total loans | 0.36 | % | 0.38 | % | 0.41 | % | 0.41 | % | 0.43 | % | ||||||||||||||||||||||
| Nonperforming assets | $ | 160 | $ | 161 | $ | 213 | $ | 179 | $ | 211 | ||||||||||||||||||||||
(a) Includes allowance for credit losses on federal funds sold and securities purchased under resale agreements, available-for-sale securities, held-to-maturity securities, accounts receivable, cash and due from banks and interest-bearing deposits with banks. | ||||||||||||||||||||||||||||||||
(b) Includes all instruments within the scope of ASU 2016-13, Financial Instruments – Credit Losses: Measurement of Credit Losses on Financial Instruments. | ||||||||||||||||||||||||||||||||
17
| THE BANK OF NEW YORK MELLON CORPORATION | | |||||||||||||||||||||||||||||||||||||||||||
| EXPLANATION OF GAAP AND NON-GAAP FINANCIAL MEASURES | ||||||||||||||||||||||||||||||||||||||||||||
| BNY has included in this Financial Supplement certain Non-GAAP financial measures on a tangible basis as a supplement to GAAP information, which exclude goodwill and intangible assets, net of deferred tax liabilities. We believe that the return on tangible common equity – Non-GAAP is additional useful information for investors because it presents a measure of those assets that can generate income, and the tangible book value per common share – Non-GAAP is additional useful information because it presents the level of tangible assets in relation to shares of common stock outstanding. | ||||||||||||||||||||||||||||||||||||||||||||
| Net interest income, on a fully taxable equivalent (“FTE”) basis – Non-GAAP and net interest margin (FTE) – Non-GAAP and other FTE measures include the tax equivalent adjustments on tax-exempt income which allows for the comparison of amounts arising from both taxable and tax-exempt sources and is consistent with industry practice. The adjustment to an FTE basis has no impact on net income. | ||||||||||||||||||||||||||||||||||||||||||||
| BNY has also included the adjusted pre-tax operating margin – Non-GAAP, which is the pre-tax operating margin for the Investment and Wealth Management business segment, net of distribution and servicing expense that was passed to third parties who distribute or service our managed funds. We believe that this measure is useful when evaluating the performance of the Investment and Wealth Management business segment relative to industry competitors. | ||||||||||||||||||||||||||||||||||||||||||||
| The presentation of the growth rates of investment management and performance fees on a constant currency basis permits investors to assess the significance of changes in foreign currency exchange rates. Growth rates on a constant currency basis were determined by applying the current period foreign currency exchange rates to the prior period revenue. We believe that this presentation, as a supplement to GAAP information, gives investors a clearer picture of the related revenue results without the variability caused by fluctuations in foreign currency exchange rates. | ||||||||||||||||||||||||||||||||||||||||||||
| Notes: | ||||||||||||||||||||||||||||||||||||||||||||
| Returns on common and tangible common equity ratios are annualized. | ||||||||||||||||||||||||||||||||||||||||||||
| Return on common equity and tangible common equity reconciliation | ||||||||||||||||||||||||||||||||||||||||||||
| (dollars in millions) | 3Q25 | 2Q25 | 1Q25 | 4Q24 | 3Q24 | YTD25 | YTD24 | |||||||||||||||||||||||||||||||||||||
| Net income applicable to common shareholders of The Bank of New York Mellon Corporation – GAAP | $ | 1,339 | $ | 1,391 | $ | 1,149 | $ | 1,130 | $ | 1,110 | $ | 3,879 | $ | 3,206 | ||||||||||||||||||||||||||||||
| Add: Amortization of intangible assets | 12 | 11 | 11 | 13 | 12 | 34 | 37 | |||||||||||||||||||||||||||||||||||||
| Less: Tax impact of amortization of intangible assets | 3 | 2 | 3 | 3 | 3 | 8 | 9 | |||||||||||||||||||||||||||||||||||||
| Adjusted net income applicable to common shareholders of The Bank of New York Mellon Corporation, excluding amortization of intangible assets – Non-GAAP | $ | 1,348 | $ | 1,400 | $ | 1,157 | $ | 1,140 | $ | 1,119 | $ | 3,905 | $ | 3,234 | ||||||||||||||||||||||||||||||
| Average common shareholders’ equity | $ | 38,626 | $ | 37,892 | $ | 36,980 | $ | 36,923 | $ | 36,772 | $ | 37,839 | $ | 36,242 | ||||||||||||||||||||||||||||||
| Less: Average goodwill | 16,787 | 16,748 | 16,615 | 16,515 | 16,281 | 16,718 | 16,250 | |||||||||||||||||||||||||||||||||||||
| Average intangible assets | 2,842 | 2,850 | 2,849 | 2,846 | 2,827 | 2,847 | 2,836 | |||||||||||||||||||||||||||||||||||||
| Add: Deferred tax liability – tax deductible goodwill | 1,236 | 1,236 | 1,226 | 1,221 | 1,220 | 1,236 | 1,220 | |||||||||||||||||||||||||||||||||||||
| Deferred tax liability – intangible assets | 665 | 668 | 666 | 665 | 656 | 665 | 656 | |||||||||||||||||||||||||||||||||||||
| Average tangible common shareholders’ equity – Non-GAAP | $ | 20,898 | $ | 20,198 | $ | 19,408 | $ | 19,448 | $ | 19,540 | $ | 20,175 | $ | 19,032 | ||||||||||||||||||||||||||||||
| Return on common equity – GAAP | 13.7 | % | 14.7 | % | 12.6 | % | 12.2 | % | 12.0 | % | 13.7 | % | 11.8 | % | ||||||||||||||||||||||||||||||
| Return on tangible common equity – Non-GAAP | 25.6 | % | 27.8 | % | 24.2 | % | 23.3 | % | 22.8 | % | 25.9 | % | 22.7 | % | ||||||||||||||||||||||||||||||
18
| THE BANK OF NEW YORK MELLON CORPORATION | | |||||||||||||||||||||||||||||||
| EXPLANATION OF GAAP AND NON-GAAP FINANCIAL MEASURES | ||||||||||||||||||||||||||||||||
| Book value and tangible book value per common share reconciliation | 2025 | 2024 | ||||||||||||||||||||||||||||||
| (dollars in millions, except common shares and unless otherwise noted) | Sept. 30 | June 30 | March 31 | Dec. 31 | Sept. 30 | |||||||||||||||||||||||||||
| The Bank of New York Mellon Corporation shareholders’ equity at period end – GAAP | $ | 43,879 | $ | 43,950 | $ | 43,119 | $ | 41,318 | $ | 41,992 | ||||||||||||||||||||||
| Less: Preferred stock | 4,836 | 5,331 | 5,331 | 4,343 | 4,343 | |||||||||||||||||||||||||||
| The Bank of New York Mellon Corporation common shareholders’ equity at period end – GAAP | 39,043 | 38,619 | 37,788 | 36,975 | 37,649 | |||||||||||||||||||||||||||
| Less: Goodwill | 16,773 | 16,823 | 16,661 | 16,598 | 16,338 | |||||||||||||||||||||||||||
| Intangible assets | 2,834 | 2,849 | 2,846 | 2,851 | 2,824 | |||||||||||||||||||||||||||
| Add: Deferred tax liability – tax deductible goodwill | 1,236 | 1,236 | 1,226 | 1,221 | 1,220 | |||||||||||||||||||||||||||
| Deferred tax liability – intangible assets | 665 | 668 | 666 | 665 | 656 | |||||||||||||||||||||||||||
| The Bank of New York Mellon Corporation tangible common shareholders’ equity at period end – Non-GAAP | $ | 21,337 | $ | 20,851 | $ | 20,173 | $ | 19,412 | $ | 20,363 | ||||||||||||||||||||||
Period-end common shares outstanding (in thousands) | 697,349 | 705,241 | 715,434 | 717,680 | 727,078 | |||||||||||||||||||||||||||
| Book value per common share – GAAP | $ | 55.99 | $ | 54.76 | $ | 52.82 | $ | 51.52 | $ | 51.78 | ||||||||||||||||||||||
| Tangible book value per common share – Non-GAAP | $ | 30.60 | $ | 29.57 | $ | 28.20 | $ | 27.05 | $ | 28.01 | ||||||||||||||||||||||
| Net interest margin reconciliation | ||||||||||||||||||||||||||||||||
| (dollars in millions) | 3Q25 | 2Q25 | 1Q25 | 4Q24 | 3Q24 | |||||||||||||||||||||||||||
| Net interest income – GAAP | $ | 1,236 | $ | 1,203 | $ | 1,159 | $ | 1,194 | $ | 1,048 | ||||||||||||||||||||||
| Add: Tax equivalent adjustment | — | 1 | — | 1 | — | |||||||||||||||||||||||||||
| Net interest income (FTE) – Non-GAAP | $ | 1,236 | $ | 1,204 | $ | 1,159 | $ | 1,195 | $ | 1,048 | ||||||||||||||||||||||
| Average interest-earning assets | $ | 374,493 | $ | 375,542 | $ | 354,687 | $ | 357,768 | $ | 356,934 | ||||||||||||||||||||||
Net interest margin – GAAP (a) | 1.31 | % | 1.27 | % | 1.30 | % | 1.32 | % | 1.16 | % | ||||||||||||||||||||||
Net interest margin (FTE) – Non-GAAP (a) | 1.31 | % | 1.27 | % | 1.30 | % | 1.32 | % | 1.16 | % | ||||||||||||||||||||||
| (a) Net interest margin is annualized. | ||||||||||||||||||||||||||||||||
19
| THE BANK OF NEW YORK MELLON CORPORATION | | |||||||||||||||||||||||||||||||||||||||||||
| EXPLANATION OF GAAP AND NON-GAAP FINANCIAL MEASURES | ||||||||||||||||||||||||||||||||||||||||||||
| Pre-tax operating margin reconciliation - Investment and Wealth Management business segment | ||||||||||||||||||||||||||||||||||||||||||||
| (dollars in millions) | 3Q25 | 2Q25 | 1Q25 | 4Q24 | 3Q24 | YTD25 | YTD24 | |||||||||||||||||||||||||||||||||||||
| Income before income taxes – GAAP | $ | 184 | $ | 148 | $ | 63 | $ | 173 | $ | 176 | $ | 395 | $ | 432 | ||||||||||||||||||||||||||||||
| Total revenue – GAAP | $ | 824 | $ | 801 | $ | 779 | $ | 873 | $ | 849 | $ | 2,404 | $ | 2,516 | ||||||||||||||||||||||||||||||
| Less: Distribution and servicing expense | 68 | 64 | 65 | 88 | 91 | 197 | 275 | |||||||||||||||||||||||||||||||||||||
| Adjusted total revenue, net of distribution and servicing expense – Non-GAAP | $ | 756 | $ | 737 | $ | 714 | $ | 785 | $ | 758 | $ | 2,207 | $ | 2,241 | ||||||||||||||||||||||||||||||
Pre-tax operating margin – GAAP (a) | 22 | % | 19 | % | 8 | % | 20 | % | 21 | % | 16 | % | 17 | % | ||||||||||||||||||||||||||||||
Adjusted pre-tax operating margin, net of distribution and servicing expense – Non-GAAP (a) | 24 | % | 20 | % | 9 | % | 22 | % | 23 | % | 18 | % | 19 | % | ||||||||||||||||||||||||||||||
| (a) Income before income taxes divided by total revenue. | ||||||||||||||||||||||||||||||||||||||||||||
| Constant currency reconciliations | 3Q25 vs. | |||||||||||||||||||||||||||||||||||||||||||
| (dollars in millions) | 3Q25 | 3Q24 | 3Q24 | |||||||||||||||||||||||||||||||||||||||||
| Consolidated: | ||||||||||||||||||||||||||||||||||||||||||||
| Investment management and performance fees – GAAP | $ | 782 | $ | 794 | (2) | % | ||||||||||||||||||||||||||||||||||||||
| Impact of changes in foreign currency exchange rates | — | 7 | ||||||||||||||||||||||||||||||||||||||||||
| Adjusted investment management and performance fees – Non-GAAP | $ | 782 | $ | 801 | (2) | % | ||||||||||||||||||||||||||||||||||||||
| Investment and Wealth Management business segment: | ||||||||||||||||||||||||||||||||||||||||||||
| Investment management and performance fees – GAAP | $ | 782 | $ | 795 | (2) | % | ||||||||||||||||||||||||||||||||||||||
| Impact of changes in foreign currency exchange rates | — | 7 | ||||||||||||||||||||||||||||||||||||||||||
| Adjusted investment management and performance fees – Non-GAAP | $ | 782 | $ | 802 | (2) | % | ||||||||||||||||||||||||||||||||||||||
20
3Q25 QUARTERLY UPDATE October 16, 2025
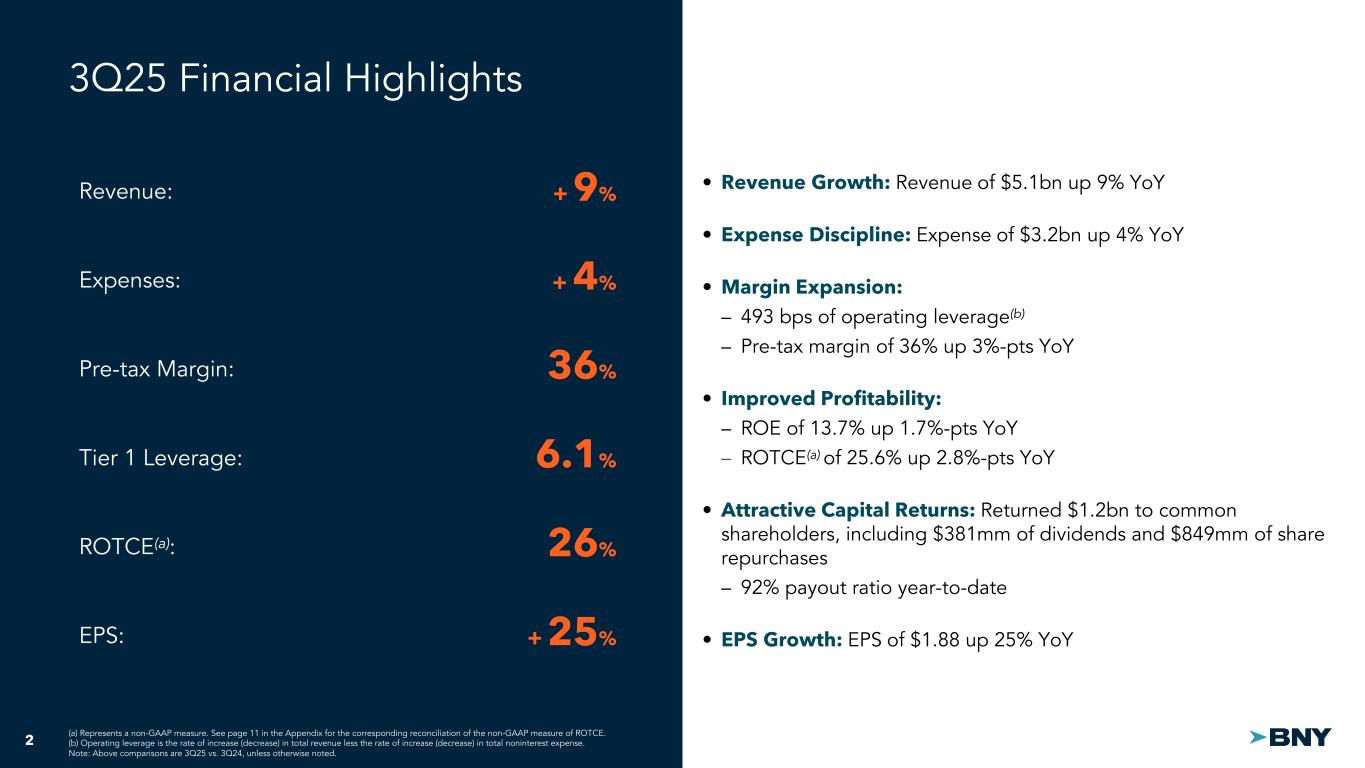
2 • Revenue Growth: Revenue of $5.1bn up 9% YoY • Expense Discipline: Expense of $3.2bn up 4% YoY • Margin Expansion: – 493 bps of operating leverage(b) – Pre-tax margin of 36% up 3%-pts YoY • Improved Profitability: – ROE of 13.7% up 1.7%-pts YoY – ROTCE(a) of 25.6% up 2.8%-pts YoY • Attractive Capital Returns: Returned $1.2bn to common shareholders, including $381mm of dividends and $849mm of share repurchases – 92% payout ratio year-to-date • EPS Growth: EPS of $1.88 up 25% YoY 3Q25 Financial Highlights + 25% Revenue: Pre-tax Margin: EPS: + 9% 36% ROTCE(a): 26% Tier 1 Leverage: 6.1% Expenses: + 4% (a) Represents a non-GAAP measure. See page 11 in the Appendix for the corresponding reconciliation of the non-GAAP measure of ROTCE. (b) Operating leverage is the rate of increase (decrease) in total revenue less the rate of increase (decrease) in total noninterest expense. Note: Above comparisons are 3Q25 vs. 3Q24, unless otherwise noted.
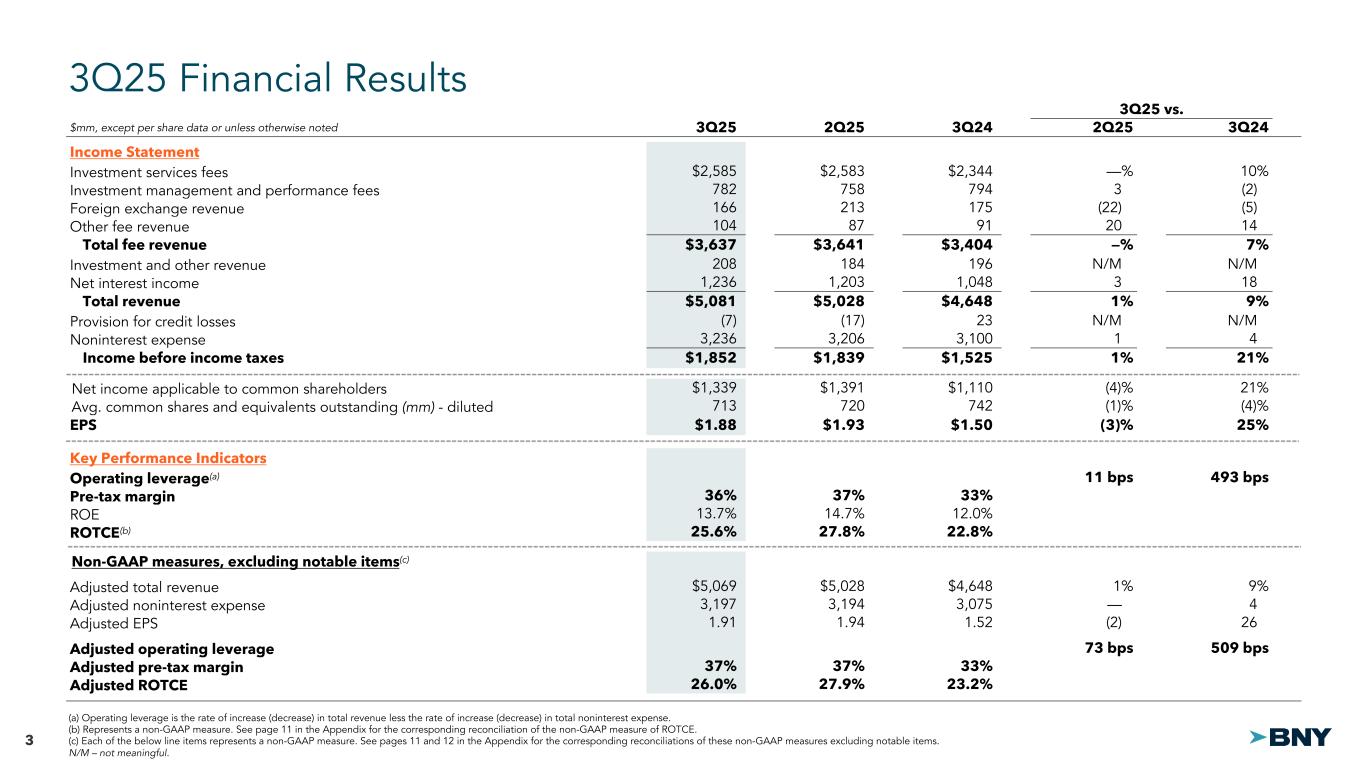
3 3Q25 vs. $mm, except per share data or unless otherwise noted 3Q25 2Q25 3Q24 2Q25 3Q24 Income Statement Investment services fees $2,585 $2,583 $2,344 —% 10% Investment management and performance fees 782 758 794 3 (2) Foreign exchange revenue 166 213 175 (22) (5) Other fee revenue 104 87 91 20 14 Total fee revenue $3,637 $3,641 $3,404 —% 7% Investment and other revenue 208 184 196 N/M N/M Net interest income 1,236 1,203 1,048 3 18 Total revenue $5,081 $5,028 $4,648 1% 9% Provision for credit losses (7) (17) 23 N/M N/M Noninterest expense 3,236 3,206 3,100 1 4 Income before income taxes $1,852 $1,839 $1,525 1% 21% Net income applicable to common shareholders $1,339 $1,391 $1,110 (4)% 21% Avg. common shares and equivalents outstanding (mm) - diluted 713 720 742 (1)% (4)% EPS $1.88 $1.93 $1.50 (3)% 25% Key Performance Indicators Operating leverage(a) 11 bps 493 bps Pre-tax margin 36% 37% 33% ROE 13.7% 14.7% 12.0% ROTCE(b) 25.6% 27.8% 22.8% Non-GAAP measures, excluding notable items(c) Adjusted total revenue $5,069 $5,028 $4,648 1% 9% Adjusted noninterest expense 3,197 3,194 3,075 — 4 Adjusted EPS 1.91 1.94 1.52 (2) 26 Adjusted operating leverage 73 bps 509 bps Adjusted pre-tax margin 37% 37% 33% Adjusted ROTCE 26.0% 27.9% 23.2% 3Q25 Financial Results (a) Operating leverage is the rate of increase (decrease) in total revenue less the rate of increase (decrease) in total noninterest expense. (b) Represents a non-GAAP measure. See page 11 in the Appendix for the corresponding reconciliation of the non-GAAP measure of ROTCE. (c) Each of the below line items represents a non-GAAP measure. See pages 11 and 12 in the Appendix for the corresponding reconciliations of these non-GAAP measures excluding notable items. N/M – not meaningful.
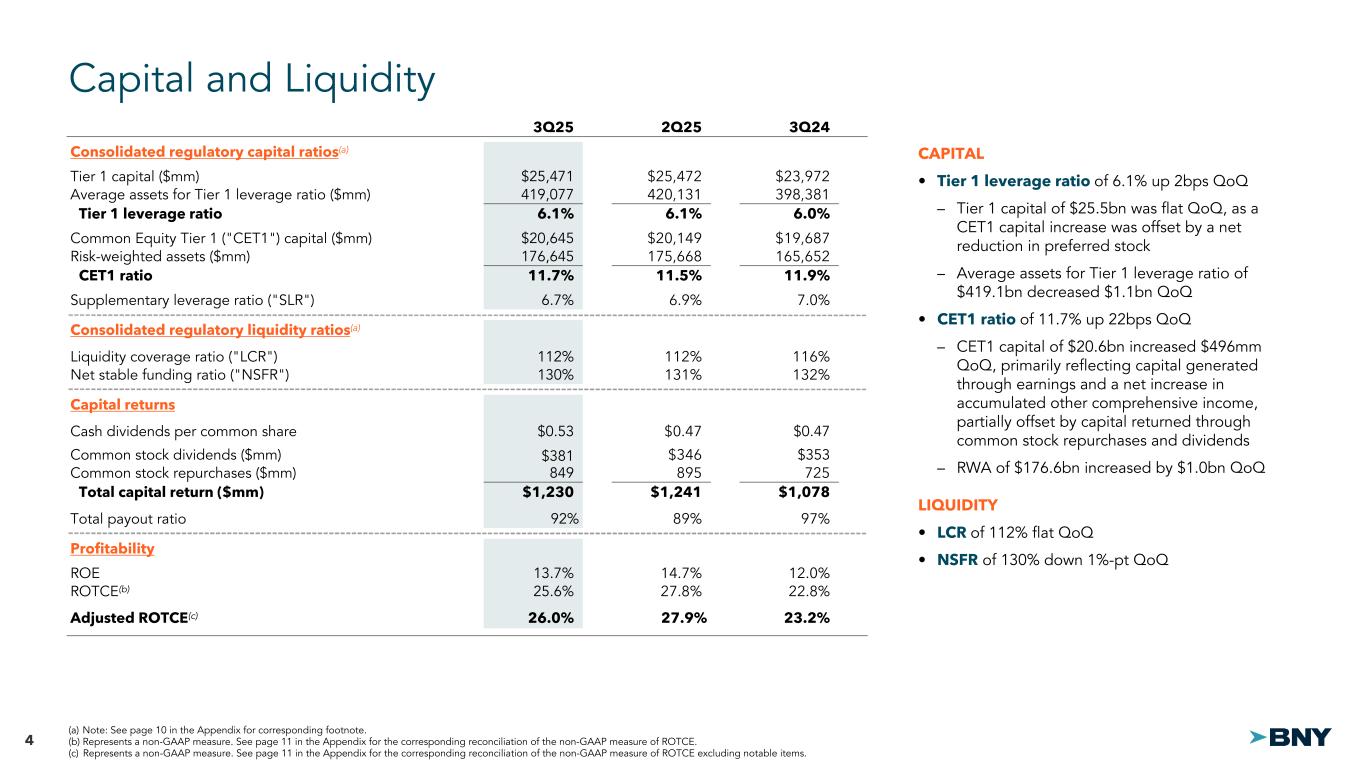
4 3Q25 2Q25 3Q24 Consolidated regulatory capital ratios(a) Tier 1 capital ($mm) $25,471 $25,472 $23,972 Average assets for Tier 1 leverage ratio ($mm) 419,077 420,131 398,381 Tier 1 leverage ratio 6.1% 6.1% 6.0% Common Equity Tier 1 ("CET1") capital ($mm) $20,645 $20,149 $19,687 Risk-weighted assets ($mm) 176,645 175,668 165,652 CET1 ratio 11.7% 11.5% 11.9% Supplementary leverage ratio ("SLR") 6.7% 6.9% 7.0% Consolidated regulatory liquidity ratios(a) Liquidity coverage ratio ("LCR") 112% 112% 116% Net stable funding ratio ("NSFR") 130% 131% 132% Capital returns Cash dividends per common share $0.53 $0.47 $0.47 Common stock dividends ($mm) $381 $346 $353 Common stock repurchases ($mm) 849 895 725 Total capital return ($mm) $1,230 $1,241 $1,078 Total payout ratio 92% 89% 97% Profitability ROE 13.7% 14.7% 12.0% ROTCE(b) 25.6% 27.8% 22.8% Adjusted ROTCE(c) 26.0% 27.9% 23.2% Capital and Liquidity CAPITAL • Tier 1 leverage ratio of 6.1% up 2bps QoQ – Tier 1 capital of $25.5bn was flat QoQ, as a CET1 capital increase was offset by a net reduction in preferred stock – Average assets for Tier 1 leverage ratio of $419.1bn decreased $1.1bn QoQ • CET1 ratio of 11.7% up 22bps QoQ – CET1 capital of $20.6bn increased $496mm QoQ, primarily reflecting capital generated through earnings and a net increase in accumulated other comprehensive income, partially offset by capital returned through common stock repurchases and dividends – RWA of $176.6bn increased by $1.0bn QoQ LIQUIDITY • LCR of 112% flat QoQ • NSFR of 130% down 1%-pt QoQ (a) Note: See page 10 in the Appendix for corresponding footnote. (b) Represents a non-GAAP measure. See page 11 in the Appendix for the corresponding reconciliation of the non-GAAP measure of ROTCE. (c) Represents a non-GAAP measure. See page 11 in the Appendix for the corresponding reconciliation of the non-GAAP measure of ROTCE excluding notable items.
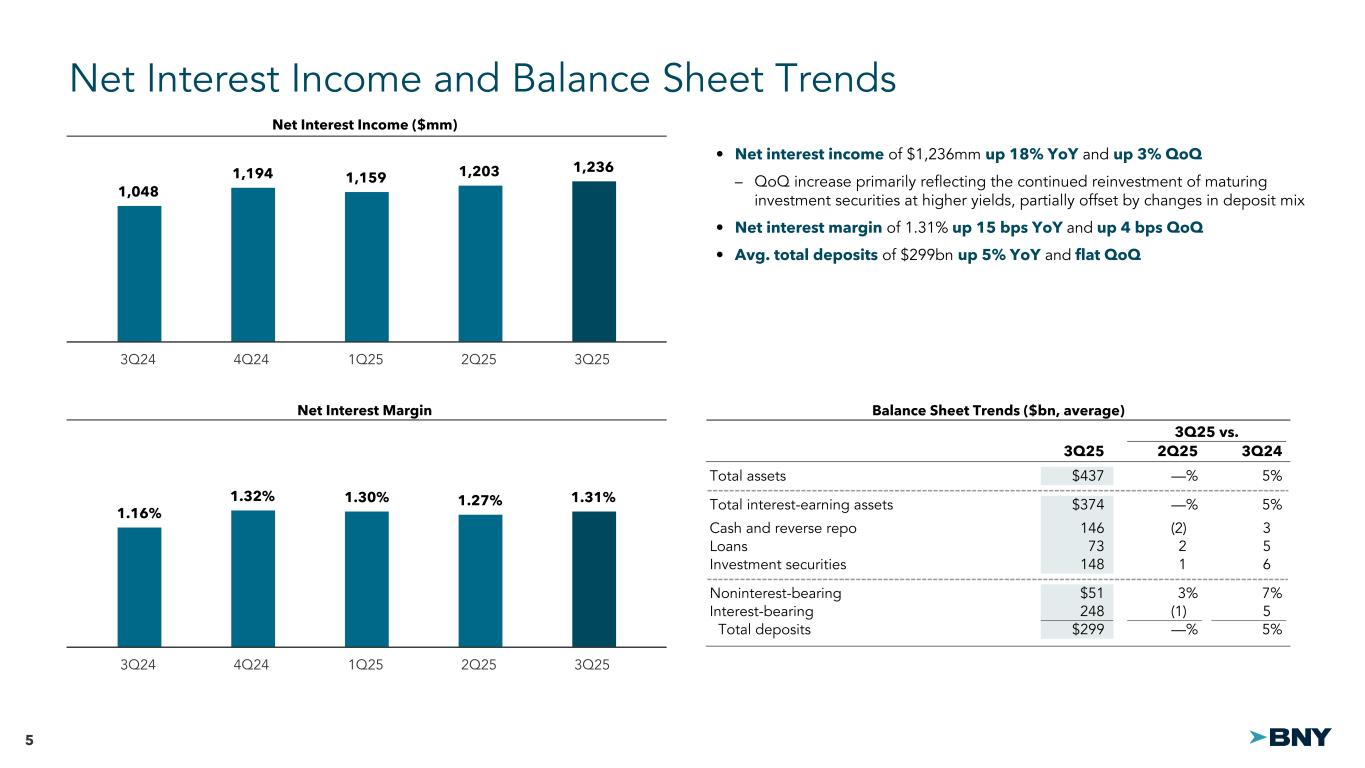
5 1,048 1,194 1,159 1,203 1,236 3Q24 4Q24 1Q25 2Q25 3Q25 3Q25 vs. 3Q25 2Q25 3Q24 Total assets $437 —% 5% Total interest-earning assets $374 —% 5% Cash and reverse repo 146 (2) 3 Loans 73 2 5 Investment securities 148 1 6 Noninterest-bearing $51 3% 7% Interest-bearing 248 (1) 5 Total deposits $299 —% 5% Net Interest Income and Balance Sheet Trends Net Interest Income ($mm) 1.16% 1.32% 1.30% 1.27% 1.31% 3Q24 4Q24 1Q25 2Q25 3Q25 Net Interest Margin Balance Sheet Trends ($bn, average) • Net interest income of $1,236mm up 18% YoY and up 3% QoQ – QoQ increase primarily reflecting the continued reinvestment of maturing investment securities at higher yields, partially offset by changes in deposit mix • Net interest margin of 1.31% up 15 bps YoY and up 4 bps QoQ • Avg. total deposits of $299bn up 5% YoY and flat QoQ
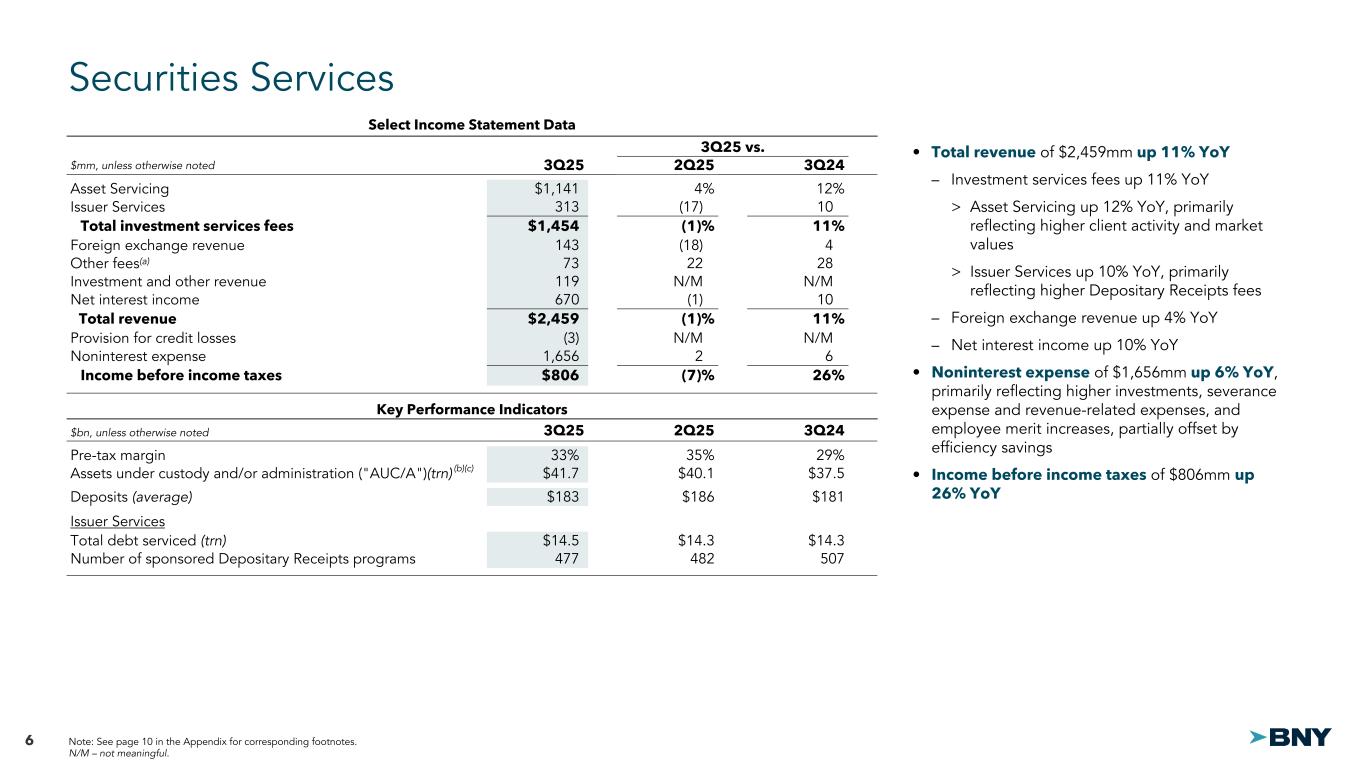
6 3Q25 vs. $mm, unless otherwise noted 3Q25 2Q25 3Q24 Asset Servicing $1,141 4% 12% Issuer Services 313 (17) 10 Total investment services fees $1,454 (1)% 11% Foreign exchange revenue 143 (18) 4 Other fees(a) 73 22 28 Investment and other revenue 119 N/M N/M Net interest income 670 (1) 10 Total revenue $2,459 (1)% 11% Provision for credit losses (3) N/M N/M Noninterest expense 1,656 2 6 Income before income taxes $806 (7)% 26% $bn, unless otherwise noted 3Q25 2Q25 3Q24 Pre-tax margin 33% 35% 29% Assets under custody and/or administration ("AUC/A")(trn) $41.7 $40.1 $37.5 Deposits (average) $183 $186 $181 Issuer Services Total debt serviced (trn) $14.5 $14.3 $14.3 Number of sponsored Depositary Receipts programs 477 482 507 Securities Services Select Income Statement Data Note: See page 10 in the Appendix for corresponding footnotes. N/M – not meaningful. Select Income Statement Data Key Performance Indicators (b)(c) • Total revenue of $2,459mm up 11% YoY – Investment services fees up 11% YoY > Asset Servicing up 12% YoY, primarily reflecting higher client activity and market values > Issuer Services up 10% YoY, primarily reflecting higher Depositary Receipts fees – Foreign exchange revenue up 4% YoY – Net interest income up 10% YoY • Noninterest expense of $1,656mm up 6% YoY, primarily reflecting higher investments, severance expense and revenue-related expenses, and employee merit increases, partially offset by efficiency savings • Income before income taxes of $806mm up 26% YoY
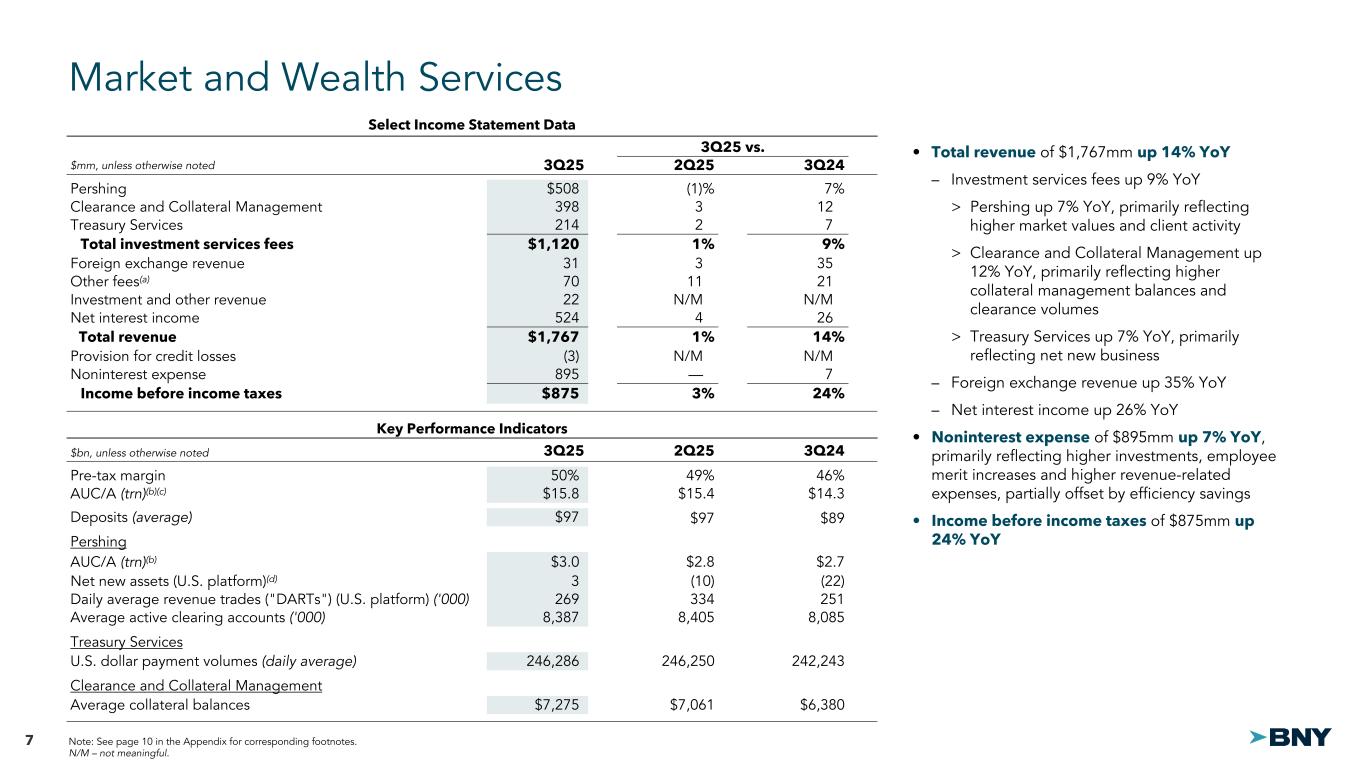
7 3Q25 vs. $mm, unless otherwise noted 3Q25 2Q25 3Q24 Pershing $508 (1)% 7% Clearance and Collateral Management 398 3 12 Treasury Services 214 2 7 Total investment services fees $1,120 1% 9% Foreign exchange revenue 31 3 35 Other fees(a) 70 11 21 Investment and other revenue 22 N/M N/M Net interest income 524 4 26 Total revenue $1,767 1% 14% Provision for credit losses (3) N/M N/M Noninterest expense 895 — 7 Income before income taxes $875 3% 24% $bn, unless otherwise noted 3Q25 2Q25 3Q24 Pre-tax margin 50% 49% 46% AUC/A (trn)(b)(c) $15.8 $15.4 $14.3 Deposits (average) $97 $97 $89 Pershing AUC/A (trn)(b) $3.0 $2.8 $2.7 Net new assets (U.S. platform)(d) 3 (10) (22) Daily average revenue trades ("DARTs") (U.S. platform) ('000) 269 334 251 Average active clearing accounts ('000) 8,387 8,405 8,085 Treasury Services U.S. dollar payment volumes (daily average) 246,286 246,250 242,243 Clearance and Collateral Management Average collateral balances $7,275 $7,061 $6,380 Market and Wealth Services Select Income Statement Data Key Performance Indicators Select Income Statement Data • Total revenue of $1,767mm up 14% YoY – Investment services fees up 9% YoY > Pershing up 7% YoY, primarily reflecting higher market values and client activity > Clearance and Collateral Management up 12% YoY, primarily reflecting higher collateral management balances and clearance volumes > Treasury Services up 7% YoY, primarily reflecting net new business – Foreign exchange revenue up 35% YoY – Net interest income up 26% YoY • Noninterest expense of $895mm up 7% YoY, primarily reflecting higher investments, employee merit increases and higher revenue-related expenses, partially offset by efficiency savings • Income before income taxes of $875mm up 24% YoY Note: See page 10 in the Appendix for corresponding footnotes. N/M – not meaningful.
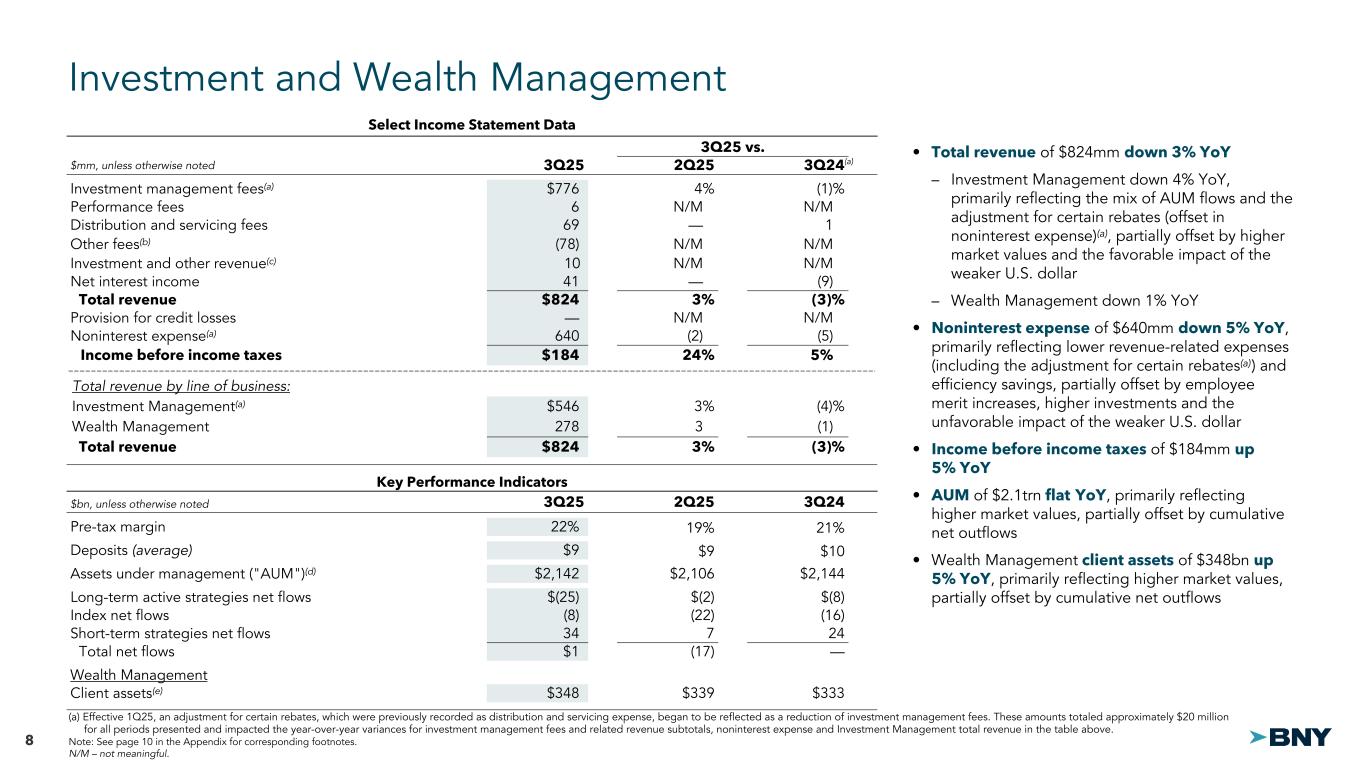
8 3Q25 vs. $mm, unless otherwise noted 3Q25 2Q25 3Q24 Investment management fees(a) $776 4% (1)% Performance fees 6 N/M N/M Distribution and servicing fees 69 — 1 Other fees(b) (78) N/M N/M Investment and other revenue(c) 10 N/M N/M Net interest income 41 — (9) Total revenue $824 3% (3)% Provision for credit losses — N/M N/M Noninterest expense(a) 640 (2) (5) Income before income taxes $184 24% 5% Total revenue by line of business: Investment Management(a) $546 3% (4)% Wealth Management 278 3 (1) Total revenue $824 3% (3)% $bn, unless otherwise noted 3Q25 2Q25 3Q24 Pre-tax margin 22% 19% 21% Deposits (average) $9 $9 $10 Assets under management ("AUM")(d) $2,142 $2,106 $2,144 Long-term active strategies net flows $(25) $(2) $(8) Index net flows (8) (22) (16) Short-term strategies net flows 34 7 24 Total net flows $1 (17) — Wealth Management Client assets(e) $348 $339 $333 Investment and Wealth Management Select Income Statement Data Key Performance Indicators Select Income Statement Data • Total revenue of $824mm down 3% YoY – Investment Management down 4% YoY, primarily reflecting the mix of AUM flows and the adjustment for certain rebates (offset in noninterest expense)(a), partially offset by higher market values and the favorable impact of the weaker U.S. dollar – Wealth Management down 1% YoY • Noninterest expense of $640mm down 5% YoY, primarily reflecting lower revenue-related expenses (including the adjustment for certain rebates(a) ) and efficiency savings, partially offset by employee merit increases, higher investments and the unfavorable impact of the weaker U.S. dollar • Income before income taxes of $184mm up 5% YoY • AUM of $2.1trn flat YoY, primarily reflecting higher market values, partially offset by cumulative net outflows • Wealth Management client assets of $348bn up 5% YoY, primarily reflecting higher market values, partially offset by cumulative net outflows (a) Effective 1Q25, an adjustment for certain rebates, which were previously recorded as distribution and servicing expense, began to be reflected as a reduction of investment management fees. These amounts totaled approximately $20 million llllllfor all periods presented and impacted the year-over-year variances for investment management fees and related revenue subtotals, noninterest expense and Investment Management total revenue in the table above. Note: See page 10 in the Appendix for corresponding footnotes. N/M – not meaningful. (a)
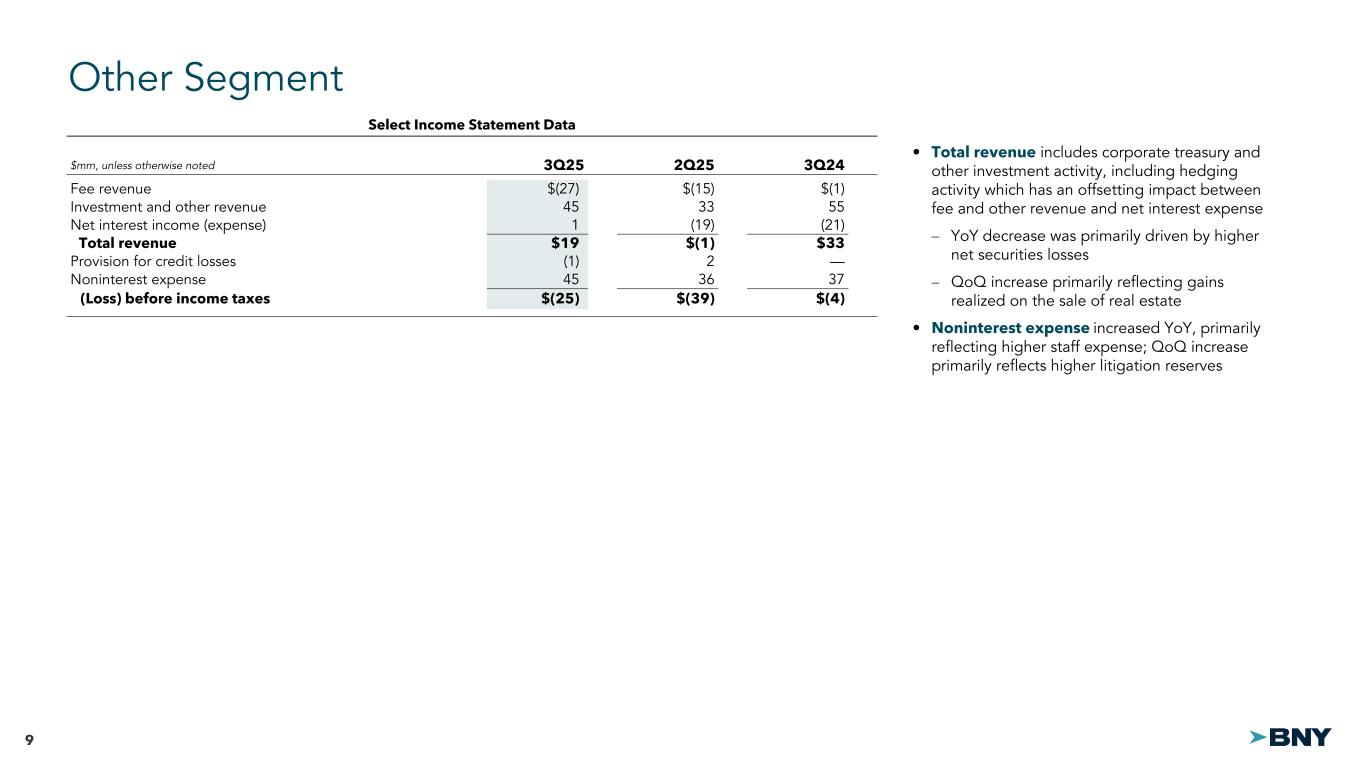
9 $mm, unless otherwise noted 3Q25 2Q25 3Q24 Fee revenue $(27) $(15) $(1) Investment and other revenue 45 33 55 Net interest income (expense) 1 (19) (21) Total revenue $19 $(1) $33 Provision for credit losses (1) 2 — Noninterest expense 45 36 37 (Loss) before income taxes $(25) $(39) $(4) Other Segment Select Income Statement Data • Total revenue includes corporate treasury and other investment activity, including hedging activity which has an offsetting impact between fee and other revenue and net interest expense – YoY decrease was primarily driven by higher net securities losses – QoQ increase primarily reflecting gains realized on the sale of real estate • Noninterest expense increased YoY, primarily reflecting higher staff expense; QoQ increase primarily reflects higher litigation reserves Select Income Statement Data
10 Footnotes Page 4 – Capital and Liquidity (a) Regulatory capital and liquidity ratios for September 30, 2025 are preliminary. For our CET1 ratio, our effective capital ratios under the U.S. capital rules are the lower of the ratios as calculated under the Standardized and Advanced Approaches, which for September 30, 2025, June 30, 2025 and September 30, 2024 was the Standardized Approach. Page 6 – Securities Services (a) Other fees primarily include financing-related fees. (b) September 30, 2025 information is preliminary. (c) Consists of AUC/A primarily from the Asset Servicing line of business and, to a lesser extent, the Issuer Services line of business. Includes the AUC/A of CIBC Mellon Trust Company (“CIBC Mellon”), a joint venture with the Canadian Imperial Bank of Commerce, of $2.1 trillion at September 30, 2025, $2.0 trillion at June 30, 2025 and $1.9 trillion at September 30, 2024. Page 7 – Market and Wealth Services (a) Other fees primarily include financing-related fees. (b) September 30, 2025 information is preliminary. (c) Consists of AUC/A from the Clearance and Collateral Management and Pershing lines of business. (d) Net new assets represent net flows of assets (e.g., net cash deposits and net securities transfers, including dividends and interest) in customer accounts in Pershing LLC, a U.S. broker-dealer. Page 8 – Investment and Wealth Management (a) (b) Other fees primarily include investment services fees. (c) Investment and other revenue is net of income (loss) attributable to noncontrolling interests related to consolidated investment management funds. (d) September 30, 2025 information is preliminary. Represents assets managed in the Investment and Wealth Management business segment. (e) September 30, 2025 information is preliminary. Includes AUM and AUC/A in the Wealth Management line of business.
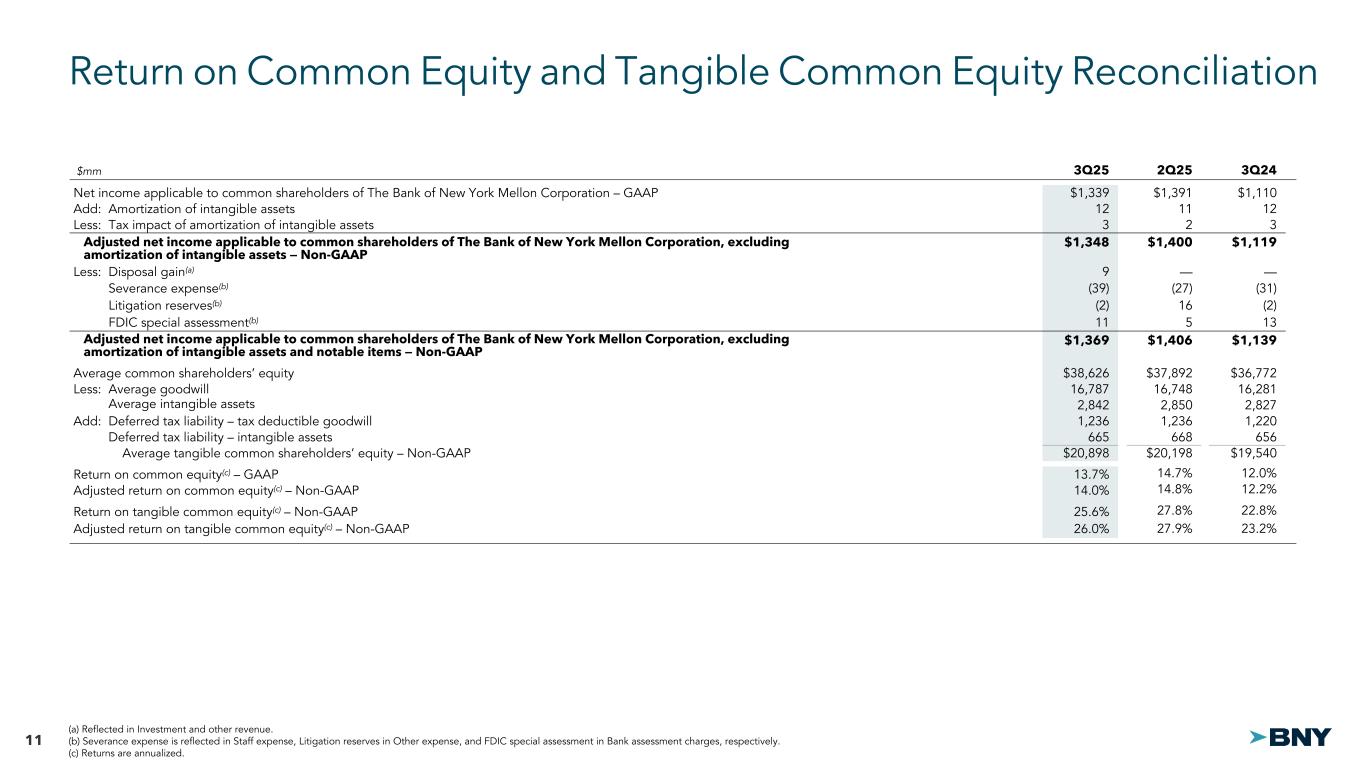
11 $mm 3Q25 2Q25 3Q24 Net income applicable to common shareholders of The Bank of New York Mellon Corporation – GAAP $1,339 $1,391 $1,110 Add: Amortization of intangible assets 12 11 12 Less: Tax impact of amortization of intangible assets 3 2 3 Adjusted net income applicable to common shareholders of The Bank of New York Mellon Corporation, excluding amortization of intangible assets — Non-GAAP $1,348 $1,400 $1,119 Less: Disposal gain(a) 9 — — Less: Severance expense(b) (39) (27) (31) Less: Litigation reserves(b) (2) 16 (2) Less: FDIC special assessment(b) 11 5 13 Adjusted net income applicable to common shareholders of The Bank of New York Mellon Corporation, excluding amortization of intangible assets and notable items — Non-GAAP $1,369 $1,406 $1,139 Average common shareholders’ equity $38,626 $37,892 $36,772 Less: Average goodwill 16,787 16,748 16,281 Less: Average intangible assets 2,842 2,850 2,827 Add: Deferred tax liability – tax deductible goodwill 1,236 1,236 1,220 Add: Deferred tax liability – intangible assets 665 668 656 Average tangible common shareholders’ equity – Non-GAAP $20,898 $20,198 $19,540 Return on common equity(c) – GAAP 13.7% 14.7% 12.0% Adjusted return on common equity(c) – Non-GAAP 14.0% 14.8% 12.2% Return on tangible common equity(c) – Non-GAAP 25.6% 27.8% 22.8% Adjusted return on tangible common equity(c) – Non-GAAP 26.0% 27.9% 23.2% Return on Common Equity and Tangible Common Equity Reconciliation (a) Reflected in Investment and other revenue. (b) Severance expense is reflected in Staff expense, Litigation reserves in Other expense, and FDIC special assessment in Bank assessment charges, respectively. (c) Returns are annualized.
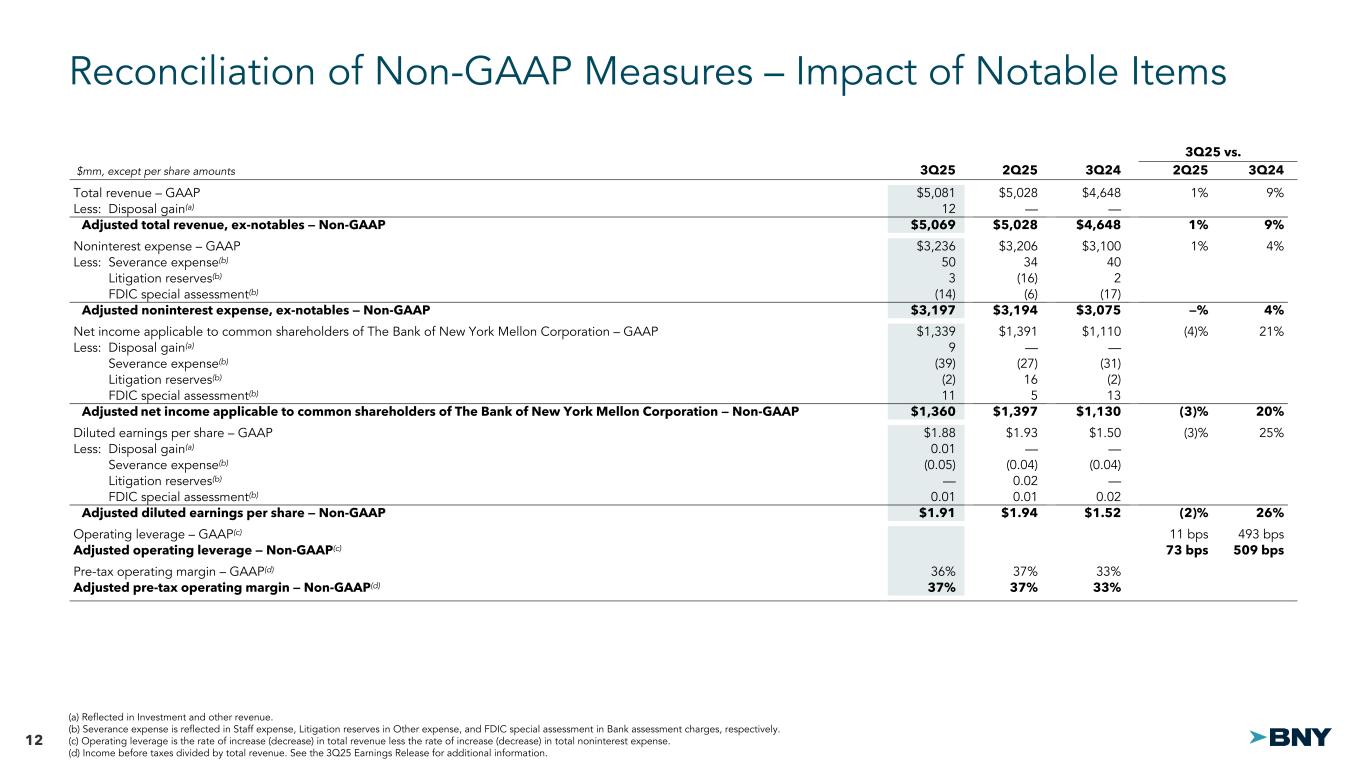
12 Select Income Statement Data Reconciliation of Non-GAAP Measures – Impact of Notable Items 3Q25 vs. $mm, except per share amounts 3Q25 2Q25 3Q24 2Q25 3Q24 Total revenue – GAAP $5,081 $5,028 $4,648 1% 9% Less: Disposal gain(a) 12 — — Adjusted total revenue, ex-notables — Non-GAAP $5,069 $5,028 $4,648 1% 9% Noninterest expense – GAAP $3,236 $3,206 $3,100 1% 4% Less: Severance expense(b) 50 34 40 Less: Litigation reserves(b) 3 (16) 2 Less: FDIC special assessment(b) (14) (6) (17) Adjusted noninterest expense, ex-notables — Non-GAAP $3,197 $3,194 $3,075 —% 4% Net income applicable to common shareholders of The Bank of New York Mellon Corporation – GAAP $1,339 $1,391 $1,110 (4)% 21% Less: Disposal gain(a) 9 — — Less: Severance expense(b) (39) (27) (31) Less: Litigation reserves(b) (2) 16 (2) Less: FDIC special assessment(b) 11 5 13 Adjusted net income applicable to common shareholders of The Bank of New York Mellon Corporation — Non-GAAP $1,360 $1,397 $1,130 (3)% 20% Diluted earnings per share – GAAP $1.88 $1.93 $1.50 (3)% 25% Less: Disposal gain(a) 0.01 — — Less: Severance expense(b) (0.05) (0.04) (0.04) Less: Litigation reserves(b) — 0.02 — Less: FDIC special assessment(b) 0.01 0.01 0.02 Adjusted diluted earnings per share — Non-GAAP $1.91 $1.94 $1.52 (2)% 26% Operating leverage – GAAP(c) 11 bps 493 bps Adjusted operating leverage — Non-GAAP(c) 73 bps 509 bps Pre-tax operating margin – GAAP(d) 36% 37% 33% Adjusted pre-tax operating margin — Non-GAAP(d) 37% 37% 33% (a) Reflected in Investment and other revenue. (b) Severance expense is reflected in Staff expense, Litigation reserves in Other expense, and FDIC special assessment in Bank assessment charges, respectively. (c) Operating leverage is the rate of increase (decrease) in total revenue less the rate of increase (decrease) in total noninterest expense. (d) Income before taxes divided by total revenue. See the 3Q25 Earnings Release for additional information.
13 A number of statements in our presentations, the accompanying slides and the responses to questions on our conference call discussing our quarterly results may constitute “forward-looking statements” within the meaning of the Private Securities Litigation Reform Act of 1995, including statements about The Bank of New York Mellon Corporation’s (the “Corporation,” “we,” “us,” or “our”) capital plans including dividends and repurchases, total payout ratio, financial performance, fee revenue, net interest income, expenses, cost discipline, efficiency savings, operating leverage, pre-tax margin, capital ratios, organic growth, pipeline, deposits, interest rates and yield curves, securities portfolio, taxes, investments, including in technology and product development, innovation in products and services, artificial intelligence, digital assets, client experience, strategic priorities and initiatives, acquisitions, related integration and divestiture activity, transition to a platforms operating model, capabilities, resiliency, risk profile, human capital management and the effects of the current and near-term market and macroeconomic outlook on us, including on our business, operations, financial performance and prospects. Preliminary business metrics and regulatory capital ratios are subject to change, possibly materially as we complete our Quarterly Report on Form 10-Q for the quarter ended September 30, 2025. Forward-looking statements may be expressed in a variety of ways, including the use of future or present tense language. Words such as “estimate,” “forecast,” “project,” “anticipate,” “likely,” “target,” “expect,” “intend,” “continue,” “seek,” “believe,” “plan,” “goal,” “could,” “should,” “would,” “may,” “might,” “will,” “strategy,” “synergies,” “opportunities,” “trends,” “momentum,” “ambition,” “aspiration,” “objective,” “aim,” “future,” “potentially,” “outlook” and words of similar meaning may signify forward-looking statements. These statements are not guarantees of future results or occurrences, are inherently uncertain and are based upon current beliefs and expectations of future events, many of which are, by their nature, difficult to predict, outside of our control and subject to change. By identifying these statements for you in this manner, we are alerting you to the possibility that our actual results may differ, possibly materially, from the anticipated results expressed or implied in these forward-looking statements as a result of a number of important factors. These factors include: escalating tariff and other trade policies and the resulting impacts on market volatility and global trade; growing fiscal deficits; changing levels of inflation and the corresponding impacts on macroeconomic conditions, client behavior and our funding costs; liquidity and interest rate volatility; potential recessions or slowing of growth in the U.S., Europe and other regions; developments in the Middle East; the economic impacts of an extended government shutdown; political uncertainty regarding operational and policy changes at U.S. government agencies; our ability to execute against our strategic initiatives; and the risk factors and other uncertainties set forth in our Annual Report on Form 10-K for the year ended Dec. 31, 2024 (the “2024 Annual Report”) and our other filings with the Securities and Exchange Commission (the “SEC”). Forward-looking statements about the timing, profitability, benefits and other prospective aspects of business and expense initiatives, our financial outlook and our medium-term financial targets, and how they can be achieved, are based on our current expectations regarding our ability to execute against our strategic initiatives, as well as our balance sheet size and composition, and may change, possibly materially, from what is currently expected. Statements about our outlook on net interest income are subject to various factors, including interest rates, continued quantitative tightening, re-investment yields and the size, mix and duration of our balance sheet, including with respect to deposits, loan balances and the securities portfolio. Statements about our outlook on fee revenue are subject to various factors, including market levels, client activity, our ability to win and onboard new business, lost business, pricing pressure and our ability to launch new products to, and expand relationships with, existing clients. Statements about our outlook on expenses are subject to various factors, including investments, revenue- related expenses, efficiency savings, merit increases, inflation and currency fluctuations. Statements about our medium-term financial targets at our business segments are similarly subject to the factors described above, but may be more significantly impacted by positive or negative events or trends that have a disproportionate impact on a particular business segment. Statements about our target Tier 1 leverage ratio and CET1 ratio are subject to various factors, including capital requirements, interest rates, capital levels, risk-weighted assets and the size of our balance sheet, including deposit levels. Statements about the timing, manner and amount of any future common stock dividends or repurchases, as well as our outlook on total payout ratio, are subject to various factors, including our capital position, capital deployment opportunities, prevailing market conditions, legal and regulatory considerations and our outlook for the economic environment. Statements about our future effective tax rate are subject to various factors including, changes in the tax rates applicable to us, changes in our earnings mix, our profitability, the assumptions we have made in forecasting our expected tax rate, the interpretation or application of existing tax statutes and regulations, as well as any corporate tax legislation that may be enacted or any guidance that may be issued by the U.S. Internal Revenue Service. You should not place undue reliance on any forward-looking statement. All forward-looking statements speak only as of the date on which they were made, and we undertake no obligation to update any forward-looking statement to reflect events or circumstances after such date or to reflect the occurrence of unanticipated events. Non-GAAP Measures. In this presentation, the accompanying slides and our responses to questions, we may discuss certain non-GAAP measures in detailing our performance, which exclude certain items or otherwise include components that differ from GAAP. We believe these measures are useful to the investment community in analyzing the financial results and trends of ongoing operations. We believe they facilitate comparisons with prior periods and reflect the principal basis on which our management monitors financial performance. Additional disclosures relating to non-GAAP measures are contained in our reports filed with the SEC, including the 2024 Annual Report, the third quarter 2025 earnings release and the third quarter 2025 financial supplement, which are available at www.bny.com/investorrelations. Forward-Looking Non-GAAP Financial Measures. From time to time we may discuss forward-looking non-GAAP financial measures, such as forward-looking estimates or targets for expenses excluding notable items and for return on tangible common equity. We are unable to provide a reconciliation of forward-looking non-GAAP financial measures to their most directly comparable GAAP financial measures because we are unable to provide, without unreasonable effort, a meaningful or accurate calculation or estimation of amounts that would be necessary for the reconciliation due to the complexity and inherent difficulty in forecasting and quantifying future amounts or when they may occur. Such unavailable information could be significant to future results. Cautionary Statement