
CMC 8-K
COMMERCIAL METALS Co (CMC)
8-K
2020-10-15
For: 2020-10-15
View Original
Added on
April 07, 2026
UNITED STATES
SECURITIES AND EXCHANGE COMMISSION
WASHINGTON, DC 20549
FORM 8-K
CURRENT REPORT PURSUANT
TO SECTION 13 OR 15(d) OF THE
SECURITIES EXCHANGE ACT OF 1934
Date of report (Date of earliest event reported): October 15, 2020
(Exact Name of Registrant as Specified in Charter)
(State or Other Jurisdiction of Incorporation) | ||||||||||||||
(Commission File Number) | (IRS Employer Identification No.) | |||||||||||||
| (Address of Principal Executive Offices) | (Zip Code) | |||||||||||||
(214 ) 689-4300
(Registrant’s Telephone Number, Including Area Code)
Not Applicable
(Former Name or Former Address, if Changed Since Last Report)
Check the appropriate box below if the Form 8-K filing is intended to simultaneously satisfy the filing obligation of the registrant under any of the following provisions (see General Instruction A.2. below):
| Written communications pursuant to Rule 425 under the Securities Act (17 CFR 230.425) | |||||
| Soliciting material pursuant to Rule 14a-12 under the Exchange Act (17 CFR 240.14a-12) | |||||
| Pre-commencement communications pursuant to Rule 14d-2(b) under the Exchange Act (17 CFR 240.14d-2(b)) | |||||
| Pre-commencement communications pursuant to Rule 13e-4(c) under the Exchange Act (17 CFR 240.13e-4(c)) | |||||
Securities registered pursuant to Section 12(b) of the Act:
| Title of Each Class | Trading Symbol(s) | Name of Each Exchange on Which Registered | ||||||||||||
| Common Stock, $0.01 par value | CMC | New York Stock Exchange | ||||||||||||
Indicate by check mark whether the registrant is an emerging growth company as defined in Rule 405 of the Securities Act of 1933 (§230.405 of this chapter) or Rule 12b-2 of the Securities Exchange Act of 1934 (§240.12b-2 of this chapter).
| Emerging growth company | |||||
If an emerging growth company, indicate by check mark if the registrant has elected not to use the extended transition period for complying with any new or revised financial accounting standards provided pursuant to Section 13(a) of the Exchange Act. ¨
Item 2.02 Results of Operations and Financial Condition.
On October 15, 2020, Commercial Metals Company (the “Company”) issued a press release regarding its financial results for the fourth quarter and fiscal year ended August 31, 2020. A copy of the press release is attached hereto as Exhibit 99.1. The press release is incorporated by reference into this Item 2.02, and the foregoing description of the press release is qualified in its entirety by reference to Exhibit 99.1.
The information in this Item 2.02 of Form 8-K, including Exhibit 99.1, shall not be deemed “filed” for purposes of Section 18 of the Securities Exchange Act of 1934, as amended (the “Exchange Act”), or otherwise subject to liabilities under that section and is not incorporated by reference into any filing of the Company under the Securities Act of 1933, as amended, or the Exchange Act, whether made before or after the date hereof, regardless of any general incorporation language in such filing.
Item 7.01 Regulation FD Disclosure.
On October 15, 2020, the Company made available on its website a financial presentation regarding its financial results for the fourth quarter and fiscal year ended August 31, 2020. A copy of the financial presentation is attached hereto as Exhibit 99.2. The financial presentation is incorporated by reference into this Item 7.01, and the foregoing description of the financial presentation is qualified in its entirety by reference to Exhibit 99.2.
The information in this Item 7.01 of Form 8-K, including Exhibit 99.2, shall not be deemed “filed” for purposes of Section 18 of the Exchange Act, or otherwise subject to liabilities under that section and is not incorporated by reference into any filing of the Company under the Securities Act of 1933, as amended, or the Exchange Act, whether made before or after the date hereof, regardless of any general incorporation language in such filing.
| Item 9.01 Financial Statements and Exhibits. | |||||
| (d) | Exhibits | ||||
| The following exhibits are being furnished as part of this Current Report on Form 8-K. | |||||
| 99.1 | |||||
| 99.2 | |||||
| 104 | Cover Page Interactive Data File (formatted as Inline XBRL and contained in Exhibit 101) | ||||
SIGNATURES
Pursuant to the requirements of the Securities Exchange Act of 1934, the registrant has duly caused this report to be signed on its behalf by the undersigned hereunto duly authorized.
COMMERCIAL METALS COMPANY | ||||||||
| Date: October 15, 2020 | By: /s/ Paul J. Lawrence | |||||||
| Name: Paul J. Lawrence | ||||||||
| Title: Vice President and Chief Financial Officer | ||||||||
Exhibit No. 99.1
News Release 
COMMERCIAL METALS COMPANY REPORTS FOURTH QUARTER
AND FULL YEAR FISCAL 2020 RESULTS
•Fourth quarter GAAP Earnings from Continuing Operations increased 5.6% sequentially, Adjusted Earnings from Continuing Operations increased 35%
•Fourth quarter Core EBITDA rose 14% sequentially. Fiscal year 2020 Core EBITDA increased 30% year-over-year
•Fourth quarter North America segment Adjusted EBITDA increased 9% sequentially, driven by higher shipments of finished product and strong cost management throughout the vertically integrated value chain
•Generated full year Cash from Operations of $791.2 million
Irving, TX - October 15, 2020 - Commercial Metals Company (NYSE: CMC) today announced financial results for its fiscal fourth quarter and year ended August 31, 2020. Earnings from continuing operations were $67.8 million, or $0.56 per diluted share, in the fourth quarter, compared to $85.9 million, or $0.72 per diluted share, in the prior year period. For the full year, earnings from continuing operations were $278.3 million, or $2.31 per diluted share, compared to $198.8 million, or $1.67 per diluted share in the prior year.
During the fourth quarter of fiscal 2020, the Company incurred $27.5 million in net after-tax charges, the largest of which related to the post-closing working capital settlement associated with its fiscal 2019 rebar asset acquisition. In addition, the Company incurred non-cash charges in connection with facility closures, as it continued to optimize its operational footprint, as well as debt extinguishment costs related to the complete pay-down of CMC's term loan facility. Excluding these and other, one-time expenses, fourth quarter adjusted earnings from continuing operations were $95.3 million, or $0.79 per diluted share, compared to adjusted earnings from continuing operations of $0.76 per diluted share in the prior year period. Details can be found in the non-GAAP reconciliation on page 12.
Barbara R. Smith, Chairman of the Board, President and Chief Executive Officer, commented, "Fiscal 2020 was an exceptional year for CMC, and our strong results – including enhanced earnings, increased cash flow, additional operational flexibility, and a more robust balance sheet – demonstrate the value of CMC’s purposeful strategic transformation completed over the last several years and our position as a leader in concrete reinforcement."
"The past year was also one of unprecedented challenges that altered the work and home life of each of our employees. I could not be prouder of the way the CMC team members responded, delivering a banner year for our Company despite the difficulties presented by the COVID-19 pandemic. Looking ahead, we continue to strategically build for the future. We expect our ongoing network optimization efforts will yield additional margin and working
(CMC Year End 2020 - 2)
capital benefits, and our third rolling line in Poland to begin commissioning toward the end of this fiscal year. In addition, we recently announced the construction of a third micro mill, which will be the world's first merchant product-capable micro mill upon its completion in fiscal 2023," Smith added.
As a result of the strong free cash flow generated during the fourth quarter, the Company reduced its debt sequentially, while also improving its cash balance to $542.1 million at August 31, 2020. Compared to the prior year-end, CMC's cash balance increased by $349.6 million, while total indebtedness was reduced by $161.0 million. Availability under the Company's credit and accounts receivable programs was $661.9 million at August 31, 2020.
On October 14, 2020, the board of directors declared a quarterly dividend of $0.12 per share of CMC common stock payable to stockholders of record on October 29, 2020. The dividend will be paid on November 13, 2020, and marks 224 consecutive quarterly dividend payments by the Company.
(CMC Year End 2020 - 3)
Business Segments - Fiscal Fourth Quarter 2020 Review
Beginning with its fiscal fourth quarter 2020 results, CMC is reporting two operating segments: North America and Europe. North America comprises the former Americas Recycling, Americas Mills, and Americas Fabrication segments. Europe comprises the former International Mill segment, with no other changes. For additional details regarding changes to the operating segment reporting, please refer to the investor relations section of CMC's website.
The North America segment generated adjusted EBITDA of $174.2 million for the fourth quarter of fiscal 2020, an increase of 14% compared to $152.5 million in the prior year period. The improvement reflects strong management of non-raw material costs at each stage of our vertically integrated value chain. Cost performance at the mills was particularly strong, with a meaningful portion of the improvement driven by the recent decision to curtail melting operations at Steel California and supply billets from lower cost plants. Lower operating costs at downstream locations also contributed to the improved performance.
Shipment volumes of finished goods, which includes steel products and downstream products, were flat compared to the prior year quarter. Demand for rebar from the mills remained strong, growing year-over-year, supported by healthy construction backlogs across our customer base. As a result of gains in market share, shipments of merchant bar were flat compared to the prior year period, as underlying consumption declined across the industry. Downstream product volumes declined modestly year-over-year due largely to the impact of weather challenges in the Gulf Coast and Texas markets.
Margins over scrap cost within the vertical chain declined from the fourth quarter of fiscal 2019, due primarily to steel products. Average selling price for steel products decreased $59 per ton year-over-year, which was only partially offset by lower scrap costs. Margin over scrap cost on downstream products expanded modestly compared to a year ago, driven by lower input costs and stronger pricing in CMC's committed backlog, which led to higher average selling prices.
The Europe segment reported adjusted EBITDA of $22.9 million for the fourth quarter of fiscal 2020, up slightly compared to adjusted EBITDA of $22.7 million for the prior year quarter. Results benefited from a $10.7 million carbon credit that was received during the quarter. While shipment volumes decreased modestly compared to the prior year quarter, they remain supported by resilience in the Polish construction sector. The Central European market for long products continues to be challenged by ongoing incursions of imported material, which led to a $39 per ton reduction in steel product margin over scrap compared to the prior year period.
Outlook
"We expect finished steel volumes for our North America and Europe operations to follow typical seasonal trends in the first fiscal quarter, with some negative impact in North America due to storms in the Texas and Gulf
(CMC Year End 2020 - 4)
Coast markets," said Ms. Smith. "Shipments of steel and downstream products in the near-term should be supported by our solid construction backlog. We anticipate margin headwinds in the first quarter within North America due to the recent rise in scrap costs mitigated, in part, by steel price increases that became effective during the quarter. The market for long products in Europe is expected to remain challenged due to elevated import levels. However, demand appears solid, driven by construction sector resilience, and rebounding Central European industrial production."
Conference Call
CMC invites you to listen to a live broadcast of its fourth quarter fiscal 2020 conference call today, Thursday, October 15, 2020, at 11:00 a.m. ET. Barbara Smith, Chairman of the Board of Directors, President, and Chief Executive Officer, and Paul Lawrence, Vice President and Chief Financial Officer, will host the call. The call is accessible via our website at www.cmc.com. In the event you are unable to listen to the live broadcast, the call will be archived and available for replay on our website on the next business day. Financial and statistical information presented in the broadcast are located on CMC's website under "Investors."
About Commercial Metals Company
Commercial Metals Company and its subsidiaries manufacture, recycle and fabricate steel and metal products, related materials and services through a network of facilities that includes seven electric arc furnace ("EAF") mini mills, two EAF micro mills, two rerolling mills, steel fabrication and processing plants, construction-related product warehouses, and metal recycling facilities in the U.S. and Poland.
Forward-Looking Statements
This news release contains forward-looking statements within the meaning of the federal securities laws with respect to general economic conditions, key macro-economic drivers that impact our business, the effects of ongoing trade actions, the effects of continued pressure on the liquidity of our customers, potential synergies and organic growth provided by our recent acquisitions and strategic investments, demand for our products, metal margins, the effect of COVID-19 and related governmental and economic responses thereto, the ability to operate our steel mills at full capacity, future supplies of raw materials and energy for our operations, share repurchases, legal proceedings, the undistributed earnings of our non-U.S. subsidiaries, U.S. non-residential construction activity, international trade, capital expenditures, our liquidity and our ability to satisfy future liquidity requirements, estimated contractual obligations and our expectations or beliefs concerning future events. These forward-looking statements can generally be identified by phrases such as we or our management "expects," "anticipates," "believes," "estimates," "intends," "plans to," "ought," "could," "will," "should," "likely," "appears," "projects," "forecasts," "outlook" or other similar words or phrases. There are inherent risks and uncertainties in any forward-looking statements. We caution readers not to place undue reliance on any forward-looking statements.
(CMC Year End 2020 - 5)
Although we believe that our expectations are reasonable, we can give no assurance that these expectations will prove to have been correct, and actual results may vary materially. Except as required by law, we undertake no obligation to update, amend or clarify any forward-looking statements to reflect changed assumptions, the occurrence of anticipated or unanticipated events, new information or circumstances or any other changes. Important factors that could cause actual results to differ materially from our expectations include those described in Part I, Item 1A, "Risk Factors" of our annual report on Form 10-K for the fiscal year ended August 31, 2020, as well as the following: changes in economic conditions which affect demand for our products or construction activity generally, and the impact of such changes on the highly cyclical steel industry; rapid and significant changes in the price of metals, potentially impairing our inventory values due to declines in commodity prices or reducing the profitability of our downstream products contracts due to rising commodity pricing; impacts from COVID-19 on the economy, demand for our products and on our operations, including the responses of governmental authorities to contain COVID-19; excess capacity in our industry, particularly in China, and product availability from competing steel mills and other steel suppliers including import quantities and pricing; compliance with and changes in environmental laws and regulations, including increased regulation associated with climate change and greenhouse gas emissions; involvement in various environmental matters that may result in fines, penalties or judgments; potential limitations in our or our customers' abilities to access credit and non-compliance by our customers with our contracts; activity in repurchasing shares of our common stock under our repurchase program; financial covenants and restrictions on the operation of our business contained in agreements governing our debt; our ability to successfully identify, consummate and integrate acquisitions, and the effects that acquisitions may have on our financial leverage; risks associated with acquisitions generally, such as the inability to obtain, or delays in obtaining, required approvals under applicable antitrust legislation and other regulatory and third party consents and approvals; lower than expected future levels of revenues and higher than expected future costs; failure or inability to implement growth strategies in a timely manner; impact of goodwill impairment charges; impact of long-lived asset impairment charges; currency fluctuations; global factors, including trade measures, political uncertainties and military conflicts; availability and pricing of electricity, electrodes and natural gas for mill operations; ability to hire and retain key executives and other employees; competition from other materials or from competitors that have a lower cost structure or access to greater financial resources; information technology interruptions and breaches in security; ability to make necessary capital expenditures; availability and pricing of raw materials and other items over which we exert little influence, including scrap metal, energy and insurance; unexpected equipment failures; losses or limited potential gains due to hedging transactions; litigation claims and settlements, court decisions, regulatory rulings and legal compliance risks; risk of injury or death to employees, customers or other visitors to our operations; civil unrest, protests and riots; new and clarifying guidance with regard to interpretation of certain provisions of the Tax Cuts and Jobs Act that could impact our assessment; and increased costs related to health care reform legislation.
(CMC Year End 2020 - 6)
| COMMERCIAL METALS COMPANY FINANCIAL & OPERATING STATISTICS (UNAUDITED) | ||||||||||||||||||||||||||||||||||||||||||||
| Three Months Ended | Fiscal Year Ended | |||||||||||||||||||||||||||||||||||||||||||
| (in thousands, except per ton amounts) | 8/31/2020 | 5/31/2020 | 2/29/2020 | 11/30/2019 | 8/31/2019 | 8/31/2020 | 8/31/2019 | |||||||||||||||||||||||||||||||||||||
| North America | ||||||||||||||||||||||||||||||||||||||||||||
| Net sales | $ | 1,224,849 | $ | 1,167,081 | $ | 1,161,283 | $ | 1,216,720 | $ | 1,333,014 | $ | 4,769,933 | $ | 5,001,116 | ||||||||||||||||||||||||||||||
| Adjusted EBITDA | 174,219 | 159,394 | 152,831 | 174,732 | 152,450 | 661,176 | 456,296 | |||||||||||||||||||||||||||||||||||||
| External tons shipped | ||||||||||||||||||||||||||||||||||||||||||||
| Raw materials | 300 | 288 | 321 | 320 | 399 | 1,229 | 1,662 | |||||||||||||||||||||||||||||||||||||
| Rebar | 498 | 463 | 461 | 475 | 474 | 1,897 | 1,726 | |||||||||||||||||||||||||||||||||||||
| Merchant and other | 234 | 211 | 238 | 236 | 237 | 919 | 973 | |||||||||||||||||||||||||||||||||||||
| Steel products | 732 | 674 | 699 | 711 | 711 | 2,816 | 2,699 | |||||||||||||||||||||||||||||||||||||
| Downstream products | 429 | 427 | 366 | 413 | 448 | 1,635 | 1,632 | |||||||||||||||||||||||||||||||||||||
| Average selling price per ton | ||||||||||||||||||||||||||||||||||||||||||||
| Raw materials | $ | 605 | $ | 517 | $ | 595 | $ | 547 | $ | 535 | $ | 567 | $ | 563 | ||||||||||||||||||||||||||||||
| Steel products | 600 | 624 | 625 | 626 | 659 | 618 | 681 | |||||||||||||||||||||||||||||||||||||
| Downstream products | 970 | 966 | 984 | 976 | 963 | 975 | 905 | |||||||||||||||||||||||||||||||||||||
| Cost of raw materials per ton | $ | 427 | $ | 348 | $ | 435 | $ | 392 | $ | 383 | $ | 402 | $ | 406 | ||||||||||||||||||||||||||||||
| Cost of ferrous scrap utilized per ton | 237 | 239 | 256 | 226 | 246 | 238 | 284 | |||||||||||||||||||||||||||||||||||||
| Steel products metal margin per ton | $ | 363 | $ | 385 | $ | 369 | $ | 400 | $ | 413 | $ | 380 | $ | 397 | ||||||||||||||||||||||||||||||
| Europe | ||||||||||||||||||||||||||||||||||||||||||||
| Net sales | $ | 179,855 | $ | 173,817 | $ | 180,079 | $ | 165,389 | $ | 205,461 | $ | 699,140 | $ | 817,048 | ||||||||||||||||||||||||||||||
| Adjusted EBITDA | 22,927 | 14,270 | 13,451 | 11,359 | 22,666 | 62,007 | 100,102 | |||||||||||||||||||||||||||||||||||||
| External tons shipped | ||||||||||||||||||||||||||||||||||||||||||||
| Rebar | 150 | 122 | 145 | 122 | 151 | 539 | 423 | |||||||||||||||||||||||||||||||||||||
| Merchant and other | 230 | 252 | 235 | 216 | 237 | 933 | 1,037 | |||||||||||||||||||||||||||||||||||||
| Steel products | 380 | 374 | 380 | 338 | 388 | 1,472 | 1,460 | |||||||||||||||||||||||||||||||||||||
| Average selling price per ton | ||||||||||||||||||||||||||||||||||||||||||||
| Steel products | $ | 446 | $ | 437 | $ | 449 | $ | 461 | $ | 500 | $ | 448 | $ | 528 | ||||||||||||||||||||||||||||||
| Cost of ferrous scrap utilized per ton | $ | 250 | $ | 239 | $ | 251 | $ | 244 | $ | 265 | $ | 246 | $ | 288 | ||||||||||||||||||||||||||||||
| Steel products metal margin per ton | $ | 196 | $ | 198 | $ | 198 | $ | 217 | $ | 235 | $ | 202 | $ | 240 | ||||||||||||||||||||||||||||||
(CMC Year End 2020 - 7)
| COMMERCIAL METALS COMPANY BUSINESS SEGMENTS (UNAUDITED) | ||||||||||||||||||||||||||||||||||||||||||||
| (in thousands) | Three Months Ended | Fiscal Year Ended | ||||||||||||||||||||||||||||||||||||||||||
| Net sales | 8/31/2020 | 5/31/2020 | 2/29/2020 | 11/30/2019 | 8/31/2019 | 8/31/2020 | 8/31/2019 | |||||||||||||||||||||||||||||||||||||
| North America | $ | 1,224,849 | $ | 1,167,081 | $ | 1,161,283 | $ | 1,216,720 | $ | 1,333,014 | $ | 4,769,933 | $ | 5,001,116 | ||||||||||||||||||||||||||||||
| Europe | 179,855 | 173,817 | 180,079 | 165,389 | 205,461 | 699,140 | 817,048 | |||||||||||||||||||||||||||||||||||||
| Corporate and Other | 4,428 | 785 | (399) | 2,599 | 4,530 | 7,413 | 10,838 | |||||||||||||||||||||||||||||||||||||
| Total net sales | $ | 1,409,132 | $ | 1,341,683 | $ | 1,340,963 | $ | 1,384,708 | $ | 1,543,005 | $ | 5,476,486 | $ | 5,829,002 | ||||||||||||||||||||||||||||||
| Adjusted EBITDA from continuing operations | ||||||||||||||||||||||||||||||||||||||||||||
| North America | $ | 174,219 | $ | 159,394 | $ | 152,831 | $ | 174,732 | $ | 152,450 | $ | 661,176 | $ | 456,296 | ||||||||||||||||||||||||||||||
| Europe | 22,927 | 14,270 | 13,451 | 11,359 | 22,666 | 62,007 | 100,102 | |||||||||||||||||||||||||||||||||||||
| Corporate and Other | (64,846) | (26,882) | (28,561) | (26,286) | (29,871) | (146,575) | (132,313) | |||||||||||||||||||||||||||||||||||||
(CMC Year End 2020 - 8)
| COMMERCIAL METALS COMPANY CONSOLIDATED STATEMENTS OF EARNINGS (UNAUDITED) | |||||||||||||||||||||||
| Three Months Ended | Fiscal Year Ended | ||||||||||||||||||||||
| (in thousands, except share data) | 8/31/2020 | 8/31/2019 | 8/31/2020 | 8/31/2019 | |||||||||||||||||||
| Net sales | $ | 1,409,132 | $ | 1,543,005 | $ | 5,476,486 | $ | 5,829,002 | |||||||||||||||
| Costs and expenses: | |||||||||||||||||||||||
| Cost of goods sold | 1,145,725 | 1,290,346 | 4,531,688 | 5,025,514 | |||||||||||||||||||
| Selling, general and administrative expenses | 162,070 | 131,882 | 504,572 | 463,271 | |||||||||||||||||||
| Asset impairments | 1,098 | 369 | 7,611 | 384 | |||||||||||||||||||
| Interest expense | 13,962 | 17,702 | 61,837 | 71,373 | |||||||||||||||||||
| 1,322,855 | 1,440,299 | 5,105,708 | 5,560,542 | ||||||||||||||||||||
| Earnings from continuing operations before income taxes | 86,277 | 102,706 | 370,778 | 268,460 | |||||||||||||||||||
| Income taxes | 18,495 | 16,826 | 92,476 | 69,681 | |||||||||||||||||||
| Earnings from continuing operations | 67,782 | 85,880 | 278,302 | 198,779 | |||||||||||||||||||
| Earnings (loss) from discontinued operations before income taxes | (34) | 280 | 1,907 | (528) | |||||||||||||||||||
| Income taxes | 125 | 49 | 706 | 158 | |||||||||||||||||||
| Earnings (loss) from discontinued operations | (159) | 231 | 1,201 | (686) | |||||||||||||||||||
| Net earnings | $ | 67,623 | $ | 86,111 | $ | 279,503 | $ | 198,093 | |||||||||||||||
| Basic earnings (loss) per share* | |||||||||||||||||||||||
| Earnings from continuing operations | $ | 0.57 | $ | 0.73 | $ | 2.34 | $ | 1.69 | |||||||||||||||
| Earnings (loss) from discontinued operations | — | — | 0.01 | (0.01) | |||||||||||||||||||
| Net earnings | $ | 0.57 | $ | 0.73 | $ | 2.35 | $ | 1.68 | |||||||||||||||
| Diluted earnings (loss) per share* | |||||||||||||||||||||||
| Earnings from continuing operations | $ | 0.56 | $ | 0.72 | $ | 2.31 | $ | 1.67 | |||||||||||||||
| Earnings (loss) from discontinued operations | — | — | 0.01 | (0.01) | |||||||||||||||||||
| Net earnings | $ | 0.56 | $ | 0.72 | $ | 2.32 | $ | 1.66 | |||||||||||||||
| Cash dividends per share | $ | 0.12 | $ | 0.12 | $ | 0.48 | $ | 0.48 | |||||||||||||||
| Average basic shares outstanding | 119,198,785 | 118,046,800 | 118,921,854 | 117,834,558 | |||||||||||||||||||
| Average diluted shares outstanding | 120,645,931 | 119,392,062 | 120,309,621 | 119,124,628 | |||||||||||||||||||
* Earnings Per Share ("EPS") is calculated independently for each component and may not sum to net earnings EPS due to rounding.
(CMC Year End 2020 - 9)
COMMERCIAL METALS COMPANY AND SUBSIDIARIES CONSOLIDATED BALANCE SHEETS (UNAUDITED) | ||||||||||||||
| August 31, | ||||||||||||||
| (in thousands, except share data) | 2020 | 2019 | ||||||||||||
| Assets | ||||||||||||||
| Current assets: | ||||||||||||||
| Cash and cash equivalents | $ | 542,103 | $ | 192,461 | ||||||||||
Accounts receivable (less allowance for doubtful accounts of $9,597 and $8,403) | 880,728 | 1,016,088 | ||||||||||||
| Inventories | 625,393 | 692,368 | ||||||||||||
| Prepaid and other current assets | 165,879 | 179,088 | ||||||||||||
| Total current assets | 2,214,103 | 2,080,005 | ||||||||||||
| Property, plant and equipment: | ||||||||||||||
| Land | 143,567 | 142,825 | ||||||||||||
| Buildings and improvements | 786,820 | 750,381 | ||||||||||||
| Equipment | 2,364,923 | 2,234,800 | ||||||||||||
| Construction in process | 103,776 | 68,579 | ||||||||||||
| 3,399,086 | 3,196,585 | |||||||||||||
| Less accumulated depreciation and amortization | (1,828,019) | (1,695,614) | ||||||||||||
| Property, plant and equipment, net | 1,571,067 | 1,500,971 | ||||||||||||
| Goodwill | 64,321 | 64,138 | ||||||||||||
| Other noncurrent assets | 232,237 | 113,657 | ||||||||||||
| Total assets | $ | 4,081,728 | $ | 3,758,771 | ||||||||||
| Liabilities and stockholders' equity | ||||||||||||||
| Current liabilities: | ||||||||||||||
| Accounts payable | $ | 266,102 | $ | 288,005 | ||||||||||
| Accrued expenses and other payables | 454,977 | 353,786 | ||||||||||||
| Acquired unfavorable contract backlog | 6,035 | 35,360 | ||||||||||||
| Current maturities of long-term debt and short-term borrowings | 18,149 | 17,439 | ||||||||||||
| Total current liabilities | 745,263 | 694,590 | ||||||||||||
| Deferred income taxes | 130,810 | 79,290 | ||||||||||||
| Other noncurrent liabilities | 250,706 | 133,620 | ||||||||||||
| Long-term debt | 1,065,536 | 1,227,214 | ||||||||||||
| Total liabilities | 2,192,315 | 2,134,714 | ||||||||||||
| Stockholders' equity: | ||||||||||||||
Common stock, par value $0.01 per share; authorized 200,000,000 shares; issued 129,060,664 shares; outstanding 119,220,905 and 117,924,938 shares | 1,290 | 1,290 | ||||||||||||
| Additional paid-in capital | 358,912 | 358,668 | ||||||||||||
| Accumulated other comprehensive loss | (103,764) | (124,126) | ||||||||||||
| Retained earnings | 1,807,826 | 1,585,379 | ||||||||||||
Less treasury stock, 9,839,759 and 11,135,726 shares at cost | (175,063) | (197,350) | ||||||||||||
| Stockholders' equity | 1,889,201 | 1,623,861 | ||||||||||||
| Stockholders' equity attributable to noncontrolling interests | 212 | 196 | ||||||||||||
| Total equity | 1,889,413 | 1,624,057 | ||||||||||||
| Total liabilities and stockholders' equity | $ | 4,081,728 | $ | 3,758,771 | ||||||||||
(CMC Year End 2020 - 10)
| COMMERCIAL METALS COMPANY AND SUBSIDIARIES CONSOLIDATED STATEMENTS OF CASH FLOWS (UNAUDITED) | ||||||||||||||
| Year Ended August 31, | ||||||||||||||
| (in thousands) | 2020 | 2019 | ||||||||||||
| Cash flows from (used by) operating activities: | ||||||||||||||
| Net earnings | $ | 279,503 | $ | 198,093 | ||||||||||
| Adjustments to reconcile net earnings to cash flows from (used by) operating activities: | ||||||||||||||
| Depreciation and amortization | 165,758 | 158,671 | ||||||||||||
| Deferred income taxes and other long-term taxes | 49,580 | 49,523 | ||||||||||||
| Share-based compensation | 31,850 | 25,106 | ||||||||||||
| Amortization of acquired unfavorable contract backlog | (29,367) | (74,784) | ||||||||||||
| Asset impairments | 7,611 | 384 | ||||||||||||
| Net gain on sales of a subsidiary, assets and other | (4,213) | (2,281) | ||||||||||||
| Write-down of inventory and other | 2,065 | 723 | ||||||||||||
| Loss on debt extinguishment | 1,778 | — | ||||||||||||
| Provision for losses on receivables, net | 578 | 388 | ||||||||||||
| Changes in operating assets and liabilities, net of acquisitions | ||||||||||||||
| Accounts receivable | 146,375 | 27,204 | ||||||||||||
| Inventories | 78,903 | 89,664 | ||||||||||||
| Accounts payable, accrued expenses and other payables | 45,718 | (15,315) | ||||||||||||
| Other operating assets and liabilities | 15,065 | (52,851) | ||||||||||||
| Beneficial interest in securitized accounts receivable | — | (367,521) | ||||||||||||
| Net cash flows from (used by) operating activities | 791,204 | 37,004 | ||||||||||||
| Cash flows from (used by) investing activities: | ||||||||||||||
| Capital expenditures | (187,618) | (138,836) | ||||||||||||
| Acquisitions, net of cash acquired | (18,137) | (700,941) | ||||||||||||
| Proceeds from the sale of property, plant and equipment | 11,843 | 3,910 | ||||||||||||
| Proceeds from insurance, sale of discontinued operations and other | 974 | 6,298 | ||||||||||||
| Beneficial interest in securitized accounts receivable | — | 367,521 | ||||||||||||
| Net cash flows from (used by) investing activities | (192,938) | (462,048) | ||||||||||||
| Cash flows from (used by) financing activities: | ||||||||||||||
| Proceeds from issuance of long-term debt | 62,539 | 180,000 | ||||||||||||
| Repayments of long-term debt | (246,523) | (127,704) | ||||||||||||
| Proceeds from accounts receivable programs | 234,482 | 288,896 | ||||||||||||
| Repayments under accounts receivable programs | (237,828) | (296,033) | ||||||||||||
| Cash dividends | (57,056) | (56,537) | ||||||||||||
| Stock issued under incentive and purchase plans, net of forfeitures | (3,420) | (1,876) | ||||||||||||
| Other | 16 | 10 | ||||||||||||
| Net cash flows from (used by) financing activities | (247,790) | (13,244) | ||||||||||||
| Effect of exchange rate changes on cash | 759 | (598) | ||||||||||||
| Increase (decrease) in cash and cash equivalents | 351,235 | (438,886) | ||||||||||||
| Cash, restricted cash and cash equivalents at beginning of year | 193,729 | 632,615 | ||||||||||||
| Cash, restricted cash and cash equivalents at end of year | $ | 544,964 | $ | 193,729 | ||||||||||
| Supplemental information: | ||||||||||||||
| Cash and cash equivalents | $ | 542,103 | $ | 192,461 | ||||||||||
| Restricted cash | $ | 2,861 | $ | 1,268 | ||||||||||
| Total cash, cash equivalents and restricted cash | $ | 544,964 | $ | 193,729 | ||||||||||
(CMC Year End 2020 - 11)
COMMERCIAL METALS COMPANY
NON-GAAP FINANCIAL MEASURES (UNAUDITED)
This press release contains financial measures not derived in accordance with generally accepted accounting principles ("GAAP"). Reconciliations to the most comparable GAAP measures are provided below.
Core EBITDA from Continuing Operations is a non-GAAP financial measure. Core EBITDA from continuing operations is the sum of earnings from continuing operations before interest expense and income taxes. It also excludes recurring non-cash charges for depreciation and amortization, asset impairments, and equity compensation. Core EBITDA from continuing operations also excludes certain acquisition settlement costs, amortization of acquired unfavorable contract backlog, labor cost government refunds, facility closure costs, debt extinguishment costs, acquisition and integration-related costs and the effect of purchase accounting adjustments on inventory. Core EBITDA from continuing operations should not be considered an alternative to earnings (loss) from continuing operations or net earnings (loss), or as a better measure of liquidity than net cash flows from operating activities, as determined by GAAP. However, we believe that Core EBITDA from continuing operations provides relevant and useful information, which is often used by analysts, creditors and other interested parties in our industry as it allows: (i) comparison of our earnings to those of our competitors; (ii) a supplemental measure of our ongoing core performance; and (iii) the assessment of period-to-period performance trends. Additionally, Core EBITDA from continuing operations is the target benchmark for our annual and long-term cash incentive performance plans for management. Core EBITDA from continuing operations may be inconsistent with similar measures presented by other companies.
A reconciliation of earnings from continuing operations before income taxes to Core EBITDA from continuing operations is provided below:
| Three Months Ended | Fiscal Year Ended | ||||||||||||||||||||||||||||||||||||||||
| (in thousands) | 8/31/2020 | 5/31/2020 | 2/29/2020 | 11/30/2019 | 8/31/2019 | 8/31/2020 | 8/31/2019 | ||||||||||||||||||||||||||||||||||
| Earnings from continuing operations | $ | 67,782 | $ | 64,169 | $ | 63,596 | $ | 82,755 | $ | 85,880 | $ | 278,302 | $ | 198,779 | |||||||||||||||||||||||||||
| Interest expense | 13,962 | 15,409 | 15,888 | 16,578 | 17,702 | 61,837 | 71,373 | ||||||||||||||||||||||||||||||||||
| Income taxes | 18,495 | 23,804 | 22,845 | 27,332 | 16,826 | 92,476 | 69,681 | ||||||||||||||||||||||||||||||||||
| Depreciation and amortization | 41,654 | 41,765 | 41,389 | 40,941 | 41,051 | 165,749 | 158,653 | ||||||||||||||||||||||||||||||||||
| Asset impairments | 1,098 | 5,983 | — | 530 | 369 | 7,611 | 384 | ||||||||||||||||||||||||||||||||||
| Non-cash equity compensation | 9,875 | 6,170 | 7,536 | 8,269 | 7,758 | 31,850 | 25,106 | ||||||||||||||||||||||||||||||||||
| Acquisition settlement | 32,123 | — | — | — | — | 32,123 | — | ||||||||||||||||||||||||||||||||||
| Amortization of acquired unfavorable contract backlog | (10,691) | (4,348) | (5,997) | (8,331) | (16,582) | (29,367) | (74,784) | ||||||||||||||||||||||||||||||||||
| Labor cost government refund | (2,985) | — | — | — | — | (2,985) | — | ||||||||||||||||||||||||||||||||||
| Facility closure | 2,903 | 1,863 | — | 6,339 | — | 11,105 | — | ||||||||||||||||||||||||||||||||||
| Debt extinguishment costs | 1,778 | — | — | — | — | 1,778 | — | ||||||||||||||||||||||||||||||||||
| Acquisition and integration related costs and other | — | — | — | — | 6,177 | — | 41,958 | ||||||||||||||||||||||||||||||||||
| Purchase accounting effect on inventory | — | — | — | — | — | — | 10,315 | ||||||||||||||||||||||||||||||||||
| Core EBITDA from continuing operations | $ | 175,994 | $ | 154,815 | $ | 145,257 | $ | 174,413 | $ | 159,181 | $ | 650,479 | $ | 501,465 | |||||||||||||||||||||||||||
(CMC Year End 2020 - 12)
Adjusted earnings from continuing operations is a non-GAAP financial measure that is equal to earnings (loss) from continuing operations before certain acquisition settlement costs, labor cost government refunds, facility closure costs, debt extinguishment costs, asset impairments, acquisition and integration-related costs and purchase accounting effects on inventory, including the estimated income tax effects thereof. Additionally, we adjust adjusted earnings from continuing operations for the effects of the TCJA. Adjusted earnings from continuing operations should not be considered as an alternative to earnings from continuing operations or any other performance measure derived in accordance with GAAP. However, we believe that adjusted earnings from continuing operations provides relevant and useful information to investors as it allows: (i) a supplemental measure of our ongoing core performance and (ii) the assessment of period-to-period performance trends. Management uses adjusted earnings from continuing operations to evaluate our financial performance. Adjusted earnings from continuing operations may be inconsistent with similar measures presented by other companies. Adjusted earnings from continuing operations per diluted share is defined as adjusted earnings from continuing operations on a diluted per share basis.
A reconciliation of earnings from continuing operations to adjusted earnings from continuing operations is provided below:
| Three Months Ended | Fiscal Year Ended | ||||||||||||||||||||||||||||||||||||||||
| (in thousands) | 8/31/2020 | 5/31/2020 | 2/29/2020 | 11/30/2019 | 8/31/2019 | 8/31/2020 | 8/31/2019 | ||||||||||||||||||||||||||||||||||
| Earnings from continuing operations | $ | 67,782 | $ | 64,169 | $ | 63,596 | $ | 82,755 | $ | 85,880 | $ | 278,302 | $ | 198,779 | |||||||||||||||||||||||||||
| Acquisition settlement | 32,123 | — | — | — | — | 32,123 | — | ||||||||||||||||||||||||||||||||||
| Labor cost government refund | (2,985) | — | — | — | — | (2,985) | — | ||||||||||||||||||||||||||||||||||
| Facility closure | 2,903 | 1,863 | — | 6,339 | — | 11,105 | — | ||||||||||||||||||||||||||||||||||
| Debt extinguishment costs | 1,778 | — | — | — | — | 1,778 | — | ||||||||||||||||||||||||||||||||||
| Asset impairments | 1,098 | 5,983 | — | — | — | 7,081 | — | ||||||||||||||||||||||||||||||||||
| Acquisition and integration related costs and other | — | — | — | — | 6,177 | — | 41,958 | ||||||||||||||||||||||||||||||||||
| Purchase accounting effect on inventory | — | — | — | — | — | — | 10,315 | ||||||||||||||||||||||||||||||||||
| Total adjustments (pre-tax) | $ | 34,917 | $ | 7,846 | $ | — | $ | 6,339 | $ | 6,177 | $ | 49,102 | $ | 52,273 | |||||||||||||||||||||||||||
| Tax Impact | |||||||||||||||||||||||||||||||||||||||||
| TCJA impact | $ | — | $ | — | $ | — | $ | — | $ | — | $ | — | $ | 7,550 | |||||||||||||||||||||||||||
| Related tax effects on adjustments | (7,392) | (1,648) | — | (1,331) | (1,297) | (10,371) | (10,977) | ||||||||||||||||||||||||||||||||||
| Total tax impact | (7,392) | (1,648) | — | (1,331) | (1,297) | (10,371) | (3,427) | ||||||||||||||||||||||||||||||||||
| Adjusted earnings from continuing operations | $ | 95,307 | $ | 70,367 | $ | 63,596 | $ | 87,763 | $ | 90,760 | $ | 317,033 | $ | 247,625 | |||||||||||||||||||||||||||
| Adjusted earnings from continuing operations per diluted share | $ | 0.79 | $ | 0.59 | $ | 0.53 | $ | 0.73 | $ | 0.76 | $ | 2.64 | $ | 2.08 | |||||||||||||||||||||||||||
Media Contact:
Susan Gerber
214.689.4300

Q4 FY 2020 SUPPLEMENTAL SLIDES OCTOBER 15, 2020
CAUTIONARY STATEMENTS This presentation contains or incorporates by reference a number of "forward-looking statements" within the meaning of the federal securities laws with respect to general economic conditions, key macro-economic drivers that impact our business, the effects of ongoing trade actions, the effects of continued pressure on the liquidity of our customers, potential synergies provided by our recent acquisitions, demand for our products, steel margins, the effect of the COVID-19 and related governmental and economic responses thereto, the ability to operate our mills at full capacity, future supplies of raw materials and energy for our operations, share repurchases, legal proceedings, the undistributed earnings of our non-U.S. subsidiaries, U.S. non-residential construction activity, international trade, capital expenditures, our liquidity and our ability to satisfy future liquidity requirements, estimated contractual obligations and our expectations or beliefs concerning future events. These forward-looking statements can generally be identified by phrases such as we or our management "expects," "anticipates," "believes," "estimates," "intends," "plans to," "ought," "could," "will," "should," "likely," "appears," "projects," "forecasts," "outlook" or other similar words or phrases. There are inherent risks and uncertainties in any forward-looking statements. We caution readers not to place undue reliance on any forward-looking statements. Our forward-looking statements are based on management's expectations and beliefs as of the time this presentation is filed with the SEC or, with respect to any document incorporated by reference, as of the time such document was prepared. Although we believe that our expectations are reasonable, we can give no assurance that these expectations will prove to have been correct, and actual results may vary materially. Except as required by law, we undertake no obligation to update, amend or clarify any forward-looking statements to reflect changed assumptions, the occurrence of anticipated or unanticipated events, new information or circumstances or any other changes. Important factors that could cause actual results to differ materially from our expectations include those described in Part I, Item 1A, Risk Factors, of our Annual Report on Form 10-K for the fiscal year ended August 31, 2019 as well as in Part II, Item 1A, Risk Factors in our subsequent Quarterly Reports on Form 10-Q as well as the following: changes in economic conditions which affect demand for our products or construction activity generally, and the impact of such changes on the highly cyclical steel industry; rapid and significant changes in the price of metals, potentially impairing our inventory values due to declines in commodity prices or reducing the profitability of our fabrication contracts due to rising commodity pricing; impacts from COVID-19 on the economy, demand for our products or our operations, including the responses of governmental authorities to contain COVID-19; excess capacity in our industry, particularly in China, and product availability from competing steel mills and other steel suppliers including import quantities and pricing; compliance with and changes in environmental laws and regulations, including increased regulation associated with climate change and greenhouse gas emissions; involvement in various environmental matters that may result in fines, penalties or judgments; potential limitations in our or our customers' abilities to access credit and non-compliance by our customers with our contracts; activity in repurchasing shares of our common stock under our repurchase program; financial covenants and restrictions on the operation of our business contained in agreements governing our debt; our ability to successfully identify, consummate, and integrate acquisitions and the effects that acquisitions may have on our financial leverage; risks associated with acquisitions generally, such as the inability to obtain, or delays in obtaining, required approvals under applicable antitrust legislation and other regulatory and third party consents and approvals; lower than expected future levels of revenues and higher than expected future costs; failure or inability to implement growth strategies in a timely manner; impact of goodwill impairment charges; impact of long-lived asset impairment charges; currency fluctuations; global factors, including trade measures, political uncertainties and military conflicts; availability and pricing of electricity, electrodes and natural gas for mill operations; ability to hire and retain key executives and other employees; competition from other materials or from competitors that have a lower cost structure or access to greater financial resources; information technology interruptions and breaches in security; ability to make necessary capital expenditures; availability and pricing of raw materials and other items over which we exert little influence, including scrap metal, energy and insurance; unexpected equipment failures; losses or limited potential gains due to hedging transactions; litigation claims and settlements, court decisions, regulatory rulings and legal compliance risks; risk of injury or death to employees, customers or other visitors to our operations; civil unrest, protests and riots; new and clarifying guidance with regard to interpretation of certain provisions of the Tax Cuts and Jobs Act that could impact our assessment; and increased costs related to health care reform legislation. Q4 FY20 Supplemental Slides | October 15, 2020 2
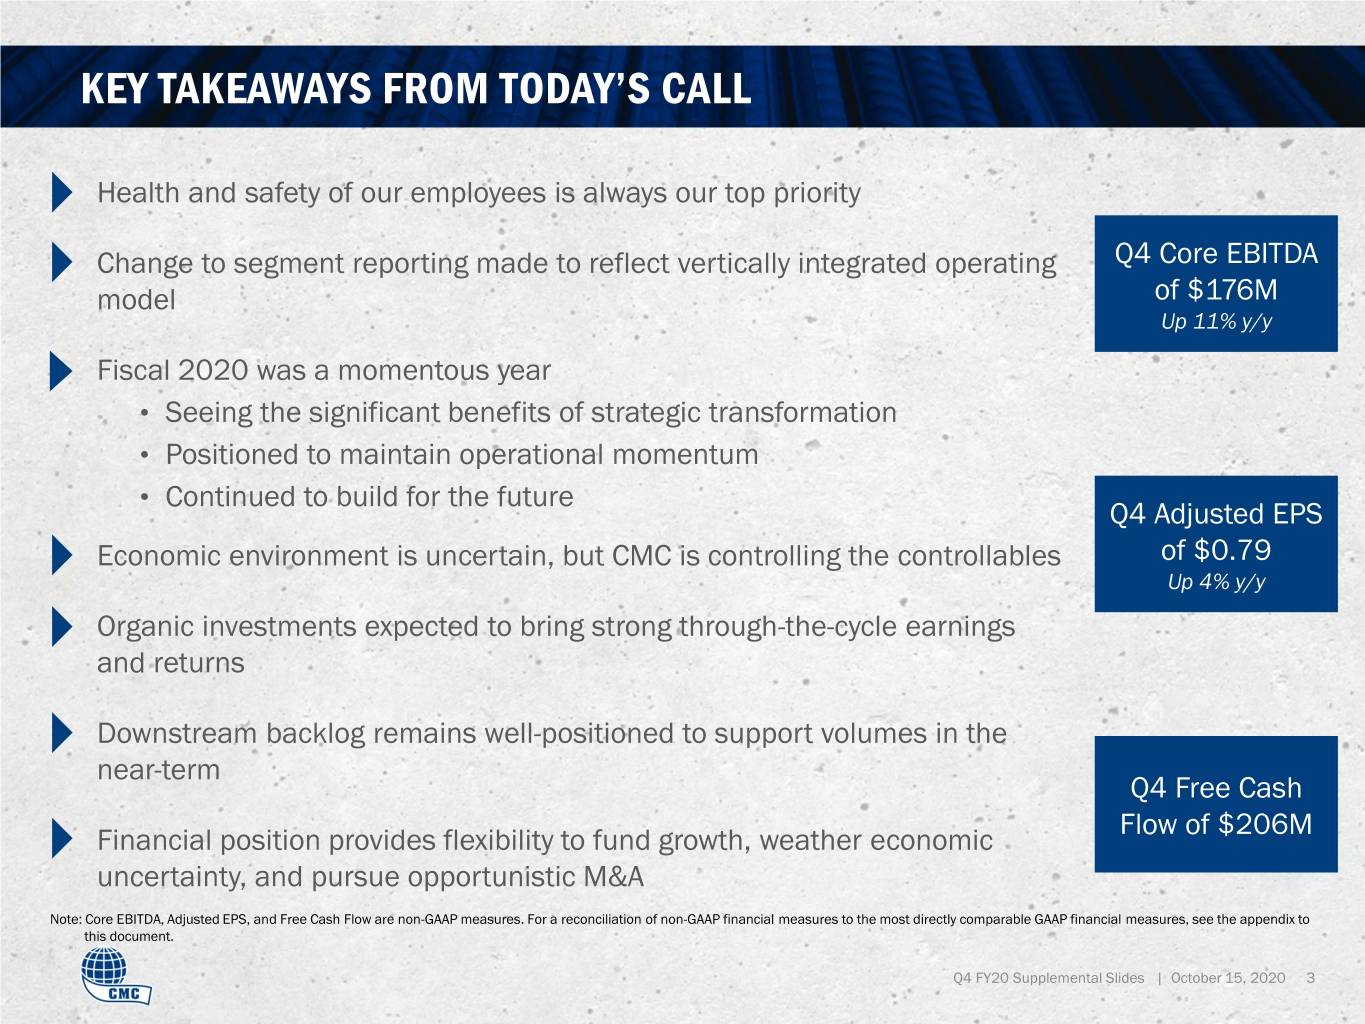
KEY TAKEAWAYS FROM TODAY’S CALL Health and safety of our employees is always our top priority Change to segment reporting made to reflect vertically integrated operating Q4 Core EBITDA model of $176M Up 11% y/y Fiscal 2020 was a momentous year • Seeing the significant benefits of strategic transformation • Positioned to maintain operational momentum • Continued to build for the future Q4 Adjusted EPS Economic environment is uncertain, but CMC is controlling the controllables of $0.79 Up 4% y/y Organic investments expected to bring strong through-the-cycle earnings and returns Downstream backlog remains well-positioned to support volumes in the near-term Q4 Free Cash Flow of $206M Financial position provides flexibility to fund growth, weather economic uncertainty, and pursue opportunistic M&A Note: Core EBITDA, Adjusted EPS, and Free Cash Flow are non-GAAP measures. For a reconciliation of non-GAAP financial measures to the most directly comparable GAAP financial measures, see the appendix to this document. Q4 FY20 Supplemental Slides | October 15, 2020 3
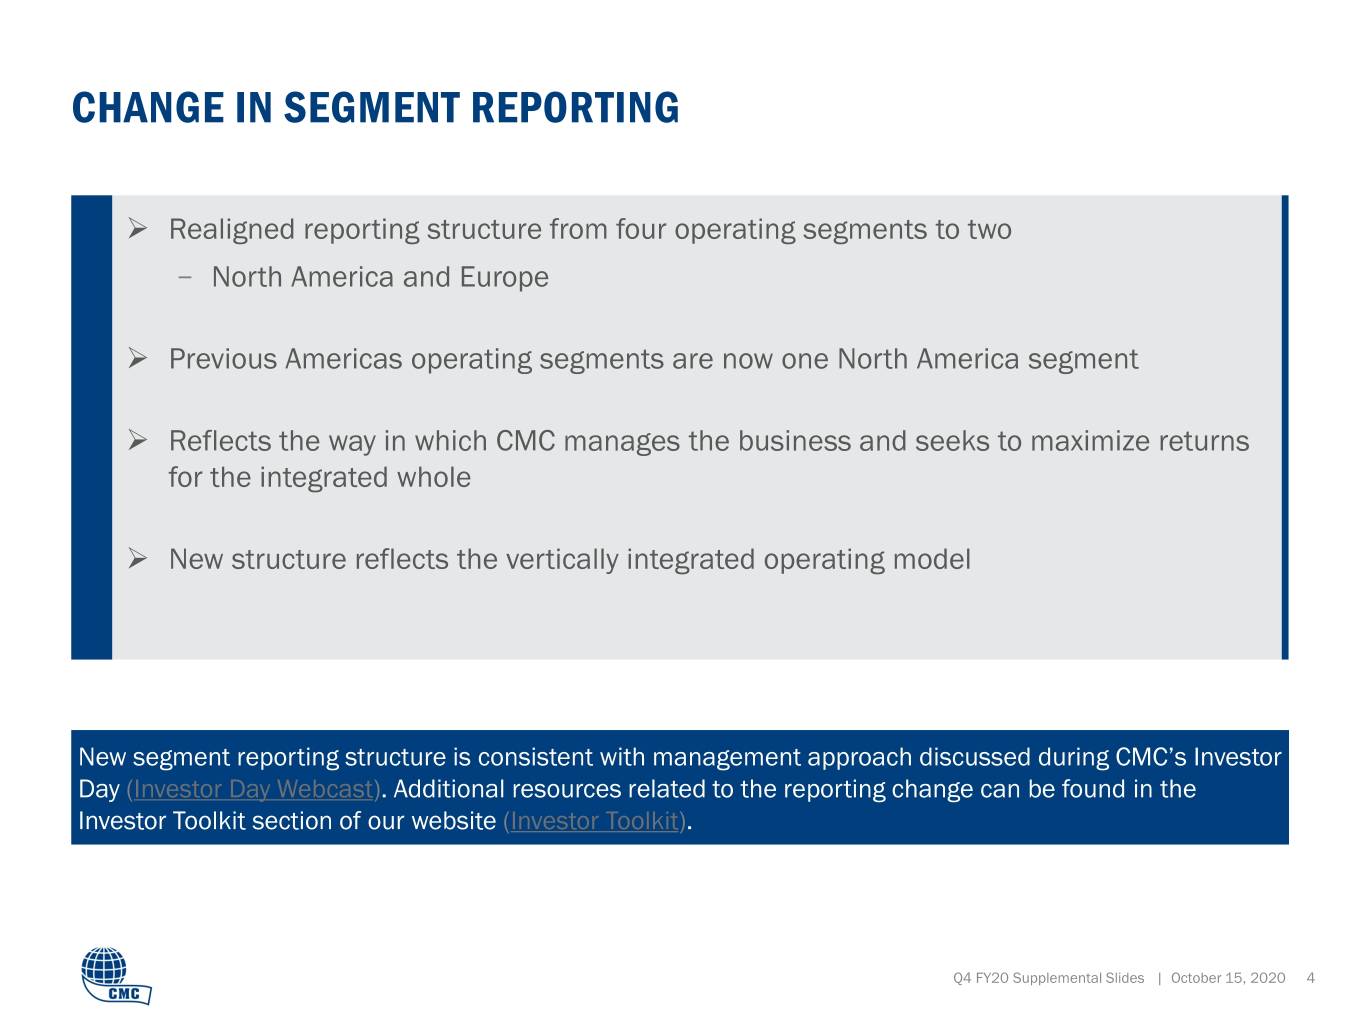
CHANGE IN SEGMENT REPORTING Realigned reporting structure from four operating segments to two − North America and Europe Previous Americas operating segments are now one North America segment Reflects the way in which CMC manages the business and seeks to maximize returns for the integrated whole New structure reflects the vertically integrated operating model New segment reporting structure is consistent with management approach discussed during CMC’s Investor Day (Investor Day Webcast). Additional resources related to the reporting change can be found in the Investor Toolkit section of our website (Investor Toolkit). Q4 FY20 Supplemental Slides | October 15, 2020 4
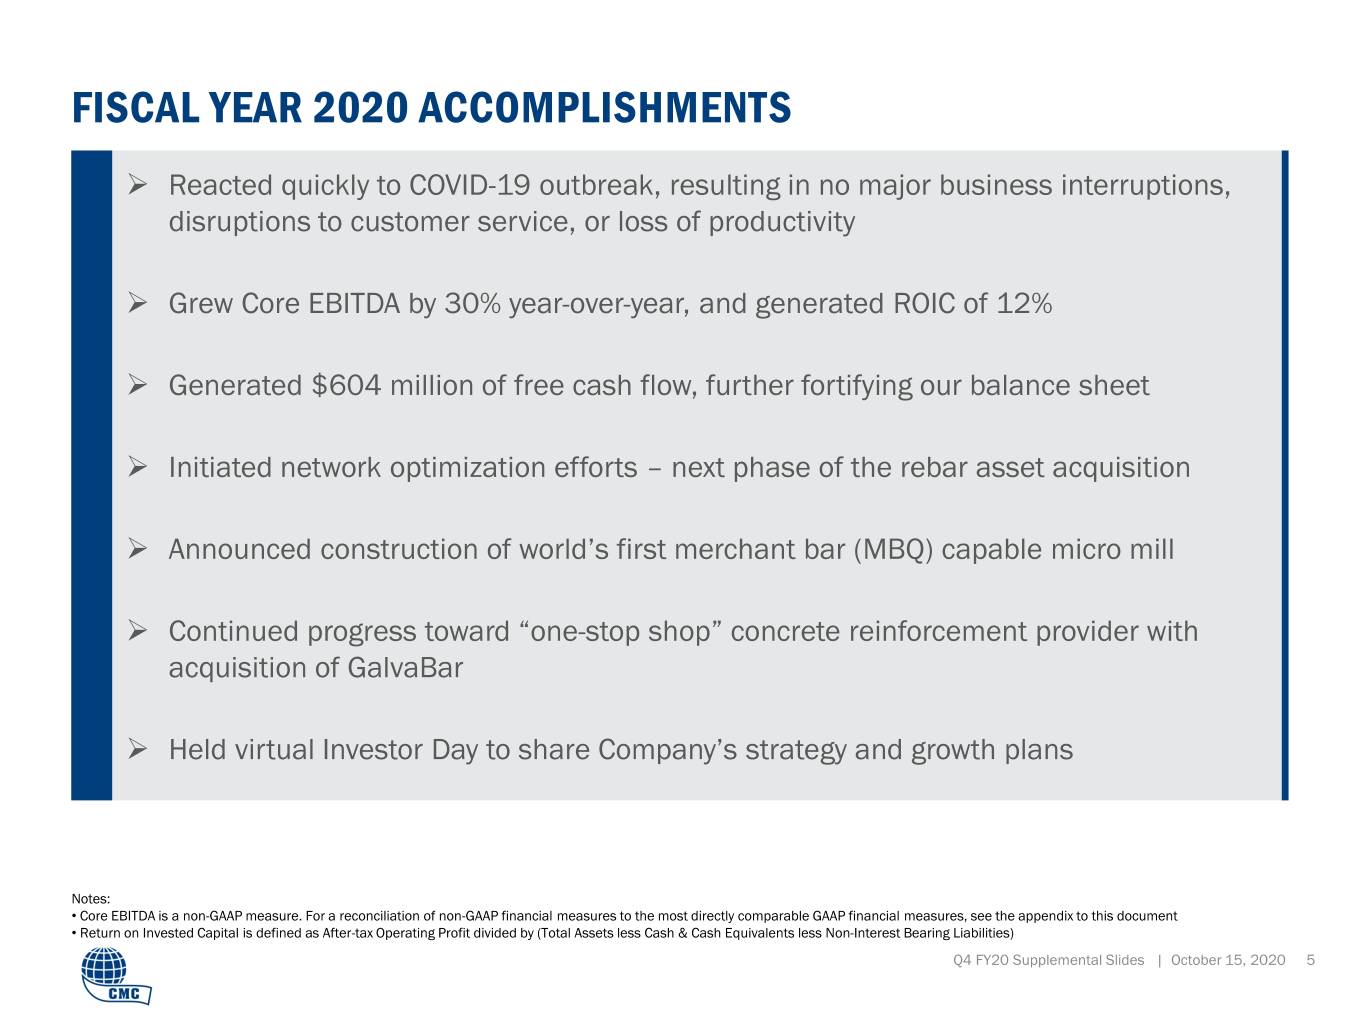
FISCAL YEAR 2020 ACCOMPLISHMENTS Reacted quickly to COVID-19 outbreak, resulting in no major business interruptions, disruptions to customer service, or loss of productivity Grew Core EBITDA by 30% year-over-year, and generated ROIC of 12% Generated $604 million of free cash flow, further fortifying our balance sheet Initiated network optimization efforts – next phase of the rebar asset acquisition Announced construction of world’s first merchant bar (MBQ) capable micro mill Continued progress toward “one-stop shop” concrete reinforcement provider with acquisition of GalvaBar Held virtual Investor Day to share Company’s strategy and growth plans Notes: • Core EBITDA is a non-GAAP measure. For a reconciliation of non-GAAP financial measures to the most directly comparable GAAP financial measures, see the appendix to this document • Return on Invested Capital is defined as After-tax Operating Profit divided by (Total Assets less Cash & Cash Equivalents less Non-Interest Bearing Liabilities) Q4 FY20 Supplemental Slides | October 15, 2020 5
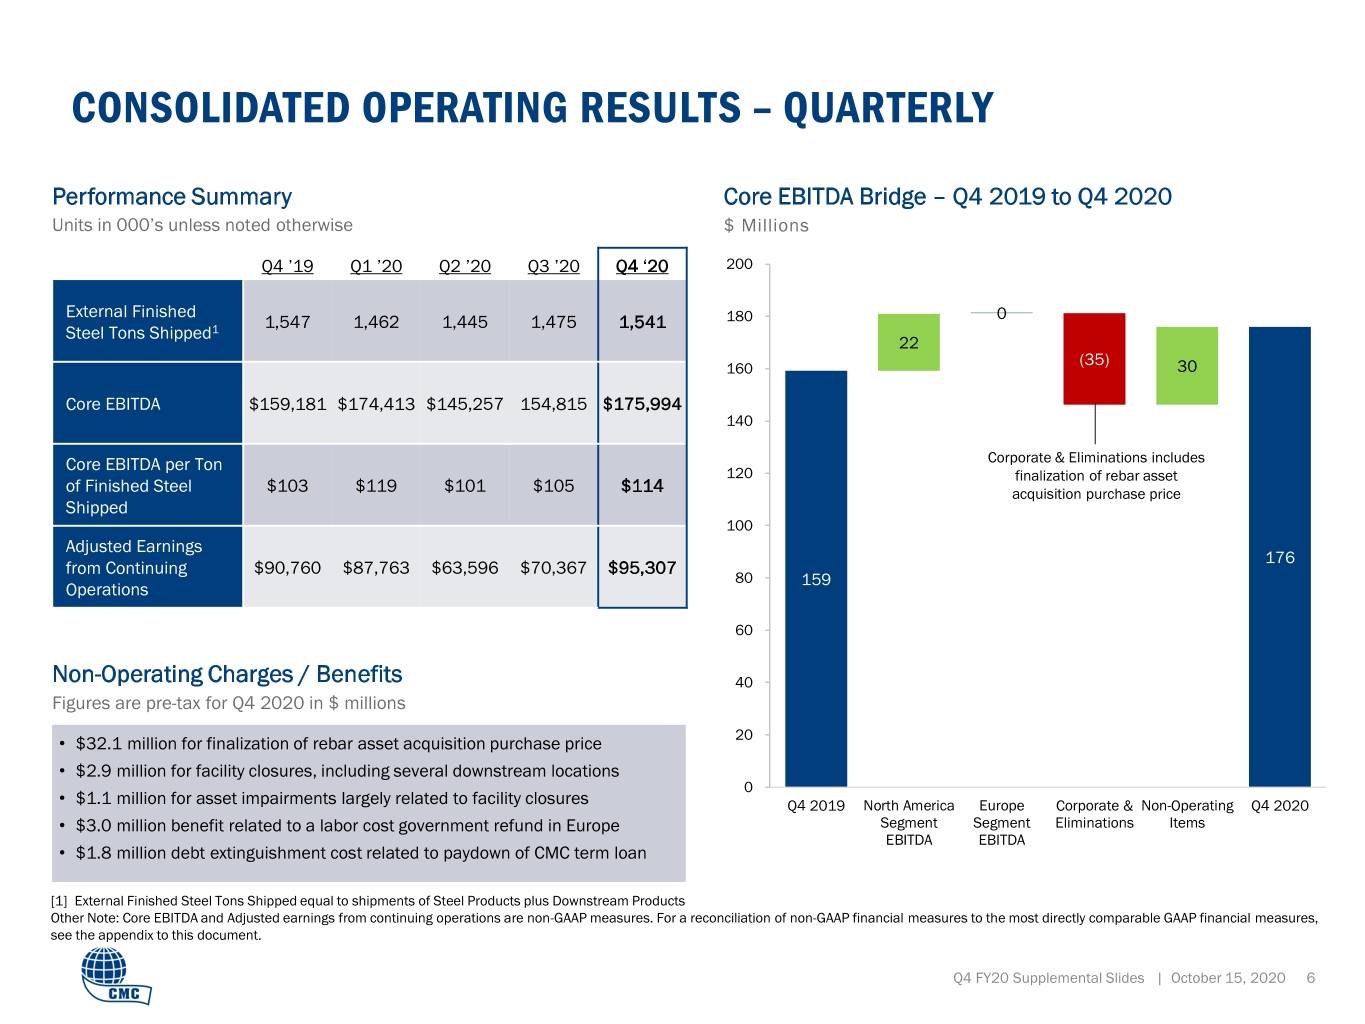
CONSOLIDATED OPERATING RESULTS – QUARTERLY Performance Summary Core EBITDA Bridge – Q4 2019 to Q4 2020 Units in 000’s unless noted otherwise $ Millions Q4 ’19 Q1 ’20 Q2 ’20 Q3 ’20 Q4 ‘20 200 External Finished 1,547 1,462 1,445 1,475 1,541 180 0 Steel Tons Shipped1 22 (35) 160 30 Core EBITDA $159,181 $174,413 $145,257 154,815 $175,994 140 Core EBITDA per Ton Corporate & Eliminations includes 120 finalization of rebar asset of Finished Steel $103 $119 $101 $105 $114 acquisition purchase price Shipped 100 Adjusted Earnings 176 from Continuing $90,760 $87,763 $63,596 $70,367 $95,307 80 159 Operations 60 Non-Operating Charges / Benefits 40 Figures are pre-tax for Q4 2020 in $ millions 20 • $32.1 million for finalization of rebar asset acquisition purchase price • $2.9 million for facility closures, including several downstream locations 0 • $1.1 million for asset impairments largely related to facility closures Q4 2019 North America Europe Corporate & Non-Operating Q4 2020 • $3.0 million benefit related to a labor cost government refund in Europe Segment Segment Eliminations Items EBITDA EBITDA • $1.8 million debt extinguishment cost related to paydown of CMC term loan [1] External Finished Steel Tons Shipped equal to shipments of Steel Products plus Downstream Products Other Note: Core EBITDA and Adjusted earnings from continuing operations are non-GAAP measures. For a reconciliation of non-GAAP financial measures to the most directly comparable GAAP financial measures, see the appendix to this document. Q4 FY20 Supplemental Slides | October 15, 2020 6
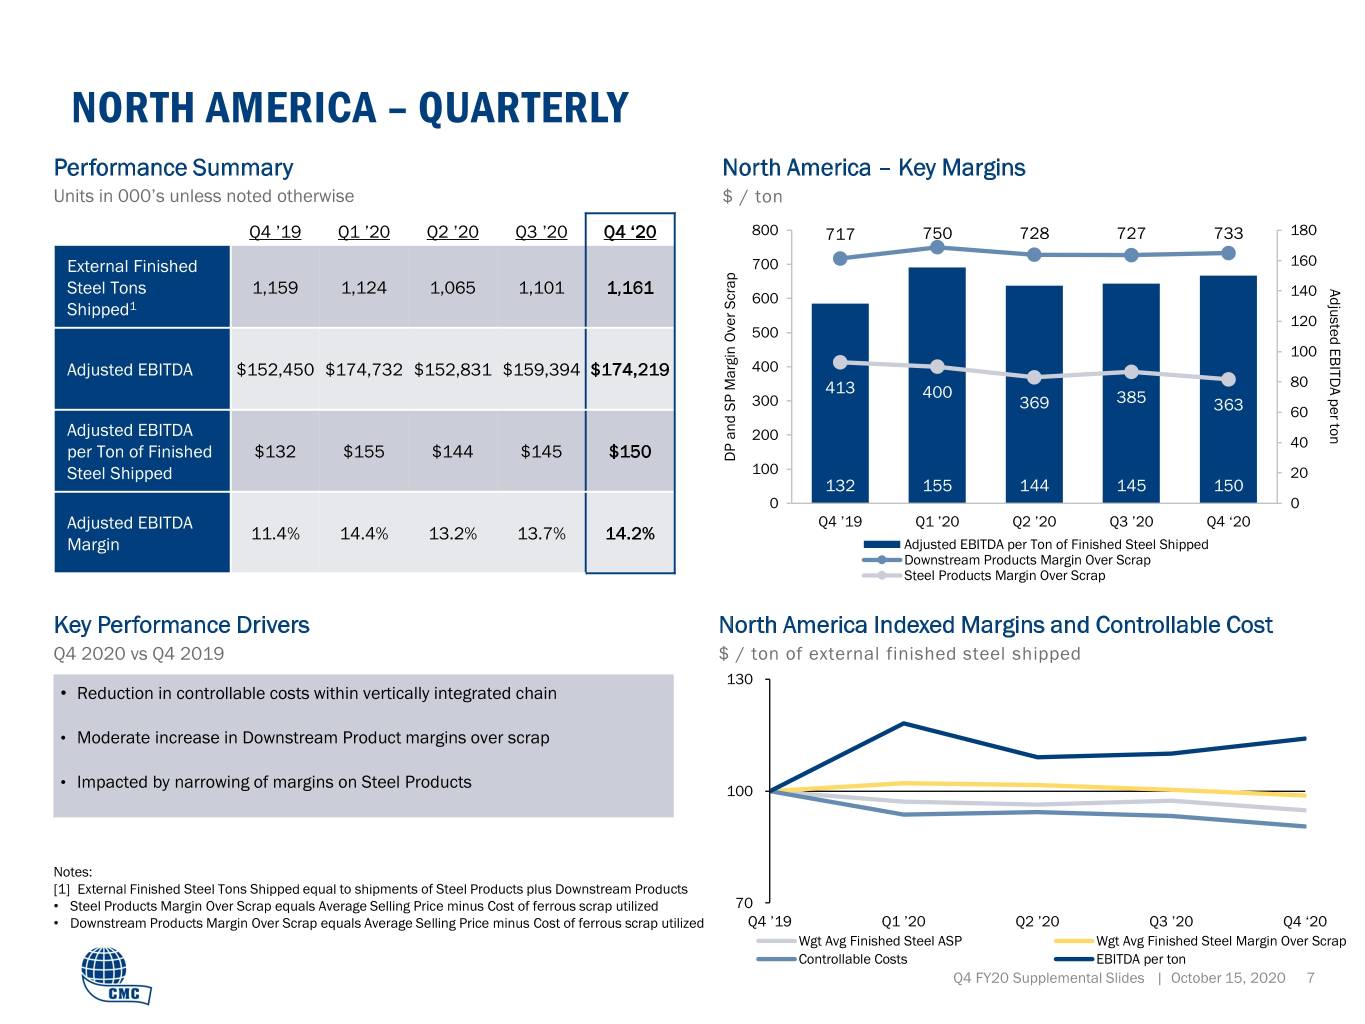
NORTH AMERICA – QUARTERLY Performance Summary North America – Key Margins Units in 000’s unless noted otherwise $ / ton Q4 ’19 Q1 ’20 Q2 ’20 Q3 ’20 Q4 ‘20 800 717 750 728 727 733 180 External Finished 700 160 Steel Tons 1,159 1,124 1,065 1,101 1,161 Adjusted EBITDA per ton 600 140 Shipped1 120 500 100 Adjusted EBITDA $152,450 $174,732 $152,831 $159,394 $174,219 400 80 413 400 300 369 385 363 60 Adjusted EBITDA 200 40 per Ton of Finished $132 $155 $144 $145 $150 DP and SP Margin Over Scrap Over Margin SP and DP Steel Shipped 100 20 132 155 144 145 150 0 0 Adjusted EBITDA Q4 ’19 Q1 ’20 Q2 ’20 Q3 ’20 Q4 ‘20 11.4% 14.4% 13.2% 13.7% 14.2% Margin Adjusted EBITDA per Ton of Finished Steel Shipped Downstream Products Margin Over Scrap Steel Products Margin Over Scrap Key Performance Drivers North America Indexed Margins and Controllable Cost Q4 2020 vs Q4 2019 $ / ton of external finished steel shipped 130 • Reduction in controllable costs within vertically integrated chain • Moderate increase in Downstream Product margins over scrap • Impacted by narrowing of margins on Steel Products 100 Notes: [1] External Finished Steel Tons Shipped equal to shipments of Steel Products plus Downstream Products • Steel Products Margin Over Scrap equals Average Selling Price minus Cost of ferrous scrap utilized 70 • Downstream Products Margin Over Scrap equals Average Selling Price minus Cost of ferrous scrap utilized Q4 ’19 Q1 ’20 Q2 ’20 Q3 ’20 Q4 ‘20 Wgt Avg Finished Steel ASP Wgt Avg Finished Steel Margin Over Scrap Controllable Costs EBITDA per ton Q4 FY20 Supplemental Slides | October 15, 2020 7
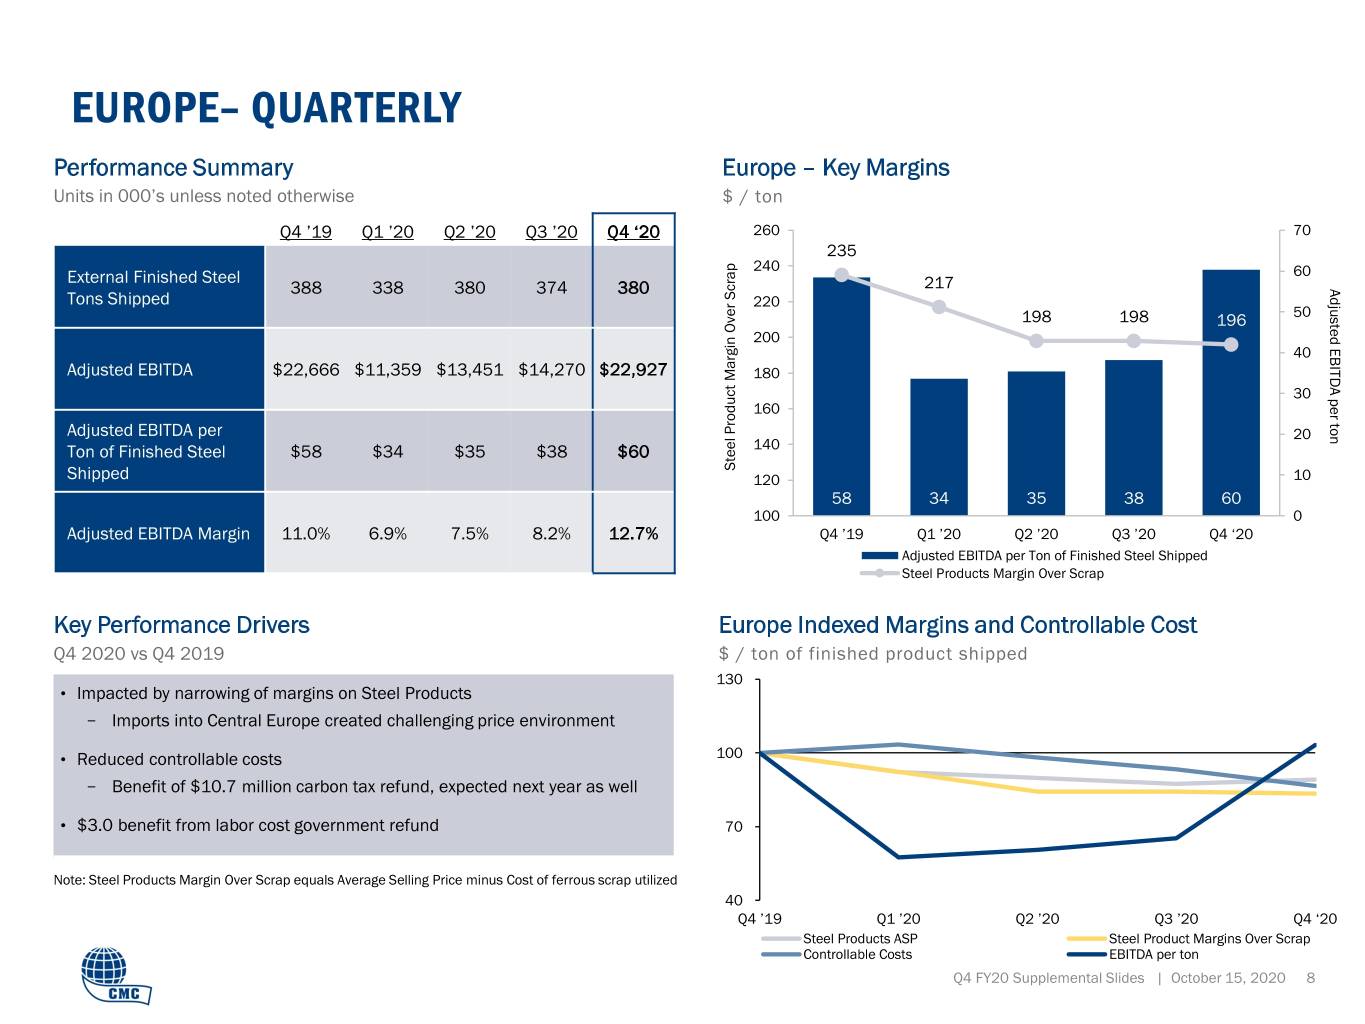
EUROPE– QUARTERLY Performance Summary Europe – Key Margins Units in 000’s unless noted otherwise $ / ton Q4 ’19 Q1 ’20 Q2 ’20 Q3 ’20 Q4 ‘20 260 70 235 240 External Finished Steel 60 388 338 380 374 380 217 Adjusted EBITDA per ton Tons Shipped 220 198 198 196 50 200 40 Adjusted EBITDA $22,666 $11,359 $13,451 $14,270 $22,927 180 30 160 Adjusted EBITDA per 20 Ton of Finished Steel $58 $34 $35 $38 $60 140 Steel Product Margin Over Scrap Over Margin Product Steel Shipped 120 10 58 34 35 38 60 100 0 Adjusted EBITDA Margin 11.0% 6.9% 7.5% 8.2% 12.7% Q4 ’19 Q1 ’20 Q2 ’20 Q3 ’20 Q4 ‘20 Adjusted EBITDA per Ton of Finished Steel Shipped Steel Products Margin Over Scrap Key Performance Drivers Europe Indexed Margins and Controllable Cost Q4 2020 vs Q4 2019 $ / ton of finished product shipped 130 • Impacted by narrowing of margins on Steel Products − Imports into Central Europe created challenging price environment • Reduced controllable costs 100 − Benefit of $10.7 million carbon tax refund, expected next year as well • $3.0 benefit from labor cost government refund 70 Note: Steel Products Margin Over Scrap equals Average Selling Price minus Cost of ferrous scrap utilized 40 Q4 ’19 Q1 ’20 Q2 ’20 Q3 ’20 Q4 ‘20 Steel Products ASP Steel Product Margins Over Scrap Controllable Costs EBITDA per ton Q4 FY20 Supplemental Slides | October 15, 2020 8
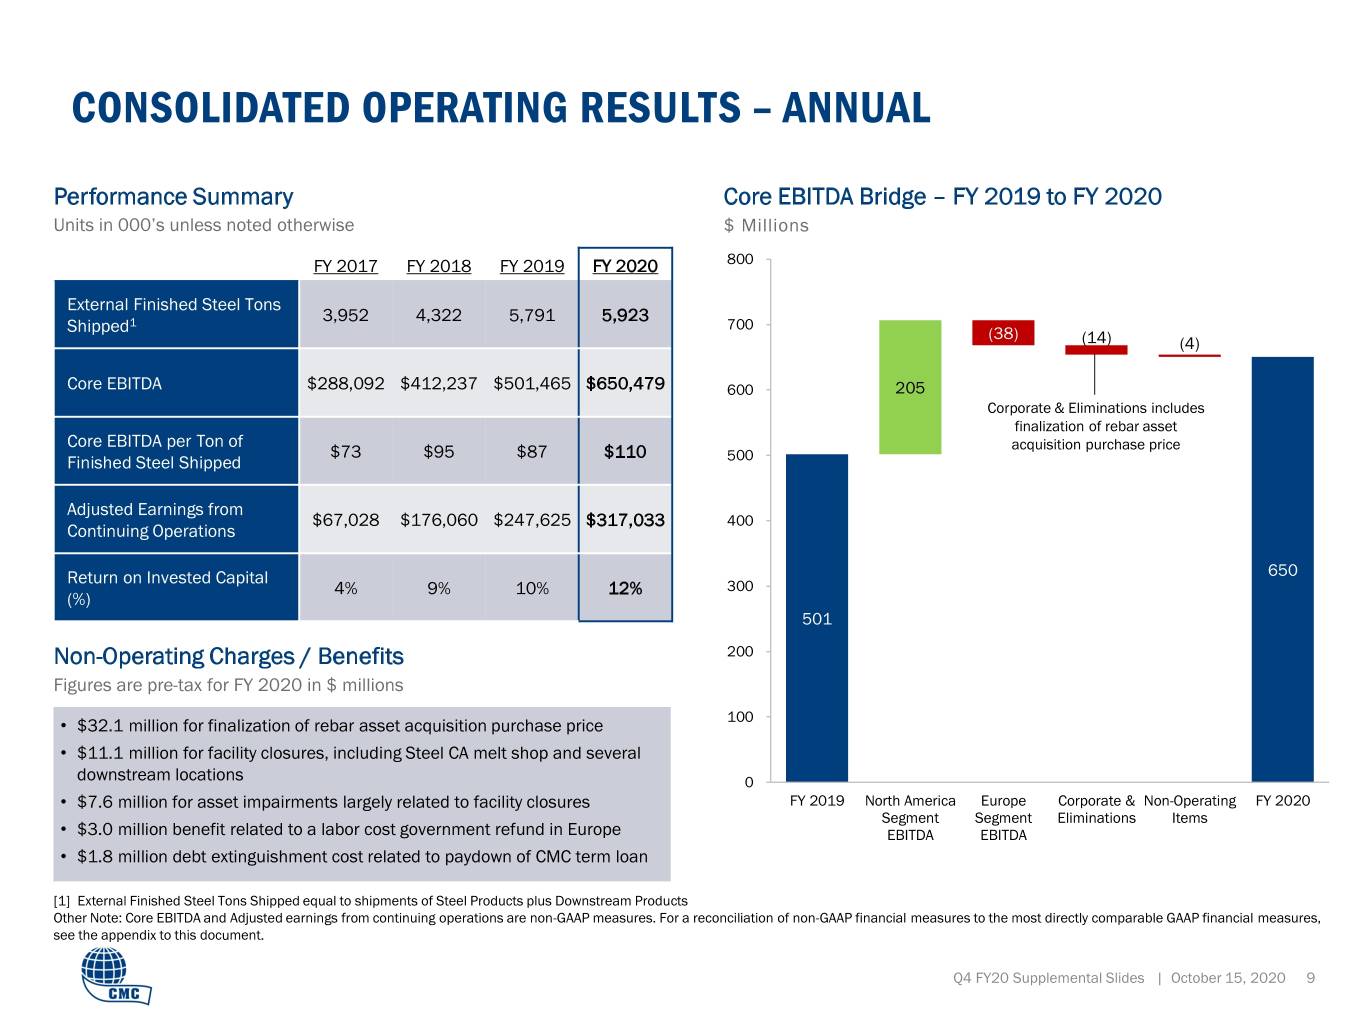
CONSOLIDATED OPERATING RESULTS – ANNUAL Performance Summary Core EBITDA Bridge – FY 2019 to FY 2020 Units in 000’s unless noted otherwise $ Millions FY 2017 FY 2018 FY 2019 FY 2020 800 External Finished Steel Tons 3,952 4,322 5,791 5,923 1 700 Shipped (38) (14) (4) Core EBITDA $288,092 $412,237 $501,465 $650,479 600 205 Corporate & Eliminations includes finalization of rebar asset Core EBITDA per Ton of $73 $95 $87 $110 acquisition purchase price Finished Steel Shipped 500 Adjusted Earnings from $67,028 $176,060 $247,625 $317,033 400 Continuing Operations Return on Invested Capital 650 4% 9% 10% 12% 300 (%) 501 Non-Operating Charges / Benefits 200 Figures are pre-tax for FY 2020 in $ millions 100 • $32.1 million for finalization of rebar asset acquisition purchase price • $11.1 million for facility closures, including Steel CA melt shop and several downstream locations 0 • $7.6 million for asset impairments largely related to facility closures FY 2019 North America Europe Corporate & Non-Operating FY 2020 Segment Segment Eliminations Items • $3.0 million benefit related to a labor cost government refund in Europe EBITDA EBITDA • $1.8 million debt extinguishment cost related to paydown of CMC term loan [1] External Finished Steel Tons Shipped equal to shipments of Steel Products plus Downstream Products Other Note: Core EBITDA and Adjusted earnings from continuing operations are non-GAAP measures. For a reconciliation of non-GAAP financial measures to the most directly comparable GAAP financial measures, see the appendix to this document. Q4 FY20 Supplemental Slides | October 15, 2020 9
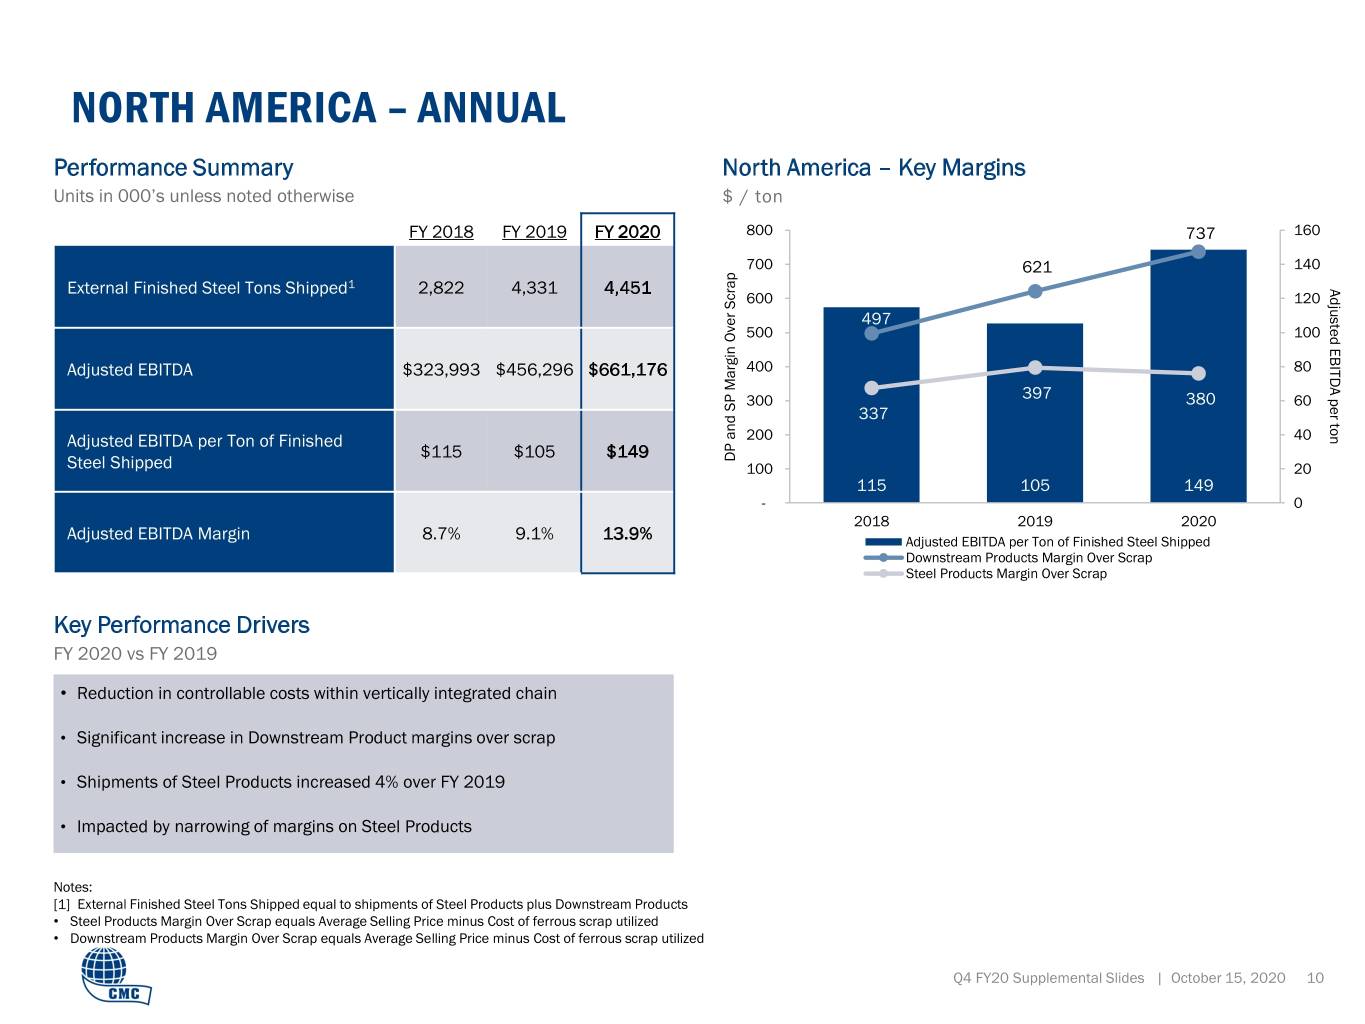
NORTH AMERICA – ANNUAL Performance Summary North America – Key Margins Units in 000’s unless noted otherwise $ / ton FY 2018 FY 2019 FY 2020 800 737 160 700 621 140 External Finished Steel Tons Shipped1 2,822 4,331 4,451 Adjusted EBITDA per ton 600 120 497 500 100 Adjusted EBITDA $323,993 $456,296 $661,176 400 80 300 397 380 60 337 Adjusted EBITDA per Ton of Finished 200 40 $115 $105 $149 Steel Shipped Scrap Over Margin SP and DP 100 20 115 105 149 - 0 2018 2019 2020 Adjusted EBITDA Margin 8.7% 9.1% 13.9% Adjusted EBITDA per Ton of Finished Steel Shipped Downstream Products Margin Over Scrap Steel Products Margin Over Scrap Key Performance Drivers FY 2020 vs FY 2019 • Reduction in controllable costs within vertically integrated chain • Significant increase in Downstream Product margins over scrap • Shipments of Steel Products increased 4% over FY 2019 • Impacted by narrowing of margins on Steel Products Notes: [1] External Finished Steel Tons Shipped equal to shipments of Steel Products plus Downstream Products • Steel Products Margin Over Scrap equals Average Selling Price minus Cost of ferrous scrap utilized • Downstream Products Margin Over Scrap equals Average Selling Price minus Cost of ferrous scrap utilized Q4 FY20 Supplemental Slides | October 15, 2020 10
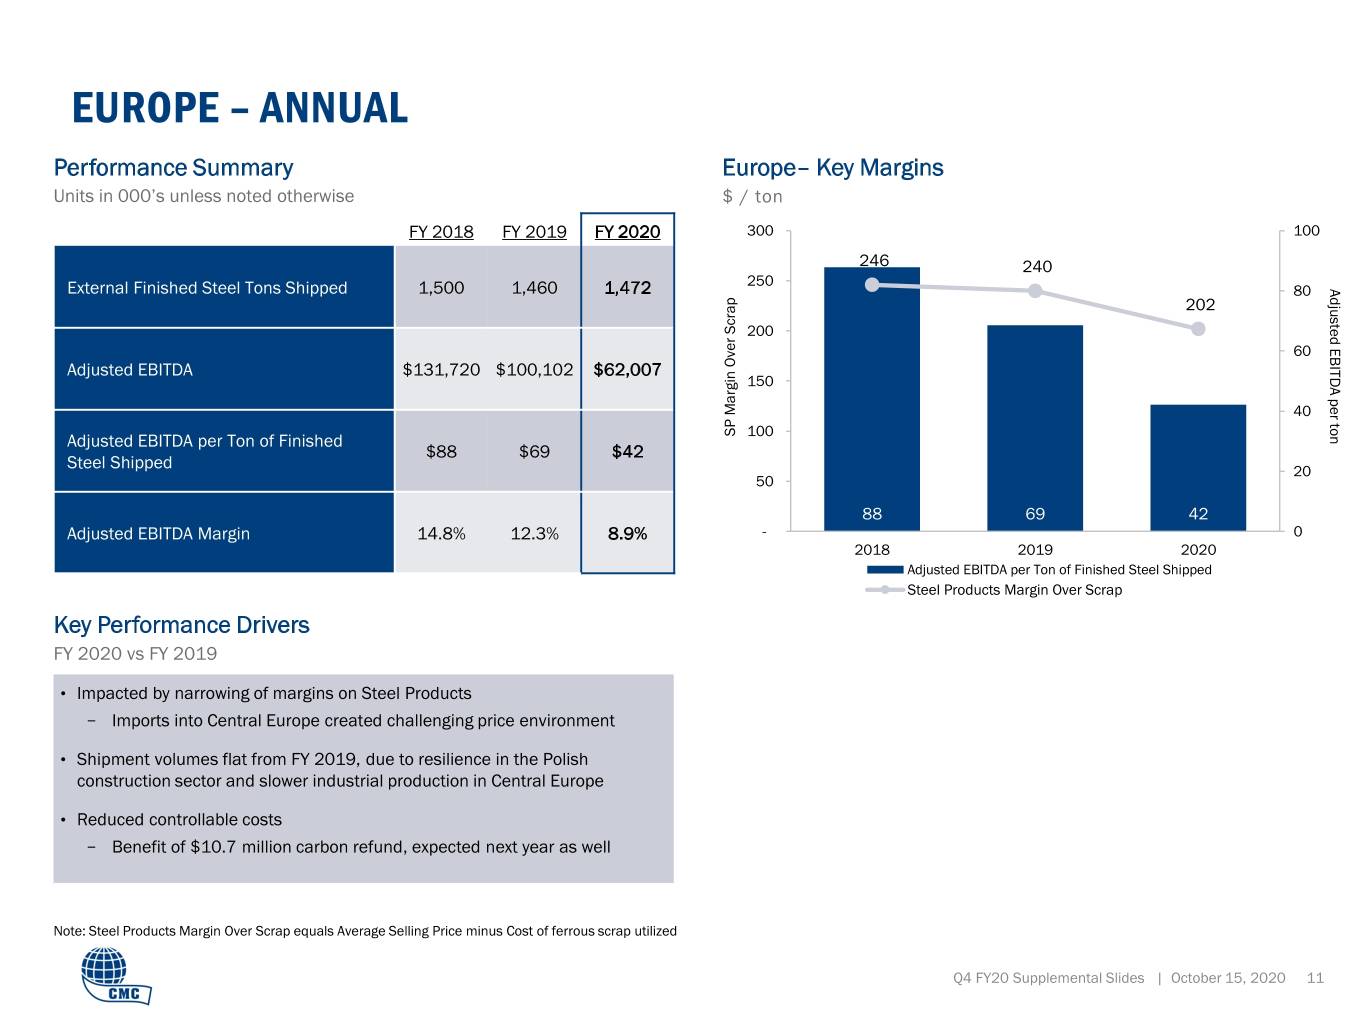
EUROPE – ANNUAL Performance Summary Europe– Key Margins Units in 000’s unless noted otherwise $ / ton FY 2018 FY 2019 FY 2020 300 100 246 240 250 External Finished Steel Tons Shipped 1,500 1,460 1,472 80 Adjusted EBITDA per ton 202 200 60 Adjusted EBITDA $131,720 $100,102 $62,007 150 40 SP Margin Over Scrap Over Margin SP 100 Adjusted EBITDA per Ton of Finished $88 $69 $42 Steel Shipped 20 50 88 69 42 Adjusted EBITDA Margin 14.8% 12.3% 8.9% - 0 2018 2019 2020 Adjusted EBITDA per Ton of Finished Steel Shipped Steel Products Margin Over Scrap Key Performance Drivers FY 2020 vs FY 2019 • Impacted by narrowing of margins on Steel Products − Imports into Central Europe created challenging price environment • Shipment volumes flat from FY 2019, due to resilience in the Polish construction sector and slower industrial production in Central Europe • Reduced controllable costs − Benefit of $10.7 million carbon refund, expected next year as well Note: Steel Products Margin Over Scrap equals Average Selling Price minus Cost of ferrous scrap utilized Q4 FY20 Supplemental Slides | October 15, 2020 11
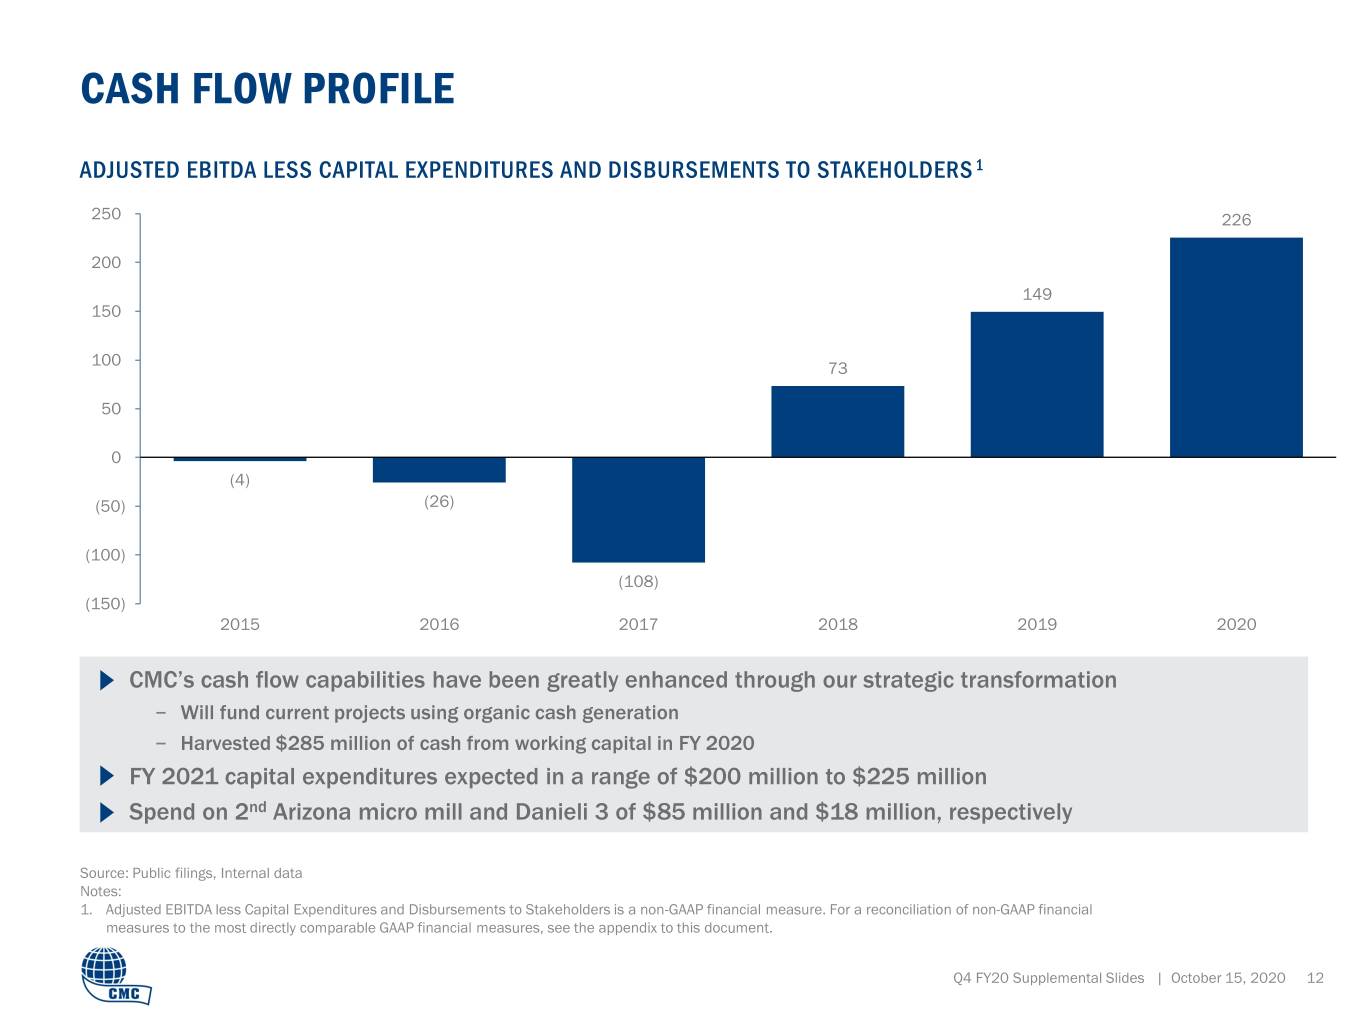
CASH FLOW PROFILE ADJUSTED EBITDA LESS CAPITAL EXPENDITURES AND DISBURSEMENTS TO STAKEHOLDERS 1 250 226 200 149 150 100 73 50 0 (4) (50) (26) (100) (108) (150) 2015 2016 2017 2018 2019 2020 CMC’s cash flow capabilities have been greatly enhanced through our strategic transformation − Will fund current projects using organic cash generation − Harvested $285 million of cash from working capital in FY 2020 FY 2021 capital expenditures expected in a range of $200 million to $225 million Spend on 2nd Arizona micro mill and Danieli 3 of $85 million and $18 million, respectively Source: Public filings, Internal data Notes: 1. Adjusted EBITDA less Capital Expenditures and Disbursements to Stakeholders is a non-GAAP financial measure. For a reconciliation of non-GAAP financial measures to the most directly comparable GAAP financial measures, see the appendix to this document. Q4 FY20 Supplemental Slides | October 15, 2020 12
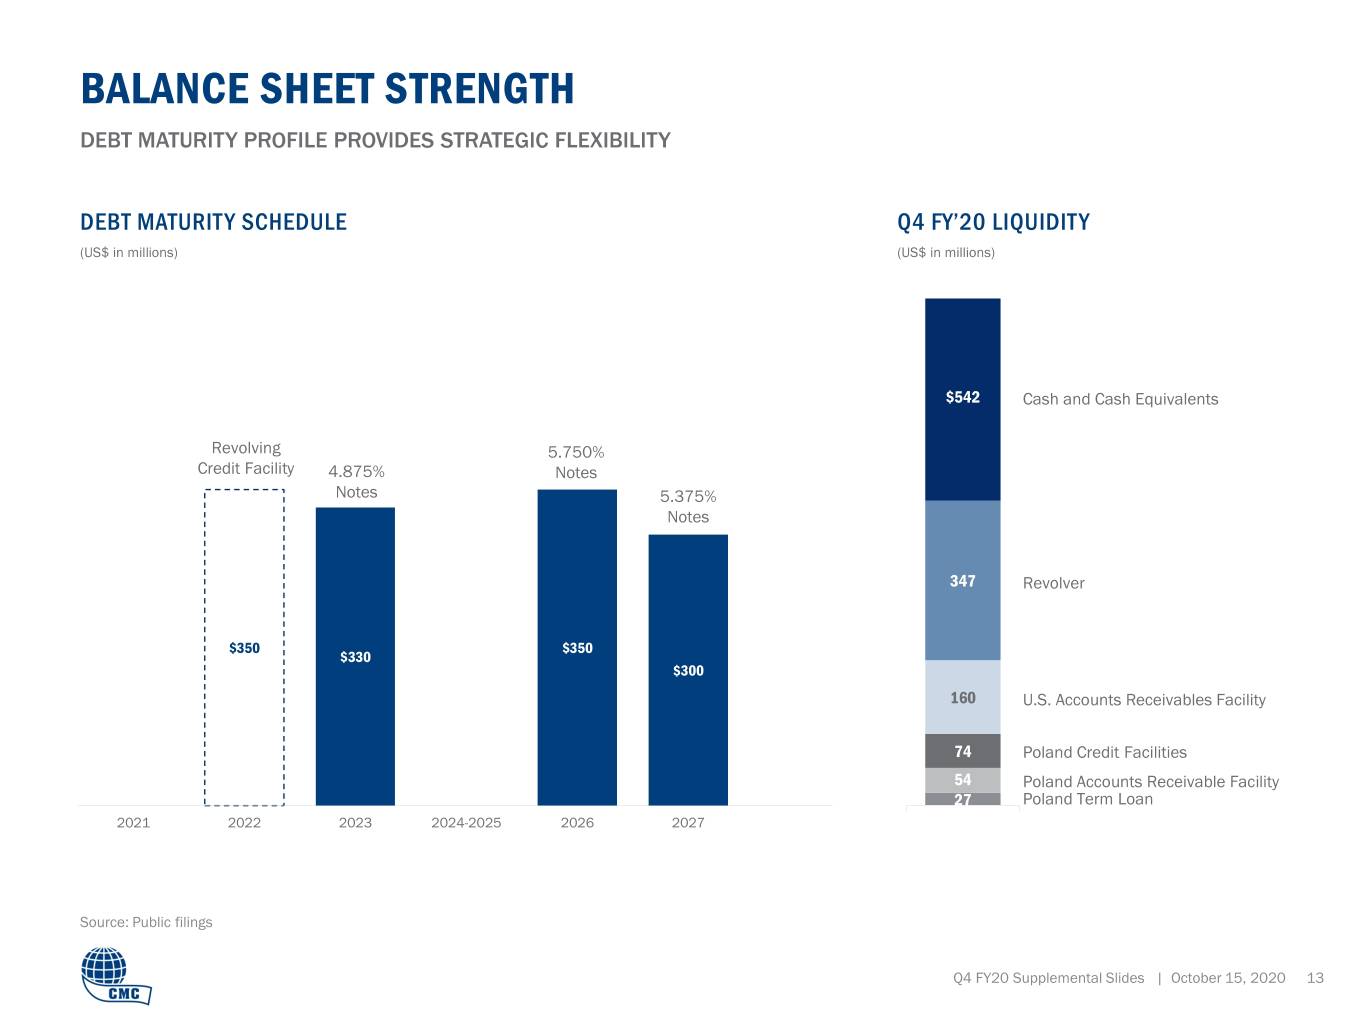
BALANCE SHEET STRENGTH DEBT MATURITY PROFILE PROVIDES STRATEGIC FLEXIBILITY DEBT MATURITY SCHEDULE Q4 FY’20 LIQUIDITY (US$ in millions) (US$ in millions) $542 Cash and Cash Equivalents Revolving 5.750% Credit Facility 4.875% Notes Notes 5.375% Notes 347 Revolver $350 $350 $330 $300 160 U.S. Accounts Receivables Facility 74 Poland Credit Facilities 54 Poland Accounts Receivable Facility 27 Poland Term Loan 2021 2022 2023 2024-2025 2026 2027 Source: Public filings Q4 FY20 Supplemental Slides | October 15, 2020 13
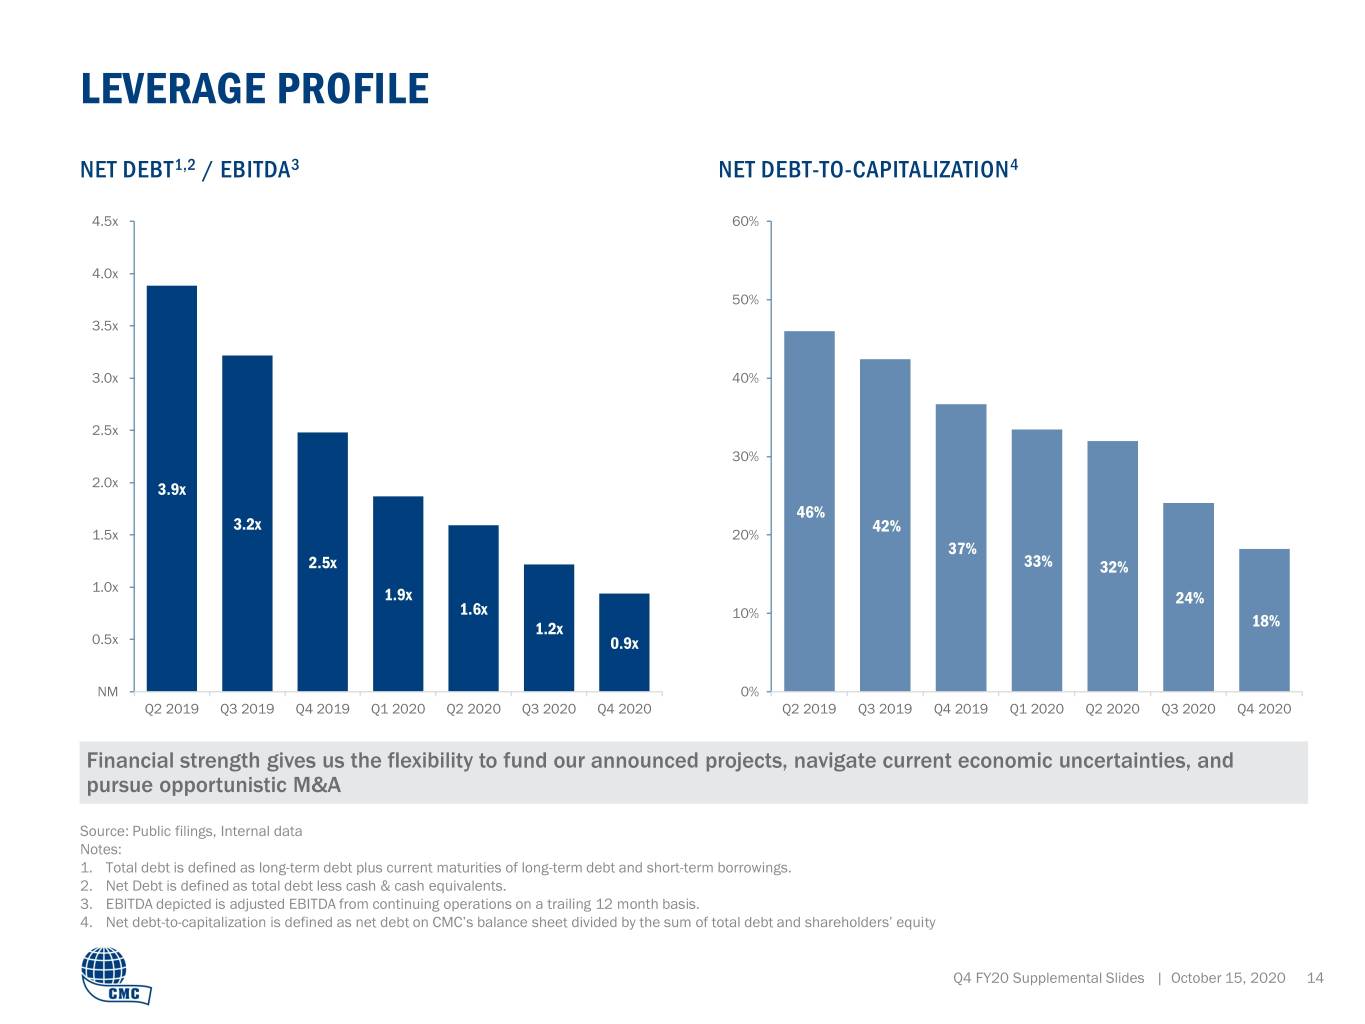
LEVERAGE PROFILE NET DEBT1,2 / EBITDA3 NET DEBT-TO-CAPITALIZATION4 4.5x 60% 4.0x 50% 3.5x 3.0x 40% 2.5x 30% 2.0x 3.9x 46% 3.2x 42% 1.5x 20% 37% 2.5x 33% 32% 1.0x 1.9x 24% 1.6x 10% 1.2x 18% 0.5x 0.9x NM 0% Q2 2019 Q3 2019 Q4 2019 Q1 2020 Q2 2020 Q3 2020 Q4 2020 Q2 2019 Q3 2019 Q4 2019 Q1 2020 Q2 2020 Q3 2020 Q4 2020 Financial strength gives us the flexibility to fund our announced projects, navigate current economic uncertainties, and pursue opportunistic M&A Source: Public filings, Internal data Notes: 1. Total debt is defined as long-term debt plus current maturities of long-term debt and short-term borrowings. 2. Net Debt is defined as total debt less cash & cash equivalents. 3. EBITDA depicted is adjusted EBITDA from continuing operations on a trailing 12 month basis. 4. Net debt-to-capitalization is defined as net debt on CMC’s balance sheet divided by the sum of total debt and shareholders’ equity Q4 FY20 Supplemental Slides | October 15, 2020 14

APPENDIX: NON-GAAP RECONCILIATIONS Q4 FY20 SupplementalQ4FY20 Slides | October 15,2020 15
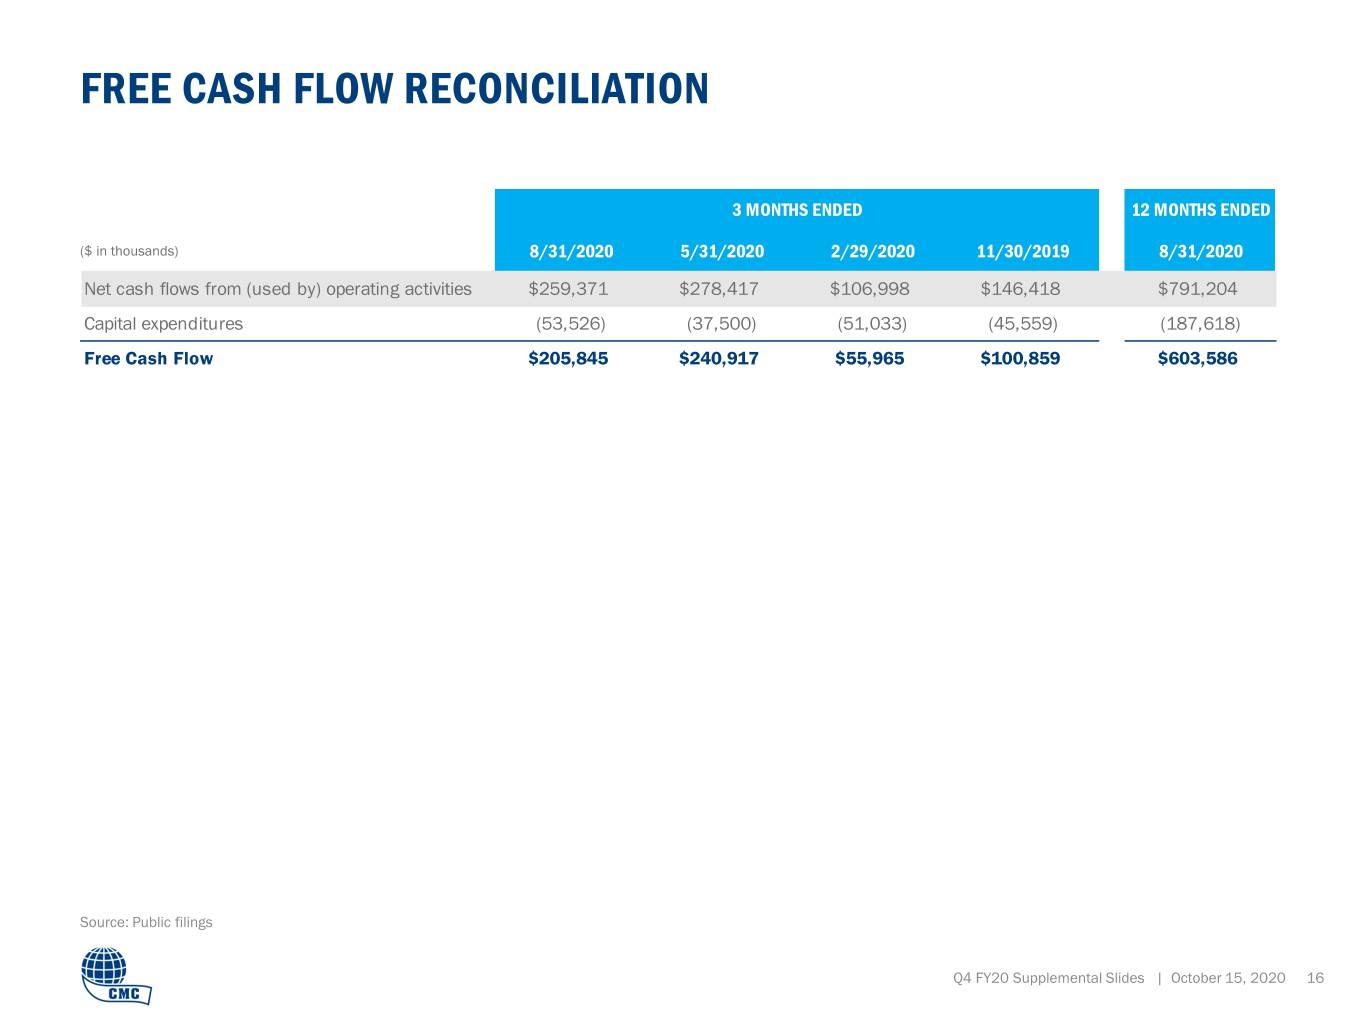
FREE CASH FLOW RECONCILIATION 3 MONTHS ENDED 12 MONTHS ENDED ($ in thousands) 8/31/2020 5/31/2020 2/29/2020 11/30/2019 8/31/2020 Net cash flows from (used by) operating activities $259,371 $278,417 $106,998 $146,418 $791,204 Capital expenditures (53,526) (37,500) (51,033) (45,559) (187,618) Free Cash Flow $205,845 $240,917 $55,965 $100,859 $603,586 Source: Public filings Q4 FY20 Supplemental Slides | October 15, 2020 16
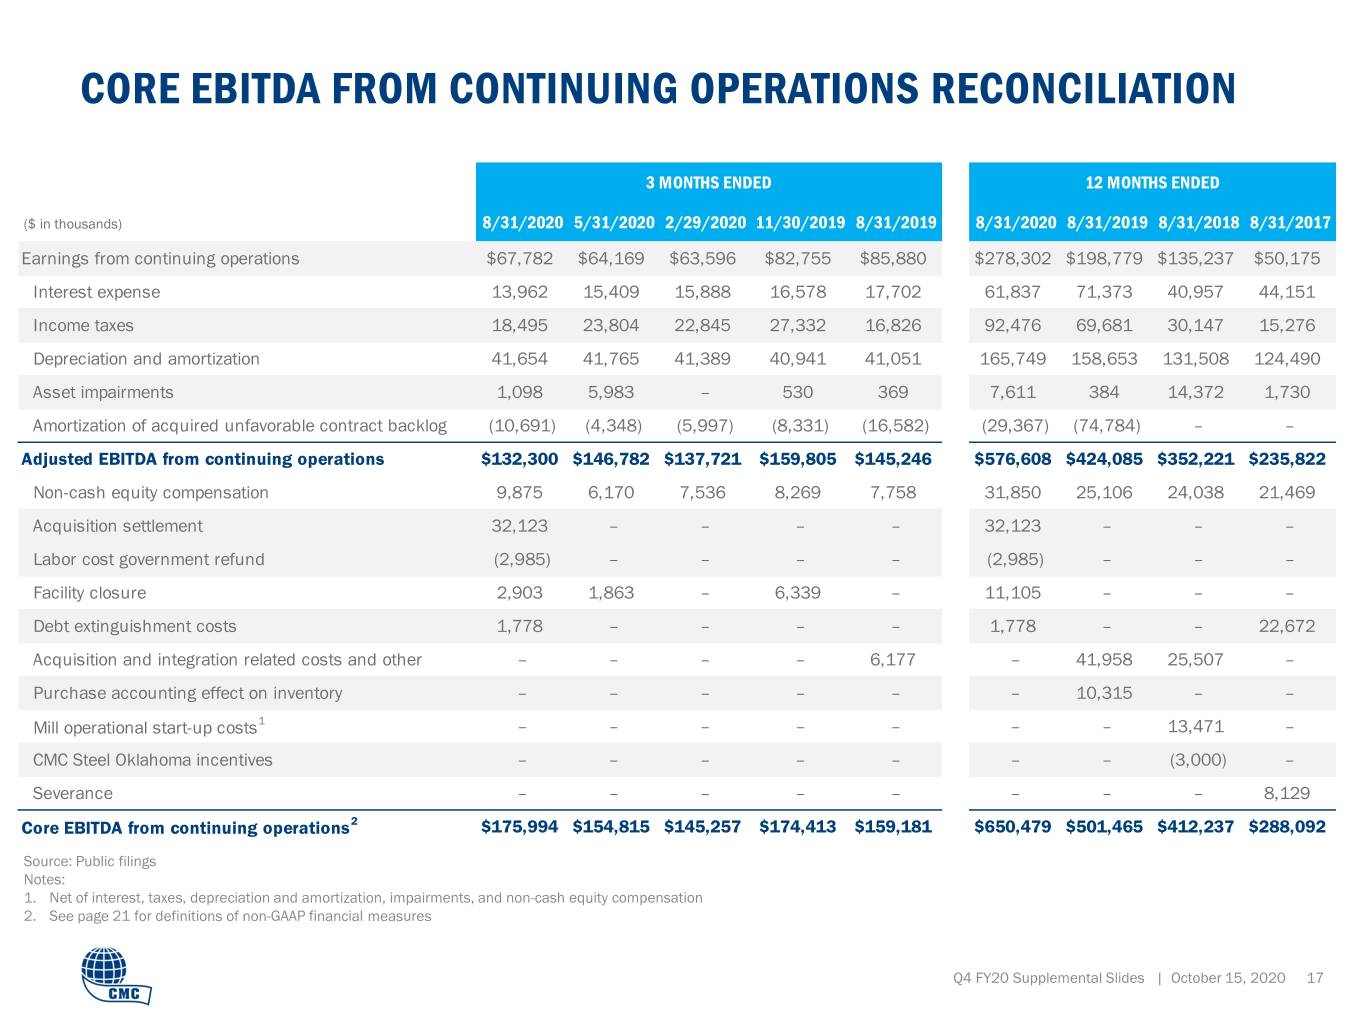
CORE EBITDA FROM CONTINUING OPERATIONS RECONCILIATION 3 MONTHS ENDED 12 MONTHS ENDED ($ in thousands) 8/31/2020 5/31/2020 2/29/2020 11/30/2019 8/31/2019 8/31/2020 8/31/2019 8/31/2018 8/31/2017 Earnings from continuing operations $67,782 $64,169 $63,596 $82,755 $85,880 $278,302 $198,779 $135,237 $50,175 Interest expense 13,962 15,409 15,888 16,578 17,702 61,837 71,373 40,957 44,151 Income taxes 18,495 23,804 22,845 27,332 16,826 92,476 69,681 30,147 15,276 Depreciation and amortization 41,654 41,765 41,389 40,941 41,051 165,749 158,653 131,508 124,490 Asset impairments 1,098 5,983 – 530 369 7,611 384 14,372 1,730 Amortization of acquired unfavorable contract backlog (10,691) (4,348) (5,997) (8,331) (16,582) (29,367) (74,784) – – Adjusted EBITDA from continuing operations $132,300 $146,782 $137,721 $159,805 $145,246 $576,608 $424,085 $352,221 $235,822 Non-cash equity compensation 9,875 6,170 7,536 8,269 7,758 31,850 25,106 24,038 21,469 Acquisition settlement 32,123 – – – – 32,123 – – – Labor cost government refund (2,985) – – – – (2,985) – – – Facility closure 2,903 1,863 – 6,339 – 11,105 – – – Debt extinguishment costs 1,778 – – – – 1,778 – – 22,672 Acquisition and integration related costs and other – – – – 6,177 – 41,958 25,507 – Purchase accounting effect on inventory – – – – – – 10,315 – – Mill operational start-up costs1 – – – – – – – 13,471 – CMC Steel Oklahoma incentives – – – – – – – (3,000) – Severance – – – – – – – – 8,129 Core EBITDA from continuing operations2 $175,994 $154,815 $145,257 $174,413 $159,181 $650,479 $501,465 $412,237 $288,092 Source: Public filings Notes: 1. Net of interest, taxes, depreciation and amortization, impairments, and non-cash equity compensation 2. See page 21 for definitions of non-GAAP financial measures Q4 FY20 Supplemental Slides | October 15, 2020 17
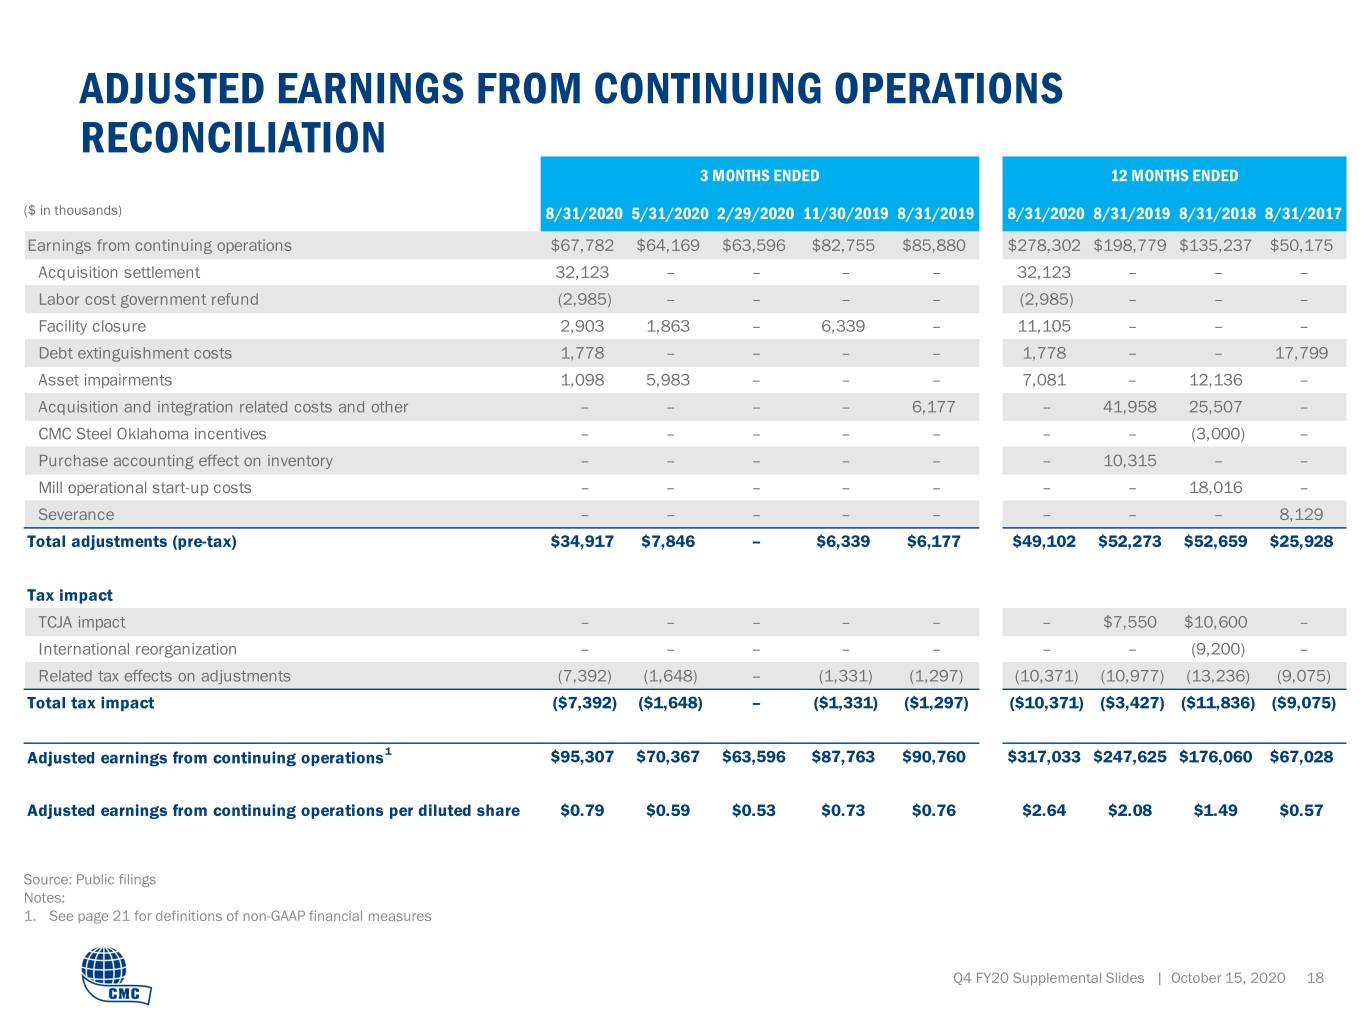
ADJUSTED EARNINGS FROM CONTINUING OPERATIONS RECONCILIATION 3 MONTHS ENDED 12 MONTHS ENDED ($ in thousands) 8/31/2020 5/31/2020 2/29/2020 11/30/2019 8/31/2019 8/31/2020 8/31/2019 8/31/2018 8/31/2017 Earnings from continuing operations $67,782 $64,169 $63,596 $82,755 $85,880 $278,302 $198,779 $135,237 $50,175 Acquisition settlement 32,123 – – – – 32,123 – – – Labor cost government refund (2,985) – – – – (2,985) – – – Facility closure 2,903 1,863 – 6,339 – 11,105 – – – Debt extinguishment costs 1,778 – – – – 1,778 – – 17,799 Asset impairments 1,098 5,983 – – – 7,081 – 12,136 – Acquisition and integration related costs and other – – – – 6,177 – 41,958 25,507 – CMC Steel Oklahoma incentives – – – – – – – (3,000) – Purchase accounting effect on inventory – – – – – – 10,315 – – Mill operational start-up costs – – – – – – – 18,016 – Severance – – – – – – – – 8,129 Total adjustments (pre-tax) $34,917 $7,846 – $6,339 $6,177 $49,102 $52,273 $52,659 $25,928 Tax impact TCJA impact – – – – – – $7,550 $10,600 – International reorganization – – – – – – – (9,200) – Related tax effects on adjustments (7,392) (1,648) – (1,331) (1,297) (10,371) (10,977) (13,236) (9,075) Total tax impact ($7,392) ($1,648) – ($1,331) ($1,297) ($10,371) ($3,427) ($11,836) ($9,075) Adjusted earnings from continuing operations 1 $95,307 $70,367 $63,596 $87,763 $90,760 $317,033 $247,625 $176,060 $67,028 Adjusted earnings from continuing operations per diluted share $0.79 $0.59 $0.53 $0.73 $0.76 $2.64 $2.08 $1.49 $0.57 Source: Public filings Notes: 1. See page 21 for definitions of non-GAAP financial measures Q4 FY20 Supplemental Slides | October 15, 2020 18
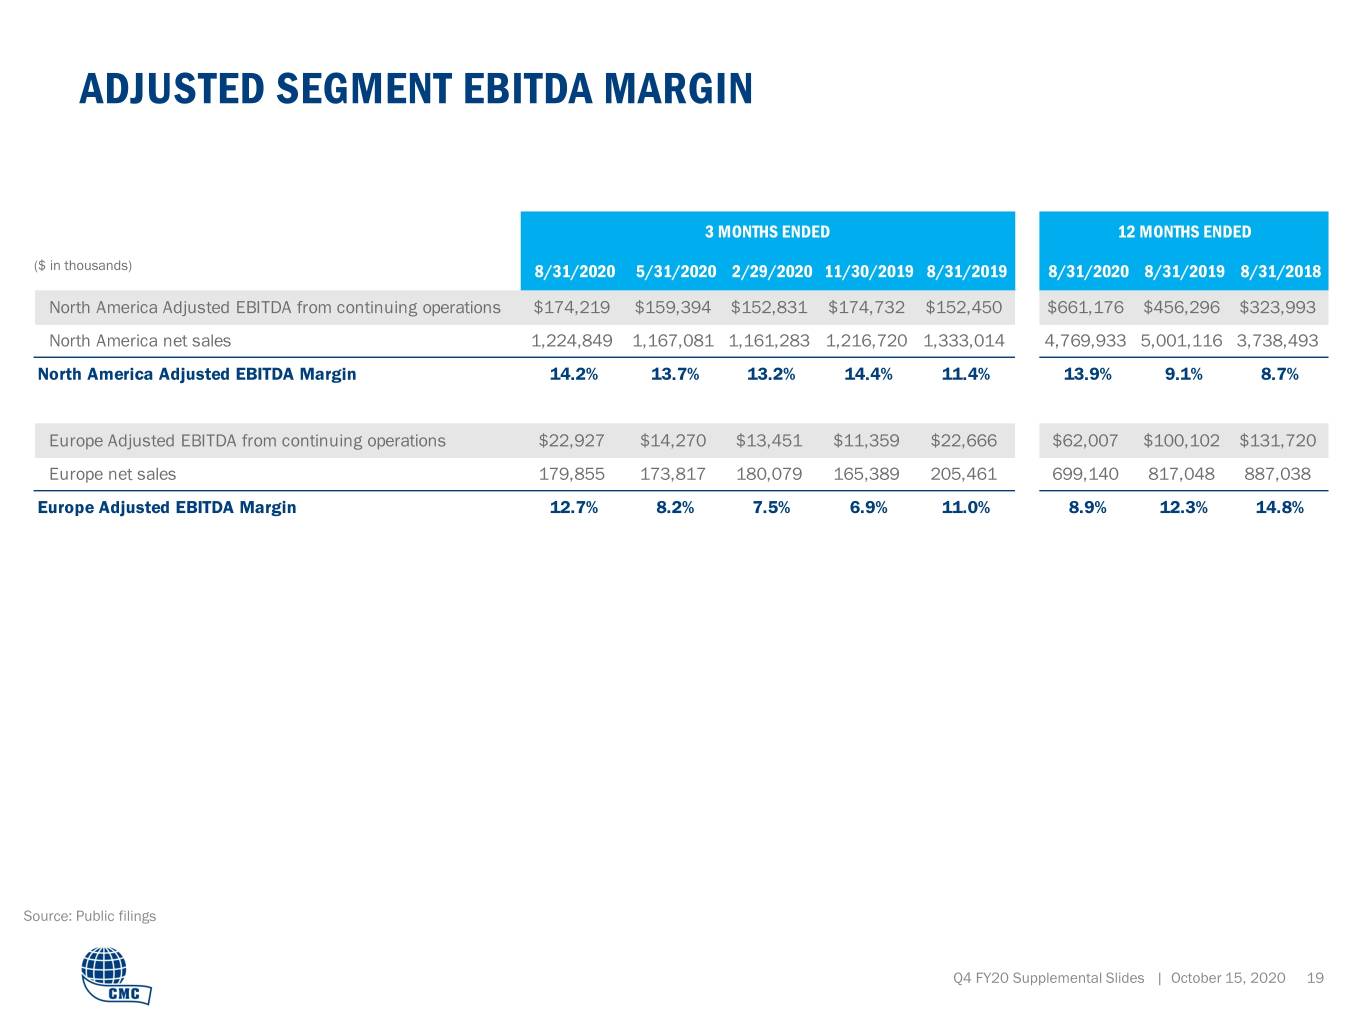
ADJUSTED SEGMENT EBITDA MARGIN 3 MONTHS ENDED 12 MONTHS ENDED ($ in thousands) 8/31/2020 5/31/2020 2/29/2020 11/30/2019 8/31/2019 8/31/2020 8/31/2019 8/31/2018 North America Adjusted EBITDA from continuing operations $174,219 $159,394 $152,831 $174,732 $152,450 $661,176 $456,296 $323,993 North America net sales 1,224,849 1,167,081 1,161,283 1,216,720 1,333,014 4,769,933 5,001,116 3,738,493 North America Adjusted EBITDA Margin 14.2% 13.7% 13.2% 14.4% 11.4% 13.9% 9.1% 8.7% Europe Adjusted EBITDA from continuing operations $22,927 $14,270 $13,451 $11,359 $22,666 $62,007 $100,102 $131,720 Europe net sales 179,855 173,817 180,079 165,389 205,461 699,140 817,048 887,038 Europe Adjusted EBITDA Margin 12.7% 8.2% 7.5% 6.9% 11.0% 8.9% 12.3% 14.8% Source: Public filings Q4 FY20 Supplemental Slides | October 15, 2020 19
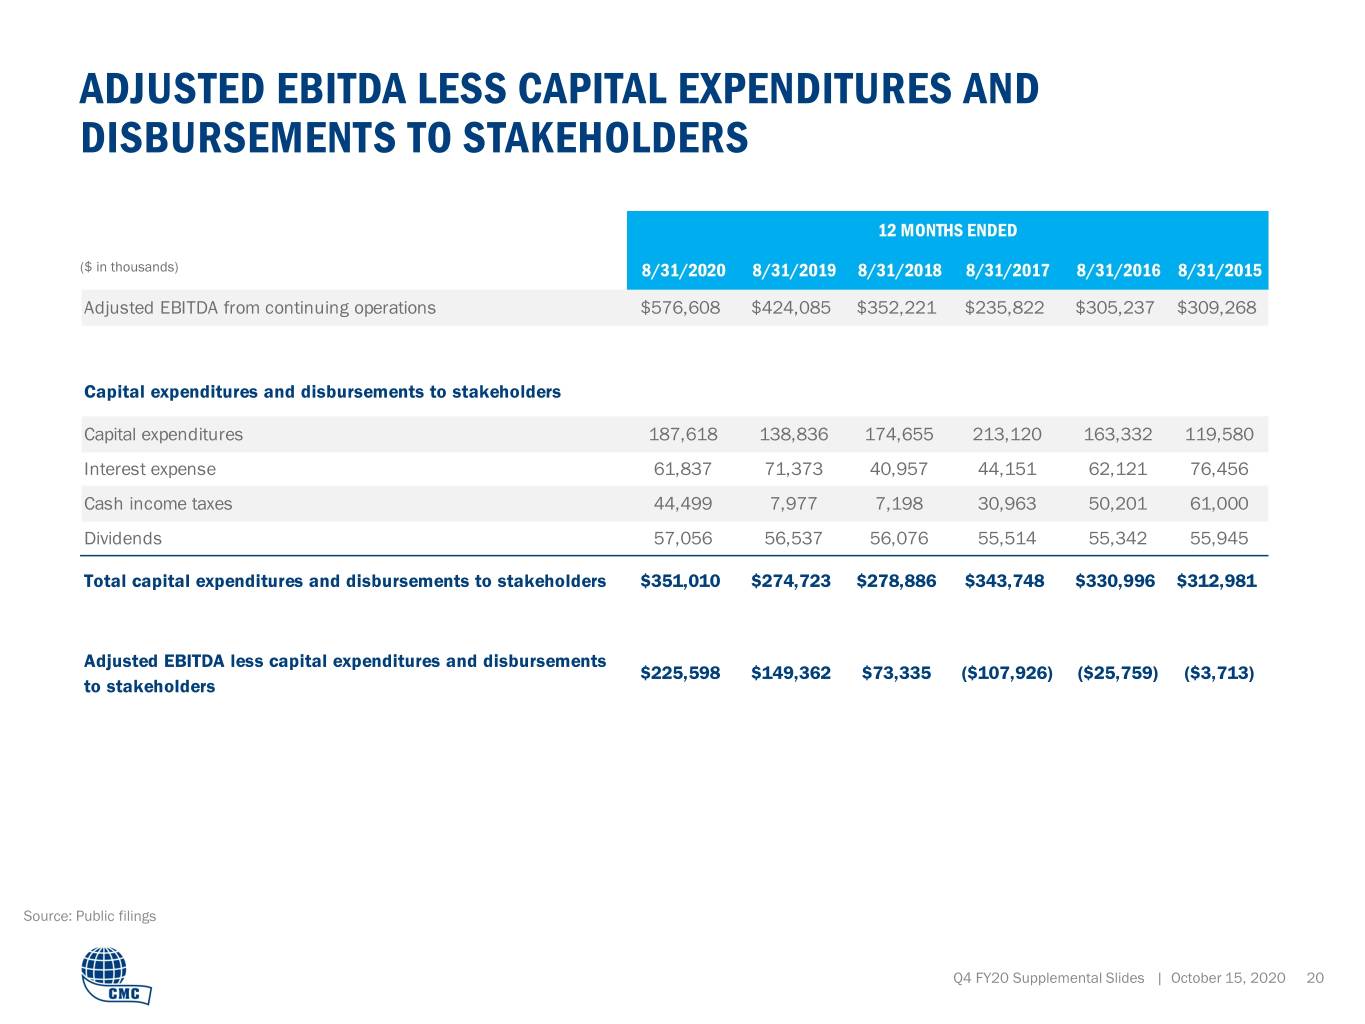
ADJUSTED EBITDA LESS CAPITAL EXPENDITURES AND DISBURSEMENTS TO STAKEHOLDERS 12 MONTHS ENDED ($ in thousands) 8/31/2020 8/31/2019 8/31/2018 8/31/2017 8/31/2016 8/31/2015 Adjusted EBITDA from continuing operations $576,608 $424,085 $352,221 $235,822 $305,237 $309,268 Capital expenditures and disbursements to stakeholders Capital expenditures 187,618 138,836 174,655 213,120 163,332 119,580 Interest expense 61,837 71,373 40,957 44,151 62,121 76,456 Cash income taxes 44,499 7,977 7,198 30,963 50,201 61,000 Dividends 57,056 56,537 56,076 55,514 55,342 55,945 Total capital expenditures and disbursements to stakeholders $351,010 $274,723 $278,886 $343,748 $330,996 $312,981 Adjusted EBITDA less capital expenditures and disbursements $225,598 $149,362 $73,335 ($107,926) ($25,759) ($3,713) to stakeholders Source: Public filings Q4 FY20 Supplemental Slides | October 15, 2020 20
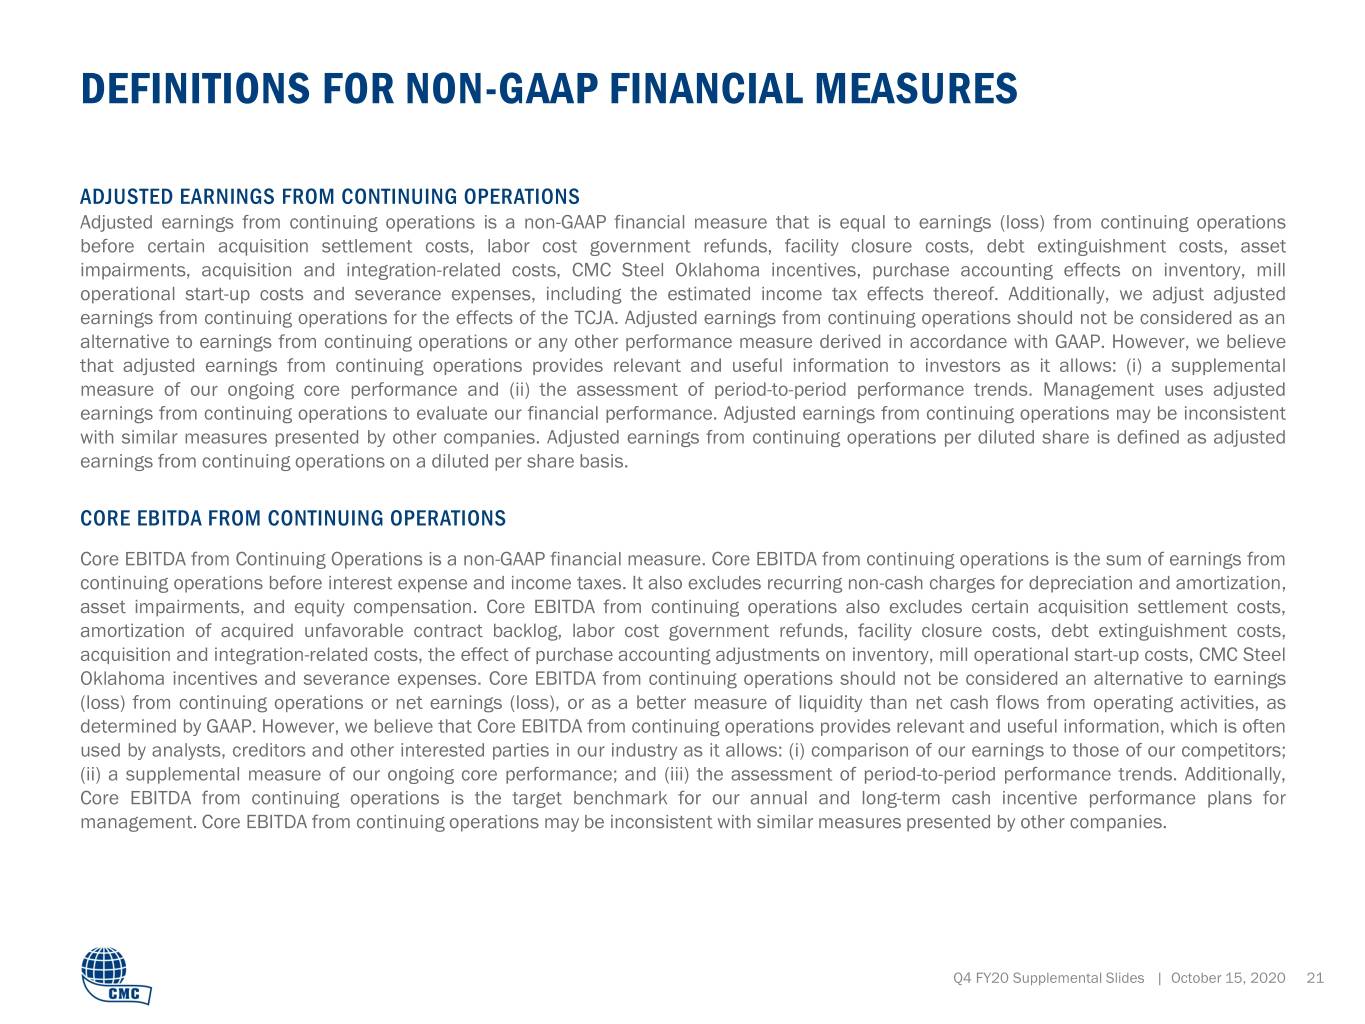
DEFINITIONS FOR NON-GAAP FINANCIAL MEASURES ADJUSTED EARNINGS FROM CONTINUING OPERATIONS Adjusted earnings from continuing operations is a non-GAAP financial measure that is equal to earnings (loss) from continuing operations before certain acquisition settlement costs, labor cost government refunds, facility closure costs, debt extinguishment costs, asset impairments, acquisition and integration-related costs, CMC Steel Oklahoma incentives, purchase accounting effects on inventory, mill operational start-up costs and severance expenses, including the estimated income tax effects thereof. Additionally, we adjust adjusted earnings from continuing operations for the effects of the TCJA. Adjusted earnings from continuing operations should not be considered as an alternative to earnings from continuing operations or any other performance measure derived in accordance with GAAP. However, we believe that adjusted earnings from continuing operations provides relevant and useful information to investors as it allows: (i) a supplemental measure of our ongoing core performance and (ii) the assessment of period-to-period performance trends. Management uses adjusted earnings from continuing operations to evaluate our financial performance. Adjusted earnings from continuing operations may be inconsistent with similar measures presented by other companies. Adjusted earnings from continuing operations per diluted share is defined as adjusted earnings from continuing operations on a diluted per share basis. CORE EBITDA FROM CONTINUING OPERATIONS Core EBITDA from Continuing Operations is a non-GAAP financial measure. Core EBITDA from continuing operations is the sum of earnings from continuing operations before interest expense and income taxes. It also excludes recurring non-cash charges for depreciation and amortization, asset impairments, and equity compensation. Core EBITDA from continuing operations also excludes certain acquisition settlement costs, amortization of acquired unfavorable contract backlog, labor cost government refunds, facility closure costs, debt extinguishment costs, acquisition and integration-related costs, the effect of purchase accounting adjustments on inventory, mill operational start-up costs, CMC Steel Oklahoma incentives and severance expenses. Core EBITDA from continuing operations should not be considered an alternative to earnings (loss) from continuing operations or net earnings (loss), or as a better measure of liquidity than net cash flows from operating activities, as determined by GAAP. However, we believe that Core EBITDA from continuing operations provides relevant and useful information, which is often used by analysts, creditors and other interested parties in our industry as it allows: (i) comparison of our earnings to those of our competitors; (ii) a supplemental measure of our ongoing core performance; and (iii) the assessment of period-to-period performance trends. Additionally, Core EBITDA from continuing operations is the target benchmark for our annual and long-term cash incentive performance plans for management. Core EBITDA from continuing operations may be inconsistent with similar measures presented by other companies. Q4 FY20 Supplemental Slides | October 15, 2020 21
THANK YOU CORPORATE OFFICE 6565 N. MacArthur Blvd Suite 800 Irving, TX 75039 Phone: (214) 689.4300 INVESTOR RELATIONS Phone: (972) 308.5349 Fax: (214) 689.4326 [email protected] Q4 FY20 Supplemental Slides | October 15, 2020 22