
ENTG 8-K
Entegris Inc (ENTG)
8-K
2022-08-02
For: 2022-08-02
View Original
Added on
April 09, 2026
UNITED STATES
SECURITIES AND EXCHANGE COMMISSION
Washington, D.C. 20549
________________________________________
FORM 8-K
________________________________________
CURRENT REPORT
PURSUANT TO SECTIONS 13 OR 15(d)
OF THE SECURITIES EXCHANGE ACT OF 1934
Date of report (Date of earliest event reported) August 2, 2022
 | ||
_______________________________________
Entegris, Inc.
(Exact name of registrant as specified in its charter)
_______________________________________
| (State or Other Jurisdiction of Incorporation) | (Commission File Number) | (I.R.S. Employer Identification No.) | ||||||||||||
| (Address of principal executive offices) | (Zip Code) | ||||||||||||||||
(978 ) 436-6500
(Registrant’s telephone number, including area code)
N/A
(Former Name or Former Address, if Changed Since Last Report)
___________________________________________________
Check the appropriate box below if the Form 8-K filing is intended to simultaneously satisfy the filing obligation of the registrant under any of the following provisions:
Securities registered pursuant to Section 12(b) of the Act:
| Title of each class | Trading Symbol(s) | Name of each exchange on which registered | ||||||||||||
Indicate by check mark whether the registrant is an emerging growth company as defined in Rule 405 of the Securities Act of 1933 (§230.405 of this chapter) or Rule 12b-2 of the Securities Exchange Act of 1934 (§240.12b-2 of this chapter).
Emerging growth company ☐
If an emerging growth company, indicate by check mark if the registrant has elected not to use the extended transition period for complying with any new or revised financial accounting standards provided pursuant to Section 13(a) of the Exchange Act. ☐
Item 2.02. Results of Operations and Financial Condition.
On August 2, 2022, Entegris, Inc. issued a press release to announce results for the second quarter of 2022 and will hold a conference call to discuss such results. A copy of this press release and the supplemental slides to which management will refer during the conference call are attached hereto as Exhibit 99.1 and Exhibit 99.2, respectively, and are incorporated herein by reference.
In accordance with General Instructions B.2 of Form 8-K, the information in this Item 2.02 shall not be deemed “filed” for purposes of Section 18 of the Securities Exchange Act of 1934, as amended, or otherwise subject to the liabilities of that section, nor shall such information be deemed incorporated by reference in any filing under the Securities Act of 1933, as amended, except as shall be expressly set forth by specific reference in such a filing. The information set forth herein will not be deemed an admission as to the materiality of any information required to be disclosed solely to satisfy the requirements of Regulation FD.
Item 9.01. Financial Statements and Exhibits.
(d) Exhibits
| EXHIBIT INDEX | ||||||||
| Exhibit No. | Description | |||||||
| 99.1 | ||||||||
| 99.2 | ||||||||
| 104 | Cover Page Interactive Data File (embedded within the Inline XBRL document) | |||||||
SIGNATURE
Pursuant to the requirements of the Securities Exchange Act of 1934, the registrant has duly caused this report to be signed on its behalf by the undersigned thereunto duly authorized.
| ENTEGRIS, INC. | ||||||||
| Dated: August 2, 2022 | By: | /s/ Gregory B. Graves | ||||||
| Name: | Gregory B. Graves | |||||||
| Title: | Executive Vice President and Chief Financial Officer | |||||||
 | PRESS RELEASE Bill Seymour VP of Investor Relations T + 1 952 556 1844 | |||||||||||||
Exhibit 99.1
FOR RELEASE AT 6:00 AM EDT
ENTEGRIS REPORTS RESULTS FOR SECOND QUARTER OF 2022
•Second-quarter revenue of $692 million, increased 21% from prior year
•Second-quarter GAAP diluted EPS of $0.73, increased 12%
•Second-quarter non-GAAP diluted EPS of $1.00, increased 18%
BILLERICA, Mass., August 2, 2022 - Entegris, Inc. (NASDAQ: ENTG), today reported its financial results for the Company’s second quarter ended July 2, 2022. Second-quarter sales were $692.5 million, an increase of 21% from the same quarter last year. Second-quarter GAAP net income was $99.5 million, or $0.73 per diluted share, which included $12.5 million of amortization of intangible assets, $10.2 million of integration costs, $2.4 million of deal and transaction costs and $22.7 million interest expense, net. Non-GAAP net income was $136.8 million for the second quarter and non-GAAP earnings per diluted share was $1.00. Entegris’ acquisition of CMC Materials closed on July 6, 2022. As a result, Entegris’ second quarter 2022 results do not include results from CMC Materials third fiscal quarter of 2022 (ending June 30).
Bertrand Loy, Entegris’ president and chief executive officer, said: “Sales growth and operational execution were once again very strong in the second quarter. Growth was significant across all three divisions, driven by demand for our solutions and great execution by our supply chain teams. In particular, we saw robust activity at the advanced nodes, where we enjoy greater Entegris content per wafer. Non-GAAP EPS was slightly below our expectations in the second quarter, primarily due to a significant decline in a few major currencies versus the U.S. Dollar.”
Mr. Loy added: “We are very excited about our combination with CMC Materials, which uniquely positions Entegris to address our customers’ most demanding process challenges and helps them achieve a faster time-to-solution. Our focus going forward, will be rapidly and effectively completing the integration of CMC Materials, driving revenue and cost synergies, and paying down the debt.”
Mr. Loy added: “For the full year 2022, we expect to achieve strong growth on a proforma basis. Looking further ahead, we will be pragmatic, closely monitoring industry developments, and ready to make adjustments as needed. And with 80 percent of our revenue now unit driven, our model should prove to be even more resilient, regardless of the macro environment.”
Quarterly Financial Results Summary
(in thousands, except percentages and per share data)
| GAAP Results | July 2, 2022 | July 3, 2021 | April 2, 2022 | ||||||||
| Net sales | $692,489 | $571,352 | $649,646 | ||||||||
| Operating income | $157,970 | $138,889 | $163,346 | ||||||||
| Operating margin - as a % of net sales | 22.8 | % | 24.3 | % | 25.1 | % | |||||
| Net income | $99,491 | $88,770 | $125,705 | ||||||||
| Diluted earnings per common share | $0.73 | $0.65 | $0.92 | ||||||||
| Non-GAAP Results | |||||||||||
| Non-GAAP adjusted operating income | $183,039 | $151,603 | $182,251 | ||||||||
| Non-GAAP adjusted operating margin - as a % of net sales | 26.4 | % | 26.5 | % | 28.1 | % | |||||
| Non-GAAP net income | $136,816 | $116,711 | $145,133 | ||||||||
| Diluted non-GAAP earnings per common share | $1.00 | $0.85 | $1.06 | ||||||||
Third-Quarter Outlook
For the third quarter ending October 1, 2022, the Company expects sales (for the combined company) of $1.00 billion to $1.04 billion and EBITDA of approximately 30 percent of sales. The foregoing forward looking guidance measures (other than revenue) are provided on a non-GAAP basis without a reconciliation to the most directly comparable GAAP measure because the Company is unable to predict with a reasonable degree of certainty certain items contained in the forward looking GAAP measures without unreasonable efforts. Such items include, but are not limited to, acquisition related expenses, restructuring and related expenses, share-based compensation and other items not reflective of the Company's ongoing operations.
Segment Results
The Company reports its results in the following segments:
Specialty Chemicals and Engineered Materials (SCEM): SCEM provides high-performance and high-purity process chemistries, gases and materials, and safe and efficient delivery systems to support semiconductor and other advanced manufacturing processes.
Microcontamination Control (MC): MC offers solutions to filter and purify critical liquid chemistries and gases used in semiconductor manufacturing processes and other high-technology industries.
Advanced Materials Handling (AMH): AMH develops solutions to monitor, protect, transport and deliver critical liquid chemistries, wafers and other substrates for a broad set of applications in the semiconductor, life sciences and other high-technology industries.
Second-Quarter Results Conference Call Details
Entegris will hold a conference call to discuss its results for the second quarter on Tuesday, August 2, 2022, at 9:00 a.m. Eastern Time. Participants should dial 888-220-8451 or +1 323-794-2588, referencing confirmation code 8913803. Participants are asked to dial in 5 to 10 minutes prior to the start of the call. For a replay of the call, please Click Here using passcode 8913803. The on-demand playback will be available for six weeks after the conclusion of the teleconference. The call can also be accessed live and on-demand from the Investor Relations section of www.entegris.com.
Management’s slide presentation concerning the results for the second quarter will be posted on the Investor Relations section of www.entegris.com Tuesday morning before the call.
Entegris, Inc. - page 2 of 13
About Entegris
Entegris is the global leader in electronic materials for the semiconductor market. With approximately 8,800 employees across its global operations, Entegris offers the industry’s most comprehensive and innovative unit-driven end-to-end offering for semiconductor customers, in addition to solutions for the life sciences and other advanced manufacturing environments. Entegris’ solutions help customers improve their performance, productivity and yields to enable technologies that transform the world. It has manufacturing, customer service, and/or research facilities in the United States, Canada, China, France, Germany, Israel, Japan, Malaysia, Singapore, South Korea, and Taiwan. For more information about Entegris, visit us at
www.entegris.com, or follow us on LinkedIn, Twitter, Facebook, and Instagram.
Non-GAAP Information
The Company’s condensed consolidated financial statements are prepared in conformity with accounting principles generally accepted in the United States (GAAP). Adjusted EBITDA, adjusted gross profit, adjusted segment profit, adjusted operating income, non-GAAP net income, non-GAAP adjusted operating margin and diluted non-GAAP earnings per common share, together with related measures thereof, are considered “non-GAAP financial measures” under the rules and regulations of the Securities and Exchange Commission. The presentation of this financial information is not intended to be considered in isolation or as a substitute for, or superior to, the financial information prepared and presented in accordance with GAAP. The Company provides supplemental non-GAAP financial measures to better understand and manage its business and believes these measures provide investors and analysts additional and meaningful information for the assessment of the Company’s ongoing results. Management also uses these non-GAAP measures to assist in the evaluation of the performance of its business segments and to make operating decisions. Management believes that the Company’s non-GAAP measures help indicate the Company’s baseline performance before certain gains, losses or other charges that may not be indicative of the Company’s business or future outlook, and that non-GAAP measures offer a more consistent view of business performance. The Company believes the non-GAAP measures aid investors’ overall understanding of the Company’s results by providing a higher degree of transparency for such items and providing a level of disclosure that will help investors generally understand how management plans, measures and evaluates the Company’s business performance. Management believes that the inclusion of non-GAAP measures provides greater consistency in its financial reporting and facilitates investors’ understanding of the Company’s historical operating trends by providing an additional basis for comparisons to prior periods. The reconciliations of GAAP gross profit to adjusted gross profit, GAAP segment profit to adjusted operating income, GAAP net income to adjusted operating income and adjusted EBITDA, GAAP net income and diluted earnings per common share to non-GAAP net income and diluted non-GAAP earnings per common share and GAAP outlook to non-GAAP outlook are included elsewhere in this release.
Cautionary Note on Forward Looking Statements
This news release contains forward looking statements. The words “believe,” “expect,” “anticipate,” “intend,” “estimate,” “forecast,” “project,” “should,” “may,” “will,” “would” or the negative thereof and similar expressions are intended to identify such forward looking statements. These forward looking statements may include statements about the ongoing impacts of the COVID-19 pandemic and the conflict in Ukraine on the Company’s operations and markets, including supply chain issues and inflationary pressures related thereto; future period guidance or projections; the Company’s performance relative to its markets, including the drivers of such performance; market and technology trends, including the duration and drivers of any growth trends and the impact of the COVID-19 pandemic on such trends; the development of new products and the success of their introductions; the focus of the Company’s engineering, research and development projects; the Company’s ability to execute on our business strategies, including with respect to Company’s expansion of its manufacturing presence in Taiwan; the Company’s capital allocation strategy, which may be modified at any time for any reason, including share repurchases, dividends, debt repayments and potential acquisitions; the impact of the acquisitions the Company has made and commercial partnerships the Company has established, including the acquisition of CMC Materials, Inc. (“CMC Materials”); trends relating to the fluctuation of currency exchange rates; future capital and other expenditures, including estimates thereof; the Company’s expected tax rate; the impact, financial or otherwise, of any organizational changes; the impact of accounting pronouncements; quantitative and qualitative disclosures about market risk; and other matters. These forward looking statements are based on current management expectations and assumptions only as of the date of this Quarterly Report, are not guarantees of future performance and involve substantial risks and uncertainties that are difficult to predict and that could cause actual results to differ materially from the results expressed in, or implied by, these forward looking statements. These risks and uncertainties include, but are not limited to, weakening of global and/or regional economic conditions, generally or specifically in the semiconductor industry, which could decrease the demand for the Company’s products and solutions; the level of, and obligations associated with, the Company’s indebtedness, including the debts incurred in connection with the acquisition of CMC Materials; risks related to the acquisition and integration of CMC Materials, including unanticipated difficulties or expenditures relating thereto; the ability to achieve the anticipated synergies and value-creation contemplated by the acquisition of CMC Materials and the diversion of management time on transaction-related matters;
Entegris, Inc. - page 3 of 13
risks related to the COVID-19 pandemic on the global economy and financial markets, as well as on the Company, its customers and suppliers, which may impact its sales, gross margin, customer demand and its ability to supply its products to its customers; raw material shortages, supply and labor constraints and price increases or pricing and inflationary pressures; operational, political and legal risks of the Company’s international operations; the Company’s dependence on sole source and limited source suppliers; the Company’s ability to meet rapid demand shifts; the Company’s ability to continue technological innovation and introduce new products to meet customers’ rapidly changing requirements; substantial competition; the Company’s concentrated customer base; the Company’s ability to identify, complete and integrate acquisitions, joint ventures or other transactions; the Company’s ability to effectively implement any organizational changes; the Company’s ability to protect and enforce intellectual property rights; the ongoing conflict in Ukraine and the global response thereto; the increasing complexity of certain manufacturing processes; changes in government regulations of the countries in which the Company operates, including the imposition of tariffs, export controls and other trade laws and restrictions and changes to foreign and national security policy, especially as they relate to China; fluctuation of currency exchange rates; fluctuations in the market price of the Company’s stock; and other risk factors and additional information described in the Company’s filings with the Securities and Exchange Commission, including under the heading “Risk Factors” in Item 1A of the Company’s Annual Report on Form 10-K for the fiscal year ended December 31, 2021, filed on February 4, 2022, in Item 1A of the Company’s Quarterly Report on Form 10-Q for the period ended April 2, 2022, filed on April 26, 2022, and in the Company’s other periodic filings. Except as required under the federal securities laws and the rules and regulations of the Securities and Exchange Commission, the Company undertakes no obligation to update publicly any forward-looking statements or information contained herein, which speak as of their respective dates.
Entegris, Inc. - page 4 of 13
Entegris, Inc. and Subsidiaries
Condensed Consolidated Statements of Operations
(In thousands, except per share data)
(Unaudited)
| Three months ended | ||||||||||||||
| July 2, 2022 | July 3, 2021 | April 2, 2022 | ||||||||||||
| Net sales | $692,489 | $571,352 | $649,646 | |||||||||||
| Cost of sales | 382,092 | 305,968 | 339,826 | |||||||||||
| Gross profit | 310,397 | 265,384 | 309,820 | |||||||||||
| Selling, general and administrative expenses | 90,685 | 72,621 | 87,108 | |||||||||||
| Engineering, research and development expenses | 49,248 | 41,972 | 46,715 | |||||||||||
| Amortization of intangible assets | 12,494 | 11,902 | 12,651 | |||||||||||
| Operating income | 157,970 | 138,889 | 163,346 | |||||||||||
| Interest expense, net | 31,343 | 10,643 | 12,864 | |||||||||||
| Other expense, net | 9,619 | 23,560 | 4,902 | |||||||||||
| Income before income tax expense | 117,008 | 104,686 | 145,580 | |||||||||||
| Income tax expense | 17,517 | 15,916 | 19,875 | |||||||||||
| Net income | $99,491 | $88,770 | $125,705 | |||||||||||
| Basic earnings per common share: | $0.73 | $0.66 | $0.93 | |||||||||||
| Diluted earnings per common share: | $0.73 | $0.65 | $0.92 | |||||||||||
| Weighted average shares outstanding: | ||||||||||||||
| Basic | 135,895 | 135,498 | 135,670 | |||||||||||
| Diluted | 136,454 | 136,533 | 136,552 | |||||||||||
Entegris, Inc. - page 5 of 13
Entegris, Inc. and Subsidiaries
Condensed Consolidated Statements of Operations
(In thousands, except per share data)
(Unaudited)
| Six months ended | |||||||||||
| July 2, 2022 | July 3, 2021 | ||||||||||
| Net sales | $1,342,135 | $1,084,196 | |||||||||
| Cost of sales | 721,918 | 583,826 | |||||||||
| Gross profit | 620,217 | 500,370 | |||||||||
| Selling, general and administrative expenses | 177,793 | 144,010 | |||||||||
| Engineering, research and development expenses | 95,963 | 79,720 | |||||||||
| Amortization of intangible assets | 25,145 | 23,773 | |||||||||
| Operating income | 321,316 | 252,867 | |||||||||
| Interest expense, net | 44,207 | 22,224 | |||||||||
| Other expense, net | 14,521 | 27,890 | |||||||||
| Income before income tax expense | 262,588 | 202,753 | |||||||||
| Income tax expense | 37,392 | 29,307 | |||||||||
| Net income | $225,196 | $173,446 | |||||||||
| Basic earnings per common share: | $1.66 | $1.28 | |||||||||
| Diluted earnings per common share: | $1.65 | $1.27 | |||||||||
| Weighted average shares outstanding: | |||||||||||
| Basic | 135,783 | 135,283 | |||||||||
| Diluted | 136,503 | 136,518 | |||||||||
Entegris, Inc. - page 6 of 13
Entegris, Inc. and Subsidiaries
Condensed Consolidated Balance Sheets
(In thousands)
(Unaudited)
| July 2, 2022 | December 31, 2021 | ||||||||||||||||
| ASSETS | |||||||||||||||||
| Current assets: | |||||||||||||||||
| Cash, cash equivalents and restricted cash | $2,743,231 | $402,565 | |||||||||||||||
| Trade accounts and notes receivable, net | 381,251 | 347,413 | |||||||||||||||
| Inventories, net | 583,766 | 475,213 | |||||||||||||||
| Deferred tax charges and refundable income taxes | 38,907 | 35,312 | |||||||||||||||
| Other current assets | 129,003 | 52,867 | |||||||||||||||
| Total current assets | 3,876,158 | 1,313,370 | |||||||||||||||
| Property, plant and equipment, net | 779,631 | 654,098 | |||||||||||||||
| Other assets: | |||||||||||||||||
| Right-of-use assets | 68,389 | 66,563 | |||||||||||||||
| Goodwill | 789,540 | 793,702 | |||||||||||||||
| Intangible assets, net | 308,871 | 335,113 | |||||||||||||||
| Deferred tax assets and other noncurrent tax assets | 26,549 | 17,671 | |||||||||||||||
| Other | 12,033 | 11,379 | |||||||||||||||
| Total assets | $5,861,171 | $3,191,896 | |||||||||||||||
| LIABILITIES AND EQUITY | |||||||||||||||||
| Current liabilities | |||||||||||||||||
| Accounts payable | $146,441 | $130,734 | |||||||||||||||
| Accrued liabilities | 198,171 | 199,131 | |||||||||||||||
| Income tax payable | 48,523 | 49,136 | |||||||||||||||
| Total current liabilities | 393,135 | 379,001 | |||||||||||||||
| Long-term debt, excluding current maturities | 3,408,801 | 937,027 | |||||||||||||||
| Long-term lease liability | 60,893 | 60,101 | |||||||||||||||
| Other liabilities | 85,628 | 101,986 | |||||||||||||||
| Shareholders’ equity | 1,912,714 | 1,713,781 | |||||||||||||||
| Total liabilities and equity | $5,861,171 | $3,191,896 | |||||||||||||||
Entegris, Inc. - page 7 of 13
Entegris, Inc. and Subsidiaries
Condensed Consolidated Statements of Cash Flows
(In thousands)
(Unaudited)
| Three months ended | Six months ended | |||||||||||||
| July 2, 2022 | July 3, 2021 | July 2, 2022 | July 3, 2021 | |||||||||||
| Operating activities: | ||||||||||||||
| Net income | $99,491 | $88,770 | $225,196 | $173,446 | ||||||||||
| Adjustments to reconcile net income to net cash provided by operating activities: | ||||||||||||||
| Depreciation | 24,381 | 22,574 | 48,286 | 44,669 | ||||||||||
| Amortization | 12,494 | 11,902 | 25,145 | 23,773 | ||||||||||
| Share-based compensation expense | 10,182 | 7,519 | 19,467 | 14,657 | ||||||||||
| Loss on extinguishment of debt and modification | — | 23,338 | — | 23,338 | ||||||||||
| Other | 8,492 | (8,369) | 8,687 | (203) | ||||||||||
| Changes in operating assets and liabilities, net of effects of acquisitions: | ||||||||||||||
| Trade accounts and notes receivable | (26,138) | (26,667) | (57,309) | (48,231) | ||||||||||
| Inventories | (47,465) | (30,386) | (124,941) | (69,723) | ||||||||||
| Accounts payable and accrued liabilities | 49,468 | 13,244 | 27,145 | (15,347) | ||||||||||
| Income taxes payable, refundable income taxes and noncurrent taxes payable | (20,308) | (22,854) | (3,548) | (26,442) | ||||||||||
| Other | 313 | 2,784 | 6,570 | 15,033 | ||||||||||
| Net cash provided by operating activities | 110,910 | 81,855 | 174,698 | 134,970 | ||||||||||
| Investing activities: | ||||||||||||||
| Acquisition of property and equipment | (107,692) | (41,771) | (192,097) | (85,101) | ||||||||||
| Acquisition of business, net of cash acquired | — | (2,250) | — | (2,250) | ||||||||||
| Other | — | 18 | 1,123 | 90 | ||||||||||
| Net cash used in investing activities | (107,692) | (44,003) | (190,974) | (87,261) | ||||||||||
| Financing activities: | ||||||||||||||
| Proceeds from revolving credit facility and long-term debt | 2,527,314 | 451,000 | 2,606,314 | 451,000 | ||||||||||
| Payments of revolving credit facility and long-term debt | (114,000) | (601,000) | (193,000) | (601,000) | ||||||||||
| Payments for debt extinguishment costs | — | (19,080) | — | (19,080) | ||||||||||
| Payments for dividends | (13,589) | (10,889) | (27,484) | (21,797) | ||||||||||
| Issuance of common stock | 5,598 | 15,245 | 8,977 | 16,817 | ||||||||||
| Taxes paid related to net share settlement of equity awards | (200) | (55) | (16,317) | (15,093) | ||||||||||
| Repurchase and retirement of common stock | — | (15,000) | — | (30,000) | ||||||||||
| Other | (10,204) | (4,800) | (11,166) | (4,801) | ||||||||||
| Net cash provided by (used in) financing activities | 2,394,919 | (184,579) | 2,367,324 | (223,954) | ||||||||||
| Effect of exchange rate changes on cash, cash equivalents and restricted cash | (7,638) | (760) | (10,382) | (3,615) | ||||||||||
| Increase (decrease) in cash, cash equivalents and restricted cash | 2,390,499 | (147,487) | 2,340,666 | (179,860) | ||||||||||
| Cash, cash equivalents and restricted cash at beginning of period | 352,732 | 548,520 | 402,565 | 580,893 | ||||||||||
| Cash, cash equivalents and restricted cash at end of period | $2,743,231 | $401,033 | $2,743,231 | $401,033 | ||||||||||
Entegris, Inc. - page 8 of 13
Entegris, Inc. and Subsidiaries
Segment Information
(In thousands)
(Unaudited)
| Three months ended | Six months ended | |||||||||||||||||||
| Net sales | July 2, 2022 | July 3, 2021 | April 2, 2022 | July 2, 2022 | July 3, 2021 | |||||||||||||||
| Specialty Chemicals and Engineered Materials | $207,729 | $180,366 | $196,421 | $404,150 | $346,907 | |||||||||||||||
| Microcontamination Control | 274,133 | 227,521 | 266,637 | 540,770 | 434,620 | |||||||||||||||
| Advanced Materials Handling | 224,084 | 172,502 | 198,113 | 422,197 | 321,043 | |||||||||||||||
| Inter-segment elimination | (13,457) | (9,037) | (11,525) | (24,982) | (18,374) | |||||||||||||||
| Total net sales | $692,489 | $571,352 | $649,646 | $1,342,135 | $1,084,196 | |||||||||||||||
| Three months ended | Six months ended | |||||||||||||||||||
| Segment profit | July 2, 2022 | July 3, 2021 | April 2, 2022 | July 2, 2022 | July 3, 2021 | |||||||||||||||
| Specialty Chemicals and Engineered Materials | $45,718 | $44,945 | $48,851 | $94,569 | $79,501 | |||||||||||||||
| Microcontamination Control | 100,107 | 78,132 | 98,618 | 198,725 | 148,698 | |||||||||||||||
| Advanced Materials Handling | 46,926 | 42,093 | 46,690 | 93,616 | 74,188 | |||||||||||||||
| Total segment profit | 192,751 | 165,170 | 194,159 | 386,910 | 302,387 | |||||||||||||||
| Amortization of intangibles | 12,494 | 11,902 | 12,651 | 25,145 | 23,773 | |||||||||||||||
| Unallocated expenses | 22,287 | 14,379 | 18,162 | 40,449 | 25,747 | |||||||||||||||
| Total operating income | $157,970 | $138,889 | $163,346 | $321,316 | $252,867 | |||||||||||||||
Entegris, Inc. - page 9 of 13
Entegris, Inc. and Subsidiaries
Reconciliation of GAAP Gross Profit to Adjusted Gross Profit
(In thousands)
(Unaudited)
| Three months ended | Six months ended | |||||||||||||||||||
| July 2, 2022 | July 3, 2021 | April 2, 2022 | July 2, 2022 | July 3, 2021 | ||||||||||||||||
| Net sales | $692,489 | $571,352 | $649,646 | $1,342,135 | $1,084,196 | |||||||||||||||
| Gross profit-GAAP | $310,397 | $265,384 | $309,820 | $620,217 | $500,370 | |||||||||||||||
| Adjusted gross profit | $310,397 | $265,384 | $309,820 | $620,217 | $500,370 | |||||||||||||||
| Gross margin - as a % of net sales | 44.8 | % | 46.4 | % | 47.7 | % | 46.2 | % | 46.2 | % | ||||||||||
| Adjusted gross margin - as a % of net sales | 44.8 | % | 46.4 | % | 47.7 | % | 46.2 | % | 46.2 | % | ||||||||||
Entegris, Inc. - page 10 of 13
Entegris, Inc. and Subsidiaries
Reconciliation of GAAP Segment Profit to Adjusted Operating Income
(In thousands)
(Unaudited)
| Three months ended | Six months ended | |||||||||||||||||||
| Segment profit-GAAP | July 2, 2022 | July 3, 2021 | April 2, 2022 | July 2, 2022 | July 3, 2021 | |||||||||||||||
| Specialty Chemicals and Engineered Materials (SCEM) | $45,718 | $44,945 | $48,851 | $94,569 | $79,501 | |||||||||||||||
| Microcontamination Control (MC) | 100,107 | 78,132 | 98,618 | 198,725 | 148,698 | |||||||||||||||
| Advanced Materials Handling (AMH) | 46,926 | 42,093 | 46,690 | 93,616 | 74,188 | |||||||||||||||
| Total segment profit | 192,751 | 165,170 | 194,159 | 386,910 | 302,387 | |||||||||||||||
| Amortization of intangible assets | 12,494 | 11,902 | 12,651 | 25,145 | 23,773 | |||||||||||||||
| Unallocated expenses | 22,287 | 14,379 | 18,162 | 40,449 | 25,747 | |||||||||||||||
| Total operating income | $157,970 | $138,889 | $163,346 | $321,316 | $252,867 | |||||||||||||||
| Three months ended | Six months ended | |||||||||||||||||||
| Adjusted segment profit | July 2, 2022 | July 3, 2021 | April 2, 2022 | July 2, 2022 | July 3, 2021 | |||||||||||||||
| SCEM segment profit | $45,718 | $44,945 | $48,851 | $94,569 | $79,501 | |||||||||||||||
| Severance and restructuring costs | — | 51 | — | — | 98 | |||||||||||||||
| Charge for fair value write-up of acquired inventory sold | — | — | — | — | — | |||||||||||||||
| SCEM adjusted segment profit | $45,718 | $44,996 | $48,851 | $94,569 | $79,599 | |||||||||||||||
| MC segment profit | $100,107 | $78,132 | $98,618 | $198,725 | $148,698 | |||||||||||||||
| Severance and restructuring costs | — | 55 | — | — | 106 | |||||||||||||||
| MC adjusted segment profit | $100,107 | $78,187 | $98,618 | $198,725 | $148,804 | |||||||||||||||
| AMH segment profit | $46,926 | $42,093 | $46,690 | $93,616 | $74,188 | |||||||||||||||
| Severance and restructuring costs | — | 38 | — | — | 75 | |||||||||||||||
| AMH adjusted segment profit | $46,926 | $42,131 | $46,690 | $93,616 | $74,263 | |||||||||||||||
| Unallocated general and administrative expenses | $22,287 | $14,379 | $18,162 | $40,449 | $25,747 | |||||||||||||||
| Unallocated deal and integration costs | (12,575) | (632) | (6,254) | (18,829) | (2,676) | |||||||||||||||
| Unallocated severance and restructuring costs | — | (36) | — | — | (44) | |||||||||||||||
| Adjusted unallocated general and administrative expenses | $9,712 | $13,711 | $11,908 | $21,620 | $23,027 | |||||||||||||||
| Total adjusted segment profit | $192,751 | $165,314 | $194,159 | $386,910 | $302,666 | |||||||||||||||
| Adjusted amortization of intangible assets | — | — | — | — | — | |||||||||||||||
| Adjusted unallocated general and administrative expenses | 9,712 | 13,711 | 11,908 | 21,620 | 23,027 | |||||||||||||||
| Total adjusted operating income | $183,039 | $151,603 | $182,251 | $365,290 | $279,639 | |||||||||||||||
Entegris, Inc. - page 11 of 13
Entegris, Inc. and Subsidiaries
Reconciliation of GAAP Net Income to Adjusted Operating Income and Adjusted EBITDA
(In thousands)
(Unaudited)
| Three months ended | Six months ended | |||||||||||||||||||
| July 2, 2022 | July 3, 2021 | April 2, 2022 | July 2, 2022 | July 3, 2021 | ||||||||||||||||
| Net sales | $692,489 | $571,352 | $649,646 | $1,342,135 | $1,084,196 | |||||||||||||||
| Net income | $99,491 | $88,770 | $125,705 | $225,196 | $173,446 | |||||||||||||||
| Net income - as a % of net sales | 14.4 | % | 15.5 | % | 19.3 | % | 16.8 | % | 16.0 | % | ||||||||||
| Adjustments to net income: | ||||||||||||||||||||
| Income tax expense | 17,517 | 15,916 | 19,875 | 37,392 | 29,307 | |||||||||||||||
| Interest expense, net | 31,343 | 10,643 | 12,864 | 44,207 | 22,224 | |||||||||||||||
| Other expense, net | 9,619 | 23,560 | 4,902 | 14,521 | 27,890 | |||||||||||||||
| GAAP - Operating income | 157,970 | 138,889 | 163,346 | 321,316 | 252,867 | |||||||||||||||
| Operating margin - as a % of net sales | 22.8 | % | 24.3 | % | 25.1 | % | 23.9 | % | 23.3 | % | ||||||||||
| Deal and transaction costs | 2,410 | — | 5,008 | 7,418 | — | |||||||||||||||
| Integration costs | 10,165 | 632 | 1,246 | 11,411 | 2,676 | |||||||||||||||
| Severance and restructuring costs | — | 180 | — | — | 323 | |||||||||||||||
| Amortization of intangible assets | 12,494 | 11,902 | 12,651 | 25,145 | 23,773 | |||||||||||||||
| Adjusted operating income | 183,039 | 151,603 | 182,251 | 365,290 | 279,639 | |||||||||||||||
| Adjusted operating margin - as a % of net sales | 26.4 | % | 26.5 | % | 28.1 | % | 27.2 | % | 25.8 | % | ||||||||||
| Depreciation | 24,381 | 22,574 | 23,905 | 48,286 | 44,669 | |||||||||||||||
| Adjusted EBITDA | $207,420 | $174,177 | $206,156 | $413,576 | $324,308 | |||||||||||||||
| Adjusted EBITDA - as a % of net sales | 30.0 | % | 30.5 | % | 31.7 | % | 30.8 | % | 29.9 | % | ||||||||||
Entegris, Inc. - page 12 of 13
Entegris, Inc. and Subsidiaries
Reconciliation of GAAP Net Income and Diluted Earnings per Common Share to Non-GAAP Net Income and Diluted Non-GAAP Earnings per Common Share
(In thousands, except per share data)
(Unaudited)
| Three months ended | Six months ended | |||||||||||||||||||
| July 2, 2022 | July 3, 2021 | April 2, 2022 | July 2, 2022 | July 3, 2021 | ||||||||||||||||
| GAAP net income | $99,491 | $88,770 | $125,705 | $225,196 | $173,446 | |||||||||||||||
| Adjustments to net income: | ||||||||||||||||||||
| Deal and transaction costs | 2,410 | — | 5,008 | 7,418 | — | |||||||||||||||
| Integration costs | 10,165 | 632 | 1,246 | 11,411 | 2,676 | |||||||||||||||
| Severance and restructuring costs | — | 180 | — | — | 323 | |||||||||||||||
| Loss on extinguishment of debt and modification | — | 23,338 | — | — | 23,338 | |||||||||||||||
| Interest expense, net | 22,742 | — | 4,683 | 27,425 | — | |||||||||||||||
| Amortization of intangible assets | 12,494 | 11,902 | 12,651 | 25,145 | 23,773 | |||||||||||||||
Tax effect of adjustments to net income and discrete items1 | (10,486) | (8,111) | (4,160) | (14,646) | (11,332) | |||||||||||||||
| Non-GAAP net income | $136,816 | $116,711 | $145,133 | $281,949 | $212,224 | |||||||||||||||
| Diluted earnings per common share | $0.73 | $0.65 | $0.92 | $1.65 | $1.27 | |||||||||||||||
| Effect of adjustments to net income | $0.27 | $0.20 | $0.14 | $0.42 | $0.28 | |||||||||||||||
| Diluted non-GAAP earnings per common share | $1.00 | $0.85 | $1.06 | $2.07 | $1.55 | |||||||||||||||
1The tax effect of pre-tax adjustments to net income was calculated using the applicable marginal tax rate during the respective years.
Entegris, Inc. - page 13 of 13
Earnings Summary August 2, 2022 Second Quarter 2022 Exhibit 99.2
This presentation contains forward-looking statements. The words “believe,” “expect,” “anticipate,” “intend,” “estimate,” “forecast,” “project,” “should,” “may,” “will,” “would” or the negative thereof and similar expressions are intended to identify such forward-looking statements. These forward-looking statements include statements related to future period guidance; future revenue, EBITDA as a percentage of sales and other financial metrics; future repayments under the Company's credit facilities; the Company’s performance relative to its markets, including the drivers of such performance; the impact, financial or otherwise, of any organizational changes; market and technology trends, including the expected impact of the COVID-19 pandemic; the Company's capital allocation strategy, which may be modified at any time for any reason, including share repurchases, dividends, debt repayments and potential acquisitions; the impact of the acquisitions the Company has made and commercial partnerships the Company has established, including the acquisition of CMC Materials, Inc. ("CMC Materials"); the Company’s ability to execute on its strategies; and other matters. These statements involve risks and uncertainties, and actual results may differ materially from those projected in the forward-looking statements. These risks and uncertainties include, but are not limited to, weakening of global and/or regional economic conditions, generally or specifically in the semiconductor industry, which could decrease the demand for the Company’s products and solutions; the level of, and obligations associated with, the Company’s indebtedness, including the debts incurred in connection with the acquisition of CMC Materials; risks related to the acquisition and integration of CMC Materials, including unanticipated difficulties or expenditures relating thereto; the ability to achieve the anticipated synergies and value-creation contemplated by the acquisition of CMC Materials and the diversion of management time on transaction-related matters; risks related to the COVID-19 pandemic on the global economy and financial markets, as well as on the Company, its customers and suppliers, which much impact the Company's sales, gross margin, customer demand and its ability to supply its products to its customers; raw material shortages, supply and labor constraints and price increases or pricing and inflationary pressures; operational, political and legal risks of the Company’s international operations; the Company’s dependence on sole source and limited source suppliers; the Company’s ability to meet rapid demand shifts; the Company’s ability to continue technological innovation and introduce new products to meet customers’ rapidly changing requirements; substantial competition; the Company’s concentrated customer base; the Company’s ability to identify, complete and integrate acquisitions, joint ventures or other transactions; the Company’s ability to effectively implement any organizational changes; the Company’s ability to protect and enforce intellectual property rights; the ongoing conflict in Ukraine and the global response thereto; the increasing complexity of certain manufacturing processes; changes in government regulations of the countries in which the Company operates, including the imposition of tariffs, export controls and other trade laws and restrictions and changes to foreign and national security policy, especially as they relate to China; fluctuation of currency exchange rates; fluctuations in the market price of the Company’s stock; and other risk factors and additional information described in the Company’s filings with the Securities and Exchange Commission, including under the heading “Risk Factors” in Item 1A of the Company’s Annual Report on Form 10-K for the fiscal year ended December 31, 2021, filed on February 4, 2022, in Item 1A of the Company’s Quarterly Report on Form 10-Q for the period ended April 2, 2022, filed on April 26, 2022, and in the Company’s other periodic filings. Except as required under the federal securities laws and the rules and regulations of the Securities and Exchange Commission, the Company undertakes no obligation to update publicly any forward-looking statements or information contained herein, which speak as of their respective dates. This presentation contains references to “Adjusted EBITDA,” “Adjusted EBITDA – as a % of Net Sales,” “Adjusted Operating Income,” “Adjusted Operating Margin,” “Adjusted Gross Profit,” “Adjusted Gross Margin – as a % of Net Sales,” “Adjusted Segment Profit,” “Adjusted Segment Profit Margin,” “Non-GAAP Operating Expenses,” "Non-GAAP Tax Rate," “Non-GAAP Net Income,” “Diluted Non-GAAP Earnings per Common Share” and "Free Cash Flow" that are not presented in accordance GAAP. The non-GAAP financial measures should not be considered in isolation or as a substitute for GAAP financial measures but should instead be read in conjunction with the GAAP financial measures. Further information with respect to and reconciliations of such measures to the most directly comparable GAAP measure can be found attached to this presentation. 2 Safe Harbor
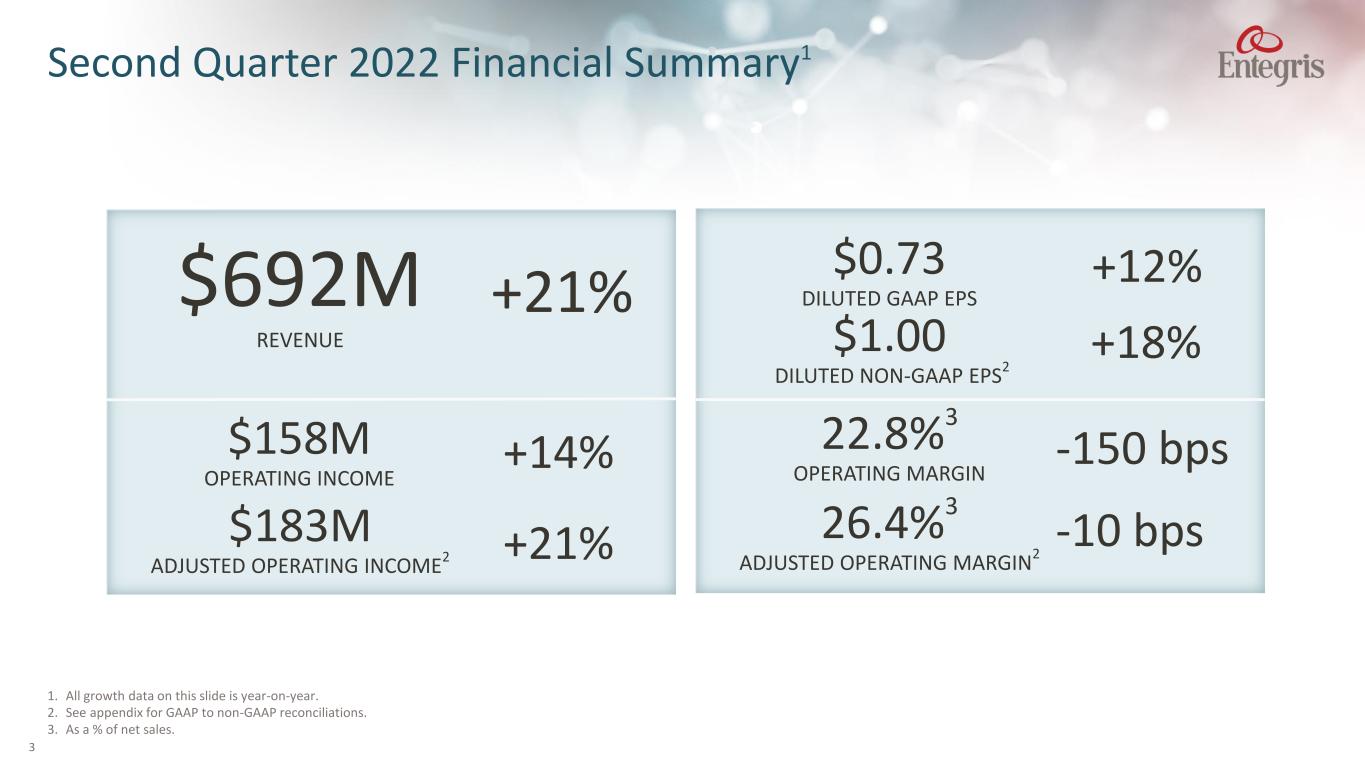
+21%$692M REVENUE +14%$158M OPERATING INCOME +12% $1.00 DILUTED NON-GAAP EPS 2 -150 bps22.8%3 OPERATING MARGIN 1. All growth data on this slide is year-on-year. 2. See appendix for GAAP to non-GAAP reconciliations. 3. As a % of net sales. 3 $0.73 DILUTED GAAP EPS +18% Second Quarter 2022 Financial Summary1 $183M ADJUSTED OPERATING INCOME 2 +21% 26.4%3 ADJUSTED OPERATING MARGIN 2 -10 bps
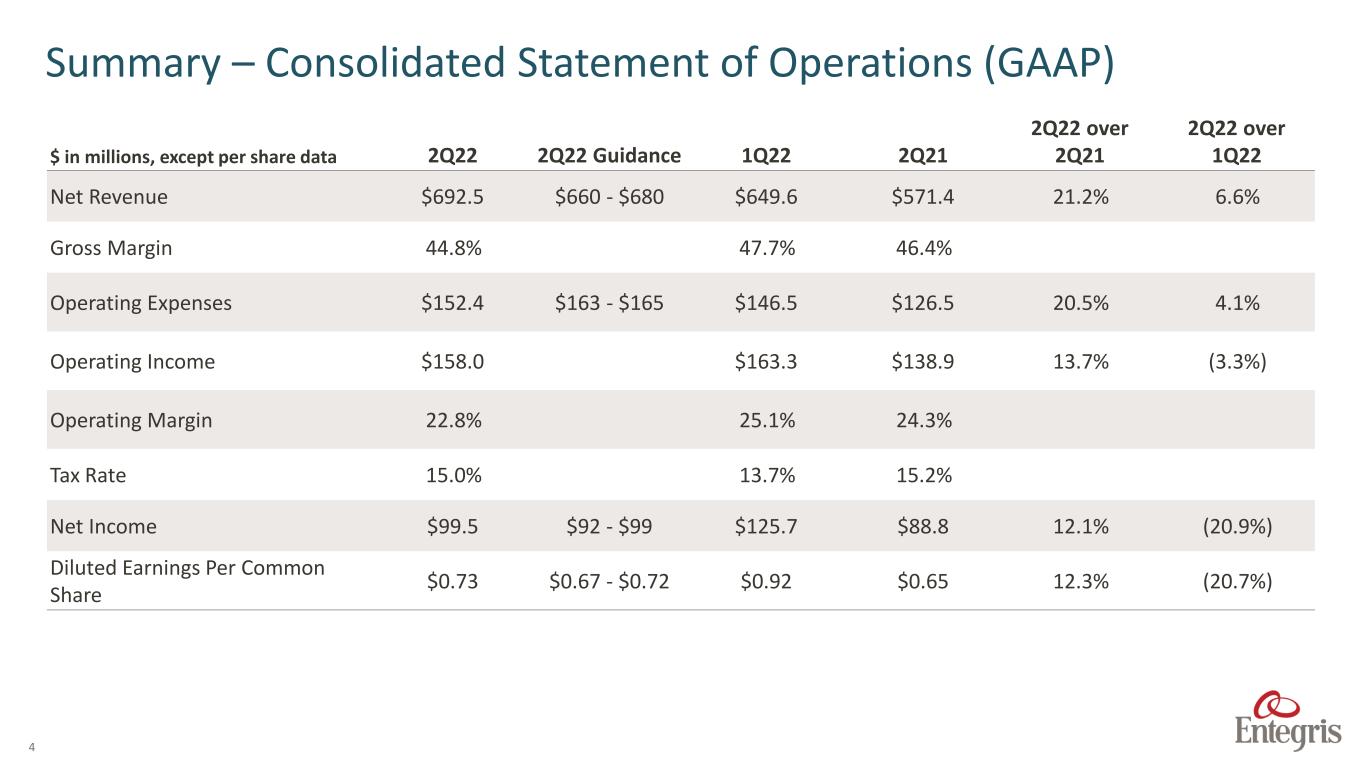
4 $ in millions, except per share data 2Q22 2Q22 Guidance 1Q22 2Q21 2Q22 over 2Q21 2Q22 over 1Q22 Net Revenue $692.5 $660 - $680 $649.6 $571.4 21.2% 6.6% Gross Margin 44.8% 47.7% 46.4% Operating Expenses $152.4 $163 - $165 $146.5 $126.5 20.5% 4.1% Operating Income $158.0 $163.3 $138.9 13.7% (3.3%) Operating Margin 22.8% 25.1% 24.3% Tax Rate 15.0% 13.7% 15.2% Net Income $99.5 $92 - $99 $125.7 $88.8 12.1% (20.9%) Diluted Earnings Per Common Share $0.73 $0.67 - $0.72 $0.92 $0.65 12.3% (20.7%) Summary – Consolidated Statement of Operations (GAAP)
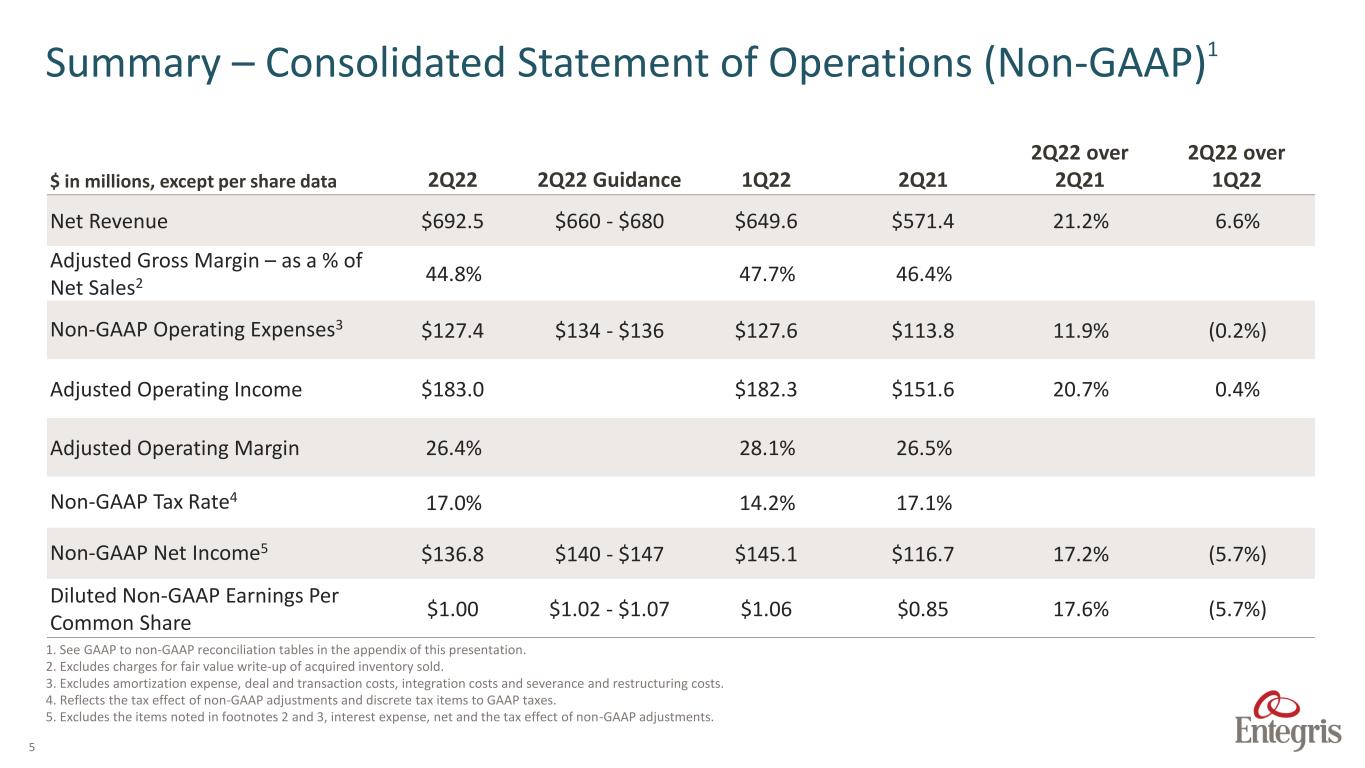
5 $ in millions, except per share data 2Q22 2Q22 Guidance 1Q22 2Q21 2Q22 over 2Q21 2Q22 over 1Q22 Net Revenue $692.5 $660 - $680 $649.6 $571.4 21.2% 6.6% Adjusted Gross Margin – as a % of Net Sales2 44.8% 47.7% 46.4% Non-GAAP Operating Expenses3 $127.4 $134 - $136 $127.6 $113.8 11.9% (0.2%) Adjusted Operating Income $183.0 $182.3 $151.6 20.7% 0.4% Adjusted Operating Margin 26.4% 28.1% 26.5% Non-GAAP Tax Rate4 17.0% 14.2% 17.1% Non-GAAP Net Income5 $136.8 $140 - $147 $145.1 $116.7 17.2% (5.7%) Diluted Non-GAAP Earnings Per Common Share $1.00 $1.02 - $1.07 $1.06 $0.85 17.6% (5.7%) Summary – Consolidated Statement of Operations (Non-GAAP)1 1. See GAAP to non-GAAP reconciliation tables in the appendix of this presentation. 2. Excludes charges for fair value write-up of acquired inventory sold. 3. Excludes amortization expense, deal and transaction costs, integration costs and severance and restructuring costs. 4. Reflects the tax effect of non-GAAP adjustments and discrete tax items to GAAP taxes. 5. Excludes the items noted in footnotes 2 and 3, interest expense, net and the tax effect of non-GAAP adjustments.
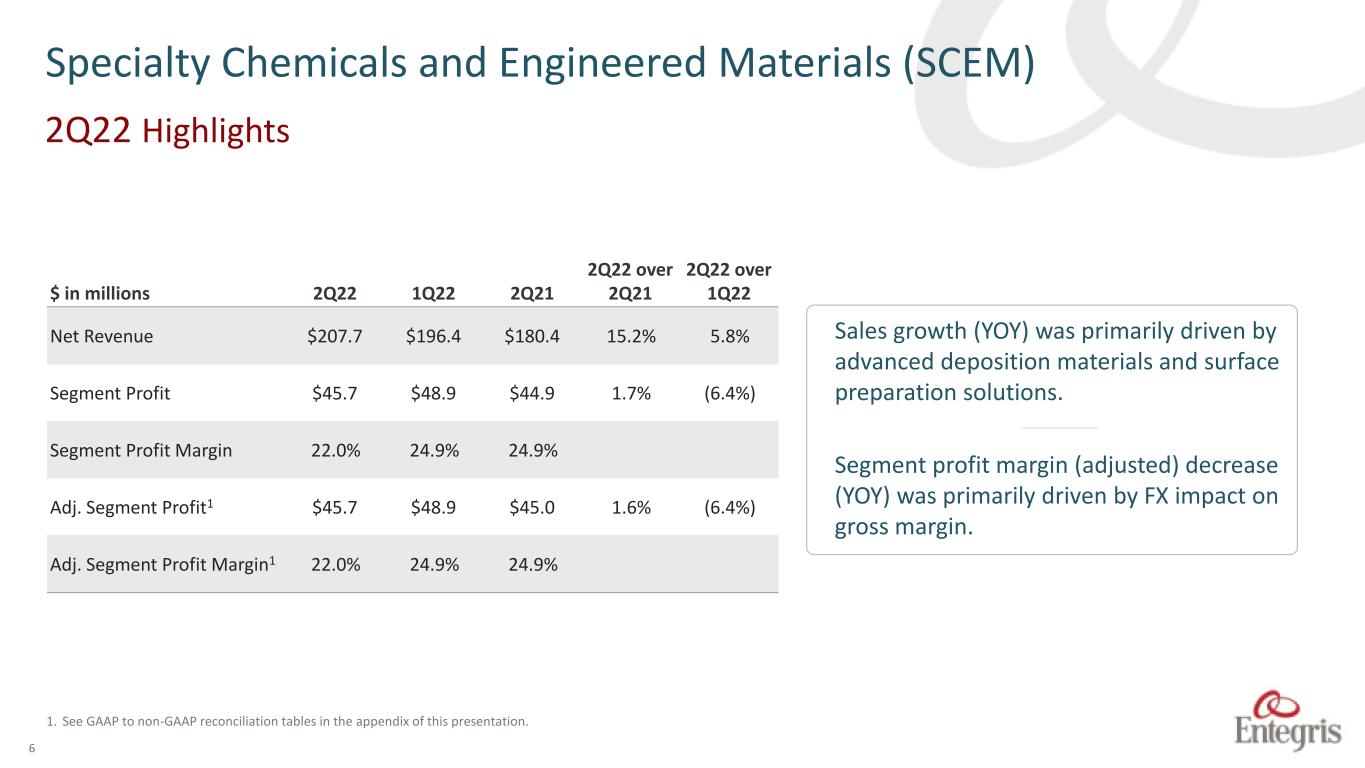
6 1. See GAAP to non-GAAP reconciliation tables in the appendix of this presentation. Sales growth (YOY) was primarily driven by advanced deposition materials and surface preparation solutions. –––––– Segment profit margin (adjusted) decrease (YOY) was primarily driven by FX impact on gross margin. $ in millions 2Q22 1Q22 2Q21 2Q22 over 2Q21 2Q22 over 1Q22 Net Revenue $207.7 $196.4 $180.4 15.2% 5.8% Segment Profit $45.7 $48.9 $44.9 1.7% (6.4%) Segment Profit Margin 22.0% 24.9% 24.9% Adj. Segment Profit1 $45.7 $48.9 $45.0 1.6% (6.4%) Adj. Segment Profit Margin1 22.0% 24.9% 24.9% Specialty Chemicals and Engineered Materials (SCEM) 2Q22 Highlights
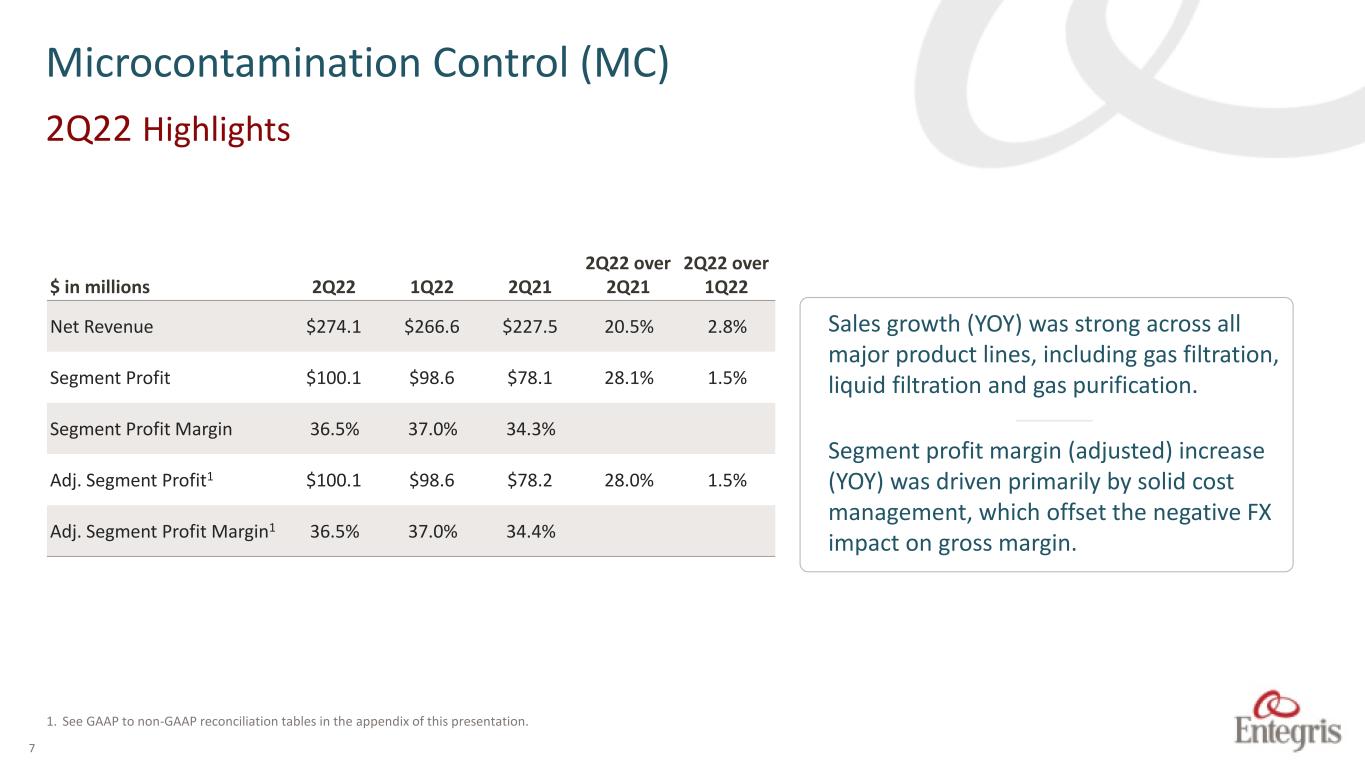
7 1. See GAAP to non-GAAP reconciliation tables in the appendix of this presentation. Microcontamination Control (MC) $ in millions 2Q22 1Q22 2Q21 2Q22 over 2Q21 2Q22 over 1Q22 Net Revenue $274.1 $266.6 $227.5 20.5% 2.8% Segment Profit $100.1 $98.6 $78.1 28.1% 1.5% Segment Profit Margin 36.5% 37.0% 34.3% Adj. Segment Profit1 $100.1 $98.6 $78.2 28.0% 1.5% Adj. Segment Profit Margin1 36.5% 37.0% 34.4% Sales growth (YOY) was strong across all major product lines, including gas filtration, liquid filtration and gas purification. –––––– Segment profit margin (adjusted) increase (YOY) was driven primarily by solid cost management, which offset the negative FX impact on gross margin. 2Q22 Highlights
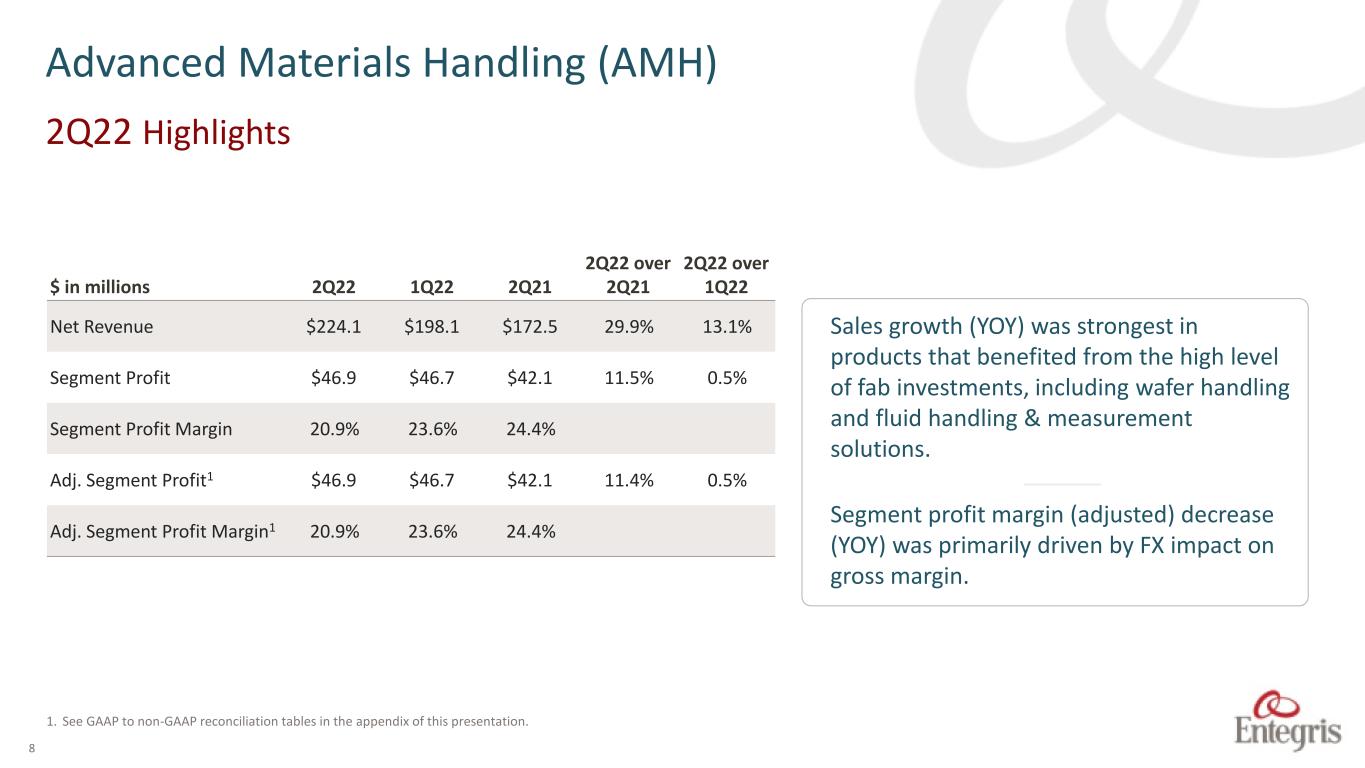
8 1. See GAAP to non-GAAP reconciliation tables in the appendix of this presentation. Advanced Materials Handling (AMH) $ in millions 2Q22 1Q22 2Q21 2Q22 over 2Q21 2Q22 over 1Q22 Net Revenue $224.1 $198.1 $172.5 29.9% 13.1% Segment Profit $46.9 $46.7 $42.1 11.5% 0.5% Segment Profit Margin 20.9% 23.6% 24.4% Adj. Segment Profit1 $46.9 $46.7 $42.1 11.4% 0.5% Adj. Segment Profit Margin1 20.9% 23.6% 24.4% Sales growth (YOY) was strongest in products that benefited from the high level of fab investments, including wafer handling and fluid handling & measurement solutions. –––––– Segment profit margin (adjusted) decrease (YOY) was primarily driven by FX impact on gross margin. 2Q22 Highlights
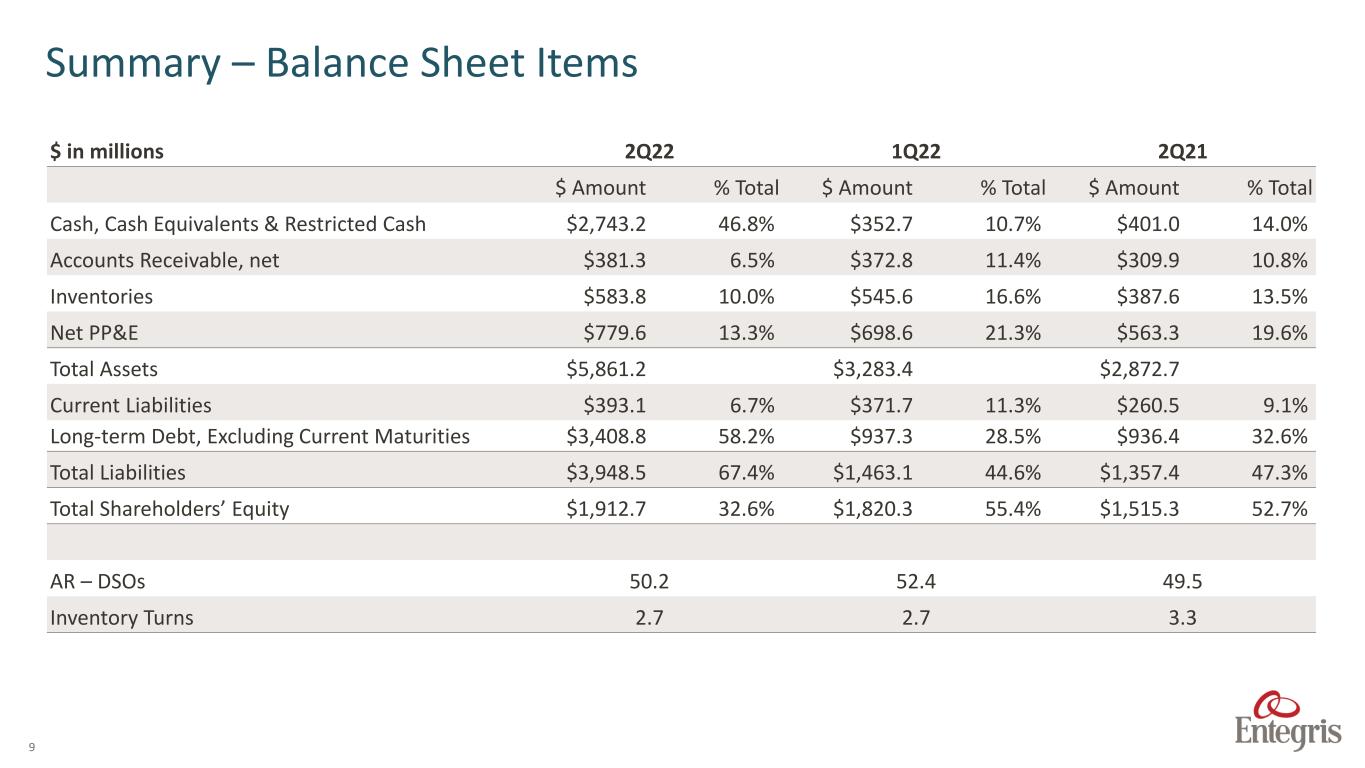
9 $ in millions 2Q22 1Q22 2Q21 $ Amount % Total $ Amount % Total $ Amount % Total Cash, Cash Equivalents & Restricted Cash $2,743.2 46.8% $352.7 10.7% $401.0 14.0% Accounts Receivable, net $381.3 6.5% $372.8 11.4% $309.9 10.8% Inventories $583.8 10.0% $545.6 16.6% $387.6 13.5% Net PP&E $779.6 13.3% $698.6 21.3% $563.3 19.6% Total Assets $5,861.2 $3,283.4 $2,872.7 Current Liabilities $393.1 6.7% $371.7 11.3% $260.5 9.1% Long-term Debt, Excluding Current Maturities $3,408.8 58.2% $937.3 28.5% $936.4 32.6% Total Liabilities $3,948.5 67.4% $1,463.1 44.6% $1,357.4 47.3% Total Shareholders’ Equity $1,912.7 32.6% $1,820.3 55.4% $1,515.3 52.7% AR – DSOs 50.2 52.4 49.5 Inventory Turns 2.7 2.7 3.3 Summary – Balance Sheet Items
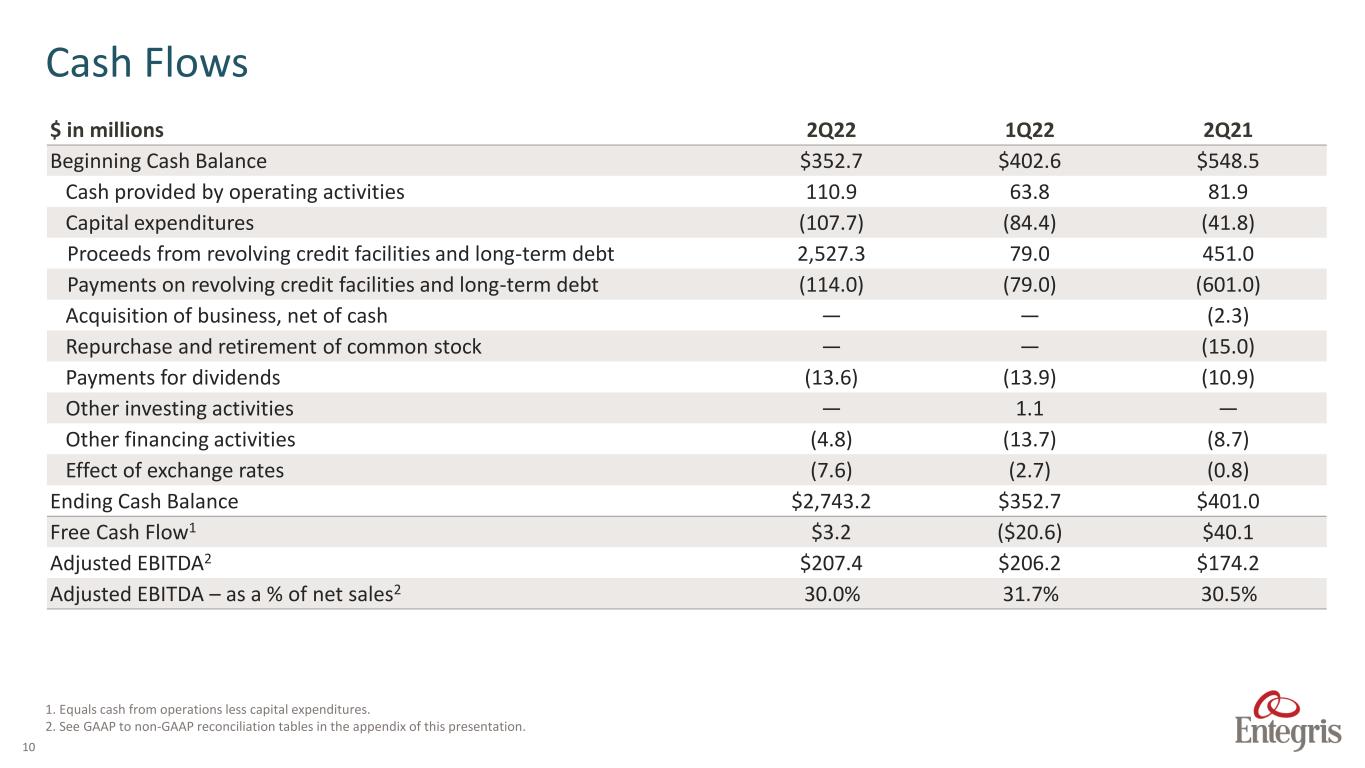
10 $ in millions 2Q22 1Q22 2Q21 Beginning Cash Balance $352.7 $402.6 $548.5 Cash provided by operating activities 110.9 63.8 81.9 Capital expenditures (107.7) (84.4) (41.8) Proceeds from revolving credit facilities and long-term debt 2,527.3 79.0 451.0 Payments on revolving credit facilities and long-term debt (114.0) (79.0) (601.0) Acquisition of business, net of cash — — (2.3) Repurchase and retirement of common stock — — (15.0) Payments for dividends (13.6) (13.9) (10.9) Other investing activities — 1.1 — Other financing activities (4.8) (13.7) (8.7) Effect of exchange rates (7.6) (2.7) (0.8) Ending Cash Balance $2,743.2 $352.7 $401.0 Free Cash Flow1 $3.2 ($20.6) $40.1 Adjusted EBITDA2 $207.4 $206.2 $174.2 Adjusted EBITDA – as a % of net sales2 30.0% 31.7% 30.5% Cash Flows 1. Equals cash from operations less capital expenditures. 2. See GAAP to non-GAAP reconciliation tables in the appendix of this presentation.
11 Outlook For the third quarter ending October 1, 2022, the Company expects sales (for the combined company) of $1.00 billion to $1.04 billion and EBITDA of approximately 30 percent of sales. The foregoing forward looking guidance measures (other than revenue) are provided on a non-GAAP basis without a reconciliation to the most directly comparable GAAP measure because the Company is unable to predict with a reasonable degree of certainty certain items contained in the forward looking GAAP measures without unreasonable efforts. Such items include, but are not limited to, acquisition related expenses, restructuring and related expenses, share-based compensation and other items not reflective of the Company's ongoing operations.
Entegris®, the Entegris Rings Design®, and other product names are trademarks of Entegris, Inc. as listed on entegris.com/trademarks. All product names, logos, and company names are trademarks or registered trademarks of their respective owners. Use of them does not imply any affiliation, sponsorship, or endorsement by the trademark owner. ©2020 Entegris, Inc. All rights reserved. 12
Appendix 13
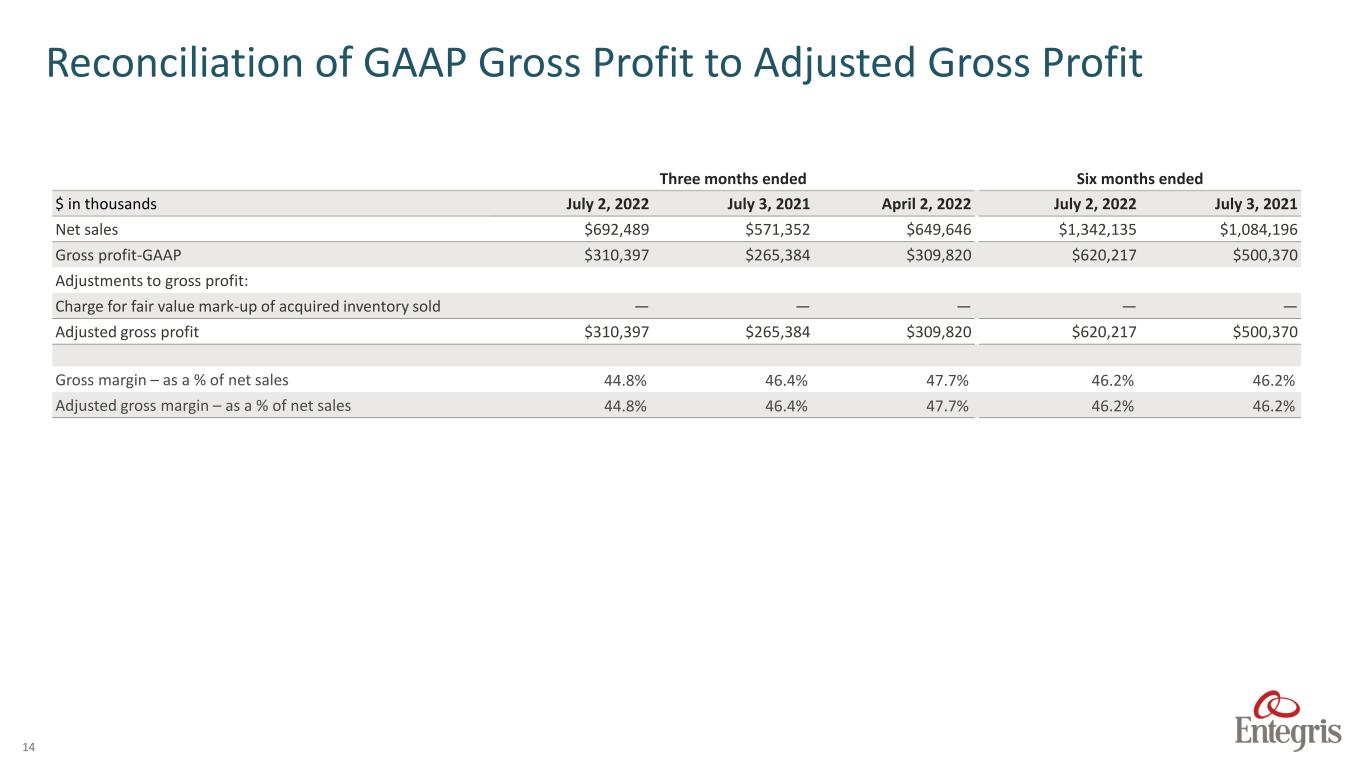
14 Reconciliation of GAAP Gross Profit to Adjusted Gross Profit Three months ended Six months ended $ in thousands July 2, 2022 July 3, 2021 April 2, 2022 July 2, 2022 July 3, 2021 Net sales $692,489 $571,352 $649,646 $1,342,135 $1,084,196 Gross profit-GAAP $310,397 $265,384 $309,820 $620,217 $500,370 Adjustments to gross profit: Charge for fair value mark-up of acquired inventory sold — — — — — Adjusted gross profit $310,397 $265,384 $309,820 $620,217 $500,370 Gross margin – as a % of net sales 44.8% 46.4% 47.7% 46.2% 46.2% Adjusted gross margin – as a % of net sales 44.8% 46.4% 47.7% 46.2% 46.2%
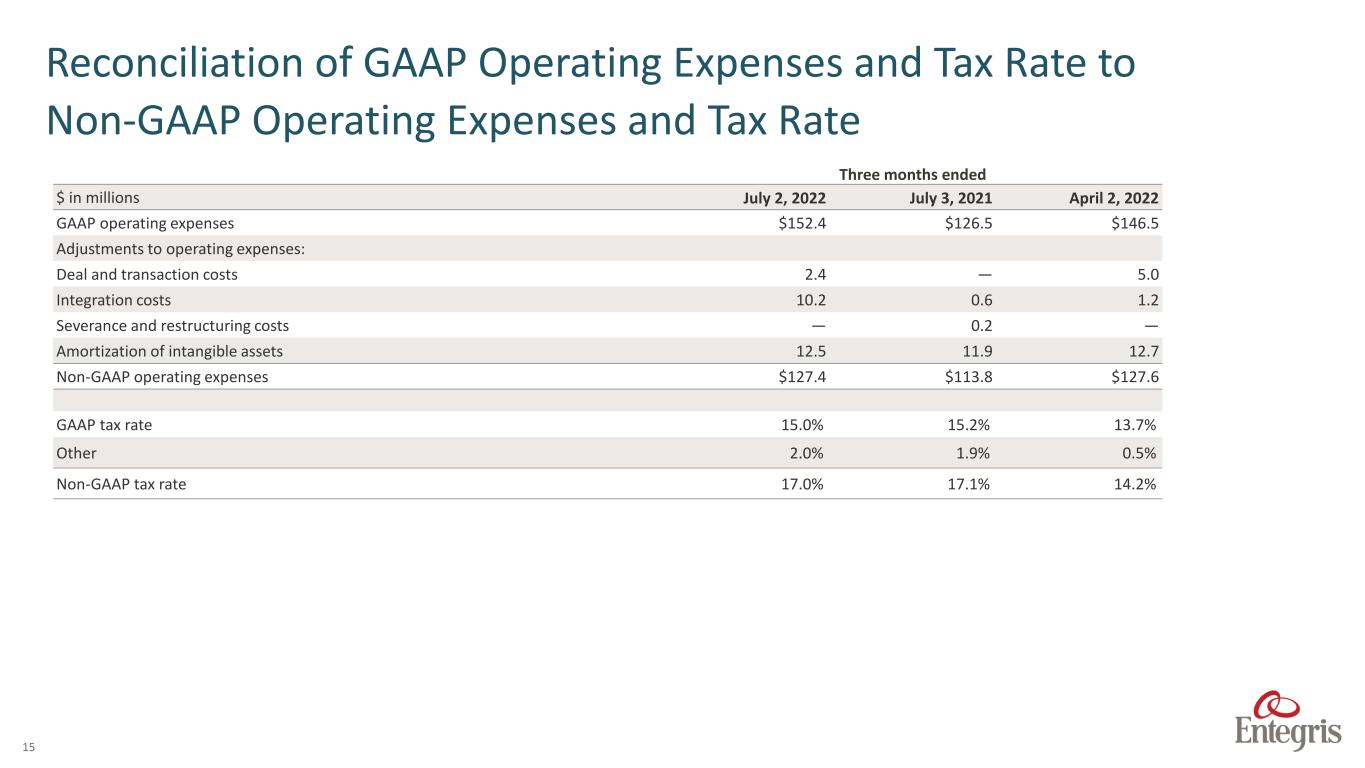
15 Reconciliation of GAAP Operating Expenses and Tax Rate to Non-GAAP Operating Expenses and Tax Rate Three months ended $ in millions July 2, 2022 July 3, 2021 April 2, 2022 GAAP operating expenses $152.4 $126.5 $146.5 Adjustments to operating expenses: Deal and transaction costs 2.4 — 5.0 Integration costs 10.2 0.6 1.2 Severance and restructuring costs — 0.2 — Amortization of intangible assets 12.5 11.9 12.7 Non-GAAP operating expenses $127.4 $113.8 $127.6 GAAP tax rate 15.0% 15.2% 13.7% Other 2.0% 1.9% 0.5% Non-GAAP tax rate 17.0% 17.1% 14.2%
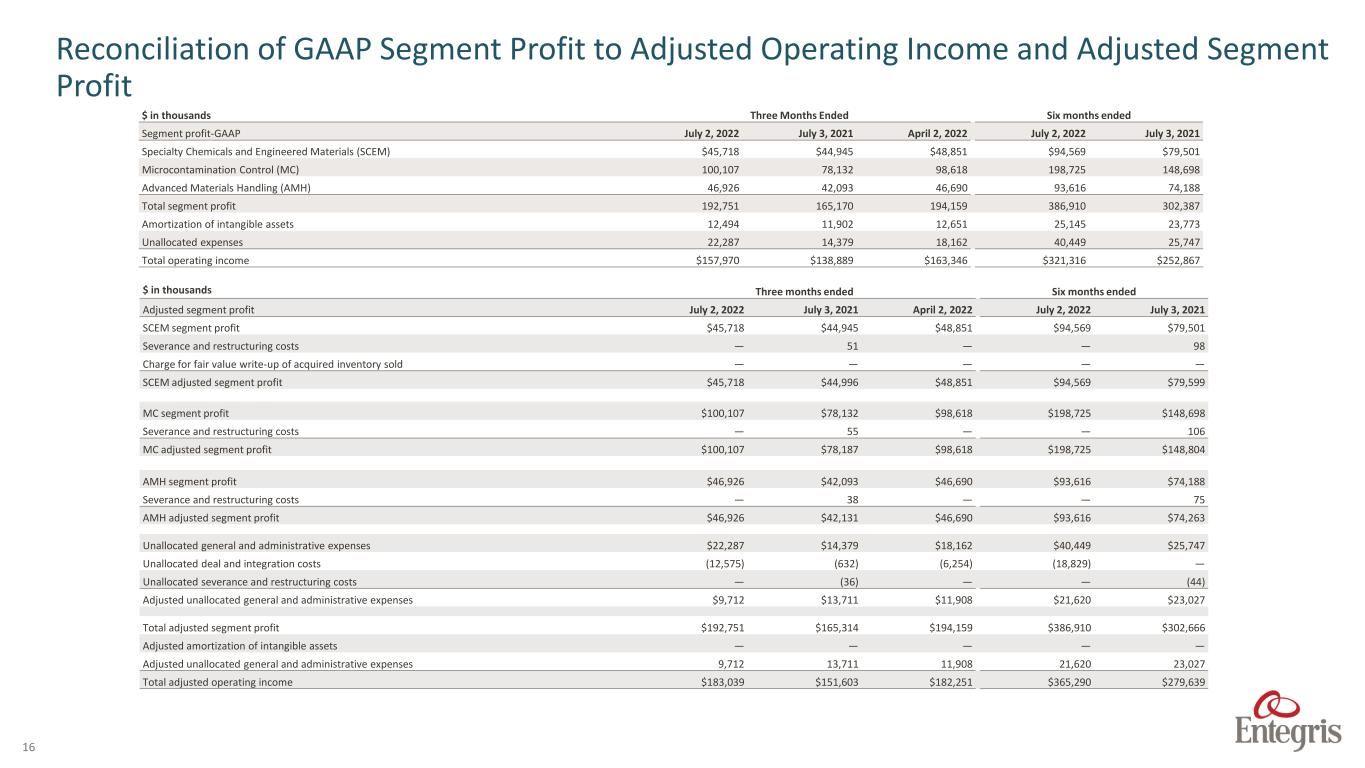
16 $ in thousands Three months ended Six months ended Adjusted segment profit July 2, 2022 July 3, 2021 April 2, 2022 July 2, 2022 July 3, 2021 SCEM segment profit $45,718 $44,945 $48,851 $94,569 $79,501 Severance and restructuring costs — 51 — — 98 Charge for fair value write-up of acquired inventory sold — — — — — SCEM adjusted segment profit $45,718 $44,996 $48,851 $94,569 $79,599 MC segment profit $100,107 $78,132 $98,618 $198,725 $148,698 Severance and restructuring costs — 55 — — 106 MC adjusted segment profit $100,107 $78,187 $98,618 $198,725 $148,804 AMH segment profit $46,926 $42,093 $46,690 $93,616 $74,188 Severance and restructuring costs — 38 — — 75 AMH adjusted segment profit $46,926 $42,131 $46,690 $93,616 $74,263 Unallocated general and administrative expenses $22,287 $14,379 $18,162 $40,449 $25,747 Unallocated deal and integration costs (12,575) (632) (6,254) (18,829) — Unallocated severance and restructuring costs — (36) — — (44) Adjusted unallocated general and administrative expenses $9,712 $13,711 $11,908 $21,620 $23,027 Total adjusted segment profit $192,751 $165,314 $194,159 $386,910 $302,666 Adjusted amortization of intangible assets — — — — — Adjusted unallocated general and administrative expenses 9,712 13,711 11,908 21,620 23,027 Total adjusted operating income $183,039 $151,603 $182,251 $365,290 $279,639 $ in thousands Three Months Ended Six months ended Segment profit-GAAP July 2, 2022 July 3, 2021 April 2, 2022 July 2, 2022 July 3, 2021 Specialty Chemicals and Engineered Materials (SCEM) $45,718 $44,945 $48,851 $94,569 $79,501 Microcontamination Control (MC) 100,107 78,132 98,618 198,725 148,698 Advanced Materials Handling (AMH) 46,926 42,093 46,690 93,616 74,188 Total segment profit 192,751 165,170 194,159 386,910 302,387 Amortization of intangible assets 12,494 11,902 12,651 25,145 23,773 Unallocated expenses 22,287 14,379 18,162 40,449 25,747 Total operating income $157,970 $138,889 $163,346 $321,316 $252,867 Reconciliation of GAAP Segment Profit to Adjusted Operating Income and Adjusted Segment Profit
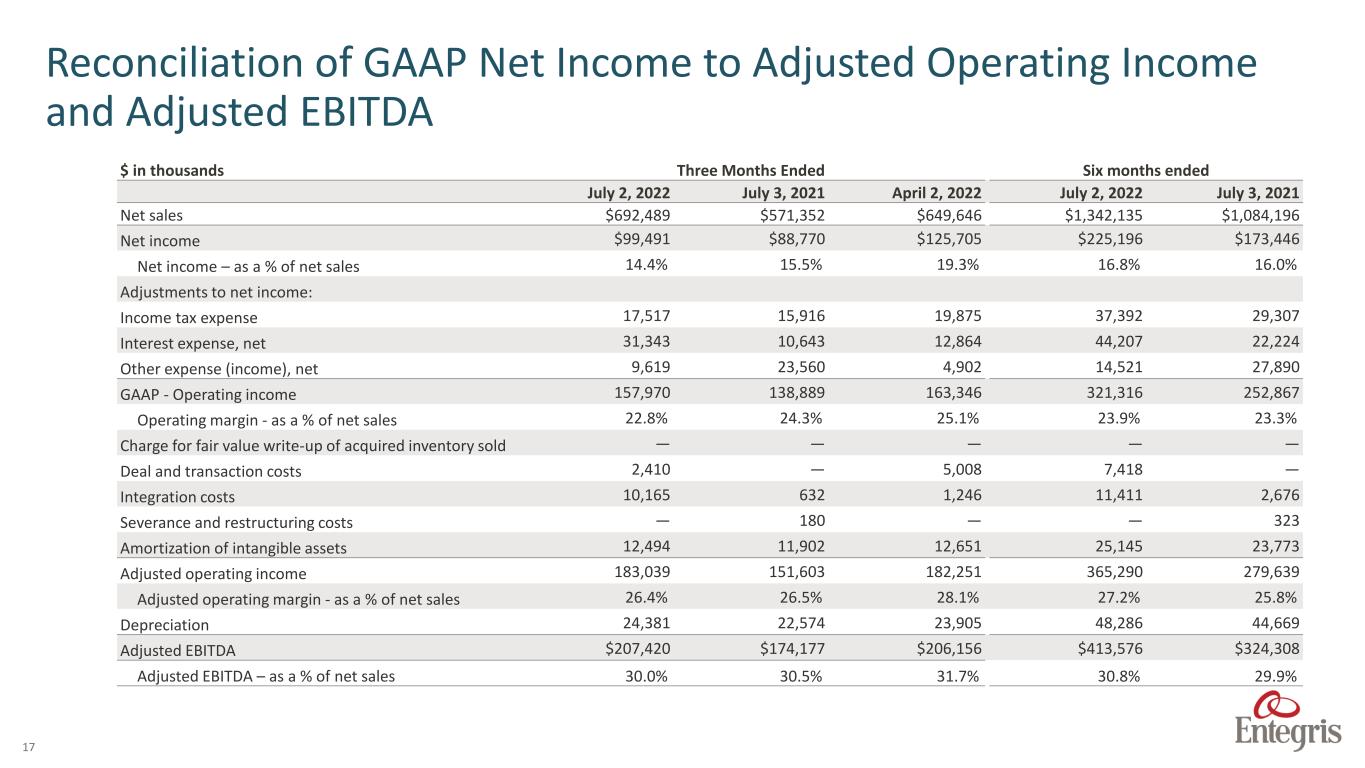
17 $ in thousands Three Months Ended Six months ended July 2, 2022 July 3, 2021 April 2, 2022 July 2, 2022 July 3, 2021 Net sales $692,489 $571,352 $649,646 $1,342,135 $1,084,196 Net income $99,491 $88,770 $125,705 $225,196 $173,446 Net income – as a % of net sales 14.4% 15.5% 19.3% 16.8% 16.0% Adjustments to net income: Income tax expense 17,517 15,916 19,875 37,392 29,307 Interest expense, net 31,343 10,643 12,864 44,207 22,224 Other expense (income), net 9,619 23,560 4,902 14,521 27,890 GAAP - Operating income 157,970 138,889 163,346 321,316 252,867 Operating margin - as a % of net sales 22.8% 24.3% 25.1% 23.9% 23.3% Charge for fair value write-up of acquired inventory sold — — — — — Deal and transaction costs 2,410 — 5,008 7,418 — Integration costs 10,165 632 1,246 11,411 2,676 Severance and restructuring costs — 180 — — 323 Amortization of intangible assets 12,494 11,902 12,651 25,145 23,773 Adjusted operating income 183,039 151,603 182,251 365,290 279,639 Adjusted operating margin - as a % of net sales 26.4% 26.5% 28.1% 27.2% 25.8% Depreciation 24,381 22,574 23,905 48,286 44,669 Adjusted EBITDA $207,420 $174,177 $206,156 $413,576 $324,308 Adjusted EBITDA – as a % of net sales 30.0% 30.5% 31.7% 30.8% 29.9% Reconciliation of GAAP Net Income to Adjusted Operating Income and Adjusted EBITDA
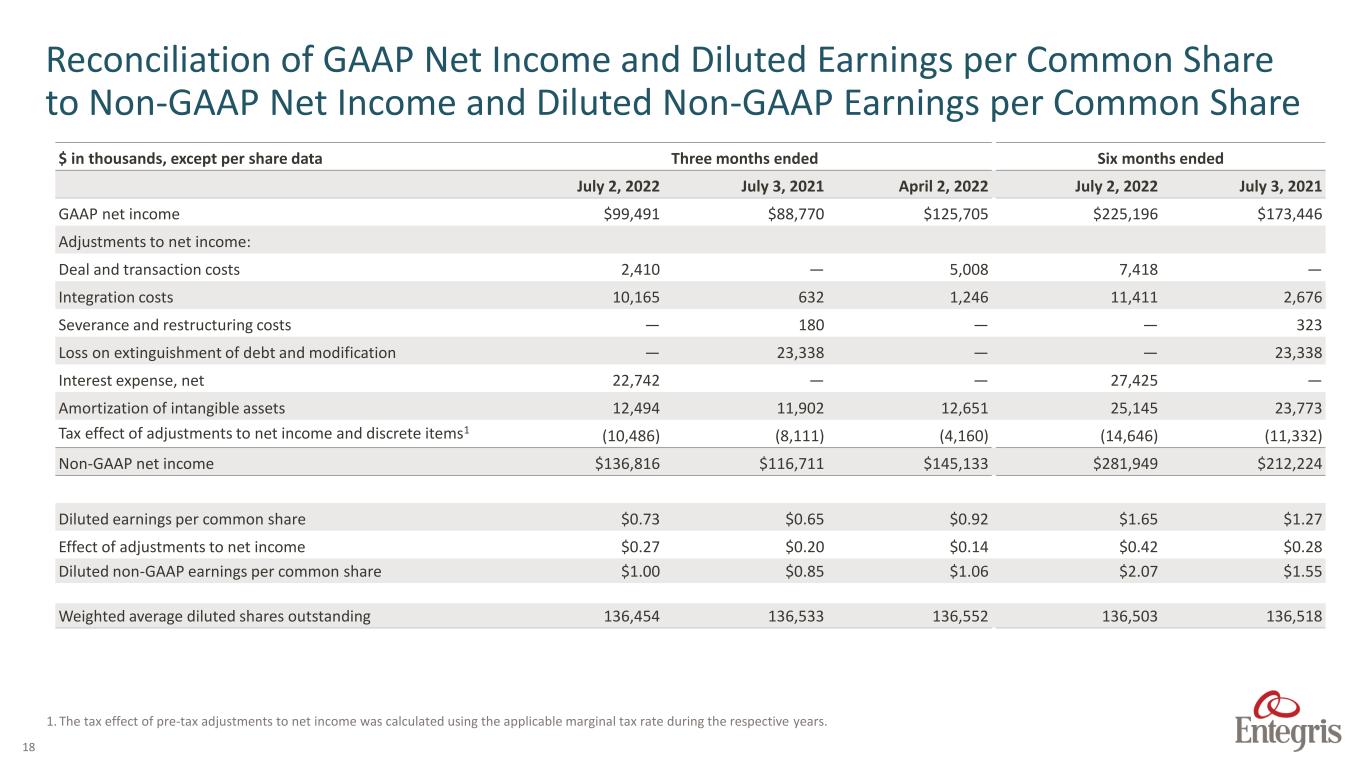
18 $ in thousands, except per share data Three months ended Six months ended July 2, 2022 July 3, 2021 April 2, 2022 July 2, 2022 July 3, 2021 GAAP net income $99,491 $88,770 $125,705 $225,196 $173,446 Adjustments to net income: Deal and transaction costs 2,410 — 5,008 7,418 — Integration costs 10,165 632 1,246 11,411 2,676 Severance and restructuring costs — 180 — — 323 Loss on extinguishment of debt and modification — 23,338 — — 23,338 Interest expense, net 22,742 — — 27,425 — Amortization of intangible assets 12,494 11,902 12,651 25,145 23,773 Tax effect of adjustments to net income and discrete items1 (10,486) (8,111) (4,160) (14,646) (11,332) Non-GAAP net income $136,816 $116,711 $145,133 $281,949 $212,224 Diluted earnings per common share $0.73 $0.65 $0.92 $1.65 $1.27 Effect of adjustments to net income $0.27 $0.20 $0.14 $0.42 $0.28 Diluted non-GAAP earnings per common share $1.00 $0.85 $1.06 $2.07 $1.55 Weighted average diluted shares outstanding 136,454 136,533 136,552 136,503 136,518 Reconciliation of GAAP Net Income and Diluted Earnings per Common Share to Non-GAAP Net Income and Diluted Non-GAAP Earnings per Common Share 1. The tax effect of pre-tax adjustments to net income was calculated using the applicable marginal tax rate during the respective years.
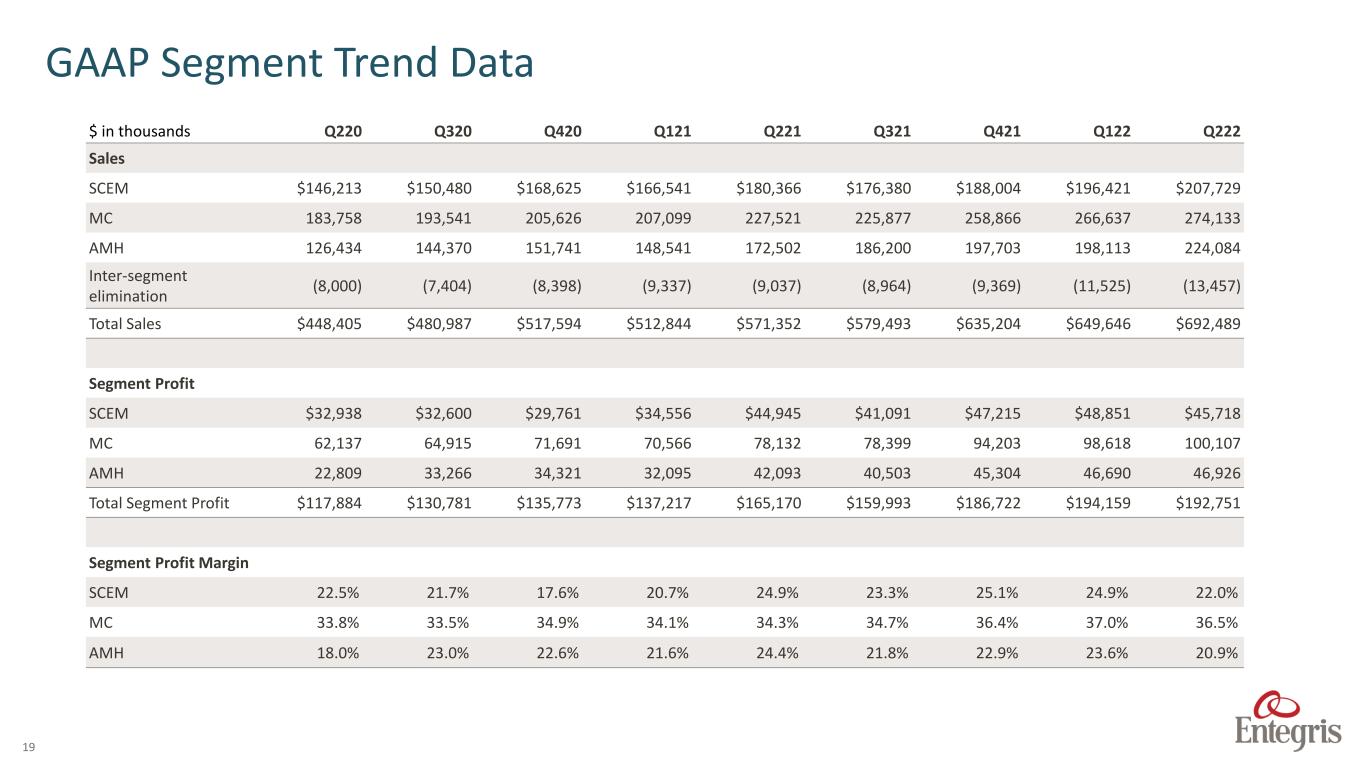
19 $ in thousands Q220 Q320 Q420 Q121 Q221 Q321 Q421 Q122 Q222 Sales SCEM $146,213 $150,480 $168,625 $166,541 $180,366 $176,380 $188,004 $196,421 $207,729 MC 183,758 193,541 205,626 207,099 227,521 225,877 258,866 266,637 274,133 AMH 126,434 144,370 151,741 148,541 172,502 186,200 197,703 198,113 224,084 Inter-segment elimination (8,000) (7,404) (8,398) (9,337) (9,037) (8,964) (9,369) (11,525) (13,457) Total Sales $448,405 $480,987 $517,594 $512,844 $571,352 $579,493 $635,204 $649,646 $692,489 Segment Profit SCEM $32,938 $32,600 $29,761 $34,556 $44,945 $41,091 $47,215 $48,851 $45,718 MC 62,137 64,915 71,691 70,566 78,132 78,399 94,203 98,618 100,107 AMH 22,809 33,266 34,321 32,095 42,093 40,503 45,304 46,690 46,926 Total Segment Profit $117,884 $130,781 $135,773 $137,217 $165,170 $159,993 $186,722 $194,159 $192,751 Segment Profit Margin SCEM 22.5% 21.7% 17.6% 20.7% 24.9% 23.3% 25.1% 24.9% 22.0% MC 33.8% 33.5% 34.9% 34.1% 34.3% 34.7% 36.4% 37.0% 36.5% AMH 18.0% 23.0% 22.6% 21.6% 24.4% 21.8% 22.9% 23.6% 20.9% GAAP Segment Trend Data
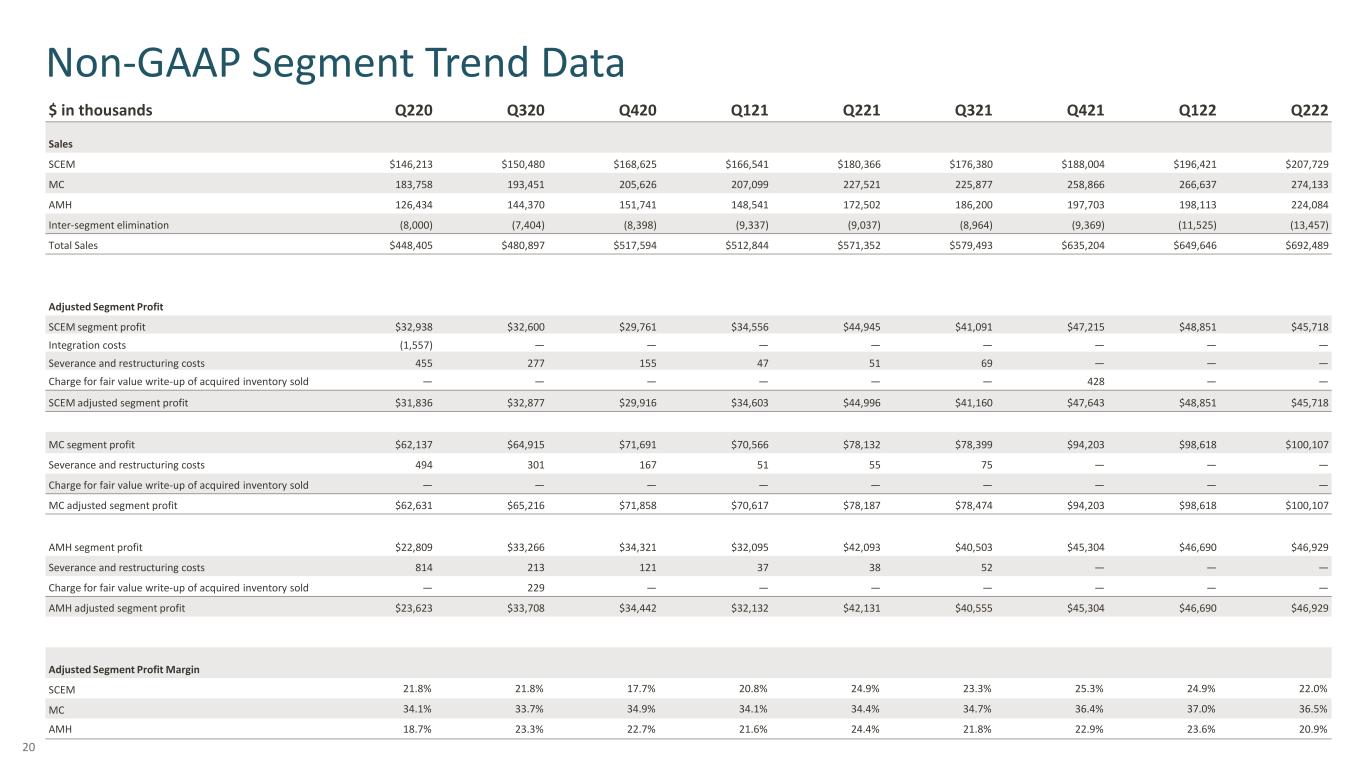
20 $ in thousands Q220 Q320 Q420 Q121 Q221 Q321 Q421 Q122 Q222 Sales SCEM $146,213 $150,480 $168,625 $166,541 $180,366 $176,380 $188,004 $196,421 $207,729 MC 183,758 193,451 205,626 207,099 227,521 225,877 258,866 266,637 274,133 AMH 126,434 144,370 151,741 148,541 172,502 186,200 197,703 198,113 224,084 Inter-segment elimination (8,000) (7,404) (8,398) (9,337) (9,037) (8,964) (9,369) (11,525) (13,457) Total Sales $448,405 $480,897 $517,594 $512,844 $571,352 $579,493 $635,204 $649,646 $692,489 Adjusted Segment Profit SCEM segment profit $32,938 $32,600 $29,761 $34,556 $44,945 $41,091 $47,215 $48,851 $45,718 Integration costs (1,557) — — — — — — — — Severance and restructuring costs 455 277 155 47 51 69 — — — Charge for fair value write-up of acquired inventory sold — — — — — — 428 — — SCEM adjusted segment profit $31,836 $32,877 $29,916 $34,603 $44,996 $41,160 $47,643 $48,851 $45,718 MC segment profit $62,137 $64,915 $71,691 $70,566 $78,132 $78,399 $94,203 $98,618 $100,107 Severance and restructuring costs 494 301 167 51 55 75 — — — Charge for fair value write-up of acquired inventory sold — — — — — — — — — MC adjusted segment profit $62,631 $65,216 $71,858 $70,617 $78,187 $78,474 $94,203 $98,618 $100,107 AMH segment profit $22,809 $33,266 $34,321 $32,095 $42,093 $40,503 $45,304 $46,690 $46,929 Severance and restructuring costs 814 213 121 37 38 52 — — — Charge for fair value write-up of acquired inventory sold — 229 — — — — — — — AMH adjusted segment profit $23,623 $33,708 $34,442 $32,132 $42,131 $40,555 $45,304 $46,690 $46,929 Adjusted Segment Profit Margin SCEM 21.8% 21.8% 17.7% 20.8% 24.9% 23.3% 25.3% 24.9% 22.0% MC 34.1% 33.7% 34.9% 34.1% 34.4% 34.7% 36.4% 37.0% 36.5% AMH 18.7% 23.3% 22.7% 21.6% 24.4% 21.8% 22.9% 23.6% 20.9% Non-GAAP Segment Trend Data