
Fifth Third Bancorp 8-K, filed Jul 21, 2022
Fifth Third Bancorp (FITB)
8-K
2022-07-21
For: 2022-07-21
View Original
Added on
April 10, 2026
About this 8-K
Fifth Third Bancorp filed this 8-K on July 21, 2022.
Items reported
- Item 2.02: Financial results
- Item 7.01: Regulation FD disclosure
- Item 9.01: Financial statements and exhibits
UNITED STATES
SECURITIES AND EXCHANGE COMMISSION
WASHINGTON, DC 20549
FORM 8-K
CURRENT REPORT
PURSUANT TO SECTION 13 OR 15(D)
OF THE SECURITIES EXCHANGE ACT OF 1934
Date of report (Date of earliest event reported): July 21, 2022

(Exact name of registrant as specified in its charter)
| (State or other jurisdiction of incorporation) | (Commission File Number) | (IRS Employer Identification No.) | ||||||||||||
| , | , | |||||||||||||||||||
| (Address of Principal Executive Offices) | (Zip Code) | |||||||||||||||||||
(800 ) 972-3030
(Registrant's telephone number, including area code)
Not Applicable
(Former name or former address, if changed since last report)
Check the appropriate box below if the Form 8-K filing is intended to simultaneously satisfy the filing obligation of the registrant under any of the following provisions (see General Instruction A.2. below)
| Securities registered pursuant to Section 12(b) of the Act: | ||||||||||||||||||||
| Title of each class | Trading Symbol(s) | Name of each exchange on which registered | ||||||||||||||||||
| The | Stock Market LLC | |||||||||||||||||||
| Depositary Shares Representing a 1/1000th Ownership Interest in a Share of 6.625% Fixed-to-Floating Rate Non-Cumulative Perpetual Preferred Stock, Series I | The | Stock Market LLC | ||||||||||||||||||
| The | Stock Market LLC | |||||||||||||||||||
| The | Stock Market LLC | |||||||||||||||||||
Indicate by check mark whether the registrant is an emerging growth company as defined in Rule 405 of the Securities Act of 1933 (§230.405 of this chapter) or Rule 12b-2 of the Securities Exchange Act of 1934 (§240.12b-2 of this chapter).
Emerging growth company ☐
If an emerging growth company, indicate by check mark if the registrant has elected not to use the extended transition period for complying with any new or revised financial accounting standards provided pursuant to Section 13(a) of the Exchange Act. ☐
Item 2.02 Results of Operations and Financial Condition.
On July 21, 2022, Fifth Third Bancorp issued a press release announcing its earnings release for the second quarter of 2022. A copy of this press release is attached as Exhibit 99.1. This information is furnished under both Item 2.02 Results of Operations and Financial Condition and Item 7.01 Regulation FD Disclosure.
The information in this Item 2.02 of Form 8-K and Exhibits attached hereto shall not be deemed filed for purposes of Section 18 of the Securities Exchange Act of 1934, nor shall they be deemed incorporated by reference in any filing under the Securities Exchange Act of 1934 or the Securities Act of 1933, except as shall be expressly set forth by specific reference.
Item 7.01 Regulation FD Disclosure.
On July 21, 2022, Fifth Third Bancorp issued a press release announcing its earnings release for the second quarter of 2022. A copy of this press release is attached as Exhibit 99.1. This information is furnished under both Item 2.02 Results of Operations and Financial Condition and Item 7.01 Regulation FD Disclosure.
For the benefit of its investors, Fifth Third Bancorp is also furnishing a presentation regarding its earnings conference call. A copy of this item is attached as Exhibit 99.2.
The information in this Item 7.01 of Form 8-K and Exhibits attached hereto shall not be deemed filed for purposes of Section 18 of the Securities Exchange Act of 1934, nor shall they be deemed incorporated by reference in any filing under the Securities Exchange Act of 1934 or the Securities Act of 1933, except as shall be expressly set forth by specific reference.
Item 9.01 Financial Statements and Exhibits
Exhibit 99.1 – Press release dated July 21, 2022
Exhibit 99.2 – Second Quarter 2022 Earnings Presentation
Exhibit 104 – Cover Page Interactive Data File (embedded within the Inline XBRL document)
SIGNATURES
Pursuant to the requirements of the Securities Exchange Act of 1934, the registrant has duly caused this report to be signed on its behalf by the undersigned hereunto duly authorized.
| FIFTH THIRD BANCORP | ||||||||
| (Registrant) | ||||||||
Date: July 21, 2022 | /s/ James C. Leonard | |||||||
| James C. Leonard | ||||||||
| Executive Vice President and Chief Financial Officer | ||||||||

Fifth Third Announces Second Quarter 2022 Results
Reported diluted earnings per share of $0.76
Reported results included a negative $0.03 impact from certain item(s) on page 2
| Key Financial Data | Key Highlights | |||||||||||||||||||||||||
| $ millions for all balance sheet and income statement items | ||||||||||||||||||||||||||
2Q22 | 1Q22 | 2Q21 | Select Business Highlights: •Generated consumer household growth of 2% compared to 2Q21 •Announced stress capital buffer requirement of 2.5% (regulatory minimum) •Closed acquisition of Dividend Finance, a national point-of-sale consumer lender •Announced $100 billion environmental and social finance target to be achieved through 2030 Select Financial Highlights: •ROTCE(a) of 17.5%; adjusted ROTCE(a) of 15.2% excl. AOCI •Compared to 2Q21, PPNR(a) increased 13% (adjusted PPNR(a) increased 11%) •Efficiency ratio(a) of 55%, a 4 point improvement from 2Q21 •Net interest income(a) increased 12% compared to 1Q22; NIM(a) up 33 basis points compared to 1Q22 •ACL of 1.85%, an increase of 5 bps from 1Q22 (includes 4 bps from Dividend Finance); Net charge-off ratio of 0.21% and NPA ratio of 0.47% | |||||||||||||||||||||||
| Income Statement Data | ||||||||||||||||||||||||||
| Net income available to common shareholders | $526 | $474 | $674 | |||||||||||||||||||||||
| Net interest income (U.S. GAAP) | 1,339 | 1,195 | 1,208 | |||||||||||||||||||||||
Net interest income (FTE)(a) | 1,342 | 1,198 | 1,211 | |||||||||||||||||||||||
| Noninterest income | 676 | 684 | 741 | |||||||||||||||||||||||
| Noninterest expense | 1,112 | 1,222 | 1,153 | |||||||||||||||||||||||
| Per Share Data | ||||||||||||||||||||||||||
| Earnings per share, basic | $0.76 | $0.69 | $0.95 | |||||||||||||||||||||||
| Earnings per share, diluted | 0.76 | 0.68 | 0.94 | |||||||||||||||||||||||
| Book value per share | 24.56 | 26.33 | 29.57 | |||||||||||||||||||||||
Tangible book value per share(a) | 17.10 | 19.54 | 23.34 | |||||||||||||||||||||||
| Balance Sheet & Credit Quality | ||||||||||||||||||||||||||
| Average portfolio loans and leases | $117,693 | $113,467 | $108,534 | |||||||||||||||||||||||
| Average deposits | 162,890 | 168,662 | 162,619 | |||||||||||||||||||||||
Net charge-off ratio(b) | 0.21 | % | 0.12 | % | 0.16 | % | ||||||||||||||||||||
Nonperforming asset ratio(c) | 0.47 | 0.49 | 0.61 | |||||||||||||||||||||||
| Financial Ratios | ||||||||||||||||||||||||||
| Return on average assets | 1.09 | % | 0.96 | % | 1.38 | % | ||||||||||||||||||||
| Return on average common equity | 12.3 | 10.0 | 13.0 | |||||||||||||||||||||||
Return on average tangible common equity(a) | 17.5 | 13.4 | 16.6 | |||||||||||||||||||||||
CET1 capital(d)(e) | 8.96 | 9.31 | 10.37 | |||||||||||||||||||||||
Net interest margin(a) | 2.92 | 2.59 | 2.63 | |||||||||||||||||||||||
Efficiency(a) | 55.1 | 64.9 | 59.1 | |||||||||||||||||||||||
Other than the Quarterly Financial Review tables beginning on page 14, commentary is on a fully taxable-equivalent (FTE) basis unless otherwise noted. Consistent with SEC guidance in Regulation S-K that contemplates the calculation of tax-exempt income on a taxable-equivalent basis, net interest income, net interest margin, net interest rate spread, total revenue and the efficiency ratio are provided on an FTE basis. | ||||||||||||||||||||||||||
| CEO Commentary | ||||||||||||||
Fifth Third has been deliberately built to perform well through-the-cycle. Our focus on maintaining discipline across the Company while growing and diversifying our revenues should ultimately result in sustainable outperformance relative to peers regardless of the economic environment. This outcome is evident in our second quarter financial performance. NIM expanded, net interest income increased, and expenses decreased compared to the prior quarter, resulting in an efficiency ratio of 55% despite softer fee revenue due to the macro environment. As a result, PPNR increased 13% compared to the year-ago quarter. We generated broad-based growth of relationships across our businesses. Our key credit quality metrics also remain well-behaved, reflecting our disciplined approach to client selection. Additionally, we added $10 billion in forward-starting swaps during the quarter to provide rate protection over the next decade.
Fifth Third continues to navigate the dynamic environment and generate strong financial results while fully supporting customers, communities, and employees. I am very proud that in addition to consistently producing strong financial results, we have also extended our ESG leadership position. Whether it's the 8 million meals we recently provided to fight hunger or our new $100 billion environmental and social finance target, we continue to live our purpose every day to improve the lives of our customers and the well-being of our communities.
-Tim Spence, President and CEO
Investor contact: Chris Doll (513) 534-2345 | Media contact: Ed Loyd (513) 534-6397 July 21, 2022
| Income Statement Highlights | ||||||||||||||||||||||||||||||||||||||||||||
| ($ in millions, except per share data) | For the Three Months Ended | % Change | ||||||||||||||||||||||||||||||||||||||||||
| June | March | June | ||||||||||||||||||||||||||||||||||||||||||
| 2022 | 2022 | 2021 | Seq | Yr/Yr | ||||||||||||||||||||||||||||||||||||||||
| Condensed Statements of Income | ||||||||||||||||||||||||||||||||||||||||||||
Net interest income (NII)(a) | $1,342 | $1,198 | $1,211 | 12% | 11% | |||||||||||||||||||||||||||||||||||||||
| Provision for (benefit from) credit losses | 179 | 45 | (115) | 298% | NM | |||||||||||||||||||||||||||||||||||||||
| Noninterest income | 676 | 684 | 741 | (1)% | (9)% | |||||||||||||||||||||||||||||||||||||||
| Noninterest expense | 1,112 | 1,222 | 1,153 | (9)% | (4)% | |||||||||||||||||||||||||||||||||||||||
Income before income taxes(a) | $727 | $615 | $914 | 18% | (20)% | |||||||||||||||||||||||||||||||||||||||
| Taxable equivalent adjustment | $3 | $3 | $3 | — | — | |||||||||||||||||||||||||||||||||||||||
| Applicable income tax expense | 162 | 118 | 202 | 37% | (20)% | |||||||||||||||||||||||||||||||||||||||
| Net income | $562 | $494 | $709 | 14% | (21)% | |||||||||||||||||||||||||||||||||||||||
| Dividends on preferred stock | 36 | 20 | 35 | 80% | 3% | |||||||||||||||||||||||||||||||||||||||
| Net income available to common shareholders | $526 | $474 | $674 | 11% | (22)% | |||||||||||||||||||||||||||||||||||||||
| Earnings per share, diluted | $0.76 | $0.68 | $0.94 | 12% | (19)% | |||||||||||||||||||||||||||||||||||||||
Fifth Third Bancorp (NASDAQ®: FITB) today reported second quarter 2022 net income of $562 million compared to net income of $494 million in the prior quarter and $709 million in the year-ago quarter. Net income available to common shareholders in the current quarter was $526 million, or $0.76 per diluted share, compared to $474 million, or $0.68 per diluted share, in the prior quarter and $674 million, or $0.94 per diluted share, in the year-ago quarter.
Diluted earnings per share impact of certain item(s) - 2Q22 | |||||||||||||||||
(after-tax impact(f); $ in millions, except per share data) | |||||||||||||||||
| Valuation of Visa total return swap (noninterest income) | $(14) | ||||||||||||||||
| Business disposition charges (noninterest income) | (5) | ||||||||||||||||
After-tax impact(f) of certain items | $(19) | ||||||||||||||||
Diluted earnings per share impact of certain item(s)1 | $(0.03) | ||||||||||||||||
1Diluted earnings per share impact reflects 694.805 million average diluted shares outstanding | |||||||||||||||||
2
| Net Interest Income | ||||||||||||||||||||||||||||||||||||||||||||
(FTE; $ in millions)(a) | For the Three Months Ended | % Change | ||||||||||||||||||||||||||||||||||||||||||
| June | March | June | ||||||||||||||||||||||||||||||||||||||||||
| 2022 | 2022 | 2021 | Seq | Yr/Yr | ||||||||||||||||||||||||||||||||||||||||
| Interest Income | ||||||||||||||||||||||||||||||||||||||||||||
| Interest income | $1,467 | $1,292 | $1,326 | 14% | 11% | |||||||||||||||||||||||||||||||||||||||
| Interest expense | 125 | 94 | 115 | 33% | 9% | |||||||||||||||||||||||||||||||||||||||
| Net interest income (NII) | $1,342 | $1,198 | $1,211 | 12% | 11% | |||||||||||||||||||||||||||||||||||||||
| Average Yield/Rate Analysis | bps Change | |||||||||||||||||||||||||||||||||||||||||||
| Yield on interest-earning assets | 3.19 | % | 2.79 | % | 2.88 | % | 40 | 31 | ||||||||||||||||||||||||||||||||||||
| Rate paid on interest-bearing liabilities | 0.43 | % | 0.33 | % | 0.40 | % | 10 | 3 | ||||||||||||||||||||||||||||||||||||
| Ratios | ||||||||||||||||||||||||||||||||||||||||||||
| Net interest rate spread | 2.76 | % | 2.46 | % | 2.48 | % | 30 | 28 | ||||||||||||||||||||||||||||||||||||
| Net interest margin (NIM) | 2.92 | % | 2.59 | % | 2.63 | % | 33 | 29 | ||||||||||||||||||||||||||||||||||||
Compared to the prior quarter, NII increased $144 million, or 12%, primarily reflecting higher market rates, as well as growth in investment portfolio balances and commercial & industrial (C&I) loan balances, partially offset by a reduction in prepayment penalties received in the investment portfolio (approximately $5 million in the current quarter compared to $24 million in the prior quarter) as well as lower interest income from government guaranteed mortgage buyouts. PPP-related income was $12 million in the current quarter compared to $20 million in the prior quarter. Compared to the prior quarter, NIM increased 33 bps, reflecting the benefit of higher market rates as well as a decrease in other short-term investments (primarily interest-bearing cash), partially offset by a reduction in prepayment penalties received in the investment portfolio.
Compared to the year-ago quarter, NII increased $131 million, or 11%, reflecting the recent benefits of higher market rates, as well as growth in investment portfolio balances and C&I loan balances, partially offset by lower PPP-related income and lower interest income from government guaranteed mortgage buyouts. Compared to the year-ago quarter, NIM increased 29 bps, reflecting the benefit of higher market rates as well as a decrease in other short-term investments (primarily interest-bearing cash).
3
| Noninterest Income | |||||||||||||||||||||||||||||||||||
| ($ in millions) | For the Three Months Ended | % Change | |||||||||||||||||||||||||||||||||
| June | March | June | |||||||||||||||||||||||||||||||||
| 2022 | 2022 | 2021 | Seq | Yr/Yr | |||||||||||||||||||||||||||||||
| Noninterest Income | |||||||||||||||||||||||||||||||||||
| Service charges on deposits | $154 | $152 | $149 | 1% | 3% | ||||||||||||||||||||||||||||||
| Commercial banking revenue | 137 | 135 | 160 | 1% | (14)% | ||||||||||||||||||||||||||||||
| Mortgage banking net revenue | 31 | 52 | 64 | (40)% | (52)% | ||||||||||||||||||||||||||||||
| Wealth and asset management revenue | 140 | 149 | 145 | (6)% | (3)% | ||||||||||||||||||||||||||||||
| Card and processing revenue | 105 | 97 | 102 | 8% | 3% | ||||||||||||||||||||||||||||||
| Leasing business revenue | 56 | 62 | 61 | (10)% | (8)% | ||||||||||||||||||||||||||||||
| Other noninterest income | 85 | 52 | 49 | 63% | 73% | ||||||||||||||||||||||||||||||
| Securities (losses) gains, net | (32) | (14) | 10 | 129% | NM | ||||||||||||||||||||||||||||||
| Securities (losses) gains, net - non-qualifying hedges | |||||||||||||||||||||||||||||||||||
| on mortgage servicing rights | — | (1) | 1 | (100)% | (100)% | ||||||||||||||||||||||||||||||
| Total noninterest income | $676 | $684 | $741 | (1)% | (9)% | ||||||||||||||||||||||||||||||
Reported noninterest income decreased $8 million, or 1%, from the prior quarter, and decreased $65 million, or 9%, from the year-ago quarter. The reported results reflect the impact of certain items in the table below. Reported current quarter results included $32 million of net securities losses, which included $26 million in net losses attributable to mark-to-market impacts related to investments supporting non-qualified deferred compensation plans, as well as a $3 million loss attributable to market value changes on Fifth Third's shares of AvidXchange Holdings, Inc.
| Noninterest Income excluding certain items | |||||||||||||||||||||||||||||
| ($ in millions) | For the Three Months Ended | ||||||||||||||||||||||||||||
| June | March | June | |||||||||||||||||||||||||||
| 2022 | 2022 | 2021 | |||||||||||||||||||||||||||
| Noninterest Income excluding certain items | |||||||||||||||||||||||||||||
| Noninterest income (U.S. GAAP) | $676 | $684 | $741 | ||||||||||||||||||||||||||
| Valuation of Visa total return swap | 18 | 11 | 37 | ||||||||||||||||||||||||||
| Business disposition charges | 6 | — | — | ||||||||||||||||||||||||||
| Securities losses/(gains), net | 32 | 14 | (10) | ||||||||||||||||||||||||||
Noninterest income excluding certain items(a) | $732 | $709 | $768 | ||||||||||||||||||||||||||
Compared to the prior quarter, noninterest income excluding certain items increased $23 million, or 3%. Compared to the year-ago quarter, noninterest income excluding certain items decreased $36 million, or 5%.
Compared to the prior quarter, service charges on deposits increased $2 million, or 1%, primarily reflecting an increase in consumer deposit fees, as an increase in gross commercial treasury management revenue was offset by earnings credits. Commercial banking revenue increased $2 million, or 1%, primarily driven by M&A advisory revenue and higher customer financial risk management revenue, partially offset by a decrease in corporate bond fees. Mortgage banking net revenue decreased $21 million, or 40%, primarily reflecting a $28 million decrease from MSR net valuation adjustments, partially offset by a $10 million increase in mortgage servicing revenue. Wealth and asset management revenue decreased $9 million, or 6%, driven by the impact of lower market values and seasonally strong tax-related private client service revenue from the prior quarter. Card and processing revenue increased $8 million, or 8%, primarily driven by higher spend volumes, partially offset by higher rewards. Leasing business revenue decreased $6 million, or 10%, reflecting the disposition of LaSalle Solutions. The increase in other noninterest income was primarily attributable to higher private equity income.
Compared to the year-ago quarter, service charges on deposits increased $5 million, or 3%, primarily reflecting an increase in commercial treasury management fees. Commercial banking revenue decreased $23 million, or 14%, primarily
4
driven by decreases in corporate bond fees and loan syndication revenue, partially offset by an increase in customer financial risk management revenue. Mortgage banking net revenue decreased $33 million, or 52%, reflecting a $58 million decrease in origination fees and gains on loan sales and a $16 million reduction from MSR net valuation adjustments, partially offset by a $22 million increase in mortgage servicing revenue and a $19 million decrease in MSR asset decay reflecting slower prepayment speeds. Wealth and asset management revenue decreased $5 million, or 3%, reflecting lower personal asset management revenue. Card and processing revenue increased $3 million, or 3%, primarily driven by higher spend volumes, partially offset by higher rewards. Leasing business revenue decreased $5 million, or 8%, reflecting the disposition of LaSalle Solutions, partially offset by an increase in lease syndication revenue. The increase in other noninterest income was primarily attributable to higher private equity income.
| Noninterest Expense | ||||||||||||||||||||||||||||||||||||||||||||
| ($ in millions) | For the Three Months Ended | % Change | ||||||||||||||||||||||||||||||||||||||||||
| June | March | June | ||||||||||||||||||||||||||||||||||||||||||
| 2022 | 2022 | 2021 | Seq | Yr/Yr | ||||||||||||||||||||||||||||||||||||||||
| Noninterest Expense | ||||||||||||||||||||||||||||||||||||||||||||
| Compensation and benefits | $584 | $711 | $638 | (18)% | (8)% | |||||||||||||||||||||||||||||||||||||||
| Net occupancy expense | 75 | 77 | 77 | (3)% | (3)% | |||||||||||||||||||||||||||||||||||||||
| Technology and communications | 98 | 101 | 94 | (3)% | 4% | |||||||||||||||||||||||||||||||||||||||
| Equipment expense | 36 | 36 | 34 | — | 6% | |||||||||||||||||||||||||||||||||||||||
| Card and processing expense | 20 | 19 | 20 | 5% | — | |||||||||||||||||||||||||||||||||||||||
| Leasing business expense | 31 | 32 | 33 | (3)% | (6)% | |||||||||||||||||||||||||||||||||||||||
| Marketing expense | 28 | 24 | 20 | 17% | 40% | |||||||||||||||||||||||||||||||||||||||
| Other noninterest expense | 240 | 222 | 237 | 8% | 1% | |||||||||||||||||||||||||||||||||||||||
| Total noninterest expense | $1,112 | $1,222 | $1,153 | (9)% | (4)% | |||||||||||||||||||||||||||||||||||||||
Compared to the prior quarter, noninterest expense decreased $110 million, or 9%, driven by a decrease in compensation and benefits expense, reflecting seasonally-higher compensation in the prior quarter, lower incentive-based compensation due to the current market dynamics, and overall expense discipline throughout the firm. Noninterest expense in the current quarter included a $27 million benefit related to the impact of non-qualified deferred compensation mark-to-market (compared to a $12 million benefit in the prior quarter). Excluding the non-qualified deferred compensation impacts from both periods, total noninterest expense decreased $95 million, or 8%.
Compared to the year-ago quarter, noninterest expense decreased $41 million, or 4%, reflecting a decrease in compensation and benefits expense. This was partially offset by higher marketing expense and an increase in technology and communications expense related to continued modernization investments.
5
| Average Interest-Earning Assets | ||||||||||||||||||||||||||||||||||||||||||||
| ($ in millions) | For the Three Months Ended | % Change | ||||||||||||||||||||||||||||||||||||||||||
| June | March | June | ||||||||||||||||||||||||||||||||||||||||||
| 2022 | 2022 | 2021 | Seq | Yr/Yr | ||||||||||||||||||||||||||||||||||||||||
| Average Portfolio Loans and Leases | ||||||||||||||||||||||||||||||||||||||||||||
| Commercial loans and leases: | ||||||||||||||||||||||||||||||||||||||||||||
| Commercial and industrial loans | $55,460 | $52,554 | $48,773 | 6% | 14% | |||||||||||||||||||||||||||||||||||||||
| Commercial mortgage loans | 10,710 | 10,521 | 10,459 | 2% | 2% | |||||||||||||||||||||||||||||||||||||||
| Commercial construction loans | 5,356 | 5,371 | 6,043 | — | (11)% | |||||||||||||||||||||||||||||||||||||||
| Commercial leases | 2,839 | 2,942 | 3,174 | (4)% | (11)% | |||||||||||||||||||||||||||||||||||||||
| Total commercial loans and leases | $74,365 | $71,388 | $68,449 | 4% | 9% | |||||||||||||||||||||||||||||||||||||||
| Consumer loans: | ||||||||||||||||||||||||||||||||||||||||||||
| Residential mortgage loans | $17,363 | $16,501 | $15,883 | 5% | 9% | |||||||||||||||||||||||||||||||||||||||
| Home equity | 3,895 | 4,009 | 4,674 | (3)% | (17)% | |||||||||||||||||||||||||||||||||||||||
| Indirect secured consumer loans | 17,241 | 17,136 | 14,702 | 1% | 17% | |||||||||||||||||||||||||||||||||||||||
| Credit card | 1,704 | 1,691 | 1,770 | 1% | (4)% | |||||||||||||||||||||||||||||||||||||||
| Other consumer loans | 3,125 | 2,742 | 3,056 | 14% | 2% | |||||||||||||||||||||||||||||||||||||||
| Total consumer loans | $43,328 | $42,079 | $40,085 | 3% | 8% | |||||||||||||||||||||||||||||||||||||||
| Total average portfolio loans and leases | $117,693 | $113,467 | $108,534 | 4% | 8% | |||||||||||||||||||||||||||||||||||||||
| Memo: | ||||||||||||||||||||||||||||||||||||||||||||
| Average PPP loans | $549 | $1,012 | $4,810 | (46)% | (89)% | |||||||||||||||||||||||||||||||||||||||
| Average portfolio commercial and industrial loans - excl. PPP loans | $54,911 | $51,542 | $43,963 | 7% | 25% | |||||||||||||||||||||||||||||||||||||||
| Average Loans and Leases Held for Sale | ||||||||||||||||||||||||||||||||||||||||||||
| Commercial loans and leases held for sale | $7 | $18 | $52 | (61)% | (87)% | |||||||||||||||||||||||||||||||||||||||
| Consumer loans held for sale | 2,536 | 3,677 | 5,857 | (31)% | (57)% | |||||||||||||||||||||||||||||||||||||||
| Total average loans and leases held for sale | $2,543 | $3,695 | $5,909 | (31)% | (57)% | |||||||||||||||||||||||||||||||||||||||
| Total average loans and leases | $120,236 | $117,162 | $114,443 | 3% | 5% | |||||||||||||||||||||||||||||||||||||||
| Securities (taxable and tax-exempt) | $54,538 | $42,422 | $36,917 | 29% | 48% | |||||||||||||||||||||||||||||||||||||||
| Other short-term investments | 9,632 | 28,310 | 33,558 | (66)% | (71)% | |||||||||||||||||||||||||||||||||||||||
| Total average interest-earning assets | $184,406 | $187,894 | $184,918 | (2)% | — | |||||||||||||||||||||||||||||||||||||||
Compared to the prior quarter, total average portfolio loans and leases increased 4%, reflecting an increase in both commercial and consumer portfolios. Average commercial portfolio loans and leases increased 4%, primarily reflecting C&I loan growth of 6%. Average consumer portfolio loans increased 3%, reflecting higher residential mortgage and other consumer loans (primarily from the Dividend Finance acquisition), partially offset by lower home equity balances.
Compared to the year-ago quarter, total average portfolio loans and leases increased 8%, reflecting an increase in both commercial and consumer portfolios. Average commercial portfolio loans and leases increased 9%, primarily reflecting C&I loan growth of 14%, partially offset by lower commercial construction loans. Average consumer portfolio loans increased 8%, as higher indirect secured consumer and residential mortgage loans were partially offset by lower home equity balances.
Average loans and leases held for sale were $3 billion in the current quarter compared to $4 billion in the prior quarter and $6 billion in the year-ago quarter. Current quarter average loans and leases held for sale were impacted by a decline in residential mortgage balances (primarily from a decline in government guaranteed mortgage buyouts).
Average securities (taxable and tax-exempt) of $55 billion in the current quarter increased $12 billion, or 29%, compared to the prior quarter and increased $18 billion, or 48%, compared to the year-ago quarter. Average other short-term investments (including interest-bearing cash) of $10 billion in the current quarter decreased $19 billion, or 66%, compared to the prior quarter and decreased $24 billion, or 71%, compared to the year-ago quarter.
6
Total period-end commercial portfolio loans and leases of $75 billion increased 3% compared to the prior quarter, primarily reflecting C&I loan growth of 4%. Compared to the year-ago quarter, total period-end commercial portfolio loans increased 12%, primarily reflecting C&I loan growth of 18%, partially offset by lower commercial construction loan balances. Period-end commercial revolving line utilization was 37%, compared to 36% in the prior quarter and 31% in the year-ago quarter.
Period-end consumer portfolio loans of $44 billion increased 2% compared to the prior quarter, primarily reflecting higher other consumer loans (primarily from the Dividend Finance acquisition) and residential mortgage loans, partially offset by a decline in indirect secured consumer loan balances. Compared to the year-ago quarter, total period-end consumer portfolio loans increased 8%, reflecting an increase in indirect secured consumer loans and residential mortgage loans, partially offset by lower home equity balances.
Total period-end securities (taxable and tax-exempt; amortized cost) of $57 billion in the current quarter increased $6 billion, or 12%, compared to the prior quarter and increased $20 billion, or 54%, compared to the year-ago quarter. Period-end other short-term investments of $7 billion in the current quarter decreased $13 billion, or 64%, compared to the prior quarter and decreased $25 billion, or 77%, compared to the year-ago quarter.
| Average Deposits | ||||||||||||||||||||||||||||||||||||||||||||
| ($ in millions) | For the Three Months Ended | % Change | ||||||||||||||||||||||||||||||||||||||||||
| June | March | June | ||||||||||||||||||||||||||||||||||||||||||
| 2022 | 2022 | 2021 | Seq | Yr/Yr | ||||||||||||||||||||||||||||||||||||||||
| Average Deposits | ||||||||||||||||||||||||||||||||||||||||||||
| Demand | $62,555 | $64,212 | $61,994 | (3)% | 1% | |||||||||||||||||||||||||||||||||||||||
| Interest checking | 44,349 | 48,659 | 45,307 | (9)% | (2)% | |||||||||||||||||||||||||||||||||||||||
| Savings | 23,708 | 22,772 | 20,494 | 4% | 16% | |||||||||||||||||||||||||||||||||||||||
| Money market | 29,284 | 30,263 | 30,844 | (3)% | (5)% | |||||||||||||||||||||||||||||||||||||||
Foreign office(g) | 139 | 126 | 140 | 10% | (1)% | |||||||||||||||||||||||||||||||||||||||
| Total transaction deposits | $160,035 | $166,032 | $158,779 | (4)% | 1% | |||||||||||||||||||||||||||||||||||||||
| CDs $250,000 or less | 2,193 | 2,376 | 3,514 | (8)% | (38)% | |||||||||||||||||||||||||||||||||||||||
| Total core deposits | $162,228 | $168,408 | $162,293 | (4)% | — | |||||||||||||||||||||||||||||||||||||||
| CDs over $250,000 | 662 | 254 | 326 | 161% | 103% | |||||||||||||||||||||||||||||||||||||||
| Total average deposits | $162,890 | $168,662 | $162,619 | (3)% | — | |||||||||||||||||||||||||||||||||||||||
Compared to the prior quarter, average core deposits decreased 4% as decreases in interest checking, demand deposit and money market balances (primarily reflecting runoff of excess and higher cost commercial deposits) were partially offset by increases in savings deposit balances. Average demand deposits represented 39% of total core deposits in the current quarter, relatively stable with the prior quarter. Average commercial transaction deposits decreased 8% and average consumer transaction deposits increased 1%.
Compared to the year-ago quarter, average core deposits were flat, as ongoing success in generating consumer household growth was offset by runoff of excess and higher cost commercial deposits. Average commercial transaction deposits decreased 5% and average consumer transaction deposits increased 7%.
The period end portfolio loan-to-core deposit ratio was 75% in the current quarter, compared to 68% in the prior quarter and 67% in the year-ago quarter.
7
| Average Wholesale Funding | ||||||||||||||||||||||||||||||||||||||||||||
| ($ in millions) | For the Three Months Ended | % Change | ||||||||||||||||||||||||||||||||||||||||||
| June | March | June | ||||||||||||||||||||||||||||||||||||||||||
| 2022 | 2022 | 2021 | Seq | Yr/Yr | ||||||||||||||||||||||||||||||||||||||||
| Average Wholesale Funding | ||||||||||||||||||||||||||||||||||||||||||||
| CDs over $250,000 | $662 | $254 | $326 | 161% | 103% | |||||||||||||||||||||||||||||||||||||||
| Federal funds purchased | 392 | 259 | 346 | 51% | 13% | |||||||||||||||||||||||||||||||||||||||
| Other short-term borrowings | 3,571 | 890 | 1,097 | 301% | 226% | |||||||||||||||||||||||||||||||||||||||
| Long-term debt | 11,164 | 11,165 | 13,883 | — | (20)% | |||||||||||||||||||||||||||||||||||||||
| Total average wholesale funding | $15,789 | $12,568 | $15,652 | 26% | 1% | |||||||||||||||||||||||||||||||||||||||
Compared to the prior quarter, average wholesale funding increased 26%, reflecting increases in other short-term borrowings, jumbo CD balances, and federal funds purchased. During the quarter, $700 million in long-term debt was retired and $1 billion in long-term debt was issued. Compared to the year-ago quarter, average wholesale funding increased 1%, reflecting increases in other short-term borrowings, jumbo CD balances, and federal funds purchased, partially offset by decreases in long-term debt.
8
| Credit Quality Summary | ||||||||||||||||||||||||||||||||||||||||||||
| ($ in millions) | As of and For the Three Months Ended | |||||||||||||||||||||||||||||||||||||||||||
| June | March | December | September | June | ||||||||||||||||||||||||||||||||||||||||
| 2022 | 2022 | 2021 | 2021 | 2021 | ||||||||||||||||||||||||||||||||||||||||
| Total nonaccrual portfolio loans and leases (NPLs) | $539 | $534 | $498 | $528 | $621 | |||||||||||||||||||||||||||||||||||||||
| Repossessed property | 6 | 5 | 5 | 4 | 5 | |||||||||||||||||||||||||||||||||||||||
| OREO | 14 | 27 | 24 | 27 | 31 | |||||||||||||||||||||||||||||||||||||||
| Total nonperforming portfolio loans and leases and OREO (NPAs) | $559 | $566 | $527 | $559 | $657 | |||||||||||||||||||||||||||||||||||||||
NPL ratio(h) | 0.45 | % | 0.46 | % | 0.44 | % | 0.49 | % | 0.58 | % | ||||||||||||||||||||||||||||||||||
NPA ratio(c) | 0.47 | % | 0.49 | % | 0.47 | % | 0.52 | % | 0.61 | % | ||||||||||||||||||||||||||||||||||
| Total loans and leases 30-89 days past due (accrual) | $294 | $288 | $254 | $267 | $281 | |||||||||||||||||||||||||||||||||||||||
| Total loans and leases 90 days past due (accrual) | 39 | 50 | 117 | 92 | 83 | |||||||||||||||||||||||||||||||||||||||
| Allowance for loan and lease losses (ALLL), beginning | $1,908 | $1,892 | $1,954 | $2,033 | $2,208 | |||||||||||||||||||||||||||||||||||||||
| Total net losses charged-off | (62) | (34) | (38) | (21) | (44) | |||||||||||||||||||||||||||||||||||||||
| Provision for (benefit from) loan and lease losses | 168 | 50 | (24) | (58) | (131) | |||||||||||||||||||||||||||||||||||||||
| ALLL, ending | $2,014 | $1,908 | $1,892 | $1,954 | $2,033 | |||||||||||||||||||||||||||||||||||||||
| Reserve for unfunded commitments, beginning | $177 | $182 | $205 | $189 | $173 | |||||||||||||||||||||||||||||||||||||||
| Provision for (benefit from) the reserve for unfunded commitments | 11 | (5) | (23) | 16 | 16 | |||||||||||||||||||||||||||||||||||||||
| Reserve for unfunded commitments, ending | $188 | $177 | $182 | $205 | $189 | |||||||||||||||||||||||||||||||||||||||
| Total allowance for credit losses (ACL) | $2,202 | $2,085 | $2,074 | $2,159 | $2,222 | |||||||||||||||||||||||||||||||||||||||
| ACL ratios: | ||||||||||||||||||||||||||||||||||||||||||||
| As a % of portfolio loans and leases | 1.85 | % | 1.80 | % | 1.85 | % | 2.00 | % | 2.06 | % | ||||||||||||||||||||||||||||||||||
| As a % of nonperforming portfolio loans and leases | 408 | % | 391 | % | 416 | % | 409 | % | 358 | % | ||||||||||||||||||||||||||||||||||
| As a % of nonperforming portfolio assets | 394 | % | 369 | % | 394 | % | 386 | % | 338 | % | ||||||||||||||||||||||||||||||||||
| ALLL as a % of portfolio loans and leases | 1.70 | % | 1.65 | % | 1.69 | % | 1.81 | % | 1.89 | % | ||||||||||||||||||||||||||||||||||
| Total losses charged-off | $(90) | $(64) | $(77) | $(56) | $(103) | |||||||||||||||||||||||||||||||||||||||
| Total recoveries of losses previously charged-off | 28 | 30 | 39 | 35 | 59 | |||||||||||||||||||||||||||||||||||||||
| Total net losses charged-off | $(62) | $(34) | $(38) | $(21) | $(44) | |||||||||||||||||||||||||||||||||||||||
Net charge-off ratio (NCO ratio)(b) | 0.21 | % | 0.12 | % | 0.14 | % | 0.08 | % | 0.16 | % | ||||||||||||||||||||||||||||||||||
| Commercial NCO ratio | 0.19 | % | 0.05 | % | 0.10 | % | 0.03 | % | 0.10 | % | ||||||||||||||||||||||||||||||||||
| Consumer NCO ratio | 0.24 | % | 0.25 | % | 0.21 | % | 0.16 | % | 0.26 | % | ||||||||||||||||||||||||||||||||||
Nonperforming portfolio loans and leases were $539 million in the current quarter, with the resulting NPL ratio of 0.45%. Compared to the prior quarter, NPLs increased $5 million with the NPL ratio decreasing 1 bp. Compared to the year-ago quarter, NPLs decreased $82 million with the NPL ratio decreasing 13 bps.
Nonperforming portfolio assets were $559 million in the current quarter, with the resulting NPA ratio of 0.47%. Compared to the prior quarter, NPAs decreased $7 million with the NPA ratio decreasing 2 bps. Compared to the year-ago quarter, NPAs decreased $98 million with the NPA ratio decreasing 14 bps.
The provision for credit losses totaled $179 million in the current quarter, including approximately $53 million for the provision expense for loans and unfunded commitments associated with the Dividend Finance acquisition. The allowance for credit loss ratio represented 1.85% of total portfolio loans and leases at quarter end, compared with 1.80% for the prior
9
quarter end and 2.06% for the year-ago quarter end. In the current quarter, the allowance for credit losses represented 408% of nonperforming portfolio loans and leases and 394% of nonperforming portfolio assets.
Net charge-offs were $62 million in the current quarter, with the resulting NCO ratio of 0.21%. Compared to the prior quarter, net charge-offs increased $28 million and the NCO ratio increased 9 bps, reflecting higher charge-offs in the commercial portfolio. Compared to the year-ago quarter, net charge-offs increased $18 million and the NCO ratio increased 5 bps, reflecting higher commercial net charge-offs, offset by slightly lower consumer net charge-offs.
| Capital Position | ||||||||||||||||||||||||||||||||||||||||||||||||||
| As of and For the Three Months Ended | ||||||||||||||||||||||||||||||||||||||||||||||||||
| June | March | December | September | June | ||||||||||||||||||||||||||||||||||||||||||||||
| 2022 | 2022 | 2021 | 2021 | 2021 | ||||||||||||||||||||||||||||||||||||||||||||||
| Capital Position | ||||||||||||||||||||||||||||||||||||||||||||||||||
| Average total Bancorp shareholders' equity as a % of average assets | 9.35 | % | 10.23 | % | 10.71% | 11.16% | 11.11 | % | ||||||||||||||||||||||||||||||||||||||||||
Tangible equity(a) | 8.05 | % | 7.98 | % | 7.97% | 8.06% | 8.35 | % | ||||||||||||||||||||||||||||||||||||||||||
Tangible common equity (excluding AOCI)(a) | 7.01 | % | 6.96 | % | 6.94% | 7.01% | 7.28 | % | ||||||||||||||||||||||||||||||||||||||||||
Tangible common equity (including AOCI)(a) | 5.82 | % | 6.48 | % | 7.47% | 7.74% | 8.18 | % | ||||||||||||||||||||||||||||||||||||||||||
Regulatory Capital Ratios(d)(e) | ||||||||||||||||||||||||||||||||||||||||||||||||||
CET1 capital | 8.96 | % | 9.31 | % | 9.54% | 9.86% | 10.37 | % | ||||||||||||||||||||||||||||||||||||||||||
Tier 1 risk-based capital | 10.24 | % | 10.63 | % | 10.91% | 11.28% | 11.83 | % | ||||||||||||||||||||||||||||||||||||||||||
Total risk-based capital | 12.48 | % | 12.93 | % | 13.42% | 13.94% | 14.60 | % | ||||||||||||||||||||||||||||||||||||||||||
| Leverage | 8.30 | % | 8.32 | % | 8.27% | 8.41% | 8.55 | % | ||||||||||||||||||||||||||||||||||||||||||
The CET1 capital ratio was 8.96%, the tangible common equity to tangible assets ratio was 7.01% excluding AOCI, and 5.82% including AOCI. The Tier 1 risk-based capital ratio was 10.24%, the Total risk-based capital ratio was 12.48%, and the Leverage ratio was 8.30%.
On June 27, 2022, Fifth Third released its indicative stress capital buffer requirement resulting from the Federal Reserve
Board’s 2022 annual bank stress test, incorporating the supervisory severely adverse scenario published in February 2022. Fifth Third’s indicative stress capital buffer under this scenario is 2.5%, effective October 1, 2022. The stress capital buffer of 2.5% is the floor under the regulatory capital rules.
10
Tax Rate
The effective tax rate was 22.4% compared with 19.2% in the prior quarter and 22.1% in the year-ago quarter.
Conference Call
Fifth Third will host a conference call to discuss these financial results at 9:00 a.m. (Eastern Time) today. This conference call will be webcast live and may be accessed through the Fifth Third Investor Relations website at www.53.com (click on “About Us” then “Investor Relations”). Those unable to listen to the live webcast may access a webcast replay through the Fifth Third Investor Relations website at the same web address, which will be available for 30 days.
Corporate Profile
Fifth Third Bancorp is a diversified financial services company headquartered in Cincinnati, Ohio, and the indirect parent company of Fifth Third Bank, National Association, a federally chartered institution. As of June 30, 2022, the Company had $207 billion in assets and operates 1,080 full-service Banking Centers, and 2,153 Fifth Third branded ATMs in Ohio, Kentucky, Indiana, Michigan, Illinois, Florida, Tennessee, West Virginia, Georgia, North Carolina and South Carolina. In total, Fifth Third provides its customers with access to approximately 56,000 fee-free ATMs across the United States. Fifth Third operates four main businesses: Commercial Banking, Branch Banking, Consumer Lending, and Wealth & Asset Management. Fifth Third is among the largest money managers in the Midwest and, as of June 30, 2022, had $512 billion in assets under care, of which it managed $54 billion for individuals, corporations and not-for-profit organizations through its Trust and Registered Investment Advisory businesses. Investor information and press releases can be viewed at www.53.com. Fifth Third’s common stock is traded on the NASDAQ® Global Select Market under the symbol “FITB.”
Earnings Release End Notes
(a)Non-GAAP measure; see discussion of non-GAAP reconciliation beginning on page 27.
(b)Net losses charged-off as a percent of average portfolio loans and leases presented on an annualized basis.
(c)Nonperforming portfolio assets as a percent of portfolio loans and leases and OREO.
(d)Regulatory capital ratios are calculated pursuant to the five-year transition provision option to phase in the effects of CECL on regulatory capital after its adoption on January 1, 2020.
(e)Current period regulatory capital ratios are estimated.
(f)Assumes a 23% tax rate.
(g)Includes commercial customer Eurodollar sweep balances for which the Bank pays rates comparable to other commercial deposit accounts.
(h)Nonperforming portfolio loans and leases as a percent of portfolio loans and leases.
11
FORWARD-LOOKING STATEMENTS
This release contains statements that we believe are “forward-looking statements” within the meaning of Section 27A of the Securities Act of 1933, as amended, and Rule 175 promulgated thereunder, and Section 21E of the Securities Exchange Act of 1934, as amended, and Rule 3b-6 promulgated thereunder. All statements other than statements of historical fact are forward-looking statements. These statements relate to our financial condition, results of operations, plans, objectives, future performance, capital actions or business. They usually can be identified by the use of forward-looking language such as “will likely result,” “may,” “are expected to,” “is anticipated,” “potential,” “estimate,” “forecast,” “projected,” “intends to,” or may include other similar words or phrases such as “believes,” “plans,” “trend,” “objective,” “continue,” “remain,” or similar expressions, or future or conditional verbs such as “will,” “would,” “should,” “could,” “might,” “can,” or similar verbs. You should not place undue reliance on these statements, as they are subject to risks and uncertainties, including but not limited to the risk factors set forth in our most recent Annual Report on Form 10-K as updated by our filings with the U.S. Securities and Exchange Commission (“SEC”).
There are a number of important factors that could cause future results to differ materially from historical performance and these forward-looking statements. Factors that might cause such a difference include, but are not limited to: (1) effects of the global COVID-19 pandemic; (2) deteriorating credit quality; (3) loan concentration by location or industry of borrowers or collateral; (4) problems encountered by other financial institutions; (5) inadequate sources of funding or liquidity; (6) unfavorable actions of rating agencies; (7) inability to maintain or grow deposits; (8) limitations on the ability to receive dividends from subsidiaries; (9) cyber-security risks; (10) Fifth Third’s ability to secure confidential information and deliver products and services through the use of computer systems and telecommunications networks; (11) failures by third-party service providers; (12) inability to manage strategic initiatives and/or organizational changes; (13) inability to implement technology system enhancements; (14) failure of internal controls and other risk management systems; (15) losses related to fraud, theft, misappropriation or violence; (16) inability to attract and retain skilled personnel; (17) adverse impacts of government regulation; (18) governmental or regulatory changes or other actions; (19) failures to meet applicable capital requirements; (20) regulatory objections to Fifth Third’s capital plan; (21) regulation of Fifth Third’s derivatives activities; (22) deposit insurance premiums; (23) assessments for the orderly liquidation fund; (24) replacement of LIBOR; (25) weakness in the national or local economies; (26) global political and economic uncertainty or negative actions; (27) changes in interest rates; (28) changes and trends in capital markets; (29) fluctuation of Fifth Third’s stock price; (30) volatility in mortgage banking revenue; (31) litigation, investigations, and enforcement proceedings by governmental authorities; (32) breaches of contractual covenants, representations and warranties; (33) competition and changes in the financial services industry; (34) changing retail distribution strategies, customer preferences and behavior; (35) difficulties in identifying, acquiring or integrating suitable strategic partnerships, investments or acquisitions; (36) potential dilution from future acquisitions; (37) loss of income and/or difficulties encountered in the sale and separation of businesses, investments or other assets; (38) results of investments or acquired entities; (39) changes in accounting standards or interpretation or declines in the value of Fifth Third’s goodwill or other intangible assets; (40) inaccuracies or other failures from the use of models; (41) effects of critical accounting policies and judgments or the use of inaccurate estimates; (42) weather-related events, other natural disasters, or health emergencies (including pandemics); (43) the impact of reputational risk created by these or other developments on such matters as business generation and retention, funding and liquidity; (44) changes in law or requirements imposed by Fifth Third’s regulators impacting our capital actions, including dividend payments and stock repurchases; and (45) Fifth Third's ability to meet its sustainability targets, goals and commitments.
You should refer to our periodic and current reports filed with the Securities and Exchange Commission, or “SEC,” for further information on other factors, which could cause actual results to be significantly different from those expressed or implied by these forward-looking statements. Moreover, you should treat these statements as speaking only as of the date they are made and based only on information then actually known to us. We expressly disclaim any obligation or undertaking to release publicly any updates or revisions to any forward-looking statements contained herein to reflect any change in our expectations or any changes in events, conditions or circumstances on which any such statement is based, except as may be required by law, and we claim the protection of the safe harbor for forward-looking statements contained in the Private Securities Litigation Reform Act of 1995. The information contained herein is intended to be reviewed in its totality, and any stipulations, conditions or provisos that apply to a given piece of information in one part of this press release should be read as applying mutatis mutandis to every other instance of such information appearing herein.
# # #
12
Quarterly Financial Review for June 30, 2022
Table of Contents
| Financial Highlights | 14-15 | ||||||||||
| Consolidated Statements of Income | 16-17 | ||||||||||
| Consolidated Balance Sheets | 18-19 | ||||||||||
| Consolidated Statements of Changes in Equity | 20 | ||||||||||
| Average Balance Sheet and Yield Analysis | 21-22 | ||||||||||
| Summary of Loans and Leases | 23 | ||||||||||
| Regulatory Capital | 24 | ||||||||||
| Summary of Credit Loss Experience | 25 | ||||||||||
| Asset Quality | 26 | ||||||||||
| Non-GAAP Reconciliation | 27-29 | ||||||||||
| Segment Presentation | 30 | ||||||||||
13
| Fifth Third Bancorp and Subsidiaries | |||||||||||||||||||||||||||||
| Financial Highlights | % / bps | % / bps | |||||||||||||||||||||||||||
| $ in millions, except per share data | For the Three Months Ended | Change | Year to Date | Change | |||||||||||||||||||||||||
| (unaudited) | June | March | June | June | June | ||||||||||||||||||||||||
| 2022 | 2022 | 2021 | Seq | Yr/Yr | 2022 | 2021 | Yr/Yr | ||||||||||||||||||||||
| Income Statement Data | |||||||||||||||||||||||||||||
| Net interest income | $1,339 | $1,195 | $1,208 | 12% | 11% | $2,534 | $2,385 | 6% | |||||||||||||||||||||
Net interest income (FTE)(a) | 1,342 | 1,198 | 1,211 | 12% | 11% | 2,541 | 2,391 | 6% | |||||||||||||||||||||
| Noninterest income | 676 | 684 | 741 | (1%) | (9%) | 1,359 | 1,490 | (9%) | |||||||||||||||||||||
Total revenue (FTE)(a) | 2,018 | 1,882 | 1,952 | 7% | 3% | 3,900 | 3,881 | — | |||||||||||||||||||||
| Provision for (benefit from) credit losses | 179 | 45 | (115) | 298% | NM | 224 | (288) | NM | |||||||||||||||||||||
| Noninterest expense | 1,112 | 1,222 | 1,153 | (9%) | (4%) | 2,334 | 2,369 | (1%) | |||||||||||||||||||||
| Net income | 562 | 494 | 709 | 14% | (21%) | 1,056 | 1,403 | (25%) | |||||||||||||||||||||
| Net income available to common shareholders | 526 | 474 | 674 | 11% | (22%) | 1,000 | 1,348 | (26%) | |||||||||||||||||||||
| Earnings Per Share Data | |||||||||||||||||||||||||||||
| Net income allocated to common shareholders | $525 | $473 | $673 | 11% | (22%) | $999 | $1,344 | (26%) | |||||||||||||||||||||
| Average common shares outstanding (in thousands): | |||||||||||||||||||||||||||||
| Basic | 689,019 | 687,538 | 708,833 | — | (3%) | 688,282 | 711,617 | (3%) | |||||||||||||||||||||
| Diluted | 694,805 | 696,242 | 718,085 | — | (3%) | 695,520 | 720,740 | (3%) | |||||||||||||||||||||
| Earnings per share, basic | $0.76 | $0.69 | $0.95 | 10% | (20%) | $1.45 | $1.89 | (23%) | |||||||||||||||||||||
| Earnings per share, diluted | 0.76 | 0.68 | 0.94 | 12% | (19%) | 1.44 | 1.87 | (23%) | |||||||||||||||||||||
| Common Share Data | |||||||||||||||||||||||||||||
| Cash dividends per common share | $0.30 | $0.30 | $0.27 | — | 11% | $0.60 | $0.54 | 11% | |||||||||||||||||||||
| Book value per share | 24.56 | 26.33 | 29.57 | (7%) | (17%) | 24.56 | 29.57 | (17%) | |||||||||||||||||||||
| Market value per share | 33.60 | 43.04 | 38.23 | (22%) | (12%) | 33.60 | 38.23 | (12%) | |||||||||||||||||||||
| Common shares outstanding (in thousands) | 686,152 | 685,905 | 703,740 | — | (2%) | 686,152 | 703,740 | (2%) | |||||||||||||||||||||
| Market capitalization | $23,055 | $29,521 | $26,904 | (22%) | (14%) | $23,055 | $26,904 | (14%) | |||||||||||||||||||||
| Financial Ratios | |||||||||||||||||||||||||||||
| Return on average assets | 1.09 | % | 0.96 | % | 1.38 | % | 13 | (29) | 1.03 | % | 1.38 | % | (35) | ||||||||||||||||
| Return on average common equity | 12.3 | % | 10.0 | % | 13.0 | % | 230 | (70) | 11.1 | % | 13.1 | % | (200) | ||||||||||||||||
Return on average tangible common equity(a) | 17.5 | % | 13.4 | % | 16.6 | % | 410 | 90 | 15.3 | % | 16.7 | % | (140) | ||||||||||||||||
Noninterest income as a percent of total revenue(a) | 33 | % | 36 | % | 38 | % | (300) | (500) | 35 | % | 38 | % | (300) | ||||||||||||||||
| Dividend payout | 39.5 | % | 43.5 | % | 28.4 | % | (400) | NM | 41.4 | % | 28.6 | % | NM | ||||||||||||||||
Average total Bancorp shareholders’ equity as a percent of average assets | 9.35 | % | 10.23 | % | 11.11 | % | (88) | (176) | 9.79 | % | 11.18 | % | (139) | ||||||||||||||||
Tangible common equity(a) | 7.01 | % | 6.96 | % | 7.28 | % | 5 | (27) | 7.01 | % | 7.28 | % | (27) | ||||||||||||||||
Net interest margin (FTE)(a) | 2.92 | % | 2.59 | % | 2.63 | % | 33 | 29 | 2.75 | % | 2.62 | % | 13 | ||||||||||||||||
Efficiency (FTE)(a) | 55.1 | % | 64.9 | % | 59.1 | % | (980) | (400) | 59.8 | % | 61.0 | % | (120) | ||||||||||||||||
| Effective tax rate | 22.4 | % | 19.2 | % | 22.1 | % | 320 | 30 | 20.9 | % | 21.8 | % | (90) | ||||||||||||||||
| Credit Quality | |||||||||||||||||||||||||||||
| Net losses charged-off | $62 | $34 | $44 | 82 | % | 41 | % | $96 | $115 | (17 | %) | ||||||||||||||||||
| Net losses charged-off as a percent of average portfolio loans and leases (annualized) | 0.21 | % | 0.12 | % | 0.16 | % | 9 | 5 | 0.17 | % | 0.21 | % | (4) | ||||||||||||||||
| ALLL as a percent of portfolio loans and leases | 1.70 | % | 1.65 | % | 1.89 | % | 5 | (19) | 1.70 | % | 1.89 | % | (19) | ||||||||||||||||
ACL as a percent of portfolio loans and leases(g) | 1.85 | % | 1.80 | % | 2.06 | % | 5 | (21) | 1.85 | % | 2.06 | % | (21) | ||||||||||||||||
| Nonperforming portfolio assets as a percent of portfolio loans and leases and OREO | 0.47 | % | 0.49 | % | 0.61 | % | (2) | (14) | 0.47 | % | 0.61 | % | (14) | ||||||||||||||||
| Average Balances | |||||||||||||||||||||||||||||
| Loans and leases, including held for sale | $120,236 | $117,162 | $114,443 | 3% | 5% | $118,708 | $114,074 | 4% | |||||||||||||||||||||
| Securities and other short-term investments | 64,170 | 70,732 | 70,475 | (9%) | (9%) | 67,431 | 69,749 | (3%) | |||||||||||||||||||||
| Assets | 205,897 | 209,150 | 206,353 | (2%) | — | 207,515 | 205,102 | 1% | |||||||||||||||||||||
Transaction deposits(b) | 160,035 | 166,032 | 158,779 | (4%) | 1% | 163,016 | 156,321 | 4% | |||||||||||||||||||||
Core deposits(c) | 162,228 | 168,408 | 162,293 | (4%) | — | 165,300 | 159,989 | 3% | |||||||||||||||||||||
Wholesale funding(d) | 15,789 | 12,568 | 15,652 | 26% | 1% | 14,188 | 16,626 | (15%) | |||||||||||||||||||||
Bancorp shareholders’ equity | 19,248 | 21,402 | 22,927 | (10%) | (16%) | 20,319 | 22,939 | (11%) | |||||||||||||||||||||
Regulatory Capital Ratios(e)(f) | |||||||||||||||||||||||||||||
CET1 capital | 8.96 | % | 9.31 | % | 10.37 | % | (35) | (141) | 8.96 | % | 10.37 | % | (141) | ||||||||||||||||
Tier 1 risk-based capital | 10.24 | % | 10.63 | % | 11.83 | % | (39) | (159) | 10.24 | % | 11.83 | % | (159) | ||||||||||||||||
Total risk-based capital | 12.48 | % | 12.93 | % | 14.60 | % | (45) | (212) | 12.48 | % | 14.60 | % | (212) | ||||||||||||||||
| Leverage | 8.30 | % | 8.32 | % | 8.55 | % | (2) | (25) | 8.30 | % | 8.55 | % | (25) | ||||||||||||||||
| Operations | |||||||||||||||||||||||||||||
| Banking centers | 1,080 | 1,079 | 1,096 | — | (1%) | 1,080 | 1,096 | (1%) | |||||||||||||||||||||
| ATMs | 2,153 | 2,201 | 2,369 | (2%) | (9%) | 2,153 | 2,369 | (9%) | |||||||||||||||||||||
| Full-time equivalent employees | 19,119 | 19,247 | 19,402 | (1%) | (1%) | 19,119 | 19,402 | (1%) | |||||||||||||||||||||
(a)Non-GAAP measure; see discussion and reconciliation of non-GAAP measures beginning on page 27.
(b)Includes demand, interest checking, savings, money market and foreign office deposits of commercial customers.
(c)Includes transaction deposits plus CDs $250,000 or less.
(d)Includes CDs over $250,000, other deposits, federal funds purchased, other short-term borrowings and long-term debt.
(e)Current period regulatory capital ratios are estimates.
(f)Regulatory capital ratios are calculated pursuant to the five-year transition provision option to phase in the effects of CECL on regulatory capital after its adoption on January 1, 2020.
(g)The allowance for credit losses is the sum of the ALLL and the reserve for unfunded commitments.
14
| Fifth Third Bancorp and Subsidiaries | ||||||||||||||||||||
| Financial Highlights | ||||||||||||||||||||
| $ in millions, except per share data | For the Three Months Ended | |||||||||||||||||||
| (unaudited) | June | March | December | September | June | |||||||||||||||
| 2022 | 2022 | 2021 | 2021 | 2021 | ||||||||||||||||
| Income Statement Data | ||||||||||||||||||||
| Net interest income | $1,339 | $1,195 | $1,197 | $1,189 | $1,208 | |||||||||||||||
Net interest income (FTE)(a) | 1,342 | 1,198 | 1,200 | 1,192 | 1,211 | |||||||||||||||
| Noninterest income | 676 | 684 | 791 | 836 | 741 | |||||||||||||||
Total revenue (FTE)(a) | 2,018 | 1,882 | 1,991 | 2,028 | 1,952 | |||||||||||||||
| Provision for (benefit from) credit losses | 179 | 45 | (47) | (42) | (115) | |||||||||||||||
| Noninterest expense | 1,112 | 1,222 | 1,206 | 1,172 | 1,153 | |||||||||||||||
| Net income | 562 | 494 | 662 | 704 | 709 | |||||||||||||||
| Net income available to common shareholders | 526 | 474 | 627 | 684 | 674 | |||||||||||||||
| Earnings Per Share Data | ||||||||||||||||||||
| Net income allocated to common shareholders | $525 | $473 | $625 | $683 | $673 | |||||||||||||||
| Average common shares outstanding (in thousands): | ||||||||||||||||||||
| Basic | 689,019 | 687,538 | 688,370 | 697,457 | 708,833 | |||||||||||||||
| Diluted | 694,805 | 696,242 | 697,532 | 706,090 | 718,085 | |||||||||||||||
| Earnings per share, basic | $0.76 | $0.69 | $0.91 | $0.98 | $0.95 | |||||||||||||||
| Earnings per share, diluted | 0.76 | 0.68 | 0.90 | 0.97 | 0.94 | |||||||||||||||
| Common Share Data | ||||||||||||||||||||
| Cash dividends per common share | $0.30 | $0.30 | $0.30 | $0.30 | $0.27 | |||||||||||||||
| Book value per share | 24.56 | 26.33 | 29.43 | 29.59 | 29.57 | |||||||||||||||
| Market value per share | 33.60 | 43.04 | 43.55 | 42.44 | 38.23 | |||||||||||||||
| Common shares outstanding (in thousands) | 686,152 | 685,905 | 682,778 | 689,790 | 703,740 | |||||||||||||||
| Market capitalization | $23,055 | $29,521 | $29,735 | $29,275 | $26,904 | |||||||||||||||
| Financial Ratios | ||||||||||||||||||||
| Return on average assets | 1.09 | % | 0.96 | % | 1.25 | % | 1.36 | % | 1.38 | % | ||||||||||
| Return on average common equity | 12.3 | % | 10.0 | % | 12.2 | % | 13.0 | % | 13.0 | % | ||||||||||
Return on average tangible common equity(a) | 17.5 | % | 13.4 | % | 16.1 | % | 16.9 | % | 16.6 | % | ||||||||||
Noninterest income as a percent of total revenue(a) | 33 | % | 36 | % | 40 | % | 41 | % | 38 | % | ||||||||||
| Dividend payout | 39.5 | % | 43.5 | % | 33.0 | % | 30.6 | % | 28.4 | % | ||||||||||
Average total Bancorp shareholders’ equity as a percent of average assets | 9.35 | % | 10.23 | % | 10.71 | % | 11.16 | % | 11.11 | % | ||||||||||
Tangible common equity(a) | 7.01 | % | 6.96 | % | 6.94 | % | 7.01 | % | 7.28 | % | ||||||||||
Net interest margin (FTE)(a) | 2.92 | % | 2.59 | % | 2.55 | % | 2.59 | % | 2.63 | % | ||||||||||
Efficiency (FTE)(a) | 55.1 | % | 64.9 | % | 60.6 | % | 57.8 | % | 59.1 | % | ||||||||||
| Effective tax rate | 22.4 | % | 19.2 | % | 20.1 | % | 21.3 | % | 22.1 | % | ||||||||||
| Credit Quality | ||||||||||||||||||||
| Net losses charged-off | $62 | $34 | $38 | $21 | $44 | |||||||||||||||
| Net losses charged-off as a percent of average portfolio loans and leases (annualized) | 0.21 | % | 0.12 | % | 0.14 | % | 0.08 | % | 0.16 | % | ||||||||||
| ALLL as a percent of portfolio loans and leases | 1.70 | % | 1.65 | % | 1.69 | % | 1.81 | % | 1.89 | % | ||||||||||
ACL as a percent of portfolio loans and leases(g) | 1.85 | % | 1.80 | % | 1.85 | % | 2.00 | % | 2.06 | % | ||||||||||
| Nonperforming portfolio assets as a percent of portfolio loans and leases and OREO | 0.47 | % | 0.49 | % | 0.47 | % | 0.52 | % | 0.61 | % | ||||||||||
| Average Balances | ||||||||||||||||||||
| Loans and leases, including held for sale | $120,236 | $117,162 | $114,790 | $113,528 | $114,443 | |||||||||||||||
| Securities and other short-term investments | 64,170 | 70,732 | 72,255 | 69,273 | 70,475 | |||||||||||||||
| Assets | 205,897 | 209,150 | 209,604 | 205,449 | 206,353 | |||||||||||||||
Transaction deposits(b) | 160,035 | 166,032 | 164,673 | 159,404 | 158,779 | |||||||||||||||
Core deposits(c) | 162,228 | 168,408 | 167,277 | 162,341 | 162,293 | |||||||||||||||
Wholesale funding(d) | 15,789 | 12,568 | 13,276 | 13,833 | 15,652 | |||||||||||||||
Bancorp shareholders’ equity | 19,248 | 21,402 | 22,449 | 22,927 | 22,927 | |||||||||||||||
Regulatory Capital Ratios(e)(f) | ||||||||||||||||||||
CET1 capital | 8.96 | % | 9.31 | % | 9.54 | % | 9.86 | % | 10.37 | % | ||||||||||
| Tier 1 risk-based capital | 10.24 | % | 10.63 | % | 10.91 | % | 11.28 | % | 11.83 | % | ||||||||||
Total risk-based capital | 12.48 | % | 12.93 | % | 13.42 | % | 13.94 | % | 14.60 | % | ||||||||||
| Leverage | 8.30 | % | 8.32 | % | 8.27 | % | 8.41 | % | 8.55 | % | ||||||||||
| Operations | ||||||||||||||||||||
| Banking centers | 1,080 | 1,079 | 1,117 | 1,100 | 1,096 | |||||||||||||||
| ATMs | 2,153 | 2,201 | 2,322 | 2,336 | 2,369 | |||||||||||||||
| Full-time equivalent employees | 19,119 | 19,247 | 19,112 | 19,171 | 19,402 | |||||||||||||||
(a)Non-GAAP measure; see discussion and reconciliation of non-GAAP measures beginning on page 27.
(b)Includes demand, interest checking, savings, money market and foreign office deposits of commercial customers.
(c)Includes transaction deposits plus CDs $250,000 or less.
(d)Includes CDs over $250,000, other deposits, federal funds purchased, other short-term borrowings and long-term debt.
(e)Current period regulatory capital ratios are estimates.
(f)Regulatory capital ratios are calculated pursuant to the five-year transition provision option to phase in the effects of CECL on regulatory capital after its adoption on January 1, 2020.
(g)The allowance for credit losses is the sum of the ALLL and the reserve for unfunded commitments.
15
| Fifth Third Bancorp and Subsidiaries | ||||||||||||||||||||||||||
| Consolidated Statements of Income | ||||||||||||||||||||||||||
| $ in millions | For the Three Months Ended | % Change | Year to Date | % Change | ||||||||||||||||||||||
| (unaudited) | June | March | June | June | June | |||||||||||||||||||||
| 2022 | 2022 | 2021 | Seq | Yr/Yr | 2022 | 2021 | Yr/Yr | |||||||||||||||||||
| Interest Income | ||||||||||||||||||||||||||
| Interest and fees on loans and leases | $1,081 | $983 | $1,035 | 10% | 4% | $2,062 | $2,064 | — | ||||||||||||||||||
| Interest on securities | 369 | 294 | 279 | 26% | 32% | 663 | 543 | 22% | ||||||||||||||||||
| Interest on other short-term investments | 14 | 12 | 9 | 17% | 56% | 27 | 17 | 59% | ||||||||||||||||||
| Total interest income | 1,464 | 1,289 | 1,323 | 14% | 11% | 2,752 | 2,624 | 5% | ||||||||||||||||||
| Interest Expense | ||||||||||||||||||||||||||
| Interest on deposits | 25 | 11 | 15 | 127% | 67% | 36 | 36 | — | ||||||||||||||||||
| Interest on federal funds purchased | 1 | — | — | NM | NM | 1 | — | NM | ||||||||||||||||||
| Interest on other short-term borrowings | 12 | — | — | NM | NM | 13 | 1 | NM | ||||||||||||||||||
| Interest on long-term debt | 87 | 83 | 100 | 5% | (13%) | 168 | 202 | (17%) | ||||||||||||||||||
| Total interest expense | 125 | 94 | 115 | 33% | 9% | 218 | 239 | (9%) | ||||||||||||||||||
| Net Interest Income | 1,339 | 1,195 | 1,208 | 12% | 11% | 2,534 | 2,385 | 6% | ||||||||||||||||||
| Provision for (benefit from) credit losses | 179 | 45 | (115) | 298% | NM | 224 | (288) | NM | ||||||||||||||||||
| Net Interest Income After Provision for (Benefit from) Credit Losses | 1,160 | 1,150 | 1,323 | 1% | (12%) | 2,310 | 2,673 | (14%) | ||||||||||||||||||
| Noninterest Income | ||||||||||||||||||||||||||
| Service charges on deposits | 154 | 152 | 149 | 1% | 3% | 306 | 292 | 5% | ||||||||||||||||||
| Commercial banking revenue | 137 | 135 | 160 | 1% | (14%) | 272 | 313 | (13%) | ||||||||||||||||||
| Mortgage banking net revenue | 31 | 52 | 64 | (40%) | (52%) | 83 | 149 | (44%) | ||||||||||||||||||
| Wealth and asset management revenue | 140 | 149 | 145 | (6%) | (3%) | 289 | 288 | — | ||||||||||||||||||
| Card and processing revenue | 105 | 97 | 102 | 8% | 3% | 201 | 196 | 3% | ||||||||||||||||||
| Leasing business revenue | 56 | 62 | 61 | (10%) | (8%) | 118 | 148 | (20%) | ||||||||||||||||||
| Other noninterest income | 85 | 52 | 49 | 63% | 73% | 138 | 92 | 50% | ||||||||||||||||||
| Securities (losses) gains, net | (32) | (14) | 10 | 129% | NM | (47) | 13 | NM | ||||||||||||||||||
| Securities (losses) gains, net - non-qualifying hedges on mortgage servicing rights | — | (1) | 1 | (100%) | (100%) | (1) | (1) | — | ||||||||||||||||||
| Total noninterest income | 676 | 684 | 741 | (1%) | (9%) | 1,359 | 1,490 | (9%) | ||||||||||||||||||
| Noninterest Expense | ||||||||||||||||||||||||||
| Compensation and benefits | 584 | 711 | 638 | (18%) | (8%) | 1,295 | 1,343 | (4%) | ||||||||||||||||||
| Net occupancy expense | 75 | 77 | 77 | (3%) | (3%) | 152 | 156 | (3%) | ||||||||||||||||||
| Technology and communications | 98 | 101 | 94 | (3%) | 4% | 199 | 187 | 6% | ||||||||||||||||||
| Equipment expense | 36 | 36 | 34 | — | 6% | 72 | 68 | 6% | ||||||||||||||||||
| Card and processing expense | 20 | 19 | 20 | 5% | — | 38 | 50 | (24%) | ||||||||||||||||||
| Leasing business expense | 31 | 32 | 33 | (3%) | (6%) | 63 | 68 | (7%) | ||||||||||||||||||
| Marketing expense | 28 | 24 | 20 | 17% | 40% | 52 | 43 | 21% | ||||||||||||||||||
| Other noninterest expense | 240 | 222 | 237 | 8% | 1% | 463 | 454 | 2% | ||||||||||||||||||
| Total noninterest expense | 1,112 | 1,222 | 1,153 | (9%) | (4%) | 2,334 | 2,369 | (1%) | ||||||||||||||||||
| Income Before Income Taxes | 724 | 612 | 911 | 18% | (21%) | 1,335 | 1,794 | (26%) | ||||||||||||||||||
| Applicable income tax expense | 162 | 118 | 202 | 37% | (20%) | 279 | 391 | (29%) | ||||||||||||||||||
| Net Income | 562 | 494 | 709 | 14% | (21%) | 1,056 | 1,403 | (25%) | ||||||||||||||||||
| Dividends on preferred stock | 36 | 20 | 35 | 80% | 3% | 56 | 55 | 2% | ||||||||||||||||||
| Net Income Available to Common Shareholders | $526 | $474 | $674 | 11% | (22%) | $1,000 | $1,348 | (26%) | ||||||||||||||||||
16
| Fifth Third Bancorp and Subsidiaries | |||||||||||||||||
| Consolidated Statements of Income | |||||||||||||||||
| $ in millions | For the Three Months Ended | ||||||||||||||||
| (unaudited) | June | March | December | September | June | ||||||||||||
| 2022 | 2022 | 2021 | 2021 | 2021 | |||||||||||||
| Interest Income | |||||||||||||||||
| Interest and fees on loans and leases | $1,081 | $983 | $1,000 | $1,014 | $1,035 | ||||||||||||
| Interest on securities | 369 | 294 | 281 | 266 | 279 | ||||||||||||
| Interest on other short-term investments | 14 | 12 | 13 | 12 | 9 | ||||||||||||
| Total interest income | 1,464 | 1,289 | 1,294 | 1,292 | 1,323 | ||||||||||||
| Interest Expense | |||||||||||||||||
| Interest on deposits | 25 | 11 | 11 | 12 | 15 | ||||||||||||
| Interest on other short-term borrowings | 12 | — | — | — | — | ||||||||||||
| Interest on long-term debt | 87 | 83 | 86 | 91 | 100 | ||||||||||||
| Total interest expense | 125 | 94 | 97 | 103 | 115 | ||||||||||||
| Net Interest Income | 1,339 | 1,195 | 1,197 | 1,189 | 1,208 | ||||||||||||
| Provision for (benefit from) credit losses | 179 | 45 | (47) | (42) | (115) | ||||||||||||
| Net Interest Income After Provision for (Benefit from) Credit Losses | 1,160 | 1,150 | 1,244 | 1,231 | 1,323 | ||||||||||||
| Noninterest Income | |||||||||||||||||
| Service charges on deposits | 154 | 152 | 156 | 152 | 149 | ||||||||||||
| Commercial banking revenue | 137 | 135 | 171 | 152 | 160 | ||||||||||||
| Mortgage banking net revenue | 31 | 52 | 35 | 86 | 64 | ||||||||||||
| Wealth and asset management revenue | 140 | 149 | 150 | 147 | 145 | ||||||||||||
| Card and processing revenue | 105 | 97 | 104 | 102 | 102 | ||||||||||||
| Leasing business revenue | 56 | 62 | 74 | 78 | 61 | ||||||||||||
| Other noninterest income | 85 | 52 | 120 | 120 | 49 | ||||||||||||
| Securities (losses) gains, net | (32) | (14) | (19) | (1) | 10 | ||||||||||||
| Securities (losses) gains, net - non-qualifying hedges on mortgage servicing rights | — | (1) | — | — | 1 | ||||||||||||
| Total noninterest income | 676 | 684 | 791 | 836 | 741 | ||||||||||||
| Noninterest Expense | |||||||||||||||||
| Compensation and benefits | 584 | 711 | 655 | 627 | 638 | ||||||||||||
| Net occupancy expense | 75 | 77 | 77 | 79 | 77 | ||||||||||||
| Technology and communications | 98 | 101 | 103 | 98 | 94 | ||||||||||||
| Equipment expense | 36 | 36 | 36 | 34 | 34 | ||||||||||||
| Card and processing expense | 20 | 19 | 19 | 19 | 20 | ||||||||||||
| Leasing business expense | 31 | 32 | 36 | 33 | 33 | ||||||||||||
| Marketing expense | 28 | 24 | 35 | 29 | 20 | ||||||||||||
| Other noninterest expense | 240 | 222 | 245 | 253 | 237 | ||||||||||||
| Total noninterest expense | 1,112 | 1,222 | 1,206 | 1,172 | 1,153 | ||||||||||||
| Income Before Income Taxes | 724 | 612 | 829 | 895 | 911 | ||||||||||||
| Applicable income tax expense | 162 | 118 | 167 | 191 | 202 | ||||||||||||
| Net Income | 562 | 494 | 662 | 704 | 709 | ||||||||||||
| Dividends on preferred stock | 36 | 20 | 35 | 20 | 35 | ||||||||||||
| Net Income Available to Common Shareholders | $526 | $474 | $627 | $684 | $674 | ||||||||||||
17
| Fifth Third Bancorp and Subsidiaries | |||||||||||||||||
| Consolidated Balance Sheets | |||||||||||||||||
| $ in millions, except per share data | As of | % Change | |||||||||||||||
| (unaudited) | June | March | June | ||||||||||||||
| 2022 | 2022 | 2021 | Seq | Yr/Yr | |||||||||||||
| Assets | |||||||||||||||||
| Cash and due from banks | $3,437 | $3,049 | $3,285 | 13% | 5% | ||||||||||||
| Other short-term investments | 7,419 | 20,529 | 32,409 | (64%) | (77%) | ||||||||||||
Available-for-sale debt and other securities(a) | 52,837 | 48,832 | 38,012 | 8% | 39% | ||||||||||||
Held-to-maturity securities(b) | 5 | 6 | 10 | (17%) | (50%) | ||||||||||||
| Trading debt securities | 293 | 324 | 711 | (10%) | (59%) | ||||||||||||
| Equity securities | 326 | 358 | 341 | (9%) | (4%) | ||||||||||||
| Loans and leases held for sale | 2,542 | 2,616 | 5,730 | (3%) | (56%) | ||||||||||||
| Portfolio loans and leases: | |||||||||||||||||
| Commercial and industrial loans | 56,095 | 53,909 | 47,564 | 4% | 18% | ||||||||||||
| Commercial mortgage loans | 10,748 | 10,694 | 10,347 | 1% | 4% | ||||||||||||
| Commercial construction loans | 5,357 | 5,420 | 5,871 | (1%) | (9%) | ||||||||||||
| Commercial leases | 2,850 | 2,915 | 3,238 | (2%) | (12%) | ||||||||||||
| Total commercial loans and leases | 75,050 | 72,938 | 67,020 | 3% | 12% | ||||||||||||
| Residential mortgage loans | 17,566 | 17,144 | 16,131 | 2% | 9% | ||||||||||||
| Home equity | 3,906 | 3,916 | 4,545 | — | (14%) | ||||||||||||
| Indirect secured consumer loans | 17,017 | 17,424 | 15,192 | (2%) | 12% | ||||||||||||
| Credit card | 1,763 | 1,690 | 1,793 | 4% | (2%) | ||||||||||||
| Other consumer loans | 3,521 | 2,753 | 3,052 | 28% | 15% | ||||||||||||
| Total consumer loans | 43,773 | 42,927 | 40,713 | 2% | 8% | ||||||||||||
| Portfolio loans and leases | 118,823 | 115,865 | 107,733 | 3% | 10% | ||||||||||||
| Allowance for loan and lease losses | (2,014) | (1,908) | (2,033) | 6% | (1%) | ||||||||||||
| Portfolio loans and leases, net | 116,809 | 113,957 | 105,700 | 3% | 11% | ||||||||||||
| Bank premises and equipment | 2,118 | 2,102 | 2,073 | 1% | 2% | ||||||||||||
| Operating lease equipment | 600 | 622 | 715 | (4%) | (16%) | ||||||||||||
| Goodwill | 4,926 | 4,514 | 4,259 | 9% | 16% | ||||||||||||
| Intangible assets | 194 | 145 | 117 | 34% | 66% | ||||||||||||
| Servicing rights | 1,582 | 1,444 | 818 | 10% | 93% | ||||||||||||
| Other assets | 13,694 | 12,961 | 11,210 | 6% | 22% | ||||||||||||
| Total Assets | $206,782 | $211,459 | $205,390 | (2%) | 1% | ||||||||||||
| Liabilities | |||||||||||||||||
| Deposits: | |||||||||||||||||
| Demand | $60,859 | $65,590 | $62,760 | (7%) | (3%) | ||||||||||||
| Interest checking | 43,338 | 48,836 | 44,872 | (11%) | (3%) | ||||||||||||
| Savings | 23,748 | 23,622 | 20,667 | 1% | 15% | ||||||||||||
| Money market | 28,792 | 29,947 | 30,564 | (4%) | (6%) | ||||||||||||
| Foreign office | 177 | 115 | 152 | 54% | 16% | ||||||||||||
| CDs $250,000 or less | 2,125 | 2,267 | 2,958 | (6%) | (28%) | ||||||||||||
| CDs over $250,000 | 2,135 | 234 | 310 | 812% | 589% | ||||||||||||
| Total deposits | 161,174 | 170,611 | 162,283 | (6%) | (1%) | ||||||||||||
| Federal funds purchased | 711 | 250 | 338 | 184% | 110% | ||||||||||||
| Other short-term borrowings | 7,057 | 872 | 1,130 | 709% | 525% | ||||||||||||
| Accrued taxes, interest and expenses | 1,683 | 1,471 | 2,045 | 14% | (18%) | ||||||||||||
| Other liabilities | 6,197 | 7,263 | 4,304 | (15%) | 44% | ||||||||||||
| Long-term debt | 10,990 | 10,815 | 12,364 | 2% | (11%) | ||||||||||||
| Total Liabilities | 187,812 | 191,282 | 182,464 | (2%) | 3% | ||||||||||||
| Equity | |||||||||||||||||
Common stock(c) | 2,051 | 2,051 | 2,051 | — | — | ||||||||||||
| Preferred stock | 2,116 | 2,116 | 2,116 | — | — | ||||||||||||
| Capital surplus | 3,636 | 3,615 | 3,602 | 1% | 1% | ||||||||||||
| Retained earnings | 20,818 | 20,501 | 19,343 | 2% | 8% | ||||||||||||
| Accumulated other comprehensive (loss) income | (2,644) | (1,096) | 1,974 | 141% | NM | ||||||||||||
| Treasury stock | (7,007) | (7,010) | (6,160) | — | 14% | ||||||||||||
| Total Equity | 18,970 | 20,177 | 22,926 | (6%) | (17%) | ||||||||||||
| Total Liabilities and Equity | $206,782 | $211,459 | $205,390 | (2%) | 1% | ||||||||||||
| (a) Amortized cost | $56,140 | $50,171 | $36,081 | 12% | 56% | ||||||||||||
| (b) Market values | 5 | 6 | 10 | (17%) | (50%) | ||||||||||||
| (c) Common shares, stated value $2.22 per share (in thousands): | |||||||||||||||||
| Authorized | 2,000,000 | 2,000,000 | 2,000,000 | — | — | ||||||||||||
| Outstanding, excluding treasury | 686,152 | 685,905 | 703,740 | — | (2 | %) | |||||||||||
| Treasury | 237,741 | 237,987 | 220,153 | — | 8 | % | |||||||||||
18
| Fifth Third Bancorp and Subsidiaries | |||||||||||||||||
| Consolidated Balance Sheets | |||||||||||||||||
| $ in millions, except per share data | As of | ||||||||||||||||
| (unaudited) | June | March | December | September | June | ||||||||||||
| 2022 | 2022 | 2021 | 2021 | 2021 | |||||||||||||
| Assets | |||||||||||||||||
| Cash and due from banks | $3,437 | $3,049 | $2,994 | $3,213 | $3,285 | ||||||||||||
| Other short-term investments | 7,419 | 20,529 | 34,572 | 34,203 | 32,409 | ||||||||||||
Available-for-sale debt and other securities(a) | 52,837 | 48,832 | 38,110 | 37,870 | 38,012 | ||||||||||||
Held-to-maturity securities(b) | 5 | 6 | 8 | 8 | 10 | ||||||||||||
| Trading debt securities | 293 | 324 | 512 | 685 | 711 | ||||||||||||
| Equity securities | 326 | 358 | 376 | 329 | 341 | ||||||||||||
| Loans and leases held for sale | 2,542 | 2,616 | 4,415 | 5,203 | 5,730 | ||||||||||||
| Portfolio loans and leases: | |||||||||||||||||
| Commercial and industrial loans | 56,095 | 53,909 | 51,659 | 47,834 | 47,564 | ||||||||||||
| Commercial mortgage loans | 10,748 | 10,694 | 10,316 | 10,300 | 10,347 | ||||||||||||
| Commercial construction loans | 5,357 | 5,420 | 5,241 | 5,456 | 5,871 | ||||||||||||
| Commercial leases | 2,850 | 2,915 | 3,052 | 3,130 | 3,238 | ||||||||||||
| Total commercial loans and leases | 75,050 | 72,938 | 70,268 | 66,720 | 67,020 | ||||||||||||
| Residential mortgage loans | 17,566 | 17,144 | 16,397 | 16,158 | 16,131 | ||||||||||||
| Home equity | 3,906 | 3,916 | 4,084 | 4,276 | 4,545 | ||||||||||||
| Indirect secured consumer loans | 17,017 | 17,424 | 16,783 | 16,004 | 15,192 | ||||||||||||
| Credit card | 1,763 | 1,690 | 1,766 | 1,744 | 1,793 | ||||||||||||
| Other consumer loans | 3,521 | 2,753 | 2,752 | 3,009 | 3,052 | ||||||||||||
| Total consumer loans | 43,773 | 42,927 | 41,782 | 41,191 | 40,713 | ||||||||||||
| Portfolio loans and leases | 118,823 | 115,865 | 112,050 | 107,911 | 107,733 | ||||||||||||
| Allowance for loan and lease losses | (2,014) | (1,908) | (1,892) | (1,954) | (2,033) | ||||||||||||
| Portfolio loans and leases, net | 116,809 | 113,957 | 110,158 | 105,957 | 105,700 | ||||||||||||
| Bank premises and equipment | 2,118 | 2,102 | 2,120 | 2,101 | 2,073 | ||||||||||||
| Operating lease equipment | 600 | 622 | 616 | 647 | 715 | ||||||||||||
| Goodwill | 4,926 | 4,514 | 4,514 | 4,514 | 4,259 | ||||||||||||
| Intangible assets | 194 | 145 | 156 | 169 | 117 | ||||||||||||
| Servicing rights | 1,582 | 1,444 | 1,121 | 943 | 818 | ||||||||||||
| Other assets | 13,694 | 12,961 | 11,444 | 11,889 | 11,210 | ||||||||||||
| Total Assets | $206,782 | $211,459 | $211,116 | $207,731 | $205,390 | ||||||||||||
| Liabilities | |||||||||||||||||
| Deposits: | |||||||||||||||||
| Demand | $60,859 | $65,590 | $65,088 | $63,879 | $62,760 | ||||||||||||
| Interest checking | 43,338 | 48,836 | 48,870 | 45,964 | 44,872 | ||||||||||||
| Savings | 23,748 | 23,622 | 22,227 | 21,423 | 20,667 | ||||||||||||
| Money market | 28,792 | 29,947 | 30,263 | 30,652 | 30,564 | ||||||||||||
| Foreign office | 177 | 115 | 121 | 202 | 152 | ||||||||||||
| CDs $250,000 or less | 2,125 | 2,267 | 2,486 | 2,691 | 2,958 | ||||||||||||
| CDs over $250,000 | 2,135 | 234 | 269 | 297 | 310 | ||||||||||||
| Total deposits | 161,174 | 170,611 | 169,324 | 165,108 | 162,283 | ||||||||||||
| Federal funds purchased | 711 | 250 | 281 | 309 | 338 | ||||||||||||
| Other short-term borrowings | 7,057 | 872 | 980 | 949 | 1,130 | ||||||||||||
| Accrued taxes, interest and expenses | 1,683 | 1,471 | 2,233 | 2,083 | 2,045 | ||||||||||||
| Other liabilities | 6,197 | 7,263 | 4,267 | 5,339 | 4,304 | ||||||||||||
| Long-term debt | 10,990 | 10,815 | 11,821 | 11,419 | 12,364 | ||||||||||||
| Total Liabilities | 187,812 | 191,282 | 188,906 | 185,207 | 182,464 | ||||||||||||
| Equity | |||||||||||||||||
Common stock(c) | 2,051 | 2,051 | 2,051 | 2,051 | 2,051 | ||||||||||||
| Preferred stock | 2,116 | 2,116 | 2,116 | 2,116 | 2,116 | ||||||||||||
| Capital surplus | 3,636 | 3,615 | 3,624 | 3,611 | 3,602 | ||||||||||||
| Retained earnings | 20,818 | 20,501 | 20,236 | 19,817 | 19,343 | ||||||||||||
| Accumulated other comprehensive (loss) income | (2,644) | (1,096) | 1,207 | 1,637 | 1,974 | ||||||||||||
| Treasury stock | (7,007) | (7,010) | (7,024) | (6,708) | (6,160) | ||||||||||||
| Total Equity | 18,970 | 20,177 | 22,210 | 22,524 | 22,926 | ||||||||||||
| Total Liabilities and Equity | $206,782 | $211,459 | $211,116 | $207,731 | $205,390 | ||||||||||||
| (a) Amortized cost | $56,140 | $50,171 | $36,941 | $36,308 | $36,081 | ||||||||||||
| (b) Market values | 5 | 6 | 8 | 8 | 10 | ||||||||||||
| (c) Common shares, stated value $2.22 per share (in thousands): | |||||||||||||||||
| Authorized | 2,000,000 | 2,000,000 | 2,000,000 | 2,000,000 | 2,000,000 | ||||||||||||
| Outstanding, excluding treasury | 686,152 | 685,905 | 682,778 | 689,790 | 703,740 | ||||||||||||
| Treasury | 237,741 | 237,987 | 241,115 | 234,102 | 220,153 | ||||||||||||
19
| Fifth Third Bancorp and Subsidiaries | ||||||||||||||||||||
| Consolidated Statements of Changes in Equity | ||||||||||||||||||||
| $ in millions | ||||||||||||||||||||
| (unaudited) | ||||||||||||||||||||
| For the Three Months Ended | Year to Date | |||||||||||||||||||
| June | June | June | June | |||||||||||||||||
| 2022 | 2021 | 2022 | 2021 | |||||||||||||||||
| Total Equity, Beginning | $20,177 | $22,595 | $22,210 | $23,111 | ||||||||||||||||
| Net income | 562 | 709 | 1,056 | 1,403 | ||||||||||||||||
| Other comprehensive loss, net of tax: | ||||||||||||||||||||
| Change in unrealized (losses) gains: | ||||||||||||||||||||
| Available-for-sale debt securities | (1,506) | 230 | (3,437) | (459) | ||||||||||||||||
| Qualifying cash flow hedges | (43) | (49) | (416) | (170) | ||||||||||||||||
| Change in accumulated other comprehensive income related to employee benefit plans | 1 | 1 | 2 | 2 | ||||||||||||||||
| Comprehensive income | (986) | 891 | (2,795) | 776 | ||||||||||||||||
| Cash dividends declared: | ||||||||||||||||||||
| Common stock | (209) | (192) | (418) | (387) | ||||||||||||||||
| Preferred stock | (36) | (35) | (56) | (55) | ||||||||||||||||
| Impact of stock transactions under stock compensation plans, net | 24 | 15 | 29 | 9 | ||||||||||||||||
| Shares acquired for treasury | — | (347) | — | (527) | ||||||||||||||||
| Other | — | (1) | — | (1) | ||||||||||||||||
| Total Equity, Ending | $18,970 | $22,926 | $18,970 | $22,926 | ||||||||||||||||
20
| Fifth Third Bancorp and Subsidiaries | ||||||||||||||||||||||||||
| Average Balance Sheet and Yield/Rate Analysis | For the Three Months Ended | |||||||||||||||||||||||||
| $ in millions | June | March | June | |||||||||||||||||||||||
| (unaudited) | 2022 | 2022 | 2021 | |||||||||||||||||||||||
| Average | Average | Average | Average | Average | Average | |||||||||||||||||||||
| Balance | Yield/Rate | Balance | Yield/Rate | Balance | Yield/Rate | |||||||||||||||||||||
| Assets | ||||||||||||||||||||||||||
| Interest-earning assets: | ||||||||||||||||||||||||||
| Loans and leases: | ||||||||||||||||||||||||||
Commercial and industrial loans(a) | $55,466 | 3.59 | % | $52,562 | 3.29 | % | $48,817 | 3.62 | % | |||||||||||||||||
Commercial mortgage loans(a) | 10,710 | 3.34 | % | 10,529 | 3.00 | % | 10,467 | 3.11 | % | |||||||||||||||||
Commercial construction loans(a) | 5,356 | 3.69 | % | 5,371 | 3.29 | % | 6,043 | 3.09 | % | |||||||||||||||||
Commercial leases(a) | 2,840 | 2.93 | % | 2,943 | 2.85 | % | 3,174 | 2.94 | % | |||||||||||||||||
| Total commercial loans and leases | 74,372 | 3.54 | % | 71,405 | 3.23 | % | 68,501 | 3.47 | % | |||||||||||||||||
| Residential mortgage loans | 19,899 | 3.12 | % | 20,179 | 3.17 | % | 21,740 | 3.29 | % | |||||||||||||||||
| Home equity | 3,895 | 3.81 | % | 4,010 | 3.52 | % | 4,674 | 3.60 | % | |||||||||||||||||
| Indirect secured consumer loans | 17,241 | 3.17 | % | 17,136 | 3.08 | % | 14,702 | 3.41 | % | |||||||||||||||||
| Credit card | 1,704 | 12.29 | % | 1,691 | 12.31 | % | 1,770 | 12.13 | % | |||||||||||||||||
| Other consumer loans | 3,125 | 5.99 | % | 2,741 | 6.08 | % | 3,056 | 5.96 | % | |||||||||||||||||
| Total consumer loans | 45,864 | 3.73 | % | 45,757 | 3.68 | % | 45,942 | 3.88 | % | |||||||||||||||||
| Total loans and leases | 120,236 | 3.61 | % | 117,162 | 3.41 | % | 114,443 | 3.63 | % | |||||||||||||||||
| Securities: | ||||||||||||||||||||||||||
| Taxable securities | 53,475 | 2.73 | % | 41,412 | 2.84 | % | 36,097 | 3.06 | % | |||||||||||||||||
Tax exempt securities(a) | 1,063 | 2.47 | % | 1,010 | 2.40 | % | 820 | 2.47 | % | |||||||||||||||||
| Other short-term investments | 9,632 | 0.60 | % | 28,310 | 0.18 | % | 33,558 | 0.11 | % | |||||||||||||||||
| Total interest-earning assets | 184,406 | 3.19 | % | 187,894 | 2.79 | % | 184,918 | 2.88 | % | |||||||||||||||||
| Cash and due from banks | 3,118 | 2,962 | 3,033 | |||||||||||||||||||||||
| Other assets | 20,282 | 20,186 | 20,608 | |||||||||||||||||||||||
| Allowance for loan and lease losses | (1,909) | (1,892) | (2,206) | |||||||||||||||||||||||
| Total Assets | $205,897 | $209,150 | $206,353 | |||||||||||||||||||||||
| Liabilities | ||||||||||||||||||||||||||
| Interest-bearing liabilities: | ||||||||||||||||||||||||||
| Interest checking deposits | $44,349 | 0.15 | % | $48,659 | 0.05 | % | $45,307 | 0.06 | % | |||||||||||||||||
| Savings deposits | 23,708 | 0.03 | % | 22,772 | 0.02 | % | 20,494 | 0.02 | % | |||||||||||||||||
| Money market deposits | 29,284 | 0.06 | % | 30,263 | 0.03 | % | 30,844 | 0.05 | % | |||||||||||||||||
| Foreign office deposits | 139 | 0.13 | % | 126 | 0.04 | % | 140 | 0.03 | % | |||||||||||||||||
| CDs $250,000 or less | 2,193 | 0.09 | % | 2,376 | 0.12 | % | 3,514 | 0.30 | % | |||||||||||||||||
| Total interest-bearing core deposits | 99,673 | 0.09 | % | 104,196 | 0.04 | % | 100,299 | 0.06 | % | |||||||||||||||||
| CDs over $250,000 | 662 | 1.08 | % | 254 | 0.85 | % | 326 | 1.84 | % | |||||||||||||||||
| Federal funds purchased | 392 | 0.82 | % | 259 | 0.15 | % | 346 | 0.10 | % | |||||||||||||||||
| Securities sold under repurchase agreements | 488 | 0.08 | % | 491 | 0.01 | % | 566 | 0.03 | % | |||||||||||||||||
| FHLB advances | 2,743 | 1.41 | % | — | 0.15 | % | — | — | ||||||||||||||||||
| Derivative collateral and other secured borrowings | 340 | 3.12 | % | 399 | 0.31 | % | 531 | 0.22 | % | |||||||||||||||||
| Long-term debt | 11,164 | 3.09 | % | 11,165 | 3.02 | % | 13,883 | 2.85 | % | |||||||||||||||||
| Total interest-bearing liabilities | 115,462 | 0.43 | % | 116,764 | 0.33 | % | 115,951 | 0.40 | % | |||||||||||||||||
| Demand deposits | 62,555 | 64,212 | 61,994 | |||||||||||||||||||||||
| Other liabilities | 8,632 | 6,772 | 5,481 | |||||||||||||||||||||||
| Total Liabilities | 186,649 | 187,748 | 183,426 | |||||||||||||||||||||||
| Total Equity | 19,248 | 21,402 | 22,927 | |||||||||||||||||||||||
| Total Liabilities and Equity | $205,897 | $209,150 | $206,353 | |||||||||||||||||||||||
| Ratios: | ||||||||||||||||||||||||||
Net interest margin (FTE)(b) | 2.92 | % | 2.59 | % | 2.63 | % | ||||||||||||||||||||
Net interest rate spread (FTE)(b) | 2.76 | % | 2.46 | % | 2.48 | % | ||||||||||||||||||||
| Interest-bearing liabilities to interest-earning assets | 62.61 | % | 62.14 | % | 62.70 | % | ||||||||||||||||||||
| (a) Average Yield/Rate of these assets are presented on an FTE basis. | ||||||||||||||||||||||||||
| (b) Non-GAAP measure; see discussion and reconciliation of non-GAAP measures beginning on page 27. | ||||||||||||||||||||||||||
21
| Fifth Third Bancorp and Subsidiaries | |||||||||||||||||
| Average Balance Sheet and Yield/Rate Analysis | Year to Date | ||||||||||||||||
| $ in millions | June | June | |||||||||||||||
| (unaudited) | 2022 | 2021 | |||||||||||||||
| Average | Average | Average | Average | ||||||||||||||
| Balance | Yield/Rate | Balance | Yield/Rate | ||||||||||||||
| Assets | |||||||||||||||||
| Interest-earning assets: | |||||||||||||||||
| Loans and leases: | |||||||||||||||||
Commercial and industrial loans(a) | $54,022 | 3.45 | % | $49,263 | 3.61 | % | |||||||||||
Commercial mortgage loans(a) | 10,620 | 3.17 | % | 10,500 | 3.09 | % | |||||||||||
Commercial construction loans(a) | 5,364 | 3.49 | % | 6,041 | 3.15 | % | |||||||||||
Commercial leases(a) | 2,891 | 2.89 | % | 3,152 | 3.05 | % | |||||||||||
| Total commercial loans and leases | 72,897 | 3.39 | % | 68,956 | 3.46 | % | |||||||||||
| Residential mortgage loans | 20,037 | 3.15 | % | 21,095 | 3.32 | % | |||||||||||
| Home equity | 3,952 | 3.66 | % | 4,841 | 3.59 | % | |||||||||||
| Indirect secured consumer loans | 17,189 | 3.13 | % | 14,331 | 3.49 | % | |||||||||||
| Credit card | 1,698 | 12.30 | % | 1,824 | 12.25 | % | |||||||||||
| Other consumer loans | 2,935 | 6.03 | % | 3,027 | 6.04 | % | |||||||||||
| Total consumer loans | 45,811 | 3.71 | % | 45,118 | 3.95 | % | |||||||||||
| Total loans and leases | 118,708 | 3.51 | % | 114,074 | 3.66 | % | |||||||||||
| Securities: | |||||||||||||||||
| Taxable securities | 47,476 | 2.77 | % | 35,932 | 3.01 | % | |||||||||||
Tax exempt securities(a) | 1,036 | 2.43 | % | 677 | 2.39 | % | |||||||||||
| Other short-term investments | 18,919 | 0.28 | % | 33,140 | 0.10 | % | |||||||||||
| Total interest-earning assets | 186,139 | 2.99 | % | 183,823 | 2.89 | % | |||||||||||
| Cash and due from banks | 3,040 | 3,012 | |||||||||||||||
| Other assets | 20,237 | 20,595 | |||||||||||||||
| Allowance for loan and lease losses | (1,901) | (2,328) | |||||||||||||||
| Total Assets | $207,515 | $205,102 | |||||||||||||||
| Liabilities | |||||||||||||||||
| Interest-bearing liabilities: | |||||||||||||||||
| Interest checking deposits | $46,492 | 0.10 | % | $45,437 | 0.06 | % | |||||||||||
| Savings deposits | 23,242 | 0.02 | % | 19,727 | 0.02 | % | |||||||||||
| Money market deposits | 29,771 | 0.05 | % | 30,723 | 0.05 | % | |||||||||||
| Foreign office deposits | 132 | 0.09 | % | 134 | 0.04 | % | |||||||||||
| CDs $250,000 or less | 2,284 | 0.10 | % | 3,668 | 0.40 | % | |||||||||||
| Total interest-bearing core deposits | 101,921 | 0.07 | % | 99,689 | 0.06 | % | |||||||||||
| CDs over $250,000 | 459 | 1.02 | % | 776 | 1.41 | % | |||||||||||
| Federal funds purchased | 326 | 0.56 | % | 335 | 0.11 | % | |||||||||||
| Securities sold under repurchase agreements | 489 | 0.05 | % | 615 | 0.03 | % | |||||||||||
| FHLB advances | 1,379 | 1.41 | % | — | — | ||||||||||||
| Derivative collateral and other secured borrowings | 370 | 1.61 | % | 538 | 0.35 | % | |||||||||||
| Long-term debt | 11,165 | 3.05 | % | 14,362 | 2.84 | % | |||||||||||
| Total interest-bearing liabilities | 116,109 | 0.38 | % | 116,315 | 0.42 | % | |||||||||||
| Demand deposits | 63,379 | 60,300 | |||||||||||||||
| Other liabilities | 7,708 | 5,548 | |||||||||||||||
| Total Liabilities | 187,196 | 182,163 | |||||||||||||||
| Total Equity | 20,319 | 22,939 | |||||||||||||||
| Total Liabilities and Equity | $207,515 | $205,102 | |||||||||||||||
| Ratios: | |||||||||||||||||
Net interest margin (FTE)(b) | 2.75 | % | 2.62 | % | |||||||||||||
Net interest rate spread (FTE)(b) | 2.61 | % | 2.47 | % | |||||||||||||
| Interest-bearing liabilities to interest-earning assets | 62.38 | % | 63.28 | % | |||||||||||||
| (a) Average Yield/Rate of these assets are presented on an FTE basis. | |||||||||||||||||
| (b) Non-GAAP measure; see discussion and reconciliation of non-GAAP measures beginning on page 27. | |||||||||||||||||
22
| Fifth Third Bancorp and Subsidiaries | |||||||||||||||||
| Summary of Loans and Leases | |||||||||||||||||
| $ in millions | For the Three Months Ended | ||||||||||||||||
| (unaudited) | June | March | December | September | June | ||||||||||||
| 2022 | 2022 | 2021 | 2021 | 2021 | |||||||||||||
| Average Portfolio Loans and Leases | |||||||||||||||||
| Commercial loans and leases: | |||||||||||||||||
| Commercial and industrial loans | $55,460 | $52,554 | $49,566 | $47,766 | $48,773 | ||||||||||||
| Commercial mortgage loans | 10,710 | 10,521 | 10,247 | 10,317 | 10,459 | ||||||||||||
| Commercial construction loans | 5,356 | 5,371 | 5,329 | 5,728 | 6,043 | ||||||||||||
| Commercial leases | 2,839 | 2,942 | 3,057 | 3,158 | 3,174 | ||||||||||||
| Total commercial loans and leases | 74,365 | 71,388 | 68,199 | 66,969 | 68,449 | ||||||||||||
| Consumer loans: | |||||||||||||||||
| Residential mortgage loans | 17,363 | 16,501 | 16,188 | 16,223 | 15,883 | ||||||||||||
| Home equity | 3,895 | 4,009 | 4,179 | 4,409 | 4,674 | ||||||||||||
| Indirect secured consumer loans | 17,241 | 17,136 | 16,345 | 15,590 | 14,702 | ||||||||||||
| Credit card | 1,704 | 1,691 | 1,739 | 1,748 | 1,770 | ||||||||||||
| Other consumer loans | 3,125 | 2,742 | 2,837 | 3,031 | 3,056 | ||||||||||||
| Total consumer loans | 43,328 | 42,079 | 41,288 | 41,001 | 40,085 | ||||||||||||
| Total average portfolio loans and leases | $117,693 | $113,467 | $109,487 | $107,970 | $108,534 | ||||||||||||
| Average Loans and Leases Held for Sale | |||||||||||||||||
| Commercial loans and leases held for sale | $7 | $18 | $5 | $31 | $52 | ||||||||||||
| Consumer loans held for sale | 2,536 | 3,677 | 5,298 | 5,527 | 5,857 | ||||||||||||
| Average loans and leases held for sale | $2,543 | $3,695 | $5,303 | $5,558 | $5,909 | ||||||||||||
Average PPP loans(a) | $549 | $1,012 | $1,756 | $3,071 | $4,810 | ||||||||||||
| Average portfolio commercial and industrial loans - excluding PPP loans | 54,911 | 51,542 | 47,810 | 44,695 | 43,963 | ||||||||||||
| Total average portfolio commercial and industrial loans | $55,460 | $52,554 | $49,566 | $47,766 | $48,773 | ||||||||||||
| End of Period Portfolio Loans and Leases | |||||||||||||||||
| Commercial loans and leases: | |||||||||||||||||
| Commercial and industrial loans | $56,095 | $53,909 | $51,659 | $47,834 | $47,564 | ||||||||||||
| Commercial mortgage loans | 10,748 | 10,694 | 10,316 | 10,300 | 10,347 | ||||||||||||
| Commercial construction loans | 5,357 | 5,420 | 5,241 | 5,456 | 5,871 | ||||||||||||
| Commercial leases | 2,850 | 2,915 | 3,052 | 3,130 | 3,238 | ||||||||||||
| Total commercial loans and leases | 75,050 | 72,938 | 70,268 | 66,720 | 67,020 | ||||||||||||
| Consumer loans: | |||||||||||||||||
| Residential mortgage loans | 17,566 | 17,144 | 16,397 | 16,158 | 16,131 | ||||||||||||
| Home equity | 3,906 | 3,916 | 4,084 | 4,276 | 4,545 | ||||||||||||
| Indirect secured consumer loans | 17,017 | 17,424 | 16,783 | 16,004 | 15,192 | ||||||||||||
| Credit card | 1,763 | 1,690 | 1,766 | 1,744 | 1,793 | ||||||||||||
| Other consumer loans | 3,521 | 2,753 | 2,752 | 3,009 | 3,052 | ||||||||||||
| Total consumer loans | 43,773 | 42,927 | 41,782 | 41,191 | 40,713 | ||||||||||||
| Total portfolio loans and leases | $118,823 | $115,865 | $112,050 | $107,911 | $107,733 | ||||||||||||
End of Period Loans and Leases Held for Sale | |||||||||||||||||
| Commercial loans and leases held for sale | $4 | $23 | $21 | $2 | $46 | ||||||||||||
| Consumer loans held for sale | 2,538 | 2,593 | 4,394 | 5,201 | 5,684 | ||||||||||||
| Loans and leases held for sale | $2,542 | $2,616 | $4,415 | $5,203 | $5,730 | ||||||||||||
| Operating lease equipment | $600 | $622 | $616 | $647 | $715 | ||||||||||||
Loans and Leases Serviced for Others(b) | |||||||||||||||||
| Commercial and industrial loans | $994 | $993 | $923 | $879 | $919 | ||||||||||||
| Commercial mortgage loans | 601 | 592 | 610 | 620 | 623 | ||||||||||||
| Commercial construction loans | 418 | 502 | 474 | 487 | 528 | ||||||||||||
| Commercial leases | 566 | 571 | 589 | 555 | 536 | ||||||||||||
| Residential mortgage loans | 100,519 | 97,736 | 89,234 | 77,929 | 71,496 | ||||||||||||
| Other consumer loans | — | — | — | 50 | 50 | ||||||||||||
| Total loans and leases serviced for others | 103,098 | 100,394 | 91,830 | 80,520 | 74,152 | ||||||||||||
| Total loans and leases owned or serviced | $225,063 | $219,497 | $208,911 | $194,281 | $188,330 | ||||||||||||
End of period PPP loans(a) | $371 | $737 | $1,305 | $2,344 | $3,685 | ||||||||||||
| End of period portfolio commercial and industrial loans - excluding PPP loans | 55,724 | 53,172 | 50,354 | 45,490 | 43,879 | ||||||||||||
| Total end of period portfolio commercial and industrial loans | $56,095 | $53,909 | $51,659 | $47,834 | $47,564 | ||||||||||||
(a)Paycheck Protection Program loans are included in commercial and industrial loans in the Condensed Consolidated Balance Sheets.
(b)Fifth Third sells certain loans and leases and obtains servicing responsibilities.
23
| Fifth Third Bancorp and Subsidiaries | |||||||||||||||||||||||
| Regulatory Capital | |||||||||||||||||||||||
| $ in millions | As of | ||||||||||||||||||||||
| (unaudited) | June | March | December | September | June | ||||||||||||||||||
2022(a) | 2022 | 2021 | 2021 | 2021 | |||||||||||||||||||
Regulatory Capital(b) | |||||||||||||||||||||||
| CET1 capital | $14,830 | $14,937 | $14,781 | $14,673 | $15,050 | ||||||||||||||||||
| Additional tier 1 capital | 2,116 | 2,116 | 2,116 | 2,116 | 2,116 | ||||||||||||||||||
| Tier 1 capital | 16,946 | 17,053 | 16,897 | 16,789 | 17,166 | ||||||||||||||||||
| Tier 2 capital | 3,713 | 3,676 | 3,892 | 3,953 | 4,018 | ||||||||||||||||||
| Total regulatory capital | $20,659 | $20,729 | $20,789 | $20,742 | $21,184 | ||||||||||||||||||
Risk-weighted assets | $165,502 | $160,352 | $154,860 | $148,827 | $145,084 | ||||||||||||||||||
| Ratios | |||||||||||||||||||||||
Average total Bancorp shareholders’ equity as a percent of average assets | 9.35 | % | 10.23 | % | 10.71 | % | 11.16 | % | 11.11 | % | |||||||||||||
Regulatory Capital Ratios(b) | |||||||||||||||||||||||
| Fifth Third Bancorp | |||||||||||||||||||||||
CET1 capital | 8.96 | % | 9.31 | % | 9.54 | % | 9.86 | % | 10.37 | % | |||||||||||||
Tier 1 risk-based capital | 10.24 | % | 10.63 | % | 10.91 | % | 11.28 | % | 11.83 | % | |||||||||||||
Total risk-based capital | 12.48 | % | 12.93 | % | 13.42 | % | 13.94 | % | 14.60 | % | |||||||||||||
| Leverage | 8.30 | % | 8.32 | % | 8.27 | % | 8.41 | % | 8.55 | % | |||||||||||||
| Fifth Third Bank, National Association | |||||||||||||||||||||||
Tier 1 risk-based capital | 10.60 | % | 10.85 | % | 10.90 | % | 11.25 | % | 11.67 | % | |||||||||||||
Total risk-based capital | 12.03 | % | 12.24 | % | 12.33 | % | 12.79 | % | 13.27 | % | |||||||||||||
| Leverage | 8.62 | % | 8.51 | % | 8.29 | % | 8.43 | % | 8.46 | % | |||||||||||||
(a)Current period regulatory capital data and ratios are estimated.
(b)Regulatory capital ratios are calculated pursuant to the five-year transition provision option to phase in the effects of CECL on regulatory capital after its adoption on January 1, 2020.
24
| Fifth Third Bancorp and Subsidiaries | |||||||||||||||||
| Summary of Credit Loss Experience | |||||||||||||||||
| $ in millions | For the Three Months Ended | ||||||||||||||||
| (unaudited) | June | March | December | September | June | ||||||||||||
| 2022 | 2022 | 2021 | 2021 | 2021 | |||||||||||||
| Average portfolio loans and leases: | |||||||||||||||||
| Commercial and industrial loans | $55,460 | $52,554 | $49,566 | $47,766 | $48,773 | ||||||||||||
| Commercial mortgage loans | 10,710 | 10,521 | 10,247 | 10,317 | 10,459 | ||||||||||||
| Commercial construction loans | 5,356 | 5,371 | 5,329 | 5,728 | 6,043 | ||||||||||||
| Commercial leases | 2,839 | 2,942 | 3,057 | 3,158 | 3,174 | ||||||||||||
| Total commercial loans and leases | 74,365 | 71,388 | 68,199 | 66,969 | 68,449 | ||||||||||||
| Residential mortgage loans | 17,363 | 16,501 | 16,188 | 16,223 | 15,883 | ||||||||||||
| Home equity | 3,895 | 4,009 | 4,179 | 4,409 | 4,674 | ||||||||||||
| Indirect secured consumer loans | 17,241 | 17,136 | 16,345 | 15,590 | 14,702 | ||||||||||||
| Credit card | 1,704 | 1,691 | 1,739 | 1,748 | 1,770 | ||||||||||||
| Other consumer loans | 3,125 | 2,742 | 2,837 | 3,031 | 3,056 | ||||||||||||
| Total consumer loans | 43,328 | 42,079 | 41,288 | 41,001 | 40,085 | ||||||||||||
| Total average portfolio loans and leases | $117,693 | $113,467 | $109,487 | $107,970 | $108,534 | ||||||||||||
| Losses charged-off: | |||||||||||||||||
| Commercial and industrial loans | ($34) | ($11) | ($25) | ($10) | ($36) | ||||||||||||
| Commercial mortgage loans | — | — | (1) | — | (8) | ||||||||||||
| Commercial construction loans | (3) | — | — | — | — | ||||||||||||
| Commercial leases | — | — | (2) | — | (1) | ||||||||||||
| Total commercial loans and leases | (37) | (11) | (28) | (10) | (45) | ||||||||||||
| Residential mortgage loans | — | (1) | — | (1) | (1) | ||||||||||||
| Home equity | (3) | (2) | (2) | (2) | (2) | ||||||||||||
| Indirect secured consumer loans | (14) | (16) | (13) | (9) | (11) | ||||||||||||
| Credit card | (18) | (17) | (17) | (17) | (26) | ||||||||||||
| Other consumer loans | (18) | (17) | (17) | (17) | (18) | ||||||||||||
| Total consumer loans | (53) | (53) | (49) | (46) | (58) | ||||||||||||
| Total losses charged-off | ($90) | ($64) | ($77) | ($56) | ($103) | ||||||||||||
| Recoveries of losses previously charged-off: | |||||||||||||||||
| Commercial and industrial loans | $1 | $2 | $11 | $5 | $23 | ||||||||||||
| Commercial mortgage loans | — | 1 | — | 1 | 2 | ||||||||||||
| Commercial construction loans | — | — | — | — | — | ||||||||||||
| Commercial leases | — | — | — | — | 3 | ||||||||||||
| Total commercial loans and leases | 1 | 3 | 11 | 6 | 28 | ||||||||||||
| Residential mortgage loans | 1 | 2 | 3 | 2 | 1 | ||||||||||||
| Home equity | 3 | 3 | 4 | 3 | 3 | ||||||||||||
| Indirect secured consumer loans | 9 | 9 | 7 | 10 | 11 | ||||||||||||
| Credit card | 4 | 4 | 4 | 5 | 6 | ||||||||||||
| Other consumer loans | 10 | 9 | 10 | 9 | 10 | ||||||||||||
| Total consumer loans | 27 | 27 | 28 | 29 | 31 | ||||||||||||
| Total recoveries of losses previously charged-off | $28 | $30 | $39 | $35 | $59 | ||||||||||||
| Net losses charged-off: | |||||||||||||||||
| Commercial and industrial loans | ($33) | ($9) | ($14) | ($5) | ($13) | ||||||||||||
| Commercial mortgage loans | — | 1 | (1) | 1 | (6) | ||||||||||||
| Commercial construction loans | (3) | — | — | — | — | ||||||||||||
| Commercial leases | — | — | (2) | — | 2 | ||||||||||||
| Total commercial loans and leases | (36) | (8) | (17) | (4) | (17) | ||||||||||||
| Residential mortgage loans | 1 | 1 | 3 | 1 | — | ||||||||||||
| Home equity | — | 1 | 2 | 1 | 1 | ||||||||||||
| Indirect secured consumer loans | (5) | (7) | (6) | 1 | — | ||||||||||||
| Credit card | (14) | (13) | (13) | (12) | (20) | ||||||||||||
| Other consumer loans | (8) | (8) | (7) | (8) | (8) | ||||||||||||
| Total consumer loans | (26) | (26) | (21) | (17) | (27) | ||||||||||||
| Total net losses charged-off | ($62) | ($34) | ($38) | ($21) | ($44) | ||||||||||||
| Net losses charged-off as a percent of average portfolio loans and leases (annualized): | |||||||||||||||||
| Commercial and industrial loans | 0.24 | % | 0.07 | % | 0.11 | % | 0.04 | % | 0.11 | % | |||||||
| Commercial mortgage loans | — | (0.03 | %) | 0.03 | % | (0.03 | %) | 0.22 | % | ||||||||
| Commercial construction loans | 0.23 | % | — | (0.01 | %) | — | 0.02 | % | |||||||||
| Commercial leases | (0.03 | %) | (0.02 | %) | 0.24 | % | 0.00 | % | (0.21 | %) | |||||||
| Total commercial loans and leases | 0.19 | % | 0.05 | % | 0.10 | % | 0.03 | % | 0.10 | % | |||||||
| Residential mortgage loans | (0.02 | %) | (0.02 | %) | (0.06 | %) | (0.02 | %) | (0.01 | %) | |||||||
| Home equity | (0.06 | %) | (0.07 | %) | (0.18 | %) | (0.13 | %) | (0.09 | %) | |||||||
| Indirect secured consumer loans | 0.13 | % | 0.17 | % | 0.14 | % | (0.02 | %) | 0.01 | % | |||||||
| Credit card | 3.26 | % | 3.13 | % | 2.90 | % | 2.70 | % | 4.52 | % | |||||||
| Other consumer loans | 1.04 | % | 1.07 | % | 1.12 | % | 1.05 | % | 0.91 | % | |||||||
| Total consumer loans | 0.24 | % | 0.25 | % | 0.21 | % | 0.16 | % | 0.26 | % | |||||||
| Total net losses charged-off as a percent of average portfolio loans and leases (annualized) | 0.21 | % | 0.12 | % | 0.14 | % | 0.08 | % | 0.16 | % | |||||||
25
| Fifth Third Bancorp and Subsidiaries | ||||||||||||||||||||
| Asset Quality | ||||||||||||||||||||
| $ in millions | For the Three Months Ended | |||||||||||||||||||
| (unaudited) | June | March | December | September | June | |||||||||||||||
| 2022 | 2022 | 2021 | 2021 | 2021 | ||||||||||||||||
| Allowance for Credit Losses | ||||||||||||||||||||
| Allowance for loan and lease losses, beginning | $1,908 | $1,892 | $1,954 | $2,033 | $2,208 | |||||||||||||||
| Total net losses charged-off | (62) | (34) | (38) | (21) | (44) | |||||||||||||||
| Provision for (benefit from) loan and lease losses | 168 | 50 | (24) | (58) | (131) | |||||||||||||||
| Allowance for loan and lease losses, ending | $2,014 | $1,908 | $1,892 | $1,954 | $2,033 | |||||||||||||||
| Reserve for unfunded commitments, beginning | $177 | $182 | $205 | $189 | $173 | |||||||||||||||
| Provision for (benefit from) the reserve for unfunded commitments | 11 | (5) | (23) | 16 | 16 | |||||||||||||||
| Reserve for unfunded commitments, ending | $188 | $177 | $182 | $205 | $189 | |||||||||||||||
| Components of allowance for credit losses: | ||||||||||||||||||||
| Allowance for loan and lease losses | $2,014 | $1,908 | $1,892 | $1,954 | $2,033 | |||||||||||||||
| Reserve for unfunded commitments | 188 | 177 | 182 | 205 | 189 | |||||||||||||||
| Total allowance for credit losses | $2,202 | $2,085 | $2,074 | $2,159 | $2,222 | |||||||||||||||
| As of | ||||||||||||||||||||
| June | March | December | September | June | ||||||||||||||||
| 2022 | 2022 | 2021 | 2021 | 2021 | ||||||||||||||||
| Nonperforming Assets and Delinquent Loans | ||||||||||||||||||||
| Nonaccrual portfolio loans and leases: | ||||||||||||||||||||
| Commercial and industrial loans | $89 | $105 | $116 | $172 | $193 | |||||||||||||||
| Commercial mortgage loans | 12 | 32 | 42 | 43 | 43 | |||||||||||||||
| Commercial construction loans | — | 6 | 6 | — | — | |||||||||||||||
| Commercial leases | 2 | 3 | 4 | 6 | 9 | |||||||||||||||
| Residential mortgage loans | 49 | 42 | 10 | 13 | 17 | |||||||||||||||
| Home equity | 45 | 49 | 47 | 48 | 53 | |||||||||||||||
| Indirect secured consumer loans | 5 | 5 | 5 | 5 | 6 | |||||||||||||||
| Other consumer loans | 2 | 1 | 1 | 1 | 1 | |||||||||||||||
| Total nonaccrual portfolio loans and leases (excludes restructured loans) | 204 | 243 | 231 | 288 | 322 | |||||||||||||||
| Nonaccrual restructured portfolio commercial loans | 216 | 177 | 169 | 128 | 164 | |||||||||||||||
Nonaccrual restructured portfolio consumer loans(c) | 119 | 114 | 98 | 112 | 135 | |||||||||||||||
| Total nonaccrual portfolio loans and leases | 539 | 534 | 498 | 528 | 621 | |||||||||||||||
| Repossessed property | 6 | 5 | 5 | 4 | 5 | |||||||||||||||
| OREO | 14 | 27 | 24 | 27 | 31 | |||||||||||||||
| Total nonperforming portfolio loans and leases and OREO | 559 | 566 | 527 | 559 | 657 | |||||||||||||||
| Nonaccrual loans held for sale | — | — | 15 | — | 13 | |||||||||||||||
| Nonaccrual restructured loans held for sale | — | 4 | — | 1 | 27 | |||||||||||||||
| Total nonperforming assets | $559 | $570 | $542 | $560 | $697 | |||||||||||||||
| Loans and leases 90 days past due (accrual): | ||||||||||||||||||||
| Commercial and industrial loans | $6 | $9 | $17 | $4 | $2 | |||||||||||||||
| Commercial mortgage loans | — | 2 | 1 | 2 | 4 | |||||||||||||||
| Commercial construction loans | — | — | 1 | — | — | |||||||||||||||
| Commercial leases | 1 | — | — | 1 | — | |||||||||||||||
| Total commercial loans and leases | 7 | 11 | 19 | 7 | 6 | |||||||||||||||
Residential mortgage loans(c) | 8 | 14 | 72 | 61 | 57 | |||||||||||||||
| Home equity | 2 | 1 | 1 | 1 | 1 | |||||||||||||||
| Indirect secured consumer loans | 8 | 9 | 9 | 8 | 4 | |||||||||||||||
| Credit card | 13 | 14 | 15 | 14 | 14 | |||||||||||||||
| Other consumer loans | 1 | 1 | 1 | 1 | 1 | |||||||||||||||
| Total consumer loans | 32 | 39 | 98 | 85 | 77 | |||||||||||||||
Total loans and leases 90 days past due (accrual)(b) | $39 | $50 | $117 | $92 | $83 | |||||||||||||||
| Ratios | ||||||||||||||||||||
| Net losses charged-off as a percent of average portfolio loans and leases (annualized) | 0.21 | % | 0.12 | % | 0.14 | % | 0.08 | % | 0.16 | % | ||||||||||
| Allowance for credit losses: | ||||||||||||||||||||
| As a percent of portfolio loans and leases | 1.85 | % | 1.80 | % | 1.85 | % | 2.00 | % | 2.06 | % | ||||||||||
As a percent of nonperforming portfolio loans and leases(a) | 408 | % | 391 | % | 416 | % | 409 | % | 358 | % | ||||||||||
As a percent of nonperforming portfolio assets(a) | 394 | % | 369 | % | 394 | % | 386 | % | 338 | % | ||||||||||
Nonperforming portfolio loans and leases as a percent of portfolio loans and leases(a) | 0.45 | % | 0.46 | % | 0.44 | % | 0.49 | % | 0.58 | % | ||||||||||
Nonperforming portfolio assets as a percent of portfolio loans and leases and OREO(a) | 0.47 | % | 0.49 | % | 0.47 | % | 0.52 | % | 0.61 | % | ||||||||||
| Nonperforming assets as a percent of total loans and leases, OREO, and repossessed property | 0.46 | % | 0.48 | % | 0.47 | % | 0.49 | % | 0.61 | % | ||||||||||
| (a) Excludes nonaccrual loans held for sale. | ||||||||||||||||||||
| (b) Excludes loans held for sale. | ||||||||||||||||||||
| (c) Excludes government guaranteed residential mortgage loans. | ||||||||||||||||||||
26
Use of Non-GAAP Financial Measures
In addition to GAAP measures, management considers various non-GAAP measures when evaluating the performance of the business, including: “net interest income (FTE),” “interest income (FTE),” “net interest margin (FTE),” “net interest rate spread (FTE),” “income before income taxes (FTE),” “tangible net income available to common shareholders,” “average tangible common equity,” “return on average tangible common equity,” “tangible common equity (excluding AOCI),” “tangible common equity (including AOCI),” “tangible equity,” “tangible book value per share,” “tangible book value per share (excluding AOCI),” “adjusted noninterest income,” “noninterest income excluding certain items,” “adjusted noninterest expense,” “noninterest expense excluding certain items,” “pre-provision net revenue,” “adjusted efficiency ratio,” “adjusted return on average common equity,” “adjusted return on average tangible common equity,” “adjusted return on average tangible common equity, excluding accumulated other comprehensive income", “adjusted pre-provision net revenue,” “adjusted return on average assets,” “efficiency ratio (FTE),” “total revenue (FTE),” “noninterest income as a percent of total revenue”, and certain ratios derived from these measures. The Bancorp believes these non-GAAP measures provide useful information to investors because these are among the measures used by the Fifth Third management team to evaluate operating performance and to make day-to-day operating decisions.
The FTE basis adjusts for the tax-favored status of income from certain loans and securities held by the Bancorp that are not taxable for federal income tax purposes. The Bancorp believes this presentation to be the preferred industry measurement of net interest income and net interest margin as it provides a relevant comparison between taxable and non-taxable amounts.
The Bancorp believes tangible net income available to common shareholders, average tangible common equity, tangible common equity (excluding AOCI), tangible common equity (including AOCI), tangible equity, tangible book value per share and return on average tangible common equity are important measures for evaluating the performance of the business without the impacts of intangible items, whether acquired or created internally, in a manner comparable to other companies in the industry who present similar measures.
The Bancorp believes noninterest income, noninterest expense, net interest income, net interest margin, pre-provision net revenue, efficiency ratio, noninterest income as a percent of total revenue, return on average common equity, return on average tangible common equity, and return on average assets are important measures that adjust for significant, unusual, or large transactions that may occur in a reporting period which management does not consider indicative of ongoing financial performance and enhances comparability of results with prior periods.
The Bancorp believes noninterest income excluding certain items and noninterest expense excluding certain items are important measures that adjust for certain components that are prone to significant period-to-period changes in order to facilitate the explanation of variances in the noninterest income and noninterest expense line items.
Management considers various measures when evaluating capital utilization and adequacy, including the tangible equity and tangible common equity (including and excluding AOCI), in addition to capital ratios defined by U.S. banking agencies. These calculations are intended to complement the capital ratios defined by U.S. banking agencies for both absolute and comparative purposes. These ratios are not formally defined by U.S. GAAP or codified in the federal banking regulations and, therefore, are considered to be non-GAAP financial measures. Management believes that providing the tangible common equity ratio excluding AOCI on certain assets and liabilities enables investors and others to assess the Bancorp’s use of equity without the effects of changes in AOCI, some of which are uncertain; providing the tangible common equity ratio including AOCI enables investors and others to assess the Bancorp’s use of equity if components of AOCI, such as unrealized gains or losses, were to be monetized.
Please note that although non-GAAP financial measures provide useful insight, they should not be considered in isolation or relied upon as a substitute for analysis using GAAP measures.
Please see reconciliations of all historical non-GAAP measures used in this release to the most directly comparable GAAP measures, beginning on the following page.
27
| Fifth Third Bancorp and Subsidiaries | ||||||||||||||||||||||||||
| Non-GAAP Reconciliation | ||||||||||||||||||||||||||
| $ and shares in millions | As of and For the Three Months Ended | |||||||||||||||||||||||||
| (unaudited) | June | March | December | September | June | |||||||||||||||||||||
| 2022 | 2022 | 2021 | 2021 | 2021 | ||||||||||||||||||||||
| Net interest income | $1,339 | $1,195 | $1,197 | $1,189 | $1,208 | |||||||||||||||||||||
| Add: Taxable equivalent adjustment | 3 | 3 | 3 | 3 | 3 | |||||||||||||||||||||
| Net interest income (FTE) (a) | 1,342 | 1,198 | 1,200 | 1,192 | 1,211 | |||||||||||||||||||||
| Net interest income (annualized) (b) | 5,371 | 4,846 | 4,749 | 4,717 | 4,845 | |||||||||||||||||||||
| Net interest income (FTE) (annualized) (c) | 5,383 | 4,859 | 4,761 | 4,729 | 4,857 | |||||||||||||||||||||
| Interest income | 1,464 | 1,289 | 1,294 | 1,292 | 1,323 | |||||||||||||||||||||
| Add: Taxable equivalent adjustment | 3 | 3 | 3 | 3 | 3 | |||||||||||||||||||||
| Interest income (FTE) | 1,467 | 1,292 | 1,297 | 1,295 | 1,326 | |||||||||||||||||||||
| Interest income (FTE) (annualized) (d) | 5,884 | 5,240 | 5,146 | 5,138 | 5,319 | |||||||||||||||||||||
| Interest expense (annualized) (e) | 501 | 381 | 385 | 409 | 461 | |||||||||||||||||||||
| Average interest-earning assets (f) | 184,406 | 187,894 | 187,045 | 182,801 | 184,918 | |||||||||||||||||||||
| Average interest-bearing liabilities (g) | 115,462 | 116,764 | 115,725 | 113,548 | 115,951 | |||||||||||||||||||||
| Net interest margin (b) / (f) | 2.91 | % | 2.58 | % | 2.54 | % | 2.58 | % | 2.62 | % | ||||||||||||||||
| Net interest margin (FTE) (c) / (f) | 2.92 | % | 2.59 | % | 2.55 | % | 2.59 | % | 2.63 | % | ||||||||||||||||
| Net interest rate spread (FTE) (d) / (f) - (e) / (g) | 2.76 | % | 2.46 | % | 2.42 | % | 2.45 | % | 2.48 | % | ||||||||||||||||
| Income before income taxes | $724 | $612 | $829 | $895 | $911 | |||||||||||||||||||||
| Add: Taxable equivalent adjustment | 3 | 3 | 3 | 3 | 3 | |||||||||||||||||||||
| Income before income taxes (FTE) | 727 | 615 | 832 | 898 | 914 | |||||||||||||||||||||
| Net income available to common shareholders | 526 | 474 | 627 | 684 | 674 | |||||||||||||||||||||
| Add: Intangible amortization, net of tax | 9 | 9 | 9 | 9 | 8 | |||||||||||||||||||||
| Tangible net income available to common shareholders (h) | 535 | 483 | 636 | 693 | 682 | |||||||||||||||||||||
| Tangible net income available to common shareholders (annualized) (i) | 2,146 | 1,959 | 2,523 | 2,749 | 2,735 | |||||||||||||||||||||
Average Bancorp shareholders’ equity | 19,248 | 21,402 | 22,449 | 22,927 | 22,927 | |||||||||||||||||||||
| Less: | Average preferred stock | (2,116) | (2,116) | (2,116) | (2,116) | (2,116) | ||||||||||||||||||||
| Average goodwill | (4,744) | (4,514) | (4,514) | (4,430) | (4,259) | |||||||||||||||||||||
| Average intangible assets | (158) | (150) | (162) | (149) | (122) | |||||||||||||||||||||
| Average tangible common equity, including AOCI (j) | 12,230 | 14,622 | 15,657 | 16,232 | 16,430 | |||||||||||||||||||||
| Less: | Average AOCI | 2,397 | (129) | (1,382) | (1,980) | (1,968) | ||||||||||||||||||||
| Average tangible common equity, excluding AOCI (k) | 14,627 | 14,493 | 14,275 | 14,252 | 14,462 | |||||||||||||||||||||
Total Bancorp shareholders’ equity | 18,970 | 20,177 | 22,210 | 22,524 | 22,926 | |||||||||||||||||||||
| Less: | Preferred stock | (2,116) | (2,116) | (2,116) | (2,116) | (2,116) | ||||||||||||||||||||
| Goodwill | (4,926) | (4,514) | (4,514) | (4,514) | (4,259) | |||||||||||||||||||||
| Intangible assets | (194) | (145) | (156) | (169) | (117) | |||||||||||||||||||||
| Tangible common equity, including AOCI (l) | 11,734 | 13,402 | 15,424 | 15,725 | 16,434 | |||||||||||||||||||||
| Less: | AOCI | 2,644 | 1,096 | (1,207) | (1,637) | (1,974) | ||||||||||||||||||||
| Tangible common equity, excluding AOCI (m) | 14,378 | 14,498 | 14,217 | 14,088 | 14,460 | |||||||||||||||||||||
| Add: | Preferred stock | 2,116 | 2,116 | 2,116 | 2,116 | 2,116 | ||||||||||||||||||||
| Tangible equity (n) | 16,494 | 16,614 | 16,333 | 16,204 | 16,576 | |||||||||||||||||||||
| Total assets | 206,782 | 211,459 | 211,116 | 207,731 | 205,390 | |||||||||||||||||||||
| Less: | Goodwill | (4,926) | (4,514) | (4,514) | (4,514) | (4,259) | ||||||||||||||||||||
| Intangible assets | (194) | (145) | (156) | (169) | (117) | |||||||||||||||||||||
| Tangible assets, including AOCI (o) | 201,662 | 206,800 | 206,446 | 203,048 | 201,014 | |||||||||||||||||||||
| Less: | AOCI, before tax | 3,347 | 1,387 | (1,528) | (2,072) | (2,499) | ||||||||||||||||||||
| Tangible assets, excluding AOCI (p) | $205,009 | $208,187 | $204,918 | $200,976 | $198,515 | |||||||||||||||||||||
| Common shares outstanding (q) | 686 | 686 | 683 | 690 | 704 | |||||||||||||||||||||
| Tangible equity (n) / (p) | 8.05 | % | 7.98 | % | 7.97 | % | 8.06 | % | 8.35 | % | ||||||||||||||||
| Tangible common equity (excluding AOCI) (m) / (p) | 7.01 | % | 6.96 | % | 6.94 | % | 7.01 | % | 7.28 | % | ||||||||||||||||
| Tangible common equity (including AOCI) (l) / (o) | 5.82 | % | 6.48 | % | 7.47 | % | 7.74 | % | 8.18 | % | ||||||||||||||||
| Tangible book value per share (including AOCI) (l) / (q) | $17.10 | $19.54 | $22.58 | $22.79 | $23.34 | |||||||||||||||||||||
| Tangible book value per share (excluding AOCI) (m) / (q) | $20.96 | $21.13 | $20.82 | $20.42 | $20.54 | |||||||||||||||||||||
28
| Fifth Third Bancorp and Subsidiaries | |||||||||||||||||||||||
| Non-GAAP Reconciliation | |||||||||||||||||||||||
| $ in millions | For the Three Months Ended | ||||||||||||||||||||||
| (unaudited) | June | March | June | ||||||||||||||||||||
| 2022 | 2022 | 2021 | |||||||||||||||||||||
| Net income (r) | $562 | $494 | $709 | ||||||||||||||||||||
| Net income (annualized) (s) | 2,254 | 2,003 | 2,844 | ||||||||||||||||||||
| Adjustments (pre-tax items) | |||||||||||||||||||||||
| Valuation of Visa total return swap | 18 | 11 | 37 | ||||||||||||||||||||
| Business disposition charges | 6 | — | — | ||||||||||||||||||||
Adjustments, after-tax (t)(a) | 19 | 8 | 28 | ||||||||||||||||||||
| Noninterest income (u) | 676 | 684 | 741 | ||||||||||||||||||||
| Valuation of Visa total return swap | 18 | 11 | 37 | ||||||||||||||||||||
| Business disposition charges | 6 | — | — | ||||||||||||||||||||
| Adjusted noninterest income (v) | 700 | 695 | 778 | ||||||||||||||||||||
| Noninterest expense (w) | 1,112 | 1,222 | 1,153 | ||||||||||||||||||||
| Adjusted net income (r) + (t) | 581 | 502 | 737 | ||||||||||||||||||||
| Adjusted net income (annualized) (x) | 2,330 | 2,036 | 2,956 | ||||||||||||||||||||
| Adjusted tangible net income available to common shareholders (h) + (t) | 554 | 491 | 710 | ||||||||||||||||||||
| Adjusted tangible net income available to common shareholders (annualized) (y) | 2,222 | 1,991 | 2,848 | ||||||||||||||||||||
| Average assets (z) | $205,897 | $209,150 | $206,353 | ||||||||||||||||||||
| Return on average tangible common equity (i) / (j) | 17.5 | % | 13.4 | % | 16.6 | % | |||||||||||||||||
| Return on average tangible common equity excluding AOCI (i) / (k) | 14.7 | % | 13.5 | % | 18.9 | % | |||||||||||||||||
| Adjusted return on average tangible common equity, including AOCI (y) / (j) | 18.2 | % | 13.6 | % | 17.3 | % | |||||||||||||||||
| Adjusted return on average tangible common equity, excluding AOCI (y) / (k) | 15.2 | % | 13.7 | % | 19.7 | % | |||||||||||||||||
| Return on average assets (s) / (z) | 1.09 | % | 0.96 | % | 1.38 | % | |||||||||||||||||
| Adjusted return on average assets (x) / (z) | 1.13 | % | 0.97 | % | 1.43 | % | |||||||||||||||||
| Efficiency ratio (FTE) (w) / [(a) + (u)] | 55.1 | % | 64.9 | % | 59.1 | % | |||||||||||||||||
| Adjusted efficiency ratio (w) / [(a) + (v)] | 54.5 | % | 64.6 | % | 58.0 | % | |||||||||||||||||
| Total revenue (FTE) (a) + (u) | $2,018 | $1,882 | $1,952 | ||||||||||||||||||||
| Adjusted total revenue (FTE) (a) + (v) | $2,042 | $1,893 | $1,989 | ||||||||||||||||||||
| Pre-provision net revenue (PPNR) (a) + (u) - (w) | $906 | $660 | $799 | ||||||||||||||||||||
| Adjusted pre-provision net revenue (PPNR) (a) + (v) - (w) | $930 | $671 | $836 | ||||||||||||||||||||
| Totals may not foot due to rounding; (a) Assumes a 23% tax rate | |||||||||||||||||||||||
29
| Fifth Third Bancorp and Subsidiaries | |||||||||||||||||||||||
| Segment Presentation | |||||||||||||||||||||||
| $ in millions | |||||||||||||||||||||||
| (unaudited) | |||||||||||||||||||||||
For the three months ended June 30, 2022 | Commercial Banking | Branch Banking(b) | Consumer Lending(c) | Wealth and Asset Management | Other/ Eliminations | Total | |||||||||||||||||
Net interest income (FTE)(a) | $518 | $554 | $114 | $53 | $103 | $1,342 | |||||||||||||||||
| Provision for credit losses | (85) | (20) | (4) | — | (70) | (179) | |||||||||||||||||
| Net interest income after provision for credit losses | 433 | 534 | 110 | 53 | 33 | 1,163 | |||||||||||||||||
| Noninterest income | 345 | 219 | 33 | 132 | (53) | 676 | |||||||||||||||||
| Noninterest expense | (418) | (458) | (146) | (137) | 47 | (1,112) | |||||||||||||||||
| Income (loss) before income taxes | 360 | 295 | (3) | 48 | 27 | 727 | |||||||||||||||||
Applicable income tax (expense) benefit(a) | (66) | (62) | 1 | (10) | (28) | (165) | |||||||||||||||||
| Net income (loss) | $294 | $233 | $(2) | $38 | $(1) | $562 | |||||||||||||||||
For the three months ended March 31, 2022 | Commercial Banking | Branch Banking(b) | Consumer Lending(c) | Wealth and Asset Management | Other/ Eliminations | Total | |||||||||||||||||
Net interest income (FTE)(a) | $481 | $430 | $131 | $35 | $121 | $1,198 | |||||||||||||||||
| (Provision for) benefit from credit losses | 28 | (17) | (6) | — | (50) | (45) | |||||||||||||||||
| Net interest income after (provision for) benefit from credit losses | 509 | 413 | 125 | 35 | 71 | 1,153 | |||||||||||||||||
| Noninterest income | 327 | 216 | 52 | 144 | (55) | 684 | |||||||||||||||||
| Noninterest expense | (446) | (490) | (144) | (142) | — | (1,222) | |||||||||||||||||
| Income before income taxes | 390 | 139 | 33 | 37 | 16 | 615 | |||||||||||||||||
Applicable income tax expense(a) | (72) | (30) | (7) | (8) | (4) | (121) | |||||||||||||||||
| Net income | $318 | $109 | $26 | $29 | $12 | $494 | |||||||||||||||||
For the three months ended December 31, 2021 | Commercial Banking | Branch Banking(b) | Consumer Lending(c) | Wealth and Asset Management | Other/ Eliminations | Total | |||||||||||||||||
Net interest income (FTE)(a) | $390 | $316 | $147 | $24 | $323 | $1,200 | |||||||||||||||||
| Benefit from (provision for) credit losses | 114 | (18) | (3) | — | (46) | 47 | |||||||||||||||||
| Net interest income after benefit from (provision for) credit losses | 504 | 298 | 144 | 24 | 277 | 1,247 | |||||||||||||||||
| Noninterest income | 372 | 235 | 35 | 145 | 4 | 791 | |||||||||||||||||
| Noninterest expense | (431) | (471) | (157) | (139) | (8) | (1,206) | |||||||||||||||||
| Income before income taxes | 445 | 62 | 22 | 30 | 273 | 832 | |||||||||||||||||
Applicable income tax expense(a) | (86) | (12) | (5) | (7) | (60) | (170) | |||||||||||||||||
| Net income | $359 | $50 | $17 | $23 | $213 | $662 | |||||||||||||||||
For the three months ended September 30, 2021 | Commercial Banking | Branch Banking(b) | Consumer Lending(c) | Wealth and Asset Management | Other/ Eliminations | Total | |||||||||||||||||
Net interest income (FTE)(a) | $371 | $309 | $145 | $22 | $345 | $1,192 | |||||||||||||||||
| Benefit from (provision for) credit losses | 242 | (13) | 2 | — | (189) | 42 | |||||||||||||||||
| Net interest income after benefit from (provision for) credit losses | 613 | 296 | 147 | 22 | 156 | 1,234 | |||||||||||||||||
| Noninterest income | 362 | 229 | 84 | 143 | 18 | 836 | |||||||||||||||||
| Noninterest expense | (406) | (463) | (158) | (134) | (11) | (1,172) | |||||||||||||||||
| Income before income taxes | 569 | 62 | 73 | 31 | 163 | 898 | |||||||||||||||||
Applicable income tax expense(a) | (112) | (14) | (15) | (7) | (46) | (194) | |||||||||||||||||
| Net income | $457 | $48 | $58 | $24 | $117 | $704 | |||||||||||||||||
For the three months ended June 30, 2021 | Commercial Banking | Branch Banking(b) | Consumer Lending(c) | Wealth and Asset Management | Other/ Eliminations | Total | |||||||||||||||||
Net interest income (FTE)(a) | $378 | $301 | $142 | $21 | $369 | $1,211 | |||||||||||||||||
| Benefit from (provision for) credit losses | 151 | (25) | — | — | (11) | 115 | |||||||||||||||||
| Net interest income after benefit from (provision for) credit losses | 529 | 276 | 142 | 21 | 358 | 1,326 | |||||||||||||||||
| Noninterest income | 355 | 224 | 63 | 143 | (44) | 741 | |||||||||||||||||
| Noninterest expense | (399) | (450) | (163) | (131) | (10) | (1,153) | |||||||||||||||||
| Income before income taxes | 485 | 50 | 42 | 33 | 304 | 914 | |||||||||||||||||
Applicable income tax expense(a) | (92) | (10) | (9) | (7) | (87) | (205) | |||||||||||||||||
| Net income | $393 | $40 | $33 | $26 | $217 | $709 | |||||||||||||||||
(a) Includes taxable equivalent adjustments of $3 million for the three months ended June 30, 2022, March 31, 2022, December 31, 2021, September 30, 2021 and June 30, 2021. | |||||||||||||||||||||||
| (b) Branch Banking provides a full range of deposit and loan and lease products to individuals and small businesses through full-service banking centers. | |||||||||||||||||||||||
(c) Consumer Lending includes the Bancorp’s residential mortgage, home equity, automobile and other indirect lending activities. | |||||||||||||||||||||||
30
1 Classification: Internal Use© Fifth Third Banc rp | All Rights Reserved Fifth Third Bancorp 2Q22 Earnings Presentation July 21st, 2022 Refer to earnings release dated July 21st, 2022 for further information.

2 Classification: Internal Use© Fifth Third Banc rp | All Rights Reserved Cautionary statement This presentation contains statements that we believe are “forward-looking statements” within the meaning of Section 27A of the Securities Act of 1933, as amended, and Rule 175 promulgated thereunder, and Section 21E of the Securities Exchange Act of 1934, as amended, and Rule 3b-6 promulgated thereunder. All statements other than statements of historical fact are forward-looking statements. These statements relate to our financial condition, results of operations, plans, objectives, future performance, capital actions or business. They usually can be identified by the use of forward-looking language such as “will likely result,” “may,” “are expected to,” “is anticipated,” “potential,” “estimate,” “forecast,” “projected,” “intends to,” or may include other similar words or phrases such as “believes,” “plans,” “trend,” “objective,” “continue,” “remain,” or similar expressions, or future or conditional verbs such as “will,” “would,” “should,” “could,” “might,” “can,” or similar verbs. You should not place undue reliance on these statements, as they are subject to risks and uncertainties, including but not limited to the risk factors set forth in our most recent Annual Report on Form 10-K as updated by our filings with the U.S. Securities and Exchange Commission (“SEC”). There are a number of important factors that could cause future results to differ materially from historical performance and these forward-looking statements. Factors that might cause such a difference include, but are not limited to: (1) effects of the global COVID-19 pandemic; (2) deteriorating credit quality; (3) loan concentration by location or industry of borrowers or collateral; (4) problems encountered by other financial institutions; (5) inadequate sources of funding or liquidity; (6) unfavorable actions of rating agencies; (7) inability to maintain or grow deposits; (8) limitations on the ability to receive dividends from subsidiaries; (9) cyber-security risks; (10) Fifth Third’s ability to secure confidential information and deliver products and services through the use of computer systems and telecommunications networks; (11) failures by third-party service providers; (12) inability to manage strategic initiatives and/or organizational changes; (13) inability to implement technology system enhancements; (14) failure of internal controls and other risk management systems; (15) losses related to fraud, theft, misappropriation or violence; (16) inability to attract and retain skilled personnel; (17) adverse impacts of government regulation; (18) governmental or regulatory changes or other actions; (19) failures to meet applicable capital requirements; (20) regulatory objections to Fifth Third’s capital plan; (21) regulation of Fifth Third’s derivatives activities; (22) deposit insurance premiums; (23) assessments for the orderly liquidation fund; (24) replacement of LIBOR; (25) weakness in the national or local economies; (26) global political and economic uncertainty or negative actions; (27) changes in interest rates; (28) changes and trends in capital markets; (29) fluctuation of Fifth Third’s stock price; (30) volatility in mortgage banking revenue; (31) litigation, investigations, and enforcement proceedings by governmental authorities; (32) breaches of contractual covenants, representations and warranties; (33) competition and changes in the financial services industry; (34) changing retail distribution strategies, customer preferences and behavior; (35) difficulties in identifying, acquiring or integrating suitable strategic partnerships, investments or acquisitions; (36) potential dilution from future acquisitions; (37) loss of income and/or difficulties encountered in the sale and separation of businesses, investments or other assets; (38) results of investments or acquired entities; (39) changes in accounting standards or interpretation or declines in the value of Fifth Third’s goodwill or other intangible assets; (40) inaccuracies or other failures from the use of models; (41) effects of critical accounting policies and judgments or the use of inaccurate estimates; (42) weather-related events, other natural disasters, or health emergencies (including pandemics); (43) the impact of reputational risk created by these or other developments on such matters as business generation and retention, funding and liquidity; (44) changes in law or requirements imposed by Fifth Third’s regulators impacting our capital actions, including dividend payments and stock repurchases; and (45) Fifth Third's ability to meet its sustainability targets, goals and commitments. You should refer to our periodic and current reports filed with the Securities and Exchange Commission, or “SEC,” for further information on other factors, which could cause actual results to be significantly different from those expressed or implied by these forward-looking statements. Moreover, you should treat these statements as speaking only as of the date they are made and based only on information then actually known to us. We expressly disclaim any obligation or undertaking to release publicly any updates or revisions to any forward-looking statements contained herein to reflect any change in our expectations or any changes in events, conditions or circumstances on which any such statement is based, except as may be required by law, and we claim the protection of the safe harbor for forward-looking statements contained in the Private Securities Litigation Reform Act of 1995. The information contained herein is intended to be reviewed in its totality, and any stipulations, conditions or provisos that apply to a given piece of information in one part of this press release should be read as applying mutatis mutandis to every other instance of such information appearing herein. Copies of those filings are available at no cost on the SEC’s webs ite at www.sec.gov or on our website at www.53.com. Annualized, pro forma, projected and estimated numbers are used for illustrative purpose only, are not forecasts and may not reflect actual results. In this presentation, we may sometimes provide non-GAAP financial information. Please note that although non-GAAP financial measures provide useful insight to analysts, investors and regulators, they should not be considered in isolation or relied upon as a substitute for analysis using GAAP measures. We provide a discussion of non-GAAP measures and reconciliations to the most directly comparable GAAP measures in later slides in this presentation, as well as on pages 27 through 29 of our 2Q22 earnings release. Management does not provide a reconciliation for forward-looking non-GAAP financial measures where it is unable to provide a meaningful or accurate calculation or estimation of reconciling items and the information is not available without unreasonable effort. This is due to the inherent difficulty of forecasting the occurrence and the financial impact of various items that have not yet occurred, are out of the Bancorp's control or cannot be reasonably predicted. For the same reasons, Bancorp's management is unable to address the probable significance of the unavailable information. Forward-looking non-GAAP financial measures provided without the most directly comparable GAAP financial measures may vary materially from the corresponding GAAP financial measures.

3 Classification: Internal Use© Fifth Third Banc rp | All Rights Reserved • Generated record adjusted revenue • Compared to 2Q21, PPNR increased 13% (adjusted PPNR increased 11%) • Net interest income increased 12% compared to 1Q22; NIM up 33 basis points compared to 1Q22 • Efficiency ratio of 55%, a 4 point improvement from 2Q21 • ACL of 1.85% (includes approximately 4 bps from Dividend Finance); Net charge-off ratio of 0.21% and NPA ratio of 0.47% 2Q22 highlights Reported1 Adjusted1 ROA Efficiency ratio ROTCE 1.13% 15.2% NIM 2.92%2.92% 1.09% 17.5% 54.5%55.1% ROE 12.8%12.3% excl. AOCI PPNR $930MM$906MM EPS $0.79$0.76 CET12 8.96% For end note descriptions, see end note summary starting on page 39

4 Classification: Internal Use© Fifth Third Banc rp | All Rights Reserved Net interest income1 T o ta l n e t in te re s t in c o m e ; $ m ill io n s NII NII $ in millions; NIM change in bps $1,1981Q22 2.59% 1Q22 to 2Q22 Reported NII & NIM Walk NIM $1,342 2.92%2Q22 Higher Day Count Net benefit of deployment of excess cash into securities 9 (1) 67 16 86 19 T o ta l n e t in te re s t in c o m e ; $ m ill io n s NII NIM 22 1 April long-term debt issuance and other wholesale (3) (1) $1,211 $1,198 $1,342 2Q21 1Q22 2Q22 Reduced investment portfolio prepayment penalties (19) (4) Market rate benefit Net benefit of excess cash deployed into loan growth For end note descriptions, see end note summary starting on page 39 Consumer and Commercial loan yield compression (10) (2) 2.63% 2.59% 2.92% NIM benefit of normalizing cash and commercial deposits 0 6 PPP balance runoff (8) (1)

5 Classification: Internal Use© Fifth Third Banc rp | All Rights Reserved Adjusted noninterest income (excl. securities (gains)/losses)1 Noninterest income • Adjusted noninterest income1 up $23 million, or 3% • Primary drivers: ‒ Other noninterest income (up 73%) ‒ Card and processing revenue (up 8%) ‒ Partially offset by mortgage banking net revenue (down 40%) T o ta l n o n in te re s t in c o m e ; $ m ill io n s Noninterest income • Adjusted noninterest income1 down $36 million, or 5% • Primary drivers: ‒ Mortgage banking net revenue (down 52%) ‒ Commercial banking revenue (down 14%) ‒ Partially offset by other noninterest income (up 27%) 2Q22 vs. 2Q21 2Q22 vs. 1Q22 $741 $684 $676 $768 $709 $732 2Q21 1Q22 2Q22 For end note descriptions, see end note summary starting on page 39

6 Classification: Internal Use© Fifth Third Banc rp | All Rights Reserved $1,153 $1,222 $1,112 $1,153 $1,222 $1,112 2Q21 1Q22 2Q22 Adjusted noninterest expense1 Noninterest expense • Adjusted noninterest expense1 down $110 million, or 9% • Primary drivers: ‒ Compensation and benefits (down 18%, or down 15% excluding the impacts of NQDC) ‒ Partially offset by other noninterest expense (up 8%) T o ta l n o n in te re s t e x p e n s e ; $ m ill io n s • Adjusted noninterest expense1 down $41 million, or 4% • Primary drivers: ‒ Compensation and benefits (down 8%, or down 2% excluding the impacts of NQDC) ‒ Net occupancy expense (down 3%) ‒ Partially offset by marketing expense (up 40%) Noninterest expense 2Q22 vs. 2Q21 2Q22 vs. 1Q22 For end note descriptions, see end note summary starting on page 39

7 Classification: Internal Use© Fifth Third Banc rp | All Rights Reserved $67.0 $72.9 $75.1 $40.7 $42.9 $43.8 $107.7 $115.9 $118.8 2Q21 1Q22 2Q22 $36.9 $42.4 $54.5 $33.6 $28.3 $9.6 $70.5 $70.7 $64.2 3.06% 2.84% 2.73% $0.0 $10.0 $20.0 $30.0 $40.0 $50.0 $60.0 $70.0 $80.0 2Q21 1Q22 2Q22 $0.0 $0.0 $0.0 $5.7 $2.6 $2.5 $5.7 $2.6 $2.5 2Q21 1Q22 2Q22 $68.4 $71.4 $74.4 $40.1 $42.1 $43.3 $108.5 $113.5 $117.7 3.63% 3.41% 3.61% 0 0.01 0.02 0.03 0.04 0.05 0.06 0.07 0.08 0.09 0 20 40 60 80 100 120 2Q21 1Q22 2Q22 Commercial Securities1Commercial Interest earning assets Average securities1 and short-term investmentsAverage loan & lease balances Consumer Total loan yield $ in billions; loan & lease balances excluding HFS Short-term investments Taxable securities yield Consumer Period-end loan & lease balances Period-end HFS loan & lease balances Commercial Consumer $ in billions Note: For end note descriptions, see end note summary starting on page 39; totals shown above may not foot due to rounding +3% +8% QoQ YoY % change (2%) (55%) NM NM QoQ YoY % change (66%) (71%) +29% +48% QoQ YoY % change +2% +8% QoQ YoY % change +4% +9% +3% +12% $ in billions; loan & lease balances excluding HFS $ in billions

8 Classification: Internal Use© Fifth Third Banc rp | All Rights Reserved $14.1 $12.2 $20.9 2Q21 1Q22 2Q22 $15.7 $12.6 $15.8 2.58% 2.71% 2.56% $0.0 $2.0 $4.0 $6.0 $8.0 $10.0 $12.0 $14.0 $16.0 $18.0 2Q21 1Q22 2Q22 $80.7 $83.3 $73.8 $81.3 $87.1 $85.3 $162.0 $170.4 $159.0 $0.0 $20.0 $40.0 $60.0 $80.0 $100.0 $120.0 $140.0 $160.0 $180.0 2Q21 1Q22 2Q22 $80.3 $83.0 $76.3 $82.0 $85.4 $85.9 $162.3 $168.4 $162.2 0.06% 0.04% 0.09% -0.10% -0.05% 0.00% 0.05% 0.10% 0.15% 0.20% 2Q21 1Q22 2Q22 Core deposits and wholesale funding Average wholesale funding balancesAverage core deposit balances Commercial Consumer Total IB core deposit rate $ in billions $ in billions Period-end core deposit balances Period-end wholesale funding balances Total wholesale funding Wholesale funding cost Total wholesale fundingCommercial Consumer $ in billions $ in billions Note: totals shown above may not foot due to rounding +1% +5% (8%) (5%) QoQ YoY % change (2%) +5% (11%) (9%) QoQ YoY % change 72% 48% QoQ YoY % change 26% 1% QoQ YoY % change

9 Classification: Internal Use© Fifth Third Banc rp | All Rights Reserved 0.13% 0.18%0.20% 0.32% 0.40% 0.33% 0.40% 0.17% 0.10% 0.03% 0.10% 0.05% 0.19% 0.59% 0.68% 0.78% 0.66% 0.52% 0.40%0.47% 0.43% 0.26% 0.21% 0.25% 0.24% 0.29% 0.36% 0.41%0.44 0.44% 0.35% 0.43% 0.27 0.16% 0.08% 0.14% 0.12% 0.21% -0.10% 0.10% 0.30% 0.50% 0.70% 0.90% 1.10% 1.30% 2Q19 2Q20 2Q21 2Q22 Commercial NCO ratio Consumer NCO ratio Total NCO Ratio 0.51% 0.47% 0.62% 0.60% 0.65% 0.84% 0.79% 0.72% 0.61% 0.52% 0.47%0.49% 0.47% 0.35% 0.37% 0.33% 0.35% 0.33% 0.29% 0.33% 0.28% 0.26% 0.25% 0.23%0.25% 0.25% 0.00% 0.20% 0.40% 0.60% 0.80% 1.00% 1.20% 2Q19 2Q20 2Q21 2Q22 NPA ratio(c) 30-89 days past due as a % of Portfolio loans 2.06% 2.00% 1.85% 1.80% 1.85% -0.30% 0.20% 0.70% 1.20% 1.70% 2.20% 2Q21 3Q21 4Q21 1Q22 2Q22 Credit quality overview Early stage delinquencies and NPAs Net charge-offs (NCOs) ACL as % of portfolio loans and leases • Drivers of $117MM increase in ACL: • $85MM increase from loan balances and unfunded commitment growth (includes impact of Dividend Finance acquisition) • Remainder of growth reflecting macroeconomic forecast conditions 1Q22 1 1Q22 1 For end note descriptions, see end note summary starting on page 39

10 Classification: Internal Use© Fifth Third Banc rp | All Rights Reserved Allowance for credit losses Allowance for loan & lease losses Commercial and industrial loans Commercial mortgage loans Commercial construction loans Commercial leases Total commercial loans and leases Residential mortgage loans Home equity Indirect secured consumer loans Credit card Other consumer loans Total consumer loans Allowance for loan & lease losses Reserve for unfunded commitments1 Allowance for credit losses 100 15 1,165 248 115 141 214 131 849 2,014 188 $2,202 261 789 1.87% 0.53% 1.55% 1.41% 2.94% 0.83% 12.14% 3.72% 1.94% 1.70% 1.85% 1.41% 2.43% Allocation of allowance by product $ in millions 2Q22 Amount % of portfolio loans & leases For end note descriptions, see end note summary starting on page 39; Note, totals shown above may not foot due to rounding Change in Rate 0.97% (0.35%) 0.30% (0.20%) (0.43%) (0.10%) 0.81% (0.16%) (0.52%) 0.01% 0.05% 0.86% 0.19% 0.41% (0.05%) 0.03% 0.02% 0.00% 0.03% 0.07% 0.05% 0.05% 0.00% 0.06% Compared to: 1Q22 CECL Day 1 0.03% 0.08% The ACL ratio of 1.85% includes approximately 4 bps impact from Dividend Finance

11 Classification: Internal Use© Fifth Third Banc rp | All Rights Reserved • Loan-to-core deposit ratio of 75% • ~$97 billion of available liquidity sources • $5.0 billion in Holding Company cash, sufficient to satisfy all fixed obligations in a stressed environment for ~21 months Strong capital and liquidity position Regulatory capital position Fed Reserves Unpledged Investment Securities Available FHLB Borrowing Capacity Current Fed Discount Window Availability Total ~$5 ~$43 ~$6 ~$42 ~$97 Liquidity Sources Liquidity position $ in billions; as of 6/30/2022 Common equity tier 1 ratio1 For end note descriptions, see end note summary starting on page 39; Note: totals shown above may not foot due to rounding ~35 bps 8.96% 9.31% ~(13 bps) ~6 bps ~(37 bps) ~(26 bps) 1Q22 2Q22 Net income to common Dividend Finance acquisition Common dividends OtherRWA • Targeting 9.25% area CET12 at year-end Excludes impact of Dividend Finance acquisition Includes the impact of disposition activities

12 Classification: Internal Use© Fifth Third Banc rp | All Rights Reserved Fifth Third value proposition Generating strong relationship growth in all our markets with a focus on our Southeast expansion and on continually improving the digital experience Diversifying and growing fee revenues to support profitability and generate strong returns Investing for long-term outperformance (people, processes, technology) while still delivering strong financial results Focused on deploying capital into organic growth opportunities, paying a strong dividend, non-bank opportunities and then share repurchases; Bank acquisitions remain a lower priority Maintaining a disciplined approach to rate and credit risk management Significantly different bank compared to the Fifth Third from a decade ago (credit, capital, management, culture) 1 2 3 4 5

13 Classification: Internal Use© Fifth Third Banc rp | All Rights Reserved Current expectations FY 2022 compared to FY 2021 Net interest income1 Noninterest income1 down 7 – 8% (April: stable to down 1%) Noninterest expense1 stable to down 1% (April: up 1 – 2%) up 17 – 18% (April: up 13 – 14% assuming 12/31/22 Fed funds rate of 2.50%) July guidance utilizes July 1 forward curve and assumes 12/31/22 Fed funds rate of 3.25%(FY21 baseline: $4.78BN) (FY21 baseline: $3.15BN) (FY21 baseline: $4.72BN) Net charge-off ratio 20 – 25 bps (April: 20 – 25 bps) Effective tax rate 22 – 23% (April: 22 – 23%) For end note descriptions, see end note summary starting on page 39 As of July 21, 2022; please see cautionary statements on page 2 Relative to April, no change to outlook with respect to: Total revenue1 up 7 – 8% (April: up 7 – 8%) (FY21 baseline: $7.93BN; Includes securities g/l) PPNR1 up 17 – 19% (April: up 16 – 18%) (FY21 baseline: $3.20BN; includes securities g/l) (including HFS) Avg. loans & leases up 5 – 6% (April: up 5 – 6%) • Expect improved PPNR growth (now 17 to 19%), as better NII and expense outlook expected to be partially offset by more subdued noninterest income in current environment • Total loan growth • Total revenue growth • Net charge-off ratio

14 Classification: Internal Use© Fifth Third Banc rp | All Rights Reserved Current expectations As of July 21, 2022; please see cautionary statements on page 2 (including HFS) Avg. loans & leases up ~1% Net interest income1 Noninterest income1 down 3 – 4% Noninterest expense1 up 4 – 5% up ~2% excluding 2Q22 NQDC item of $27MM up 11 – 12% Guidance utilizes July 1 forward curve and assumes 9/30/22 Fed Funds rate of 3.00%(2Q22 baseline: $1.342BN) (2Q22 baseline: $732MM) (2Q22 baseline: $1.112BN) Net charge-off ratio 20 – 25 bps Effective tax rate 22 – 23% Third quarter 2022 compared to Second quarter 2022 For end note descriptions, see end note summary starting on page 39 Total revenue1 up 8 – 9% (2Q22 baseline: $2.042BN; includes securities g/l) PPNR1 up 11 – 13% (2Q22 baseline: $930MM; includes securities g/l)

15 Classification: Internal Use© Fifth Third Banc rp | All Rights Reserved Appendix

16 Classification: Internal Use© Fifth Third Banc rp | All Rights Reserved Living our purpose guided by our vision and values Our Vision Be the One Bank people most value and trust Our Core Values Our Purpose To improve the lives of our customers and the well-being of our communities Work as One Bank Take Accountability Be Respectful Act with Integrity Our purpose, vision, and core values support our commitment to generating sustainable value for stakeholders

17 Classification: Internal Use© Fifth Third Banc rp | All Rights Reserved ESG priorities and metrics Addressing climate change Promoting inclusion and diversity Demonstrating our commitment to employees Strengthening our communities Keeping the customer at the center $180MM Neighborhood Investment Program in nine majority-Black communities $1.3BN provided in community development lending and investment $41MM in charitable donations to support communities ~3MM people educated through our LIFE programs3 ~97K hours of community service and $6MM in employee giving $20/hour minimum wage with over 40% of workforce receiving mid- year compensation increase Special COVID bonus awarded to 7,500+ eligible front-line employees during pandemic Up to 7% 401(k) employer contribution with 84% participation ~765K hours of training (39 hours average / FTE) 99% of banking centers remained open since the start of the pandemic 13MM customer outreach calls in 2021 2% consumer household growth Low reliance on punitive consumer fees, with $16MM overdraft fees avoided with Extra Time ® 2M+ mobile banking users 17% reduction in complaints since 2019 $2.8BN accelerating racial equality, equity and inclusion initiative 38% board diversity2 59% women; 27% persons of color in workforce >99% pay equity for women and minorities $88MM Tier 1 diverse supplier spend, ~9% of net addressable spend (up from 7% in 2020) $8BN in lending and financing to renewable energy projects since 2012 (achieved 2025 goal) 78 due diligence reviews for sensitive sectors in compliance with E&S Policy1 50% reduction in Scope 1 and 2 GHG emissions since 2014 100% renewable energy purchased since 2019 Achieved carbon neutrality in our operations since 2020 Fifth Third is committed to maintaining ESG leadership position For end note descriptions, see end note summary starting on page 39

18 Classification: Internal Use© Fifth Third Banc rp | All Rights Reserved A recognized ESG leader among peers Recent actions Third-party recognitions Published 3rd ESG report Available on ir.53.com Announced 10-year $100BN Environmental & Social Finance Target Expansion of the original $8BN renewable energy goal achieved in June 2022 Aligned executive compensation to ESG topics ESG Funding Modifier added to 2022 Variable Compensation Plan Established sustainability office Leading comprehensive environmental, social and governance strategy, which includes the Bank’s climate strategy and sustainable finance initiatives Acquisition of Dividend Finance A leading fintech point-of-sale (POS) lender, providing financing solutions for residential renewable energy and sustainability-focused home improvement $20 minimum wage per hour Effective July 2022, increase from $18 per hour since 2019 Expanded operational sustainability goals Announced six new operational sustainability targets to be achieved by 2030, including Scope 1 and 2 GHG emissions reduction of 75% Rank for customer COVID Response 2021 Financial Health and Advice from a leading study Top Workplace in Financial Services Recognized by Energage in 2022 Perfect 100% Score Human Rights Campaign Corporate Equality Index for seventh consecutive year A- Leadership Band 2019, 2020 and 2021 CDP surveys BankOn National Certification For Express Banking account #1 SSGA R-Factor Score Feb 2022 Outperformer Top 10-30% among Commercial Banks S&P Global ESG Score Corporate Sustainability Assessment 73rd percentile Top among peers1 MSCI ESG Rating Nov 2021 (last update) A Upgraded 3 notches CSRHub ESG Ranking July 2022 91st percentile Top among peers1 ESG Risk Rating2 July 2022 Low Risk Top quartile among peers1 Refinitiv ESG Combined Score July 2022 A- (79/100) Top among peers1 For end note descriptions, see end note summary starting on page 39

19 Classification: Internal Use© Fifth Third Banc rp | All Rights Reserved Strong liquidity profile $ millions – excl. Retail Brokered & Institutional CDs Unsecured debt maturities Holding company: • Holding Company cash as of June 30, 2022: $5.0BN • Cash currently sufficient to satisfy all fixed obligations in a stressed environment for ~21 months (debt maturities, common and preferred dividends, interest, and other expenses) without accessing capital markets, relying on dividends from subsidiaries or any other actions • The Holding Company issued the following long-term debt in 2Q22: • $400MM 6NC5 fixed-to-floating rate debt • $600MM 11NC10 fixed-to-floating rate debt • $0.7BN of Holding Company debt was redeemed in 2Q22 Bank entity: • The Bank did not issue or have long-term debt maturities in 2Q22 • Available and contingent borrowing capacity (2Q22): • FHLB ~$6.3BN available, ~$13.2BN total • Federal Reserve ~$42.5BN 2022 2023 2024 2025 2026 2027 on Fifth Third Bancorp Fifth Third Bank Fifth Third Financial Corp $2,250 $4,737 $750 $0 $1,150 $1,500 57% 8% 35% Branch Banking Wealth & Asset Management Commercial Banking Composition of deposits by segment Average as of 2Q22

20 Classification: Internal Use© Fifth Third Banc rp | All Rights Reserved $0.4B $0.7B ~$1.2B 2021 2022E ✓ Continue to expect through-the-cycle NCOs in the 0.25% to 0.30% range1 Recent non-bank acquisitions Dividend Finance • Closed acquisition of Dividend Finance on May 10, 2022 • Dividend Finance is a national tech-enabled point-of-sale finance provider assisting homeowners with the renewable energy transition (solar and home improvement loans) • Management team with deep experience in consumer credit, energy, and technology at leading regulated financial services institutions • Leading consumer solar project loan originator with a focus on prime and super-prime borrowers ✓ Continue to expect through-the-cycle NCOs in the 1.30% area1 Dividend Finance expectations For end note descriptions, see end note summary starting on page 39 Estimated Pre-close production Post-close production Provide • Closed acquisition of Provide on August 2, 2021 • Provide is the leading fintech in the healthcare practice finance segment • Digital capabilities delivers best-in-class experience and speed to close • Post-acquisition, added 5 additional products, expanded salesforce, and entered Veterinary vertical • Significant success in deepening relationships with ~70% deposit penetration and ~50% TM penetration ~$1.6B$0.9B ~$2.1B 2021 2022E Estimated Provide expectations Expect ~$1.3B in production in 2H22

21 Classification: Internal Use© Fifth Third Banc rp | All Rights Reserved $25 $16 $11 $6 $3 $28 $31 $25 $14 $10 $53 $47 $36 $20 $12 2Q21 3Q21 4Q21 1Q22 2Q22 Other Accelerated Fees From Forgiveness $3.7 $2.3 $1.3 $0.7 $0.4 2Q21 3Q21 4Q21 1Q22 2Q22 $4.8 $3.1 $1.8 $1.0 $0.5 2Q21 3Q21 4Q21 1Q22 2Q22 Average PPP loan balances Period-end PPP loan balances PPP interest income • Originated $7.3BN in PPP loans across all 3 waves • Projected loan balances1 • FY22 Average Balance: $0.5BN • 4Q22 Average Balance: $0.1BN • Expect FY22 interest income of ~$40MM1 $ in millions $ in billions $ in billions Paycheck Protection Program update For end note descriptions, see end note summary starting on page 39 ; totals shown above may not foot due to rounding

22 Classification: Internal Use© Fifth Third Banc rp | All Rights Reserved $7.2 $3.3 $1.7 $0.5 $0.0 0.00 1.00 2.00 3.00 4.00 5.00 6.00 7.00 8.00 2Q22 3Q22 4Q22 1Q23 2Q23 $16.2 $8.5 $4.5 $1.3 $0.1 0.00 2.00 4.00 6.00 8.00 10.00 12.00 14.00 16.00 18.00 20.00 2Q22 3Q22 4Q22 1Q23 2Q23 $1.6 $1.1 $0.8 $0.3 $0.0 2Q22 3Q22 4Q22 1Q23 2Q23 Average loan balances • Third-party serviced GNMA forbearance loan purchases: • 4Q20: $2.1BN • 1Q21: $0.6BN • 2Q21: $1.0BN • 3Q21: $0.3BN • 4Q21: $0.7BN • Expect the decline in these loan balances to accelerate in 2022, given the strong underlying credit quality of the portfolio • Expect FY22 NII of ~$55MM compared to ~$115MM in FY21 • Expect FY22 servicing expenses of ~$20MM compared to ~$50MM in FY21 • Relatively minor noninterest income in both FY21 and FY22 • GNMA forbearance projections are incorporated into outlook $ in billions GNMA forbearance loan purchase update1 Net interest income $ in millions Servicing expenses $ in millions actual actual actual For end note descriptions, see end note summary starting on page 39
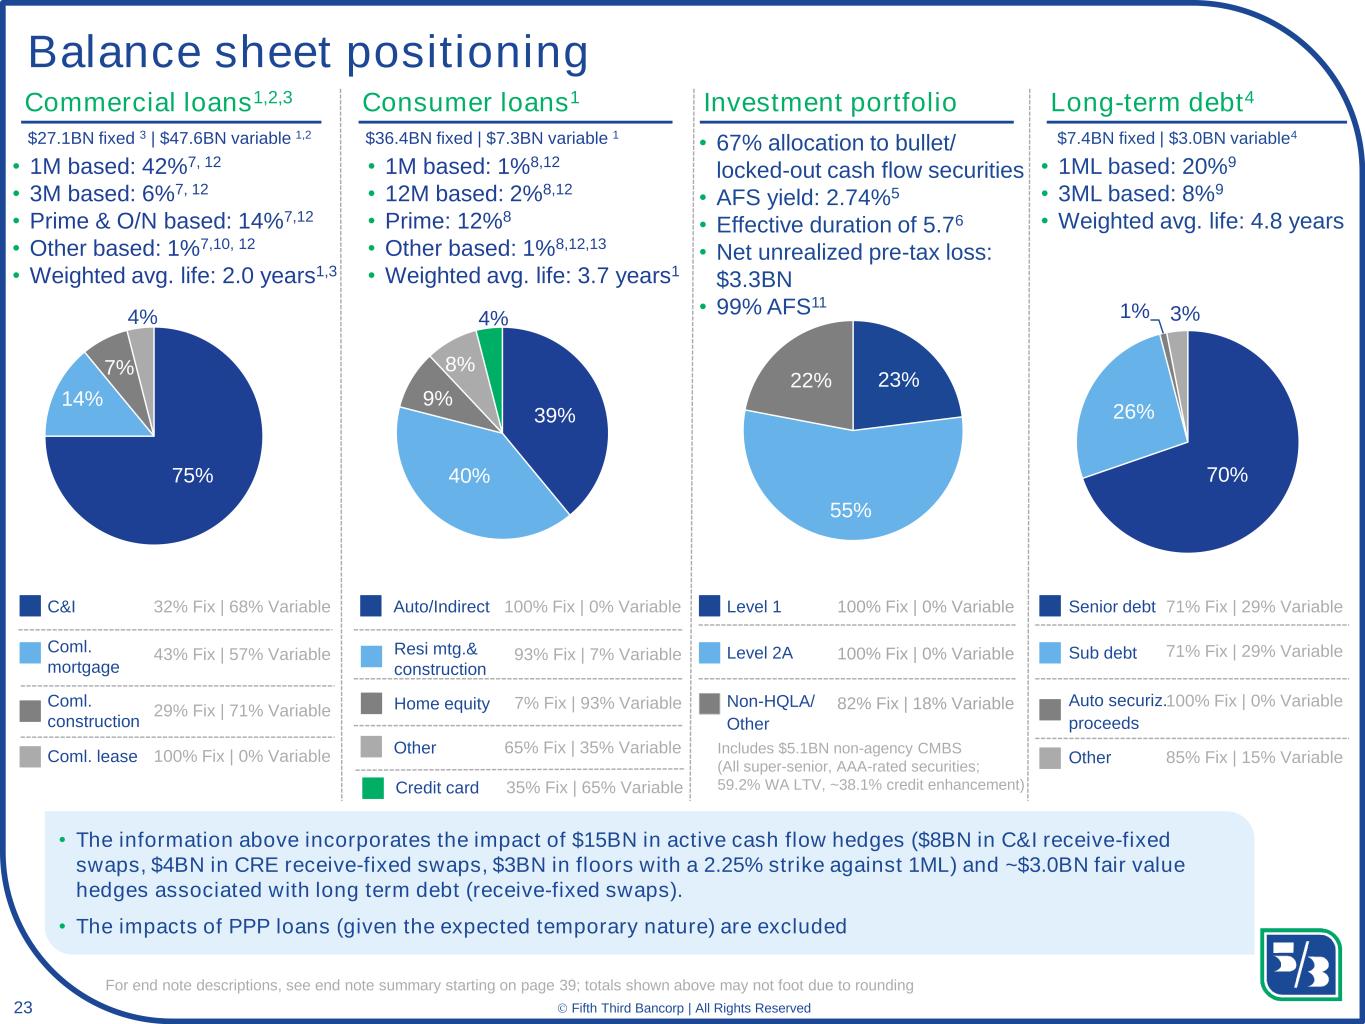
23 Classification: Internal Use© Fifth Third Banc rp | All Rights Reserved 0% 100% Fix | 0% Variable 82% Fix | 18% Variable Balance sheet positioning Investment portfolio $27.1BN fixed 3 | $47.6BN variable 1,2 Commercial loans1,2,3 Consumer loans1 Long-term debt4 $36.4BN fixed | $7.3BN variable 1 $7.4BN fixed | $3.0BN variable4 • 1M based: 42%7, 12 • 3M based: 6%7, 12 • Prime & O/N based: 14%7,12 • Other based: 1%7,10, 12 • Weighted avg. life: 2.0 years1,3 • 1M based: 1%8,12 • 12M based: 2%8,12 • Prime: 12%8 • Other based: 1%8,12,13 • Weighted avg. life: 3.7 years1 • 1ML based: 20%9 • 3ML based: 8%9 • Weighted avg. life: 4.8 years C&I 32% Fix | 68% Variable Coml. mortgage 43% Fix | 57% Variable Coml. lease 100% Fix | 0% Variable Resi mtg.& construction 93% Fix | 7% Variable Home equity 7% Fix | 93% Variable Senior debt 71% Fix | 29% Variable Sub debt 71% Fix | 29% Variable Auto securiz. proceeds 100% Fix | 0% VariableComl. construction 29% Fix | 71% Variable Credit card 35% Fix | 65% Variable Other 65% Fix | 35% Variable Other 85% Fix | 15% Variable • 67% allocation to bullet/ locked-out cash flow securities • AFS yield: 2.74%5 • Effective duration of 5.76 • Net unrealized pre-tax loss: $3.3BN • 99% AFS11 Level 1 100% Fix | 0% Variable Level 2A Non-HQLA/ Other • The information above incorporates the impact of $15BN in active cash flow hedges ($8BN in C&I receive-fixed swaps, $4BN in CRE receive-fixed swaps, $3BN in floors with a 2.25% strike against 1ML) and ~$3.0BN fair value hedges associated with long term debt (receive-fixed swaps). • The impacts of PPP loans (given the expected temporary nature) are excluded Includes $5.1BN non-agency CMBS (All super-senior, AAA-rated securities; 59.2% WA LTV, ~38.1% credit enhancement) For end note descriptions, see end note summary starting on page 39; totals shown above may not foot due to rounding Auto/Indirect 100% Fix | 0% Variable 75% 14% 7% 4% 39% 40% 9% 8% 4% 70% 26% 1% 3% 23% 55% 22%
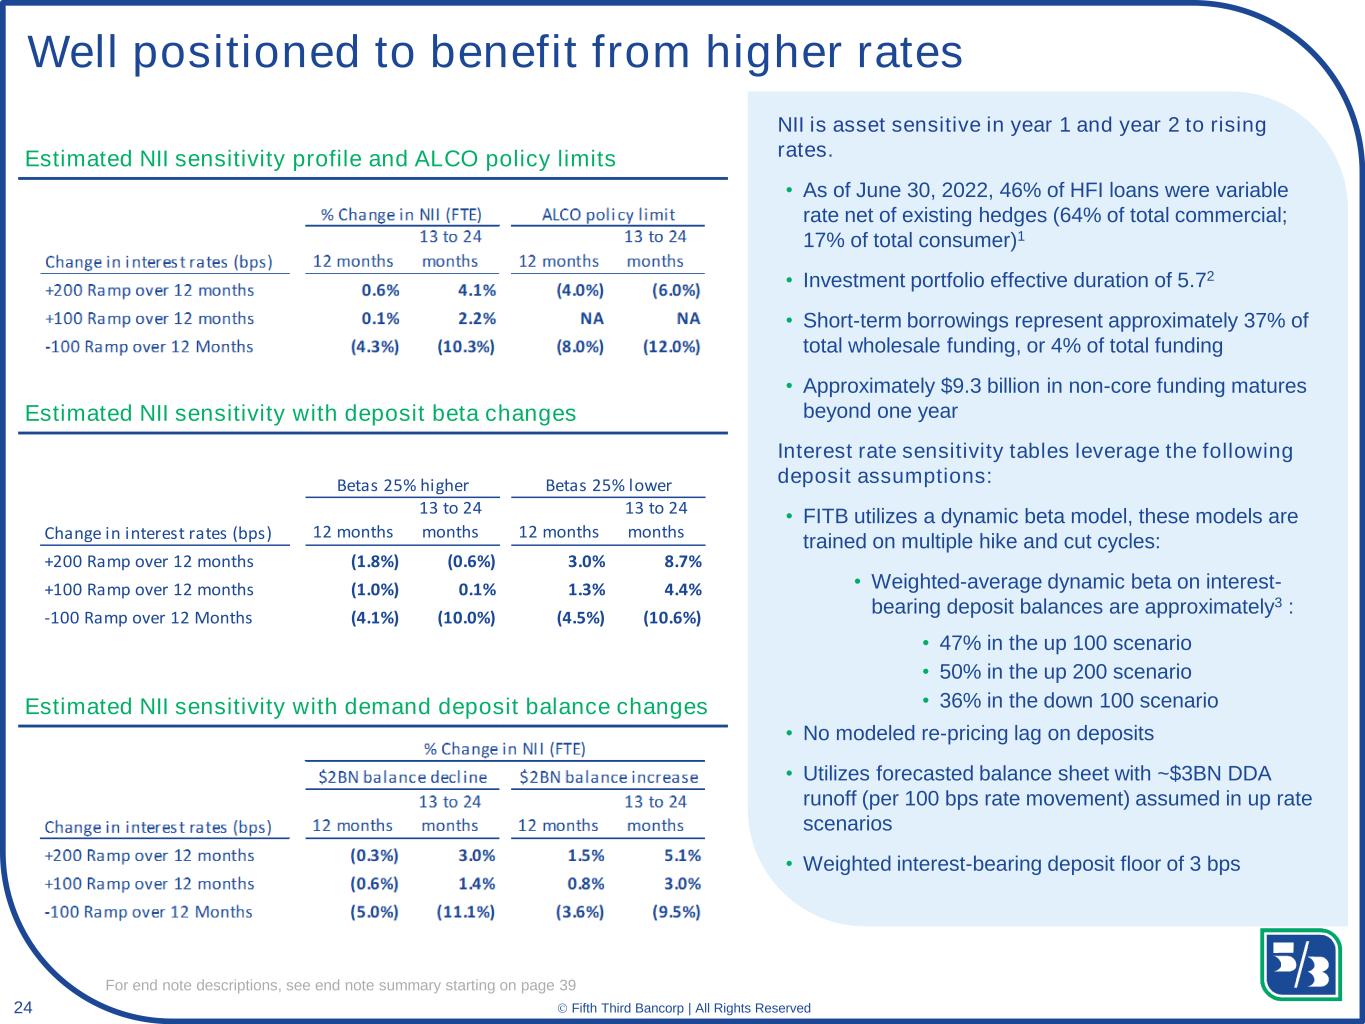
24 Classification: Internal Use© Fifth Third Banc rp | All Rights Reserved Well positioned to benefit from higher rates Estimated NII sensitivity profile and ALCO policy limits Estimated NII sensitivity with demand deposit balance changes Estimated NII sensitivity with deposit beta changes NII is asset sensitive in year 1 and year 2 to rising rates. • As of June 30, 2022, 46% of HFI loans were variable rate net of existing hedges (64% of total commercial; 17% of total consumer)1 • Investment portfolio effective duration of 5.72 • Short-term borrowings represent approximately 37% of total wholesale funding, or 4% of total funding • Approximately $9.3 billion in non-core funding matures beyond one year Interest rate sensitivity tables leverage the following deposit assumptions: • FITB utilizes a dynamic beta model, these models are trained on multiple hike and cut cycles: • Weighted-average dynamic beta on interest- bearing deposit balances are approximately3 : • 47% in the up 100 scenario • 50% in the up 200 scenario • 36% in the down 100 scenario • No modeled re-pricing lag on deposits • Utilizes forecasted balance sheet with ~$3BN DDA runoff (per 100 bps rate movement) assumed in up rate scenarios • Weighted interest-bearing deposit floor of 3 bps For end note descriptions, see end note summary starting on page 39 Betas 25% higher Betas 25% lower Change in interest rates (bps) 12 months 13 to 24 months 12 months 13 to 24 months +200 Ramp over 12 months (1.8%) (0.6%) 3.0% 8.7% +100 Ramp over 12 months (1.0%) 0.1% 1.3% 4.4% -100 Ramp over 12 Months (4.1%) (10.0%) (4.5%) (10.6%)

25 Classification: Internal Use© Fifth Third Banc rp | All Rights Reserved $10 4Q29 $12 $12 $12 $11 $11 $11 $7 $7 $6 $5 $5 $1 $1 $1 $5 $5 $6 $7 $10 $3 $3 $3 $3 $3 $3 $3 $3 $3 $3 $15 $15 $15 $15 $15 $15 $15 $15 $15 $15 $15 2Q22 3Q22 4Q22 1Q23 2Q23 3Q23 4Q23 1Q24 2Q24 3Q24 4Q24 Floors Forward starting swaps Existing swaps ($3BN @ 2.25% 1-month LIBOR strike) Cash flow hedges continue to protect NIM1 EOP notional value of cash flow hedges ($ in billions) Cash flow hedges Actual Gross receive fixed rate of swaps: • 2Q22-4Q22: 2.35% • 1Q23-3Q23: 2.37% • 4Q23-1Q24: 2.34% • 2Q24: 2.35% • 3Q24: 2.34% • 4Q24: 2.50% Added $10BN of forward starting swaps in 2Q22; swap protection extends into 2031 ($10BN at weighted average receive fixed rate of 3.03%) 2 $9 3Q30 $5 4Q30 For end note descriptions, see end note summary starting on page 39

26 Classification: Internal Use© Fifth Third Banc rp | All Rights Reserved $81 $78 $37 $25 $23 $59 $63 $67 $71 $81 ($3) $9 ($5) $9 ($19) ($73) ($64) ($64) ($53) ($54) $64 $86 $35 $52 $31 -$100 -$75 -$50 -$25 $0 $25 $50 $75 $100 $125 $150 $175 $200 $225 $250 2Q21 3Q21 4Q21 1Q22 2Q22 $3.7 $3.8 $2.7 $2.2 $3.0 $1.3 $1.2 $1.6 $1.2 $1.3 $5.0 $5.0 $4.3 $3.5 $4.3 2Q21 3Q21 4Q21 1Q22 2Q22 Gross servicing fees Mortgage banking results $ in millions Mortgage banking net revenue Mortgage originations and margins • Mortgage banking net revenue decreased $21 million from prior quarter, primary reflecting a $28 million decrease from MSR net valuation adjustment and an $10 million increase in mortgage servicing revenue • $4.3 billion in originations, up 23% from the prior quarter and down 14% compared to the year-ago quarter; ~64% purchase volume Origination fees and gains on loan sale MSR decayNet MSR Valuation Note: totals shown above may not foot due to rounding $ in billions Originations HFS Originations HFI 1.70% 1.65% 1.57% 1.68% 0.95% 1.10% 1.10% 1.18%Gain-on-sale margin Gain-on-sale margin represents gains on all loans originated for sale divided by salable originations. Rate lock margin Rate lock margin represents gains recorded associated with salable rate locks divided by salable rate locks. 0.84% 0.85%

27 Classification: Internal Use© Fifth Third Banc rp | All Rights Reserved $45 $22 $11 4Q22 4Q23 4Q24 Estimated potential GAAP noninterest income recognition1,2 Future TRA payment schedule $ in millions; pre-tax For end note descriptions, see end note summary starting on page 39

28 Classification: Internal Use© Fifth Third Banc rp | All Rights Reserved Preferred dividend schedule 3Q22 4Q22 1Q23 2Q23 Series H - ~$15 - ~$15 Series I ~$8 ~$8 ~$8 ~$8 Series J ~$5 ~$5 ~$5 ~$5 Series K ~$3 ~$3 ~$3 ~$3 Series L ~$4 ~$4 ~$4 ~$4 Class B Series A ~$3 ~$3 ~$3 ~$3 Total ~$22 ~$38 ~$22 ~$38 Upcoming preferred dividend schedule1 $ in millions Floating (3ML + 3.129%)2 For end note descriptions, see end note summary starting on page 39; totals shown above may not foot due to rounding
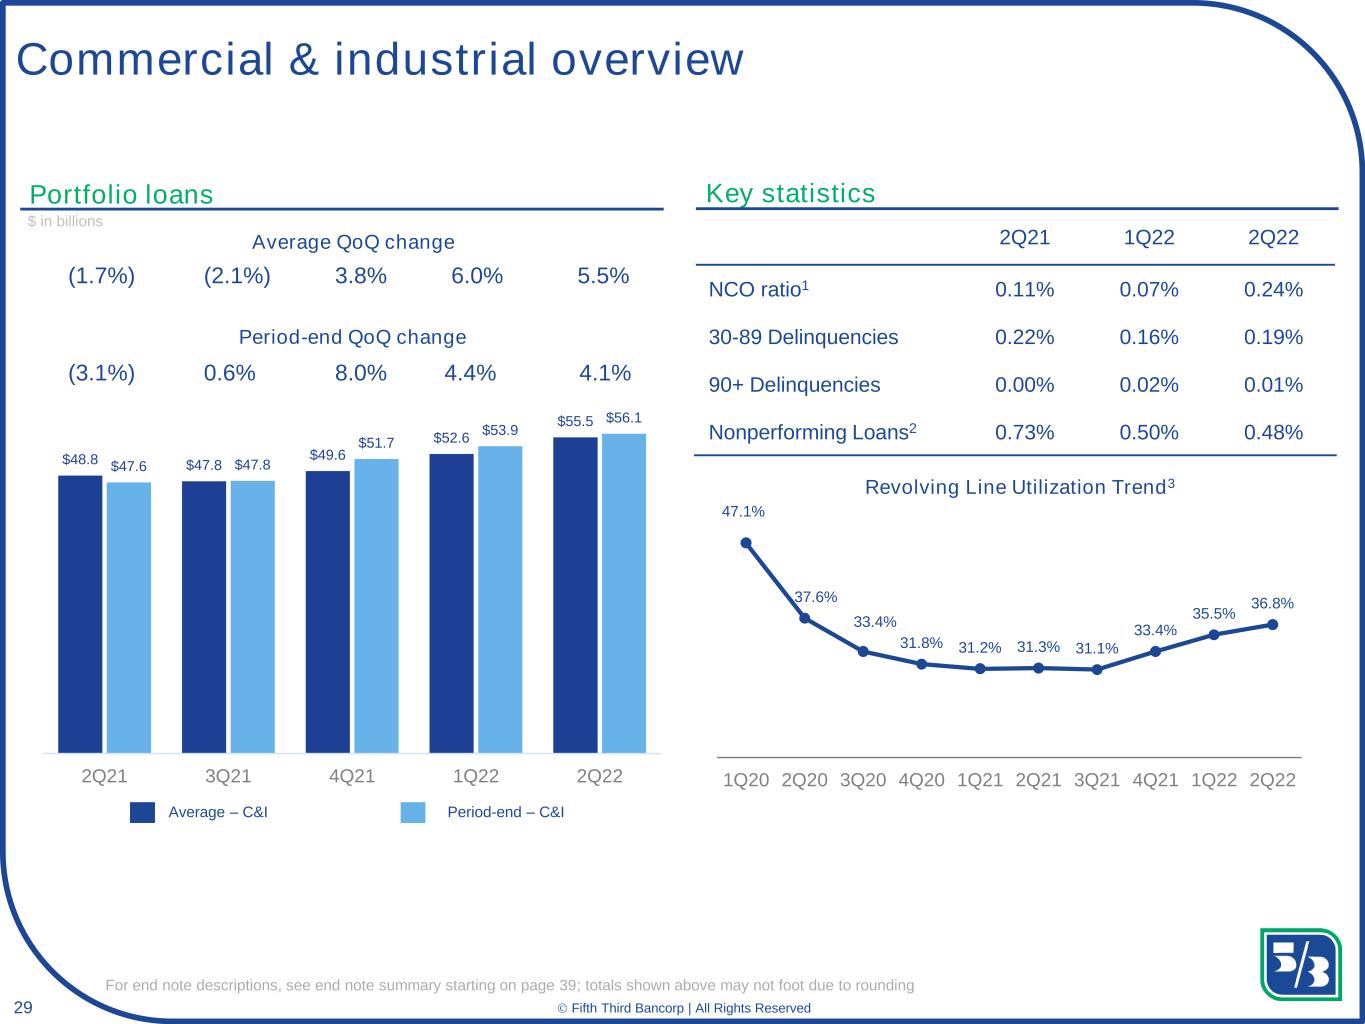
29 Classification: Internal Use© Fifth Third Banc rp | All Rights Reserved 47.1% 37.6% 33.4% 31.8% 31.2% 31.3% 31.1% 33.4% 35.5% 36.8% 1Q20 2Q20 3Q20 4Q20 1Q21 2Q21 3Q21 4Q21 1Q22 2Q22 $48.8 $47.8 $49.6 $52.6 $55.5 $47.6 $47.8 $51.7 $53.9 $56.1 0 0.2 0.4 0.6 0.8 1 1.2 $0.0 $10.0 $20.0 $30.0 $40.0 $50.0 $60.0 2Q21 3Q21 4Q21 1Q22 2Q22 Commercial & industrial overview Portfolio loans Key statistics 2Q21 1Q22 2Q22 NCO ratio1 0.11% 0.07% 0.24% 30-89 Delinquencies 0.22% 0.16% 0.19% 90+ Delinquencies 0.00% 0.02% 0.01% Nonperforming Loans2 0.73% 0.50% 0.48% $ in billions Revolving Line Utilization Trend3 (3.1%) 0.6% 8.0% 4.4% 4.1% Period-end QoQ change Average QoQ change (1.7%) (2.1%) 3.8% 6.0% 5.5% Average – C&I Period-end – C&I For end note descriptions, see end note summary starting on page 39; totals shown above may not foot due to rounding

30 Classification: Internal Use© Fifth Third Banc rp | All Rights Reserved Non-Owner Occupied 53% Owner Occupied 47% Multifamily 27% Home Builder 21% Industrial 10% Hospitality 8% Office 9% Retail 5% Other 20% $10.5 $10.3 $10.2 $10.5 $10.7 $10.3 $10.3 $10.3 $10.7 $10.7 $6.0 $5.7 $5.3 $5.4 $5.4 $5.9 $5.5 $5.2 $5.4 $5.4 $16.2 $15.8 $15.6 $16.1 $16.1 $ 6 $16.0 $15.6 $15.9 $16.1 $0.0 $2.0 $4.0 $6.0 $8.0 $10.0 $12.0 $14.0 $16.0 $18.0 $20.0 $6.0 $6.5 $7.0 $7.5 $8.0 $8.5 $9.0 $9.5 $10.0 $10.5 $11.0 2Q21 3Q21 4Q21 1Q22 2Q22 Commercial real estate overview Portfolio loans Key statistics 2Q21 1Q22 2Q22 NCO ratio1 0.15% (0.03%) 0.07% 30-89 Delinquencies 0.22% 0.12% 0.07% 90+ Delinquencies 0.02% 0.01% 0.00% Nonperforming Loans2 0.32% 0.30% 0.30% $ in billions (0.4%) (2.8%) (2.9%) 2.0% 1.1% Average QoQ change CRE Mortgage Balance by owner occupancy CRE Construction Balance by property type (2.8%) (2.8%) (1.3%) 3.6% (0.1%) Period-end QoQ change $10.5 $10.3 $10.3 $10.2 $10.3 $10.5 $10.7 $10.7 $10.7 Average – Commercial Mortgage Average – Commercial Construction Period-end – Commercial Mortgage Period-end – Commercial Construction For end note descriptions, see end note summary starting on page 39; totals shown above may not foot due to rounding $10.3

31 Classification: Internal Use© Fifth Third Banc rp | All Rights Reserved $15.9 $16.2 $16.2 $16.5 $17.4 $16.1 $16.2 $16.4 $17.1 $17.6 2Q21 3Q21 4Q21 1Q22 2Q22 2Q21 1Q22 2Q22 NCO ratio1 (0.01%) (0.02%) (0.02%) 30-89 Delinquencies 0.12% 0.09% 0.09% 90+ Delinquencies 0.35% 0.08% 0.05% Nonperforming Loans2 0.30% 0.51% 0.60% Weighted average FICO at origination3 762 767 765 Weighted average LTV at origination 73% 70% 71% Residential mortgage overview Portfolio loans $ in billions 0.5% 2.1% (0.2%) 1.9% 5.2% Average QoQ change 4% 13% 15% 68% Key statistics Portfolio FICO score at origination3 750+720-749<660 660-719 2.3% 0.2% 1.5% 4.6% 2.5% Period-end QoQ change Average Period-end For end note descriptions, see end note summary starting on page 39; totals shown above may not foot due to rounding

32 Classification: Internal Use© Fifth Third Banc rp | All Rights Reserved $4.7 $4.4 $4.2 $4.0 $3.9 $4.5 $4.3 $4.1 $3.9 $3.9 2Q21 3Q21 4Q21 1Q22 2Q22 2% 17% 16% 65% Home equity overview Portfolio loans Key statistics 2Q21 1Q22 2Q22 NCO ratio1 (0.09%) (0.07%) (0.06%) 30-89 Delinquencies 0.44% 0.64% 0.56% 90+ Delinquencies 0.02% 0.03% 0.05% Nonperforming Loans2 1.87% 1.97% 1.84% Weighted average FICO at origination3 762 764 765 Weighted average LTV at origination 69% 68% 68% $ in billions Portfolio FICO score at origination3 (6.7%) (5.7%) (5.2%) (4.1%) (2.8%) Average QoQ change (5.6%) (5.9%) (4.5%) (4.1%) (0.3%) Period-end QoQ change Average Period-end 750+720-749<660 660-719 For end note descriptions, see end note summary starting on page 39; totals shown above may not foot due to rounding

33 Classification: Internal Use© Fifth Third Banc rp | All Rights Reserved $14.7 $15.6 $16.3 $17.1 $17.2 $15.2 $16.0 $16.8 $17.4 $17.0 2Q21 3Q21 4Q21 1Q22 2Q22 Indirect secured consumer overview Portfolio loans $ in billions 5.4% 6.0% 4.8% 4.8% 0.6% Average QoQ change 1% 22% 17% 60% 2Q21 1Q22 2Q22 NCO ratio1 0.01% 0.17% 0.13% 30-89 Delinquencies 0.45% 0.62% 0.59% 90+ Delinquencies 0.03% 0.05% 0.05% Nonperforming Loans2 0.32% 0.13% 0.11% Weighted average FICO at origination 764 768 767 Weighted average LTV at origination 89% 88% 88% Portfolio FICO score at origination 750+720-749<660 660-719 88% 12% Auto Specialty Lending Includes primarily RV & Marine Portfolio mix Key statistics 6.0% 5.3% 4.9% 3.8% (2.3%) Period-end QoQ change Average Period-end For end note descriptions, see end note summary starting on page 39; totals shown above may not foot due to rounding

34 Classification: Internal Use© Fifth Third Banc rp | All Rights Reserved $1.8 $1.7 $1.7 $1.7 $1.7 $1.8 $1.7 $1.8 $1.7 $1.8 2Q21 3Q21 4Q21 1Q22 2Q22 Credit card overview Portfolio loans $ in billions (5.8%) (1.2%) (0.5%) (2.8%) 0.8% Average QoQ change 4% 29% 20% 47% Key statistics 2Q21 1Q22 2Q22 NCO ratio1 4.52% 3.13% 3.26% 30-89 Delinquencies 0.84% 1.01% 0.96% 90+ Delinquencies 0.78% 0.83% 0.74% Nonperforming Loans2 1.51% 1.36% 1.30% Weighted average FICO at origination3 739 741 742 Portfolio FICO score at origination3 750+720-749<660 660-719 (0.9%) (2.7%) 1.3% (4.3%) 4.3% Period-end QoQ change Average Period-End For end note descriptions, see end note summary starting on page 39; totals shown above may not foot due to rounding
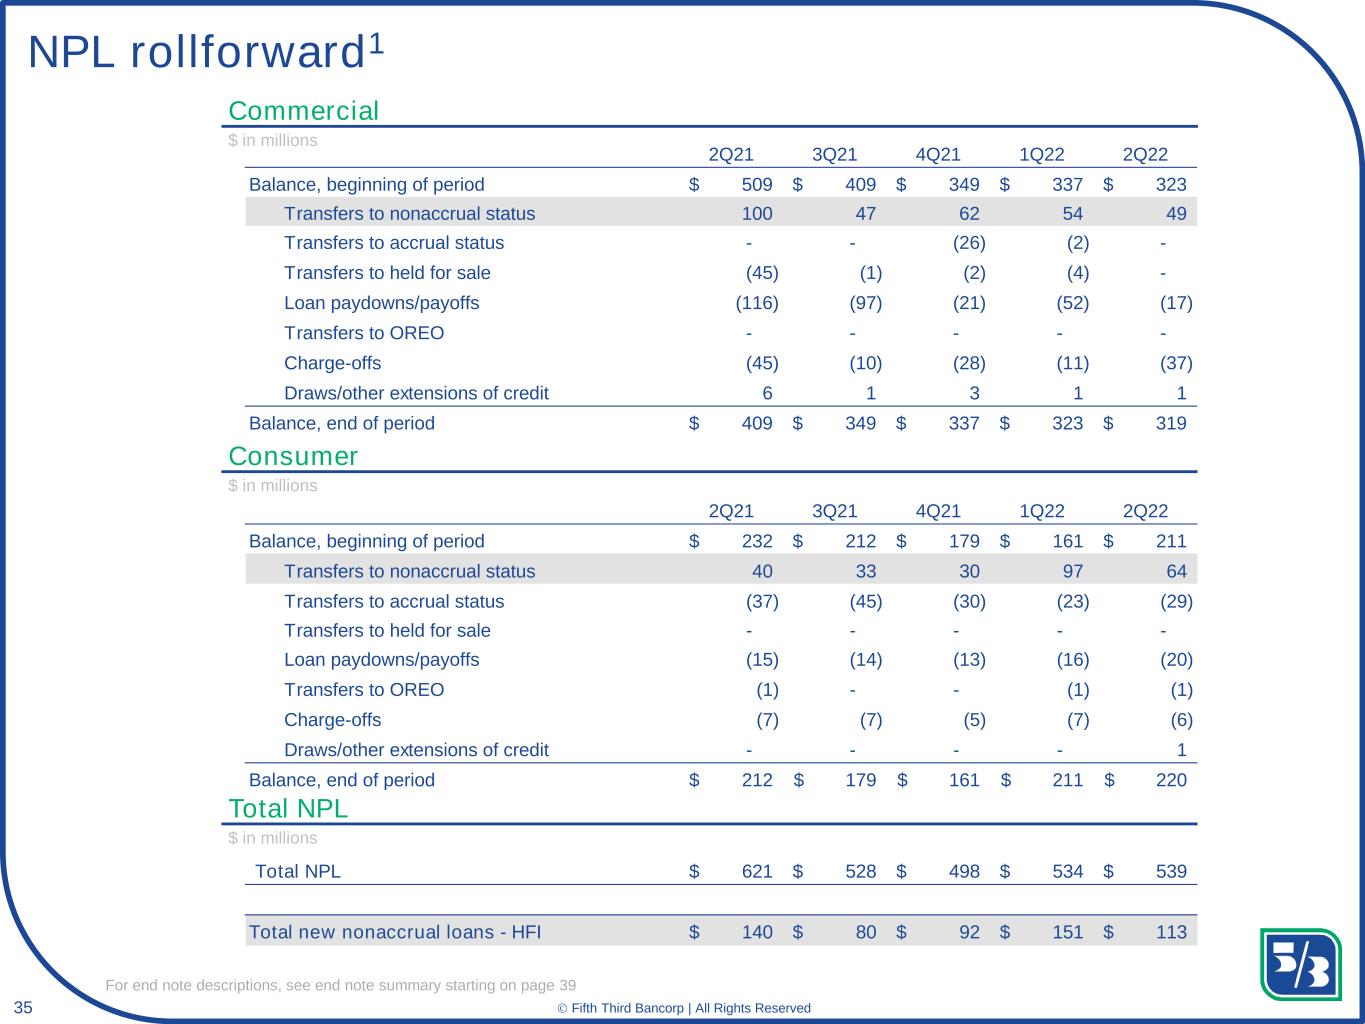
35 Classification: Internal Use© Fifth Third Banc rp | All Rights Reserved 2Q21 3Q21 4Q21 1Q22 2Q22 509$ 409$ 349$ 337$ 323$ Transfers to nonaccrual status 100 47 62 54 49 Transfers to accrual status - - (26) (2) - Transfers to held for sale (45) (1) (2) (4) - Loan paydowns/payoffs (116) (97) (21) (52) (17) Transfers to OREO - - - - - Charge-offs (45) (10) (28) (11) (37) Draws/other extensions of credit 6 1 3 1 1 409$ 349$ 337$ 323$ 319$ Balance, beginning of period Balance, end of period NPL rollforward1 Commercial Consumer Total NPL $ in millions $ in millions $ in millions For end note descriptions, see end note summary starting on page 39 2Q21 3Q21 4Q21 1Q22 2Q22 232$ 212$ 179$ 161$ 211$ Transfers to nonaccrual status 40 33 30 97 64 Transfers to accrual status (37) (45) (30) (23) (29) Transfers to held for sale - - - - - Loan paydowns/payoffs (15) (14) (13) (16) (20) Transfers to OREO (1) - - (1) (1) Charge-offs (7) (7) (5) (7) (6) Draws/other extensions of credit - - - - 1 212$ 179$ 161$ 211$ 220$ Balance, beginning of period Balance, end of period Total NPL 621$ 528$ 498$ 534$ 539$ Total new nonaccrual loans - HFI 140$ 80$ 92$ 151$ 113$

36 Classification: Internal Use© Fifth Third Banc rp | All Rights Reserved 2Q22 adjustments and notable items Adjusted EPS of $0.791 2Q22 reported EPS of $0.76 included a negative $0.03 impact from the following notable items: • $18 million pre-tax (~$14 million after-tax2) charge related to the valuation of the Visa total return swap • $6 million pre-tax (~$5 million after-tax2) charge related to business disposition charges For end note descriptions, see end note summary starting on page 39

37 Classification: Internal Use© Fifth Third Banc rp | All Rights Reserved Non-GAAP reconciliation For end note descriptions, see end note summary starting on page 39; totals shown above may not foot due to rounding Fifth Third Bancorp and Subsidiaries $ and shares in millions June March December September June (unaudited) 2022 2022 2021 2021 2021 Net income (U.S. GAAP) (a) $562 $494 $662 $704 $709 Net income (U.S. GAAP) (annualized) (b) $2,254 $2,003 $2,626 $2,793 $2,844 Net income available to common shareholders (U.S. GAAP) (c) $526 $474 $627 $684 $674 Add: Intangible amortization, net of tax 9 9 9 9 8 Tangible net income available to common shareholders (d) $535 $483 $636 $693 $682 Tangible net income available to common shareholders (annualized) (e) $2,146 $1,959 $2,523 $2,749 $2,735 Net income available to common shareholders (annualized) (f) $2,110 $1,922 $2,488 $2,714 $2,703 Average Bancorp shareholders' equity (U.S. GAAP) (g) $19,248 $21,402 $22,449 $22,927 $22,927 Less: Average preferred stock (h) (2,116) (2,116) (2,116) (2,116) (2,116) Average goodwill (4,744) (4,514) (4,514) (4,430) (4,259) Average intangible assets and other servicing rights (158) (150) (162) (149) (122) Average tangible common equity (i) $12,230 $14,622 $15,657 $16,232 $16,430 Less: Average accumulated other comprehensive income ("AOCI") 2,397 (129) (1,382) (1,980) (1,968) Average tangible common equity, excluding AOCI (j) $14,627 $14,493 $14,275 $14,252 $14,462 Adjustments (pre-tax items) Valuation of Visa total return swap 18 11 19 17 37 Fifth Third Foundation contribution - - - 15 - Net business acquisition and disposition charges/(gain) 6 - - (60) - Special COVID staffing bonus to front-line employees - - 10 - - Adjustments - after-tax 1 (k) 19 8 22 (21) 28 Adjusted net income [(a) + (k)] $581 $502 $684 $683 $737 Adjusted net income (annualized) (l) $2,330 $2,036 $2,714 $2,710 $2,956 Adjusted net income available to common shareholders [(c) + (k)] $545 $482 $649 $663 $702 Adjusted net income available to common shareholders (annualized) (m) $2,186 $1,955 $2,575 $2,630 $2,816 Adjusted tangible net income available to common shareholders [(d) + (k)] $554 $491 $658 $672 $710 Adjusted tangible net income available to common shareholders (annualized) (n) $2,222 $1,991 $2,611 $2,666 $2,848 Average assets (o) $205,897 $209,150 $209,604 $205,449 $206,353 Metrics: Return on assets (b) / (o) 1.09% 0.96% 1.25% 1.36% 1.38% Adjusted return on assets (l) / (o) 1.13% 0.97% 1.29% 1.32% 1.43% Return on average common equity (f) / [(g) + (h)] 12.3% 10.0% 12.2% 13.0% 13.0% Adjusted return on average common equity (m) / [(g) + (h)] 12.8% 10.1% 12.7% 12.6% 13.5% Return on average tangible common equity (e) / (i) 17.5% 13.4% 16.1% 16.9% 16.6% Adjusted return on average tangible common equity (n) / (i) 18.2% 13.6% 16.7% 16.4% 17.3% Adjusted return on average tangible common equity, excluding AOCI (n) / (j) 15.2% 13.7% 18.3% 18.7% 19.7% For the Three Months Ended

38 Classification: Internal Use© Fifth Third Banc rp | All Rights Reserved Fifth Third Bancorp and Subsidiaries For the Three Months Ended $ and shares in millions June March December September June (unaudited) 2022 2022 2021 2021 2021 Average interest-earning assets (a) $184,406 $187,894 $187,045 $182,801 $184,918 Net interest income (U.S. GAAP) (b) $1,339 $1,195 $1,197 $1,189 $1,208 Add:Taxable equivalent adjustment 3 3 3 3 3 Net interest income (FTE) (c) $1,342 $1,198 $1,200 $1,192 $1,211 Net interest income (FTE) (annualized) (d) $5,383 $4,859 $4,761 $4,729 $4,857 Noninterest income (U.S. GAAP) (e) $676 $684 $791 $836 $741 Valuation of Visa total return swap 18 11 19 17 37 Net disposition charges/(gain) 6 - - (60) - Adjusted noninterest income (f) $700 $695 $810 $793 $778 Add:Securities (gains)/losses 32 14 19 1 (10) Adjusted noninterest income, (excl. securities (gains)/losses) $732 $709 $829 $794 $768 Noninterest expense (U.S. GAAP) (g) $1,112 $1,222 $1,206 $1,172 $1,153 Fifth Third Foundation contribution - - - (15) - Special COVID staffing bonus to front-line employees - - (10) - - Adjusted noninterest expense (h) $1,112 $1,222 $1,196 $1,157 $1,153 Metrics: Revenue (FTE) (c) + (e) 2,018 1,882 1,991 2,028 1,952 Adjusted revenue (c) + (f) 2,042 1,893 2,010 1,985 1,989 Pre-provision net revenue [(c) + (e) - (g)] 906 660 785 856 799 Adjusted pre-provision net revenue [(c) + (f) - (h)] 930 671 814 828 836 Net interest margin (FTE) (d) / (a) 2.92% 2.59% 2.55% 2.59% 2.63% Efficiency ratio (FTE) (g) / [(c) + (e)] 55.1% 64.9% 60.6% 57.8% 59.1% Adjusted efficiency ratio (h) / [(c) + (f)] 54.5% 64.6% 59.5% 58.3% 58.0% Non-GAAP reconciliation For end note descriptions, see end note summary starting on page 39; totals shown above may not foot due to rounding
39 Classification: Internal Use© Fifth Third Banc rp | All Rights Reserved Earnings presentation end notes Slide 3 end notes 1. Reported ROTCE, NIM, pre-provision net revenue, and efficiency ratio are non-GAAP measures: all adjusted figures are non-GAAP measures; see reconciliation on pages 37 and 38 of this presentation and the use of non-GAAP measures on pages 27-29 of the earnings release. 2. Current period regulatory capital ratios are estimated. Slide 4 end notes 1. Results are on a fully-taxable equivalent basis; non-GAAP measure: see reconciliation on pages 37 and 38 of this presentation and use of non-GAAP measures on pages 27-29 of the earnings release. Slide 5 end notes 1. Non-GAAP measure: see reconciliation on pages 37 and 38 of this presentation and use of non-GAAP measures on pages 27-29 of the earnings release. Slide 6 end notes 1. Non-GAAP measure: see reconciliation on pages 37 and 38 of this presentation and use of non-GAAP measures on pages 27-29 of the earnings release. Slide 7 end notes 1. Includes taxable and tax-exempt securities. Slide 9 end notes 1. Excludes HFS loans. Slide 10 end notes 1. 2Q22 commercial and consumer portfolio make up $138 and $50M, respectively, of the total reserve for unfunded commitment. Slide 11 end notes 1. Current period regulatory capital ratios are estimated. 2. See forward-looking statements on page 2 of this presentation regarding forward-looking non-GAAP measures and use of non-GAAP measures on pages 27-29 of the earnings release. Slide 13 end notes 1. Non-GAAP measure: see forward-looking statements on page 2 of this presentation regarding forward-looking non-GAAP measures and use of non-GAAP measures on pages 27-29 of the earnings release. Slide 14 end notes 1. Non-GAAP measure: see forward-looking statements on page 2 of this presentation regarding forward-looking non-GAAP measures and use of non-GAAP measures on pages 27-29 of the earnings release. Slide 17 end notes Data is for fiscal year 2021, unless otherwise noted. 1. 9/23/2020 - 3/31/2022. 2. As of 7/5/2022 and in terms of ethnicity or gender. 3. Since 2004 Slide 18 end notes 1. Peer group comprises of Fifth Third’s board approved peers. 2. From leading third-party ESG data provider.

40 Classification: Internal Use© Fifth Third Banc rp | All Rights Reserved Earnings presentation end notes Slide 20 end notes 1. See forward-looking statements on page 2 of this presentation regarding forward-looking non-GAAP measures and use of non-GAAP measures on pages 27-29 of the earnings release. Slide 21 end notes 1. See forward-looking statements on page 2 of this presentation regarding forward-looking non-GAAP measures and use of non-GAAP measures on pages 27-29 of the earnings release. Slide 22 end notes 1. See forward-looking statements on page 2 of this presentation regarding forward-looking non-GAAP measures and use of non-GAAP measures on pages 27-29 of the earnings release. Slide 23 end notes Note: Data as of 6/30/22. 1. Excludes HFS Loans & Leases. 2. Fifth Third had $15B of commercial variable loans classified as fixed given the impacts of $3BN in floors with a 2.25% 1ML strike, $8BN in C&I receive-fix swaps, and $4BN in CRE receive-fix swaps; Excludes forward starting swaps & floors 3. Excludes ~$0.4BN in Small Business Administration Paycheck Protection Program (PPP) loans. 4. Fifth Third had $705MM 3ML receive-fix swaps and $2.25BN 1ML receive-fix swaps outstanding against long-term debt, which are being included in floating long-term debt. 5. Yield of the 2Q22 weighted average taxable and non-taxable (tax equivalent) available for sale portfolio. 6. Effective duration taxable and non-taxable available for sale portfolio. 7. As a percent of total commercial, excluding PPP loans. 8. As a percent of total consumer. 9. As a percent of par. 10. Includes 12M term, 6M term, and Fed Funds based loans. 11. Excludes equity securities. 12. Term points include LIBOR, SOFR, BSBY, AMERIBOR, Treasuries & FX curves 13. Includes overnight term, 3M term, 6M term, 12M term and Fed Funds Slide 24 end notes Note: Data as of 06/30/22; actual results may vary from these simulated results due to differences between forecasted and actual balance sheet composition, timing, magnitude, and frequency of interest rate changes, as well as other changes in market conditions and management strategies. 1. Excludes ~$0.4BN in Small Business Administration Paycheck Protection Program (PPP) loans. 2. Effective duration taxable and non-taxable available for sale portfolio. 3. Re-pricing percentage or “beta” is the estimated change in yield after the 12-month ramp scenarios are fully realized and therefore reflects year-2 Slide 25 end notes 1. Represents forward looking statement, please refer to page 2 of this presentation regarding forward-looking non-GAAP measures; All swaps are receive fixed / pay 1-month LIBOR. 2. $3BN floors mature on 12/16/2024. Slide 27 end notes 1. Assumes FIS will have sufficient taxable income to utilize TRA related deductions and have a marginal tax rate of 25%. 2. See forward-looking statements on page 2. Slide 28 end notes 1. Represents forward looking statement, please refer to page 2 of this presentation regarding forward-looking non-GAAP measures 2. Estimates assume forward curve for LIBOR as of 7/1/22.

41 Classification: Internal Use© Fifth Third Banc rp | All Rights Reserved Earnings presentation end notes Slide 29 end notes 1. Net losses charged-off as a percent of average portfolio loans and leases presented on an annualized basis. 2. Nonperforming portfolio loans and leases as a percent of portfolio loans and leases. 3. Total commercial portfolio line utilization. Slide 30 end notes 1. Net losses charged-off as a percent of average portfolio loans and leases presented on an annualized basis. 2. Nonperforming portfolio loans and leases as a percent of portfolio loans and leases. Slide 31 end notes 1. Net losses charged-off as a percent of average portfolio loans and leases presented on an annualized basis. 2. Nonperforming portfolio loans and leases as a percent of portfolio loans and leases. 3. FICO distributions at origination exclude certain acquired mortgage loans. Slide 32 end notes 1. Net losses charged-off as a percent of average portfolio loans and leases presented on an annualized basis. 2. Nonperforming portfolio loans and leases as a percent of portfolio loans and leases. 3. FICO distributions at origination exclude certain acquired home equity loans. Slide 33 end notes 1. Net losses charged-off as a percent of average portfolio loans and leases presented on an annualized basis. 2. Nonperforming portfolio loans and leases as a percent of portfolio loans and leases. Slide 34 end notes 1. Net losses charged-off as a percent of average portfolio loans and leases presented on an annualized basis. 2. Nonperforming portfolio loans and leases as a percent of portfolio loans and leases. 3. FICO distributions at origination exclude ~$80 million from credit loans on book primarily ~15+ years. Slide 35 end notes 1. Loan balances exclude nonaccrual loans HFS. Slide 36 end notes 1. Average diluted common shares outstanding (thousands); 694,805; all adjusted figures are non-GAAP measures; see reconciliation on pages 37 and 38 of this presentation and the use of non-GAAP measures on pages 27-29 of the earnings release. 2. Assumes a 23% tax rate. Slide 37 end notes Note: See pages 27-29 of the earnings release for a discussion on the use of non-GAAP financial measures. 1. Assumes a 23% tax rate. Slide 38 end notes Note: See pages 27-29 of the earnings release for a discussion on the use of non-GAAP financial measures.