Operator
Good day, and welcome to the Hope Bank Corp. 2025 Fourth Quarter Earnings Conference Call. All participants will be in listen-only mode. Should you need assistance, please signal a conference specialist by pressing star, then zero on your telephone keypad. After today's presentation, there will be an opportunity to ask questions. To ask a question, you may press star, then one on your telephone keypad. To withdraw your question, please press star then 2. Please note this event is being recorded. I would now like to turn the conference over to Maxime Olivan, Senior Strategic Finance Manager. Please go ahead.
Thank you, Drew. Good morning, everyone, and thank you for joining us for the whole Bancorp Investor conference call for the fourth quarter of 2025. As usual, we will be using a slide presentation to accompany our discussion this morning, which is available on the presentations page of our investor relations website. Beginning on slide two, let me start with a brief statement regarding forward-looking remarks. The call today contains forward-looking projections regarding the future financial performance for the company and future events. Forward-looking statements are not guarantees of future performance. Actual outcomes and results may differ materially. Hope Bancorp assumes no obligation to revise any forward-looking projections that may be made on today's call. In addition, some of the information referenced during this call today includes non-GAAP financial measures. For a more detailed description of the risk factors and a reconciliation of GAAP to non-GAAP financial measures please refer to the company's filings with the SEC as well as the safe harbor statements in our press release issued this morning now we have allotted one hour for this call presenting from management today will be kevin kent hope bankroll chairman president and ceo and juliana beliska our chief financial officer pito co our chief operating officer is also here with us as usual and will be available for the Q&A session. With that, let me turn the call over to Kevin Kinney.
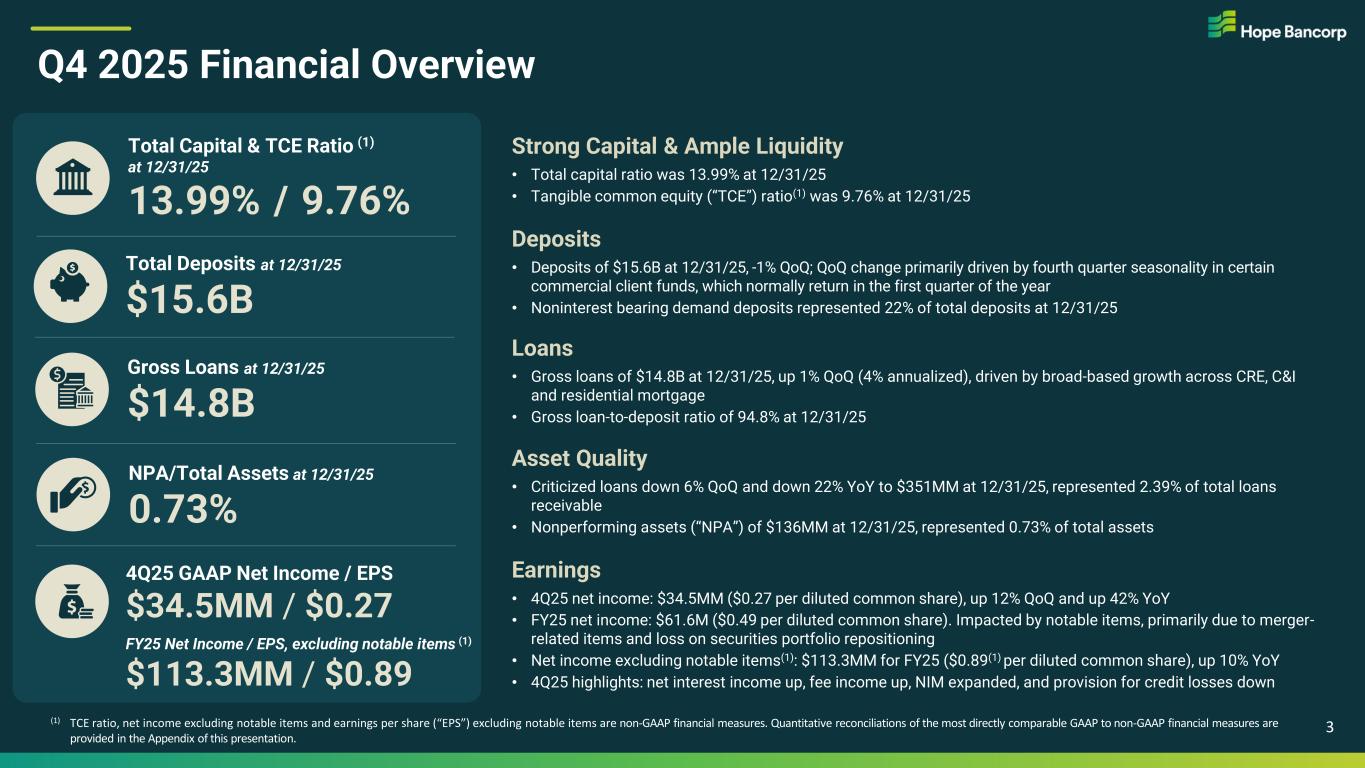
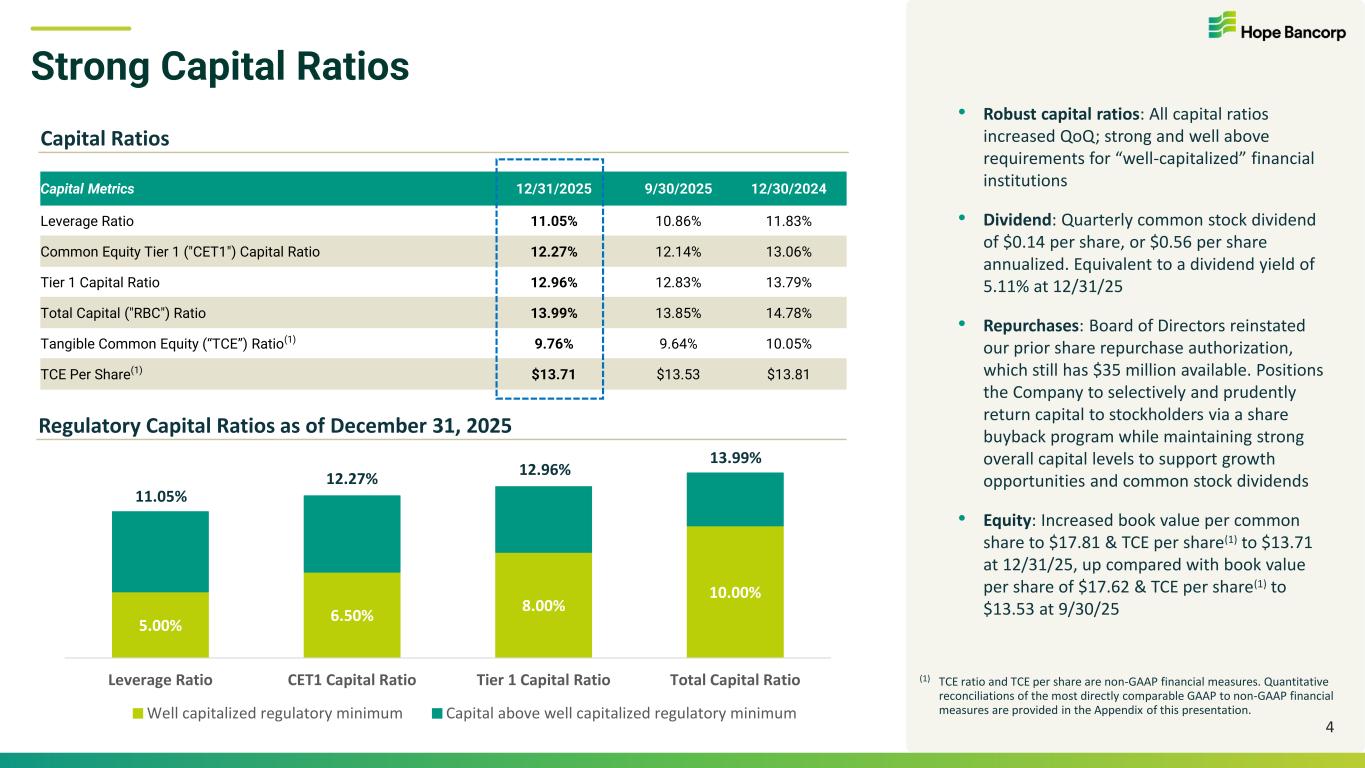
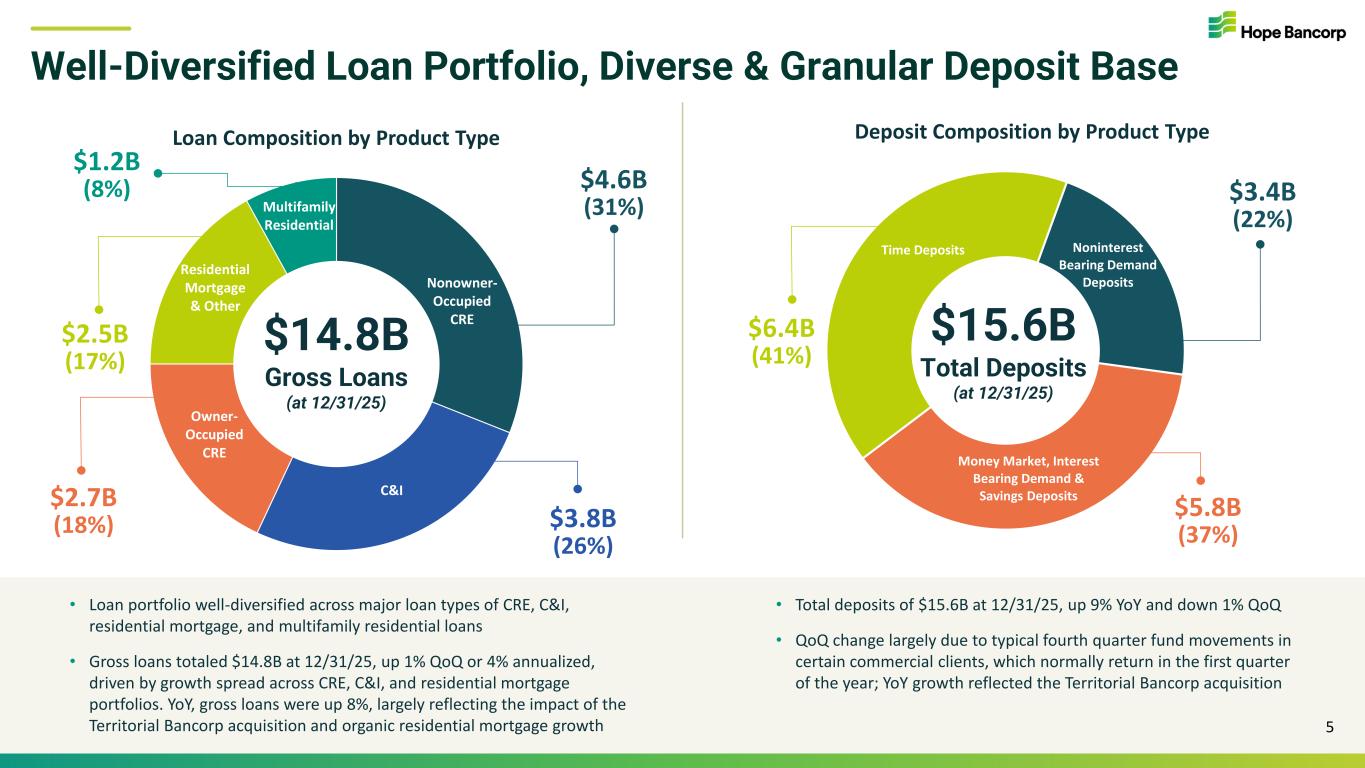
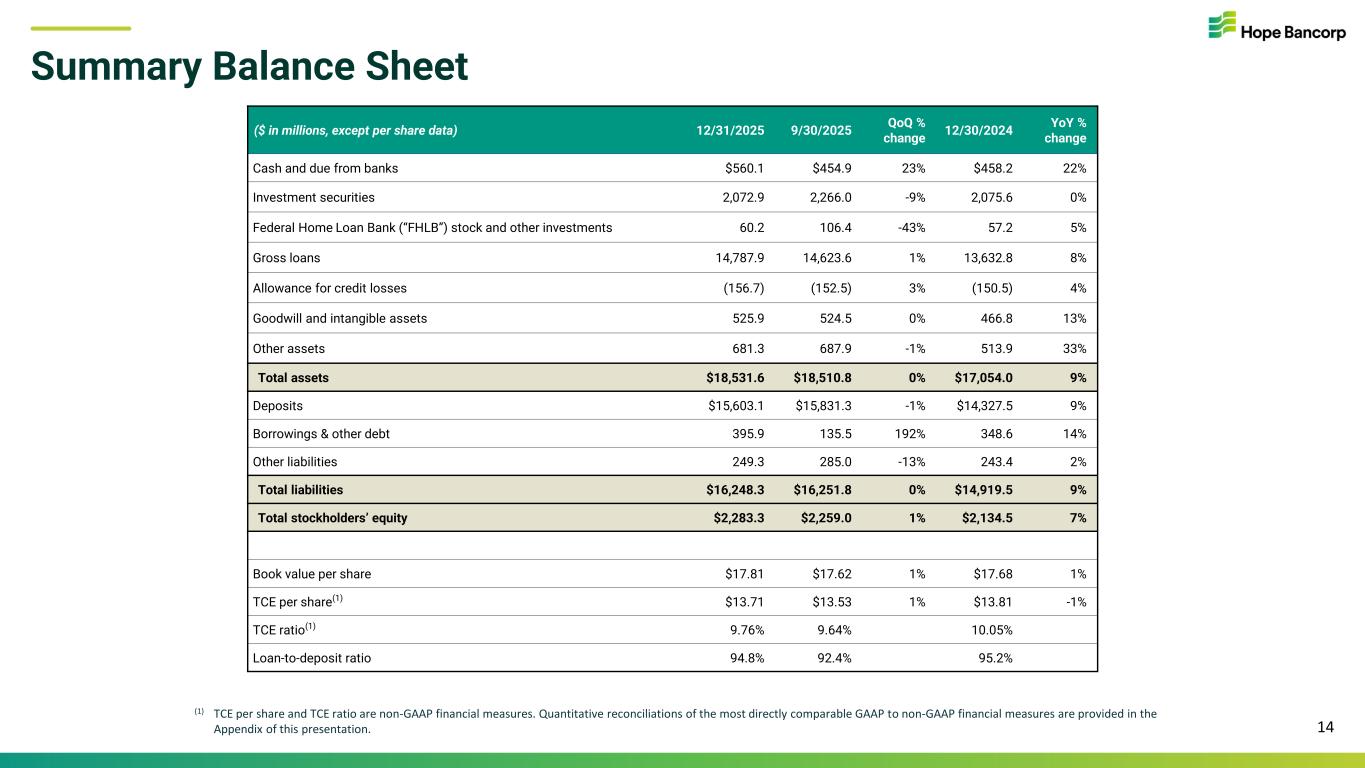
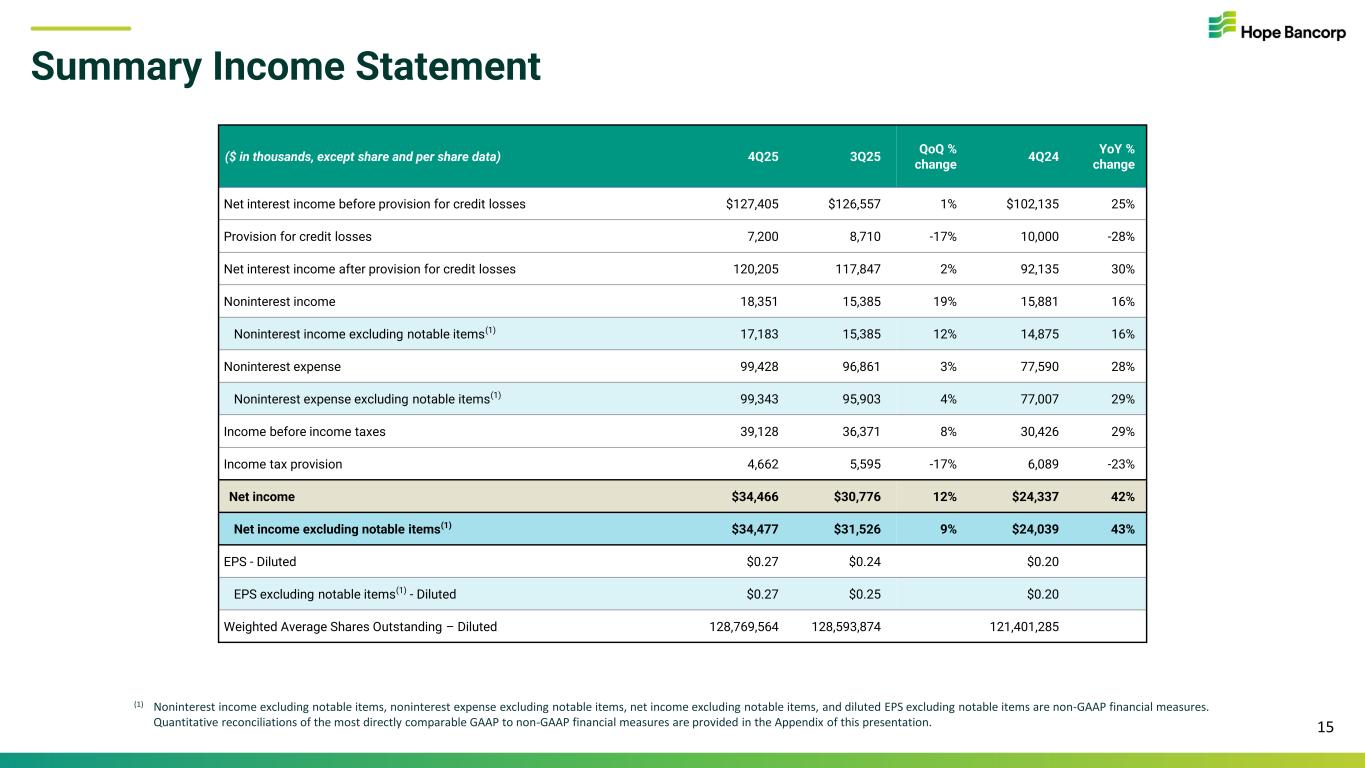
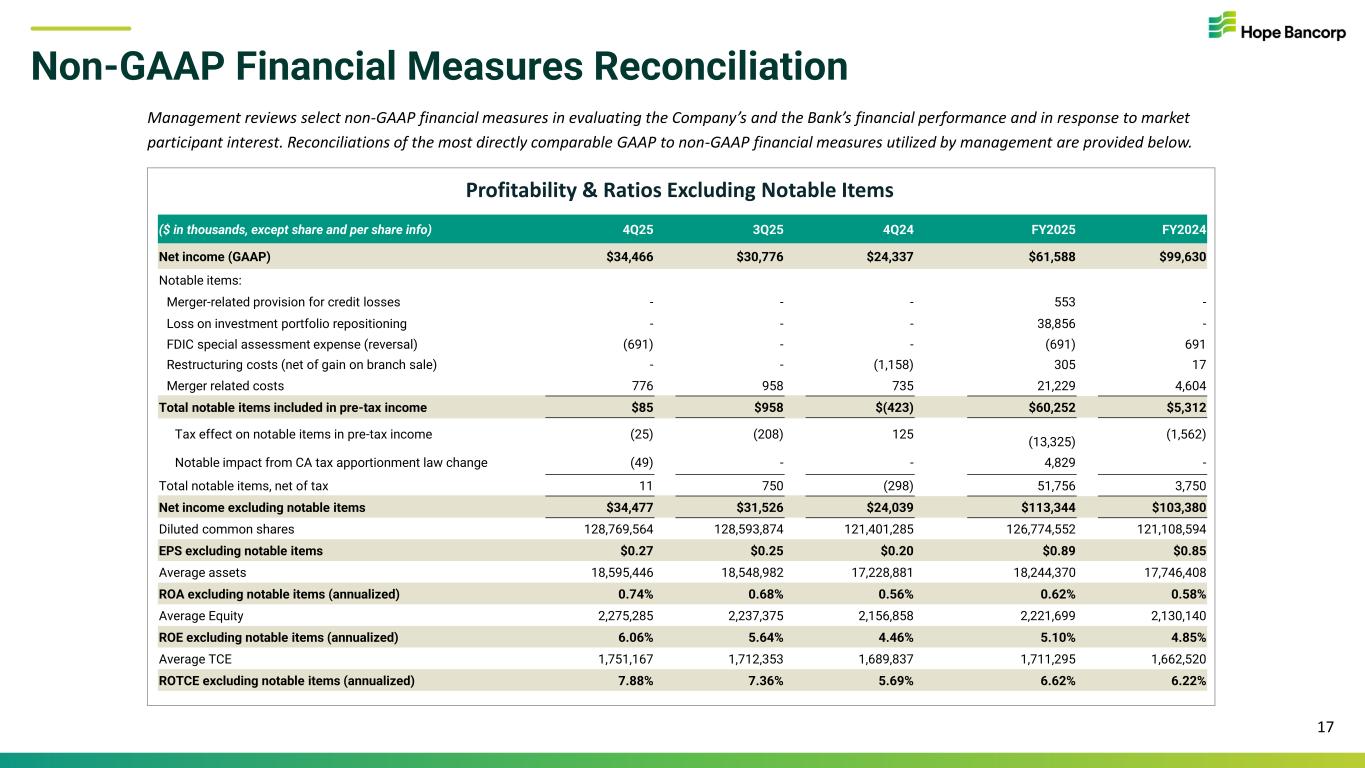
Thank you, Maxim. Good morning, everyone, and thank you for joining us today. I'm very pleased to report that we ended 2025 on a positive note with strong earnings growth in the fourth quarter. Beginning with slide three, you will find a brief overview of our results. Net income for the fourth quarter of 2025 totaled $34 million, up 42% year-over-year, from $24 million in the year-ago fourth quarter. Quarter-over-quarter, net income rose 12% from $31 million in the third quarter, driven by growth in net interest income, strength in customer fee income, lower provision for credit losses and a lower tax expense partially offset by higher operating expense looking back at the year as a whole we significantly lowered our cost of deposits reduced our reliance on broker deposits enhanced our earning assets mix added experienced senior leadership and talent to to support our revenue generating capabilities and strengthened our asset quality with a steady decrease in criticized loans in each quarter of 2025. We also expanded our banking footprint to the strategically attractive market of Hawaii via the Territorial Bank of Acquisition, which closed in April 2025. In sum, we were able to optimize our balance sheet and meaningfully improve our underlying core profitability metrics. As we look ahead, we are excited about the opportunities in 2026 and believe we are well positioned to continue making progress towards our medium-term financial goals. I want to express my sincere appreciation for the dedication of our colleagues at Bank of Hope. Their steadfast commitment to excellence has propelled our organization forward and strengthened our position as the leading regional bank serving multicultural communities across the continental United States and Hawaii. As we navigate the path ahead, I am confident that our collective focus and hard work will drive even greater positive outcomes in the years to come. Moving on to slide four, all our capital ratios increased quarter of a quarter and remain well above the requirements for well-capitalized financial institutions. Our board of directors declared a quarterly common stock dividend of 14 cents per share, payable on or around February 20th to stockholders of record as of February 6th, 2026. Our board of directors also reinstated our prior share purchase authorization, which still has $35 million available. Our healthy capital ratios position us to selectively and prudently return capital to shareholders via a share buyback program, while maintaining strong overall capital levels to support growth opportunities and common stock dividends. Continuing to slide five, at December 31st, 2025, gross loans totaled $14.8 billion, up 1% quarter of a quarter, the equivalent to 4% annualized, driven by broad-based growth across commercial real estate, residential mortgage, and commercial and industrial loans. Year-over-year, gross loans are up 8 percent, largely reflecting the impact of the territorial acquisition and organic residential mortgage growth. Loan production momentum has improved throughout 2025, with fourth quarter 2025 production volumes up 39 percent relative to the year-over-quarter. At December 31st, 2025, deposits totaled $15.6 billion, up 9% year-over-year, primarily due to the territorial acquisition, and down 1% from September 30th, largely due to typical fourth-quarter fund movements in certain commercial clients, which normally return in the first quarter of the year. Our strategy is centered on building a durable deposit base by expanding primary customer relationships and improving funding efficiency through thoughtful mixed management and pricing discipline. In 2025, we continue to reduce our reliance on broker deposits, which declined 15% year over year. Overall, we are pleased with the progress we are making in strengthening the organization. Our continued investments in people and capabilities are reinforcing disciplined growth, expanding our banking franchise, and deepening client engagements as we broaden our market footprint. With that, I will ask Juliana to provide additional details on our financial performance for the Thank you, Kevin, and good morning, everyone.
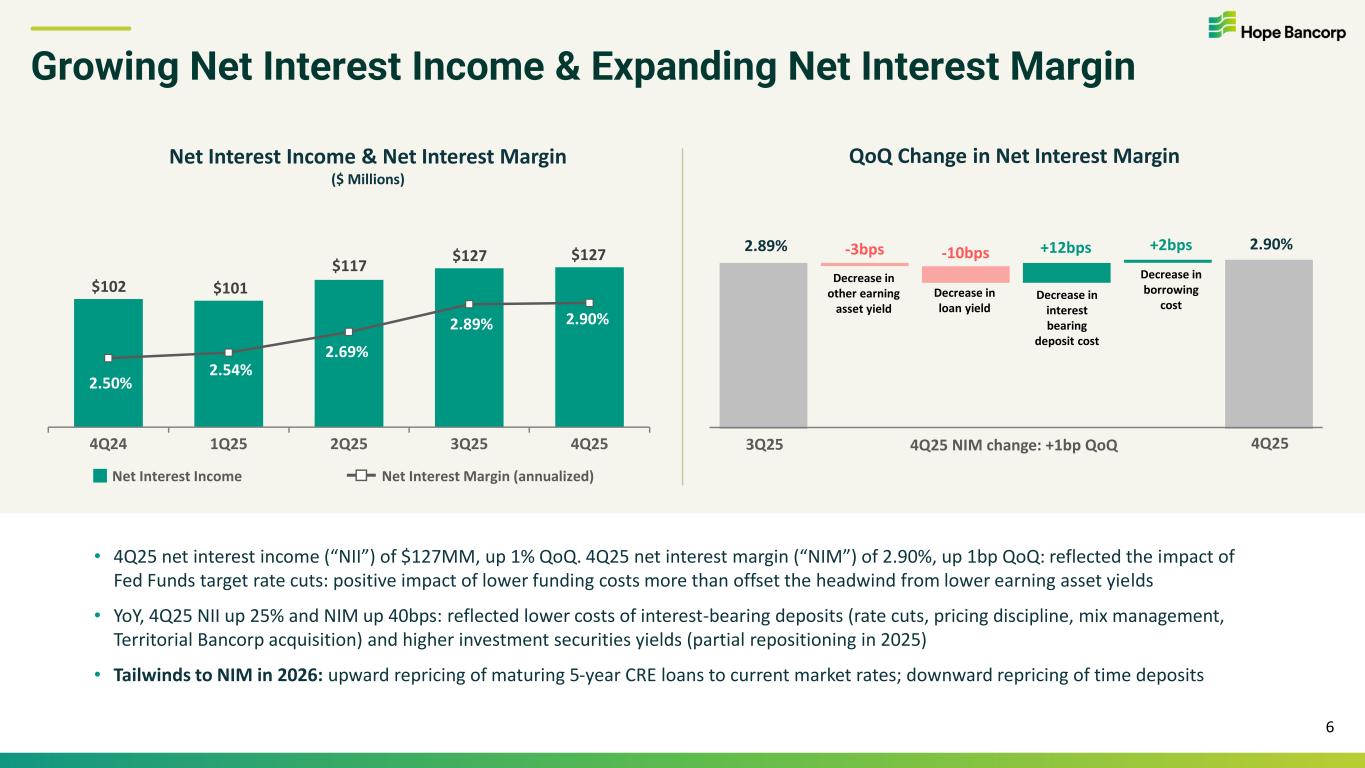
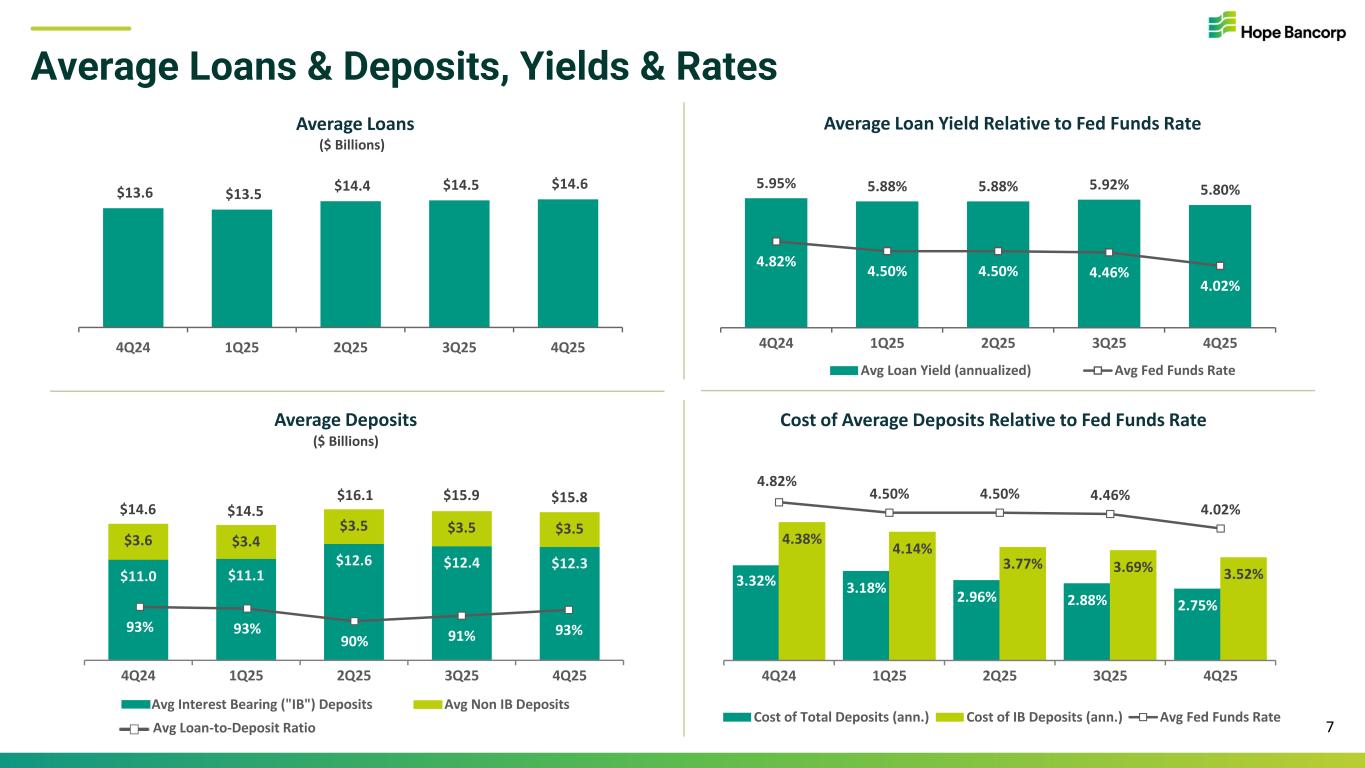
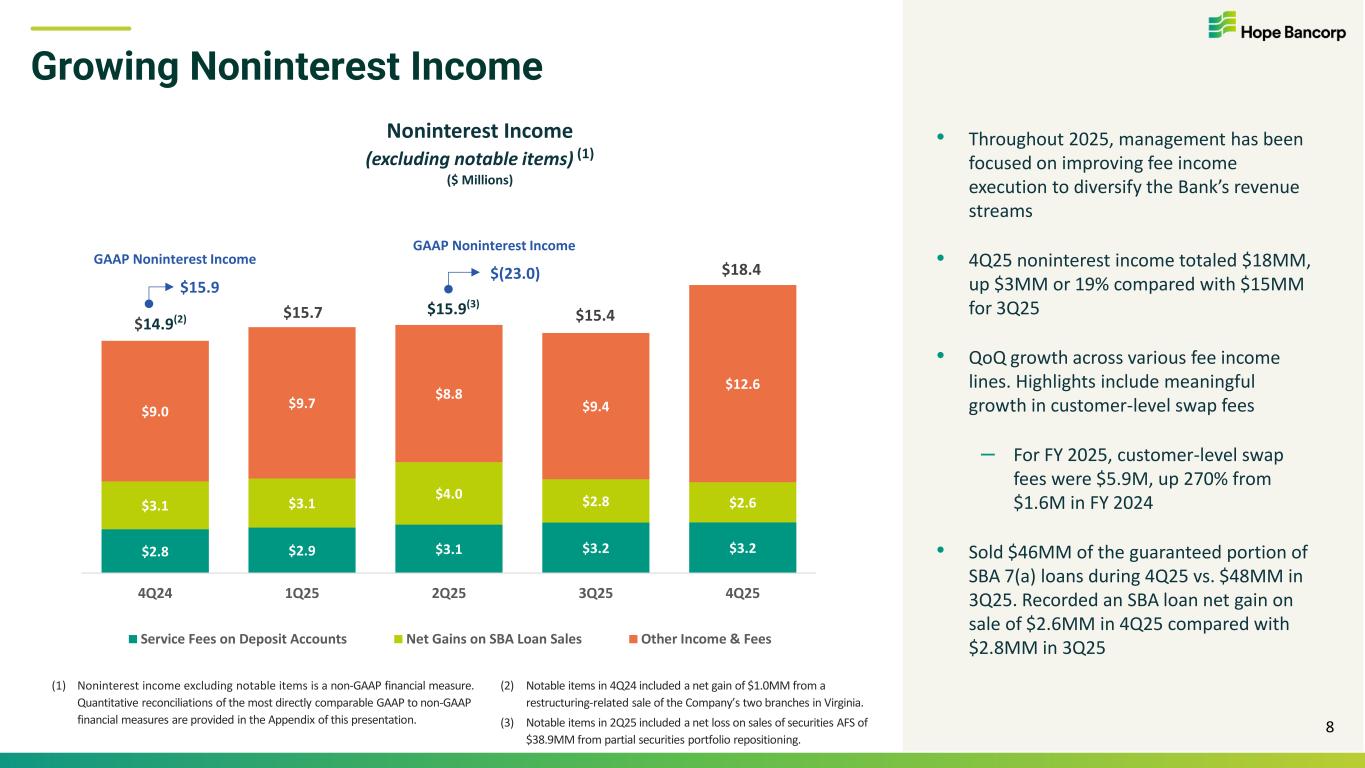
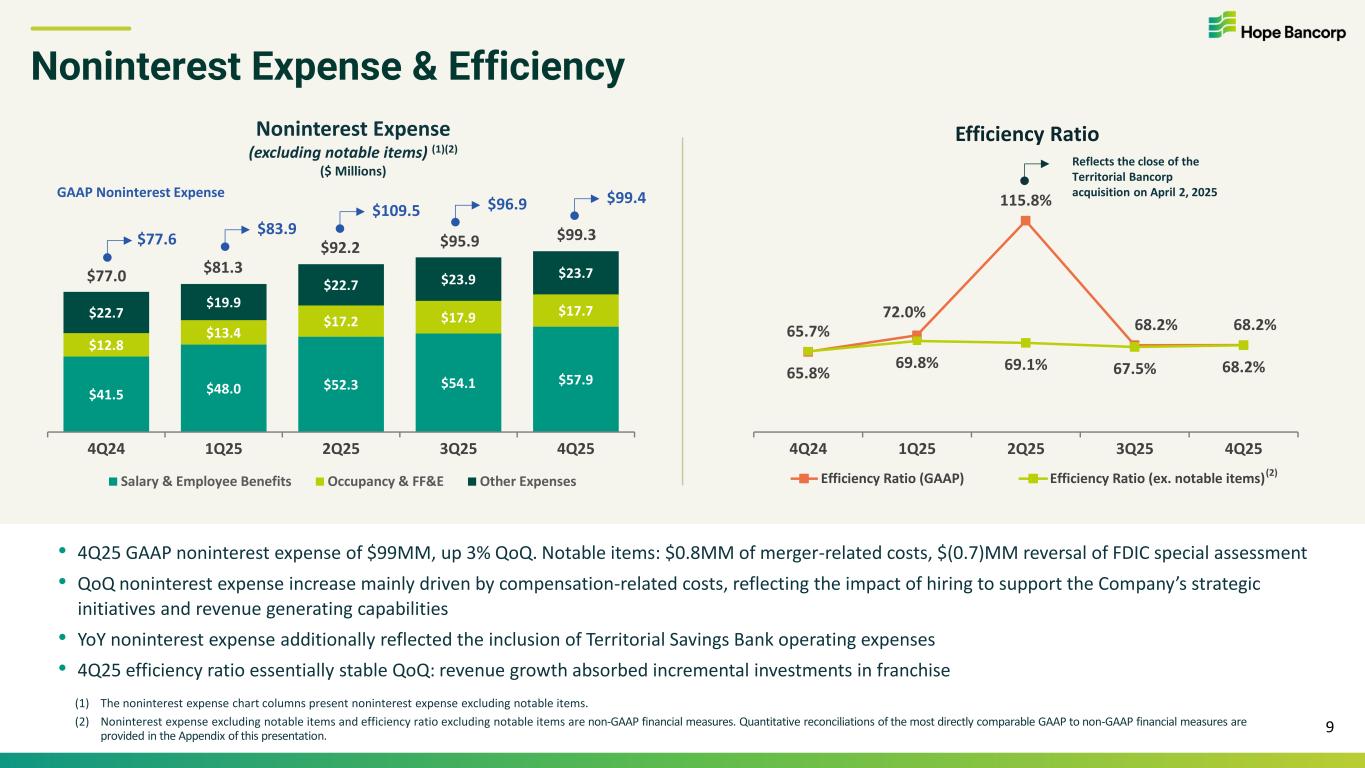
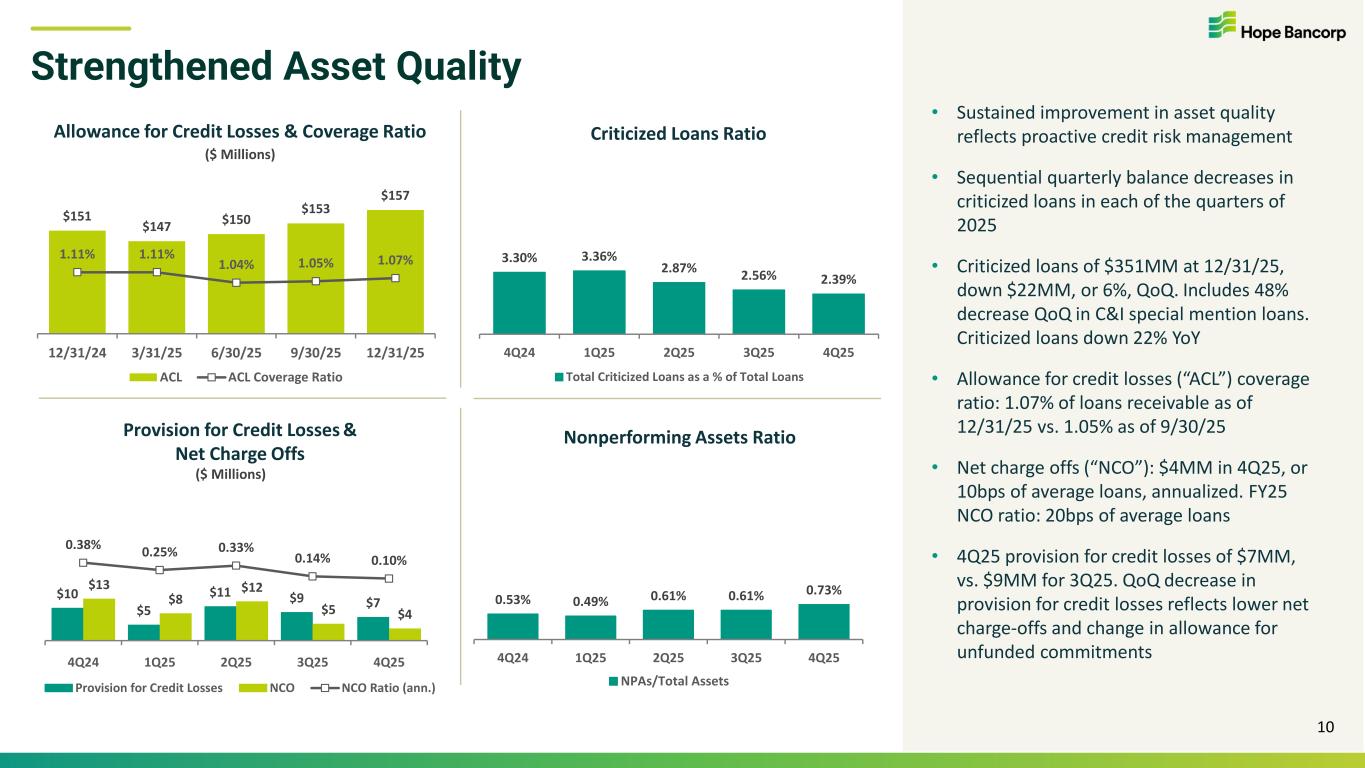
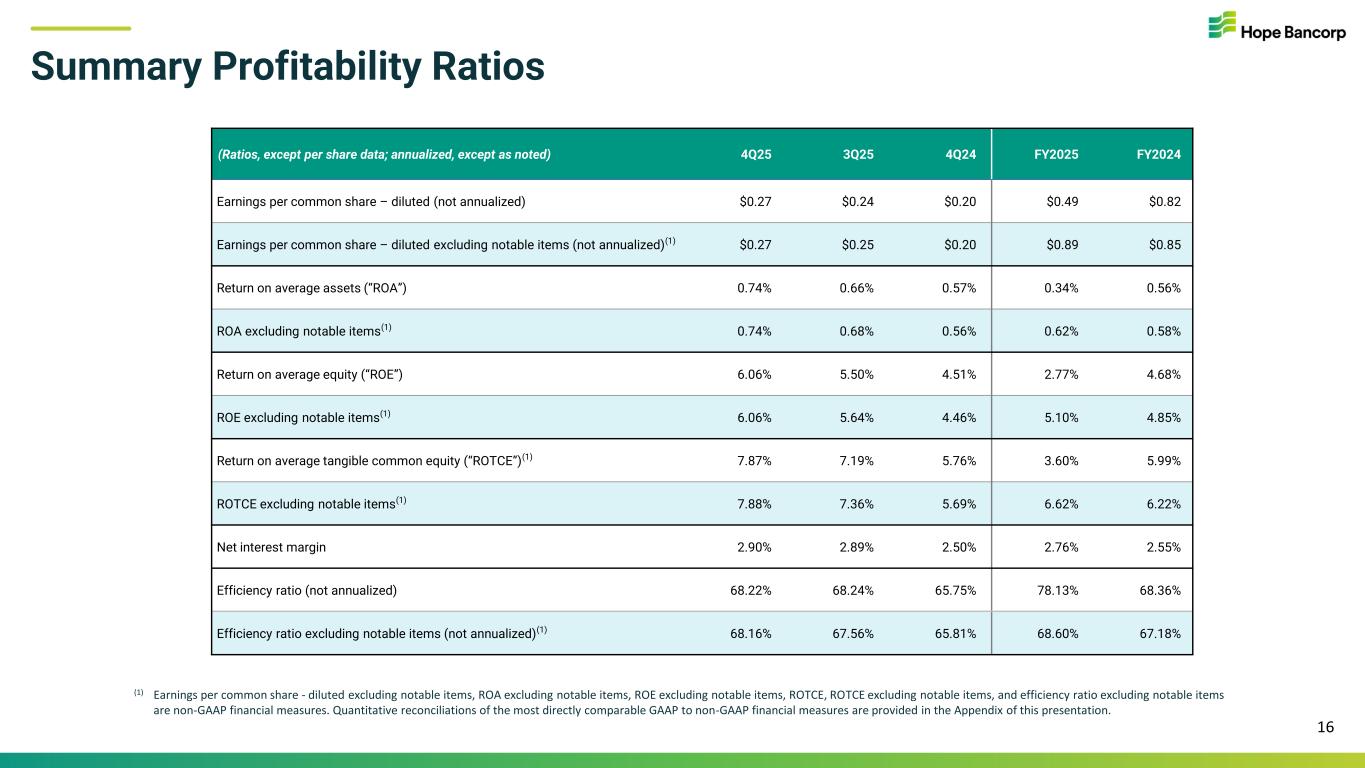
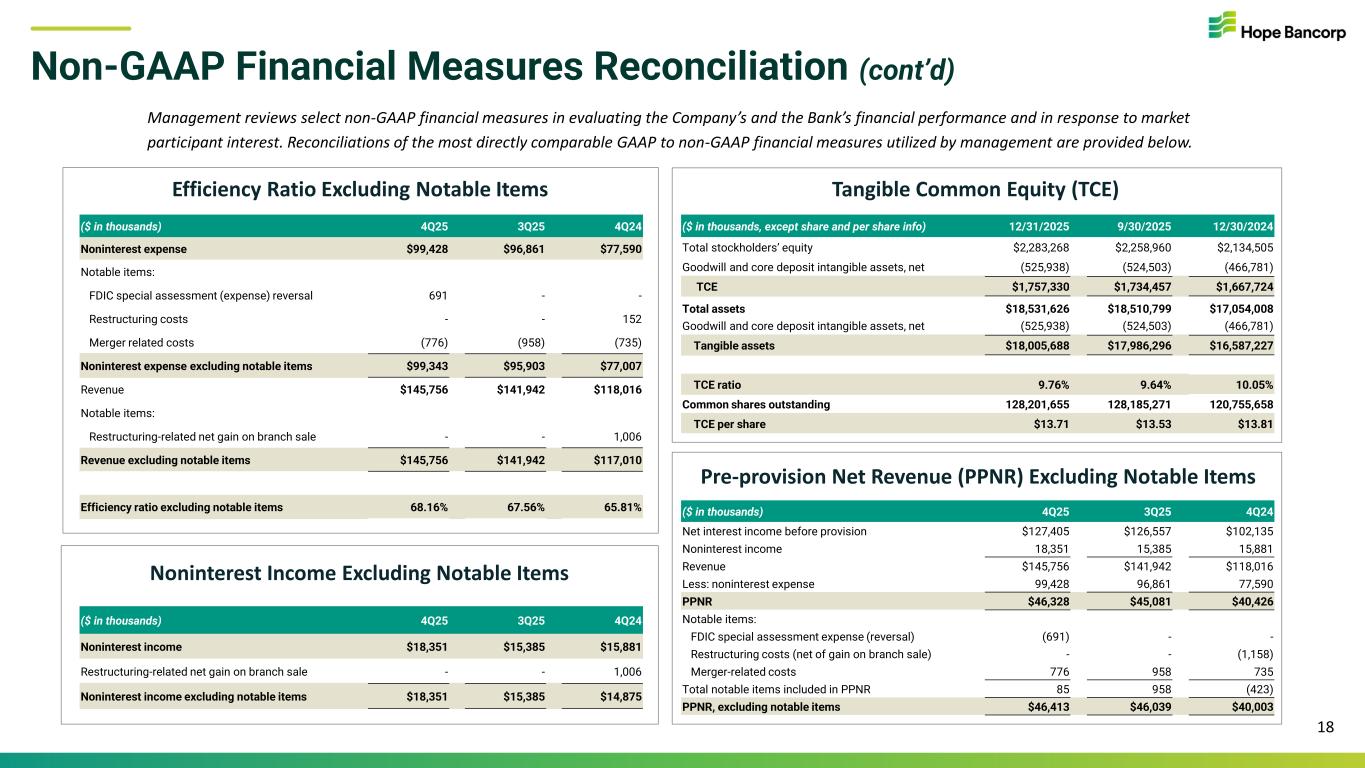
Beginning on slide six, our net interest income totaled $127 million for the fourth quarter of 2025, an increase of 1% from the prior quarter and up 25% from the fourth quarter of 2024. The fourth quarter of 2025 net interest margin was 2.90%, up one basis point from the third quarter reflecting the positive impact of lower funding costs which more than offset the headwind from lower earning asset yields year over year our net interest margin expanded by 40 basis points in the fourth quarter of 2024 primarily driven by lower costs of interest-bearing deposits and higher investment securities yields the latter being partially repositioned in 2025. On slide seven, we present the quarterly trends in our average loan and deposit balances and our weighted average yields and costs. Reflecting the impact of Fed Fund's target rate cuts, our average loan yield declined by 12 basis points, and the cost of average interest-bearing deposits decreased by 17 basis points from the previous quarter. In 2026, we expect to benefit from two ongoing tailwinds in our balance sheet, the upward repricing of maturing five-year commercial real estate loans to current market rates and the downward repricing of time deposits. On to slide eight, where we summarize our non-interest income. In the fourth quarter of 2025, we realized growth across a number of fee income lines and strength in customer-level swap fees was a highlight. Throughout 2025, management has been focused on improving fee income execution to diversify the bank's revenue streams. For example, customer-level swap fees were $6 million for the full year of 2025, an increase of 270% from $1.6 million in 2024. During the fourth quarter, we sold $46 million of SBA loans, compared with $48 million in the third quarter. Accordingly, we recognized SBA loan gains on sale of $2.6 million for the fourth quarter, compared with $2.8 million for the third quarter. Moving on to non-interest expense on slide nine. Our non-interest expense totaled $99 million in the fourth quarter of 2025, up from $97 million in the third quarter. The sequential quarter increase was mainly driven by compensation-related costs, reflecting the impact of hiring to support the company's strategic initiatives and revenue-generating capabilities. The year-over-year increase in non-interest expense from $78 million in the fourth quarter of 2024 additionally reflected the inclusion of Territorial Savings Bank operating expenses. The fourth quarter-2025 efficiency ratio was essentially stable link quarter at 68%, with revenue growth effectively absorbing the incremental investments that we have been making. Next, on to slide 10. I will review our asset quality, which steadily improved throughout the year, with sequential quarterly balance decreases in criticized loans in each of the quarters of 2025. This reflected our disciplined and proactive approach to underwriting and portfolio management, as well as successful workouts of problem loans. At December 31st, 2025, criticized loans were $351 million, down 6% quarter over quarter, and down 22% year over year. The sequential quarter improvement included a 48% lean quarter decrease in C&I special mention loans. The criticized loan ratio improved to 2.39% of loans at December 31st, 2025, down from 2.56% at September 30th, 2025, and down from 3.30% at December 31st, 2024. That charge-offs were $3.6 million for the fourth quarter of 2025, or annualized 10 basis points of average loans, compared with $5.1 million, or 14 basis points annualized in the third quarter. The fourth quarter of 2025 provision for credit losses was $7.2 million, compared with $8.7 million for the third quarter of 2025. The quarter-over-quarter decrease in the provision for credit losses primarily reflected lower net charge-offs and the linked quarter change in the allowance for unfunded commitments. The allowance for credit losses totaled $157 million at December 31st, 2025, up from $152.5 million at September 30th.
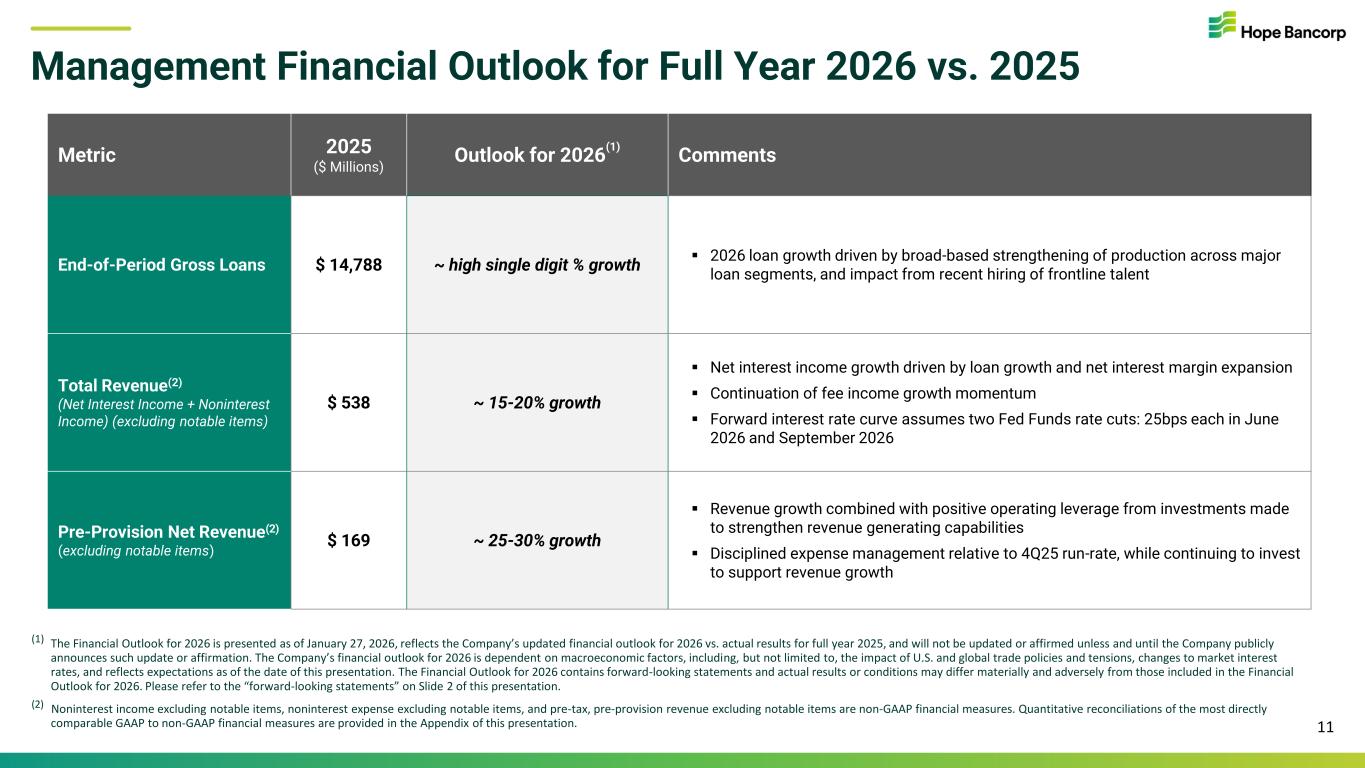
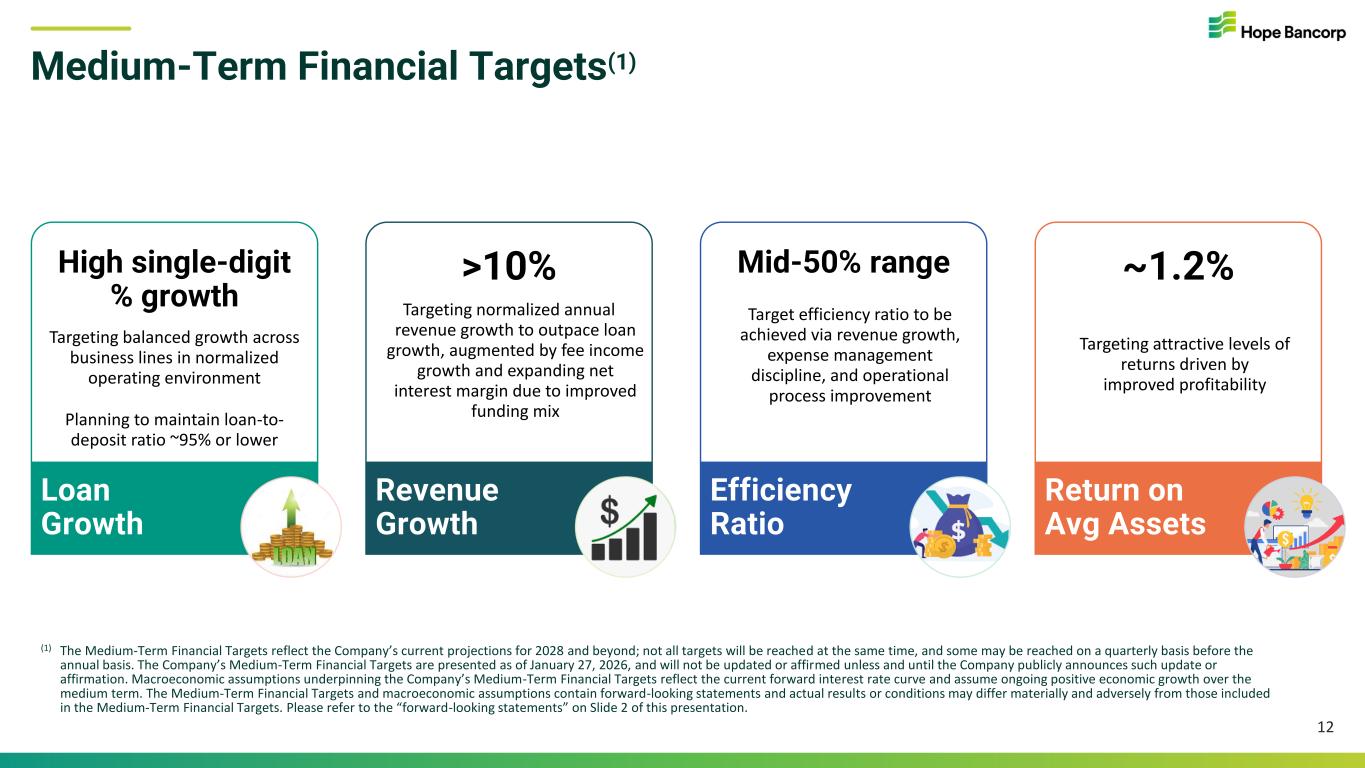
The allowance coverage ratio was 1.07% of loans receivable December 31st, 2025, up two basis points compared with 1.05% at September 30th with that let me turn the call back to Kevin thank you Juliana moving on to the outlook on slide 11 we present our management outlook for the full year 2026 we expect to see year over year long growth in the high single digit range in 2026 continuing to build on the growth momentum from the second half of 2025 and supported by the hiring that we have been making in our frontline teams throughout 2025 we expect year-over-year revenue growth in the range of 15 to 20 percent for 2026 this will be driven by our loan growth outlook continued net interest margin margin expansion and strong fee income growth. In terms of net interest income, our budget assumes two Fed funds target rate cuts, 25 basis points, each in June and September 2026, in line with the current forward interest rate curve. In addition, we anticipate a tailwind to net interest margin expansion from the downward repricing of time deposits as well as from the upward repricing of maturing commercial real estate loans to current rates. In terms of fee income, we expect to see a continuation of the strong customer fee income momentum that we delivered in 2025. Overall, our outlook is for year-over-year pre-provision net revenue growth, excluding notable items, to be in the range of 25 to 30 percent for the full year 2026. This reflects the combination of our revenue growth outlook and positive operating leverage. The investments that the bank has been making in people and platforms to strengthen its franchise are anticipated to support our revenue growth outlook in 2026. Going forward, we would consider the fourth quarter 2025 non-interest expense level to be a reasonable starting quarterly run rate for 2026, factoring in ongoing plans to support revenue-generating hires, strengthen frontline capabilities, as well as manage quarterly fluctuations. Our outlook assumes a steady asset quality backdrop and an effective tax rate between 20% and 25% on a full-year basis. With that, I will briefly review our medium-term financial targets on slide 12. We continue to make progress towards our medium-term financial targets and believe we are well-positioned to achieve these goals. Our bottom line financial target continues to be a return on average assets of approximately 1.2%. To achieve this metric, we are targeting loan growth in the high single-digit percentage range and revenue growth over 10% on an annual normalized basis. The loan growth target is part of our outlook and plan for 2026, and is expected to drive our revenue growth alongside continued expansion of net interest margin and strong fee income growth. We expect to exceed our normalized revenue target this year. Over the medium term, we are continuing to target an enhanced efficiency ratio. Our current target is for an efficiency ratio in the mid-50 percentage range, which reflects our recent and planned strategic investments in the business and personnel to support the development of our commercial and corporate banking capabilities. We believe that our efficiency enhancement will come from a combination of sustained, strong revenue growth, disciplined expense management, and ongoing operational process improvement. Improved efficiency remains a medium-term target, and we expect to make progress on the efficiency ratio in 2026 through positive operating leverage, but achieving our target will likely take more than just one year. Ultimately, the combination of attractive revenue growth and positive operating leverage over the medium term is expected to improve our return on assets toward the 1.2% target. In summary, building on the execution of our improved 2025 financial results, our stronger balance sheet positioning, as well as targeted team and talent additions have enhanced our capacity to deliver disciplined, profitable, and sustainable growth, creating durable value for our stakeholders in the years ahead. With that, operator, please open up the call for questions.
Operator
We will now begin the question and answer session. To ask a question, you may press star than 1 on your telephone keypad. If you're using a speakerphone, please pick up your handset before pressing the keys. If at any time your question has been addressed and you would like to withdraw your question, please press star than 2. Please limit yourself to two questions. At this time, we will pause momentarily to assemble our roster. The first question comes from Ahmad Hassan with DA Davidson. Please go ahead.
Hey guys, on for Gary Tenner here. Can I quickly just get the PAA accretion number?
I'm sorry, we don't disclose that number separately.
And then maybe can I get your thoughts on deposit costs from here in terms of pricing and do you guys disclose the spot rate for deposit costs?
We did not provide the spot rate for deposit costs on this call. I can look that up momentarily, one second. Our spot rate on total deposits was 2.68% as of December 31st, 2025, and in terms of deposit costs going forward, as we mentioned in our remarks, the continued downward repricing of CD portfolio as it turns over will continue to lower our deposit costs in the future, And then we reduced our non-maturity deposit rates alongside Fed fund cuts. So to the extent of our future cuts, we will continue that practice, of course. And then thirdly, in our outlook embedded, there's also in terms of behind the DDA growth that we are anticipating and planning for in this year, we have been investing in strengthening our TMS treasury management products and services infrastructure and teams in order to be able to expand our customer relationships and capture more of the operating deposit wallet share so an improved deposit mix will be the third factor in helping to reduce our deposit costs in 2026.
Appreciate the color there. And then maybe last one for me. You guys mentioned new hiring as a potential lever for loan growth in your outlook slide. How should we think about new hiring going forward in 2026? Any sort of new hire targets you guys can give out?
Not specific new hire targets, but our business plan does have very specific roles outlined in the hiring that we are bringing on board. Our hiring is focused on supporting revenue generation and the capabilities related to that as well, obviously frontline and related support. And so in terms of thinking about that from your perspective, I would say that if you start with the fourth quarter run rate that you saw that already has embedded in it, the hiring that we've made in 2025. And then from here on out, when you think about 2026, we're going to continue to add to the hiring, but I would think about it as an OPEX growth rate in the low single digits, sub-5%.
Operator
That was helpful. Thanks. Again, if you have a question, please press star, then one.
The next question comes from kelly mata with kbw please go ahead hi this is charlie on for kelly mata i just wanted to i just wanted to dig in to what the cdu repricing looks like as you mentioned that downward repricing is a core driver of the name going forward so any detail you can provide about the cd schedule and repricing there going forward in 2026 thank you so in terms of our um cds in 2026 uh we're looking at a repricing of $6.3 billion, so obviously a lot of it reprices quickly, I mean CDs are
by nature 12 months or less, and so maybe for the near term, in the first quarter we've got a total of $2.5 billion of CDs repricing, and that weighted average rate that they're pricing from is 3.99% and the new CDs have been coming in at, one second I'll tell you, the new CDs have been coming in at somewhere between 390. I'll get that back. The branch CDs were coming in at that 390 kind of percent level so There's a little bit more competitive, but we also are benefiting from repricing of institutional CDs, and those are coming in at more kind of lower pricing, and so that kind of pricing has been coming in at $370. So it's going to be a blend of both kind of going forward.
Awesome. Thank you for the color there. And then I guess just following up on the overall margin dynamics, Can you remind us of any, like, sensitivity to cuts and how you view the overall margin expansion heading into 2026?
Sorry, can you repeat your question?
I guess the overall margin dynamics and any sensitivity to cuts and how you view, kind of, the margin expansion from here heading into 2026.
Actually, I need to make a correction. The 390s that I quoted you from the branch CDs, I was reading from the roll-off WAC column. So, I'm very sorry. Let me correct that. The new roll-on from branch CDs has been in the 375 to 380 range.
Thank you. Let me make that correction. And the sensitivity or margin to the rate cuts. I would probably take a look at the third quarter and the fourth quarter margin relative to the rate cuts you've seen in this half of the year and extrapolate from that. I mean, at this point in time, the rate cuts are expected in the second half of next year. So a lot can change between now and then. So I'll just extrapolate from recent trends.
Thank you. And I guess from a high level, like looking back on the year, you guys entered Hawaii. Just an update on the operations there and the strategy there. If you're hiring teams, you're still stabilizing operations.
Yeah, our focus in 25 in Hawaii was to ensure the successful integration of the teams and add resources as necessary. And during the transition period in 2025, we were pleased to see that we did not experience any meaningful deposit fluctuations, and the reception by our customer base in Hawaii was pretty positive. In 2026, we are looking forward to generating growth from the strategically attractive market in Hawaii. Great.
Thank you. I'll step back.
Operator
This concludes our question and answer session. I would like to turn the conference back over to Kevin Kim, CEO, for any closing remarks.
Thank you. Once again, thank you all for joining us today. And we look forward to speaking with you again next quarter. So long, everyone.
Operator
The conference has now concluded. Thank you for attending today's presentation. You may now disconnect.