Operator
Hello, everyone. Thank you for joining us and welcome to the Independent BankCorp second quarter 2026 earnings call. Joining me on today's call is Jeff Tangle, CEO, and Mark Reguero, CFO. After today's prepared remarks, we will host a question and answer session. If you would like to ask a question, please press star one to raise your hand. To withdraw your question, press star one again. Before proceeding, please note that during this call, we will be making forward-looking statements. Actual results may differ materially from these statements due to a number of factors, including those described in our earnings release and other SEC filings. We undertake no obligation to publicly update any such statements. In addition, some of our discussion today may include references to certain non-GAAP financial measures. Information about these non-GAAP measures, including reconciliation to GAAP measures, may be found in our earnings release and other SEC filings. These SEC filings can be accessed via the Investor Relations section of our website. Finally, please note that this event is being recorded. I would now like to turn the conference over to Jeff Tangle, CEO. Please go ahead.
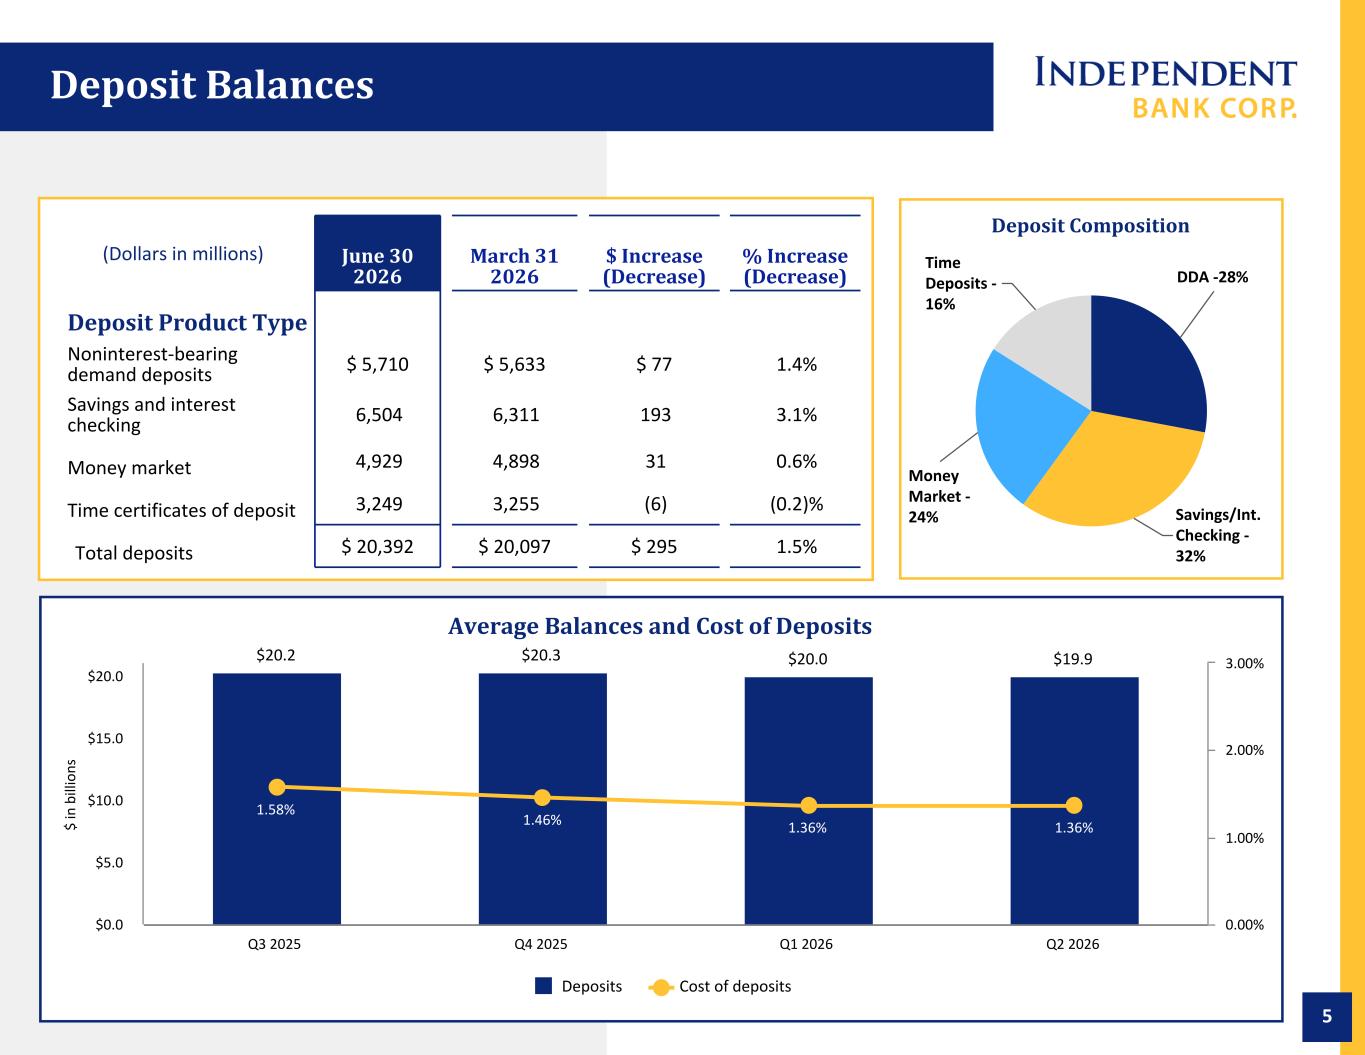
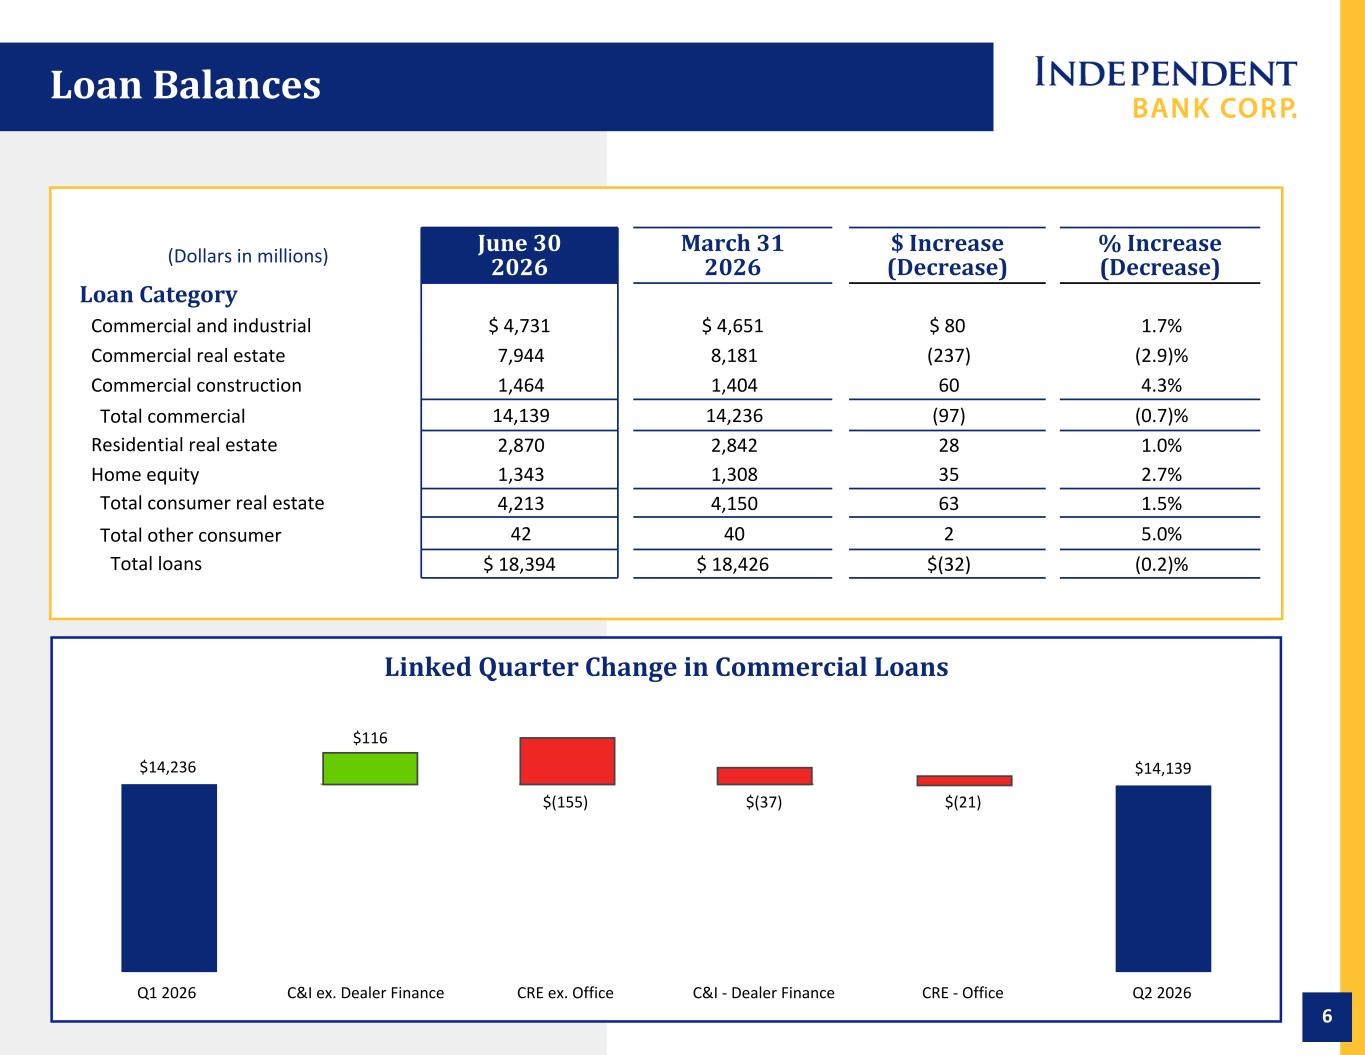
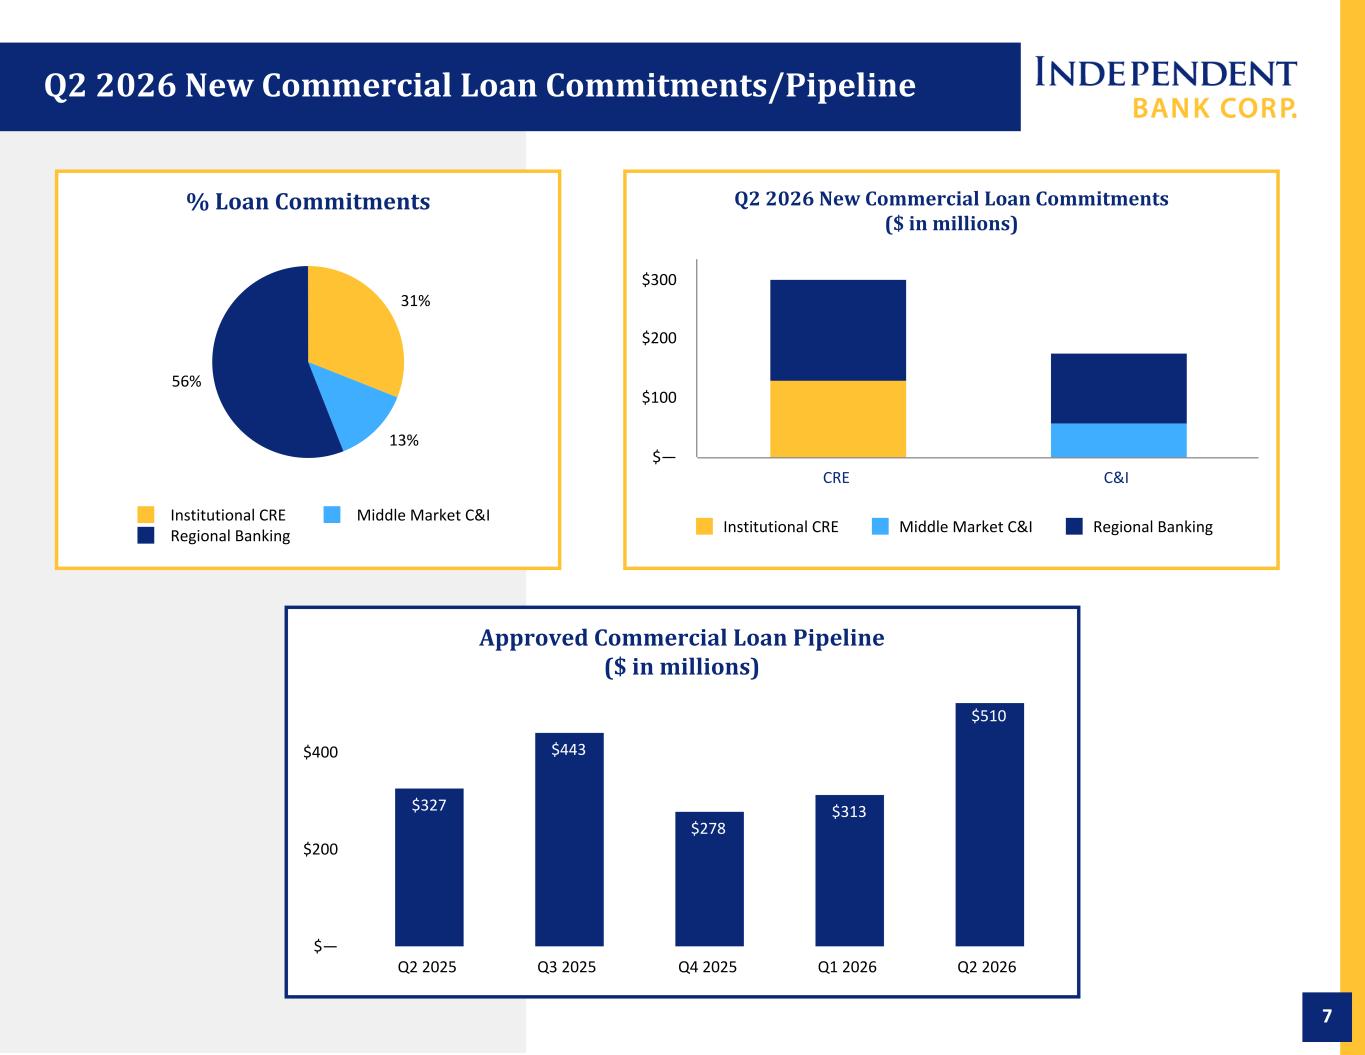
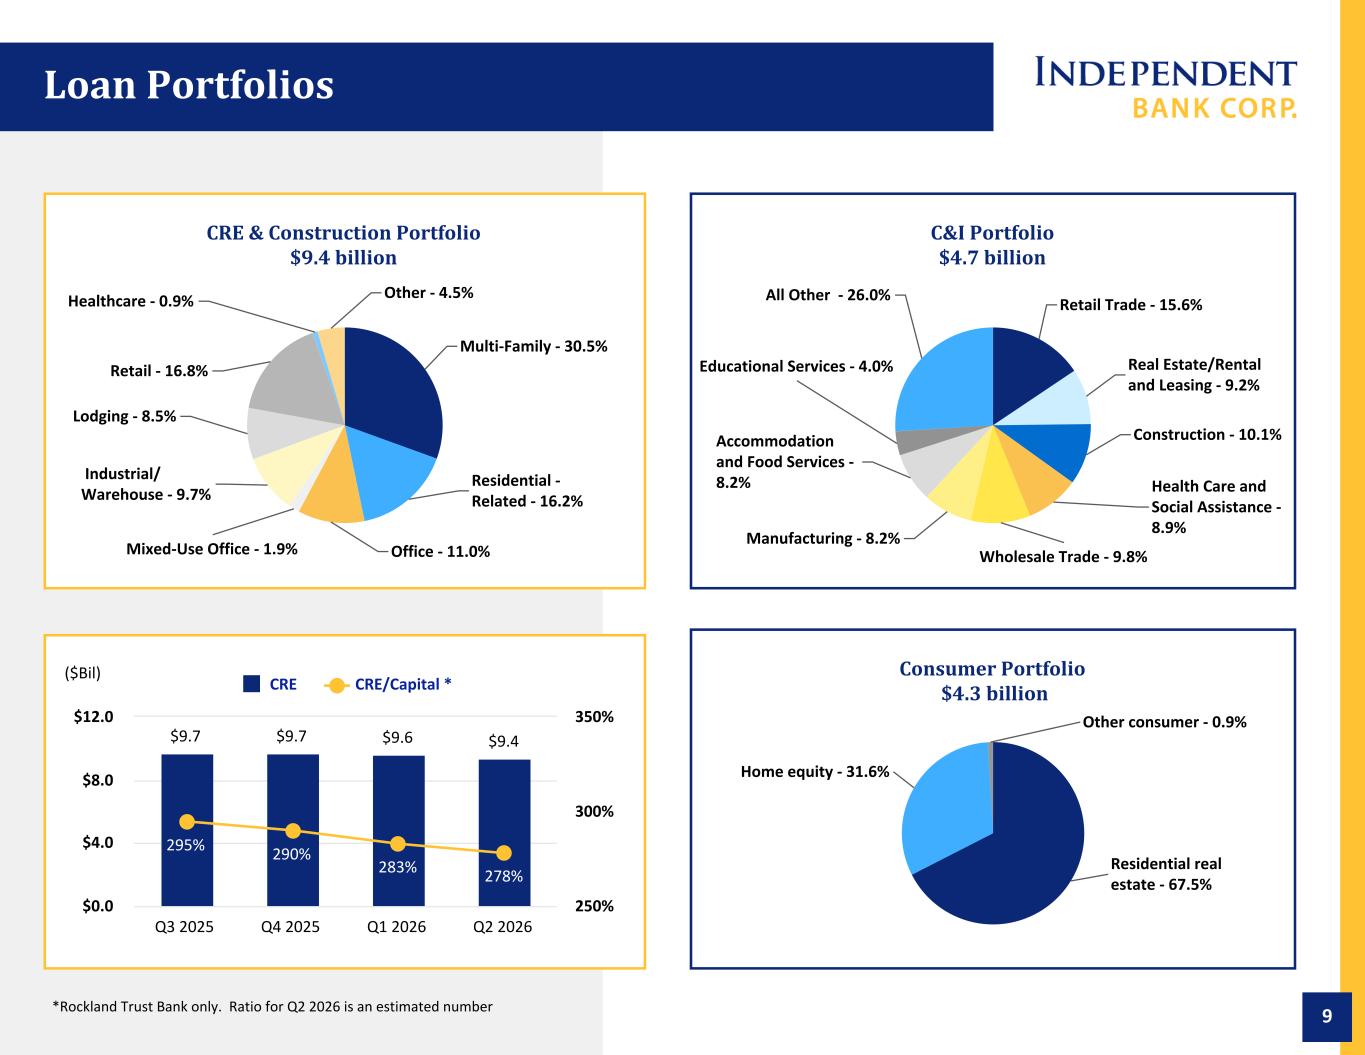
Thank you. Good morning, and thanks for joining us today. I'm accompanied this morning by CFO and Head of Consumer Lending, Mark Ruggiero. Before we discuss our quarterly results, I wanted to share an update on my health. We released an 8K in February disclosing that I had been diagnosed with non-Hodgkin's lymphoma. I'm happy to report that I have finished my treatments and learned last Friday that I am cancer-free and in remission. So on that good note, I'd like to turn to our quarterly results. While activity was slow early in the second quarter, momentum accelerated as the quarter progressed, resulting in solid deposit growth strong cni loan growth continued improvement in the adjusted nim aggressive buyback activity and excellent results in our wealth management business these positives were offset by a smaller average balance sheet and lower loan accretion income our deposit franchise continued to differentiate itself producing over 300 million dollars of non-timed deposits representing 7 percent annualized growth while maintaining a stable cost of deposits of 136. these results were achieved in an environment of heightened competition and expectations that the fed will keep rates higher for longer on the lending front we experienced robust growth in the cni and home equity portfolios offset by heavy loan payoffs within the cre book With respect to CNI, excluding the impact of the $37 million decrease in our dealer floor plan business, which we have now largely exited, our CNI loans rose by $116 million, a healthy 10% on an annualized basis. This growth was broad-based across all of our market segments. Investment Cree and construction loans conversely declined $176 million during the quarter, primarily reflecting elevated payoffs due to a variety of factors, including asset sales, refinancing done away from us, and construction loans maturing and going to the permanent market. We like the Cree asset class and will continue to support our clients in this space the way we always have. This is evidenced by the 203 million dollars in new relationship-based Cree loans we funded in the quarter, up 11 percent from the first quarter, and the 300 million dollars of new Cree commitments we added. Our Cree concentration now stands at 278. On June 30th, our approved commercial loan pipeline totaled 510 million, up from 313 million on March 31st. This strong loan pipeline, together with continued strong origination activity and an expected normalization of payoff activity, positions us well to return to positive commercial loan growth. The second quarter also saw continued improvement in the adjusted NIMH, which rose by four basis points, right in line with our guidance. This reflects pricing discipline across both our loan and deposit portfolios. Mark will elaborate on our NIMH during his comments. As Mark will also further expand on, we maintained a proactive posture in returning excess capital to shareholders. With expected further improvement in our profitability and moderate balance sheet growth, capital management will remain a key priority for the balance of the year. Our wealth management business continues to be a key fee income driver for us. Second quarter results benefited from strength in our traditional asset management business as well as inroads we have made in the enterprise footprint. I would also highlight momentum in our business advisory services segment where we assist business owners to prepare for and manage the sale of their companies, which has shown early signs of being a real positive catalyst for potential AUM inflows. With respect to asset quality, while we continue to see movement in and out of our non-performing loans and criticized and classified loan buckets the levels are consistent with our historical credit performance our net charge-offs were just two basis points for the second quarter and have averaged just nine basis points over the last five quarters our loan loss provision represented 14 basis points of average loans in the second quarter and has averaged 13 basis points over the last five quarters excluding the day one impact of the enterprise acquisition Excluding M&A charges and non-recurring core system conversion costs, expenses were flat versus the first quarter. Mark will provide a detailed breakdown of the moving parts within our expenses. We remain vigilant regarding our expense levels. As we have stated in the past, given the investments we have made in people and technology over the past few years, we believe we have the scale to continue to grow without significant additions to our expense base. There is a significant amount of work underway as we prepare to transition our core operating platform from Horizon to IBS, both part of the FIS ecosystem. The conversion is scheduled to take place in October of this year. The IBS platform positions us to improve client service, enhance operating efficiencies, accelerate the introduction of new products, and support future growth related i'd like to take a moment to talk about ai this is obviously a topic on investors minds in the first quarter we established an office of digital innovation we've stood up a governance framework around our ai activities to ensure we stay within the guardrails of our moderate risk profile and that any actions are consistent with our award-winning culture this governance framework includes a steering committee that will serve as a clearinghouse for ai use cases this will allow us to make ai investments in those areas that have a meaningful payback and avoid the proverbial boiling the ocean i expect us to start with some relatively easy use cases as we build muscle memory over time this should enable us to gain confidence in our ability to execute and take on bigger more impactful applications our strategy remains straightforward organic growth through new and existing relationships maintain disciplined underwriting generate positive operating leverage and deploy our strong capital position to create long-term shareholder value i want to thank all rockman trust employees for their tremendous efforts on a daily basis every measure of our success is a direct result of their commitment
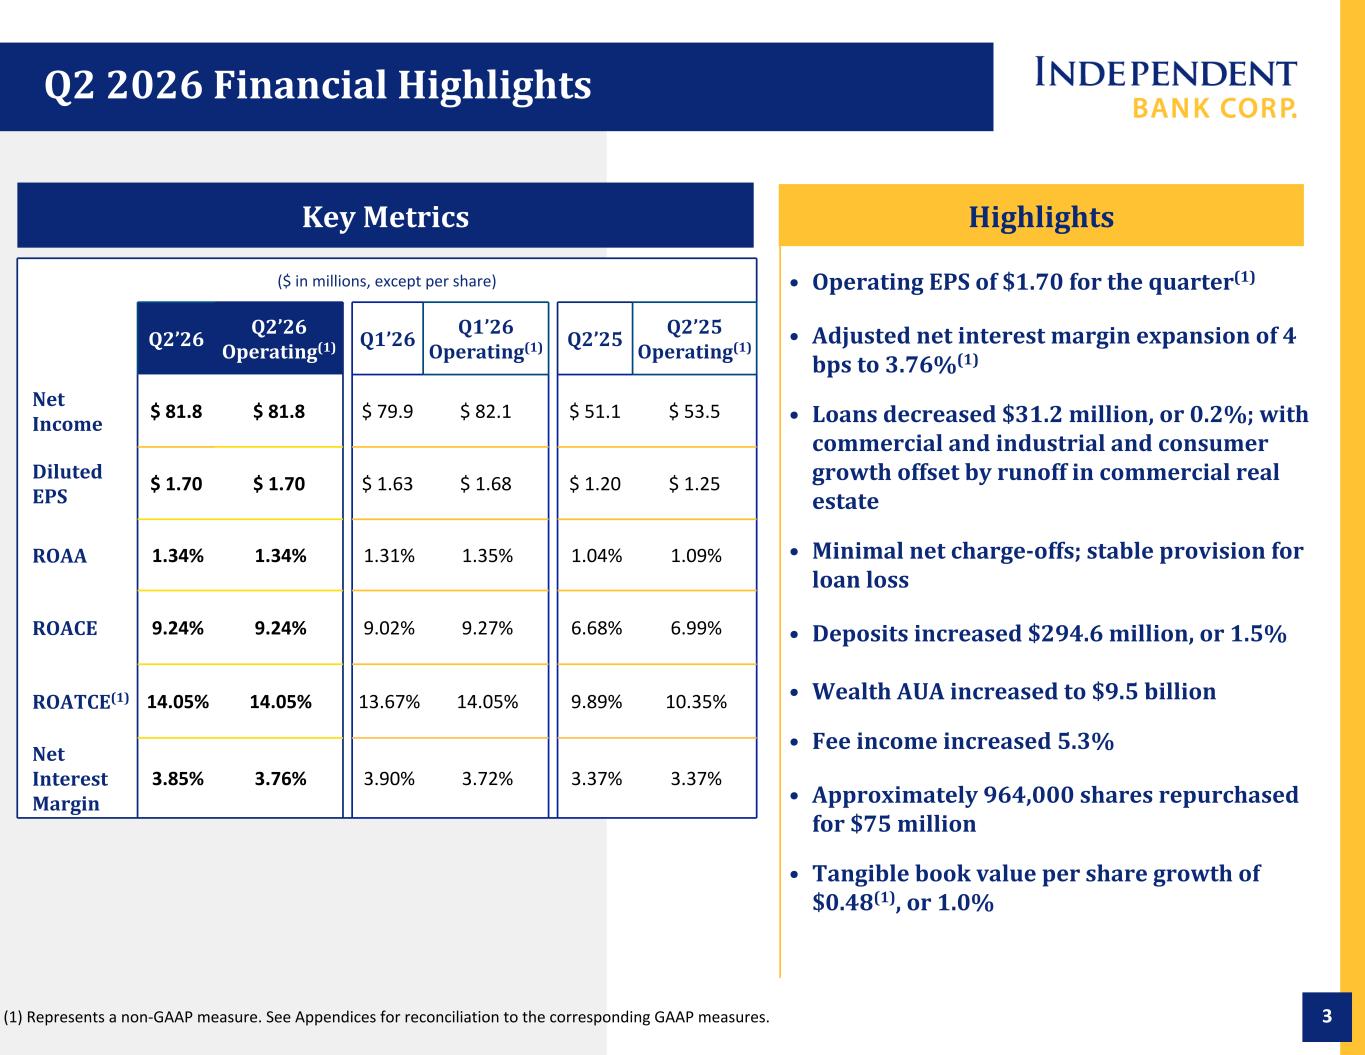
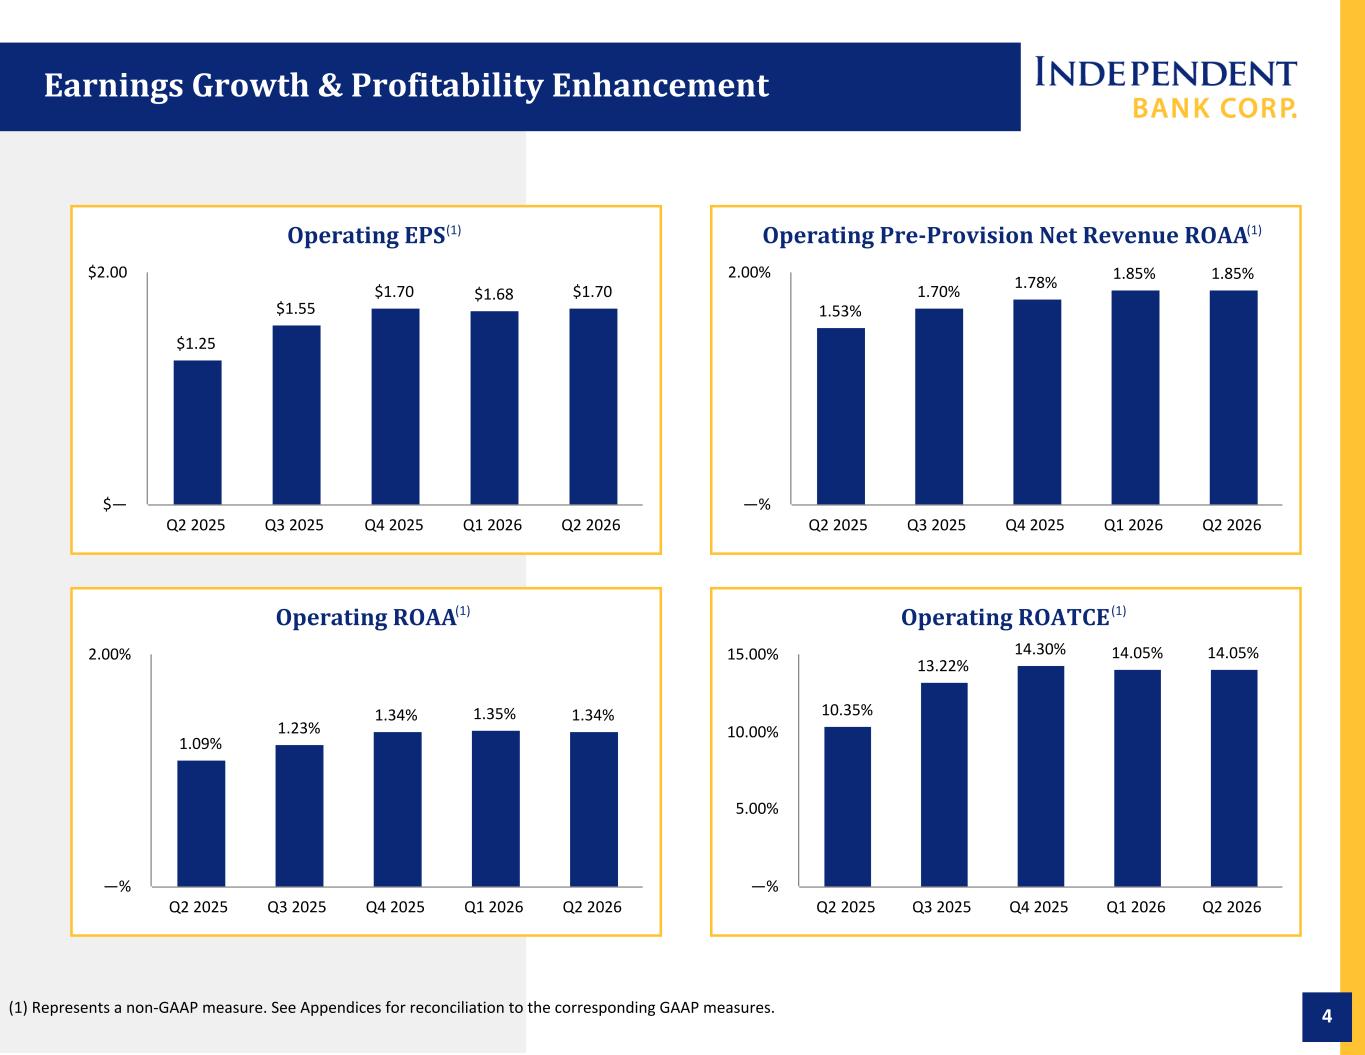
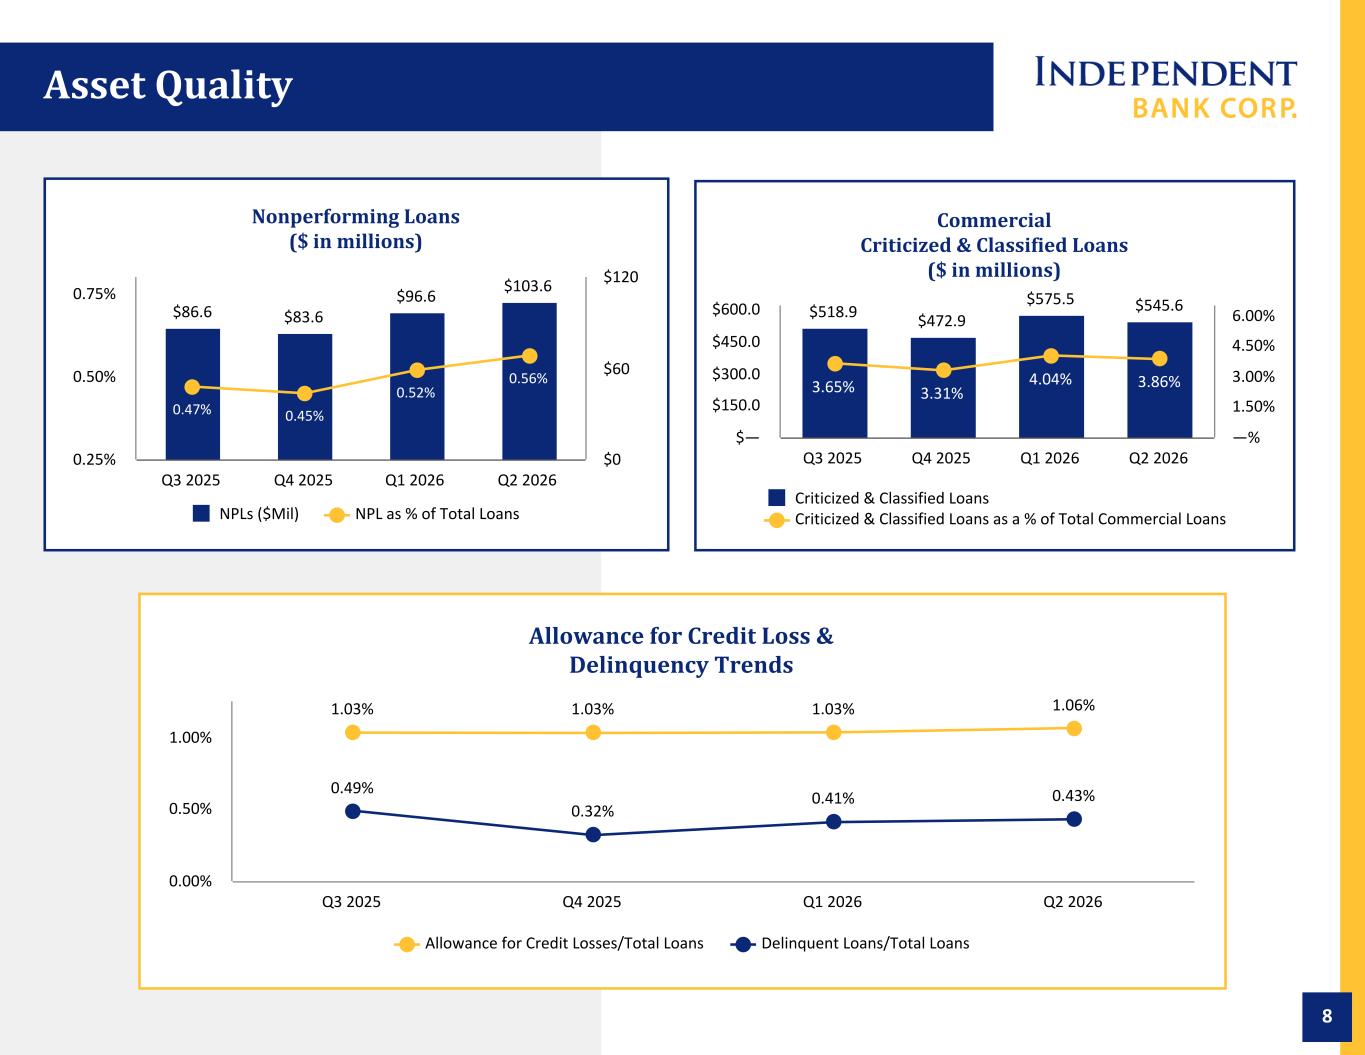
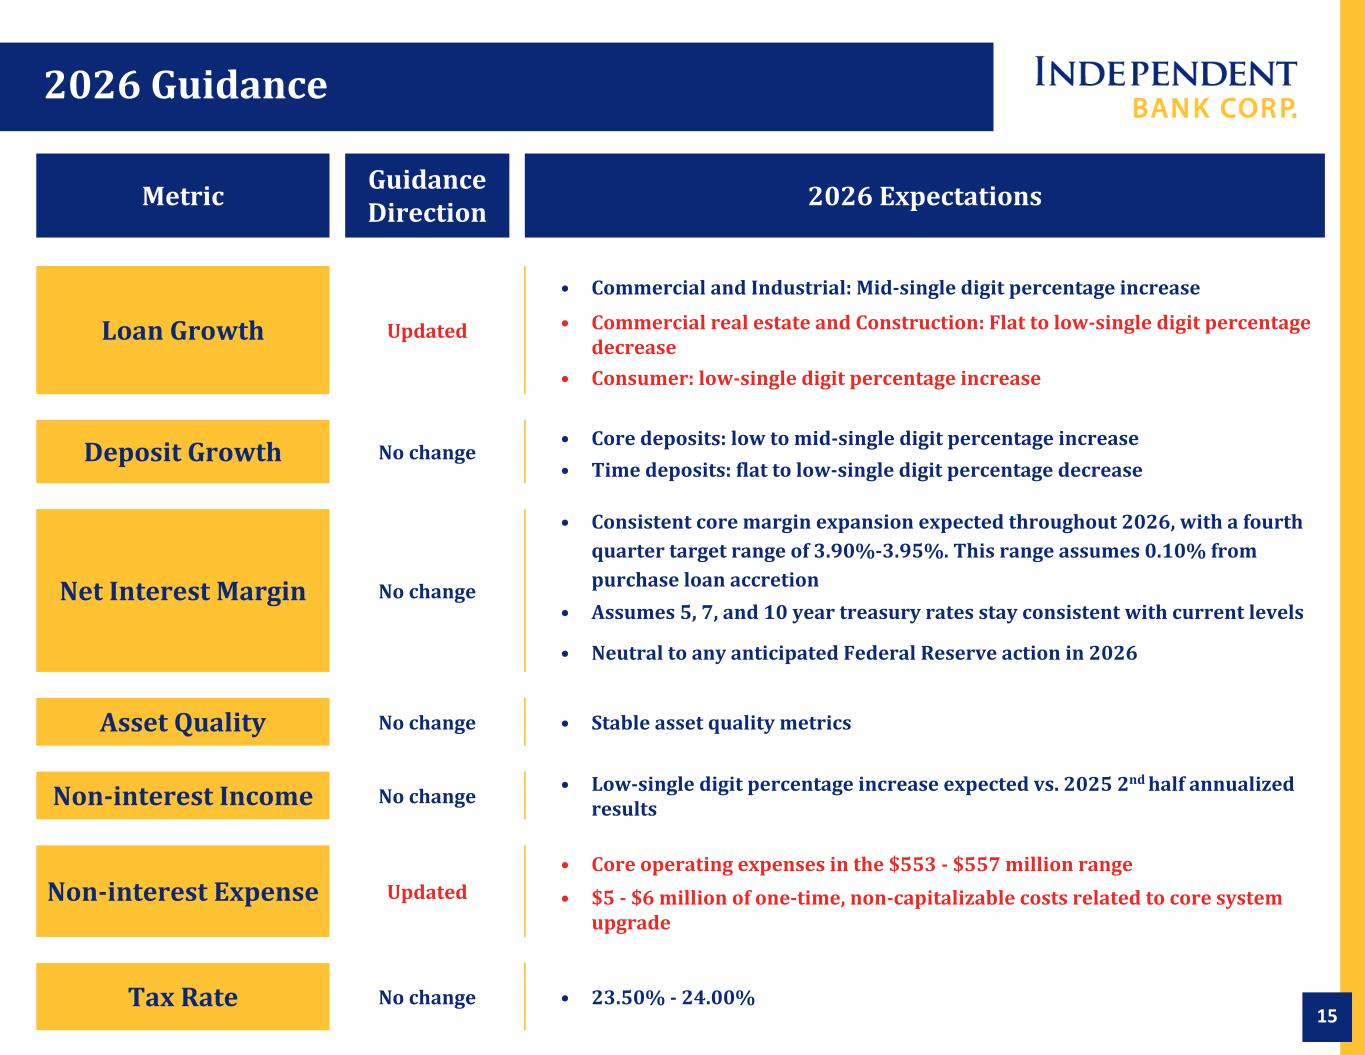
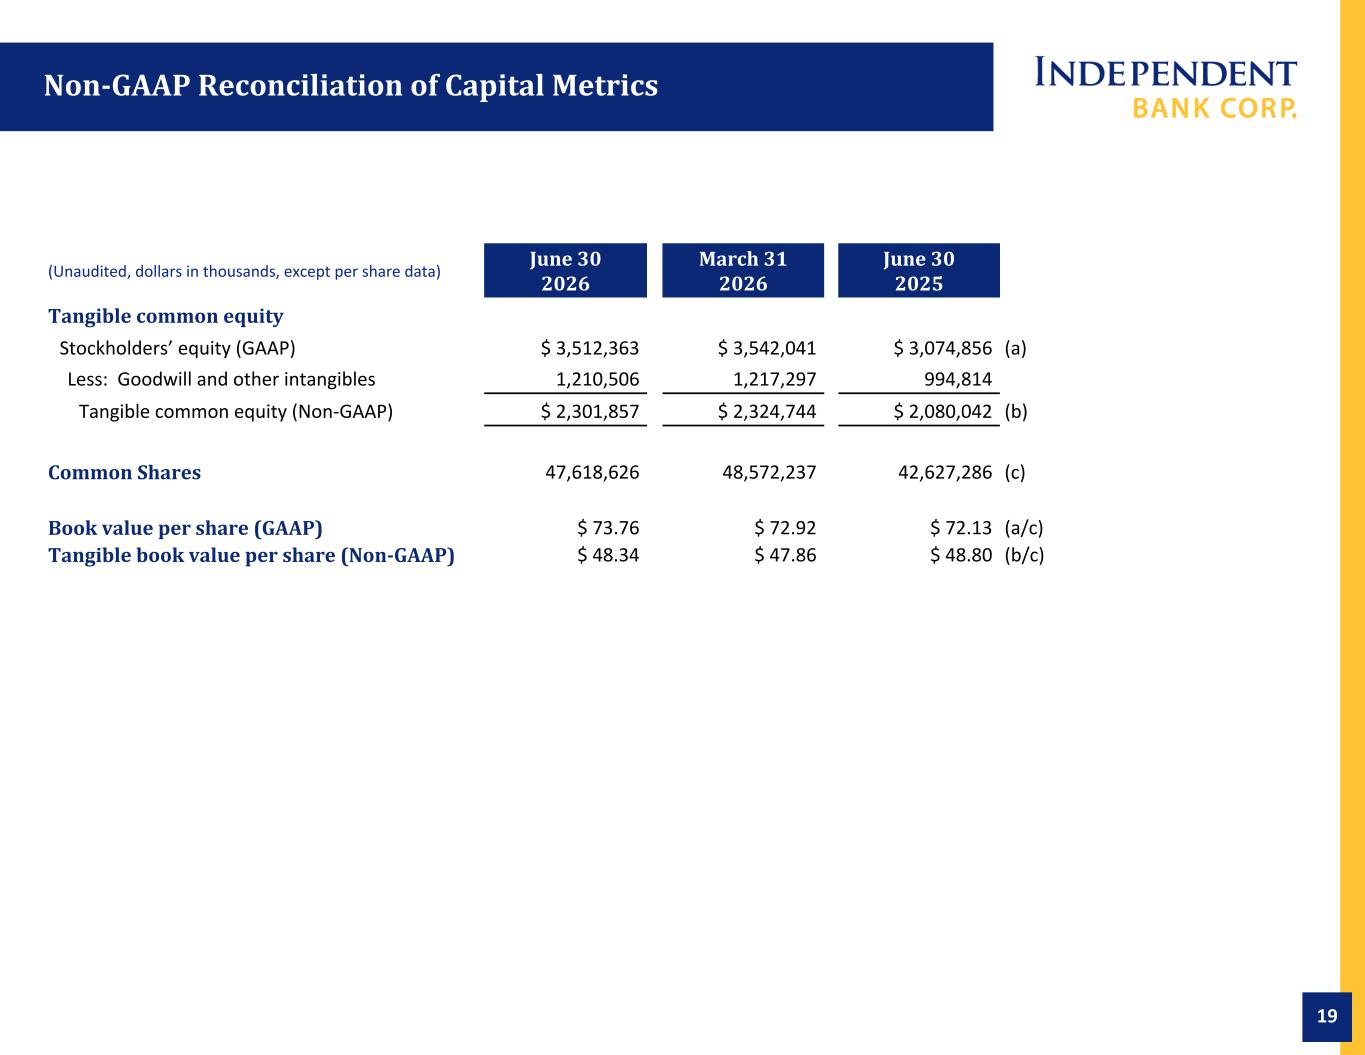
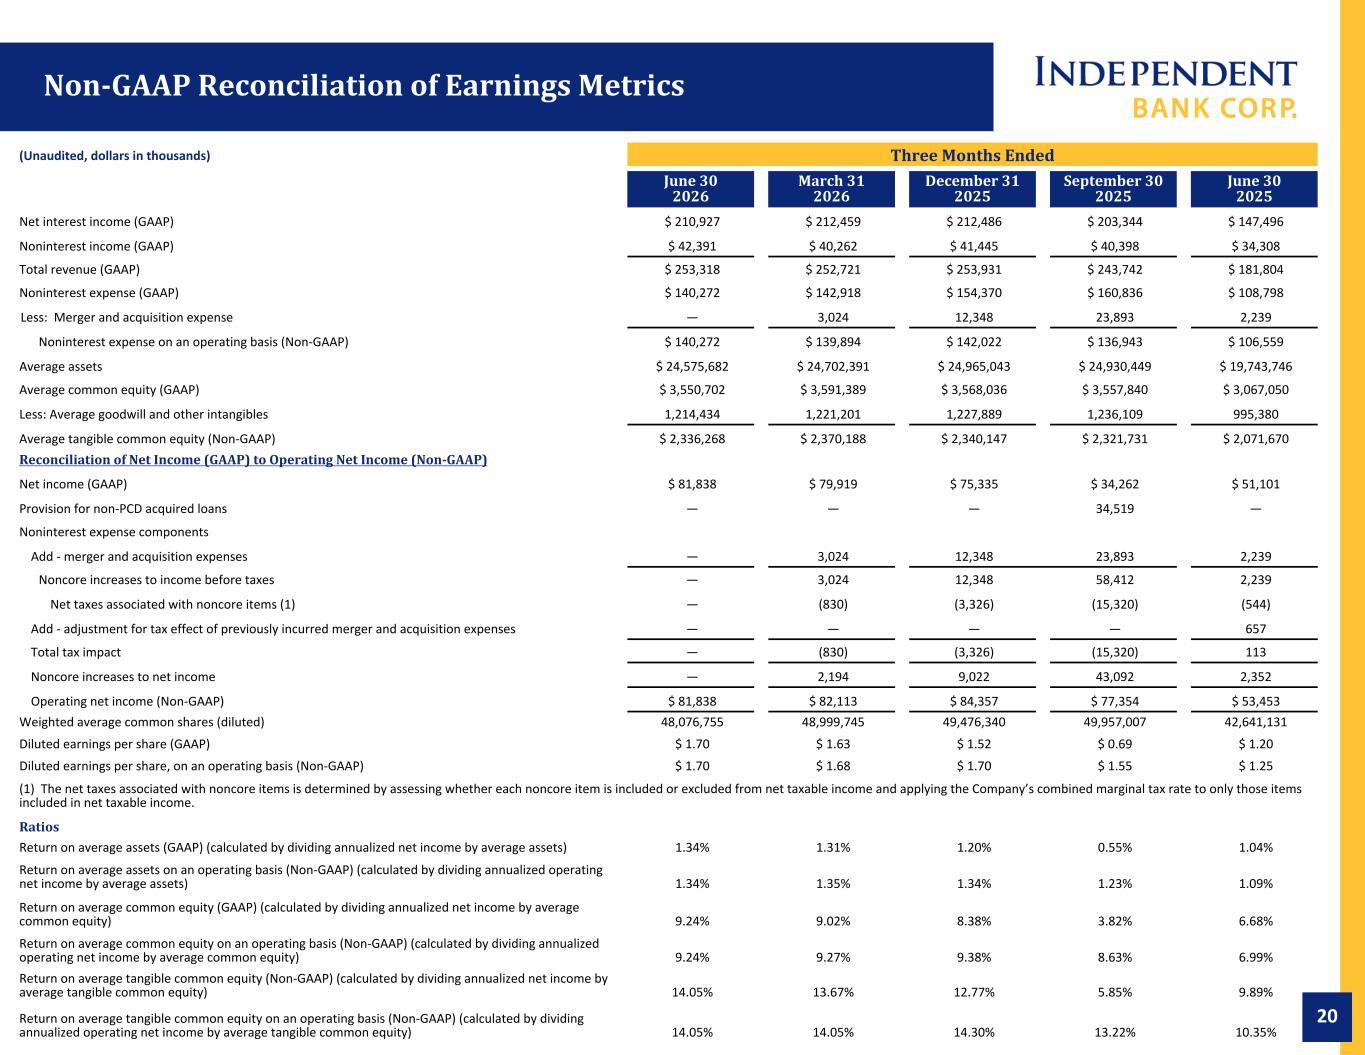
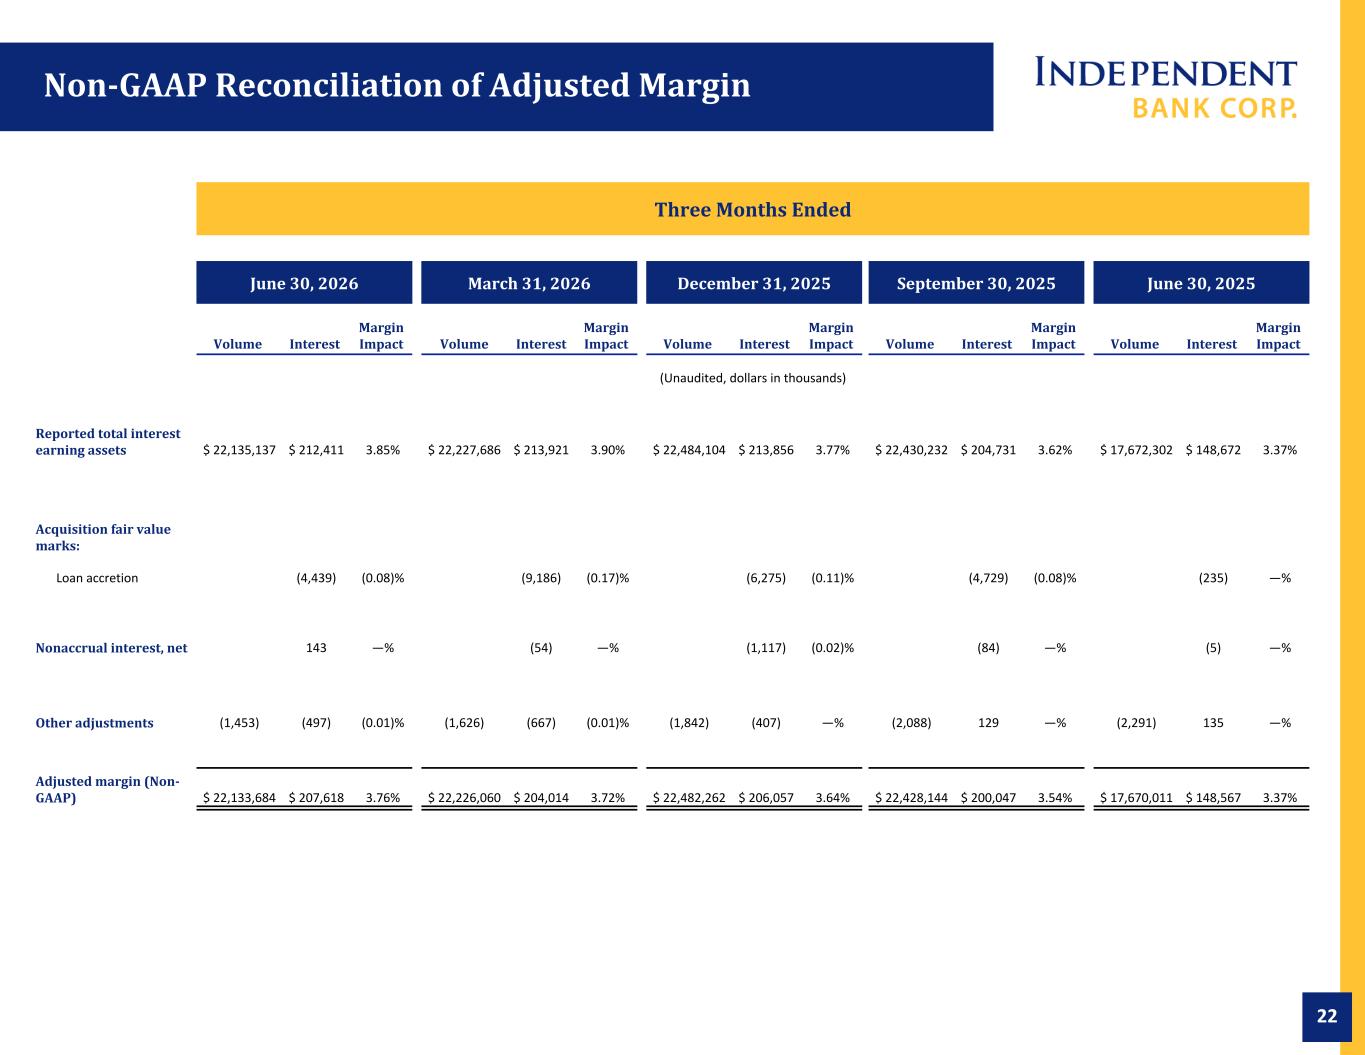
on that note i'll turn it over to mark thanks jeff and to summarize the quarter results EPS' 2026 second quarter net income was $81.8 million and diluted EPS was $1.70, resulting in a 1.34% return on assets, a 9.24% return on average common equity, and a 14.05% return on average tangible common equity. The second quarter results were a great reflection of the bank's ability to drive strong core profitability and return capital to shareholders despite the highly competitive environment keeping loan growth relatively flat touching first on the capital management aspect during the quarter we completed the previous year's buyback authorization and in may announced a new 200 million share repurchase plan during the second quarter we repurchased 75 million dollars in capital, bringing our capital ratios down slightly, with the CET1 ratio at June 30th now at 12.8 percent and the tangible capital ratio at 9.7 percent. Going forward, we will continue to leverage the buyback plan as our primary means of returning excess capital to our shareholders. In terms of the core profitability improvement, the main drivers continue to be core net interest margin expansion coupled with prudent share repurchases. Regarding the margin, though reported loan yields were down eight basis points in the second quarter, core loan yields increased three basis points when adjusted for the exclusion of volatile purchase accounting accretion and other non-core items. And although commercial real estate loan growth has been a challenge, we are originating a significant volume of new loans to offset the paydowns and amortization in this portfolio, and that continues to fuel the cash flow and repricing benefit dynamic in our loan yields. Similar characteristics in the securities portfolio drove an increase of five basis points for the quarter, with increased amortization and maturities expected in the second half of the year. And lastly, as Jeff noted, we are extremely pleased with our ability to hold the line on cost of deposits keeping that flat at 1.36 percent with these all primary drivers the core net interest margin increased four basis points for the quarter i mentioned the challenges in the commercial real estate and construction books but on a positive note as jeff mentioned the second quarter approved commercial pipeline grew nicely to 510 million a 63 increase from the prior quarter and reflects a healthy mix of both commercial real estate and cni on the cni side the ability to enhance our combined offerings to both the smaller and mid-market cni space was highlighted this quarter as cni balances increased 10 on an annualized basis when excluding balance runoff from the exited dealer floor plan business in addition consumer home home equity balances increased 35 million or 11 percent on an annualized basis while residential mortgage activity reflected a nice balance between increased portfolio balances and mortgage banking gain on sale results on the deposit side there's no secret in our industry when it comes to how competitive the environment is we believe the second quarter results are a testament to the amazing deposit franchise that continues to differentiate Rockland Trust. Not only did we grow period end balances at a 5.9% annualized rate, we did so while maintaining a flat cost of deposits. Average balances, however, were down for much of the quarter, which created a temporary drag on our cash position and overall average earning assets. But we are encouraged by the rebound of balances late in the quarter in our consistent quarterly trends of attracting new core deposit relationships to the bank. As a result of the strong core deposit growth, we paid down $100 million of maturing FHLB borrowings while increasing our working capital line of credit by only $25 million. I'll now switch gears to asset quality and I'll highlight the following notable items for the second quarter. Total non-performing assets increased modestly to 103.8 million or 56 basis points of total assets. The changes reflect some normal ins and outs on the commercial loan side and a net $4.7 million increase in residential loans. Regarding the latter, though we are seeing some increased volatility in delinquencies and non-performers, in almost all workout cases to date, there is sufficient equity in the homes and net charge off remain extremely low in this portfolio. Along those lines, net charge-offs for the quarter were only 911,000, or two basis points, annualized, with total year-to-day charge-offs now at only six basis points on an annualized basis. The second quarter provision of $6.3 million and increase in the allowance for loan loss to 1.06% of loans was primarily driven by modest specific reserves on a couple of commercial loans. And lastly, total criticized and classified loans decreased versus the prior quarter as we remain hypervigilant on effective early identification and development of workout strategies on problem loans. Moving to non-interest items, fee income of $42.4 million was up over 5% from the prior quarter. The wealth management business continues to lead the way with AUA at $9.5 billion as of June 30th, driving higher wealth management fees combined with elevated tax preparation fees of $537,000 during the quarter. In addition to wealth, we saw solid fee income growth from our deposit and treasury management services, as well as increased swap volume. On the expense side, the quarter over quarter results reflect a few moving pieces that i'll highlight specific to quarter over quarter trends the second quarter has zero merger related expenses versus three million dollars recognized in the first quarter secondly we incurred approximately 2.1 million dollars of expenses related to the ongoing preparation of our core conversion project versus 1.1 million of similar expenses in the first quarter the The majority of these are consulting related, included in the other non-interest category in our earnings release. After excluding these two items, our remaining core expenses were relatively flat versus the prior quarter, as reductions in incentive expense, payroll taxes, and snow removal were offset by annual merit increases, annual director equity compensation grants, and some other miscellaneous increases. And lastly, as expected, the tax rate stayed relatively consistent at 23.4%. With that, I'll now finish up by revisiting our 2026 full-year guidance. First, we reaffirm our two primary profitability targets for the fourth quarter of 2026. The first is return on average assets of 1.4%, and the second is return on average tangible capital of 15%. percent regarding loan growth given the pay down activity experienced in the second quarter we update our cree and construction full year estimates to now be flat to low single digit percentage decrease for cni growth with minimal headwinds from the exit from the exited floor plan business we would expect to land on the high end of the mid single digit percentage range of the guidance. And for total consumer, we now assume a full-year increase in the low single-digit percentage range. Our full-year deposit growth guidance remains unchanged. And similarly, with the core margin increase as expected for the quarter, we reaffirm our 2026 fourth quarter margin will be in the range of 3.9% to 3.95%, though likely on the low end of that range. I would also point out this range includes a 10-basis point impact assumption from purchase accounting accretion. Our fee income and tax guidance also remains unchanged. And lastly, on the expense side, we anticipate core expenses, which exclude the systems conversion expenses, to be in the $553 to $557 million range, plus the one-time systems conversion expenses to land in the $5 to $6 million total range for the year. And that concludes my comments, and with that, we'll now open it up for questions.
Operator
Thank you. We will now begin the question and answer session. If you would like to ask a question, please press star 1 to raise your hand. To withdraw your question press star one again we ask that you pick up your handset when asking a question to allow for optimum sound quality and if you are muted locally please remember to unmute your device please stand by while we compile the q a roster your first question comes from the line of justin crowley from piper stanler your line is open please go ahead hey good morning guys um i just First of all, Jeff, on the health update, congratulations.
That's really excellent news and thrilled to hear it. I think we all are.
But I wanted to start out on loan growth and maybe just dig into that commercial real estate bucket where the guide was tweaked a bit lower. I was wondering if you could give a sense of what else may have gone into that. beyond, I know you mentioned the payoff activity, but just maybe some detail just on the evolution of the market uncertainty and competition from where we were 90 days ago when we talked through this.
Yeah, I mean, especially in commercial real estate, it feels like the market has continued to get more aggressive as the year has unfolded. You know, part of that is evidenced by, you know, we talked about the elevated paydowns in the second quarter. we had two loans uh in the second quarter that accounted for 120 million dollars of those pay downs um so and what one of both of those loans are refinanced away from us uh and one of them was refinanced uh really on terms and conditions that we were very uncomfortable with um and so that's some of the headwinds that we have when we're trying to to um to grow the commercial loan book um having said that uh as as mark pointed out and i did as well in my comments uh we still originated a healthy amount of commercial real estate in the quarter and um and feel like we can continue to do that in the back half of the year and really would expect uh paydowns to revert back to their more historical levels which is why we think in the second half of the year we could see flat to modestly up commercial real estate balances. It won't offset the first half of the year headwinds, but we think that is a good signal for us in terms of growing the balance sheet.
Okay. And then I guess kind of like, you know, within commercial real estate, you know, I know it's still early days here, but what have you been hearing from borrowers in the wake of the decision we got just on Massachusetts front control? You know, I guess any read on how that could impact the commercial real estate market and just overall level of activity in the state?
I think it's a little too early to say that we've seen a big increase in the demand for multifamily construction. We have seen some asset sales that I think maybe wouldn't have occurred had that news not come out. But we do expect that there will be more activity as we move through the second half of the year in that in the multifamily construction space and of course the it also impacts the permanent market as well to the extent that there are sponsors looking to sell their multifamily business then the cap rates have likely come in a bit because of the the rent control ruling so too early it's all but we but I do think as we move through the balance of year that we'll see an increase in activity okay got it that's helpful um and maybe just one last
one on credit um as you guys pointed out you know overall looks like some stabilization you know if not some improvement in a lot of areas and i know there's some moving parts but i guess just in the not performing bucket um you know with the growth inflows picking up a bit over the last quarter um you know curious if you could talk through some of what you saw there and then uh just some color or on the payoff that kind of helped keep a lid on that net increase for the period.
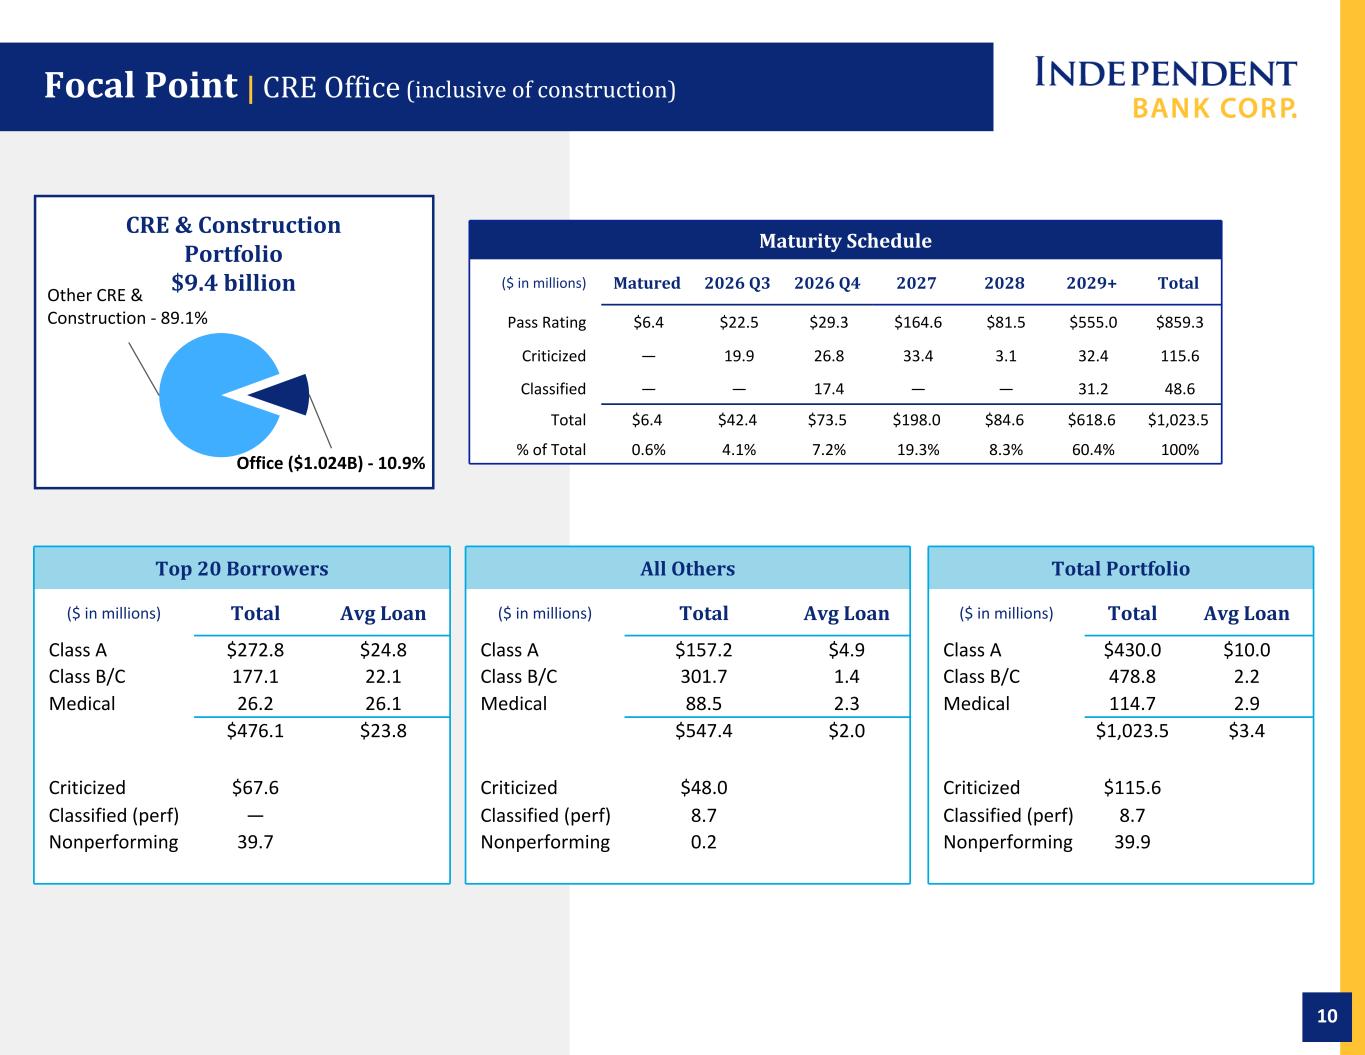
Yeah, I mean, the story on the non-performing asset side on the commercial is fairly benign. I'd say the biggest movers was the actually resolution and pay down of one office non-performer that we were talking about last quarter. That was about an $11 million loan that had been charged down to that came off the NPA list and and we had one new one go on at about 14 million dollars um and and you know outside of that there was very little movement within the commercial bucket i did mention in my prepared comments what you're seeing really is the primary driver of the increase is a bit of an uptick on the resi side but you know it's it's interesting as you as you go through each case um you know you're seeing a dynamic where you know the consumer will often suggest that the mortgage payment is one that they're willing to to delay while still spending in other areas so believe it or not we have a lot of what we would call chronic non-performers where they make periodic payments throughout but it's not at a consistent pace where you can establish putting them back on on accruing status so in all cases you know there's plenty of equity in the homes we don't see really any emerging loss dynamics in that segment you're just seeing a little bit of payment um you know or you know payment issues where delays are picking up a bit in terms of delinquencies and npas one other comment i'd make yeah sorry just one other comment i'd make on our non-performing bucket is is the largest non-performer uh which we've talked about multiple quarters continues to improve and and we think there's a chance that it could return to performing status by year-end so we're encouraged by the the progress there in fact it already started to make interest payments in July so there's an 18 month no payment period that respectively started last January of last year so that 18 months has come due and they are starting to make the interest payments.
And one other comment on the rent control that you asked about, Justin, and just to be clear, the organization that was putting that forward, they can come back in two years. So that's the, I'm not sure what the legalese is around that, but they'll have the ability in two years to reintroduce that as a ballot matter.
I guess just on that one large non-performer that you called out do you have you know how much what is the balance of that um right now i'm not sure if you have it handy the largest one that's been on non-performing yeah correct yeah that's a 22 million dollar large syndicated loan we had taken a fairly sizable charge off on that um down to that balance 22. okay perfect i will leave it there.
Operator
Your next question comes from the line of David Conrad from KVW. Please go ahead.
Hey, good morning. And I'd also like to say, Jeff, congrats on your health. It's great news.
You bet. Mark, some questions for you. I mean, I think the quarter really isn't about the NIM, but it's about the balance sheet. And because of the developing deposits, I'm looking, you know, cash bounces around $730 million EOP last quarter, $530 average, and now we're up to a billion EOP in cash with kind of flat security. So, kind of when we think about, you know, the guidance in the back half of the year, I guess my key question is, you know, how quickly, what do you think cash and securities, that mix shift, what will that end up, do you think, by the end of the year? How quickly can you kind of remix that?
Yeah, no, it's a great question. And we're already remixing that into securities right now. I mean, ideally, we'd like to see that obviously get redeployed into loan growth, but we absolutely will be more aggressive in putting more of that cash balance into the securities bucket. So ideally, I would say targeting earning cash in the $400 million to $500 million range will be a bit – we'll monitor the pipeline and see how much of that we get comfortable should get redeployed into loan growth. But I would expect you'll see us – you'll certainly put more of that back into higher-yielding securities.
And then you also have, what, about a half a billion or so rolling off in the second half, like sub 2%, right? That's another benefit.
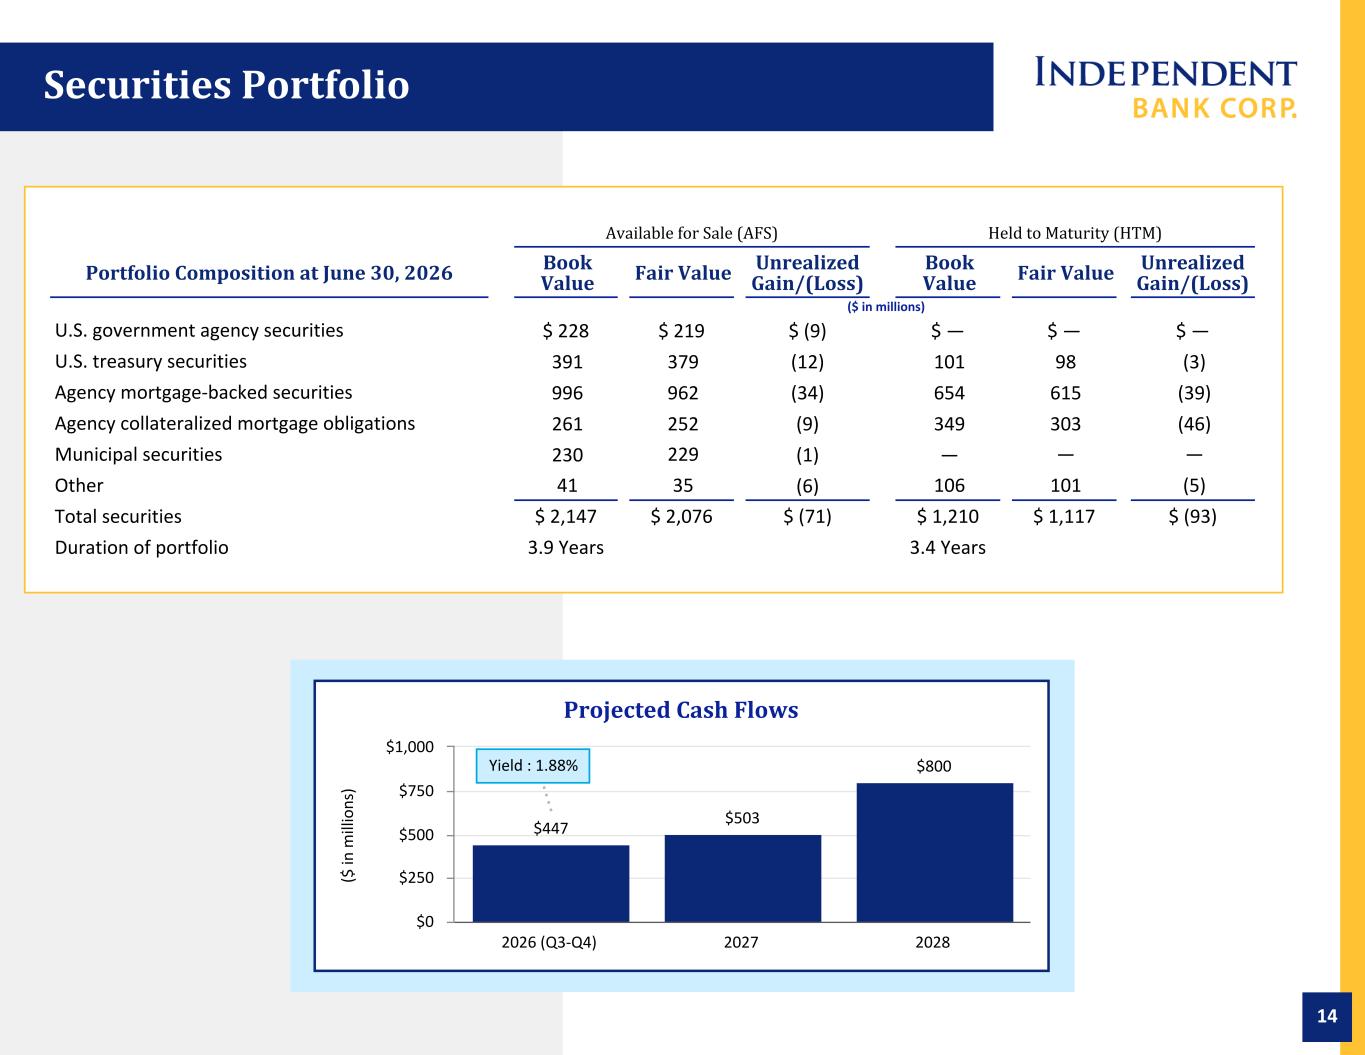
No, no. You're fine. It's interesting. In the second quarter, you only saw about 70 million of runoff in the securities portfolio. 45 million of it happened literally on the last day of the quarter. We had a Treasury security mature at 87 basis points. So, you know, the five basis point lift you're seeing in the securities book for the second quarter, I'm very, very comfortable suggesting that's a low point in terms of a quarterly increase. You know, the $200 million in the third quarter, $200 million in the fourth quarter, give or take, at 2% coupon, you know, that should create more like a 15 basis point lift each quarter, all other things being equal. and I would think we can go even more north of that if we're putting more purchases into the book as well.
Got it. And what yields are you looking at now with the improved yield church?
Yeah, I mean, we're still looking mostly at deep discounted MBS that give us sort of downright protection, but as the rain environment and expectations are starting to shift more, we're more comfortable taking on a little bit more duration so call it high fours five percent on new purchases perfect thank you appreciate it your next question comes from the line of steve moss from raymond james please go ahead good morning guys you know jeff just to echo what's already
been said congratulations on your health here you know great news there um thank you Definitely glad to hear it. In terms of just the, you know, going back to the loan pipeline here, just kind of curious on the, you know, has the mix shifted to more CNI in the pipeline on that 510 million number or is it kind of similar to what you guys disclosed in there in terms of what was originated for 2Q? And just one other thing to throw in there, just curious on where you're seeing loan pricing these days.
Yeah, the mix is, I would say, has shifted to CNI slightly in the pipeline. Part of that is we had a number of approved loans that, honestly, we thought were going to close in the second quarter, and they didn't, and they slipped into the third quarter. So that's one of the reasons why I think the CNI pipeline is a little bit higher as a percentage of the overall than maybe it was in the first quarter. But I think we expect to see good originations in both asset classes, CNI and CRI, as we move through the second half of the year.
I'll add on, and the good news is as more of that pipeline has shifted to CNI, it's primarily more floating rates. So we've seen new originations on the commercial space move up into the mid-6% range. In the pipeline, I have the data. It's about 50-50 CRI CNI today. I can't recall off the top of my head last quarter if it was materially different than that. But to Jeff's point, it probably continues to tick a bit more up C&I versus CRE from a mixed standpoint.
Okay, great. Appreciate that color there. And then in terms of capital deployment, you guys bought back 2% of shares outstanding here. Just kind of curious how – and capital ratio has barely moved. I'm just kind of curious as to, you know, how you guys are thinking about the payout ratio here going forward on a combined basis. You know, do we think about it as 100% of quarterly earnings or maybe a bit more than that, just given where your capital ratios are at the moment?
Yeah, I'd say 100% is the minimum, Steve. And I think ability to do more, I talked about this in the past, but, you know, where a lot of that I would like to fund via earnings. in a bank holding company structure, dividend funding up from the bank to the holding company allows us to execute buybacks in a much more economic efficient way. I'm not against borrowing to execute more buyback than that, but that's the calculus we'll go through each quarter to see how aggressive we want to get in terms of returning over 100% of profits.
But it's appropriate question to ask obviously the growth has been challenged so we are we are definitely committed to to executing the buyback in an aggressive manner okay appreciate that and then you know on on expenses here just kind of curious obviously got the conversion coming up in october um you know but it kind of seems like your underlying core expense run rate would be fairly stable call it 138 139 ish you know as you kind of look at going forward i know you guys been looking to hire people and add more talent, how do you think about your investments and maybe your expense growth rate a little further out here?
Yeah, I mean, I think, as Jeff said in his comment, the mentality here is sort of a hold the line type mentality, meaning we can't take our foot off the pedal in terms of thinking about AI and technology investments. And that's part of what you're seeing, you know, even in the last couple of quarters is increased IT spend and talent in those areas to help develop, you know, some of the technologies that we know we'll need to deploy throughout the bank internally. So, you know, it's looking for opportunities to, you know, find areas to reduce or get smarter on and other spend across the bank. So, you know, I think it's still supporting the infrastructure that we think we need to be a bank that continues to grow in this space but we need to find you know the offsets to to make sure the expenses are held in check okay great i appreciate all the call there i'll step back in the key here thanks guys okay thank you your next question comes in the line of laurie hunziker from seaport research partners please go ahead yeah hi thanks good morning jeff messengers Sorry.
Yes. Congratulations. I'm so, so happy to hear that news.
Just wanted to wanted to maybe start over with margin and deposit. Just want to make sure I'm thinking about this. Right. So as I as I look late quarter, you guys actually had a jump in your money market. You know, I mean, the line held flat on an average basis that I'm talking about the rate. Right. So the rate went from 206 to two pounds.
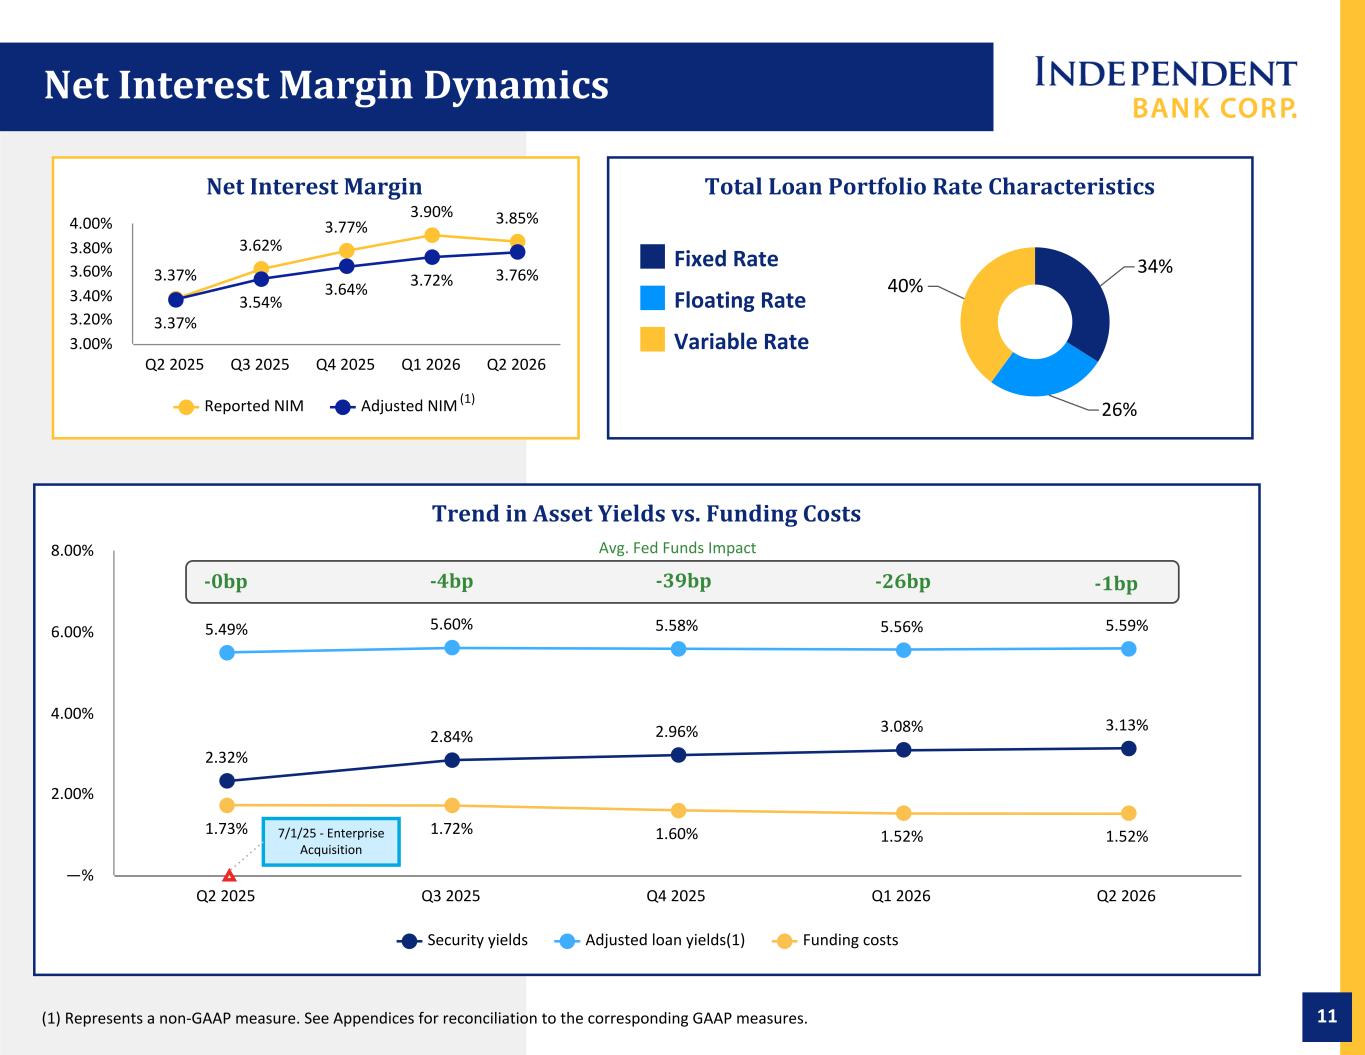
So direction a little different than what we're seeing. is it just so competitive you're paying up or was that a special or how do we think about that yes it is um we have a a money market special that we introduced into the market you know i'd say halfway through the second quarter and that that is a four percent sort of short-term money market rate so it's not surprising laurie we're seeing some of the new money come in on that special. So it's been pretty equally balanced between, you know, DDA low cost deposits and higher rate promo money. But, you know, I'll be fully candid, you know, we would expect the cost of deposits to tick up a bit in the second half. I'm still comfortable with the fourth quarter guidance range that we gave with the margin in the 390, 395 range. But, you know, our spot cost deposits in June was at 1.38%. So I think you'll see a little bit of pressure on the cost of deposits in the second half.
Okay, that's helpful. And then what was your spot margin?
It was, so spot margin for June stayed at 376, which is what the full quarter was despite that cost of deposit increase I just mentioned. So we're still seeing the asset side repriced to offset that.
Great. Okay. So 376, and that's obviously excluding the accretion.
Exactly. That's a core number. Correct.
Okay. Okay. Great. And then just going over, back over to office. So you're down to, you've got the two office non-performers, obviously the 22 million, which you've talked about for some time. And I just want to make sure I heard that potentially goes current in the fourth quarter?
By year end, potentially.
By year end. Okay, okay. And then the $18 million office that remains, that's the life sciences loan?
In classified? I think in non-performing. In our non-performing? No, the $18 million is the, that's a loan that had moved into non-performing last quarter we had taken a reserve on it. We're in the process of brokering that for sale based on some updated BOVs. That's one of the two properties we actually put a bit more reserve on. So we're hoping to get that resolved in the second half of the year.
That's a $17.4 million balance, but that has a full reserve on it based on our updated BOVs. okay but that one is that one the life sciences that's the one where you had a large tenant or is that a single tenant like it's a single tenant like it's not the labs that has been built up and now has new tenants in it this is a another life science um single tenant uh facility gotcha gotcha okay and then next quarter i'm just looking at page 10 and i love all of your details here, and this certainly was unchanged from last quarter, but the $20 million that's criticized that matures in the third quarter, is there anything that we should be thinking about there, or how are you looking at that?
So the third quarter criticized levels is primarily two loans. Give me one sec here. Let me just make sure I'm getting you the right data here for the classified. So we have basically the classified is the loan we just talked about within the other criticized is $26.8 million. It's two loans. One is $17 million. The other is $10 million. You know, we're both, you know, we're working through on both of those for a resolution. we think one of them would likely either refinance out as that becomes reaching maturity and the other I believe is likely on on track to see sort of a short-term extension so both of those right now based on the data we have we don't see any imminent loss exposure on them but we are looking for either short-term extension or hopefully refinance out on both okay yeah so that's okay so that's the 27 and the 17 for we talked about and sorry the one that comes up in the third quarter the 19.9 million criticized that's maturing in the third quarter third quarter is also two loans yeah so sorry third quarter is also two loans um one of them is 14 million the other is about five i'd say the 14 million dollar loan we're also working with the broker to sell that property um based on data now we we do expect full payment um so we hope to get out of that here in the second half the five million dollar loan um you know that that one's a little bit uh of a different situation it's it's anchored by one primary tenant who um you know is is indicating they may be leaving the space so if that ends up happening
we would expect that that will have maybe a modest impact on the valuation so right now there's no loss reserve on that okay and then jack you you um you've you've now held i think for um at least a quarter maybe two quarters that were seventh inning on office which is still long seventh inning are we close to the eighth how are you thinking about it uh i yes it still feels like we're in kind of this long seventh inning.
I am encouraged, though, by the amount of work that we're doing that I think is going to, over the next couple of quarters, hopefully bring down the office loans in our criticized and classified buckets. We have an awful lot of energy around moving as many of those out as we can. So hopefully we can get into the eighth and ninth inning before too long. But we still have a lot of work to do, but we're doing the work. And I think we'll have some positive outcomes over the second half of Okay.
Okay, great. And then just income statement, just two questions here. Non-interest income, it looks like, you know, outside, outside fully fully death benefits and sort of outside loan level derivative. I mean, if, if, if we're looking at, at your projected numbers of increase, do you exclude that fully death benefit?
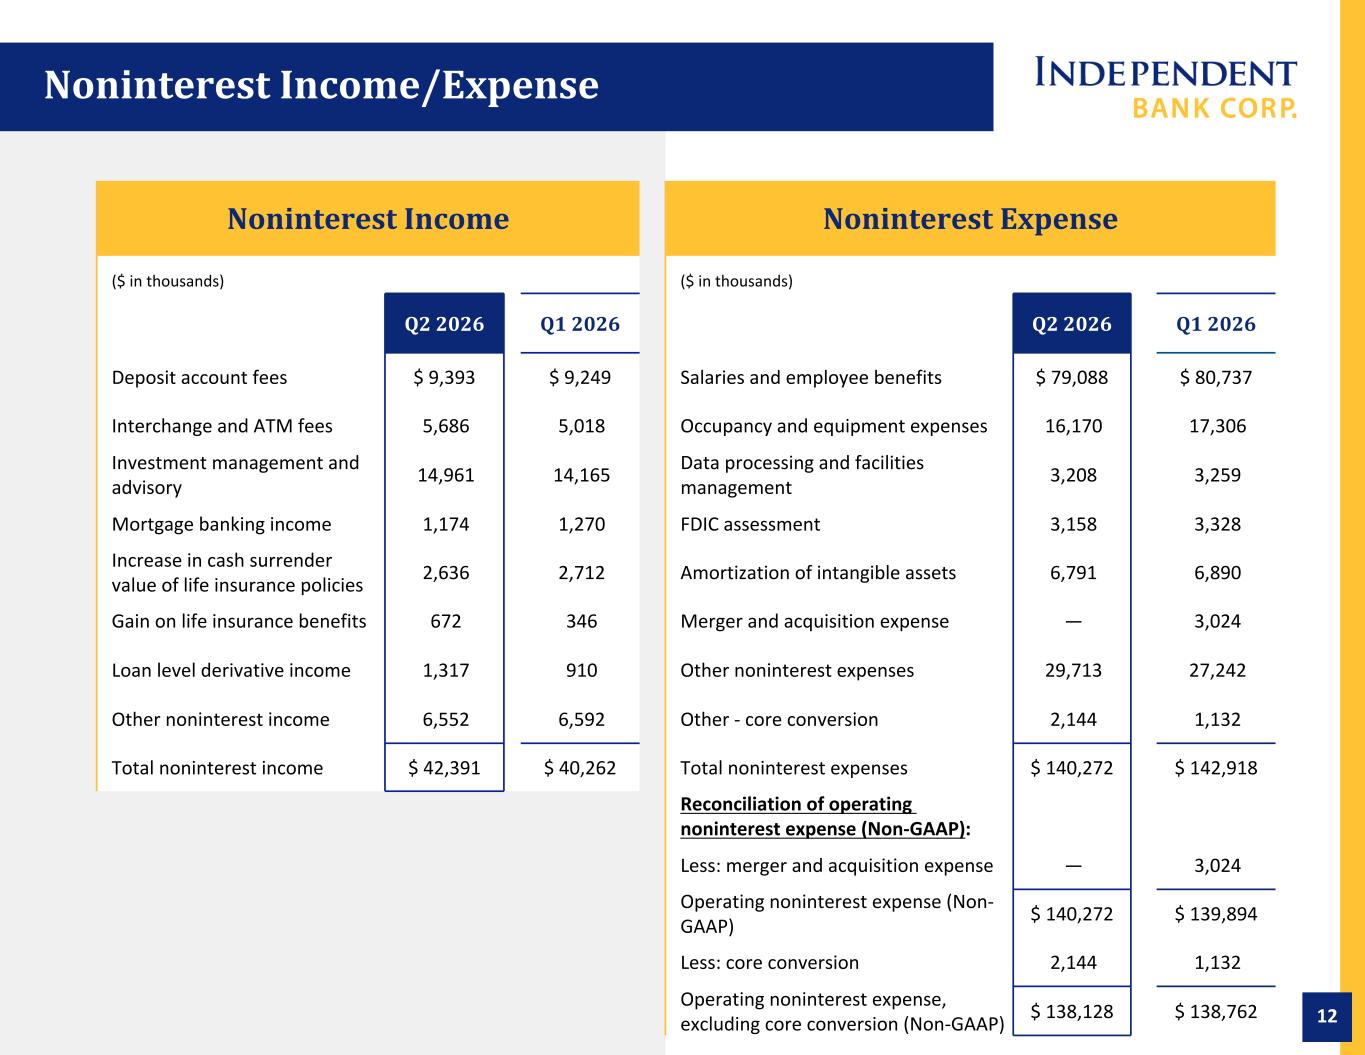
Or maybe a better way to ask this, you know, if we're thinking sort of about a core number of 41 and a half, 41.6 million would be a closer number with the quarterly run rate um yeah i mean i think you'll you'll lose a little bit of tax prep fees in the third quarter obviously off of the second quarter numbers but i think a lot of the other major components whether it's deposit related fees interchange atm those all should be you know pretty consistent and continuing to increase modestly so i think i would expect to see us you know pretty consistent with q2 results all in if okay and then on the
foley side it's pretty modest right so i think you know i think even with or without that you should stay in that you know 42 million dollar plus range okay okay and then last question for me um on your expenses so the core systems upgrade was a million and then you mentioned another million um that was that was non-recurring in the quarter i guess just what was that and then if we look at the core systems upgrade relative it looks like you you sort of upticked your spend a little bit there we're going to have maybe a four million dollar charge in the third quarter being into that right or are you still going to take some of that in the fourth quarter because
it's an october event how should we think about that yeah so just to be clear we had one point 1 million of core charges in the first quarter that increased to 2.1 million in the second quarter so we're 3.2 million all in already year to date so the 1 million dollar reference is the increase quarter over quarter but both quarter had had meaningful charges in there um in terms of the remaining so call it three million you know two to three million dollars i would expect most of it to be in the third quarter, Laurie, because the conversion date is in October. You may see some added consulting expense in the fourth quarter to help with, you know, whether it's call center or other sort of customer-facing work that we would expect post-conversion, but I would imagine the bulk of that will be in the third quarter.
Okay, great. Thanks for taking my questions.
Thank you. your next question comes from the line of matthew breeze from stevens incorporated hold on please good morning everybody uh jeff i'd be remiss if i i too didn't congratulate you on that it's a health news feels a little out of tune hopscotch to nim and long growth dynamics but very glad you hear the news everything else i suppose is secondary um mark you touched on a little bit deposit competition. I guess I'm curious, you had mentioned the spot rate, I think, is 138. Should we expect that kind of cadence, maybe one or two BIFs of deposit cost increases through the end of the year?
And then as we think about, because you're also growing DDAs, as we think about kind of the all-in new money rate for deposits, what is that relative to where you're at yeah yeah i i think your first question is spot on um there matt i would expect you know i mean we're already talking about two basis points in terms of that spot rate number i gave but you know i'd like to see us you know counter that a bit and kind of keep that in check through the third quarter and and probably even a little bit more pressure heading into the fourth quarter So when I look out into the margin guidance and reaffirming the 390 to 395 range, I'm comfortable suggesting that with an expectation you could see cost of deposits, you know, tick up towards 1.4, 0%. I think there's still enough asset repricing benefit and, you know, with some growth, hopefully on the commercial side, you know, I think you land in the low end of that range, even with some of that cost of deposit pressure. And the reason we're seeing that pressure, you hit on it in the second part of your question, you know, we're seeing basically almost a 50-50 kind of DDA plus promo money, you know, driving those new deposit results. So that's going to create sort of an all-in weighted average cost on new deposits, call it around 2%. So as the deposit environment, our deposit situation has stabilized significantly through June, I think it's prudent for us to revisit sort of the promo strategy and make sure we're finding the right sort of marketing and, you know, I guess new sales efforts to keep that new cost of deposit in check. um so you know i don't want to promise anything quite yet out of the gate but we recognize you know the more that comes in on that promo money the more pressure that puts on cost of deposit so with with the you know the modest growth and the the nice lift we got through june i think it gives
us the opportunity to get you know a bit more tactical on that front in the second half okay okay and then just a follow-up mark on the nim you know when you model it out how much longer might we see the fixed asset repricing benefits flow through to the NIM? When do you think it starts to peter out? And I'm particularly focused on 2028 as, you know, loan yields kind of spiked in 2023. And just my gut is that we start to see some of those benefits from 23 roll off in 28. And I'm curious if that kind of aligns with what you're seeing.
It does. It does. I think there's a there's certainly additional repricing benefit both on the securities and the loans through 2027 and i would suggest early 28 is when you start to see you know most of that really low coupon um not not impacting as much okay um jeff one for you you know kind of marrying two two ideas together and considering your background um and the continued disruption in Connecticut with Webster being sold.
Is there an opportunity for you all to kind of expand the geography, start to hire or de novo in Connecticut, considering how many folks you're close to there? I would also throw in hiring and or M&A, but I think I know what the M&A answer is going to be.
Yeah. So the M&A answer would be the same as it's been in past quarters. And I think DeNovo branching would probably be a ways off. But having said that, we're having active dialogue with some of the people that are in Connecticut that I know. And honestly, you know, we've done this in the past. Our head of commercial banking, Jim Rizzo, I don't know, Mark, how many years ago this was, that um we established you know effectively an lpo and providence and um experienced a lot of success there and um and so we're having conversations uh as we speak about uh thinking about doing the same thing in connecticut which um again which we have confidence we can do because we've done it before but it's it's all about the people we wouldn't do it if we couldn't get the right people on the ground that we felt confident could could build a business would that be a um uh like a hartford play or more northern connecticut uh could be hartford um it could be you know new haven fairfield county uh at this point um we've been open-minded about it as we've been having discussions with various people um our preference it would probably be hartford just because it's closer, but not exclusively.
And then last one for me, wealth management, a good quarter. Nice to see AUM pick up as well. But as I measure kind of fees to AUM, that ratio has started to creep up in recent quarters. It's now at 63 basic points versus 59 just a few quarters ago. Anything to that?
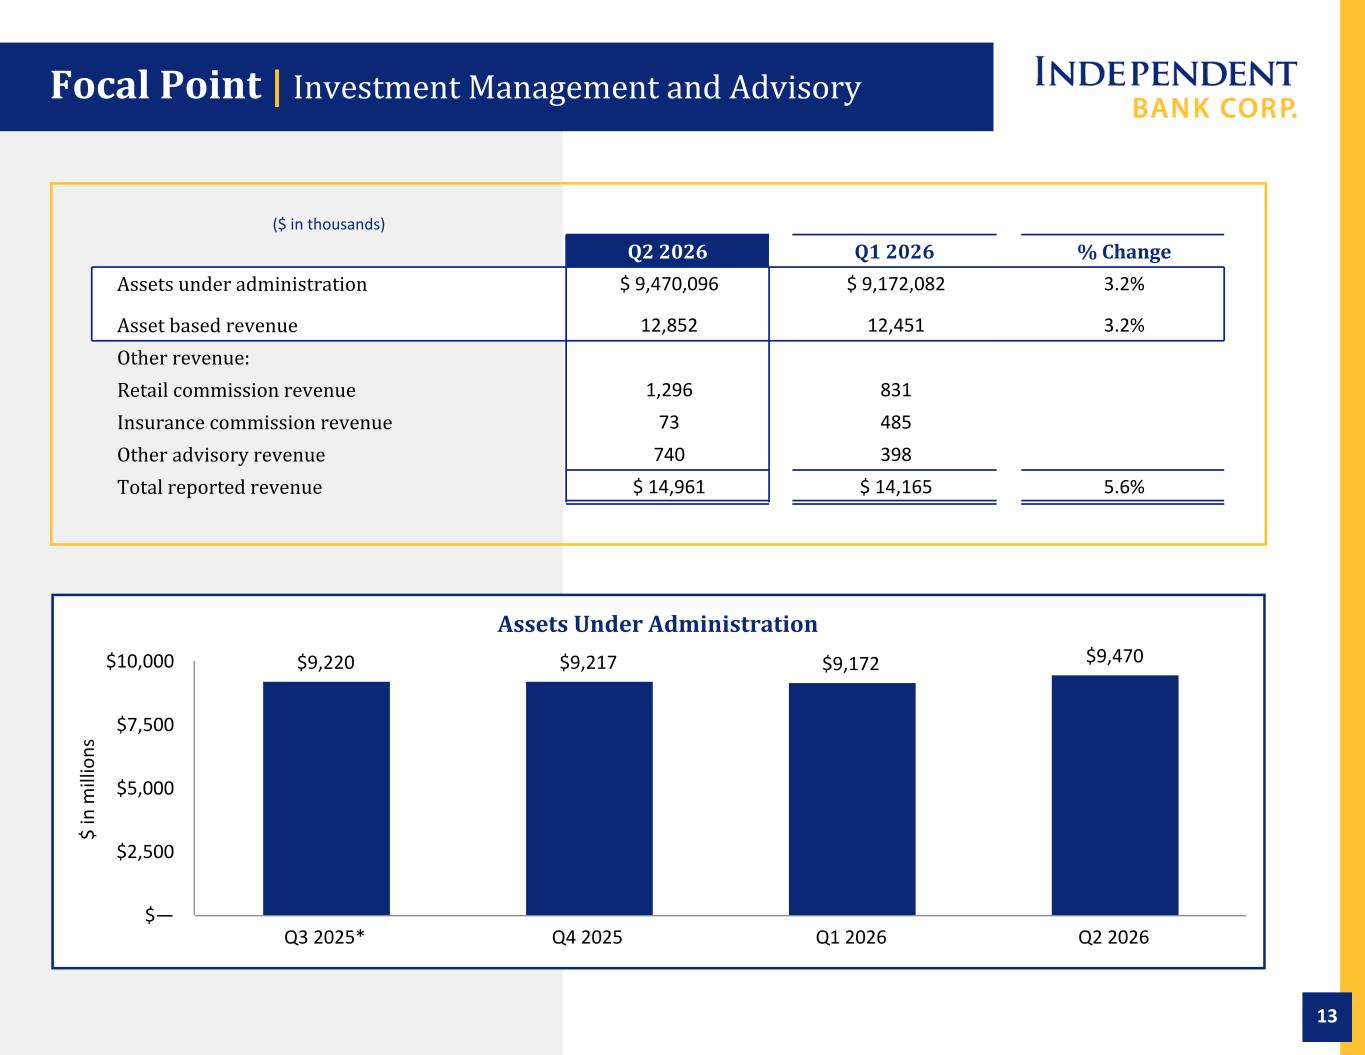
What's going on behind the scenes to drive a higher level of profitability there? and do you expect it to continue yeah i'm not sure i'm at if you're using from an income perspective if you have just what i would call managed money or if some of our other ancillary businesses might be in that revenue number you're using but we've seen our fee ratios stay relatively flat to be honest um over the last couple of quarters so um i wouldn't suggest where we're seeing any dynamic that is driving an increase in fee ratios. I think it just might be other services that we've put into the wealth business that are also giving us some nice lift on the revenue side.
Okay. I can help maybe break that down. I'm using the 14-5-9-6-1. Yeah, I'll follow up with you there. Okay, I'll leave it there. Thank you very much for taking my questions.
Yeah, the 14-9, just so you know, that's an all-in number. If you look at the slide deck we include in the slide, we include in the earnings deck we we try and break out what is you know really tied to the to the aua versus what's um either tax prep we have estate planning we have a business advisory fee services all that is in that 14.9 number cool thank you okay a reminder if you would like to ask a question to please press star one to raise your hand your next question comes from the line of jared shaw from barclays please go ahead thanks good morning and uh congratulations
chef as well that's great news thank you um yeah so i think you know a lot has been addressed but i guess just on the loan side um you know what's what's giving you confidence that that the pace of prepayments on the cre side is going to to slow down in the second half is that uh you know just more of a willingness on your part to to engage or you just you know we're looking at sort of the pipeline of of what's uh what's coming down i think it's both of those things and then i would add one a third which was i mentioned in my comments uh a little bit earlier we had two rather large loans and and one of them wasn't one loan it was a it was two or three different loans
but to one sponsor but um the two i'll call it the two relationships uh totaled 120 million dollars of uh of pay downs incredibly lumpy uh a bit unusual uh in terms of our normal pay down activity so so it would be a combination of those three things uh jared it'd be we don't expect that kind of lumpiness of size uh in the second half and um and and we think we're going to get you know, good originations as we move through the second half of the year. And we're going to continue to defend our existing clients when they're refinancing and be as aggressive as we think is appropriate without doing something stupid. I guess is, you know, so a combination of those factors is what gives us confidence.
We have very few $50 million exposures in the book at all, so to have two of them pay off is pretty...
Yeah, okay. So I guess, you know, if we just sort of look at the expectations for the second half of the year and some of those trends, I mean, you know, when we look at 27, is that the type of thing where we could be mid to high single digit loan growth overall?
I would think mid-single digits overall. If we can get some traction in Cree, I feel very confident we'll continue to generate the kind of loan growth that we've had on the CNI side, and we're just talking commercial here, not consumer, but I think we could get back to the mid-single digits.
And then what's the new loan yields going on right now on the commercial, on the C&I and the CRE side for you?
Yeah, on the commercial side, C&I is mid to high sixes. Cree, probably low sixes. So all in, it was trending around 6.5% for the second quarter. So it's up nicely quarter over quarter. On the consumer side, home equity is typically prime minus 50, give or take on average. And then on the mortgage side, you know, we're still only putting into portfolio both five or seven-one-armed product. We have not opened up 30-year fixed to the balance sheet. So, you know, that's pricing we're staying fairly competitive on in kind of the high fives, call it 6% range.
And then on the DDA side, good trends on growth there. is that is that just you know getting a bigger wallet share from existing customers or you know maybe you could break down what's you know sort of new to bank versus uh versus existing customers doing a little bit more yeah it is both jared um you know we see a lot of seasonality in the second quarter and and this is probably the biggest drop in rebound that i've seen here since i've been at the bank um you know i think to give that perspective we we got probably as low as like 19.6 billion during the quarter so significant rebound a lot of that is existing relationships um and just kind of you know we have a lot of activity on the cape and the islands that's more seasonal um tax time period always creates some some drops and then rebounds so a lot of it was rebounding on existing relationships on the new money um you know We're still very much on the consumer side, community bank driven with a free checking product that doesn't bring in a lot of big single deposit relationships, but it brings in a lot of units and it adds up in dollars over time. so that continues to be a big driver of new money and on the business side it's word of mouth treasury management you know some of the cni activity that we're doing that that's going to lead to you know better full wallet deposit relationships um on the commercial side muni is always a bit volatile we had a you know a big uptick on municipal in june as well but you know that's that's an area that we have a good team on and is sourcing some new wins as well okay all right good thanks and then just finally you know i know it's a relatively small part of the overall number but good good growth in the interchange and atm fees is that anything anything to call out there is that uh you know the impact of of enterprise or is that just sort of seasonality i think a little bit of seasonality i wouldn't say there's anything unique to call out there
Operator
but you know it's it's you know it's a focus on operating accounts that continues to put that debit card in their hand and drive interchange so that's you know it's nice to see that lift play out great thanks a lot thank you at this time there are no further questions i will now pass the call back to jeff tangle for closing remarks thank you we appreciate everybody's interest in independent bank corp have a great rest of the day this concludes today's call thank you all for attending you may now disconnect