Operator
Good day, everyone. Welcome to the RBB Bancorp Q1 2026 earnings call. At this time, all participants have been placed on a listen-only mode, and the floor will be open for your questions and comments after the presentation. It is now my pleasure to turn the floor over to your host, Rebecca Rico. The floor is yours.
Thank you, Kelly. Good day, everyone, and thank you for joining us to discuss RBD Bancorp's results for the first quarter of 2026. With me today are President and CEO Johnny Lee, Chief Financial Officer Lynn Hopkins, Chief Credit Officer Jeffrey Yeh, and Chief Operations Officer Gary Phan. Johnny and Lynn will briefly summarize the results, which can be found in the earnings press release and investor presentation that are available on our Investor Relations website and then we'll open up the call to your questions. I would ask that everyone please refer to the disclaimer regarding forward-looking statements in the investor presentation and the company's SEC filings. Now, I'd like to turn the call over to RBB Bancorp President and Chief Executive Officer, Johnny. Johnny?
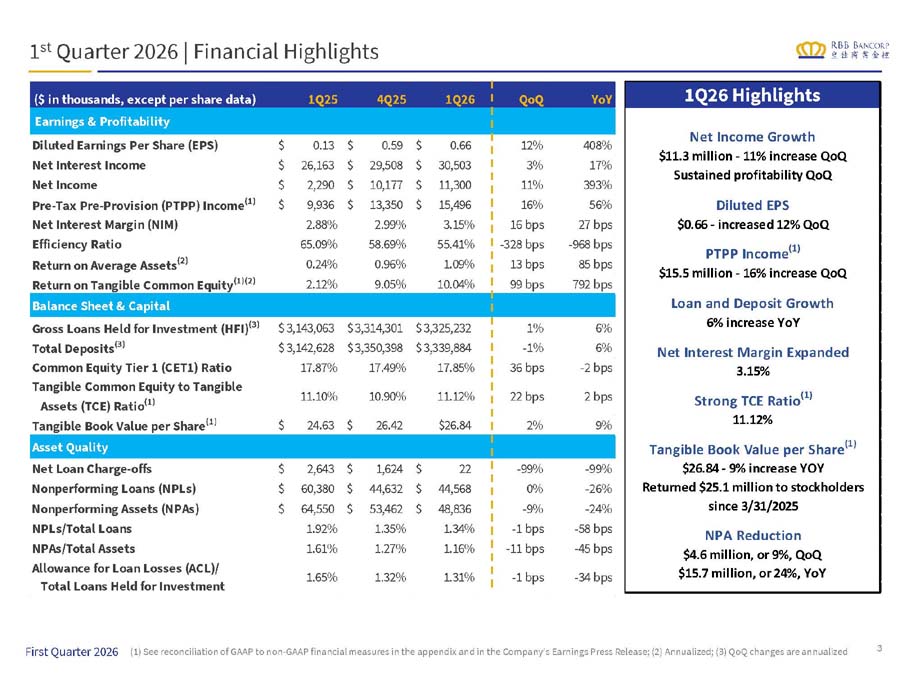
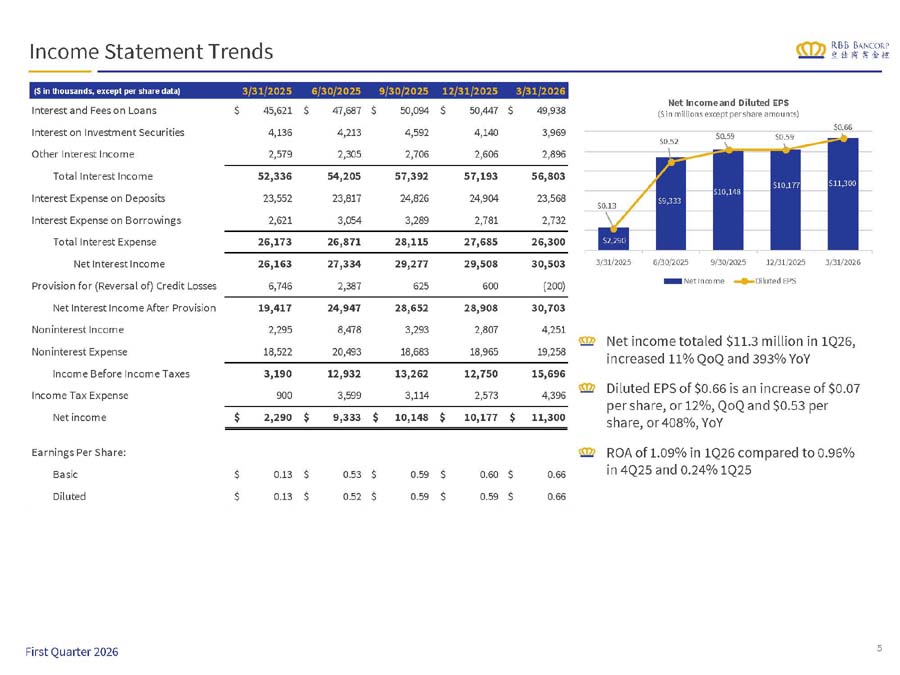
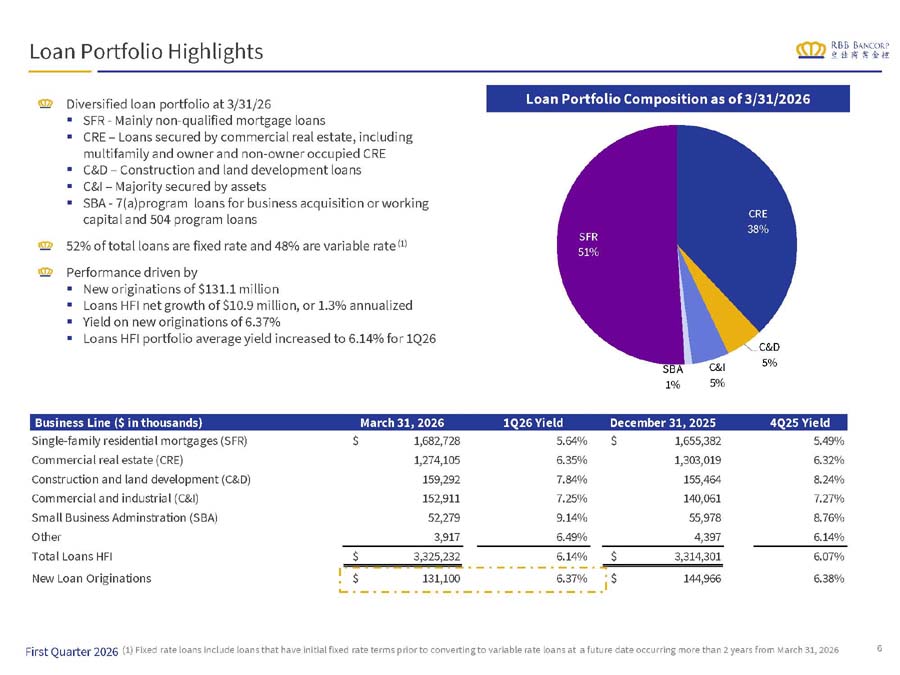
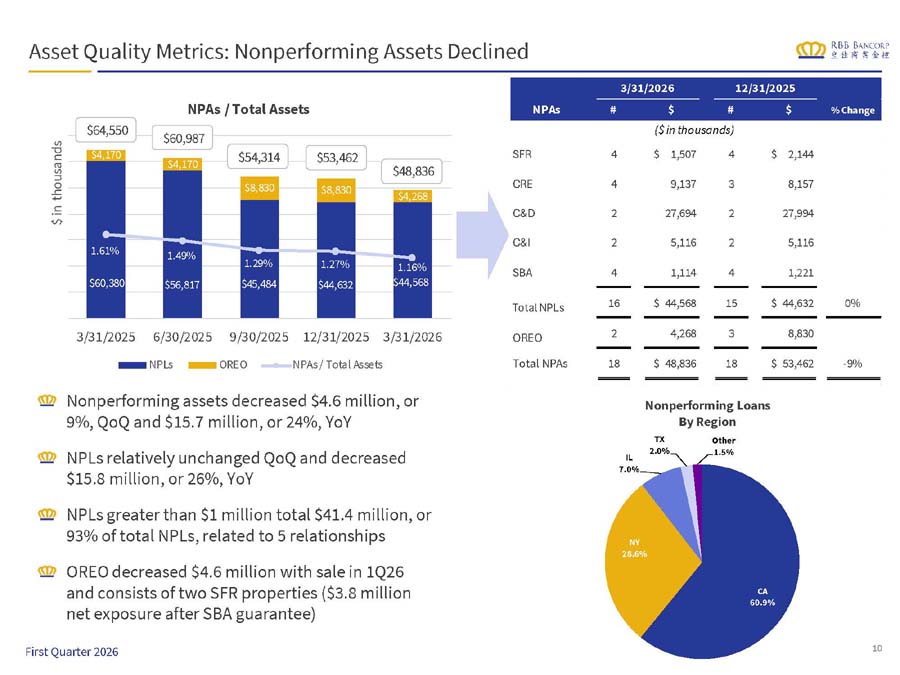
Thank you, Rebecca. Good day, everyone, and thank you for joining us today. The first quarter was a strong start to the year with continued earnings growth, expanding the revenue margin, and further improvement in our credit metrics. We generated a net income of $11.3 million, or $0.66 per share, which was an 11% increase from the fourth quarter and our highest quarterly earnings level in two years. Return on assets increased to 1.09% and we continued to grow tangible book value per year. Net interest margin increased another 16 basis points to 3.15 percent, which marked our fifth consecutive quarter of margin expansion. The increase was driven by both lower funding costs and higher asset yields. Our cost of deposits declined 10 basis points in our spot rate on deposits ended the quarter at 2.79 percent, which gives us some additional opportunity for improvement in the second quarter. Loan growth was more modest in the first quarter, with loans increasing by approximately $11 million, or 1% annual loss. We originated $131 million on new loans at an average yield of 6.4%, but that growth was offset by elevated payoffs and paydowns as some borrowers refinanced or sold assets. As we mentioned before, we remain disciplined on pricing and structure and have focused on possible growth. Our pipelines remain healthy, and we continue to believe we are positioned to deliver stronger loan growth over the balance of the year. Deposits declined slightly during the quarter due to a reduction in wholesale deposits, but this was more than offset from a quality standpoint by another quarter of growth in retail relationships. We also continue to make progress on credit. Non-performing assets declined 9% from prior quarter and are down 24% from a year ago. Overall, we believe the first quarter reflected continued progress in returning RBV to its historical levels of performance. We continue to focus on disciplined growth, maintaining strong credit quality, and increasing long-term shareholder value. With that, I'll hand over to Lynn to talk about the results in more detail.
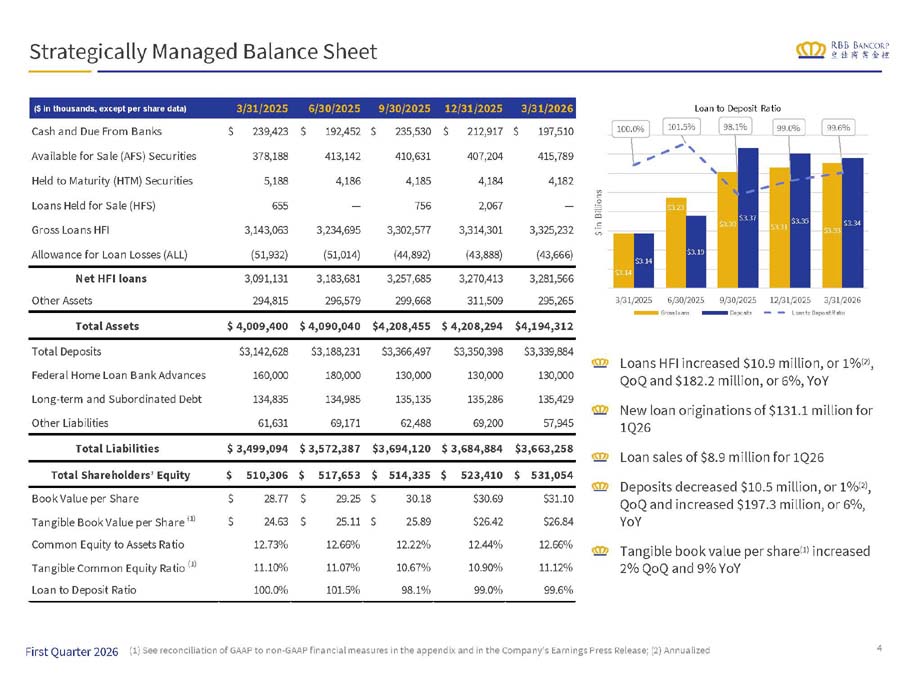
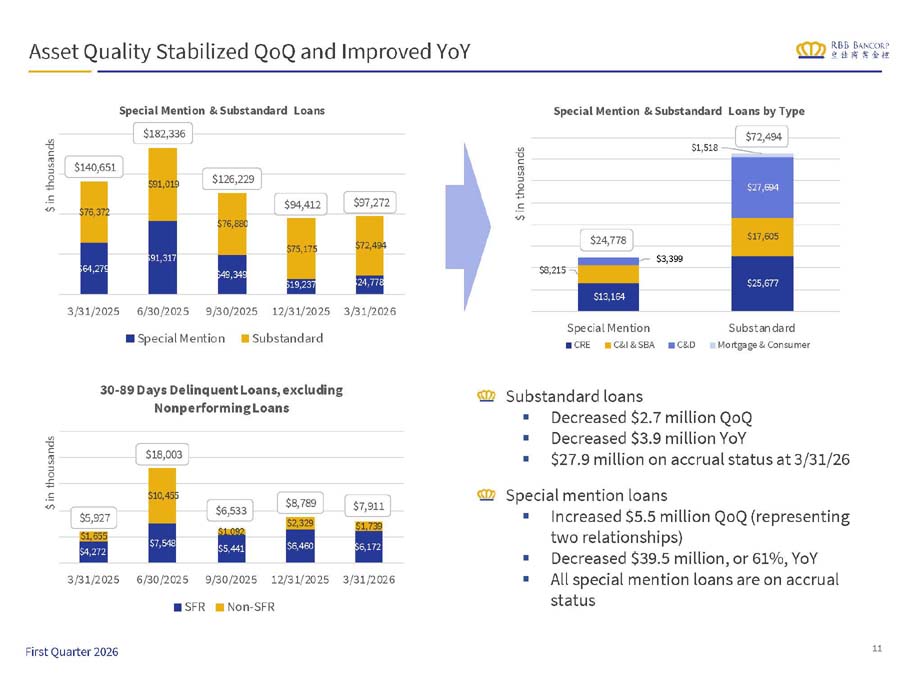
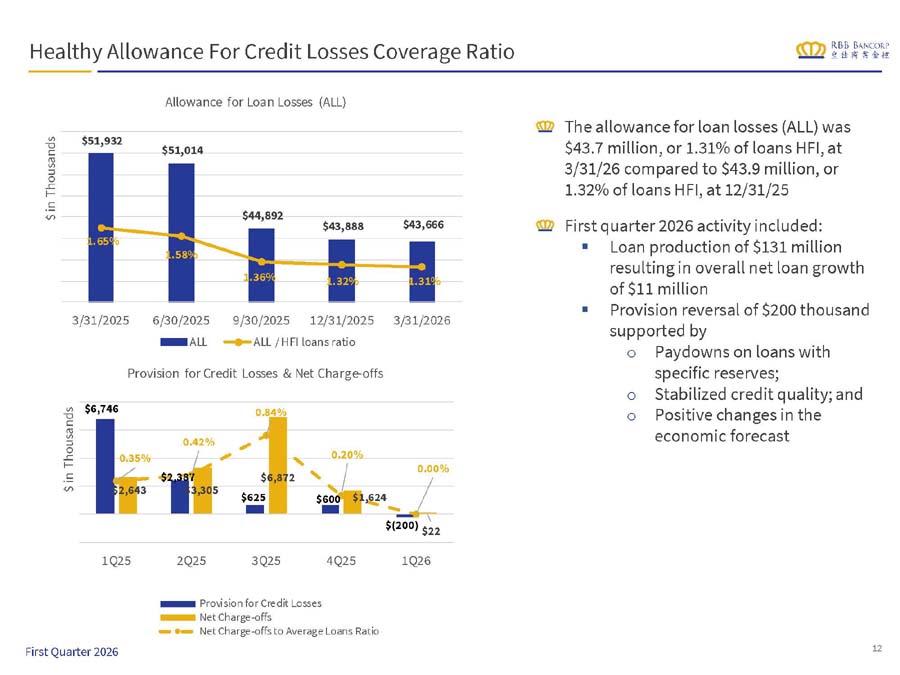
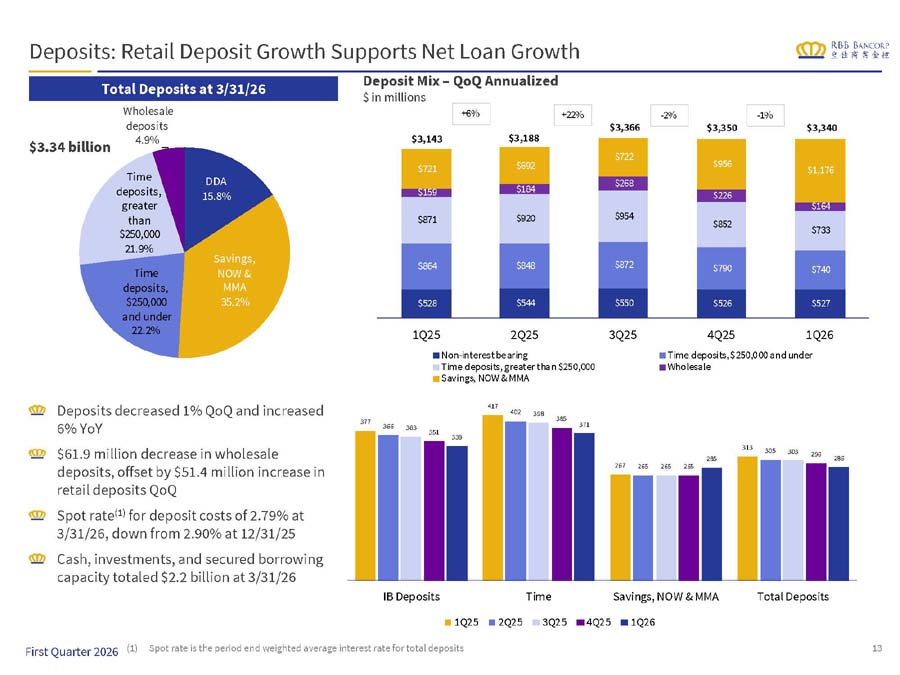
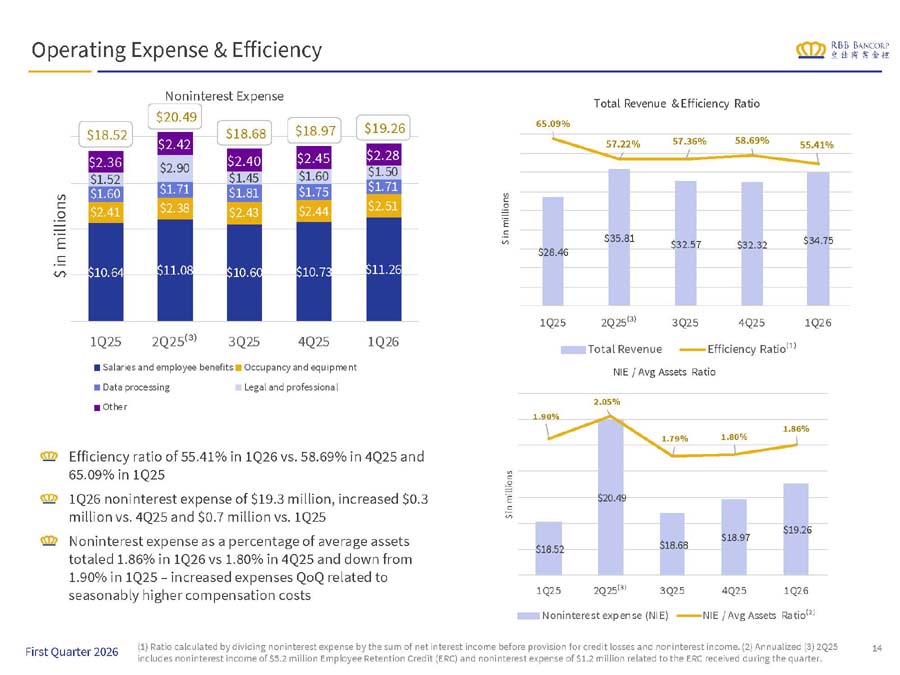
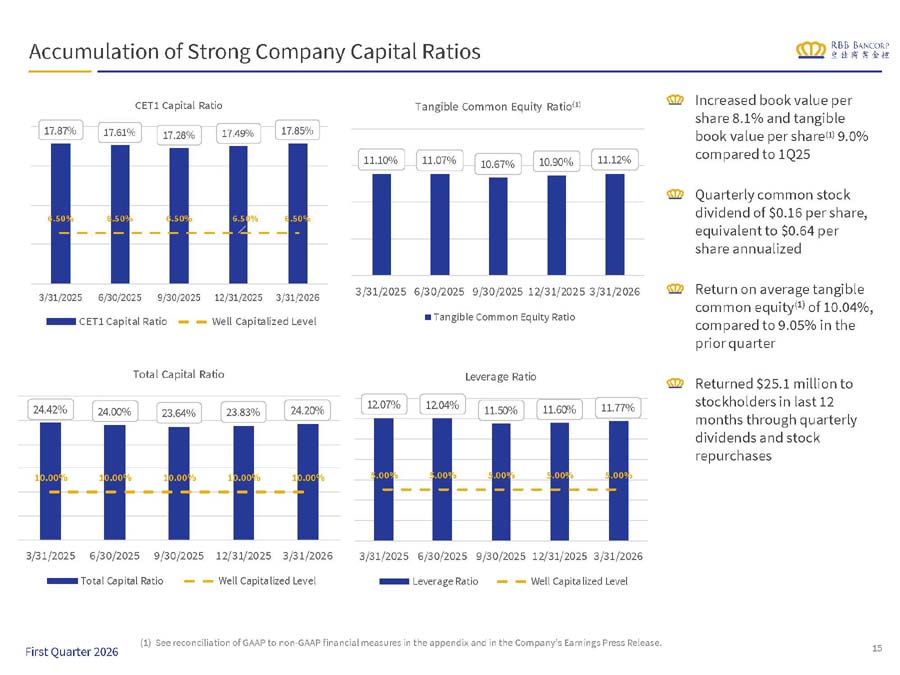
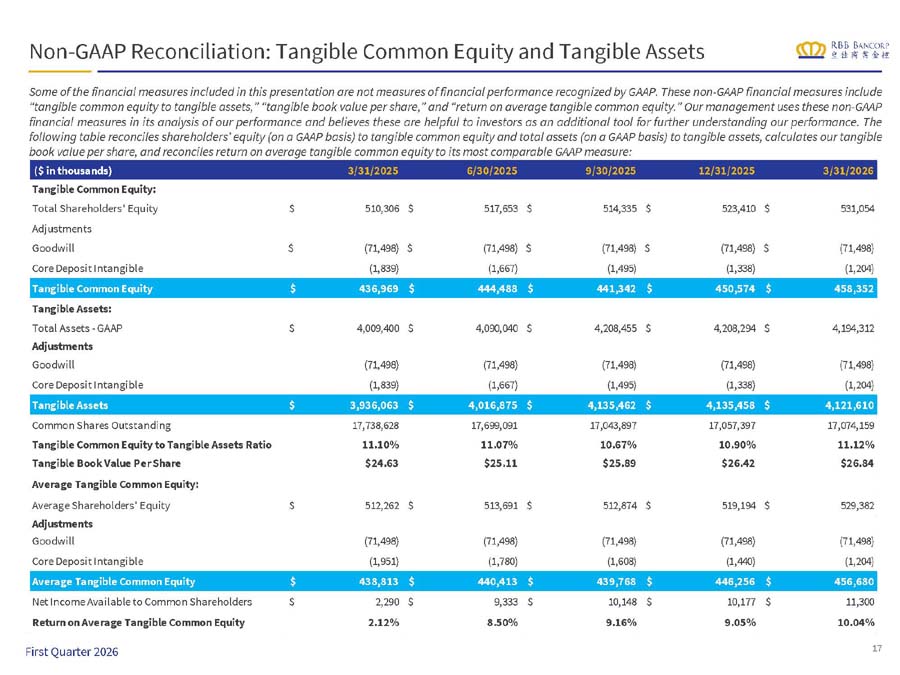
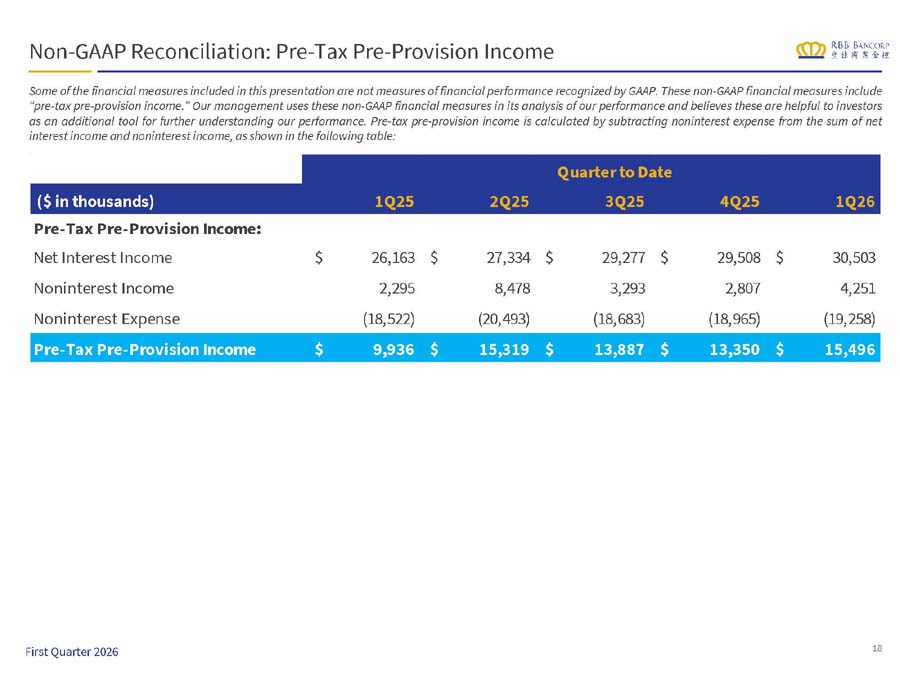
Thank you, Johnny. Please feel free to refer to the investor presentation we have provided, as I discussed, the company's first quarter of 2026 financial performance as Johnny mentioned net income for the first quarter was 11.3 million or 66 cents per diluted share which compares to 10.2 million or 59 cents per diluted share in the fourth quarter despite two fewer days in the quarter net interest income increased 1 million dollars to 30.5 million and included a 1.4 million dollar decrease in interest expense partially offset by a $390,000 decrease in interest income. The decrease in interest expense is due mainly to the shorter quarter and lower rates on retail deposits as we continue to benefit from the repricing of our deposit portfolio into the current rate environment following the Federal Reserve rate cuts made towards the end of 2025. Retail deposits increased by 50 million and included a shift from time deposits into a high yield savings product the decrease in interest income was due to the shorter quarter and lower cash and securities yields offset by higher loan yields and the receipt of a four hundred and thirty thousand dollar FHLB special dividend our net interest margin increased to 315 in the first quarter from $299 in the fourth quarter. The increase included an eight-basis point increase in the yield on earning assets and an eight-basis point decline in the overall cost of funds. The FHLB dividend added four basis points to our NIM in the fourth quarter. Sorry, four basis points to our NIM in the first quarter. Turning to credit quality, non-performing loans remained basically unchanged. substandard loans decreased 2.7 million and special mention loans increased 5.5 million all special mention loans are on accrual status we had effectively no net charge-offs in the quarter and we recorded a small reversal of provisions for credit losses supported by paydowns on non-performing loans overall stable credit quality and positive economic indicators in the underlying forecast we believe that we are adequately reserved and with credit quality generally improving over the past year we expect future provisions to reflect that not interest income increased 1.4 million to 4.3 million the increase was driven primarily by an $890,000 higher net gain on REO 484,000 in a recovery on a fully charged off acquired loan and 360,000 of interest income on tax refunds related to purchased federal tax credits non-interest expense increased by two hundred ninety three thousand to nineteen point three million do mainly to higher payroll taxes and employee benefit costs at the beginning of the year even with the increase our efficiency ratio improved to 55% from 59% in the fourth quarter. We expect non-interest expense for the next few quarters to be in the 18 to 19 million dollar range. Turning to the balance sheet, total assets for 4.2 billion at quarter end. Loans held for investment increased 11 million since year end and deposits declined 10.5 million. Importantly, the mix of deposits continue to improve as we reduced wholesale funding and grew lower-costing retail deposits. Book value per share increased to $31.10 and tangible book value per share increased 2% to $26.84. This concludes my prepared remarks. Kelly, we are now ready to take questions.
Operator
Certainly. The floor is now open for questions. If you have any questions or comments, please press star 1 on your phone at this time. We ask that while posing your question, you please pick up your handset if listening on a speakerphone to provide optimum sound quality. Please hold for just a moment while we pose for questions. Your first question is coming from Brendan Nozzle with HubD Group. Please pose your question. Your line is live.
Hey, folks. Hope you're doing well. Thanks for taking the questions. Hi, Brendan. Nice to see a continued workout on the asset quality front and improvement there. So I guess I just want to start my questions on that front.
Operator
Yes, it did. Hold on one moment. Brendan, your line is live.
Can you folks hear me now? Okay. Sorry about that. maybe just starting off on asset quality, you know, nice to see continued workout and improvement in ratios this quarter. Can you offer a little bit of color on some of the larger non-performing assets you still have kind of in the workout process? And then to the extent that you're able to continue to work those out, you know, what do you view as a normalized kind of reserve to loan ratio as you work through the noise?
So I start with the end of your question and we'll go backwards. We, well, first we'll acknowledge we're elevated on our NPLs and we would expect those to normalize down at a much smaller percent of our total loans. I think you are familiar that 90% of our NPLs are represented by the same three relationships so that remains stable or understood and I think as far as a normalized coverage ratio given the composition of our overall loan portfolio we could see it coming down some what relative to the levels it is now but we do go through a robust process and I think we have to take into consideration everything that's going on in the market so I think it has an opportunity to move lower as you recall last year it was much higher with those specific reserves that ultimately you know we did some charge-offs and now we resolve loans so I think that's where we would say going forward with respect to specific comments on the NPL I think I can turn that over to you Johnny or Jeffrey yeah I'm you know actually um this is virtually non-change during the quarter however then there's a there's a reduction of the numbers along so there's to exit one in and then the
the one that those assets are those are successful work out and then they pay off. One in there is just only a little bit of technical issue, they become not cool. So but virtually and this is a pretty quiet quarter.
I'll just add we have represented that our largest one is working its way through a bankruptcy process and we will continue to work on that. So we do see an opportunity for for MPLs to be resolved during 2026, but it is a process.
Actually, they're still paying down, right?
That's a super helpful color on that topic. Maybe turning to capital, you know, ratios obviously remain quite strong. S equalities incrementally getting better from here with good line of sight. Any updated thoughts on kind of capital deployment from here? I think you had a tranche of sub debt that was repricing and perhaps looking at the buyback at some point, but any updated color there would be great.
Sure. So we have stated that we've been focused on the sub debt that's coming up for repricing. We recognize that its capital treatment will start to sunset. It did reprice April 1st. We do view, I think, the sub-debt as a capital instrument as sort of something that we're going to address this year. I think that there's also opportunity for us to look at a stock buyback. back. But I do think the sub-debt is our first priority. I think that based on the current interest rate environment and how we're looking at the balance sheet, there may be a good reason to look to retire a good portion of it. So we're working through, I think, that process, as everyone knows, does require regulatory approval.
Fantastic. I'm going to try and sneak one more here on the margin. Can I guess you just comment on whether that four basis points of margin from the FHLB special dividend is one time in nature, and then to the extent that we don't get any more Fed cuts for the foreseeable future, just talk about your expectations for the margin path from here.
Excellent question. So there's definitely a few dynamics in our net interest margin. think you're right the FHLB special dividend is one time in nature we would welcome a special dividend every quarter but don't view that as recurring I think with the sub debts our retirement dates are the first date of each quarter so in the near term we will be absorbing the sub debts at a little bit higher price in the second quarter at least and then I think the other thing I would point out is half of our portfolio is a mortgage portfolio and as everyone knows those are priced on a 3360 basis so we do get a bit of a benefit in the shorter quarters and then it will normalize on the rest of the year so on one hand we'll have more days which is usually higher net interest income but from a margin perspective it may push down a little bit on it having said all of that I think we still have an opportunity to expand our margin from a more normalized basis which is probably you know closer to or just above 3% with balance sheet growth in the current environment and some modest repricing of our deposits. So I think that's where we're headed in the near term.
Fantastic, Lynn. Thank you for taking the questions.
Operator
Your next question is coming from Kelly Matov with KBW. Kelly, please pose your question. Your line is live.
Hi, thanks for the question. And maybe on loan growth, and the growth for the quarter was a bit more muted than we had expected. I think the pipelines coming into the quarter were quite strong. Can you provide any color as to kind of where that variance, what drove that, and how pipelines are looking as we look ahead here?
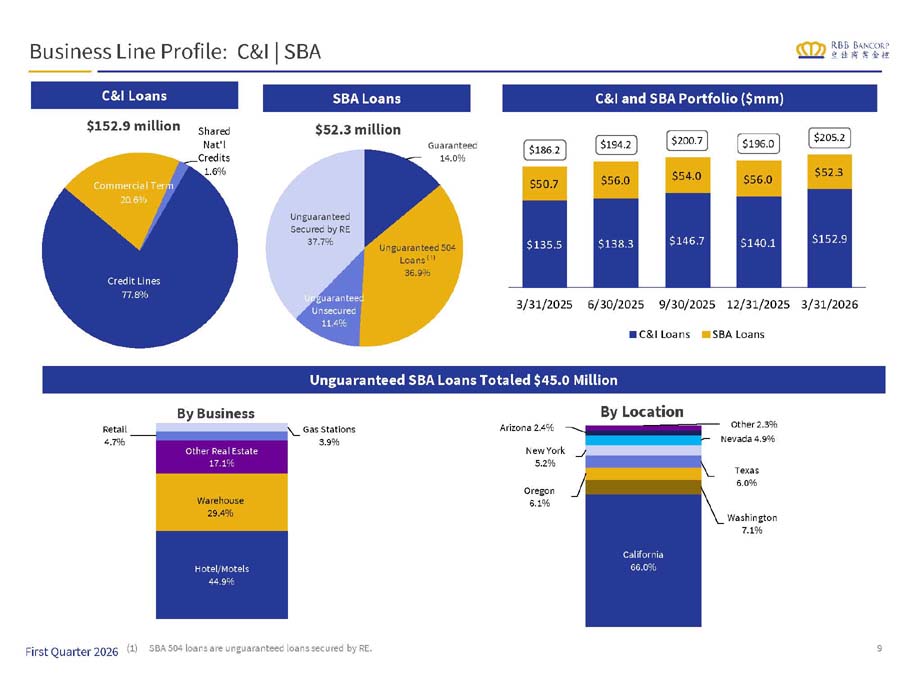
Hi, Kelly. Hi, this is Johnny. Thanks for the question. Well, you know, Q1 is always sort of a seasonal order and also with the geopolitical risk Obviously, there's still a lot of uncertainty out there, but it was in some ways, you know, we try to balance. Obviously, as always, we always look at quality first and then look to see if, you know, based on the competition on the pricing side, whether it makes sense or not, was to aggressively to compete on certain types of deals, and we weren't prepared to sort of compete in sort of sub-market rates in the 5.5 to find, you know, for the MFRs, find a three-quarter or even lower for some CRE loans. So we feel like a commander in the battlefield, trying to hold the line. So we stay pretty disciplined during the first quarter in keeping our rates above 6, you know, unless, as always, if there are certain sort of enhancements to the yield with ancillary businesses such as deposits or other potential fee income that might come with that relationship. Otherwise we're trying to stay pretty disciplined as far as keeping the rate high. So in that sense, we did, you know, sort of let go, if you will, of a few deals during the queue. And then also there's been a little bit higher paydowns, payoffs during the quarter as well. So certainly that impacted the net growth. But to your question about the pipeline, pipeline is still very healthy. And I think you'll see for Q2, based on this bill that we have right now, we should be able to get training toward what we have achieved in the past year, in our 46 quarters. I think we're in good training. So I'm very positive about the pipeline overall, but again, we definitely look for quality first and making sure any pricing that we're going to compete on makes sense for the bank.
Got it. That's helpful. And then on the deposit costs, those came down quite nicely. I think you mentioned your prepared remarks. You had shifted some customers to different categories to help manage that. As we look ahead, barring rate cuts, is there still any room to bring down deposit costs within categories outside time?
And then within time, can you remind us the roll-on versus roll-off rates sure so so I think there's there's still some opportunity with the latest changes in interest rates the belly of the curve kind of moving up I think there's probably less opportunity I think we have historically had a very strong 12-month CD ladder and as those CDs mature you know 98% mature over a 12-month period of time those that typically repriced into a lower environment for the amounts that are coming off they are probably pretty similar to these higher interest rates and the competition that we're seeing you know we are seeing things as high as 4% now being offered by other other banks so I think that the opportunity is maybe smaller but having said that our spot rate at the end of the quarter is lower than what the average was over the quarter so I do think there's still a little bit of opportunity I would throw as far as a runoff rate we did mention that a portion of our CDs moved to a higher yielding what we call a savings product and when we sit back and look at both our CDs and this particular product, about a third of it is able to reprice in the first quarter. And again, it probably reprices similarly or maybe a little bit lower than what we saw in the fourth quarter. So we still have a fair amount repricing into the current quarter, but maybe it's a few basis points.
Got it. That's helpful. Last question, if I can just sneak it in, is just in regards to, I think, Trump, it's been reported that he may look to do an executive order requiring banks to collect citizenship data on their customers. I'm wondering if you guys have looked at this and have, you know, any preliminary thoughts of how that could impact the way you look to do business or anything of that nature.
Tell me if I was speaking to, like, the SBA type of executive order.
I think this is a broader...
A broader way, a broader...
It's hypothetical, but I think Bessent talked about Trump potentially working on an executive order to collect citizenship banks, requiring banks to collect citizenship data on their customers.
Yeah. No, the only thing that we were kind of sort of monitoring a little bit more closely is with respect to the U.S. SBA administration's recent sort of procedural guideline, if you will, which restricts applicants to only to be U.S. citizens, if you will. So that's the only thing that we were kind of watching more closely.
Got it. You guys do have an SBA business? Like, does that have any, you know, bearing on kind of your expectation for that on a go-forward basis?
No, no. In fact, when you first, no, not at all. We don't have any, there's no impact based upon our system.
Got it. Thank you so much.
Operator
Your next question is coming from Matthew Clark with Piper Sandler. Please pose your question. Your line is live.
Thanks. Good morning, everyone. Just wanted to drill into the loan growth outlook a little more. I think coming into the year, the expectation was for high single digits. A little bit more of a challenge here after the first quarter. Do you expect to kind of work toward high single digits as we move through the year? Do you still think we can bounce back here and get close to something in that high single digit range?
I'm going to turn it over to Johnny for a second, but let me make a couple comments. So we had loan production of about $145 million in the fourth quarter. We came into the first quarter with about $130 million, approximately the same yield, kind of holding the line as we observed interest rates, you know, kind of stopped moving down, even some talk of potentially moving up. we recognize you know our funding base I think that while we didn't observe much of an impact with the government shutdown call it in our SBA business I would say our originations in that area were maybe a little bit lighter in the first quarter so there's opportunity there our second and third quarters have historically been our highest producing quarters so much so that they you know achieve I think that higher number so we're stringing together I think positive quarters there's business to be done and with interest rates as high as they are it'll you know depend whether people come off the sidelines and go ahead and move forward and so you know when I think about the range you know high single digits I mean I would put it you know mid to high single digits I you know, we're only building off of, you know, a $3 billion and change portfolio. We're in big areas. We should be able to participate. But to the extent that we're operating inside this interest rate environment, that might be tempered with maintaining NIM. So, you know, I think piecing together everything we're seeing, you know, an attractive pipeline, historically, fourth and first quarter can be a little bit lower you know we would still remain optimistic you know but let's maybe anchor it in the mid to high single digits so I can turn it more comments over to Johnny but that's I think what we're looking at no I I echo Lynn's comments nothing to be out there to Again, our pipeline is healthy.
We just want to be very disciplined in what kind of loans we fund quality-wise and also making sure we're generating appropriate returns for the bank with these new relationships that we're bringing.
Great. The other one I had was to get a little more color on the CD repricing and the savings promotional product. Just want to get the specific amount of CDs that are coming due here in 2Q and the related rate. And then it sounds like the renewal rate is similar maybe. maybe a little bit lower, but I just want to get those specific numbers, including the promotional savings rate product.
Sure. So I think what we are looking at is about 60% of our deposits fit into the CDs and sort of flex savings product, and a third of them reprice in the first quarter. And, you know, our observation in the marketplace is I think the more rate-sensitive money is now costing between 385 and 4%. We've been successful a little bit lower than that, and that's what it's actually coming off at. So, you know, we're working with our relationships and our customers, but, you know, our ladder at the same time last year when we were putting on 12-month money, that was around at the $375 level, right? so that's what's coming due and it's interestingly you know it's all 385 to 4% despite short-term or fed funds rates being lower so yes we still have about you know 60% of our funding base in CDs and savings about a third reprices in the first quarter, and, you know, we've been kind of in the 370 to 375 range, I think that we are competing heavily, and we've done a really great job, but we're observing rates at 385 and 4% when you, you know, look around at offer rates.
Operator
Once again, if you do have any remaining questions or comments, please press star 1 at this time. Your next question is coming from Jackson Laurent with Stevens. Please pose your question. Your line is live.
Hey, good morning. This is Jackson on for Andrew Terrell.
Hi, Jack. Thanks, Jackson.
Maybe coming back to margin, I appreciate the color on kind of the short-term wide path, But if we look a little bit longer term, you've run at a 4% NIM in the past. Do you guys see a path to get back to that? Yeah.
Hello? Hi. Can you just start your question again? I think the line cut and I didn't catch all of it.
Yeah, of course. So just more longer term on the margin. You guys have run at a, call it 4% NIM in the past. I was just wondering if you guys see a path to kind of get back to that level. And if so, what do you think is kind of required to get back there?
So I think what you may be referring to is a point in time in RBB's history where there was a very high percent of non-interest-bearing deposits. And in order to move to, I think, that mid-3% net interest margin, it requires a high percent of non-interest-bearing deposits. And we remain focused on building the commercial or CNI part of our business, which tends to have the more attractive deposits and funding base associated with it. I think before we start talking about a NIM with a 4% handle, we'll need to squarely get into, you know, three, three and a quarter. And, you know, I think we believe we have the opportunity to do that. But it does require, you know, staying focused on our CNI business, growing that, bringing in more non-interest bearing or less rate sensitive customers. And then continuing to work with our relationships that we have so that we can move down on our wholesale funding, which we did in the first quarter.
Got it. That's helpful. Thank you. And then just last one for me on fees. I was wondering if you guys could just talk about gain on sale margin trends and kind of how we should be thinking about loan sales versus loan retention going forward.
So for loan sales, I think they fall into two buckets. One is our mortgage banking business. You know, that tends to be higher volume, lower premiums. We like to test the secondary market to make sure that we do have an off-ramp relative to our loan production. But generally, we hold the majority of it, look at our prepayments, And then we're balancing our mortgage portion of our portfolio against our overall total portfolio. We've kept that at about 50%. We would like to continue to grow our commercial side, which includes multifamily CRE, CNI, and SBA. And then on the SBA loan sales, those are smaller dollar volume but higher premiums. and we would expect to be at similar if not higher levels than what we were able to achieve in 2025. 2025 was a little bit lower than 2024 a little bit of disruption from the government shut down just a little bit of noise so you know we still see that as you know good opportunity we had hired a couple people last year. So I think there's still opportunity in the fee income area to have that move higher in other quarters compared to the first quarter.
That is all I had. Thank you guys for taking the questions.
Operator
Thank you. There appear to be no further questions in queue at this time. I would now like to turn the floor back over to Johnny Lee for any closing remarks.
Once again, thank you for joining us today. We look forward to speaking to many of you in the coming days and weeks. Have a great day, everyone.
Operator
Thank you, everyone. This does conclude today's conference call. You may disconnect your phone lines at this time and have a wonderful day. Thank you for your participation.