
SPT 8-K
Sprout Social, Inc. (SPT)
8-K
2021-05-04
For: 2021-05-04
View Original
Added on
April 10, 2026
UNITED STATES
SECURITIES AND EXCHANGE COMMISSION
Washington, D.C. 20549
FORM 8-K
CURRENT REPORT
PURSUANT TO SECTION 13 OR 15(d) OF THE
SECURITIES EXCHANGE ACT OF 1934
Date of report (Date of earliest event reported): May 4, 2021
(Exact Name of Registrant as Specified in its Charter)
| (State or Other Jurisdiction of Incorporation) | (Commission File Number) | (IRS Employer Identification No.) | ||||||
| , | |||||||||||
| (Address of Principal Executive Offices) | (Zip Code) | ||||||||||
(866 ) 878-3231
(Registrant’s telephone number, including area code)
Not applicable
(Former Name or Former Address, if Changed Since Last Report)
Check the appropriate box below if the Form 8-K filing is intended to simultaneously satisfy the filing obligation of the registrant under any of the following provisions:
| Written communications pursuant to Rule 425 under the Securities Act (17 CFR 230.425) | |||||
| Soliciting material pursuant to Rule 14a-12 under the Exchange Act (17 CFR 240.14a-12) | |||||
| Pre-commencement communications pursuant to Rule 14d-2(b) under the Exchange Act (17 CFR 240.14d-2(b)) | |||||
| Pre-commencement communications pursuant to Rule 13e-4(c) under the Exchange Act (17 CFR 240.13e-4(c)) | |||||
Securities registered pursuant to Section 12(b) of the Act:
| Title of each class | Trading Symbol(s) | Name of each exchange on which registered | ||||||
Indicate by check mark whether the registrant is an emerging growth company as defined in Rule 405 of the Securities Act of 1933 (§230.405 of this chapter) or Rule 12b-2 of the Securities Exchange Act of 1934 (§240.12b-2 of this chapter).
Emerging growth company ☒
If an emerging growth company, indicate by check mark if the registrant has elected not to use the extended transition period for complying with any new or revised financial accounting standards provided pursuant to Section 13(a) of the Exchange Act. ☐
Item 2.02. Results of Operation and Financial Condition.
On May 4, 2021, Sprout Social, Inc. (the “Company”) issued a press release announcing its results for the quarter ended March 31, 2021, and providing its business outlook. A copy of the press release is attached as Exhibit 99.1 to this Current Report on Form 8-K and is incorporated herein by reference.
Item 7.01 Regulation FD Disclosure.
On May 4, 2021, the Company posted an investor presentation to its website at https://investors.sproutsocial.com (the “Investor Presentation”). A copy of the Investor Presentation is attached as Exhibit 99.2 to this Current Report on Form 8-K and is incorporated herein by reference. The Company expects to use the Investor Presentation, in whole or in part, and possibly with modifications, in connection with presentations to investors, analysts and others.
The information contained in the Investor Presentation is summary information that is intended to be considered in the context of the Company’s Securities and Exchange Commission (“SEC”) filings and other public announcements that the Company may make, by press release or otherwise, from time to time. The Investor Presentation speaks only as of the date of this Current Report on Form 8-K. The Company undertakes no duty or obligation to publicly update or revise the information contained in the Investor Presentation, although it may do so from time to time. Any such updating may be made through the filing of other reports or documents with the SEC, through press releases or through other public disclosure. In addition, the exhibit furnished herewith contains statements intended as “forward-looking statements” that are subject to the cautionary statements about forward-looking statements set forth in such exhibit. By furnishing the information contained in the Investor Presentation, the Company makes no admission as to the materiality of any information in the Investor Presentation that is required to be disclosed solely by reason of Regulation FD.
This Current Report on Form 8-K and its contents (including Exhibits 99.1 and 99.2) are furnished and shall not be deemed “filed” for purposes of Section 18 of the Securities Exchange Act of 1934, as amended (the “Exchange Act”), or otherwise subject to the liabilities of that section or Sections 11 and 12(a)(2) of the Securities Act of 1933, as amended (the “Securities Act”), nor shall it be deemed incorporated by reference in any filing under the Securities Act or the Exchange Act, regardless of any general incorporation language in such filing, except as shall be expressly set forth by specific reference in such filing.
Note Regarding Forward-Looking Statements
Certain statements in this Current Report on Form 8-K constitute “forward-looking statements” within the meaning of the federal securities laws. These statements are based on management’s current opinions, expectations, beliefs, plans, objectives, assumptions or projections regarding future events or future results. These forward-looking statements are only predictions, not historical fact, and involve certain risks and uncertainties, as well as assumptions. Actual results, levels of activity, performance, achievements and events could differ materially from those stated, anticipated or implied by such forward-looking statements. While the Company believes that its assumptions are reasonable, it is very difficult to predict the impact of known factors, and, of course, it is impossible to anticipate all factors that could affect actual results. There are many risks and uncertainties that could cause actual results to differ materially from forward-looking statements made herein including the risks discussed under the heading “Risk Factors” in the Company’s Annual Report on Form 10-K for the year ended December 31, 2020 filed with the SEC on February 24, 2021, as well as other factors described from time to time in the Company's other filings with the SEC. Such forward-looking statements are made only as of the date of this Current Report on Form 8-K. The Company undertakes no obligation to publicly update or revise any forward-looking statement because of new information, future events or otherwise, except as otherwise required by law. If it does update one or more forward-looking statements, no inference should be made that the Company will make additional updates with respect to those or other forward-looking statements.
Item 9.01. Financial Statements and Exhibits.
(d)Exhibits.
| Exhibit No. | Description | |||||||
SIGNATURE
Pursuant to the requirements of the Securities Exchange Act of 1934, the registrant has duly caused this report to be signed on its behalf by the undersigned hereunto duly authorized.
| SPROUT SOCIAL, INC. | |||||
| By: | /s/ Heidi Jonas | ||||
| Name: | Heidi Jonas | ||||
| Title: | General Counsel and Secretary | ||||
Date: May 4, 2021

Sprout Social Announces First Quarter 2021 Financial Results Above Guidance Range
Raises 2021 Guidance
First Quarter Total Revenue of $40.8 Million
28,122 Customers as of March 31, 2021
CHICAGO, May 4, 2021 – Sprout Social, Inc. (“Sprout Social”, the “Company”) (Nasdaq: SPT), an industry-leading provider of cloud-based social media management software, today announced financial results for its first quarter ended March 31, 2021.
“Our growth rate is continuing to accelerate, reinforcing confidence in our strategy, our opportunity and the investments we’re making in our future,” said Justyn Howard, Sprout Social’s CEO and co-founder. “Social sits at the center of digital strategy for the next evolution of business. During Q1, we added a record number of net-new customers and generated positive free cash flow for the first time. We’re making aggressive investments behind growth and momentum in our business that has never been stronger.”
“We’re incredibly proud of the team for continually raising the bar and delivering for our customers, especially given the backdrop of the past year.”
First Quarter 2021 Financial Highlights
Revenue
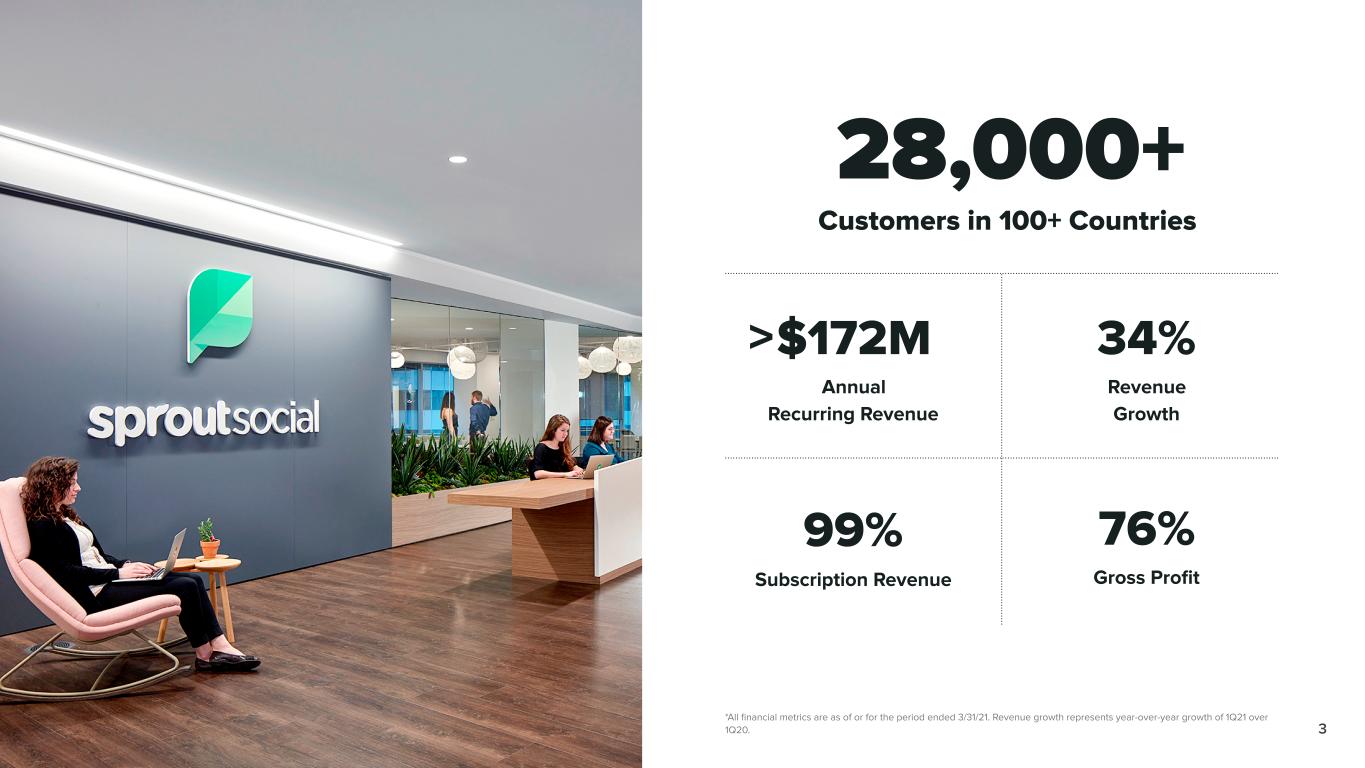
•Total revenue was $40.8 million, up 34% compared to the first quarter of 2020.
•Organic revenue (excluding the impact of legacy Simply Measured revenue) was up 35% compared to the first quarter of 2020.
•Total ARR was $172.0 million, up 38% compared to the first quarter of 2020.
•Organic ARR was $171.0 million, up 39% compared to the first quarter of 2020.
•We expect the impact from legacy Simply Measured to be immaterial to revenue and ARR moving forward.
Operating Loss
•GAAP operating loss was ($6.2) million, compared to ($10.9) million in the first quarter of 2020.
•Non-GAAP operating loss was ($2.3) million, compared to ($7.4) million in the first quarter of 2020.
Net Loss
•GAAP net loss was ($6.4) million, compared to ($10.5) million in the first quarter of 2020.
•Non-GAAP net loss was ($2.5) million, compared to ($7.0) million in the first quarter of 2020.
•GAAP net loss per share was ($0.12) based on 53.4 million weighted-average shares of common stock outstanding, compared to ($0.21) based on 50.1 million weighted-average shares of common stock outstanding in the first quarter of 2020.
•Non-GAAP net loss per share was ($0.05) based on 53.4 million weighted-average shares of common stock outstanding, compared to ($0.14) based on 50.1 million weighted-average shares of common stock outstanding in the first quarter of 2020.
Cash
•Cash and equivalents and marketable securities totaled $167.8 million as of March 31, 2021, up from $163.9 million as of December 31, 2020.
•Net cash generated by operating activities was $3.6 million, compared to ($4.5) million in the first quarter of 2020.
•Free cash flow was $3.4 million, compared to ($4.8) million in the first quarter of 2020.
See “Customer Metrics” and “Use of Non-GAAP Financial Measures” below for how Sprout Social defines total ARR, organic ARR, non-GAAP operating loss, non-GAAP net loss, non-GAAP net loss per share and free cash flow and the financial tables that accompany this release for reconciliations of these measures to their closest comparable GAAP measures.
Customer Metrics
•Grew number of customers to 28,122 as of March 31, 2021, up from 26,718 customers as of December 31, 2020, and up from 24,083 customers as of March 31, 2020.
•Grew number of customers contributing over $10,000 in ARR to 3,514 customers as of March 31, 2021, up 46% compared to March 31, 2020.
Recent Customer Highlights
•During the first quarter, we had the opportunity to help new customers like Performance Food Groups, Danaher, Oliver Wyman, Heidrick & Struggles and Brother International. We executed growth deals with great brands like McKesson, Cole Haan, Hanes Brands, Tumi, Sur La Table, Grammarly and Academy Museum of Motion Pictures.
Recent Business Highlights
Sprout Social:
•Was recently recognized as one of Fortune’s Best Workplaces in Technology
•Commissioned research from Harris Poll that found 91% of business executives anticipate their company’s social media budget will increase over the next three years
Second Quarter and 2021 Financial Outlook
For the second quarter of 2021, the Company currently expects:
•Total revenue between $43.0 and $43.1 million, or overall growth of 37%.
•Non-GAAP operating loss between ($5.4) million and ($5.0) million.
•Non-GAAP net loss per share of between ($0.10) and ($0.09) based on approximately 53.6 million weighted average basic shares of common stock outstanding.
“We are pleased to deliver positive quarterly free cash flow for the first time,” said Joe Del Preto, CFO. “This underscores the attractiveness of our unit economics and compelling efficiencies in our business model. Our teams are executing well and we are also pleased to raise our annual forecast.”
For the full year 2021, the Company is updating guidance to reflect the following:
•Total revenue between $176 to $177 million, or overall growth of 32% to 33%.
•Non-GAAP operating loss between ($18.5) and ($18.0) million.
•At the midpoint of these ranges, this implies an (10.3%) operating margin and more than 500bps of year-over-year operating margin improvement.
•Non-GAAP net loss per share of between ($0.35) and ($0.34) based on approximately 53.8 million weighted average basic shares of common stock outstanding.
The Company’s second quarter and 2021 financial outlook is based on a number of assumptions that are subject to change and many of which are outside the Company’s control, including the impact of COVID-19 on our financial performance and customer demand. If actual results vary from these assumptions, the Company’s expectations may change. There can be no assurance that the Company will achieve these results.
The Company does not provide guidance for operating loss, the most directly comparable GAAP measure to non-GAAP operating loss, or net loss per share, the most directly comparable GAAP measure to non-GAAP net loss per share, and similarly cannot provide a reconciliation between its forecasted non-GAAP operating loss and non-GAAP net loss per share and these comparable GAAP measures without unreasonable effort due to the unavailability of reliable estimates for certain items. These items are not within the Company’s control and may vary greatly between periods and could significantly impact future financial results.
Conference Call Information
The financial results and business highlights will be discussed on a conference call and webcast scheduled at 4:00 p.m. Central Time (5:00 p.m. Eastern Time) today, May 4, 2021. Online registration for this event conference call can be found at http://www.directeventreg.com/registration/event/5735789. The live webcast of the conference call can be accessed from Sprout Social’s investor relations website at http://investors.sproutsocial.com.
Following completion of the events, a webcast replay will also be available at http://investors.sproutsocial.com for 12 months.
About Sprout Social
Sprout Social offers deep social media listening and analytics, social management, customer care and advocacy solutions to more than 28,000 brands and agencies worldwide. Sprout’s unified platform integrates the power of social throughout every aspect of a business and enables social leaders at every level to extract valuable data and insights that drive their business forward. Headquartered in Chicago, Sprout operates across major social media networks, including Twitter, Facebook, Instagram, Pinterest, YouTube and LinkedIn.
Forward-Looking Statements
This press release contains “forward-looking statements” within the meaning of Section 27A of the Securities Act of 1933, as amended, and Section 21E of the Securities Exchange Act of 1934, as amended. In some cases, you can identify forward-looking statements by terms such as “anticipate,” “believe,” “estimate,” “expect,” “intend,” “outlook,” “long-term model,” “may,” “might,” “plan,” “project,” “will,” “would,” “should,” “could,” “can,” “predict,” “potential,” “strategy, “target,” “explore,” “continue,” or the negative of these terms, and similar expressions intended to identify forward-looking statements. However, not all forward-looking statements contain these identifying words. These statements may relate to the impact on our business and the businesses of our prospective and existing customers of the COVID-19 pandemic, our market size and growth strategy, our estimated and projected costs, margins, revenue, expenditures and customer and financial growth rates, our Q2 and 2021 financial outlook, our plans and objectives for future operations, growth, initiatives or strategies. By their nature, these statements are subject to numerous uncertainties and risks, including factors beyond our control, that could cause actual results, performance or achievement to differ materially and adversely from those anticipated or implied in the forward-looking statements. These assumptions, uncertainties and risks include that, among others, the effects of the COVID-19 pandemic and the governmental actions taken to combat the pandemic may materially affect how we and our customers operate our businesses, and the duration and extent to which this threatens our future results of operations and overall financial performance remains uncertain, any decline in new customers, renewals or upgrades, our limited operating history makes it difficult to evaluate our prospects and future results of operations, we operate in competitive markets, we may not be able to sustain our revenue growth rate in the future, our business would be harmed by any significant interruptions, delays or outages in services from our platform or certain social media platforms, changing regulations relating to privacy, information security and data protection could increase our costs, affect or limit how we collect and use personal information and harm our brand, and a cybersecurity-related attack, significant data breach or disruption of the information technology systems or networks could negatively affect our business. Additional risks and uncertainties that could cause actual outcomes and results to differ materially from those contemplated by the forward-looking statements are included under the caption “Risk Factors” and elsewhere in our filings with the Securities and Exchange Commission (the “SEC”), including our Annual Report on Form 10-K for the year ended December 31, 2020 filed with the SEC on February 24, 2021, as well as any other future quarterly and current reports that we file with the SEC. Moreover, you should interpret many of the risks identified in those reports as being heightened as a result of the ongoing and numerous adverse impacts of the COVID-19 pandemic. Forward-looking statements speak only as of the date the statements are made and are based on information available to Sprout Social at the time those statements are made and/or management's good faith belief as of that time with respect to future events. Sprout Social assumes no obligation to update forward-looking statements to reflect events or circumstances after the date they were made, except as required by law.
Use of Non-GAAP Financial Measures
We have provided in this press release certain financial information that has not been prepared in accordance with generally accepted accounting principles in the United States (“GAAP”). Our management uses these non-GAAP financial measures internally in analyzing our financial results and believes that use of these non-GAAP financial measures is useful to investors as an additional tool to evaluate ongoing operating results and trends and in comparing our financial results with other companies in our industry, many of which present similar non-GAAP financial measures. Non-GAAP financial measures are not meant to be considered in isolation or as a substitute for comparable financial measures prepared in accordance with GAAP and should be read only in conjunction with our consolidated financial statements prepared in accordance with GAAP. A reconciliation of our historical non-GAAP financial measures to the most directly comparable GAAP measures has been
provided in the financial statement tables included in this press release, and investors are encouraged to review these reconciliations.
Non-GAAP gross margin. We define non-GAAP gross margin as GAAP gross profit, excluding stock-based compensation expense. We believe non-GAAP gross margin provides our management and investors consistency and comparability with our past financial performance and facilitates period-to-period comparisons of operations, as it eliminates the effect of stock-based compensation, which is often unrelated to overall operating performance.
Non-GAAP operating loss. We define non-GAAP operating loss as GAAP loss from operations, excluding stock-based compensation expense. We believe non-GAAP operating loss provides our management and investors consistency and comparability with our past financial performance and facilitates period-to-period comparisons of operations, as it eliminates the effect of stock-based compensation, which is often unrelated to overall operating performance.
Non-GAAP net loss. We define non-GAAP net loss as GAAP net loss and comprehensive loss, excluding stock-based compensation expense. We believe non-GAAP net loss provides our management and investors consistency and comparability with our past financial performance and facilitates period-to-period comparisons of operations, as this non-GAAP financial measure eliminates the effect of stock-based compensation, which is often unrelated to overall operating performance.
Non-GAAP net loss per share. We define non-GAAP net loss per share as GAAP net loss per share attributable to common shareholders, basic and diluted, excluding stock-based compensation expense. We believe non-GAAP net loss per share provides our management and investors consistency and comparability with our past financial performance and facilitates period-to-period comparisons of operations, as this non-GAAP financial measure eliminates the effect of stock-based compensation, which is often unrelated to overall operating performance.
Free cash flow. We define free cash flow as net cash used in operating activities less purchases of property and equipment. Free cash flow does not reflect our future contractual obligations or represent the total increase or decrease in our cash balance for a given period. We believe free cash flow is a useful indicator of liquidity that provides information to management and investors about the amount of cash used in our core operations that, after purchases of property and equipment, is not available for strategic initiatives.
Free cash flow margin. We define free cash flow margin as free cash flow as a percentage of revenue.
Customer Metrics
Number of customers. We define a customer as a unique account, multiple accounts containing a common non-personal email domain or multiple accounts governed by a single agreement. Number of customers excludes customers exclusively using legacy products obtained through the acquisition of Simply Measured. We believe that the number of customers using our platform is an indicator not only of our market penetration, but also of our potential for future growth as our customers often expand their adoption of our platform over time based on an increased awareness of the value of our platform and products.
Number of customers contributing more than $10,000 in ARR. We define number of customers contributing more than $10,000 in ARR as those on a paid subscription plan that had more than $10,000 in ARR as of a period end. We view the number of customers that contribute more than $10,000 in ARR as a measure of our ability to scale with our customers and attract larger organizations. We believe this represents potential for future growth, including expanding within our current customer base.
Total annual recurring revenue (“total ARR”). We define total ARR as the annualized revenue run-rate of subscription agreements from all customers as of the last date of the specified period. We believe total ARR is an indicator of the scale of our entire platform while mitigating fluctuations due to seasonality and contract term.
Organic ARR. We define organic ARR as total ARR excluding the impact of recurring revenue generated from legacy Simply Measured products. We believe organic ARR is an indicator of the scale and visibility of our core platform while mitigating fluctuations due to seasonality and contract term.
Availability of Information on Sprout Social’s Website and Social Media Profiles
Investors and others should note that Sprout Social routinely announces material information to investors and the marketplace using SEC filings, press releases, public conference calls, webcasts and the Sprout Social Investors website. We also intend
to use the social media profiles listed below as a means of disclosing information about us to our customers, investors and the public. While not all of the information that the Company posts to the Sprout Social Investors website or to social media profiles is of a material nature, some information could be deemed to be material. Accordingly, the Company encourages investors, the media, and others interested in Sprout Social to review the information that it shares at the Investors link located at the bottom of the page on www.sproutsocial.com and to regularly follow our social media profiles. Users may automatically receive email alerts and other information about Sprout Social when enrolling an email address by visiting "Email Alerts" in the "Shareholder Services" section of Sprout Social's Investor website at https://investors.sproutsocial.com/.
Social Media Profiles:
www.twitter.com/SproutSocial
www.facebook.com/SproutSocialInc
www.linkedin.com/company/sprout-social-inc-/
www.instagram.com/sproutsocial
Contact
Media:
Kaitlyn Gronek
Email: [email protected]
Phone: (773) 904-9674
Investors:
Jason Rechel
Email: [email protected]
Phone: (312) 528-9166
| Sprout Social, Inc. | |||||||||||
| Consolidated Statements of Operations and Comprehensive Loss (Unaudited) | |||||||||||
| (in thousands, except share and per share data) | |||||||||||
| Three Months Ended March 31, | |||||||||||
| 2021 | 2020 | ||||||||||
| Revenue | |||||||||||
| Subscription | $ 40,355 | $ 30,329 | |||||||||
| Professional services and other | 463 | 206 | |||||||||
| Total revenue | 40,818 | 30,535 | |||||||||
| Cost of revenue(1) | |||||||||||
| Subscription | 9,705 | 8,086 | |||||||||
| Professional services and other | 292 | 122 | |||||||||
| Total cost of revenue | 9,997 | 8,208 | |||||||||
| Gross profit | 30,821 | 22,327 | |||||||||
| Operating expenses | |||||||||||
| Research and development(1) | 8,272 | 7,281 | |||||||||
| Sales and marketing(1) | 18,153 | 13,894 | |||||||||
| General and administrative(1) | 10,615 | 12,096 | |||||||||
| Total operating expenses | 37,040 | 33,271 | |||||||||
| Loss from operations | (6,219) | (10,944) | |||||||||
| Interest expense | (72) | (95) | |||||||||
| Interest income | 52 | 460 | |||||||||
| Other income (expense), net | (119) | 102 | |||||||||
| Loss before income taxes | (6,358) | (10,477) | |||||||||
| Income tax expense | 9 | 3 | |||||||||
| Net loss and comprehensive loss | $ (6,367) | $ (10,480) | |||||||||
| Net loss per share attributable to common shareholders, basic and diluted | $ (0.12) | $ (0.21) | |||||||||
| Weighted-average shares outstanding used to compute net loss per share, basic and diluted | 53,432,658 | 50,143,971 | |||||||||
| (1) Includes stock-based compensation expense as follows: | |||||||||||
| Three Months Ended March 31, | |||||||||||
| 2021 | 2020 | ||||||||||
| Cost of revenue | $ 184 | $295 | |||||||||
| Research and development | 717 | 484 | |||||||||
| Sales and marketing | 1,752 | 469 | |||||||||
| General and administrative | 1,256 | 2,274 | |||||||||
| Total stock-based compensation expense | $ 3,909 | $ 3,522 | |||||||||
| Sprout Social, Inc. | |||||||||||
| Consolidated Balance Sheets (Unaudited) | |||||||||||
| (in thousands, except share and per share data) | |||||||||||
| March 31, 2021 | December 31, 2020 | ||||||||||
| Assets | |||||||||||
| Current assets | |||||||||||
| Cash and cash equivalents | $ 102,303 | $ 114,515 | |||||||||
| Marketable securities | 65,490 | 49,364 | |||||||||
Accounts receivable, net of allowances of $1,252 and $1,428 at March 31, 2021 and December 31, 2020, respectively | 15,928 | 17,178 | |||||||||
| Deferred Commissions | 9,551 | 8,622 | |||||||||
| Prepaid expenses and other assets | 7,596 | 9,651 | |||||||||
| Total current assets | 200,868 | 199,330 | |||||||||
| Property and equipment, net | 14,352 | 14,925 | |||||||||
| Deferred commissions, net of current portion | 9,775 | 8,757 | |||||||||
| Operating lease, right-of-use asset | 9,942 | 10,132 | |||||||||
| Goodwill | 2,299 | 2,299 | |||||||||
| Intangible assets, net | 3,827 | 4,088 | |||||||||
| Other assets, net | 130 | 138 | |||||||||
| Total assets | $ 241,193 | $ 239,669 | |||||||||
| Liabilities and Stockholders' Equity | |||||||||||
| Current liabilities | |||||||||||
| Accounts payable | $ 705 | $ 1,543 | |||||||||
| Deferred revenue | 50,800 | 43,407 | |||||||||
| Operating lease liability | 2,513 | 2,155 | |||||||||
| Accrued wages and payroll related benefits | 6,370 | 9,885 | |||||||||
| Accrued expenses and other | 7,202 | 6,587 | |||||||||
| Total current liabilities | 67,590 | 63,577 | |||||||||
| Deferred revenue, net of current portion | 207 | 355 | |||||||||
| Operating lease liability, net of current portion | 22,987 | 23,638 | |||||||||
| Total liabilities | 90,784 | 87,570 | |||||||||
| Stockholders' equity | |||||||||||
Class A common stock, par value $0.0001 per share; 1,000,000,000 shares authorized; 47,199,895 and 44,387,761 shares issued and outstanding at March 31, 2021, respectively; 46,698,354 and 43,898,850 shares issued and outstanding at December 31, 2020, respectively | 4 | 4 | |||||||||
Class B common stock, par value $0.0001 per share; 25,000,000 shares authorized; 9,362,566 and 9,155,622 shares issued and outstanding at March 31, 2021, respectively; 9,574,566 and 9,367,622 shares issued and outstanding at December 31, 2020, respectively | 1 | 1 | |||||||||
| Additional paid-in capital | 333,939 | 328,343 | |||||||||
| Treasury stock, at cost | (30,125) | (29,206) | |||||||||
| Accumulated deficit | (153,410) | (147,043) | |||||||||
| Total stockholders’ equity | 150,409 | 152,099 | |||||||||
| Total liabilities and stockholders’ equity | $ 241,193 | $ 239,669 | |||||||||
| Sprout Social, Inc. | |||||||||||
| Consolidated Statements of Cash Flows (Unaudited) | |||||||||||
| (in thousands) | |||||||||||
| Three Months Ended March 31, | |||||||||||
| 2021 | 2020 | ||||||||||
| Cash flows from operating activities | |||||||||||
| Net loss | $ (6,367) | $ (10,480) | |||||||||
| Adjustments to reconcile net loss to net cash provided by (used in) operating activities | |||||||||||
| Depreciation of property and equipment | 737 | 725 | |||||||||
| Amortization of line of credit issuance costs | 43 | 65 | |||||||||
| Amortization of premium on marketable securities | 177 | - | |||||||||
| Amortization of acquired intangible assets | 261 | 357 | |||||||||
| Amortization of deferred commissions | 2,583 | 1,627 | |||||||||
| Amortization of right-of-use operating lease asset | 190 | 309 | |||||||||
| Stock-based compensation expense | 3,909 | 3,522 | |||||||||
| Provision for accounts receivable allowances | 144 | 910 | |||||||||
| Changes in operating assets and liabilities | |||||||||||
| Accounts receivable | 1,106 | (2,122) | |||||||||
| Prepaid expenses and other current assets | 2,152 | (313) | |||||||||
| Deferred commissions | (4,529) | (2,500) | |||||||||
| Accounts payable and accrued expenses | (3,738) | (305) | |||||||||
| Deferred revenue | 7,245 | 4,299 | |||||||||
| Lease liabilities | (293) | (597) | |||||||||
| Net cash provided by (used in) operating activities | 3,620 | (4,503) | |||||||||
| Cash flows from investing activities | |||||||||||
| Purchases of property and equipment | (173) | (313) | |||||||||
| Purchases of marketable securities | (25,903) | - | |||||||||
| Proceeds from maturity of marketable securities | 9,600 | - | |||||||||
| Net cash (used in) investing activities | (16,476) | (313) | |||||||||
| Cash flows from financing activities | |||||||||||
Proceeds from underwriters' purchase of over-allotment shares, related to the Company's initial public offering, net of underwriters' discounts and commissions | - | 9,954 | |||||||||
| Payments for line of credit issuance costs | (124) | (132) | |||||||||
| Proceeds from exercise of stock options | 23 | 142 | |||||||||
| Proceeds from disgorgement of stockholders short-swing profits | 1,664 | - | |||||||||
| Employee taxes paid related to the net share settlement of stock-based awards | (919) | (3,082) | |||||||||
| Net cash provided by financing activities | 644 | 6,882 | |||||||||
| Net increase (decrease) in cash and cash equivalents | (12,212) | 2,066 | |||||||||
| Cash and cash equivalents | |||||||||||
| Beginning of period | 114,515 | 135,310 | |||||||||
| End of period | $ 102,303 | $ 137,376 | |||||||||
The following schedule reflects our non-GAAP financial measures and reconciles our non-GAAP financial measures to the related GAAP financial measures (in thousands, except per share data):
| Summary of Non-GAAP Financial Measures | ||||||||||||||
| Three Months Ended March 31, | ||||||||||||||
| 2021 | 2020 | |||||||||||||
| Non-GAAP gross margin | $ 31,005 | $ 22,622 | ||||||||||||
| Non-GAAP operating loss | $ (2,310) | $ (7,422) | ||||||||||||
| Non-GAAP net loss | (2,458) | (6,958) | ||||||||||||
| Non-GAAP net loss per share | (0.05) | (0.14) | ||||||||||||
| Free cash flow | $ 3,447 | $ (4,816) | ||||||||||||
| Reconciliation of Non-GAAP Financial Measures | ||||||||||||||
| Three Months Ended March 31, | ||||||||||||||
| 2021 | 2020 | |||||||||||||
| Reconciliation of Non-GAAP gross margin | ||||||||||||||
| Gross profit | $ 30,821 | $ 22,327 | ||||||||||||
| Stock-based compensation expense | 184 | 295 | ||||||||||||
| Non-GAAP gross margin | $ 31,005 | $ 22,622 | ||||||||||||
| Reconciliation of Non-GAAP operating loss | ||||||||||||||
| Loss from operations | $ (6,219) | $ (10,944) | ||||||||||||
| Stock-based compensation expense | 3,909 | 3,522 | ||||||||||||
| Non-GAAP operating loss | $ (2,310) | $ (7,422) | ||||||||||||
| Reconciliation of Non-GAAP net loss | ||||||||||||||
| Net loss and comprehensive loss | $ (6,367) | $ (10,480) | ||||||||||||
| Stock-based compensation expense | 3,909 | 3,522 | ||||||||||||
| Non-GAAP net loss | $ (2,458) | $ (6,958) | ||||||||||||
| Reconciliation of Non-GAAP net loss per share | ||||||||||||||
| Net loss per share attributable to common shareholders, basic and diluted | $ (0.12) | $ (0.21) | ||||||||||||
| Stock-based compensation expense per share | 0.07 | 0.07 | ||||||||||||
| Non-GAAP net loss per share | $ (0.05) | $ (0.14) | ||||||||||||
| Reconciliation of free cash flow | |||||||||||
| Net cash provided by (used in) operating activities | $ 3,620 | $ (4,503) | |||||||||
| Purchases of property and equipment | (173) | (313) | |||||||||
| Free cash flow | $ 3,447 | $ (4,816) | |||||||||

1 2021 Investor Presentation
Disclaimer 22021 Investor Presentation Forward-Looking Statements This press release contains “forward-looking statements” within the meaning of Section 27A of the Securities Act of 1933, as amended, and Section 21E of the Securities Exchange Act of 1934, as amended. In some cases, you can identify forward-looking statements by terms such as “anticipate,” “believe,” “estimate,” “expect,” “intend,” “outlook,” “may,” “might,” “plan,” “project,” “will,” “would,” “should,” “could,” “can,” “predict,” “potential,” “strategy, “target,” “explore,” “continue,” or the negative of these terms, and similar expressions intended to identify forward-looking statements. However, not all forward-looking statements contain these identifying words. These statements may relate to the impact on our business and the businesses of our prospective and existing customers of the COVID-19 pandemic, our market size and growth strategy, our estimated and projected costs, margins, revenue, expenditures and customer and financial growth rates, our Q1 and 2021 financial outlook, our plans and objectives for future operations, growth, initiatives or strategies. By their nature, these statements are subject to numerous uncertainties and risks, including factors beyond our control, that could cause actual results, performance or achievement to differ materially and adversely from those anticipated or implied in the forward-looking statements. These assumptions, uncertainties and risks include that, among others, the effects of the COVID-19 pandemic and the governmental actions taken to combat the pandemic may materially affect how we and our customers operate our businesses, and the duration and extent to which this threatens our future results of operations and overall financial performance remains uncertain, any decline in new customers, renewals or upgrades, our limited operating history makes it difficult to evaluate our prospects and future results of operations, we operate in competitive markets, we may not be able to sustain our revenue growth rate in the future, our business would be harmed by any significant interruptions, delays or outages in services from our platform or certain social media platforms, changing regulations relating to privacy, information security and data protection could increase our costs, affect or limit how we collect and use personal information and harm our brand, and a cybersecurity-related attack, significant data breach or disruption of the information technology systems or networks could negatively affect our business. Additional risks and uncertainties that could cause actual outcomes and results to differ materially from those contemplated by the forward-looking statements are included under the caption “Risk Factors” and elsewhere in our filings with the Securities and Exchange Commission (the “SEC”), including our Annual Report on Form 10-K for the year ended December 31, 2020 filed with the SEC on February 24, 2021, as well as any other future quarterly and current reports that we file with the SEC. Moreover, you should interpret many of the risks identified in those reports as being heightened as a result of the ongoing and numerous adverse impacts of the COVID-19 pandemic. Forward-looking statements speak only as of the date the statements are made and are based on information available to Sprout Social at the time those statements are made and/or management's good faith belief as of that time with respect to future events. Sprout Social assumes no obligation to update forward-looking statements to reflect events or circumstances after the date they were made, except as required by law. Use of Non-GAAP Financial Measures We have provided in this presentation certain financial information that has not been prepared in accordance with generally accepted accounting principles in the United States (“GAAP”). Our management uses these non-GAAP financial measures internally in analyzing our financial results and believes that use of these non-GAAP financial measures is useful to investors as an additional tool to evaluate ongoing operating results and trends and in comparing our financial results with other companies in our industry, many of which present similar non-GAAP financial measures. Non-GAAP financial measures are not meant to be considered in isolation or as a substitute for comparable financial measures prepared in accordance with GAAP and should be read only in conjunction with our consolidated financial statements prepared in accordance with GAAP. At the end of this presentation we have included a reconciliation of our historical non-GAAP financial measures to the most directly comparable GAAP measures and definitions of the non-GAAP financial measures used in this presentation. Customer Metrics and Market Data This presentation includes useful customer metrics, which are defined at the back of this presentation. Unless otherwise noted, information in this presentation concerning our industry, including industry statistics and forecasts, competitive position and the markets in which we operate is based on information from independent industry and research organizations, other third-party sources and management estimates. Management estimates are derived from publicly available information released by independent industry analysts and other third party sources, as well as data from our internal research, and are based on assumptions made by us upon reviewing such data, and our experience in, and knowledge of, such industry and markets, which we believe to be reasonable. Projections, forecasts, assumptions and estimates of the future performance of the industry in which we operate and our future performance are necessarily subject to uncertainty and risk due to a variety of factors. We have not independently verified the accuracy or completeness of the information provided by independent industry and research organizations, other third parties or other publicly available information. Accordingly, we make no representations as to the accuracy or completeness of that information nor do we undertake to update such information after the date of this presentation.
3 *All financial metrics are as of or for the period ended 3/31/21. Revenue growth represents year-over-year growth of 1Q21 over 1Q20. 28,000+ Customers in 100+ Countries 76% Gross Profit 34% Revenue Growth 99% Subscription Revenue $172M Annual Recurring Revenue >
2021 Investor Presentation Enabling businesses to operationalize social Investment highlights 4 Mission critical system of record for digital business Recurring SaaS model (99% subscription) Founder-led leadership team and exceptional culture Disruptive inbound trial model and fast time to value Highly scalable single code base Durable moats and barriers to entry Large and rapidly growing TAM
2021 Investor Presentation 5 Our history Sprout was founded in 2010 and built on the premise that social media would change the way the world communicates and how virtually every aspect of business operates. 2011 Sprout platform introduced 2010 Founded company 2013 Hired 100th employee 2016 Series C funding 2017 First business acquisition 2018 Opened Dublin office Launched first add-on module (Listening) 2019 Became a public company Launched Reviews add-on 2020 Sprout Design Refresh Launched Premium Analytics add-on

2021 Investor Presentation Social media has fundamentally transformed the way consumers connect with brands 6 With more than 3.4 billion consumers using social media, businesses must adapt or risk becoming irrelevant to nearly half of the world’s population. The ways that business attract, acquire, sell to and service customers is being completely transformed. Total Global Social Media Users per Statista, February 2020
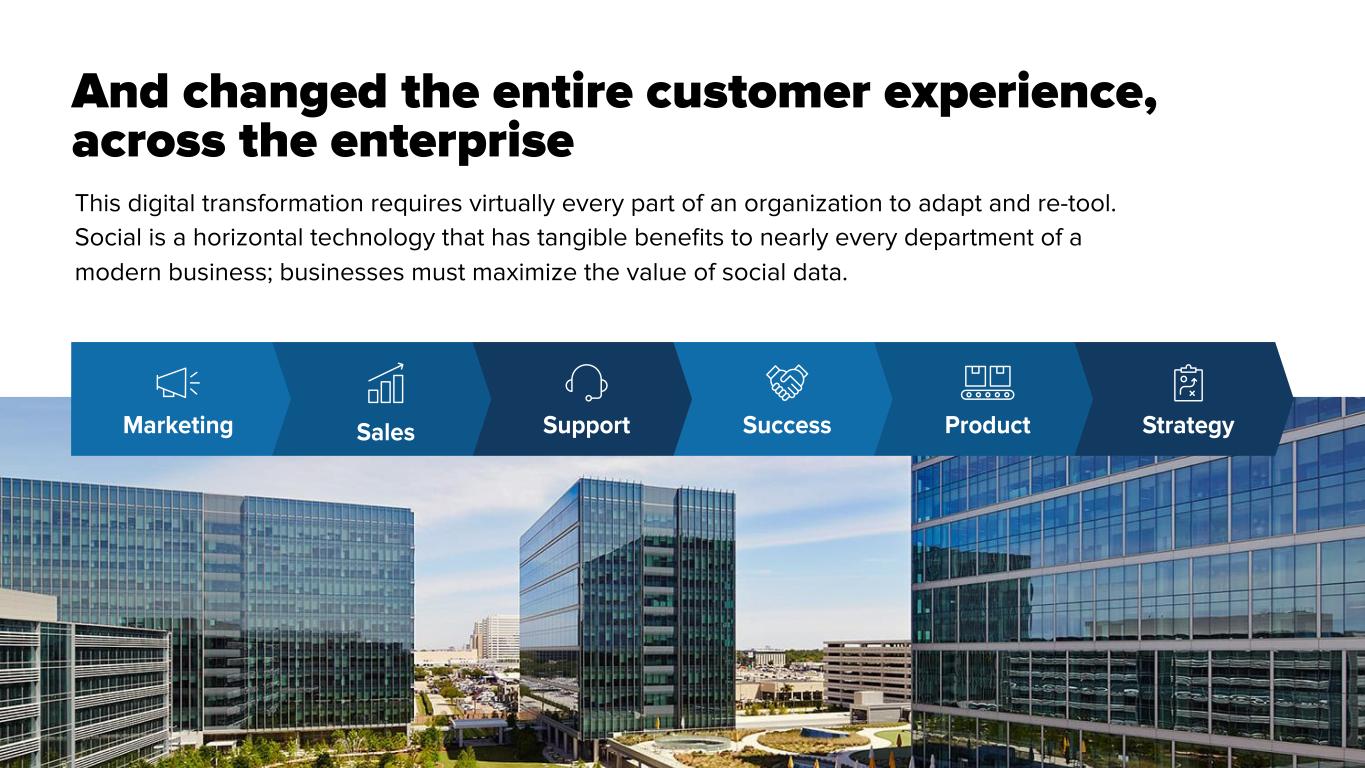
2021 Investor Presentation And changed the entire customer experience, across the enterprise This digital transformation requires virtually every part of an organization to adapt and re-tool. Social is a horizontal technology that has tangible benefits to nearly every department of a modern business; businesses must maximize the value of social data. Sales StrategyProductSuccessSupportMarketing
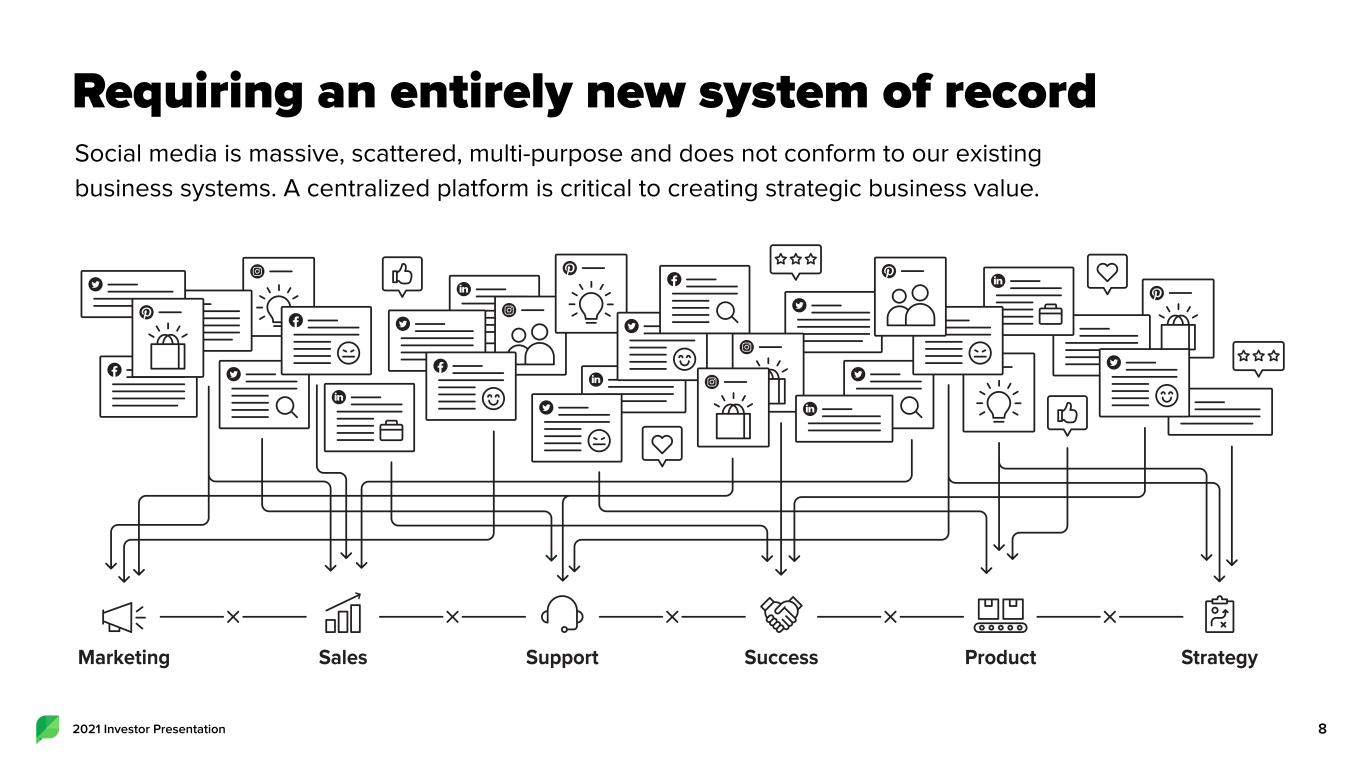
82021 Investor Presentation Requiring an entirely new system of record Social media is massive, scattered, multi-purpose and does not conform to our existing business systems. A centralized platform is critical to creating strategic business value. Sales StrategyProductSuccessSupportMarketing
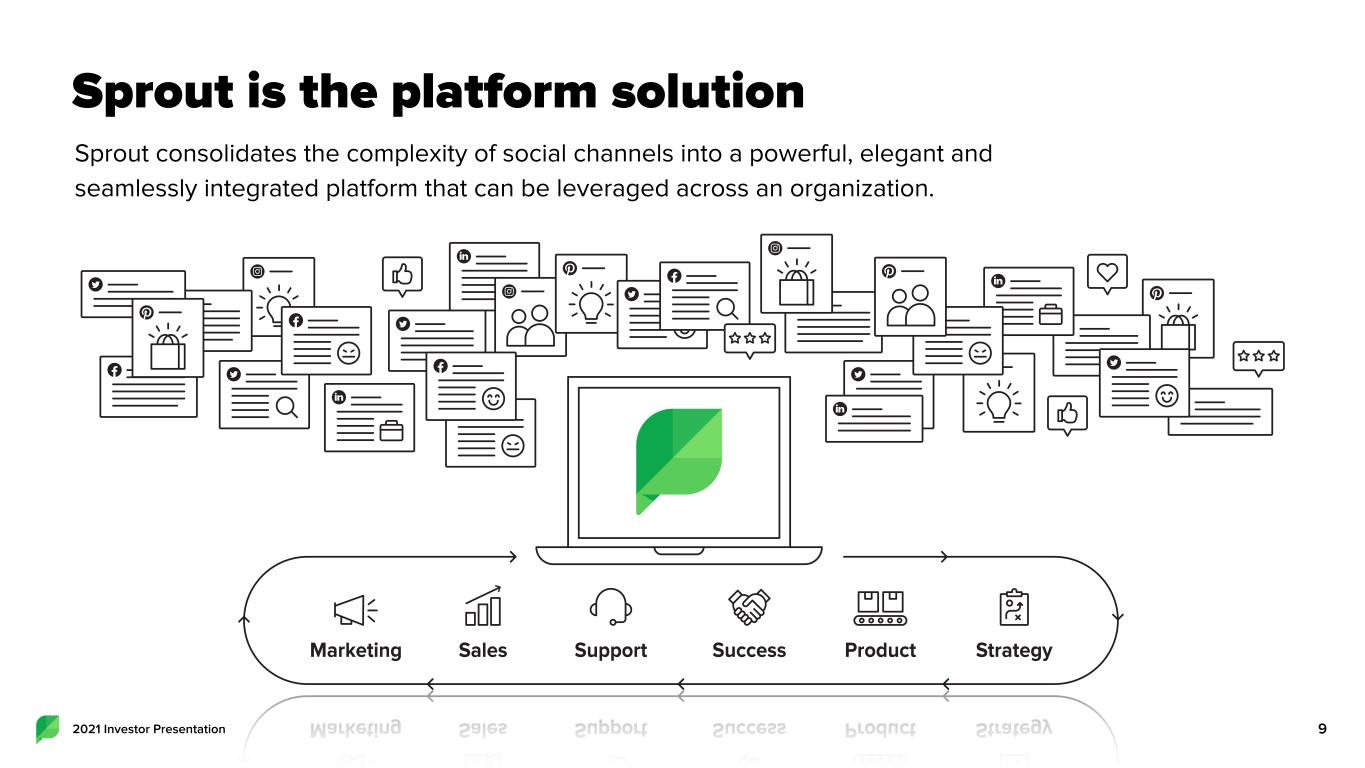
92021 Investor Presentation Sprout is the platform solution Sprout consolidates the complexity of social channels into a powerful, elegant and seamlessly integrated platform that can be leveraged across an organization. ProductSuccessSupportSales StrategyMarketing
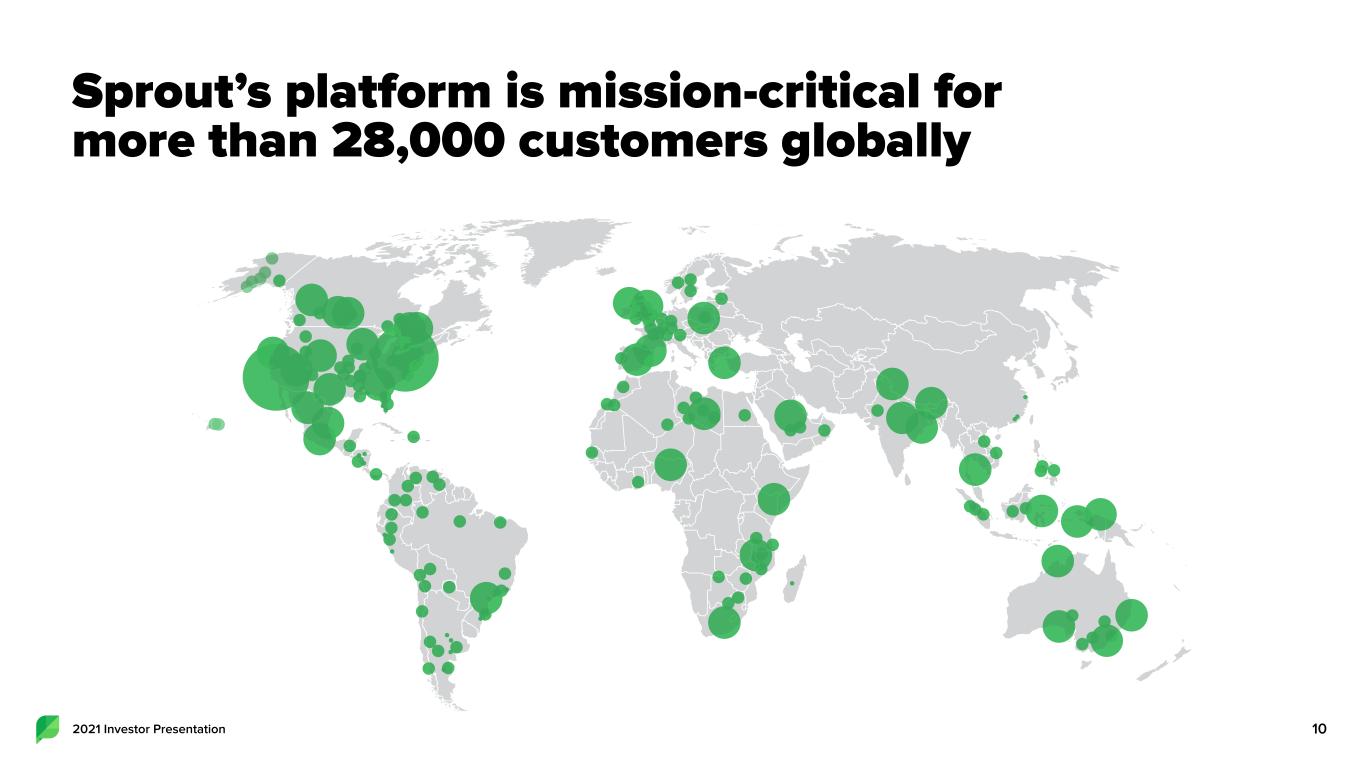
102021 Investor Presentation Sprout’s platform is mission-critical for more than 28,000 customers globally
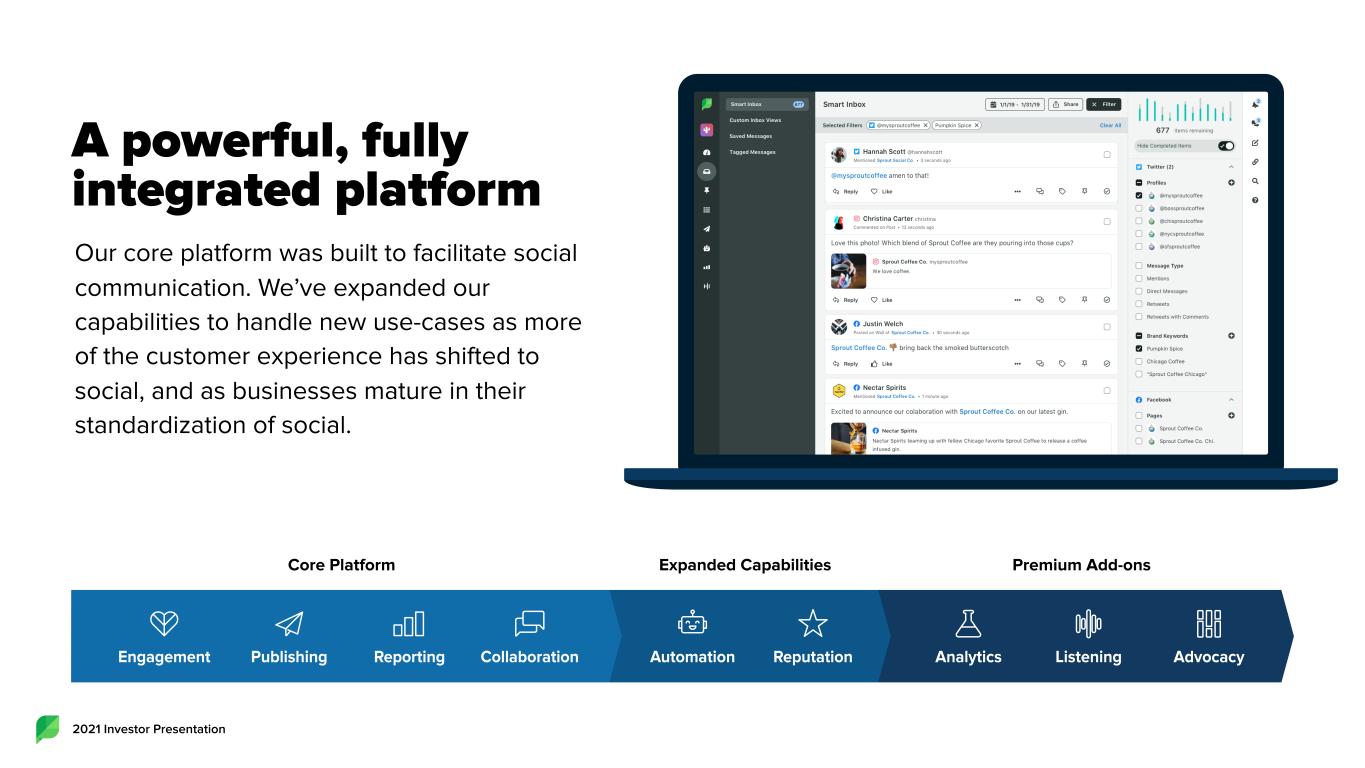
2021 Investor Presentation Core Platform Expanded Capabilities Premium Add-ons A powerful, fully integrated platform Our core platform was built to facilitate social communication. We’ve expanded our capabilities to handle new use-cases as more of the customer experience has shifted to social, and as businesses mature in their standardization of social. Engagement Publishing Analytics ListeningAutomationReporting Collaboration AdvocacyReputation
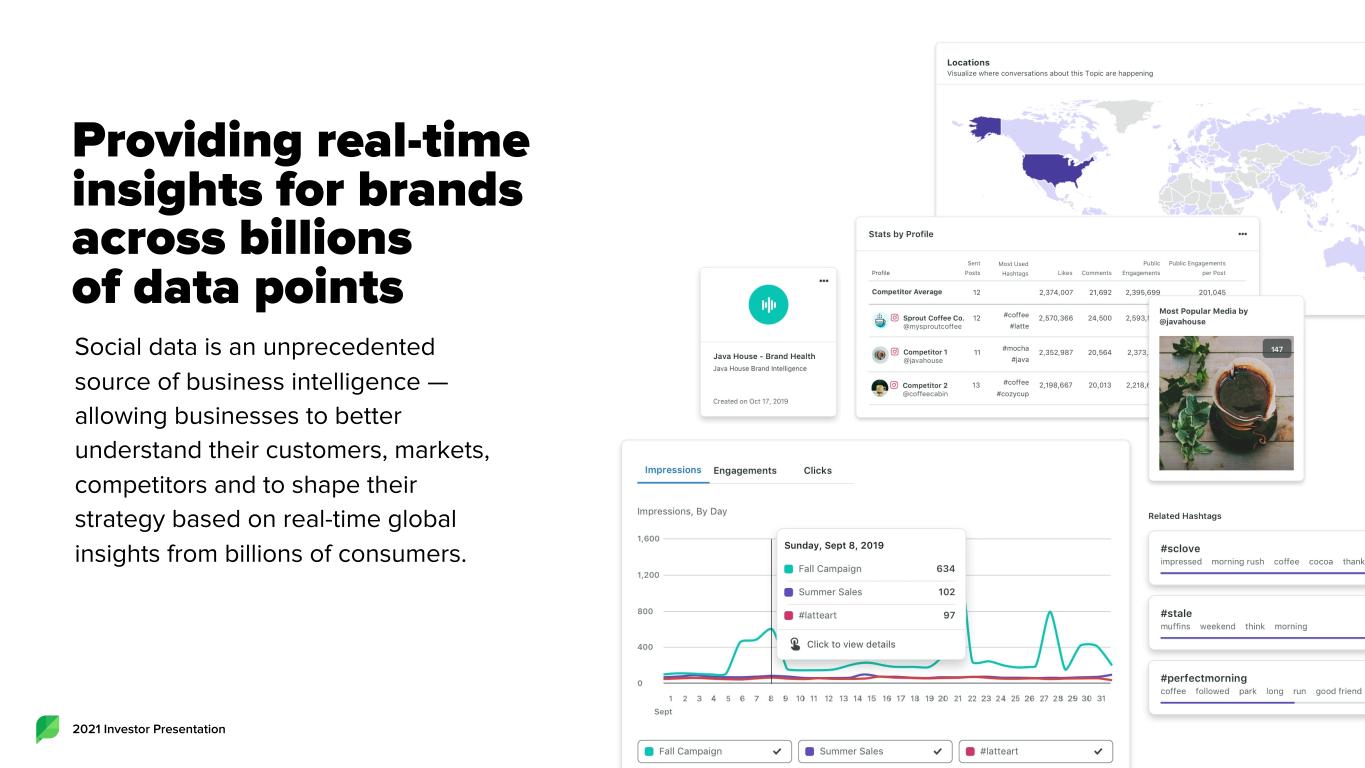
2021 Investor Presentation Providing real-time insights for brands across billions of data points Social data is an unprecedented source of business intelligence — allowing businesses to better understand their customers, markets, competitors and to shape their strategy based on real-time global insights from billions of consumers.
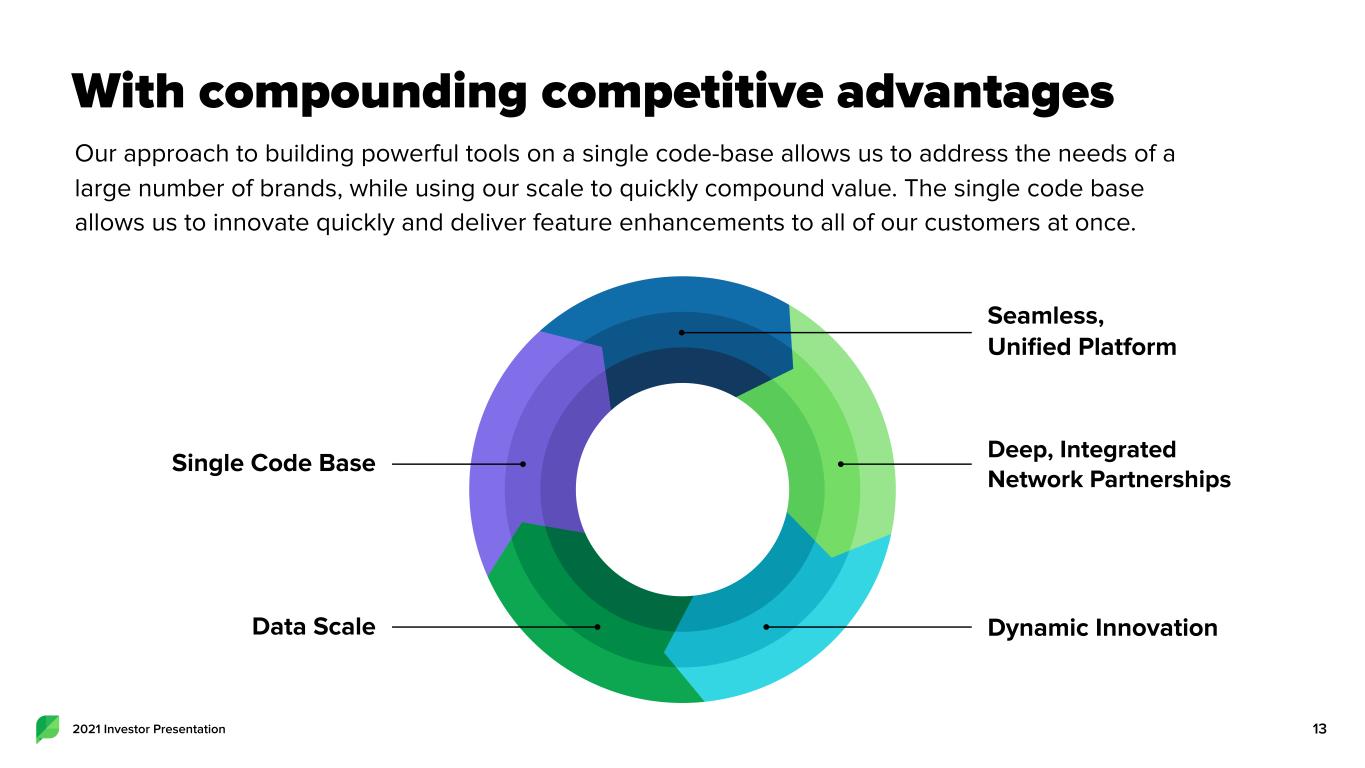
2021 Investor Presentation With compounding competitive advantages Our approach to building powerful tools on a single code-base allows us to address the needs of a large number of brands, while using our scale to quickly compound value. The single code base allows us to innovate quickly and deliver feature enhancements to all of our customers at once. 13 Deep, Integrated Network Partnerships Dynamic Innovation Seamless, Unified Platform Single Code Base Data Scale
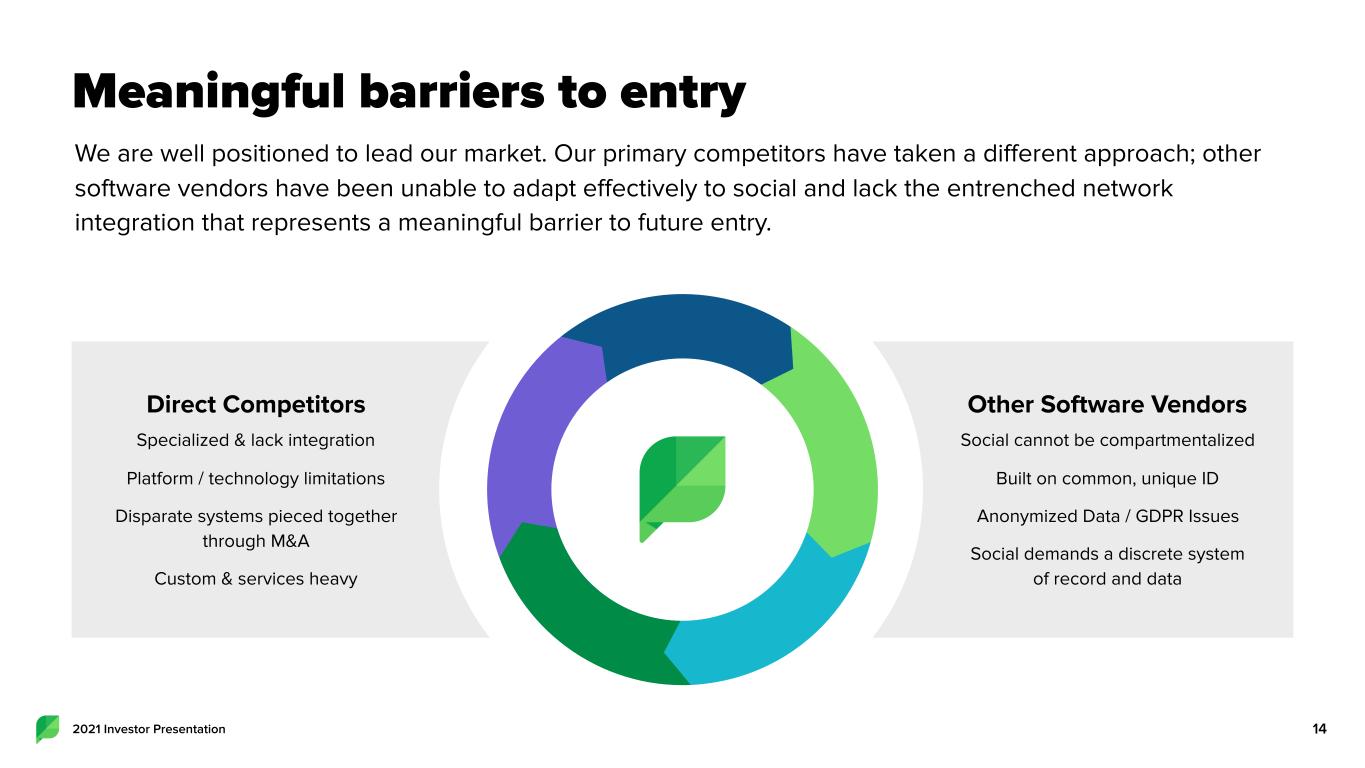
2021 Investor Presentation Direct Competitors Specialized & lack integration Platform / technology limitations Disparate systems pieced together through M&A Custom & services heavy Other Software Vendors Social cannot be compartmentalized Built on common, unique ID Anonymized Data / GDPR Issues Social demands a discrete system of record and data Meaningful barriers to entry We are well positioned to lead our market. Our primary competitors have taken a different approach; other software vendors have been unable to adapt effectively to social and lack the entrenched network integration that represents a meaningful barrier to future entry. 14
2021 Investor Presentation And entrenched network & integration ecosystem We have deep, integrated network relationships that are increasingly hard to replicate; our expanding set of technology partner integrations is growing the value of our social system of record. 15
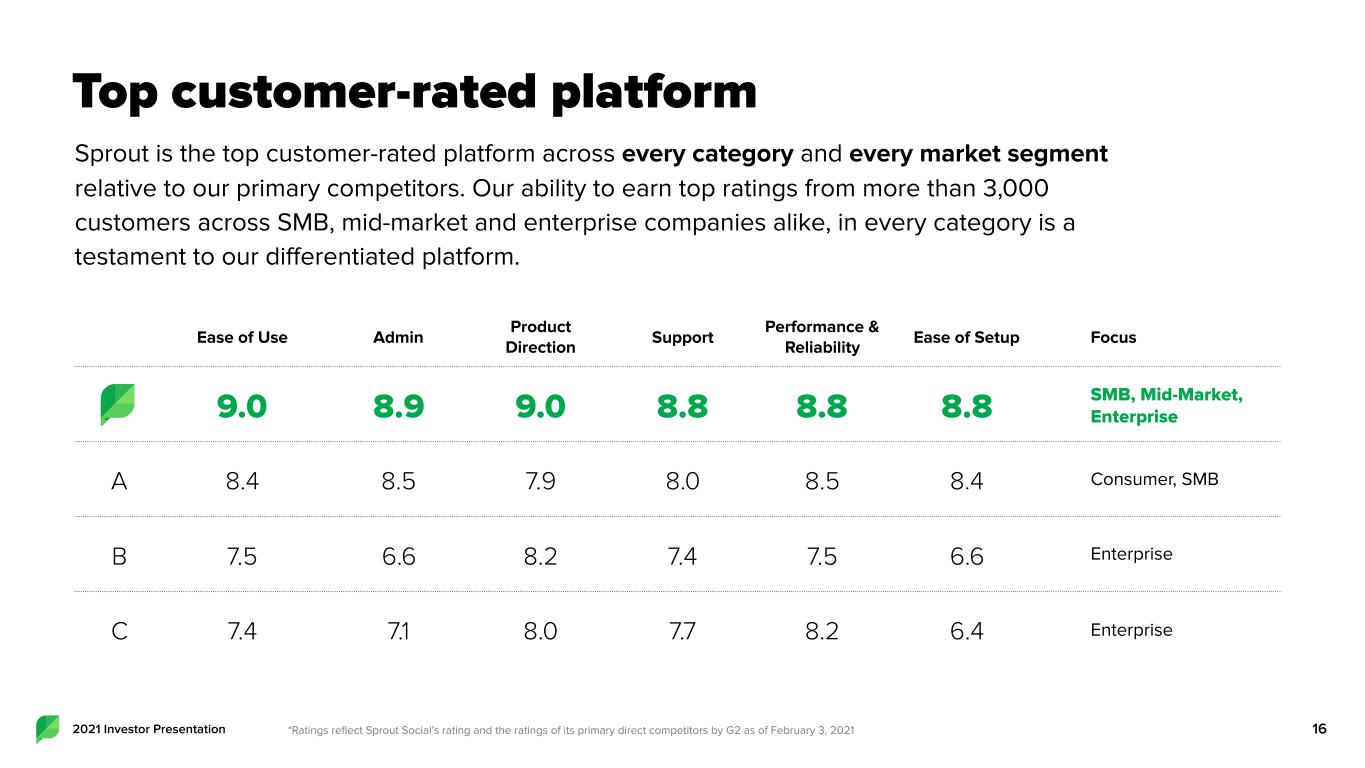
2021 Investor Presentation Top customer-rated platform Sprout is the top customer-rated platform across every category and every market segment relative to our primary competitors. Our ability to earn top ratings from more than 3,000 customers across SMB, mid-market and enterprise companies alike, in every category is a testament to our differentiated platform. 16*Ratings reflect Sprout Social’s rating and the ratings of its primary direct competitors by G2 as of February 3, 2021 Ease of Use Admin Product Direction Support Performance & Reliability Ease of Setup Focus 9.0 8.9 9.0 8.8 8.8 8.8 SMB, Mid-Market, Enterprise A 8.4 8.5 7.9 8.0 8.5 8.4 Consumer, SMB B 7.5 6.6 8.2 7.4 7.5 6.6 Enterprise C 7.4 7.1 8.0 7.7 8.2 6.4 Enterprise
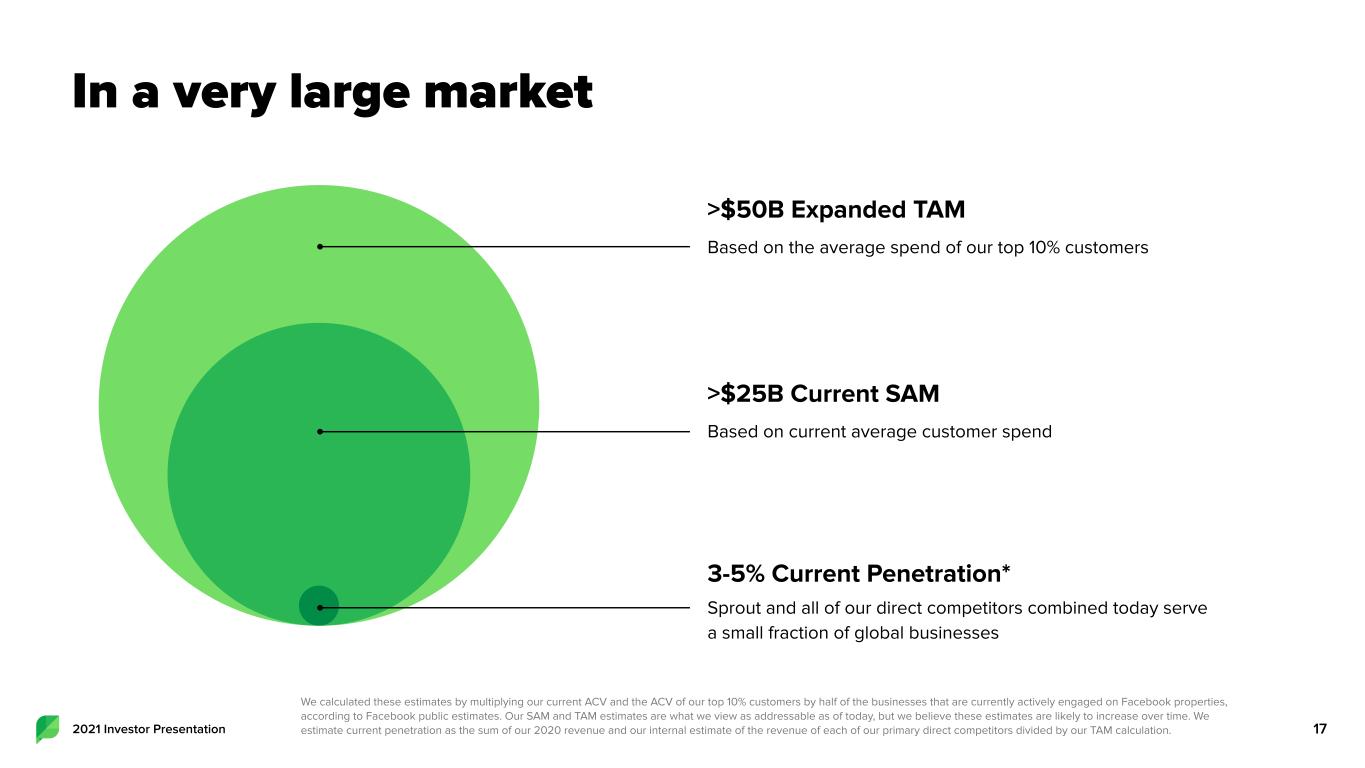
In a very large market 172021 Investor Presentation >$25B Current SAM Based on current average customer spend 3-5% Current Penetration* Sprout and all of our direct competitors combined today serve a small fraction of global businesses >$50B Expanded TAM Based on the average spend of our top 10% customers We calculated these estimates by multiplying our current ACV and the ACV of our top 10% customers by half of the businesses that are currently actively engaged on Facebook properties, according to Facebook public estimates. Our SAM and TAM estimates are what we view as addressable as of today, but we believe these estimates are likely to increase over time. We estimate current penetration as the sum of our 2020 revenue and our internal estimate of the revenue of each of our primary direct competitors divided by our TAM calculation.
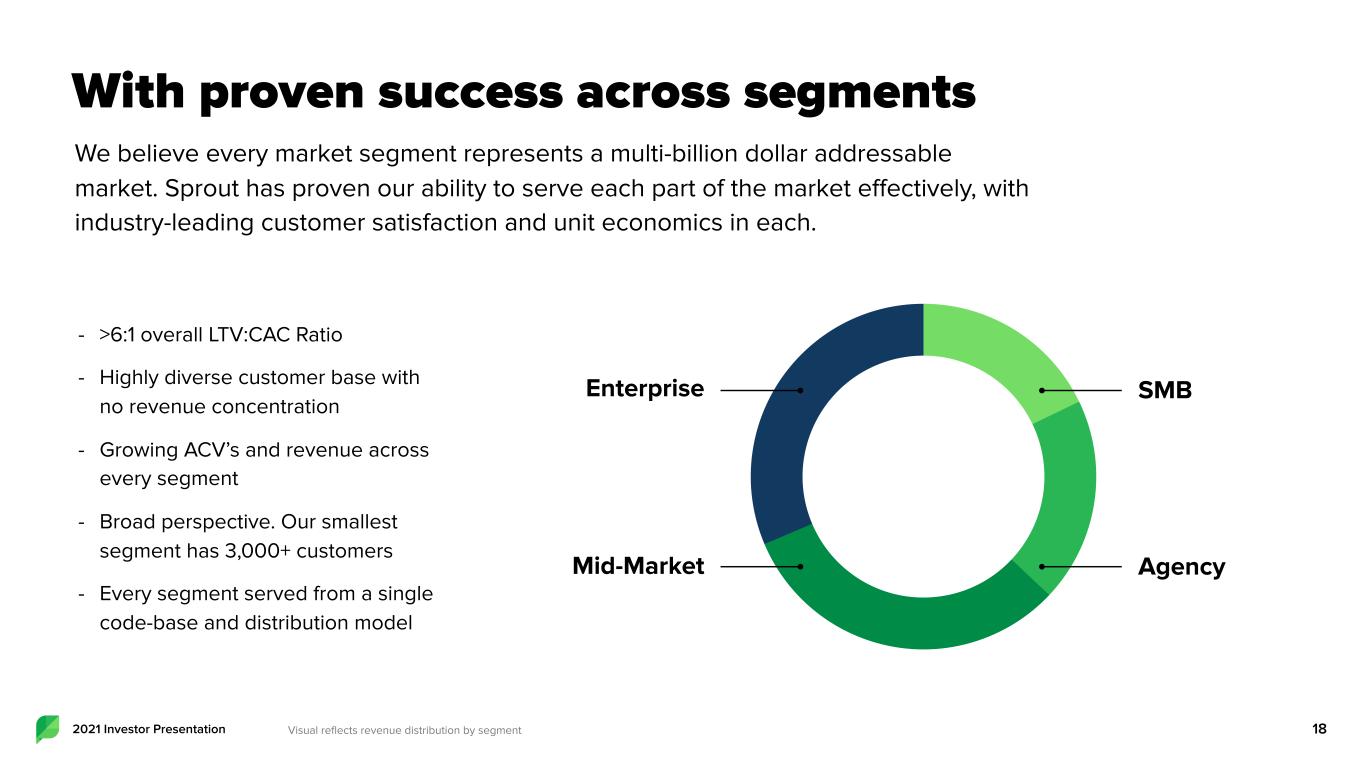
2021 Investor Presentation With proven success across segments We believe every market segment represents a multi-billion dollar addressable market. Sprout has proven our ability to serve each part of the market effectively, with industry-leading customer satisfaction and unit economics in each. 18 - >6:1 overall LTV:CAC Ratio - Highly diverse customer base with no revenue concentration - Growing ACV’s and revenue across every segment - Broad perspective. Our smallest segment has 3,000+ customers - Every segment served from a single code-base and distribution model Enterprise SMB Mid-Market Agency Visual reflects revenue distribution by segment
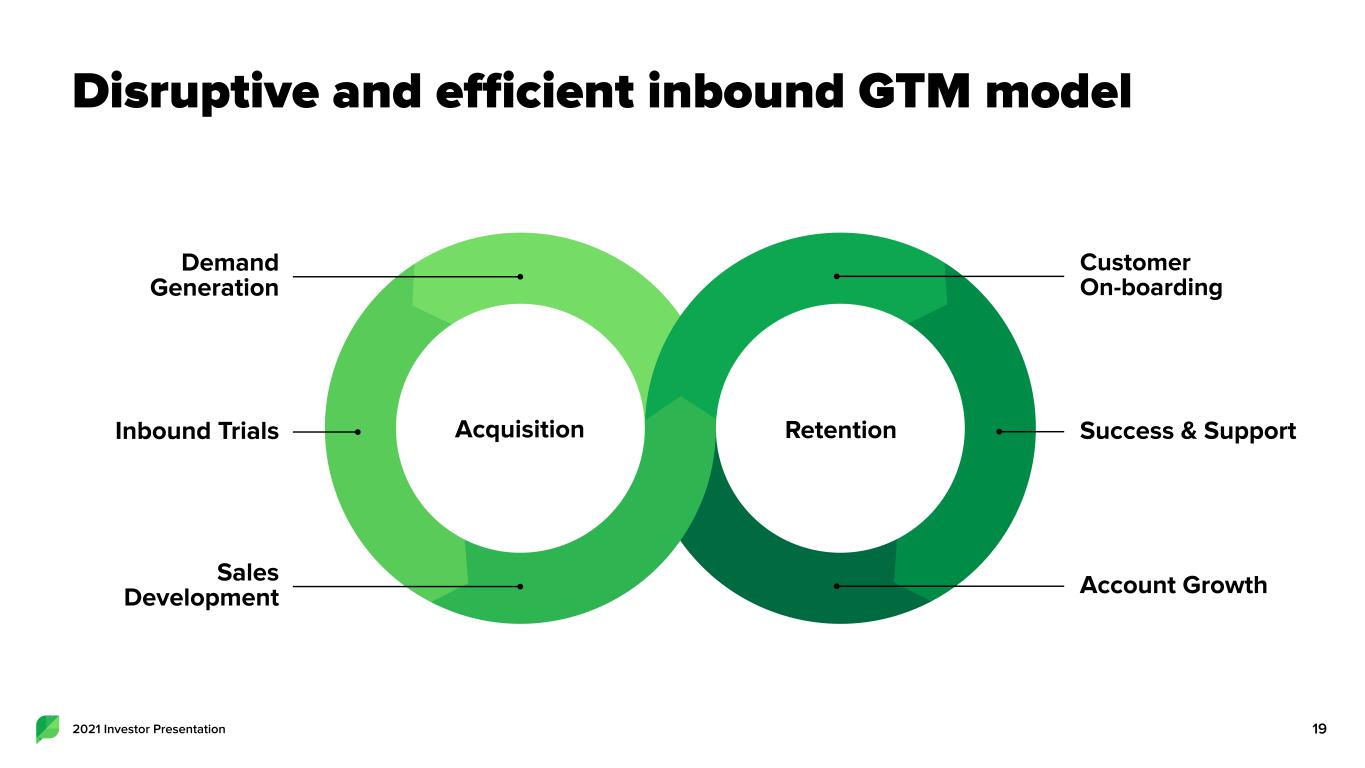
Disruptive and efficient inbound GTM model 192021 Investor Presentation Success & Support Account Growth Customer On-boarding RetentionInbound Trials Sales Development Demand Generation Acquisition
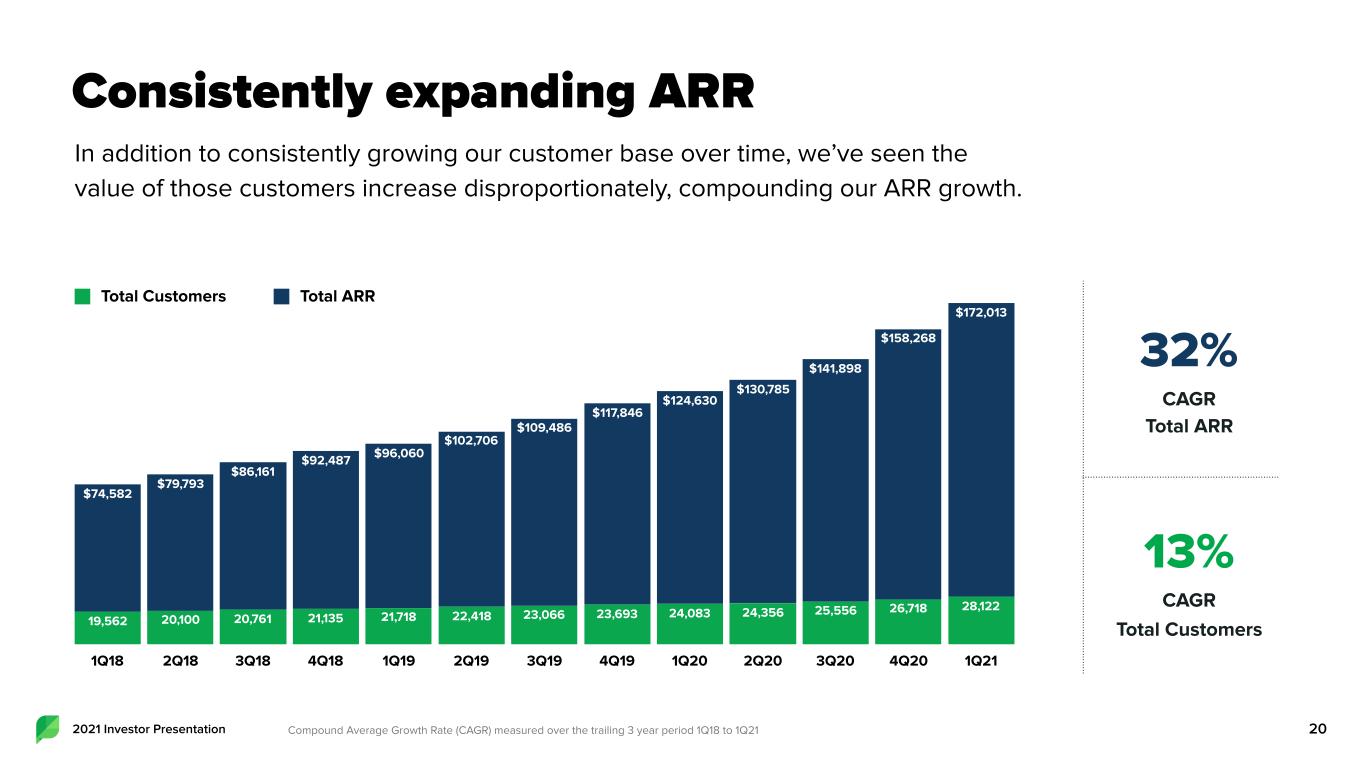
2021 Investor Presentation 20 1Q18 2Q18 3Q18 4Q18 1Q19 2Q19 3Q19 4Q19 1Q20 2Q20 3Q20 4Q20 1Q21 $172,013 $158,268 $141,898 $130,785 $124,630 $117,846 $109,486 $102,706 $96,060 $92,487 $86,161 $79,793 $74,582 28,12226,71825,55624,35624,08323,69323,06622,41821,71821,13520,76120,10019,562 Total Customers Total ARR Consistently expanding ARR In addition to consistently growing our customer base over time, we’ve seen the value of those customers increase disproportionately, compounding our ARR growth. 13% CAGR Total Customers 32% CAGR Total ARR Compound Average Growth Rate (CAGR) measured over the trailing 3 year period 1Q18 to 1Q21
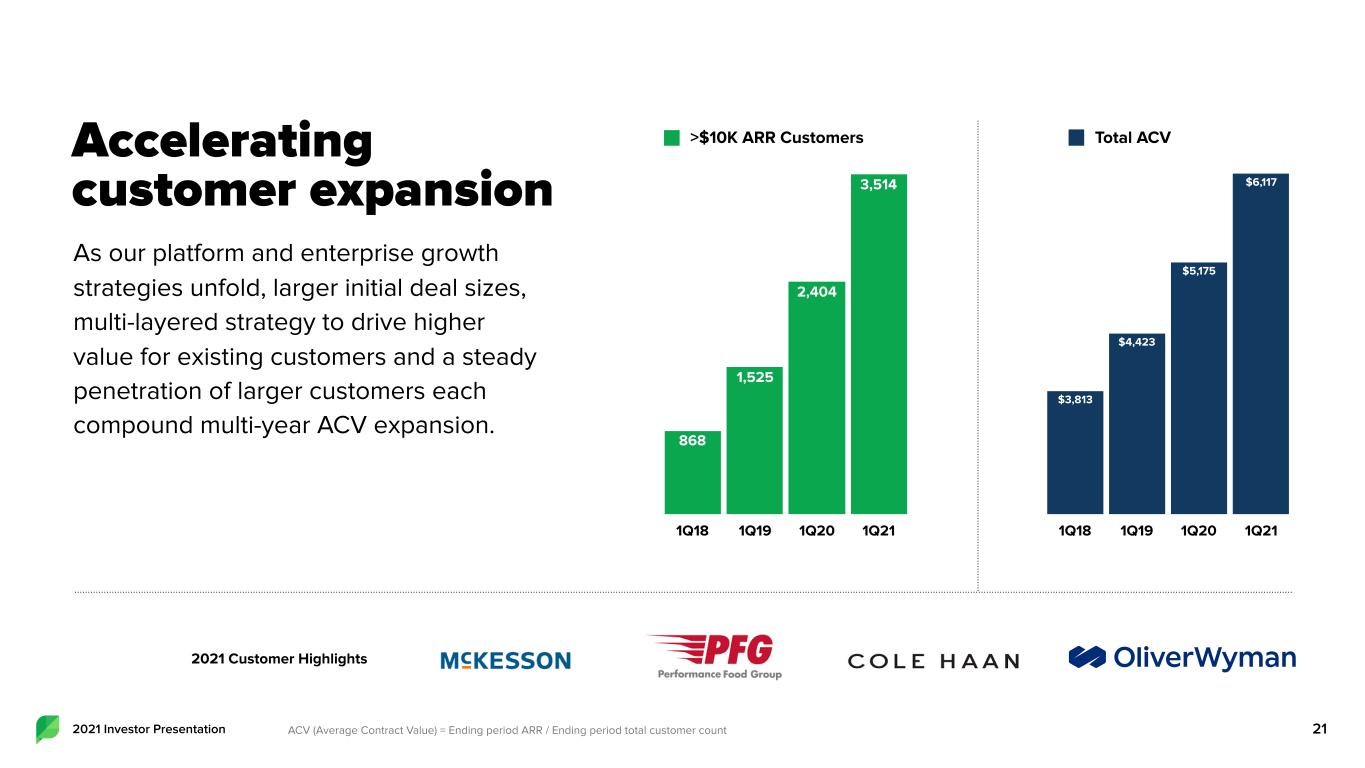
2021 Investor Presentation 21 1Q18 1Q19 1Q20 1Q21 3,514 2,404 1,525 868 >$10K ARR Customers 1Q18 1Q19 1Q20 1Q21 $6,117 $5,175 $4,423 $3,813 Total ACVAccelerating customer expansion As our platform and enterprise growth strategies unfold, larger initial deal sizes, multi-layered strategy to drive higher value for existing customers and a steady penetration of larger customers each compound multi-year ACV expansion. 2021 Customer Highlights ACV (Average Contract Value) = Ending period ARR / Ending period total customer count
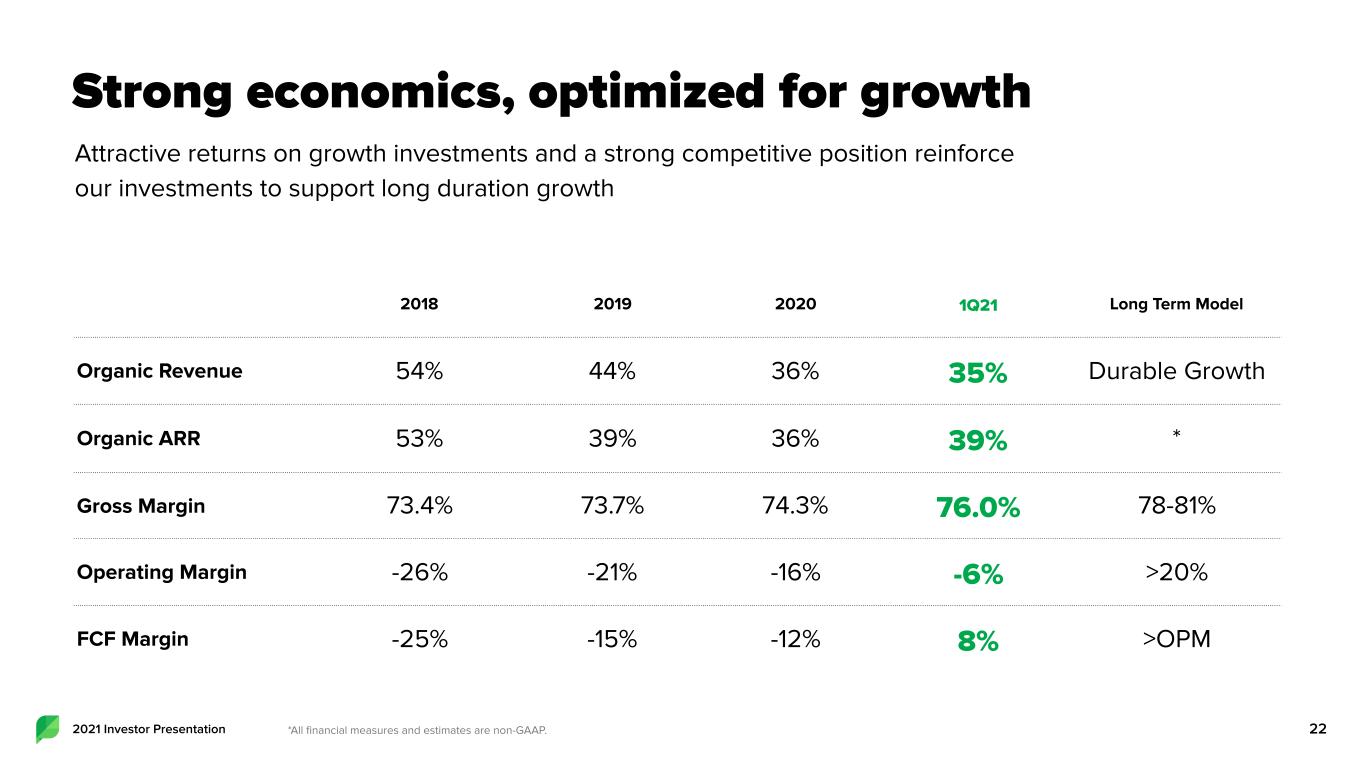
2021 Investor Presentation Strong economics, optimized for growth Attractive returns on growth investments and a strong competitive position reinforce our investments to support long duration growth 22 2018 2019 2020 1Q21 Long Term Model Organic Revenue 54% 44% 36% 35% Durable Growth Organic ARR 53% 39% 36% 39% * Gross Margin 73.4% 73.7% 74.3% 76.0% 78-81% Operating Margin -26% -21% -16% -6% >20% FCF Margin -25% -15% -12% 8% >OPM *All financial measures and estimates are non-GAAP.
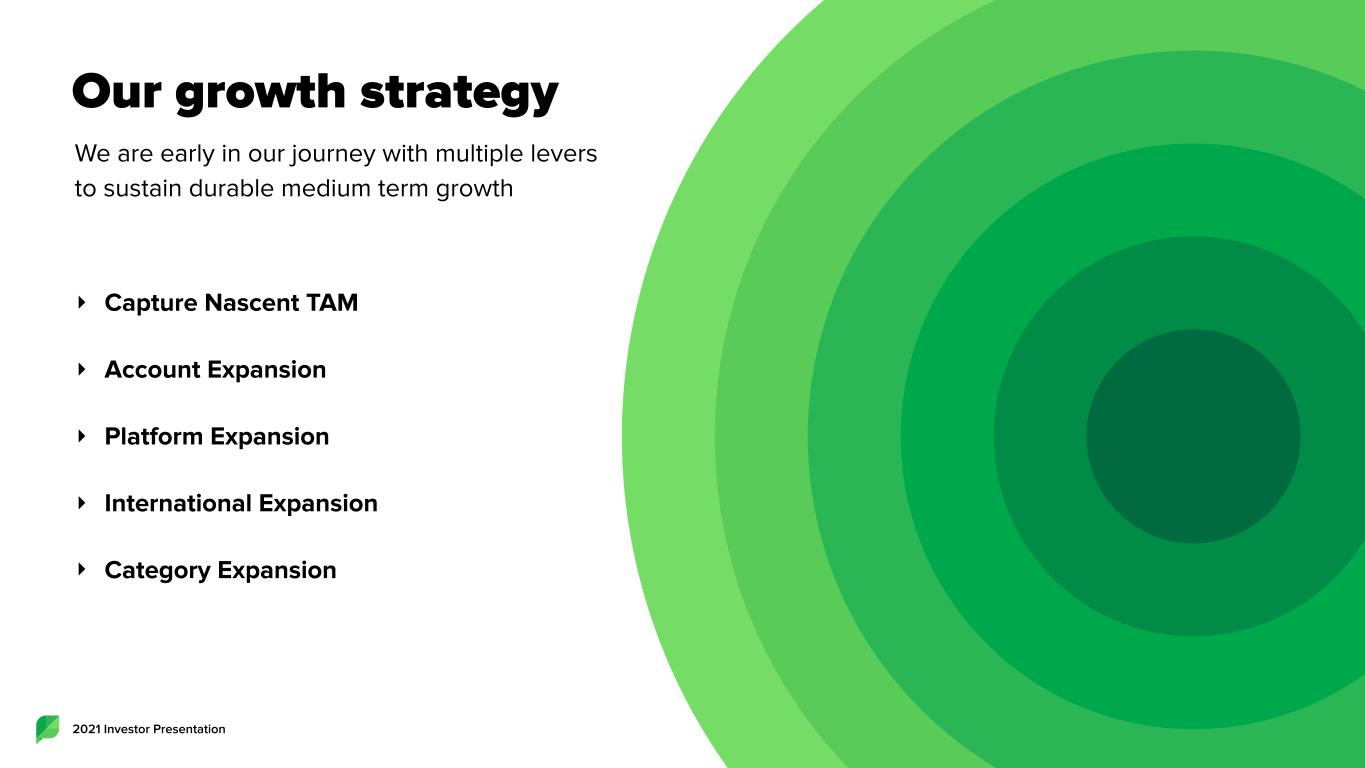
2021 Investor Presentation Our growth strategy We are early in our journey with multiple levers to sustain durable medium term growth 23 ‣ Capture Nascent TAM ‣ Account Expansion ‣ Platform Expansion ‣ International Expansion ‣ Category Expansion
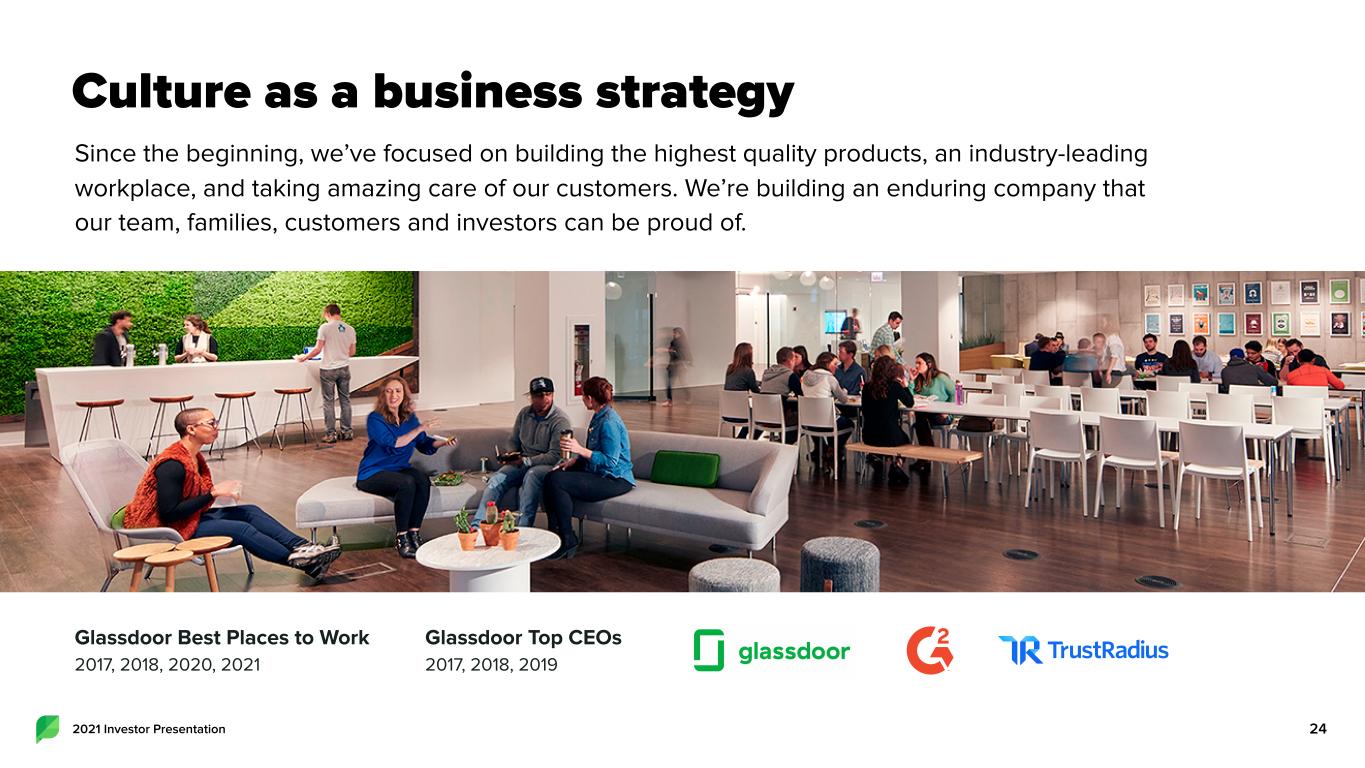
2021 Investor Presentation Culture as a business strategy 24 Since the beginning, we’ve focused on building the highest quality products, an industry-leading workplace, and taking amazing care of our customers. We’re building an enduring company that our team, families, customers and investors can be proud of. Glassdoor Top CEOs 2017, 2018, 2019 Glassdoor Best Places to Work 2017, 2018, 2020, 2021

2021 Investor Presentation Driven by a world-class leadership team 25 Heidi Jonas General Counsel Joe Del Preto CFO Jamie Gilpin CMO Maureen Calabrese CPO Ryan Barretto President Rachael Pfenning SVP, Operations Peter Soung Dir. Product & Engineering Alan Boyce SVP, Engineering Aaron Rankin CTO Justyn Howard CEO Gil Lara CCO Team Background
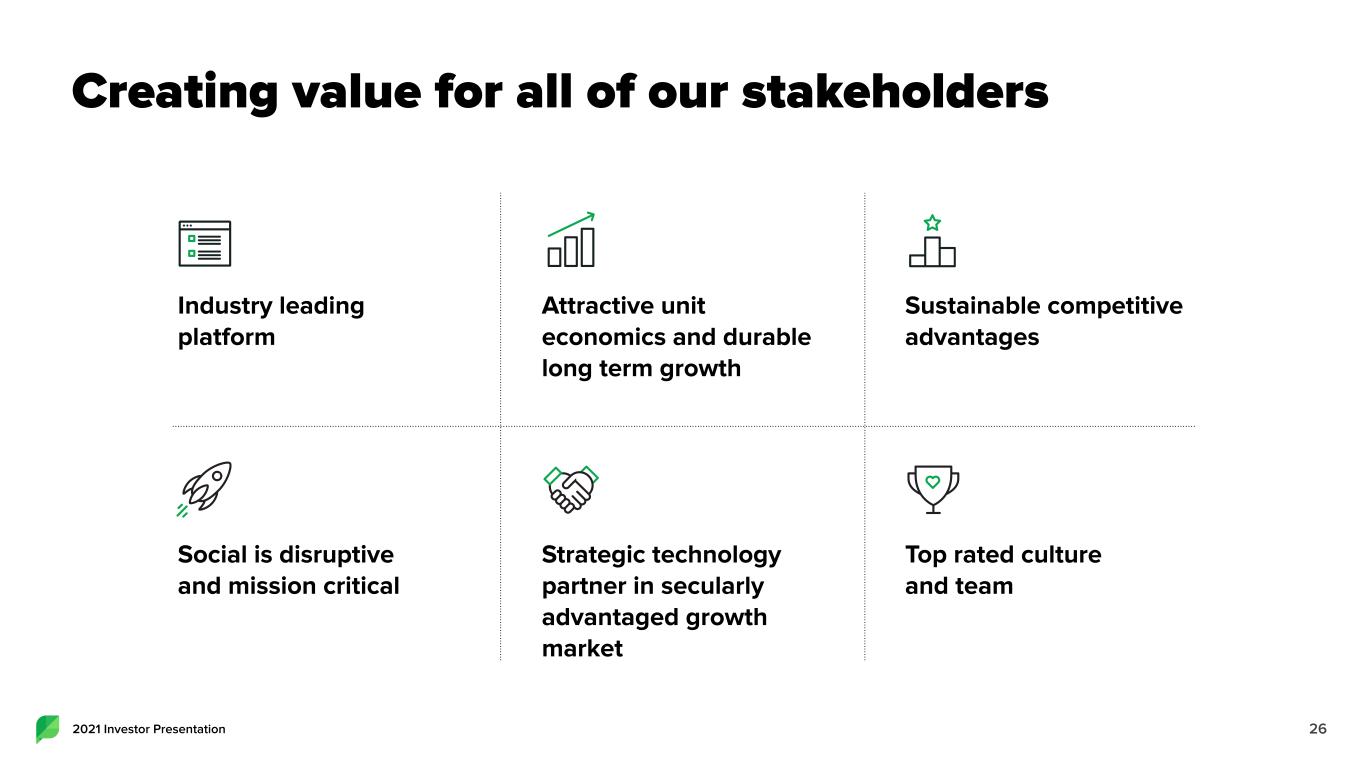
Creating value for all of our stakeholders 262021 Investor Presentation Social is disruptive and mission critical Attractive unit economics and durable long term growth Strategic technology partner in secularly advantaged growth market Sustainable competitive advantages Top rated culture and team Industry leading platform
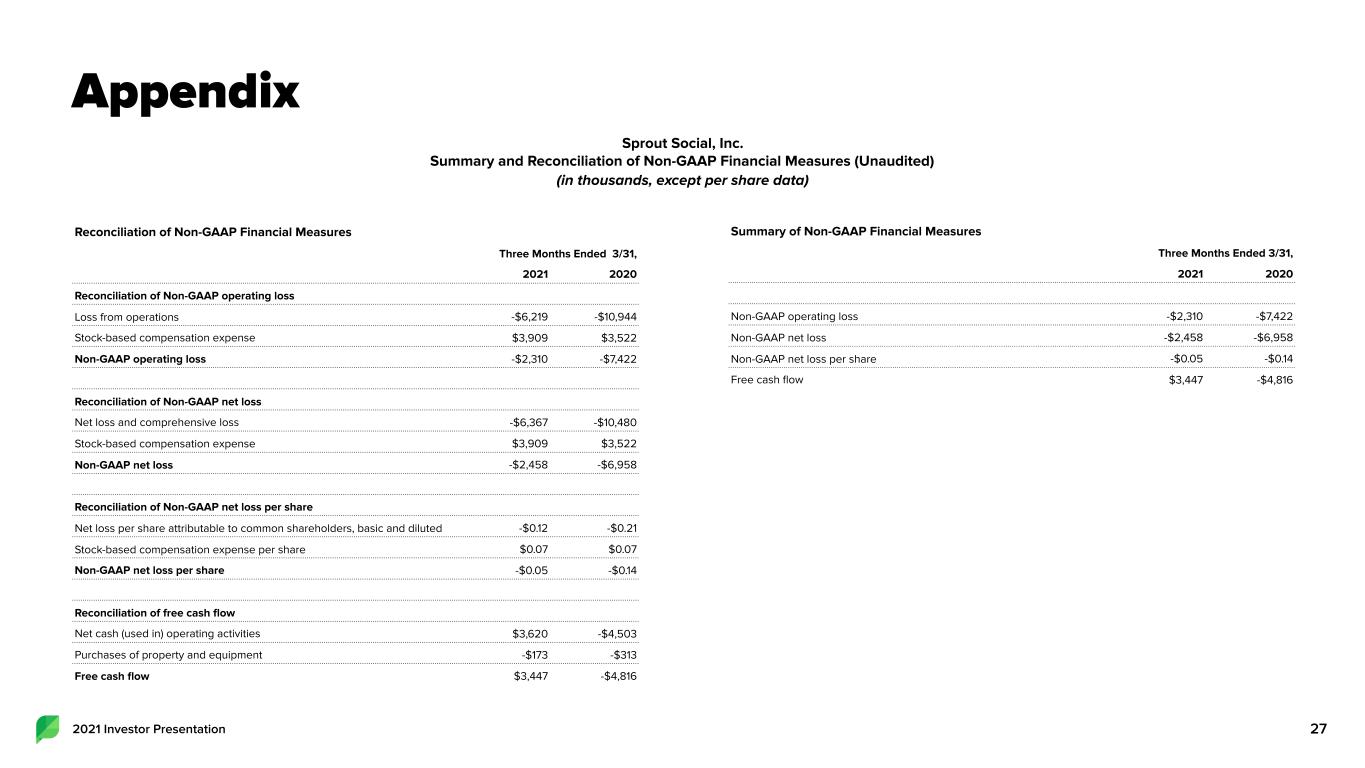
Appendix 272021 Investor Presentation Sprout Social, Inc. Summary and Reconciliation of Non-GAAP Financial Measures (Unaudited) (in thousands, except per share data) Reconciliation of Non-GAAP Financial Measures Three Months Ended 3/31, 2021 2020 Reconciliation of Non-GAAP operating loss Loss from operations -$6,219 -$10,944 Stock-based compensation expense $3,909 $3,522 Non-GAAP operating loss -$2,310 -$7,422 Reconciliation of Non-GAAP net loss Net loss and comprehensive loss -$6,367 -$10,480 Stock-based compensation expense $3,909 $3,522 Non-GAAP net loss -$2,458 -$6,958 Reconciliation of Non-GAAP net loss per share Net loss per share attributable to common shareholders, basic and diluted -$0.12 -$0.21 Stock-based compensation expense per share $0.07 $0.07 Non-GAAP net loss per share -$0.05 -$0.14 Reconciliation of free cash flow Net cash (used in) operating activities $3,620 -$4,503 Purchases of property and equipment -$173 -$313 Free cash flow $3,447 -$4,816 Summary of Non-GAAP Financial Measures Three Months Ended 3/31, 2021 2020 Non-GAAP operating loss -$2,310 -$7,422 Non-GAAP net loss -$2,458 -$6,958 Non-GAAP net loss per share -$0.05 -$0.14 Free cash flow $3,447 -$4,816
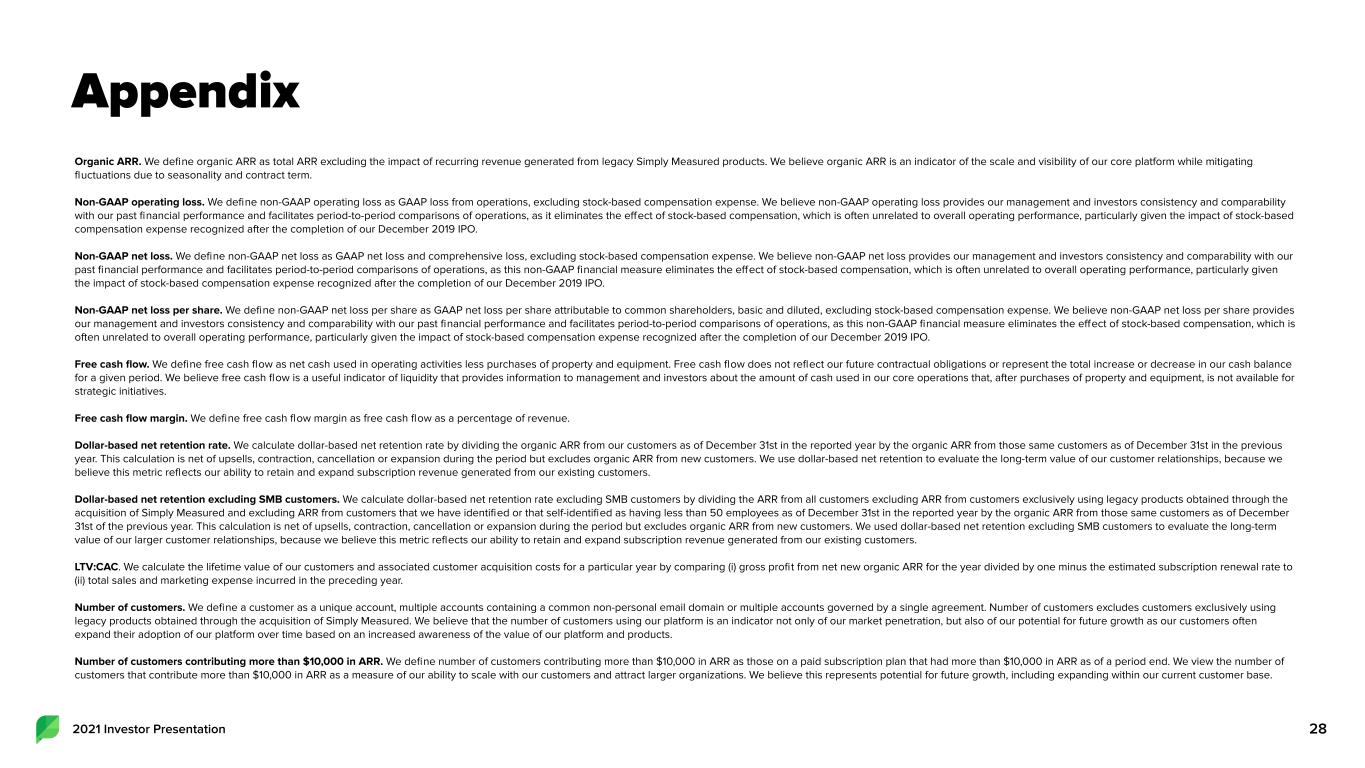
Appendix Organic ARR. We define organic ARR as total ARR excluding the impact of recurring revenue generated from legacy Simply Measured products. We believe organic ARR is an indicator of the scale and visibility of our core platform while mitigating fluctuations due to seasonality and contract term. Non-GAAP operating loss. We define non-GAAP operating loss as GAAP loss from operations, excluding stock-based compensation expense. We believe non-GAAP operating loss provides our management and investors consistency and comparability with our past financial performance and facilitates period-to-period comparisons of operations, as it eliminates the effect of stock-based compensation, which is often unrelated to overall operating performance, particularly given the impact of stock-based compensation expense recognized after the completion of our December 2019 IPO. Non-GAAP net loss. We define non-GAAP net loss as GAAP net loss and comprehensive loss, excluding stock-based compensation expense. We believe non-GAAP net loss provides our management and investors consistency and comparability with our past financial performance and facilitates period-to-period comparisons of operations, as this non-GAAP financial measure eliminates the effect of stock-based compensation, which is often unrelated to overall operating performance, particularly given the impact of stock-based compensation expense recognized after the completion of our December 2019 IPO. Non-GAAP net loss per share. We define non-GAAP net loss per share as GAAP net loss per share attributable to common shareholders, basic and diluted, excluding stock-based compensation expense. We believe non-GAAP net loss per share provides our management and investors consistency and comparability with our past financial performance and facilitates period-to-period comparisons of operations, as this non-GAAP financial measure eliminates the effect of stock-based compensation, which is often unrelated to overall operating performance, particularly given the impact of stock-based compensation expense recognized after the completion of our December 2019 IPO. Free cash flow. We define free cash flow as net cash used in operating activities less purchases of property and equipment. Free cash flow does not reflect our future contractual obligations or represent the total increase or decrease in our cash balance for a given period. We believe free cash flow is a useful indicator of liquidity that provides information to management and investors about the amount of cash used in our core operations that, after purchases of property and equipment, is not available for strategic initiatives. Free cash flow margin. We define free cash flow margin as free cash flow as a percentage of revenue. Dollar-based net retention rate. We calculate dollar-based net retention rate by dividing the organic ARR from our customers as of December 31st in the reported year by the organic ARR from those same customers as of December 31st in the previous year. This calculation is net of upsells, contraction, cancellation or expansion during the period but excludes organic ARR from new customers. We use dollar-based net retention to evaluate the long-term value of our customer relationships, because we believe this metric reflects our ability to retain and expand subscription revenue generated from our existing customers. Dollar-based net retention excluding SMB customers. We calculate dollar-based net retention rate excluding SMB customers by dividing the ARR from all customers excluding ARR from customers exclusively using legacy products obtained through the acquisition of Simply Measured and excluding ARR from customers that we have identified or that self-identified as having less than 50 employees as of December 31st in the reported year by the organic ARR from those same customers as of December 31st of the previous year. This calculation is net of upsells, contraction, cancellation or expansion during the period but excludes organic ARR from new customers. We used dollar-based net retention excluding SMB customers to evaluate the long-term value of our larger customer relationships, because we believe this metric reflects our ability to retain and expand subscription revenue generated from our existing customers. LTV:CAC. We calculate the lifetime value of our customers and associated customer acquisition costs for a particular year by comparing (i) gross profit from net new organic ARR for the year divided by one minus the estimated subscription renewal rate to (ii) total sales and marketing expense incurred in the preceding year. Number of customers. We define a customer as a unique account, multiple accounts containing a common non-personal email domain or multiple accounts governed by a single agreement. Number of customers excludes customers exclusively using legacy products obtained through the acquisition of Simply Measured. We believe that the number of customers using our platform is an indicator not only of our market penetration, but also of our potential for future growth as our customers often expand their adoption of our platform over time based on an increased awareness of the value of our platform and products. Number of customers contributing more than $10,000 in ARR. We define number of customers contributing more than $10,000 in ARR as those on a paid subscription plan that had more than $10,000 in ARR as of a period end. We view the number of customers that contribute more than $10,000 in ARR as a measure of our ability to scale with our customers and attract larger organizations. We believe this represents potential for future growth, including expanding within our current customer base. 282021 Investor Presentation