Sensient Technologies Corp 8-K, filed Feb 8, 2024
Sensient Technologies Corp (SXT)
8-K
2024-02-08
For: 2024-02-06
View Original
Added on
April 10, 2026
About this 8-K
Sensient Technologies Corp filed this 8-K on February 8, 2024, reporting on events of February 6, 2024.
Items reported
- Item 2.02: Financial results
- Item 2.05: Exit or restructuring costs
- Item 5.02: Director or officer change, or executive pay
- Item 7.01: Regulation FD disclosure
- Item 9.01: Financial statements and exhibits
UNITED STATES SECURITIES AND EXCHANGE COMMISSION
WASHINGTON, D.C. 20549
FORM 8-K
CURRENT REPORT
Pursuant to Section 13 or 15(d) of the Securities Exchange Act of 1934
(Date of Report/Date of earliest event reported)
(Exact name of registrant as specified in its charter)
|
(State or other jurisdiction of incorporation)
|
(Commission File Number)
|
(IRS Employer Identification No.)
|
(Address and zip code of principal executive offices)
(414 ) 271-6755
(Registrant’s telephone number, including area code)
N/A
(Former name or former address, if changed since last report)
Check the appropriate box below if the Form 8-K filing is intended to simultaneously satisfy the filing obligation of the registrant under any of the following
provisions:
|
Written communications pursuant to Rule 425 under the Securities Act (17 CFR 230.425)
|
|
Soliciting material pursuant to Rule 14a-12 under the Exchange Act (17 CFR 240.14a-12)
|
|
Pre-commencement communications pursuant to Rule 14d-2(b) under the Exchange Act (17 CFR 240.14d-2(b))
|
|
Pre-commencement communications pursuant to Rule 13e-4(c) under the Exchange Act (17 CFR 240.13e-4(c))
|
Securities registered pursuant to Section 12(b) of the Act:
|
Title of each class
|
Trading Symbol(s)
|
Name of each exchange on which registered
|
Indicate by check mark whether the registrant is an emerging growth company as defined in Rule 405 of the Securities Act of 1933 (§230.405 of this chapter) or Rule 12b-2
of the Securities Exchange Act of 1934 (§240.12b-2 of this chapter).
Emerging growth company ☐
If an emerging growth company, indicate by check mark if the registrant has elected not to use the extended transition period for complying with any new or revised
financial accounting standards provided pursuant to Section 13(a) of the Exchange Act. ☐
| Item 2.02 |
Results of Operations and Financial Condition.
|
Sensient Technologies Corporation (the “Company”) issued a press release on February 8, 2024, disclosing its results of operations for its quarter and year ended December
31, 2023, and its financial condition at that date. The press release is furnished as Exhibit 99.1 to this Current Report on Form 8-K.
The information contained in this Item 2.02 (including Exhibit 99.1) is intended to be furnished under Item 2.02 of Form 8-K and shall not be deemed
“filed” for purposes of Section 18 of the Securities Exchange Act of 1934, as amended (the “Exchange Act”), or otherwise subject to the liabilities of that section, nor shall it be deemed to be incorporated by reference into any registration
statement or other document filed under the Securities Act of 1933, as amended, or the Exchange Act.
| Item 2.05 |
Costs Associated with Exit or Disposal Activities.
|
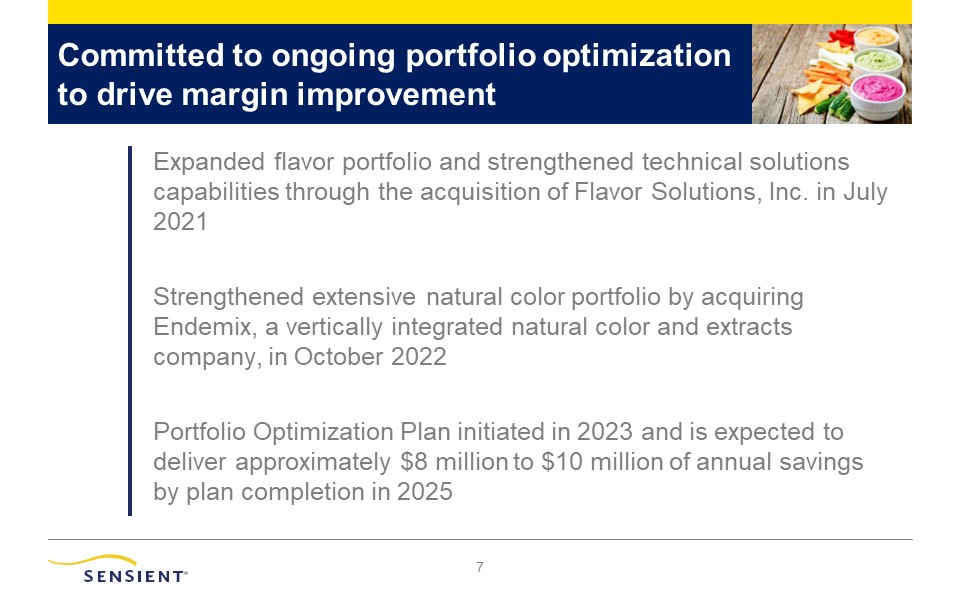
On February 8, 2024, the Company announced its portfolio optimization plan (the “Plan”)
to undertake an effort to optimize certain production facilities and improve efficiencies within the Company. As part of the Plan, in the Flavors & Extracts segment, the Company is evaluating the potential closure of its manufacturing
facility in Felinfach, Wales, United Kingdom, the potential closure of its sales office in Granada, Spain, and the potential centralization and elimination of certain selling and administrative positions. In addition, in the Color segment, the
Company is closing a manufacturing facility in Delta, British Columbia, Canada, closing a sales office in Argentina, and centralizing and eliminating certain production positions as well as potentially eliminating some selling and
administrative positions. The Company expects the Plan to be substantially completed by the end of 2025, subject to local law and consultation requirements and the Company’s business needs.
Given the consultation requirements, the Company cannot provide a final, definitive financial impact. If all contemplated actions were taken, the
Company would expect that the Plan would reduce annual operating costs by approximately $8 million to $10 million, with the full benefit expected to be achieved after 2025.
If all contemplated actions were taken, the Company would also expect the Plan to cost approximately $40 million, including approximately $8 million in
future cash expenditures in connection with the Plan. The expected total Plan costs are primarily related to non-cash impairment charges (approximately $22 million), employee separation costs (approximately $5 million), and non-cash inventory
charges (approximately $3 million).
If all contemplated actions were taken, the Company would potentially reduce headcount by approximately 130 positions, which would be primarily in the
Flavors & Extracts and Color segments, related to certain production and selling and administrative positions. As discussed, decisions regarding the elimination of positions are subject to local law and consultation requirements in certain
countries, as well as the Company’s business needs.
This Item 2.05 contains “forward-looking statements” within the meaning of the Private Securities Litigation Reform Act of 1995, including, but not
limited to, statements related to expected costs and expected cost savings. These forward-looking statements are based on the Company’s current expectations and inherently involve significant risks and uncertainties. The Company’s actual results
and the timing of events could differ materially from those anticipated in such forward-looking statements as a result of these risks and uncertainties. These risks and uncertainties include, among other things, the risk that the restructuring
costs and charges may be greater than anticipated; the risk that the Company’s restructuring efforts may be distracting to employees and management; and the risk that the Company’s restructuring efforts (including the use of any expense savings
therefrom) and the Company’s strategic and operating initiatives may not generate their intended benefits to the extent or as quickly as anticipated. Investors should not rely on forward-looking statements because they are subject to a variety of
risks, uncertainties, and other factors that could cause actual results to differ materially from our expectations. Please refer to our Form 10-K, Form 10-Qs, and our other filings with the U.S. Securities and Exchange Commission concerning
factors that could cause actual results to differ materially from those described in our forward-looking statements.
| Item 5.02 |
Departure of Directors or Certain Officers; Election of Directors; Appointment of Certain Officers; Compensatory Arrangements of Certain Officers.
|
On February 6, 2024, Stephen J. Rolfs, Senior Vice President and Chief Financial Officer of the Company, provided notice of his intent to retire from his employment with
the Company on June 30, 2024. On February 8, 2024, the Company announced that Tobin Tornehl, the Company’s current Vice President, Controller and Chief Accounting Officer, will succeed Mr. Rolfs as the Company’s Vice President and Chief Financial
Officer and principal financial officer upon the effectiveness of Mr. Rolfs’s retirement. Mr. Tornehl’s biographical information is set forth in the Company’s Annual Report on Form 10-K filed with the Securities and Exchange Commission on February
17, 2023, and such information is incorporated herein by reference.
In connection with Mr. Tornehl’ s appointment, he will (1) receive a base salary of $400,000, (2) continue to participate in the Company’s annual incentive plan for
fiscal year 2024, with a prorated target bonus of 65% of his base salary, and (3) receive long-term equity incentive awards consistent with the awards granted to the Company’s executives relative to his position and experience, including a prorated
award at the time he assumes his new position. Mr. Tornehl will continue to be eligible to participate in all employee benefit plans generally available to executives of the Company, which are more fully described in the Company’s definitive proxy
statement on Schedule 14A filed with the Securities and Exchange Commission on March 15, 2023.
There are no transactions since the beginning of the Company’s last fiscal year in which the Company is a participant and in which Mr. Tornehl or any members of his
immediate family have any interest that are required to be reported under Item 404(a) of Regulation S-K. No family relationships exist between Mr. Tornehl and any of the Company’s directors or executive officers. The appointment of Mr. Tornehl was
not pursuant to any arrangement or understanding between him and any person, other than a director or executive officer of the Company acting in his or her official capacity.
| Item 7.01 |
Regulation FD Disclosure.
|
On February 8, 2024, the Company also posted an updated investor presentation for its quarter and year ended December 31, 2023, on the “Investor
Information” section of its website. A copy of the investor presentation is furnished as Exhibit 99.2 to this Current Report on Form 8-K.
The information contained in this Item 7.01 (including Exhibit 99.2) is intended to be furnished under Item 7.01 of Form 8-K and shall not be deemed
“filed” for purposes of Section 18 of the Exchange Act, or otherwise subject to the liabilities of that section, nor shall it be deemed to be incorporated by reference into any registration statement or other document filed under the Securities
Act of 1933, as amended, or the Exchange Act.
| Item 9.01 |
Financial Statements and Exhibits.
|
|
(d)
|
Exhibits. The following exhibits are furnished with this Current Report
on Form 8-K:
|
EXHIBIT INDEX
|
Exhibit Number
|
Description
|
|
Sensient Technologies Corporation Earnings Press Release for the Quarter and Year Ended December 31, 2023.
|
|
|
Sensient Technologies Corporation Investor Presentation – Q4 2023.
|
|
|
104
|
Cover Page Interactive Data File (embedded within the Inline XBRL document).
|
SIGNATURES
Pursuant to the requirements of the Securities Exchange Act of 1934, the registrant has duly caused this report to be signed on its behalf by the undersigned hereunto
duly authorized.
|
SENSIENT TECHNOLOGIES
CORPORATION
|
|||
|
By:
|
/s/ John J. Manning
|
||
|
Name:
|
John J. Manning
|
||
|
Title:
|
Senior Vice President, General Counsel, and Secretary
|
||
|
Date:
|
February 8, 2024
|
||
Exhibit 99.1
 |
Contact:
Amy Agallar
(414) 347-3706
investor.relations@sensient.com
|
Sensient Technologies Corporation
Reports Results for the Quarter Ended December 31, 2023
MILWAUKEE— February 8, 2024 — Sensient Technologies Corporation (NYSE: SXT), a leading provider of flavors and
colors for the food, pharmaceutical, and personal care markets, today reported financial results for the fourth quarter ended December 31, 2023. The Company also announced its Portfolio Optimization Plan, pending changes to its officer group, as
well as a nominee for election to its Board of Directors at its 2024 annual meeting of shareholders.
Fourth Quarter Consolidated Results
| • |
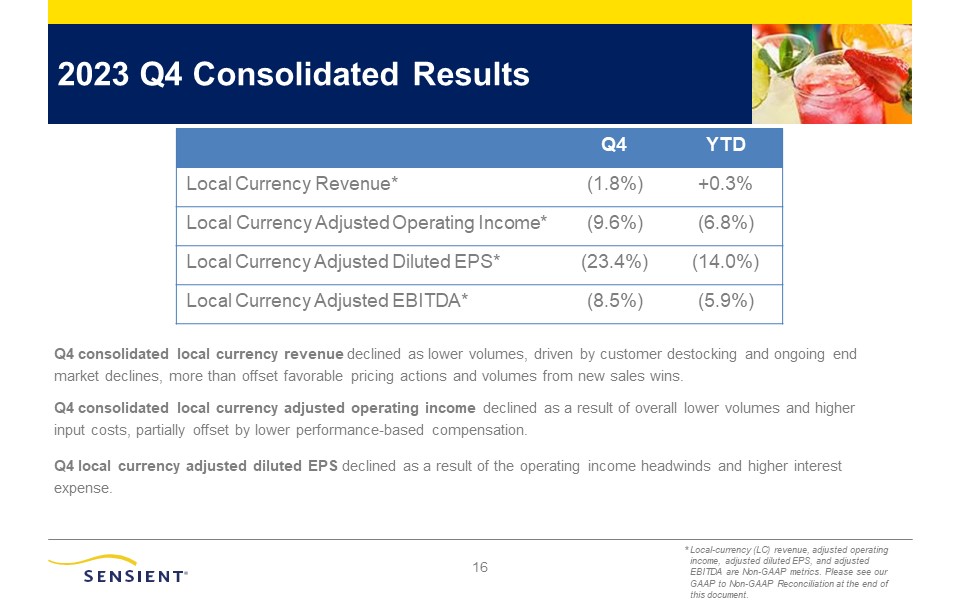
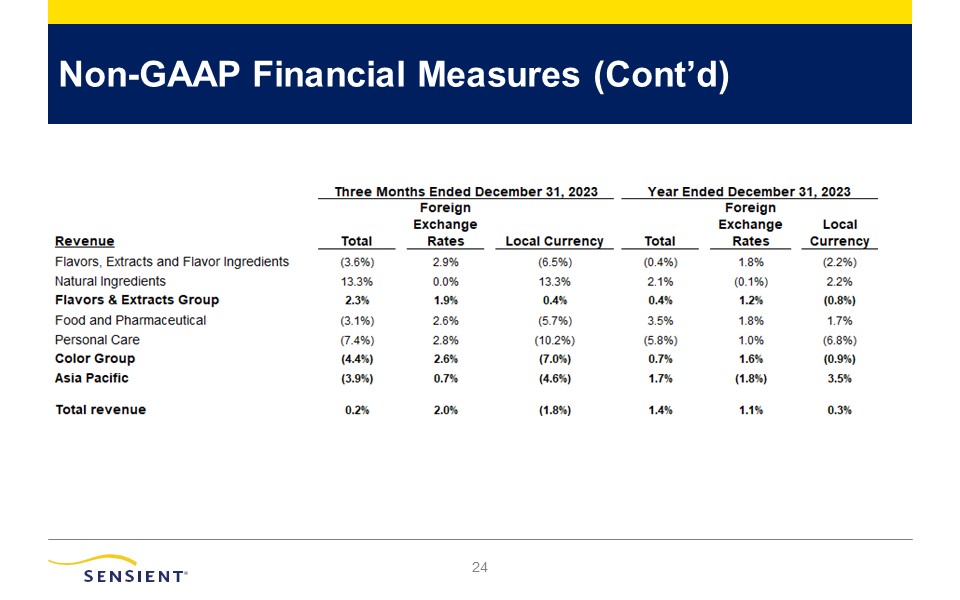
Reported revenue increased 0.2% to $349.3 million in the fourth quarter of 2023 versus last year’s fourth quarter results of $348.7 million. On a local currency basis(1), revenue
decreased 1.8%.
|
| • |
Reported operating income declined 80.4% to $8.1 million compared to $41.2 million recorded in the fourth quarter of 2022. In the fourth quarter of 2023, the Company recorded $27.8 million of
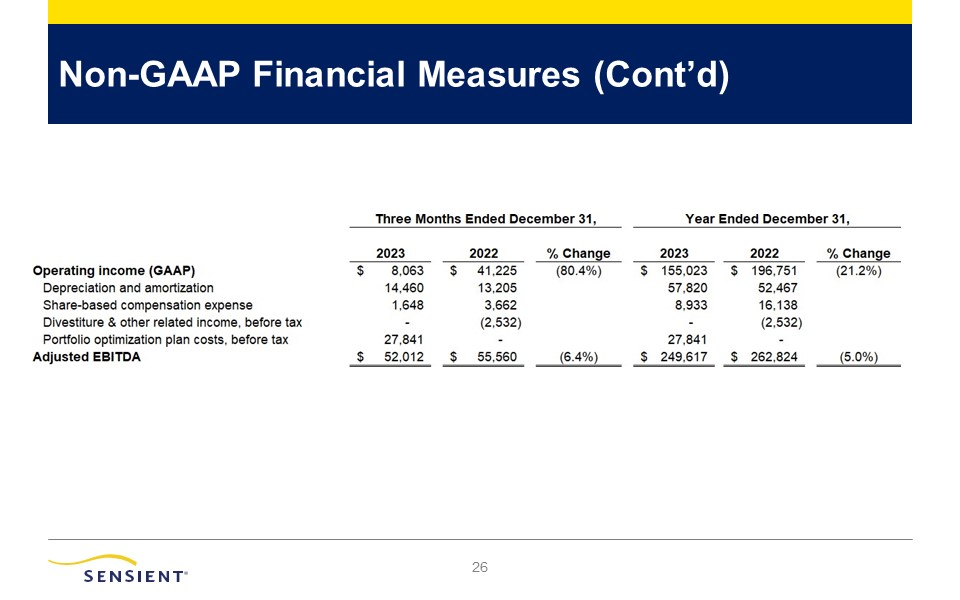
costs, primarily non-cash, related to its recently enacted Portfolio Optimization Plan. Adjusted local currency operating income(1) and local currency adjusted EBITDA(1) decreased 9.6% and 8.5%, respectively, in the
fourth quarter, with each decreasing as a result of lower sales volumes.
|
| • |
Reported earnings per share was a loss of 14 cents in the fourth quarter of 2023 compared to income of 69 cents in the fourth quarter of 2022. Adjusted local currency EPS(1) decreased
23.4% in the fourth quarter as a result of lower sales volumes and higher interest expense.
|
“As expected, 2023 was a transitional year for the market and Sensient as inflation
and destocking provided significant headwinds. I expect a better environment in 2024 with a return to volume growth and continuation of our strong sales win rate. Concurrently, we are proactively reducing costs through a Portfolio Optimization
Plan that we expect to provide significant cost savings. Overall, I am optimistic about 2024,” said Paul Manning, Sensient’s Chairman, President, and Chief Executive Officer.
|
Sensient Technologies Corporation
Earnings Release – Quarter Ended December 31, 2023
February 8, 2024
|
Page 2 |
Fourth Quarter Group Results
|
Reported
|
Local Currency(1)
|
|||||||
|
Revenue
|
Quarter
|
Year-to-Date
|
Quarter
|
Year-to-Date
|
||||
|
Flavors & Extracts
|
2.3%
|
0.4%
|
0.4%
|
-0.8%
|
||||
|
Color
|
-4.4%
|
0.7%
|
-7.0%
|
-0.9%
|
||||
|
Asia Pacific
|
-3.9%
|
1.7%
|
-4.6%
|
3.5%
|
||||
|
Total Revenue
|
0.2%
|
1.4%
|
-1.8%
|
0.3%
|
||||
|
Reported
|
Adjusted Local Currency(1)
|
|||||||
|
Operating Profit
|
Quarter
|
Year-to-Date
|
Quarter
|
Year-to-Date
|
||||
|
Flavors & Extracts
|
-16.0%
|
-16.7%
|
-16.6%
|
-17.3%
|
||||
|
Color
|
-13.2%
|
-8.1%
|
-16.2%
|
-9.6%
|
||||
|
Asia Pacific
|
-11.0%
|
4.4%
|
-11.9%
|
6.3%
|
||||
|
Total Operating Profit
|
-80.4%
|
-21.2%
|
-9.6%
|
-6.8%
|
||||
|
|
|
|
|
|
|
|
|
|
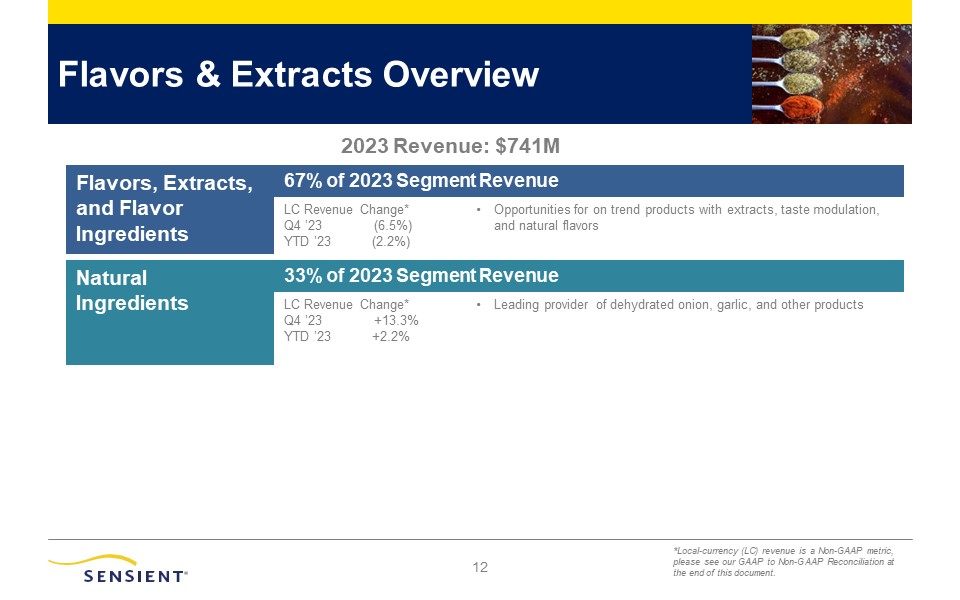
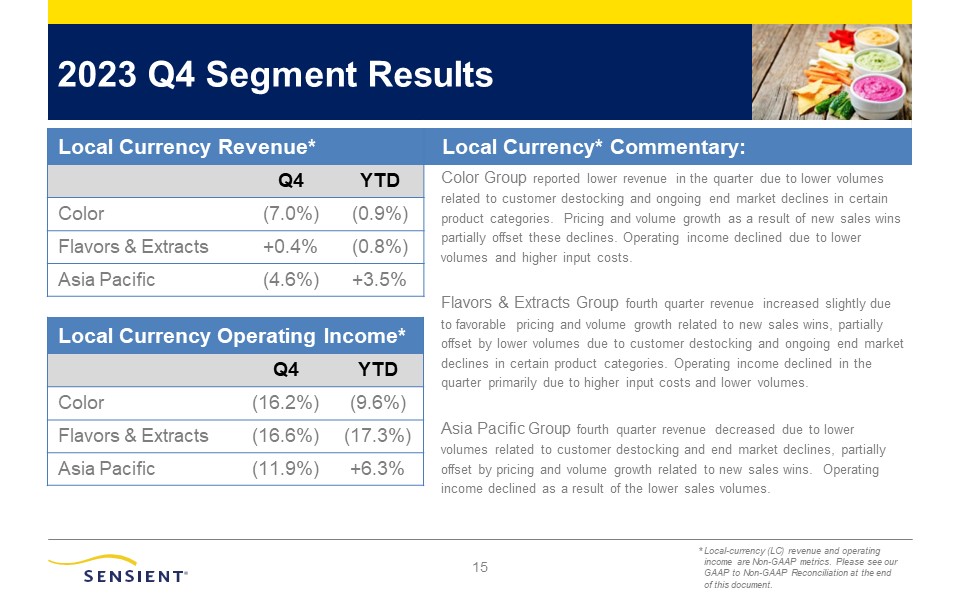
The Flavors & Extracts Group reported fourth quarter 2023 revenue of $182.9 million, an increase of $4.0 million versus the prior year’s fourth
quarter. The Group’s revenue benefited from favorable pricing and exchange rates, partially offset by lower volumes, primarily due to customer destocking and market declines in certain product lines. Segment operating income was $18.1 million in
the fourth quarter of 2023, a decrease of $3.4 million compared to the prior year’s fourth quarter. The lower operating income was primarily due to the lower volumes and higher input costs, partially offset by favorable pricing.
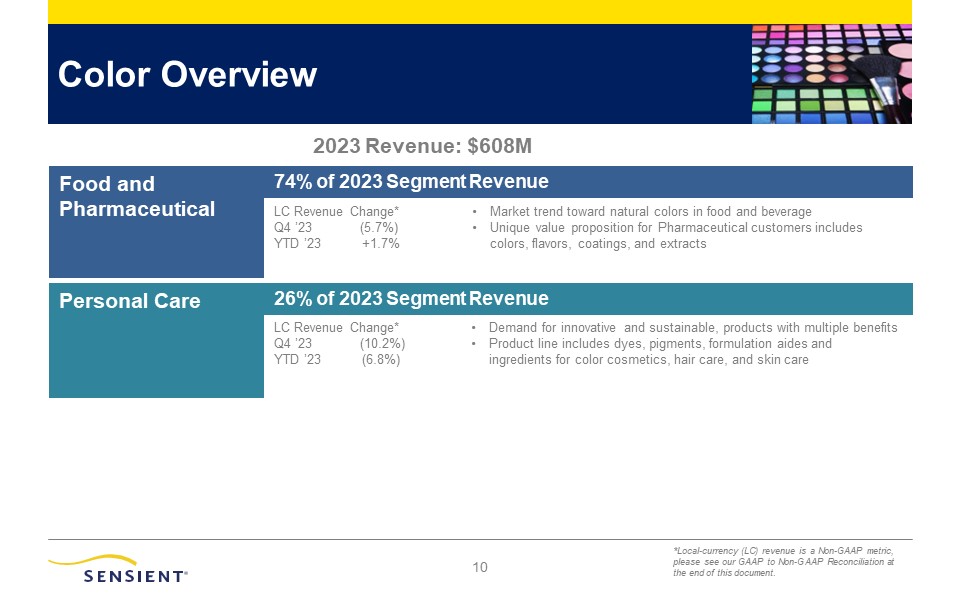
The Color Group reported revenue of $141.4 million in the fourth quarter of 2023, a decrease of $6.4 million compared to the prior year’s fourth
quarter. The Group’s revenue was negatively impacted by lower volumes in both the food and pharmaceutical and personal care product lines, primarily due to customer destocking and market declines in certain product lines, partially offset by
higher pricing and favorable exchange rates. Segment operating income was $21.3 million in the fourth quarter of 2023, a decrease of $3.2 million compared to the prior year’s fourth quarter results. The lower operating income is primarily a
result of the lower volumes and higher input costs, partially offset by favorable pricing and exchange rates.
|
Sensient Technologies Corporation
Earnings Release – Quarter Ended December 31, 2023
February 8, 2024
|
Page 3 |
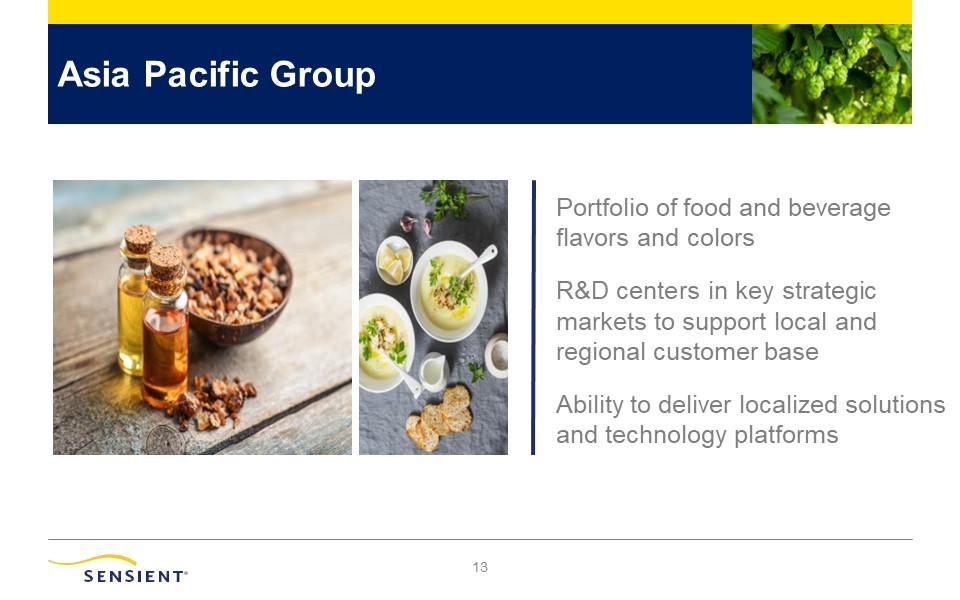
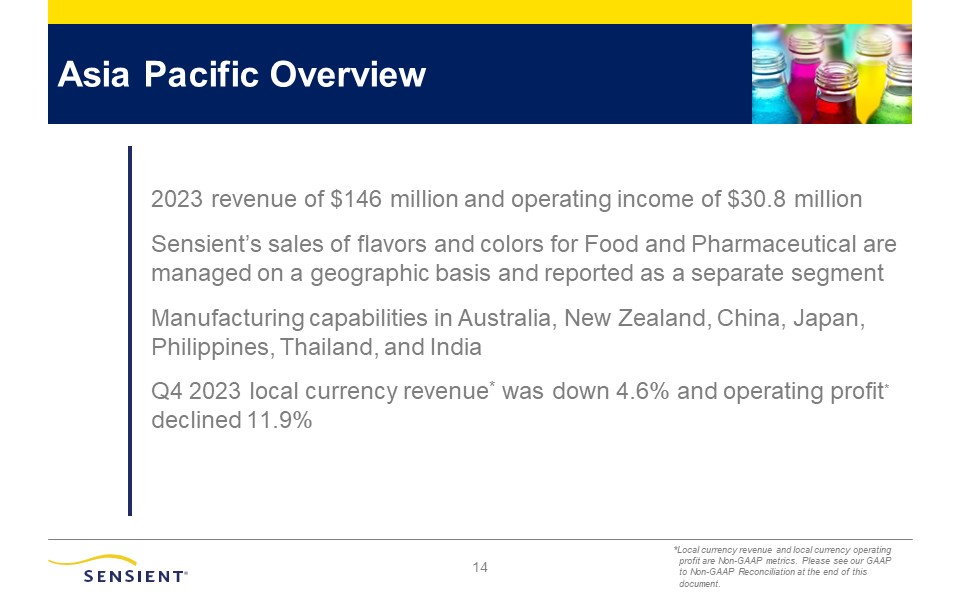
The Asia Pacific Group reported revenue of $33.2 million in the fourth quarter of 2023, a decrease of $1.4 million compared to the prior year’s
fourth quarter. The Group’s revenue was negatively impacted by lower volumes, partially offset by favorable pricing. Segment operating income was $5.9 million in the quarter, a decrease of $0.7 million compared to the prior year’s fourth quarter.
The lower operating income is primarily a result of the lower volumes and higher input costs, partially offset by favorable pricing.
Corporate & Other reported operating expenses of $37.2 million in the fourth quarter of 2023, compared to $11.5 million of operating expenses
reported in the prior year’s fourth quarter. The increase was primarily due to the Portfolio Optimization Plan costs of $27.8 million recorded in the fourth quarter of 2023, which were primarily non-cash costs. In the fourth quarter of 2022, the
Company recorded $2.5 million of divestiture related income related to an earnout payment received in connection with the divestiture of the yogurt fruit preparations business. Adjusted local currency operating expenses(1) for
Corporate & Other decreased $4.6 million compared to the prior year’s fourth quarter, primarily due to lower performance-based compensation recorded in 2023.
During the fourth quarter of 2023, the Company initiated a Portfolio Optimization Plan to undertake an effort to optimize its organizational
structure with a focus on driving improved productivity and delivering cost improvement. The Company currently estimates that the Portfolio Optimization Plan will deliver annual cost savings of approximately $8 million to $10 million once fully
implemented by the end of 2025. Including the costs incurred during the fourth quarter of 2023, the Company currently expects to incur pre-tax charges of approximately $40 million through 2025, of which approximately $30 million will be non-cash.
The Company announced that it is beginning the information and consultation process with certain employee groups in the United Kingdom, France, and Germany that may be impacted by the plan.
|
Sensient Technologies Corporation
Earnings Release – Quarter Ended December 31, 2023
February 8, 2024
|
Page 4 |
In addition, the Company will be increasing its Board of Directors from nine to ten directors and nominating Brett Bruggeman for election to the
Board of Directors at its 2024 annual meeting of shareholders. Mr. Bruggeman is the Chief Operating Officer of Land O’Lakes, Inc., a Fortune 250 food company and one of the world’s premier agribusiness companies. “We are delighted to nominate Brett to the Board. He brings over 30 years of food industry experience, including 16 years at Land O’Lakes. His insights into agribusiness will be invaluable as the Company
continues our expansion in natural colors and flavors across all of its business units,” said Paul Manning, Sensient’s Chairman, President, and Chief Executive Officer.
Sensient also announced today that Stephen Rolfs, Senior Vice President and Chief Financial Officer, has informed the Company that he intends to
retire effective June 30, 2024. Mr. Rolfs has served as Chief Financial Officer since February of 2015. Tobin Tornehl will be named Chief Financial Officer upon Mr. Rolfs’ retirement. Mr. Tornehl joined Sensient in 2008 and has served as Vice
President, Controller, and Chief Accounting Officer, since 2018. Prior to joining Sensient, Mr. Tornehl worked in a variety of financial leadership roles at Jefferson Wells and Ernst & Young. Mr. Tornehl is a Certified Public Accountant and
holds a Bachelor of Business Administration from Boston College. “On behalf of the Board of Directors and the Executive Team, I want to thank Steve for his financial leadership
and his significant contributions over his more than twenty-five years with the Company,” said Paul Manning, Chairman of the Board, President, and Chief Executive Officer of Sensient Technologies Corporation. “I am also pleased to have Tobin succeed Steve as Chief Financial Officer. I have had the chance to work closely with Tobin over the last five years, and he is well suited to lead our financial function
going forward. His promotion is a sign of Sensient’s strong talent pool and thoughtful succession planning.”
|
Sensient Technologies Corporation
Earnings Release – Quarter Ended December 31, 2023
February 8, 2024
|
Page 5 |
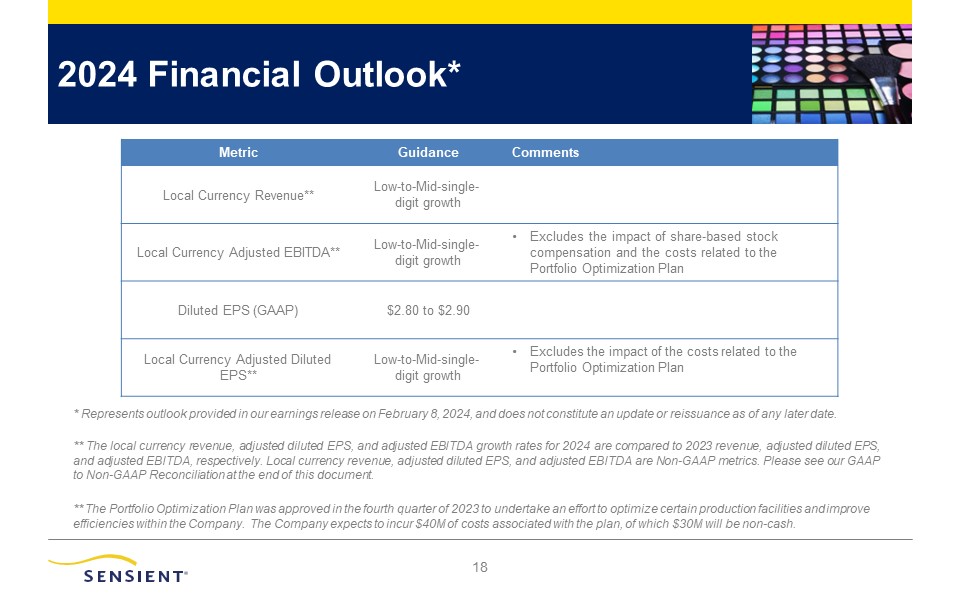
2024 OUTLOOK
Sensient expects 2024 diluted earnings per share to be between $2.80 and $2.90, which includes approximately 15 cents of Portfolio Optimization
Plan costs in 2024, compared to the Company’s 2023 reported GAAP diluted earnings of $2.21.
The Company expects 2024 revenue, 2024 adjusted EBITDA(1), and 2024 adjusted diluted earnings per share(1) to grow at a
low-to-mid single-digit rate on a local currency basis compared to the Company’s 2023 revenue, the Company’s 2023 adjusted EBITDA(1), and the Company’s 2023 adjusted diluted earnings per share(1) of $2.86,
respectively.
The Company expects its 2024 diluted earnings per share to be impacted by higher interest expense. The Company currently expects interest expense
to increase by approximately $3 million ($0.05 per diluted share) in 2024 compared to the Company’s 2023 full year interest expense of $25.2 million. The Company also expects its full year 2024 tax rate to be between 24% and 25%.
The Company’s guidance is based on current conditions and economic and market trends in the markets in which the Company operates and is subject to
various risks and uncertainties as described below.
| (1) |
Please refer to “Reconciliation of Non-GAAP Amounts” at the end of this release for more information regarding our
non-GAAP financial measures.
|
USE OF NON-GAAP FINANCIAL MEASURES
The Company’s non-GAAP financial measures eliminate the impact of certain items, which, depending on the measure, include: currency movements,
depreciation and amortization, Portfolio Optimization Plan costs, divestiture and other related income, and non-cash share-based compensation. These measures are provided to enhance the overall understanding of the Company’s performance when
viewed together with the GAAP results. Refer to “Reconciliation of Non-GAAP Amounts” at the end of this release.
|
Sensient Technologies Corporation
Earnings Release – Quarter Ended December 31, 2023
February 8, 2024
|
Page 6 |
CONFERENCE CALL
The Company will host a conference call to discuss its 2023 fourth quarter financial results at 8:30 a.m. CST on Friday, February 9, 2024. To
participate in the conference call, contact Chorus Call Inc. at (844) 492-3726 or (412) 317-1078, and ask to join the Sensient Technologies Corporation conference call. Alternatively, the call can be accessed by using the webcast link that is
available on the Investor Information section of the Company’s web site at www.sensient.com.
A replay of the call will be available one hour after the end of the conference call through February 16, 2024, by calling (877) 344-7529 and using
access code 4647643. An audio replay and written transcript of the call will also be posted on the Investor Information section of the Company’s web site at www.sensient.com on or after
February 13, 2024.
This release contains statements that may constitute “forward-looking statements” within the meaning of Federal securities laws
including under “2024 Outlook” above. Such forward-looking statements are not guarantees of future performance and involve known and unknown risks, uncertainties, and other factors concerning the Company’s operations and business environment.
Important factors that could cause actual results to differ materially from those suggested by these forward-looking statements and that could adversely affect the Company’s future financial performance include the following: the Company’s
ability to manage general business, economic, and capital market conditions, including actions taken by customers in response to such market conditions, and the impact of recessions and economic downturns; the impact of macroeconomic and
geopolitical volatility, including inflation and shortages impacting the availability and cost of raw materials, energy, and other supplies, disruptions and delays in the Company’s supply chain, and the conflicts between Russia and Ukraine and
Israel and Hamas and other parties in the Middle East; the availability and cost of labor, logistics, and transportation; the pace and nature of new product introductions by the Company and the Company’s customers; the Company’s ability to
anticipate and respond to changing consumer preferences and changing technologies; the Company’s ability to successfully implement its growth strategies; the outcome of the Company’s various productivity-improvement and cost-reduction efforts,
acquisition and divestiture activities, and portfolio optimization plan; industry, regulatory, legal, and economic factors related to the Company’s domestic and international business; the effects of tariffs, trade barriers, and disputes; growth
in markets for products in which the Company competes; industry and customer acceptance of price increases; actions by competitors; the Company’s ability to enhance its innovation efforts and drive cost efficiencies; currency exchange rate
fluctuations; and other factors included in “Risk Factors” in the Company's Annual Report on Form 10-K for the year ended December 31, 2023, and in other documents that the Company files with the SEC. The risks and uncertainties identified above
are not the only risks the Company faces. Additional risks and uncertainties not presently known to the Company or that it currently believes to be immaterial also may adversely affect the Company. Should any known or unknown risks and
uncertainties develop into actual events, these developments could have material adverse effects on our business, financial condition, and results of operations. This release contains time-sensitive information that reflects management’s best
analysis only as of the date of this release. Except to the extent required by applicable laws, the Company does not undertake to publicly update or revise its forward-looking statements even if experience or future changes make it clear that any
projected results expressed or implied herein will not be realized.
|
Sensient Technologies Corporation
Earnings Release – Quarter Ended December 31, 2023
February 8, 2024
|
Page 7 |
ABOUT SENSIENT TECHNOLOGIES
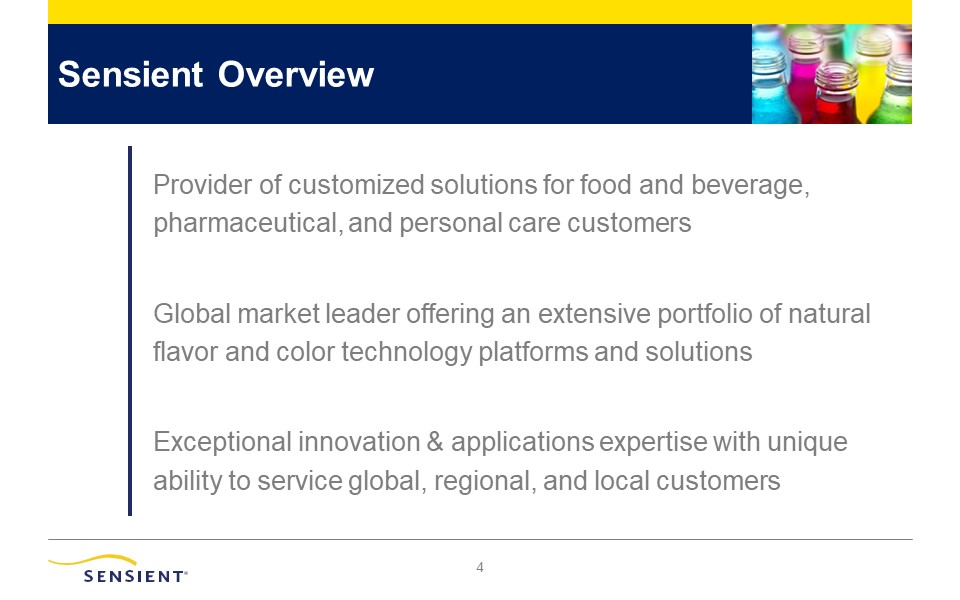
Sensient Technologies Corporation is a leading global manufacturer and marketer of colors, flavors, and other specialty ingredients. Sensient uses
advanced technologies and robust global supply chain capabilities to develop specialized solutions for food and beverages, as well as products that serve the pharmaceutical, nutraceutical, and personal care industries. Sensient’s customers range
in size from small entrepreneurial businesses to major international manufacturers representing some of the world’s best-known brands. Sensient is headquartered in Milwaukee, Wisconsin.
www.sensient.com
Page 8
Sensient Technologies Corporation
(In thousands, except percentages and per share amounts)
(Unaudited)
|
Consolidated Statements of Earnings
|
Three Months Ended December 31,
|
Year Ended December 31,
|
||||||||||||||||||||||
|
2023
|
2022
|
% Change
|
2023
|
2022
|
% Change
|
|||||||||||||||||||
|
Revenue
|
$
|
349,302
|
$
|
348,736
|
0.2
|
%
|
$
|
1,456,450
|
$
|
1,437,039
|
1.4
|
%
|
||||||||||||
|
Cost of products sold
|
249,472
|
237,232
|
5.2
|
%
|
996,153
|
947,928
|
5.1
|
%
|
||||||||||||||||
|
Selling and administrative expenses
|
91,767
|
70,279
|
30.6
|
%
|
305,274
|
292,360
|
4.4
|
%
|
||||||||||||||||
|
Operating income
|
8,063
|
41,225
|
(80.4
|
%)
|
155,023
|
196,751
|
(21.2
|
%)
|
||||||||||||||||
|
Interest expense
|
6,524
|
4,799
|
25,172
|
14,547
|
||||||||||||||||||||
|
Earnings before income taxes
|
1,539
|
36,426
|
129,851
|
182,204
|
||||||||||||||||||||
|
Income taxes
|
7,372
|
7,305
|
36,457
|
41,317
|
||||||||||||||||||||
|
Net earnings
|
$
|
(5,833
|
)
|
$
|
29,121
|
(120.0
|
%)
|
$
|
93,394
|
$
|
140,887
|
(33.7
|
%)
|
|||||||||||
|
Earnings per share of common stock:
|
||||||||||||||||||||||||
|
Basic
|
$
|
(0.14
|
)
|
$
|
0.70
|
$
|
2.22
|
$
|
3.36
|
|||||||||||||||
|
Diluted
|
$
|
(0.14
|
)
|
$
|
0.69
|
$
|
2.21
|
$
|
3.34
|
|||||||||||||||
|
Average common shares outstanding:
|
||||||||||||||||||||||||
|
Basic
|
42,051
|
41,896
|
42,027
|
41,888
|
||||||||||||||||||||
|
Diluted
|
42,051
|
42,255
|
42,242
|
42,213
|
||||||||||||||||||||
|
Results by Segment
|
Three Months Ended December 31,
|
Year Ended December 31,
|
||||||||||||||||||||||
|
Revenue
|
2023
|
2022
|
% Change
|
2023
|
2022
|
% Change
|
||||||||||||||||||
|
Flavors & Extracts
|
$
|
182,939
|
$
|
178,893
|
2.3
|
%
|
$
|
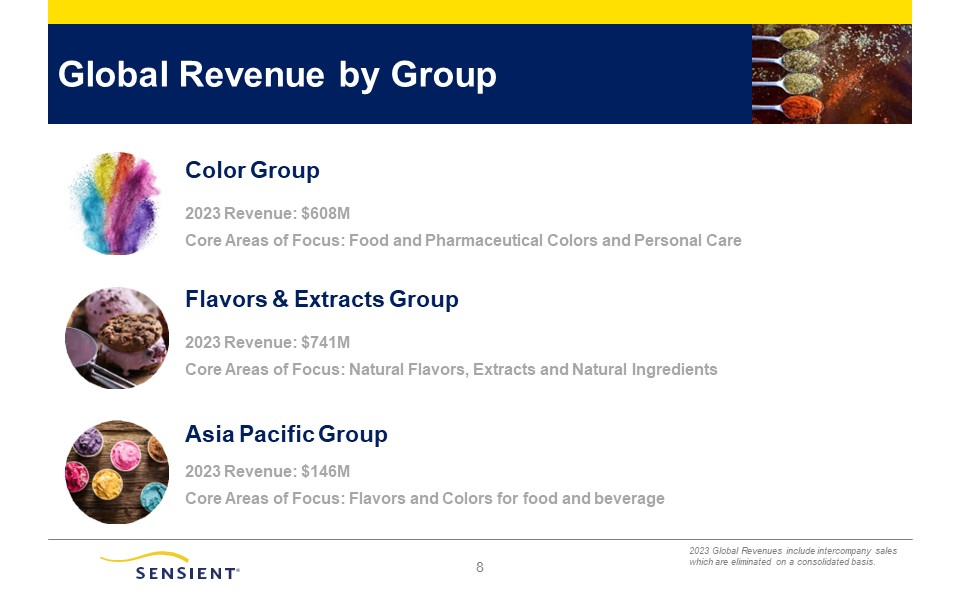
741,072
|
$
|
738,003
|
0.4
|
%
|
||||||||||||
|
Color
|
141,396
|
147,842
|
(4.4
|
%)
|
607,959
|
604,017
|
0.7
|
%
|
||||||||||||||||
|
Asia Pacific
|
33,202
|
34,567
|
(3.9
|
%)
|
146,090
|
143,581
|
1.7
|
%
|
||||||||||||||||
|
Intersegment elimination
|
(8,235
|
)
|
(12,566
|
)
|
(38,671
|
)
|
(48,562
|
)
|
||||||||||||||||
|
Consolidated
|
$
|
349,302
|
$
|
348,736
|
0.2
|
%
|
$
|
1,456,450
|
$
|
1,437,039
|
1.4
|
%
|
||||||||||||
|
Operating Income
|
||||||||||||||||||||||||
|
Flavors & Extracts
|
$
|
18,059
|
$
|
21,495
|
(16.0
|
%)
|
$
|
87,773
|
$
|
105,424
|
(16.7
|
%)
|
||||||||||||
|
Color
|
21,343
|
24,584
|
(13.2
|
%)
|
105,370
|
114,619
|
(8.1
|
%)
|
||||||||||||||||
|
Asia Pacific
|
5,889
|
6,615
|
(11.0
|
%)
|
30,800
|
29,492
|
4.4
|
%
|
||||||||||||||||
|
Corporate & Other
|
(37,228
|
)
|
(11,469
|
)
|
(68,920
|
)
|
(52,784
|
)
|
||||||||||||||||
|
Consolidated
|
$
|
8,063
|
$
|
41,225
|
(80.4
|
%)
|
$
|
155,023
|
$
|
196,751
|
(21.2
|
%)
|
||||||||||||
Page 9
Sensient Technologies Corporation
(In thousands)
(Unaudited)
|
Consolidated Condensed Balance Sheets
|
December 31,
|
December 31,
|
||||||
|
2023
|
2022
|
|||||||
|
Cash and cash equivalents
|
$
|
28,934
|
$
|
20,921
|
||||
|
Trade accounts receivable
|
272,164
|
302,109
|
||||||
|
Inventories
|
598,399
|
564,110
|
||||||
|
Prepaid expenses and other current assets
|
37,119
|
47,640
|
||||||
|
Total Current Assets
|
936,616
|
934,780
|
||||||
|
Goodwill & intangible assets (net)
|
436,177
|
434,315
|
||||||
|
Property, plant, and equipment (net)
|
505,277
|
483,193
|
||||||
|
Other assets
|
136,437
|
129,326
|
||||||
|
Total Assets
|
$
|
2,014,507
|
$
|
1,981,614
|
||||
|
Trade accounts payable
|
$
|
131,114
|
$
|
142,365
|
||||
|
Short-term borrowings
|
13,460
|
20,373
|
||||||
|
Other current liabilities
|
91,732
|
109,415
|
||||||
|
Total Current Liabilities
|
236,306
|
272,153
|
||||||
|
Long-term debt
|
645,085
|
630,331
|
||||||
|
Accrued employee and retiree benefits
|
27,715
|
26,364
|
||||||
|
Other liabilities
|
52,077
|
53,168
|
||||||
|
Shareholders' Equity
|
1,053,324
|
999,598
|
||||||
|
Total Liabilities and Shareholders' Equity
|
$
|
2,014,507
|
$
|
1,981,614
|
||||
Page 10
Sensient Technologies Corporation
(In thousands, except per share amounts)
(Unaudited)
Consolidated Statements of Cash Flows
Year Ended December 31,
|
|
2023
|
2022
|
||||||
|
Cash flows from operating activities:
|
||||||||
|
Net earnings
|
$
|
93,394
|
$
|
140,887
|
||||
|
Adjustments to arrive at net cash provided by operating activities:
|
||||||||
|
Depreciation and amortization
|
57,820
|
52,467
|
||||||
|
Share-based compensation expense
|
8,933
|
16,138
|
||||||
|
Net loss on assets
|
541
|
276
|
||||||
|
Net gain on divestiture of business
|
-
|
(2,532
|
)
|
|||||
|
Portfolio optimization plan costs
|
24,089
|
-
|
||||||
|
Deferred income taxes
|
(5,100
|
)
|
(11,010
|
)
|
||||
|
Changes in operating assets and liabilities:
|
||||||||
|
Trade accounts receivable
|
35,801
|
(46,086
|
)
|
|||||
|
Inventories
|
(28,193
|
)
|
(159,014
|
)
|
||||
|
Prepaid expenses and other assets
|
5,767
|
(5,055
|
)
|
|||||
|
Trade accounts payable and other accrued expenses
|
(5,978
|
)
|
17,489
|
|||||
|
Accrued salaries, wages, and withholdings
|
(17,830
|
)
|
3,486
|
|||||
|
Income taxes
|
(1,175
|
)
|
4,422
|
|||||
|
Other liabilities
|
1,628
|
602
|
||||||
|
Net cash provided by operating activities
|
169,697
|
12,070
|
||||||
|
Cash flows from investing activities:
|
||||||||
|
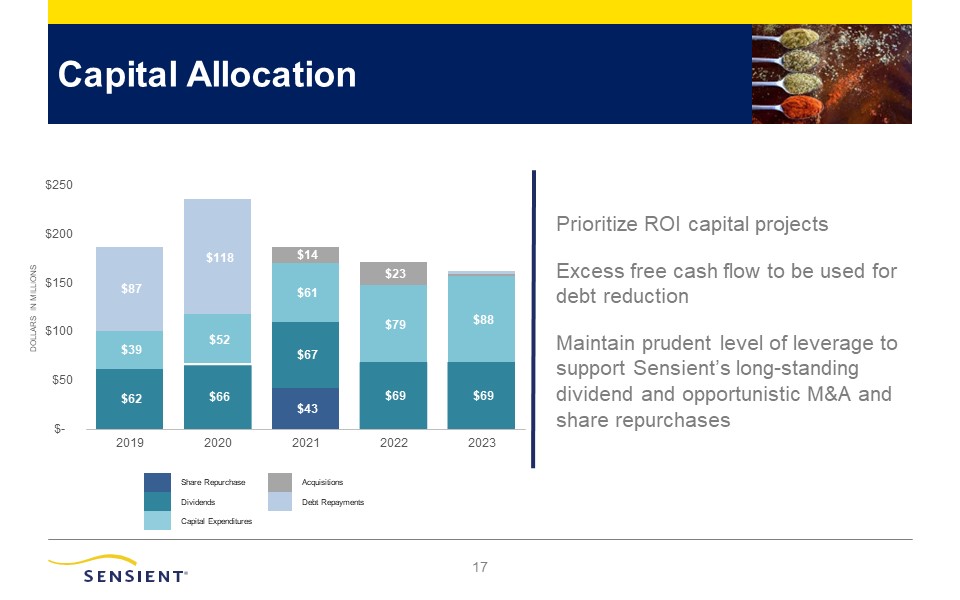
Acquisition of property, plant, and equipment
|
(87,868
|
)
|
(79,322
|
)
|
||||
|
Proceeds from sale of assets
|
156
|
264
|
||||||
|
Proceeds from divestiture of business
|
-
|
2,532
|
||||||
|
Acquisiton of new businesses
|
(1,650
|
)
|
(22,714
|
)
|
||||
|
Other investing activities
|
1,741
|
792
|
||||||
|
Net cash used in investing activities
|
(87,621
|
)
|
(98,448
|
)
|
||||
|
Cash flows from financing activities:
|
||||||||
|
Proceeds from additional borrowings
|
351,662
|
328,597
|
||||||
|
Debt payments
|
(355,161
|
)
|
(171,447
|
)
|
||||
|
Dividends paid
|
(69,222
|
)
|
(68,915
|
)
|
||||
|
Other financing activities
|
(9,278
|
)
|
(2,056
|
)
|
||||
|
Net cash (used in) provided by financing activities
|
(81,999
|
)
|
86,179
|
|||||
|
Effect of exchange rate changes on cash and cash equivalents
|
7,936
|
(4,620
|
)
|
|||||
|
Net increase (decrease) in cash and cash equivalents
|
8,013
|
(4,819
|
)
|
|||||
|
Cash and cash equivalents at beginning of period
|
20,921
|
25,740
|
||||||
|
Cash and cash equivalents at end of period
|
$
|
28,934
|
$
|
20,921
|
||||
|
Supplemental Information
|
||||||||
|
Year Ended December 31,
|
2023
|
2022
|
||||||
|
Dividends paid per share
|
$
|
1.64
|
$
|
1.64
|
Page 11
Sensient Technologies Corporation
(In thousands, except percentages and per share amounts)
(Unaudited)
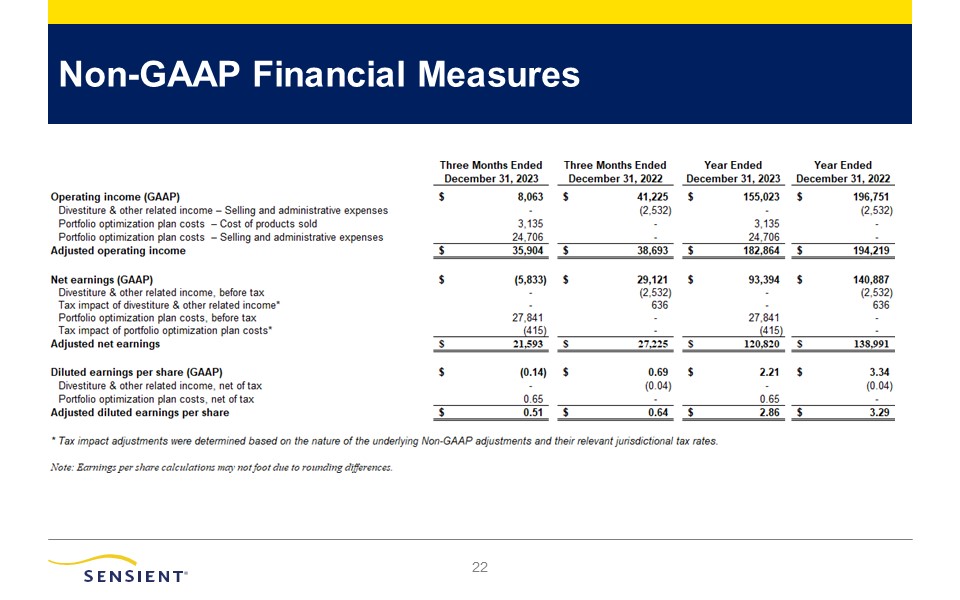
Reconciliation of Non-GAAP Amounts
The Company's results for the three and twelve months ended December 31, 2023 and 2022 include adjusted operating income, adjusted net earnings, and adjusted diluted earnings per
share, which exclude divestiture & other related income and portfolio optimization plan costs.
|
Three Months Ended December 31,
|
Year Ended December 31,
|
|||||||||||||||||||||||
|
2023
|
2022
|
% Change
|
2023
|
2022
|
% Change
|
|||||||||||||||||||
|
Operating income (GAAP)
|
$
|
8,063
|
$
|
41,225
|
(80.4
|
%)
|
$
|
155,023
|
$
|
196,751
|
(21.2
|
%)
|
||||||||||||
|
Divestiture & other related income – Selling and administrative expenses
|
-
|
(2,532
|
)
|
-
|
(2,532
|
)
|
||||||||||||||||||
|
Portfolio optimization plan costs – Cost of products sold
|
3,135
|
-
|
3,135
|
-
|
||||||||||||||||||||
|
Portfolio optimization plan costs – Selling and administrative expenses
|
24,706
|
-
|
24,706
|
-
|
||||||||||||||||||||
|
Adjusted operating income
|
$
|
35,904
|
$
|
38,693
|
(7.2
|
%)
|
$
|
182,864
|
$
|
194,219
|
(5.8
|
%)
|
||||||||||||
|
Net earnings (GAAP)
|
$
|
(5,833
|
)
|
$
|
29,121
|
(120.0
|
%)
|
$
|
93,394
|
$
|
140,887
|
(33.7
|
%)
|
|||||||||||
|
Divestiture & other related income, before tax
|
-
|
(2,532
|
)
|
-
|
(2,532
|
)
|
||||||||||||||||||
|
Tax impact of divestiture & other related income(1)
|
-
|
636
|
-
|
636
|
||||||||||||||||||||
|
Portfolio optimization plan costs, before tax
|
27,841
|
-
|
27,841
|
-
|
||||||||||||||||||||
|
Tax impact of portfolio optimization plan costs(1)
|
(415
|
)
|
-
|
(415
|
)
|
-
|
||||||||||||||||||
|
Adjusted net earnings
|
$
|
21,593
|
$
|
27,225
|
(20.7
|
%)
|
$
|
120,820
|
$
|
138,991
|
(13.1
|
%)
|
||||||||||||
|
Diluted earnings per share (GAAP)
|
$
|
(0.14
|
)
|
$
|
0.69
|
(120.3
|
%)
|
$
|
2.21
|
$
|
3.34
|
(33.8
|
%)
|
|||||||||||
|
Divestiture & other related income, net of tax
|
-
|
(0.04
|
)
|
-
|
(0.04
|
)
|
||||||||||||||||||
|
Portfolio optimization plan costs, net of tax
|
0.65
|
-
|
0.65
|
-
|
||||||||||||||||||||
|
Adjusted diluted earnings per share
|
$
|
0.51
|
$
|
0.64
|
(20.3
|
%)
|
$
|
2.86
|
$
|
3.29
|
(13.1
|
%)
|
||||||||||||
Note: Earnings per share calculations may not foot due to rounding differences.
(1) Tax impact adjustments were determined based on the nature of the underlying non-GAAP adjustments and their relevant jurisdictional tax rates.
|
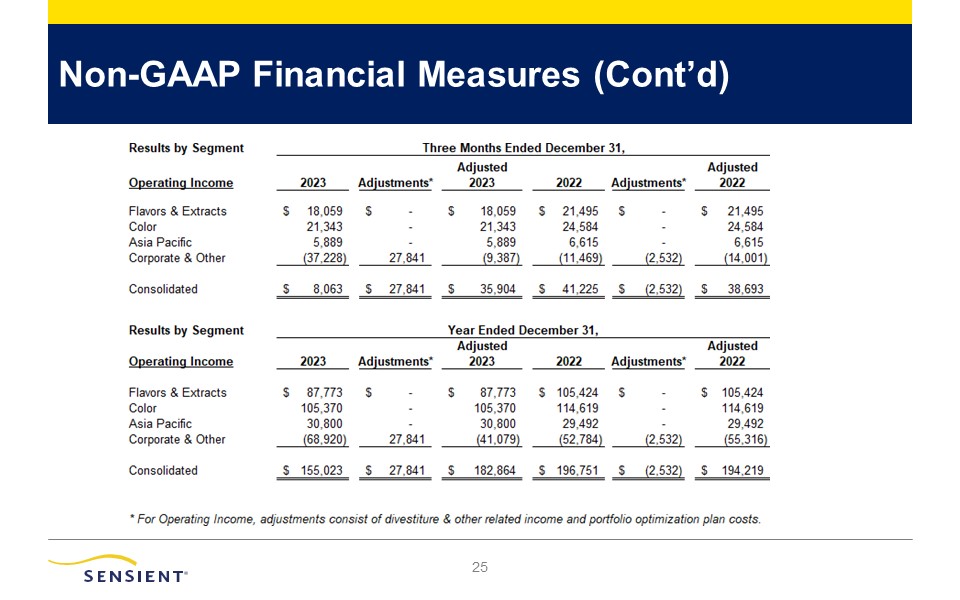
Results by Segment
|
Three Months Ended December 31,
|
|||||||||||||||||||||||
|
Operating Income
|
2023
|
Adjustments(2)
|
Adjusted
2023 |
2022
|
Adjustments(2)
|
Adjusted
2022 |
||||||||||||||||||
|
Flavors & Extracts
|
$
|
18,059
|
$
|
-
|
$
|
18,059
|
$
|
21,495
|
$
|
-
|
$
|
21,495
|
||||||||||||
|
Color
|
21,343
|
-
|
21,343
|
24,584
|
-
|
24,584
|
||||||||||||||||||
|
Asia Pacific
|
5,889
|
-
|
5,889
|
6,615
|
-
|
6,615
|
||||||||||||||||||
|
Corporate & Other
|
(37,228
|
)
|
27,841
|
(9,387
|
)
|
(11,469
|
)
|
(2,532
|
)
|
(14,001
|
)
|
|||||||||||||
|
Consolidated
|
$
|
8,063
|
$
|
27,841
|
$
|
35,904
|
$
|
41,225
|
$
|
(2,532
|
)
|
$
|
38,693
|
|||||||||||
|
Results by Segment
|
Year Ended December 31,
|
|||||||||||||||||||||||
|
Operating Income
|
2023
|
Adjustments(2)
|
Adjusted
2023
|
2022
|
Adjustments(2)
|
Adjusted
2022
|
||||||||||||||||||
|
Flavors & Extracts
|
$
|
87,773
|
$
|
-
|
$
|
87,773
|
$
|
105,424
|
$
|
-
|
$
|
105,424
|
||||||||||||
|
Color
|
105,370
|
-
|
105,370
|
114,619
|
-
|
114,619
|
||||||||||||||||||
|
Asia Pacific
|
30,800
|
-
|
30,800
|
29,492
|
-
|
29,492
|
||||||||||||||||||
|
Corporate & Other
|
(68,920
|
)
|
27,841
|
(41,079
|
)
|
(52,784
|
)
|
(2,532
|
)
|
(55,316
|
)
|
|||||||||||||
|
Consolidated
|
$
|
155,023
|
$
|
27,841
|
$
|
182,864
|
$
|
196,751
|
$
|
(2,532
|
)
|
$
|
194,219
|
|||||||||||
(2) For Operating Income, adjustments consist of divestiture & other related income in 2022 and portfolio optimization plan costs in 2023.
Page 12
Sensient Technologies Corporation
(In thousands, except percentages)
(Unaudited)
Reconciliation of Non-GAAP Amounts
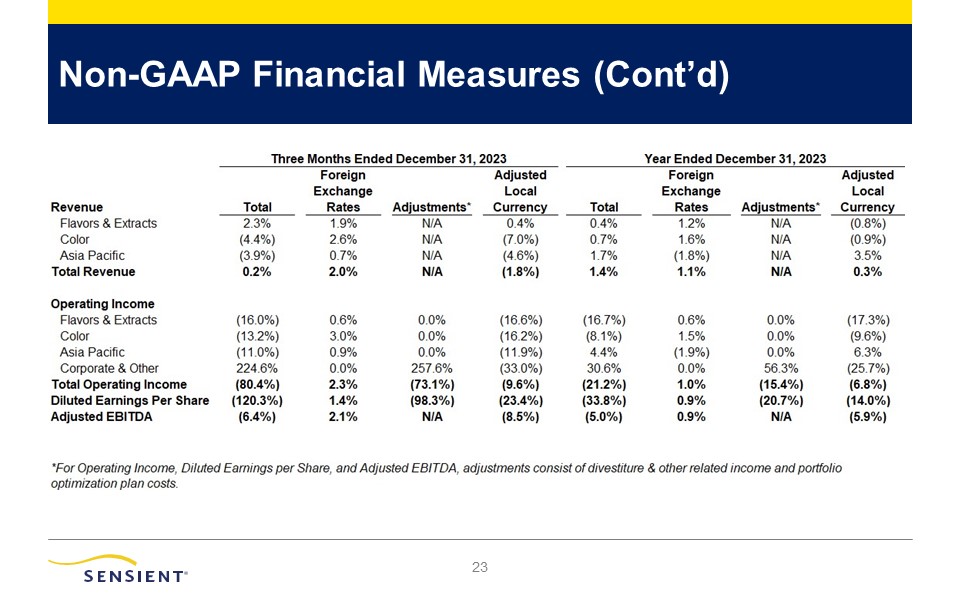
The following table summarizes the percentage change in the 2023 results compared to the 2022 results for the corresponding periods.
|
Three Months Ended December 31,
|
||||||||||||||||
|
Revenue
|
Total
|
Foreign
Exchange
Rates
|
Adjustments(3)
|
Adjusted
Local
Currency
|
||||||||||||
|
Flavors & Extracts
|
2.3
|
%
|
1.9
|
%
|
N/A
|
0.4
|
%
|
|||||||||
|
Color
|
(4.4
|
%)
|
2.6
|
%
|
N/A
|
(7.0
|
%)
|
|||||||||
|
Asia Pacific
|
(3.9
|
%)
|
0.7
|
%
|
N/A
|
(4.6
|
%)
|
|||||||||
|
Total Revenue
|
0.2
|
%
|
2.0
|
%
|
N/A
|
(1.8
|
%)
|
|||||||||
|
|
||||||||||||||||
|
Operating Income
|
||||||||||||||||
|
Flavors & Extracts
|
(16.0
|
%)
|
0.6
|
%
|
0.0
|
%
|
(16.6
|
%)
|
||||||||
|
Color
|
(13.2
|
%)
|
3.0
|
%
|
0.0
|
%
|
(16.2
|
%)
|
||||||||
|
Asia Pacific
|
(11.0
|
%)
|
0.9
|
%
|
0.0
|
%
|
(11.9
|
%)
|
||||||||
|
Corporate & Other
|
224.6
|
%
|
0.0
|
%
|
257.6
|
%
|
(33.0
|
%)
|
||||||||
|
Total Operating Income
|
(80.4
|
%)
|
2.3
|
%
|
(73.1
|
%)
|
(9.6
|
%)
|
||||||||
|
Diluted Earnings Per Share
|
(120.3
|
%)
|
1.4
|
%
|
(98.3
|
%)
|
(23.4
|
%)
|
||||||||
|
Adjusted EBITDA
|
(6.4
|
%)
|
2.1
|
%
|
N/A
|
(8.5
|
%)
|
|||||||||
|
Year Ended December 31,
|
||||||||||||||||
|
Revenue
|
Total
|
Foreign
Exchange
Rates
|
Adjustments(3)
|
Adjusted
Local
Currency
|
||||||||||||
|
Flavors & Extracts
|
0.4
|
%
|
1.2
|
%
|
N/A
|
(0.8
|
%)
|
|||||||||
|
Color
|
0.7
|
%
|
1.6
|
%
|
N/A
|
(0.9
|
%)
|
|||||||||
|
Asia Pacific
|
1.7
|
%
|
(1.8
|
%)
|
N/A
|
3.5
|
%
|
|||||||||
|
Total Revenue
|
1.4
|
%
|
1.1
|
%
|
N/A
|
0.3
|
%
|
|||||||||
|
|
||||||||||||||||
|
Operating Income
|
||||||||||||||||
|
Flavors & Extracts
|
(16.7
|
%)
|
0.6
|
%
|
0.0
|
%
|
(17.3
|
%)
|
||||||||
|
Color
|
(8.1
|
%)
|
1.5
|
%
|
0.0
|
%
|
(9.6
|
%)
|
||||||||
|
Asia Pacific
|
4.4
|
%
|
(1.9
|
%)
|
0.0
|
%
|
6.3
|
%
|
||||||||
|
Corporate & Other
|
30.6
|
%
|
0.0
|
%
|
56.3
|
%
|
(25.7
|
%)
|
||||||||
|
Total Operating Income
|
(21.2
|
%)
|
1.0
|
%
|
(15.4
|
%)
|
(6.8
|
%)
|
||||||||
|
Diluted Earnings Per Share
|
(33.8
|
%)
|
0.9
|
%
|
(20.7
|
%)
|
(14.0
|
%)
|
||||||||
|
Adjusted EBITDA
|
(5.0
|
%)
|
0.9
|
%
|
N/A
|
(5.9
|
%)
|
|||||||||
(3) For Operating Income, Diluted Earnings per Share, and Adjusted EBITDA, adjustments consist divestiture & other related income in 2022 and
portfolio optimization plan costs in 2023.
The following table summarizes the reconciliation between Operating Income (GAAP) and Adjusted EBITDA for the three months and year ended December 31, 2023 and 2022.
|
Three Months Ended December 31,
|
Year Ended December 31,
|
|||||||||||||||||||||||
|
2023
|
2022
|
% Change
|
2023
|
2022
|
% Change
|
|||||||||||||||||||
|
Operating income (GAAP)
|
$
|
8,063
|
$
|
41,225
|
(80.4
|
%)
|
$
|
155,023
|
$
|
196,751
|
(21.2
|
%)
|
||||||||||||
|
Depreciation and amortization
|
14,460
|
13,205
|
57,820
|
52,467
|
||||||||||||||||||||
|
Share-based compensation expense
|
1,648
|
3,662
|
8,933
|
16,138
|
||||||||||||||||||||
|
Divestiture & other related income, before tax
|
-
|
(2,532
|
)
|
-
|
(2,532
|
)
|
||||||||||||||||||
|
Portfolio optimization plan costs, before tax
|
27,841
|
-
|
27,841
|
-
|
||||||||||||||||||||
|
Adjusted EBITDA
|
$
|
52,012
|
$
|
55,560
|
(6.4
|
%)
|
$
|
249,617
|
$
|
262,824
|
(5.0
|
%)
|
||||||||||||
Page 13
Sensient Technologies Corporation
(In thousands, except percentages)
(Unaudited)
Reconciliation of Non-GAAP Amounts - Continued
The following table summarizes the reconciliation between Debt (GAAP) and Net Debt, and Operating Income (GAAP) and Credit Adjusted EBITDA for the year ended
December 31, 2023 and 2022.
|
Year Ended December 31,
|
||||||||
|
Debt
|
2023
|
2022
|
||||||
|
Short-term borrowings
|
$
|
13,460
|
$
|
20,373
|
||||
|
Long-term debt
|
645,085
|
630,331
|
||||||
|
Credit Agreement adjustments(1)
|
(16,743
|
)
|
(10,180
|
)
|
||||
|
Net Debt
|
$
|
641,802
|
$
|
640,524
|
||||
|
Operating income (GAAP)
|
$
|
155,023
|
$
|
196,751
|
||||
|
Depreciation and amortization
|
57,820
|
52,467
|
||||||
|
Share-based compensation expense
|
8,933
|
16,138
|
||||||
|
Divestiture & other related income, before tax
|
-
|
(2,532
|
)
|
|||||
|
Portfolio optimization plan costs, before tax
|
27,841
|
-
|
||||||
|
Other non-operating gains(2)
|
(762
|
)
|
(866
|
)
|
||||
|
Credit Adjusted EBITDA
|
$
|
248,855
|
$
|
261,958
|
||||
|
Net Debt to Credit Adjusted EBITDA
|
2.6
|
x
|
2.4
|
x
|
||||
(1) Adjustments include cash and cash equivalents, as described in the Company's Third Amended and Restated Credit Agreement (Credit Agreement), and
certain letters of credit and hedge contracts.
(2) Adjustments consist of certain financing transaction costs, certain non-financing interest items, and gains and losses related to certain non-cash,
non-operating, and/or non-recurring items as described in the Credit Agreement.
We have included each of these non-GAAP measures in order to provide additional information regarding our underlying operating results and comparable period-over-period performance.
Such information is supplemental to information presented in accordance with GAAP and is not intended to represent a presentation in accordance with GAAP. These non-GAAP measures should not be considered in isolation. Rather, they should be
considered together with GAAP measures and the rest of the information included in this release and our SEC filings. Management internally reviews each of these non-GAAP measures to evaluate performance on a comparative period-to-period basis
and to gain additional insight into underlying operating and performance trends, and we believe the information can be beneficial to investors for the same purposes. These non-GAAP measures may not be comparable to similarly titled measures
used by other companies.
Exhibit 99.2