
Synchrony Financial 8-K, filed Jan 23, 2023
Synchrony Financial (SYF)
8-K
2023-01-23
For: 2023-01-23
View Original
Added on
July 04, 2026
About this 8-K
Synchrony Financial filed this 8-K on January 23, 2023.
Items reported
- Item 2.02: Financial results
- Item 9.01: Financial statements and exhibits
UNITED STATES
SECURITIES AND EXCHANGE COMMISSION
Washington, D.C. 20549
FORM 8-K
CURRENT REPORT
PURSUANT TO SECTION 13 OR 15(d)
OF THE SECURITIES EXCHANGE ACT OF 1934
Date of Report
(Date of earliest event reported)
(Exact name of registrant as specified in its charter)
| (State or other jurisdiction of incorporation) | (Commission File Number) | (I.R.S. Employer Identification No.) | ||||||||||||
| (Address of principal executive offices) | (Zip Code) | ||||||||||
(203 ) 585-2400
(Registrant’s telephone number, including area code)
N/A
(Former name or former address, if changed since last report)
Check the appropriate box below if the Form 8-K filing is intended to simultaneously satisfy the filing obligation of the registrant under any of the following provisions:
| Written communications pursuant to Rule 425 under the Securities Act (17 CFR 230.425) | |||||
| Soliciting material pursuant to Rule 14a-12 under the Exchange Act (17 CFR 240.14a-12) | |||||
| Pre-commencement communications pursuant to Rule 14d-2(b) under the Exchange Act (17 CFR 240.14d-2(b)) | |||||
| Pre-commencement communications pursuant to Rule 13e-4(c) under the Exchange Act (17 CFR 240.13e-4(c)) | |||||
Securities Registered Pursuant to Section 12(b) of the Act:
| Title of each class | Trading Symbol(s) | Name of each exchange on which registered | ||||||
Indicate by check mark whether the registrant is an emerging growth company as defined in Rule 405 of the Securities Act of 1933 (§230.405 of this chapter) or Rule 12b-2 of the Securities Exchange Act of 1934 (§240.12b-2 of this chapter).
| Emerging growth company | |||||||||||
If an emerging growth company, indicate by check mark if the registrant has elected not to use the extended transition period for complying with any new or revised financial accounting standards provided pursuant to Section 13(a) of the Exchange Act. ¨
Item 2.02 Results of Operations and Financial Condition.
On January 23, 2023 , Synchrony Financial (the “Company”) issued a press release setting forth the Company’s fourth quarter 2022 earnings. A copy of the Company’s press release is being furnished as Exhibit 99.1 and hereby incorporated by reference. The information furnished pursuant to this Item 2.02, including Exhibits, shall not be deemed “filed” for purposes of Section 18 of the Securities Exchange Act of 1934 (the “Exchange Act”) or otherwise subject to the liabilities under that Section and shall not be deemed to be incorporated by reference into any filing of the Company under the Securities Act of 1933 or the Exchange Act.
Item 9.01 Financial Statements and Exhibits.
(d) Exhibits
The following exhibits are being furnished as part of this report:
| Number | Description | |||||||
| 99.1 | Press release, dated January 23, 2023, issued by Synchrony Financial | |||||||
| 99.2 | Financial Data Supplement of the Company for the quarter ended December 31, 2022 | |||||||
| 99.3 | Financial Results Presentation of the Company for the quarter ended December 31, 2022 | |||||||
| 99.4 | Explanation of Non-GAAP Measures | |||||||
| 104 | The cover page from this Current Report on Form 8-K, formatted in Inline XBRL | |||||||
SIGNATURES
Pursuant to the requirements of the Securities Exchange Act of 1934, the registrant has duly caused this report to be signed on its behalf by the undersigned hereunto duly authorized.
SYNCHRONY FINANCIAL | ||||||||||||||||||||
| Date: January 23, 2023 | By: | /s/ Jonathan Mothner | ||||||||||||||||||
Name: | Jonathan Mothner | |||||||||||||||||||
Title: | Executive Vice President, General Counsel and Secretary | |||||||||||||||||||
EXHIBIT INDEX
| Number | Description | |||||||
| 104 | The cover page from this Current Report on Form 8-K, formatted in Inline XBRL | |||||||
Exhibit 99.1
For Immediate Release Synchrony Financial (NYSE: SYF) January 23, 2023 |  | |||||||
FOURTH QUARTER 2022 RESULTS AND KEY METRICS
2.2% Return on Assets | 12.8% CET1 Ratio | $803M Capital Returned | CEO COMMENTARY | |||||||||||||||||||||||||||||
| “Synchrony’s strong fourth quarter performance reflected the strength of our differentiated business model: our diversified portfolio across industries, our scalable technology platform, our deep industry expertise and sophisticated underwriting, and the flexibility and choice of our digitally-powered product suite,” said Brian Doubles, Synchrony’s President and Chief Executive Officer. “We closed the year with record purchase volume and double digit receivables growth, while also driving strong risk-adjusted margins, improved operating efficiency and robust capital returns to our shareholders. “As Synchrony continues to execute on our key strategic priorities – growing existing partner programs and adding new ones; further diversifying our programs, products, and markets; and delivering best-in-class customer experiences – we are excited about the opportunities we see to continue driving sustainable, profitable growth and meaningful long-term value for all our stakeholders.” | ||||||||||||||||||||||||||||||||
$92.5B Loan Receivables | ||||||||||||||||||||||||||||||||
 | Net Earnings of $577 Million or $1.26 per Diluted Share | |||||||||||||||||||||||||||||||
 | Delivered Record Purchase Volume and Strong Receivables Growth | |||||||||||||||||||||||||||||||
 | Returned $803 Million of Capital to Shareholders, including $700 Million of Share Repurchases | |||||||||||||||||||||||||||||||
STAMFORD, Conn. – Synchrony Financial (NYSE: SYF) today announced fourth quarter 2022 net earnings of $577 million, or $1.26 per diluted share, compared to $813 million, or $1.48 per diluted share in the fourth quarter 2021. | ||||||||||||||||||||||||||||||||
| KEY OPERATING & FINANCIAL METRICS* | ||||||||||||||||||||||||||||||||
| PERFORMANCE REFLECTS DIFFERENTIATED BUSINESS MODEL AND CONTINUED STRENGTH OF THE CONSUMER | ||||||||||||||||||||||||||||||||
•Purchase volume increased 2% to $47.9 billion, or 11% on a Core basis** •Loan receivables were $92.5 billion and increased 15% on both a GAAP and Core basis •Average active accounts decreased 1% to 68.4 million, and increased 8% on a Core basis •New accounts decreased 13% to 6.4 million, or 3% on a Core basis •Net interest margin decreased 19 basis points to 15.58% •Efficiency ratio decreased 390 basis points to 37.2% •Return on assets decreased 120 basis points to 2.2% •Return on equity decreased 550 basis points to 17.5%; return on tangible common equity*** decreased 660 basis points to 22.1% | ||||||||||||||||||||||||||||||||
| CFO COMMENTARY | BUSINESS AND FINANCIAL RESULTS FOR THE FOURTH QUARTER OF 2022* | |||||||||||||||||||||||||
| “Synchrony delivered strong fourth quarter and full year financial results for 2022, highlighted by record purchase volume for the quarter and year — a reflection of the broad consumer demand for our wide range of products, our compelling value propositions and our best-in-class experiences,” said Brian Wenzel, Synchrony’s Executive Vice President and Chief Financial Officer. “As anticipated, credit trends continued to normalize across our portfolio as consumers worked through excess savings and payment behavior migrated toward pre-pandemic levels. While credit losses remained meaningfully below our portfolio’s historical average, this normalization towards our net charge-off target contributed to the improvements in our RSA and operating efficiency ratios – both of which declined considerably year over year as our purpose-built business model supported each of our stakeholders as designed. “Looking forward, Synchrony is uniquely positioned to continue to deliver best-in-class financing flexibility to our customers, consistently strong outcomes for our partners, and resilient risk-adjusted returns to our stakeholders.” | ||||||||||||||||||||||||||
| BUSINESS HIGHLIGHTS | ||||||||||||||||||||||||||
| CONTINUED TO EXPAND PORTFOLIO, ENHANCE PRODUCTS AND EXTEND REACH | ||||||||||||||||||||||||||
•Added or renewed over 25 programs, including Lowe’s and Rooms to Go •Launched Synchrony’s buy now, pay later products with Belk and Discount Tire, expanding access to responsible and flexible financing •Renewed with Mars, Inc., keeping CareCredit as the pet financing solution of choice for the owner of VCA Hospitals, Banfield Pet Hospital and BluePearl | ||||||||||||||||||||||||||
| FINANCIAL HIGHLIGHTS | ||||||||||||||||||||||||||
| STRONG EARNINGS DRIVEN BY CORE BUSINESS DRIVERS | ||||||||||||||||||||||||||
•Interest and fees on loans increased 13% to $4.6 billion, driven primarily by growth in average loan receivables, partially offset by impacts of portfolios sold during the second quarter. •Net interest income increased $276 million, or 7%, to $4.1 billion, driven by higher interest and fees on loans, partially offset by higher benchmark rates and higher funding liabilities. •Retailer share arrangements decreased $224 million, or 18%, to $1.0 billion, reflecting the impact of portfolios sold during the second quarter and higher net charge-offs, partially offset by higher net interest income. •Provision for credit losses increased $640 million to $1.2 billion, driven by a higher reserve build and higher net charge-offs. •Other income decreased $137 million, or 82%, to $30 million, driven primarily by a prior year gain on a venture investment and higher loyalty costs. •Other expense increased $29 million, or 3%, to $1.2 billion, driven by higher employee costs, technology investments and higher transaction volume, partially offset by prior year asset impairments and lower marketing costs. Other expense included $12 million of additional marketing and growth reinvestment of the second quarter 2022 gain on sale proceeds. •Net earnings decreased to $577 million, compared to $813 million. | ||||||||||||||||||||||||||
| CREDIT QUALITY | ||||||||||||||||||||||||||
| CREDIT PERFORMANCE CONTINUES TO BE DRIVEN BY A STRONG CONSUMER | ||||||||||||||||||||||||||
•Loans 30+ days past due as a percentage of total period-end loan receivables were 3.65% compared to 2.62% in the prior year, an increase of 103 basis points. •Net charge-offs as a percentage of total average loan receivables were 3.48% compared to 2.37% in the prior year, an increase of 111 basis points. •The allowance for credit losses as a percentage of total period-end loan receivables was 10.30% compared to 10.58% in the third quarter 2022. | ||||||||||||||||||||||||||
| SALES PLATFORM HIGHLIGHTS | |||||||||||||||||||||||
| DIVERSITY ACROSS OUR PLATFORMS CONTINUES TO PROVIDE RESILIENCE | |||||||||||||||||||||||
•Home & Auto purchase volume increased 9%, driven by strong spend in Home and higher prices in Furniture. Period-end loan receivables increased 12%, reflecting the higher purchase volume and slowing payment rates. Interest and fees on loans were up by 12%, primarily driven by the growth in loan receivables. Average active accounts increased 5%. •Digital purchase volume increased 10%, reflecting growth in average active accounts and strong customer engagement. Period-end loan receivables increased 17%, reflecting moderation in payment rates and continued purchase volume growth. Interest and fees on loans increased 29%, reflecting the loan receivables growth and higher benchmark rates. Average active accounts increased 9%. •Diversified & Value purchase volume increased 15%, driven by strong out-of-partner spend, in addition to partner performance and penetration growth. Period-end loan receivables increased 16%, reflecting the purchase volume growth and moderating payment rates. Interest and fees on loans increased 25%, driven by the growth in loan receivables and higher benchmark rates. Average active accounts increased 8%. •Health & Wellness purchase volume increased 15%, reflecting broad-based growth in active accounts and higher spend per active account. Period-end loan receivables increased 19%, driven by continued higher promotional purchase volume and modestly lower payment rates. Interest and fees on loans increased 23%, reflecting the loan receivables growth and higher revolve rates, and average active accounts increased 13%. •Lifestyle purchase volume increased 2%, driven by higher out-of-partner spend. Period-end loan receivables increased 9%, reflecting the purchase volume growth, lower payment rates and the longer-term nature of the financing products. Interest and fees on loans increased 14%, driven primarily by the growth in loan receivables and higher benchmark rates. Average active accounts increased 1%. | |||||||||||||||||||||||
| BALANCE SHEET, LIQUIDITY & CAPITAL | |||||||||||||||||||||||
| FUNDING, CAPITAL & LIQUIDITY REMAIN ROBUST | |||||||||||||||||||||||
•Loan receivables of $92.5 billion increased 15%; purchase volume increased 2% and average active accounts decreased 1%. •Deposits increased $9.4 billion, or 15%, to $71.7 billion and comprised 84% of funding. •Total liquidity, consisting of liquid assets and undrawn credit facilities, was $17.2 billion, or 16.4% of total assets. •The company returned $803 million in capital to shareholders, including $700 million of share repurchases and $103 million of common stock dividends. •As of December 31, 2022, the Company had a total remaining share repurchase authorization of $700 million. •The estimated Common Equity Tier 1 ratio was 12.8% compared to 15.6%, and the estimated Tier 1 Capital ratio was 13.6% compared to 16.5%. | |||||||||||||||||||||||
*All comparisons are for the fourth quarter of 2022 compared to the fourth quarter of 2021, unless otherwise noted. ** Financial measures shown on a Core basis are non-GAAP measures and exclude from both the prior and current years amounts related to portfolios sold in the second quarter of 2022. See non-GAAP reconciliation in the financial tables. *** Tangible common equity is a non-GAAP financial measure. See non-GAAP reconciliation in the financial tables. | |||||||||||||||||||||||
| CORRESPONDING FINANCIAL TABLES AND INFORMATION | |||||||||||||||||||||||
No representation is made that the information in this news release is complete. Investors are encouraged to review the foregoing summary and discussion of Synchrony Financial's earnings and financial condition in conjunction with the detailed financial tables and information that follow and the Company’s Annual Report on Form 10-K for the fiscal year ended December 31, 2021, as filed February 10, 2022, and the Company’s forthcoming Annual Report on Form 10-K for the year ended December 31, 2022. The detailed financial tables and other information are also available on the Investor Relations page of the Company’s website at www.investors.synchronyfinancial.com. This information is also furnished in a Current Report on Form 8-K filed with the SEC today. | |||||||||||||||||||||||
CONFERENCE CALL AND WEBCAST | ||||||||||||||
On Monday, January 23, 2023, at 8:00 a.m. Eastern Time, Brian Doubles, President and Chief Executive Officer, and Brian Wenzel Sr., Executive Vice President and Chief Financial Officer, will host a conference call to review the financial results and outlook for certain business drivers. The conference call can be accessed via an audio webcast through the Investor Relations page on the Synchrony Financial corporate website, www.investors.synchronyfinancial.com, under Events and Presentations. A replay will also be available on the website. | ||||||||||||||
ABOUT SYNCHRONY FINANCIAL
Synchrony (NYSE: SYF) is a premier consumer financial services company delivering one of the industry’s most complete digitally-enabled product suites. Our experience, expertise and scale encompass a broad spectrum of industries including digital, health and wellness, retail, telecommunications, home, auto, outdoor, pet and more. We have an established and diverse group of national and regional retailers, local merchants, manufacturers, buying groups, industry associations and healthcare service providers, which we refer to as our “partners.” We connect our partners and consumers through our dynamic financial ecosystem and provide them with a diverse set of financing solutions and innovative digital capabilities to address their specific needs and deliver seamless, omnichannel experiences. We offer the right financing products to the right customers in their channel of choice.
For more information, visit www.synchrony.com and Twitter: @Synchrony.
| Investor Relations | Media Relations | ||||
| Kathryn Miller | Lisa Lanspery | ||||
| (203) 585-6291 | (203) 585-6143 | ||||
CAUTIONARY STATEMENT REGARDING FORWARD-LOOKING STATEMENTS
This news release contains certain forward-looking statements as defined in Section 27A of the Securities Act of 1933, as amended, and Section 21E of the Securities Exchange Act of 1934, as amended, which are subject to the "safe harbor" created by those sections. Forward-looking statements may be identified by words such as "expects," "intends," "anticipates," "plans," "believes," "seeks," "targets," "outlook," "estimates," "will," "should," "may" or words of similar meaning, but these words are not the exclusive means of identifying forward-looking statements. Forward-looking statements are based on management's current expectations and assumptions, and are subject to inherent uncertainties, risks and changes in circumstances that are difficult to predict. As a result, actual results could differ materially from those indicated in these forward-looking statements. Factors that could cause actual results to differ materially include global political, economic, business, competitive, market, regulatory and other factors and risks, such as: the impact of macroeconomic conditions and whether industry trends we have identified develop as anticipated, including the future impacts of the novel coronavirus disease (“COVID-19”) outbreak and measures taken in response thereto for which future developments are highly uncertain and difficult to predict; retaining existing partners and attracting new partners, concentration of our revenue in a small number of partners, and promotion and support of our products by our partners; cyber-attacks or other security breaches; disruptions in the operations of our and our outsourced partners' computer systems and data centers; the financial performance of our partners; the sufficiency of our allowance for credit losses and the accuracy of the assumptions or estimates used in preparing our financial statements, including those related to the CECL accounting guidance; higher borrowing costs and adverse financial market conditions impacting our funding and liquidity, and any reduction in our credit ratings; our ability to grow our deposits in the future; damage to our reputation; our ability to securitize our loan receivables, occurrence of an early amortization of our securitization facilities, loss of the right to service or subservice our securitized loan receivables, and lower payment rates on our securitized loan receivables; changes in market interest rates and the impact of any margin compression; effectiveness of our risk management processes and procedures, reliance on models which may be inaccurate or misinterpreted, our ability to manage our credit risk; our ability to offset increases in our costs in retailer share arrangements; competition in the consumer finance industry; our concentration in the U.S. consumer credit market; our ability to successfully develop and commercialize new or enhanced products and services; our ability to realize the value of acquisitions and strategic investments; reductions in interchange fees; fraudulent activity; failure of third parties to provide various services that are important to our operations; international risks and compliance and regulatory risks and costs associated with international operations; alleged infringement of intellectual property rights of others and our ability to protect our intellectual property; litigation and regulatory actions; our ability to attract, retain and motivate key officers and employees; tax legislation initiatives or challenges to our tax positions and/or interpretations, and state sales tax rules and regulations; regulation, supervision, examination and enforcement of our business by governmental authorities, the impact of the Dodd-Frank Wall Street Reform and Consumer Protection Act and other legislative and regulatory developments and the impact of the Consumer Financial Protection Bureau’s regulation of our business; impact of capital adequacy rules and liquidity requirements; restrictions that limit our ability to pay dividends and repurchase our common stock, and restrictions that limit the Synchrony Bank’s ability to pay dividends to us; regulations relating to privacy, information security and data protection; use of third-party vendors and ongoing third-party business relationships; and failure to comply with anti-money laundering and anti-terrorism financing laws.
CAUTIONARY STATEMENT REGARDING FORWARD-LOOKING STATEMENTS
For the reasons described above, we caution you against relying on any forward-looking statements, which should also be read in conjunction with the other cautionary statements that are included elsewhere in this news release and in our public filings, including under the heading "Risk Factors" in the Company's Annual Report on Form 10-K for the fiscal year ended December 31, 2021, as filed on February 10, 2022. You should not consider any list of such factors to be an exhaustive statement of all the risks, uncertainties, or potentially inaccurate assumptions that could cause our current expectations or beliefs to change. Further, any forward-looking statement speaks only as of the date on which it is made, and we undertake no obligation to update or revise any forward-looking statement to reflect events or circumstances after the date on which the statement is made or to reflect the occurrence of unanticipated events, except as otherwise may be required by law.
NON-GAAP MEASURES
The information provided herein includes measures we refer to as “Core,” "tangible common equity," and certain “CECL fully phased-in" capital measures, which are not prepared in accordance with U.S. generally accepted accounting principles ("GAAP"). For a reconciliation of these non-GAAP measures to the most directly comparable GAAP measures, please see the detailed financial tables and information that follow. For a statement regarding the usefulness of these measures to investors, please see the Company's Current Report on Form 8-K filed with the SEC today.
Exhibit 99.2
| SYNCHRONY FINANCIAL | |||||||||||||||||||||||||||||||||||||||||||||||||||||||||||
| FINANCIAL SUMMARY | |||||||||||||||||||||||||||||||||||||||||||||||||||||||||||
| (unaudited, in millions, except per share statistics) | |||||||||||||||||||||||||||||||||||||||||||||||||||||||||||
| Quarter Ended | Twelve Months Ended | ||||||||||||||||||||||||||||||||||||||||||||||||||||||||||
| Dec 31, 2022 | Sep 30, 2022 | June 30, 2022 | Mar 31, 2022 | Dec 31, 2021 | 4Q'22 vs. 4Q'21 | Dec 31, 2022 | Dec 31, 2021 | YTD'22 vs. YTD'21 | |||||||||||||||||||||||||||||||||||||||||||||||||||
| EARNINGS | |||||||||||||||||||||||||||||||||||||||||||||||||||||||||||
| Net interest income | $ | 4,106 | $ | 3,928 | $ | 3,802 | $ | 3,789 | $ | 3,830 | $ | 276 | 7.2 | % | $ | 15,625 | $ | 14,239 | $ | 1,386 | 9.7 | % | |||||||||||||||||||||||||||||||||||||
| Retailer share arrangements | (1,043) | (1,057) | (1,127) | (1,104) | (1,267) | 224 | (17.7) | % | (4,331) | (4,528) | 197 | (4.4) | % | ||||||||||||||||||||||||||||||||||||||||||||||
| Provision for credit losses | 1,201 | 929 | 724 | 521 | 561 | 640 | 114.1 | % | 3,375 | 726 | 2,649 | NM | |||||||||||||||||||||||||||||||||||||||||||||||
| Net interest income, after retailer share arrangements and provision for credit losses | 1,862 | 1,942 | 1,951 | 2,164 | 2,002 | (140) | (7.0) | % | 7,919 | 8,985 | (1,066) | (11.9) | % | ||||||||||||||||||||||||||||||||||||||||||||||
| Other income | 30 | 44 | 198 | 108 | 167 | (137) | (82.0) | % | 380 | 481 | (101) | (21.0) | % | ||||||||||||||||||||||||||||||||||||||||||||||
| Other expense | 1,151 | 1,064 | 1,083 | 1,039 | 1,122 | 29 | 2.6 | % | 4,337 | 3,963 | 374 | 9.4 | % | ||||||||||||||||||||||||||||||||||||||||||||||
| Earnings before provision for income taxes | 741 | 922 | 1,066 | 1,233 | 1,047 | (306) | (29.2) | % | 3,962 | 5,503 | (1,541) | (28.0) | % | ||||||||||||||||||||||||||||||||||||||||||||||
| Provision for income taxes | 164 | 219 | 262 | 301 | 234 | (70) | (29.9) | % | 946 | 1,282 | (336) | (26.2) | % | ||||||||||||||||||||||||||||||||||||||||||||||
| Net earnings | $ | 577 | $ | 703 | $ | 804 | $ | 932 | $ | 813 | $ | (236) | (29.0) | % | $ | 3,016 | $ | 4,221 | $ | (1,205) | (28.5) | % | |||||||||||||||||||||||||||||||||||||
| Net earnings available to common stockholders | $ | 567 | $ | 692 | $ | 793 | $ | 922 | $ | 803 | $ | (236) | (29.4) | % | $ | 2,974 | $ | 4,179 | $ | (1,205) | (28.8) | % | |||||||||||||||||||||||||||||||||||||
| COMMON SHARE STATISTICS | |||||||||||||||||||||||||||||||||||||||||||||||||||||||||||
| Basic EPS | $ | 1.27 | $ | 1.48 | $ | 1.61 | $ | 1.79 | $ | 1.49 | $ | (0.22) | (14.8) | % | $ | 6.19 | $ | 7.40 | $ | (1.21) | (16.4) | % | |||||||||||||||||||||||||||||||||||||
| Diluted EPS | $ | 1.26 | $ | 1.47 | $ | 1.60 | $ | 1.77 | $ | 1.48 | $ | (0.22) | (14.9) | % | $ | 6.15 | $ | 7.34 | $ | (1.19) | (16.2) | % | |||||||||||||||||||||||||||||||||||||
| Dividend declared per share | $ | 0.23 | $ | 0.23 | $ | 0.22 | $ | 0.22 | $ | 0.22 | $ | 0.01 | 4.5 | % | $ | 0.90 | $ | 0.88 | $ | 0.02 | 2.3 | % | |||||||||||||||||||||||||||||||||||||
| Common stock price | $ | 32.86 | $ | 28.19 | $ | 27.62 | $ | 34.82 | $ | 46.39 | $ | (13.53) | (29.2) | % | $ | 32.86 | $ | 46.39 | $ | (13.53) | (29.2) | % | |||||||||||||||||||||||||||||||||||||
| Book value per share | $ | 27.70 | $ | 26.76 | $ | 25.95 | $ | 25.06 | $ | 24.53 | $ | 3.17 | 12.9 | % | $ | 27.70 | $ | 24.53 | $ | 3.17 | 12.9 | % | |||||||||||||||||||||||||||||||||||||
Tangible common equity per share(1) | $ | 22.24 | $ | 22.10 | $ | 21.39 | $ | 20.60 | $ | 20.21 | $ | 2.03 | 10.0 | % | $ | 22.24 | $ | 20.21 | $ | 2.03 | 10.0 | % | |||||||||||||||||||||||||||||||||||||
| Beginning common shares outstanding | 458.9 | 487.8 | 506.2 | 526.8 | 547.2 | (88.3) | (16.1) | % | 526.8 | 584.0 | (57.2) | (9.8) | % | ||||||||||||||||||||||||||||||||||||||||||||||
| Issuance of common shares | — | — | — | — | — | — | — | % | — | — | — | — | % | ||||||||||||||||||||||||||||||||||||||||||||||
| Stock-based compensation | 0.1 | 0.4 | 0.2 | 1.4 | 0.1 | — | — | % | 2.1 | 3.8 | (1.7) | (44.7) | % | ||||||||||||||||||||||||||||||||||||||||||||||
| Shares repurchased | (20.8) | (29.3) | (18.6) | (22.0) | (20.5) | (0.3) | 1.5 | % | (90.7) | (61.0) | (29.7) | 48.7 | % | ||||||||||||||||||||||||||||||||||||||||||||||
| Ending common shares outstanding | 438.2 | 458.9 | 487.8 | 506.2 | 526.8 | (88.6) | (16.8) | % | 438.2 | 526.8 | (88.6) | (16.8) | % | ||||||||||||||||||||||||||||||||||||||||||||||
| Weighted average common shares outstanding | 445.8 | 468.5 | 493.0 | 515.3 | 537.8 | (92.0) | (17.1) | % | 480.4 | 564.6 | (84.2) | (14.9) | % | ||||||||||||||||||||||||||||||||||||||||||||||
| Weighted average common shares outstanding (fully diluted) | 448.9 | 470.7 | 495.3 | 519.5 | 543.0 | (94.1) | (17.3) | % | 483.4 | 569.3 | (85.9) | (15.1) | % | ||||||||||||||||||||||||||||||||||||||||||||||
| (1) Tangible Common Equity ("TCE") is a non-GAAP measure. For corresponding reconciliation of TCE to a GAAP financial measure, see Reconciliation of Non-GAAP Measures and Calculations of Regulatory Measures. | |||||||||||||||||||||||||||||||||||||||||||||||||||||||||||
1
| SYNCHRONY FINANCIAL | |||||||||||||||||||||||||||||||||||||||||||||||||||||||||||
| SELECTED METRICS | |||||||||||||||||||||||||||||||||||||||||||||||||||||||||||
| (unaudited, $ in millions) | |||||||||||||||||||||||||||||||||||||||||||||||||||||||||||
| Quarter Ended | Twelve Months Ended | ||||||||||||||||||||||||||||||||||||||||||||||||||||||||||
| Dec 31, 2022 | Sep 30, 2022 | June 30, 2022 | Mar 31, 2022 | Dec 31, 2021 | 4Q'22 vs. 4Q'21 | Dec 31, 2022 | Dec 31, 2021 | YTD'22 vs. YTD'21 | |||||||||||||||||||||||||||||||||||||||||||||||||||
| PERFORMANCE METRICS | |||||||||||||||||||||||||||||||||||||||||||||||||||||||||||
Return on assets(1) | 2.2 | % | 2.8 | % | 3.4 | % | 4.0 | % | 3.4 | % | (1.2) | % | 3.1 | % | 4.5 | % | (1.4) | % | |||||||||||||||||||||||||||||||||||||||||
Return on equity(2) | 17.5 | % | 21.1 | % | 24.0 | % | 27.5 | % | 23.0 | % | (5.5) | % | 22.6 | % | 30.8 | % | (8.2) | % | |||||||||||||||||||||||||||||||||||||||||
Return on tangible common equity(3) | 22.1 | % | 26.6 | % | 30.3 | % | 34.9 | % | 28.7 | % | (6.6) | % | 28.5 | % | 38.8 | % | (10.3) | % | |||||||||||||||||||||||||||||||||||||||||
Net interest margin(4) | 15.58 | % | 15.52 | % | 15.60 | % | 15.80 | % | 15.77 | % | (0.19) | % | 15.63 | % | 14.74 | % | 0.89 | % | |||||||||||||||||||||||||||||||||||||||||
Efficiency ratio(5) | 37.2 | % | 36.5 | % | 37.7 | % | 37.2 | % | 41.1 | % | (3.9) | % | 37.2 | % | 38.9 | % | (1.7) | % | |||||||||||||||||||||||||||||||||||||||||
| Other expense as a % of average loan receivables, including held for sale | 5.16 | % | 5.02 | % | 5.21 | % | 5.09 | % | 5.44 | % | (0.28) | % | 5.12 | % | 5.02 | % | 0.10 | % | |||||||||||||||||||||||||||||||||||||||||
| Effective income tax rate | 22.1 | % | 23.8 | % | 24.6 | % | 24.4 | % | 22.3 | % | (0.2) | % | 23.9 | % | 23.3 | % | 0.6 | % | |||||||||||||||||||||||||||||||||||||||||
| CREDIT QUALITY METRICS | |||||||||||||||||||||||||||||||||||||||||||||||||||||||||||
| Net charge-offs as a % of average loan receivables, including held for sale | 3.48 | % | 3.00 | % | 2.73 | % | 2.73 | % | 2.37 | % | 1.11 | % | 3.00 | % | 2.92 | % | 0.08 | % | |||||||||||||||||||||||||||||||||||||||||
30+ days past due as a % of period-end loan receivables(6) | 3.65 | % | 3.28 | % | 2.74 | % | 2.78 | % | 2.62 | % | 1.03 | % | 3.65 | % | 2.62 | % | 1.03 | % | |||||||||||||||||||||||||||||||||||||||||
90+ days past due as a % of period-end loan receivables(6) | 1.69 | % | 1.43 | % | 1.22 | % | 1.30 | % | 1.17 | % | 0.52 | % | 1.69 | % | 1.17 | % | 0.52 | % | |||||||||||||||||||||||||||||||||||||||||
| Net charge-offs | $ | 776 | $ | 635 | $ | 567 | $ | 558 | $ | 489 | $ | 287 | 58.7 | % | $ | 2,536 | $ | 2,304 | $ | 232 | 10.1 | % | |||||||||||||||||||||||||||||||||||||
Loan receivables delinquent over 30 days(6) | $ | 3,377 | $ | 2,818 | $ | 2,262 | $ | 2,194 | $ | 2,114 | $ | 1,263 | 59.7 | % | $ | 3,377 | $ | 2,114 | $ | 1,263 | 59.7 | % | |||||||||||||||||||||||||||||||||||||
Loan receivables delinquent over 90 days(6) | $ | 1,562 | $ | 1,232 | $ | 1,005 | $ | 1,026 | $ | 942 | $ | 620 | 65.8 | % | $ | 1,562 | $ | 942 | $ | 620 | 65.8 | % | |||||||||||||||||||||||||||||||||||||
| Allowance for credit losses (period-end) | $ | 9,527 | $ | 9,102 | $ | 8,808 | $ | 8,651 | $ | 8,688 | $ | 839 | 9.7 | % | $ | 9,527 | $ | 8,688 | $ | 839 | 9.7 | % | |||||||||||||||||||||||||||||||||||||
Allowance coverage ratio(7) | 10.30 | % | 10.58 | % | 10.65 | % | 10.96 | % | 10.76 | % | (0.46) | % | 10.30 | % | 10.76 | % | (0.46) | % | |||||||||||||||||||||||||||||||||||||||||
| BUSINESS METRICS | |||||||||||||||||||||||||||||||||||||||||||||||||||||||||||
Purchase volume(8)(9) | $ | 47,923 | $ | 44,557 | $ | 47,217 | $ | 40,490 | $ | 47,072 | $ | 851 | 1.8 | % | $ | 180,187 | $ | 165,854 | $ | 14,333 | 8.6 | % | |||||||||||||||||||||||||||||||||||||
| Period-end loan receivables | $ | 92,470 | $ | 86,012 | $ | 82,674 | $ | 78,916 | $ | 80,740 | $ | 11,730 | 14.5 | % | $ | 92,470 | $ | 80,740 | $ | 11,730 | 14.5 | % | |||||||||||||||||||||||||||||||||||||
| Credit cards | $ | 87,630 | $ | 81,254 | $ | 78,062 | $ | 74,596 | $ | 76,628 | $ | 11,002 | 14.4 | % | $ | 87,630 | $ | 76,628 | $ | 11,002 | 14.4 | % | |||||||||||||||||||||||||||||||||||||
| Consumer installment loans | $ | 3,056 | $ | 2,945 | $ | 2,847 | $ | 2,719 | $ | 2,675 | $ | 381 | 14.2 | % | $ | 3,056 | $ | 2,675 | $ | 381 | 14.2 | % | |||||||||||||||||||||||||||||||||||||
| Commercial credit products | $ | 1,682 | $ | 1,723 | $ | 1,689 | $ | 1,530 | $ | 1,372 | $ | 310 | 22.6 | % | $ | 1,682 | $ | 1,372 | $ | 310 | 22.6 | % | |||||||||||||||||||||||||||||||||||||
| Other | $ | 102 | $ | 90 | $ | 76 | $ | 71 | $ | 65 | $ | 37 | 56.9 | % | $ | 102 | $ | 65 | $ | 37 | 56.9 | % | |||||||||||||||||||||||||||||||||||||
| Average loan receivables, including held for sale | $ | 88,436 | $ | 84,038 | $ | 83,412 | $ | 82,747 | $ | 81,784 | $ | 6,652 | 8.1 | % | $ | 84,672 | $ | 78,928 | $ | 5,744 | 7.3 | % | |||||||||||||||||||||||||||||||||||||
Period-end active accounts (in thousands)(9)(10) | 70,763 | 66,503 | 65,969 | 69,122 | 72,420 | (1,657) | (2.3) | % | 70,763 | 72,420 | (1,657) | (2.3) | % | ||||||||||||||||||||||||||||||||||||||||||||||
Average active accounts (in thousands)(9)(10) | 68,373 | 66,266 | 68,671 | 70,127 | 69,397 | (1,024) | (1.5) | % | 68,627 | 67,334 | 1,293 | 1.9 | % | ||||||||||||||||||||||||||||||||||||||||||||||
| LIQUIDITY | |||||||||||||||||||||||||||||||||||||||||||||||||||||||||||
| Liquid assets | |||||||||||||||||||||||||||||||||||||||||||||||||||||||||||
| Cash and equivalents | $ | 10,294 | $ | 11,962 | $ | 10,682 | $ | 10,541 | $ | 8,337 | $ | 1,957 | 23.5 | % | $ | 10,294 | $ | 8,337 | $ | 1,957 | 23.5 | % | |||||||||||||||||||||||||||||||||||||
| Total liquid assets | $ | 14,201 | $ | 16,566 | $ | 15,177 | $ | 14,687 | $ | 12,989 | $ | 1,212 | 9.3 | % | $ | 14,201 | $ | 12,989 | $ | 1,212 | 9.3 | % | |||||||||||||||||||||||||||||||||||||
| Undrawn credit facilities | |||||||||||||||||||||||||||||||||||||||||||||||||||||||||||
| Undrawn credit facilities | $ | 2,950 | $ | 3,700 | $ | 3,700 | $ | 3,100 | $ | 2,700 | $ | 250 | 9.3 | % | $ | 2,950 | $ | 2,700 | $ | 250 | 9.3 | % | |||||||||||||||||||||||||||||||||||||
| Total liquid assets and undrawn credit facilities | $ | 17,151 | $ | 20,266 | $ | 18,877 | $ | 17,787 | $ | 15,689 | $ | 1,462 | 9.3 | % | $ | 17,151 | $ | 15,689 | $ | 1,462 | 9.3 | % | |||||||||||||||||||||||||||||||||||||
| Liquid assets % of total assets | 13.58 | % | 16.44 | % | 15.94 | % | 15.42 | % | 13.57 | % | 0.01 | % | 13.58 | % | 13.57 | % | 0.01 | % | |||||||||||||||||||||||||||||||||||||||||
| Liquid assets including undrawn credit facilities % of total assets | 16.40 | % | 20.11 | % | 19.83 | % | 18.67 | % | 16.39 | % | 0.01 | % | 16.40 | % | 16.39 | % | 0.01 | % | |||||||||||||||||||||||||||||||||||||||||
| (1) Return on assets represents net earnings as a percentage of average total assets. | |||||||||||||||||||||||||||||||||||||||||||||||||||||||||||
| (2) Return on equity represents net earnings as a percentage of average total equity. | |||||||||||||||||||||||||||||||||||||||||||||||||||||||||||
| (3) Return on tangible common equity represents net earnings available to common stockholders as a percentage of average tangible common equity. Tangible common equity ("TCE") is a non-GAAP measure. For corresponding reconciliation of TCE to a GAAP financial measure, see Reconciliation of Non-GAAP Measures and Calculations of Regulatory Measures. | |||||||||||||||||||||||||||||||||||||||||||||||||||||||||||
| (4) Net interest margin represents net interest income divided by average interest-earning assets. | |||||||||||||||||||||||||||||||||||||||||||||||||||||||||||
| (5) Efficiency ratio represents (i) other expense, divided by (ii) net interest income, plus other income, less retailer share arrangements. | |||||||||||||||||||||||||||||||||||||||||||||||||||||||||||
| (6) Based on customer statement-end balances extrapolated to the respective period-end date. | |||||||||||||||||||||||||||||||||||||||||||||||||||||||||||
| (7) Allowance coverage ratio represents allowance for credit losses divided by total period-end loan receivables. | |||||||||||||||||||||||||||||||||||||||||||||||||||||||||||
| (8) Purchase volume, or net credit sales, represents the aggregate amount of charges incurred on credit cards or other credit product accounts less returns during the period. | |||||||||||||||||||||||||||||||||||||||||||||||||||||||||||
| (9) Includes activity and accounts associated with loan receivables held for sale. | |||||||||||||||||||||||||||||||||||||||||||||||||||||||||||
| (10) Active accounts represent credit card or installment loan accounts on which there has been a purchase, payment or outstanding balance in the current month. | |||||||||||||||||||||||||||||||||||||||||||||||||||||||||||
2
| SYNCHRONY FINANCIAL | |||||||||||||||||||||||||||||||||||||||||||||||||||||||||||
| STATEMENTS OF EARNINGS | |||||||||||||||||||||||||||||||||||||||||||||||||||||||||||
| (unaudited, $ in millions) | |||||||||||||||||||||||||||||||||||||||||||||||||||||||||||
| Quarter Ended | Twelve Months Ended | ||||||||||||||||||||||||||||||||||||||||||||||||||||||||||
| Dec 31, 2022 | Sep 30, 2022 | June 30, 2022 | Mar 31, 2022 | Dec 31, 2021 | 4Q'22 vs. 4Q'21 | Dec 31, 2022 | Dec 31, 2021 | YTD'22 vs. YTD'21 | |||||||||||||||||||||||||||||||||||||||||||||||||||
| Interest income: | |||||||||||||||||||||||||||||||||||||||||||||||||||||||||||
| Interest and fees on loans | $ | 4,576 | $ | 4,258 | $ | 4,039 | $ | 4,008 | $ | 4,042 | $ | 534 | 13.2 | % | $ | 16,881 | $ | 15,228 | $ | 1,653 | 10.9 | % | |||||||||||||||||||||||||||||||||||||
| Interest on cash and debt securities | 132 | 84 | 35 | 14 | 11 | 121 | NM | 265 | 43 | 222 | NM | ||||||||||||||||||||||||||||||||||||||||||||||||
| Total interest income | 4,708 | 4,342 | 4,074 | 4,022 | 4,053 | 655 | 16.2 | % | 17,146 | 15,271 | 1,875 | 12.3 | % | ||||||||||||||||||||||||||||||||||||||||||||||
| Interest expense: | |||||||||||||||||||||||||||||||||||||||||||||||||||||||||||
| Interest on deposits | 441 | 280 | 160 | 127 | 119 | 322 | 270.6 | % | 1,008 | 566 | 442 | 78.1 | % | ||||||||||||||||||||||||||||||||||||||||||||||
| Interest on borrowings of consolidated securitization entities | 69 | 54 | 40 | 33 | 33 | 36 | 109.1 | % | 196 | 169 | 27 | 16.0 | % | ||||||||||||||||||||||||||||||||||||||||||||||
| Interest on senior unsecured notes | 92 | 80 | 72 | 73 | 71 | 21 | 29.6 | % | 317 | 297 | 20 | 6.7 | % | ||||||||||||||||||||||||||||||||||||||||||||||
| Total interest expense | 602 | 414 | 272 | 233 | 223 | 379 | 170.0 | % | 1,521 | 1,032 | 489 | 47.4 | % | ||||||||||||||||||||||||||||||||||||||||||||||
| Net interest income | 4,106 | 3,928 | 3,802 | 3,789 | 3,830 | 276 | 7.2 | % | 15,625 | 14,239 | 1,386 | 9.7 | % | ||||||||||||||||||||||||||||||||||||||||||||||
| Retailer share arrangements | (1,043) | (1,057) | (1,127) | (1,104) | (1,267) | 224 | (17.7) | % | (4,331) | (4,528) | 197 | (4.4) | % | ||||||||||||||||||||||||||||||||||||||||||||||
| Provision for credit losses | 1,201 | 929 | 724 | 521 | 561 | 640 | 114.1 | % | 3,375 | 726 | 2,649 | NM | |||||||||||||||||||||||||||||||||||||||||||||||
| Net interest income, after retailer share arrangements and provision for credit losses | 1,862 | 1,942 | 1,951 | 2,164 | 2,002 | (140) | (7.0) | % | 7,919 | 8,985 | (1,066) | (11.9) | % | ||||||||||||||||||||||||||||||||||||||||||||||
| Other income: | |||||||||||||||||||||||||||||||||||||||||||||||||||||||||||
| Interchange revenue | 251 | 238 | 263 | 230 | 254 | (3) | (1.2) | % | 982 | 880 | 102 | 11.6 | % | ||||||||||||||||||||||||||||||||||||||||||||||
| Debt cancellation fees | 102 | 103 | 93 | 89 | 79 | 23 | 29.1 | % | 387 | 284 | 103 | 36.3 | % | ||||||||||||||||||||||||||||||||||||||||||||||
| Loyalty programs | (351) | (326) | (322) | (258) | (310) | (41) | 13.2 | % | (1,257) | (992) | (265) | 26.7 | % | ||||||||||||||||||||||||||||||||||||||||||||||
| Other | 28 | 29 | 164 | 47 | 144 | (116) | (80.6) | % | 268 | 309 | (41) | (13.3) | % | ||||||||||||||||||||||||||||||||||||||||||||||
| Total other income | 30 | 44 | 198 | 108 | 167 | (137) | (82.0) | % | 380 | 481 | (101) | (21.0) | % | ||||||||||||||||||||||||||||||||||||||||||||||
| Other expense: | |||||||||||||||||||||||||||||||||||||||||||||||||||||||||||
| Employee costs | 459 | 416 | 404 | 402 | 409 | 50 | 12.2 | % | 1,681 | 1,501 | 180 | 12.0 | % | ||||||||||||||||||||||||||||||||||||||||||||||
| Professional fees | 233 | 204 | 185 | 210 | 207 | 26 | 12.6 | % | 832 | 782 | 50 | 6.4 | % | ||||||||||||||||||||||||||||||||||||||||||||||
| Marketing and business development | 121 | 115 | 135 | 116 | 167 | (46) | (27.5) | % | 487 | 486 | 1 | 0.2 | % | ||||||||||||||||||||||||||||||||||||||||||||||
| Information processing | 165 | 150 | 163 | 145 | 143 | 22 | 15.4 | % | 623 | 550 | 73 | 13.3 | % | ||||||||||||||||||||||||||||||||||||||||||||||
| Other | 173 | 179 | 196 | 166 | 196 | (23) | (11.7) | % | 714 | 644 | 70 | 10.9 | % | ||||||||||||||||||||||||||||||||||||||||||||||
| Total other expense | 1,151 | 1,064 | 1,083 | 1,039 | 1,122 | 29 | 2.6 | % | 4,337 | 3,963 | 374 | 9.4 | % | ||||||||||||||||||||||||||||||||||||||||||||||
| Earnings before provision for income taxes | 741 | 922 | 1,066 | 1,233 | 1,047 | (306) | (29.2) | % | 3,962 | 5,503 | (1,541) | (28.0) | % | ||||||||||||||||||||||||||||||||||||||||||||||
| Provision for income taxes | 164 | 219 | 262 | 301 | 234 | (70) | (29.9) | % | 946 | 1,282 | (336) | (26.2) | % | ||||||||||||||||||||||||||||||||||||||||||||||
| Net earnings | $ | 577 | $ | 703 | $ | 804 | $ | 932 | $ | 813 | $ | (236) | (29.0) | % | $ | 3,016 | $ | 4,221 | $ | (1,205) | (28.5) | % | |||||||||||||||||||||||||||||||||||||
| Net earnings available to common stockholders | $ | 567 | $ | 692 | $ | 793 | $ | 922 | $ | 803 | $ | (236) | (29.4) | % | $ | 2,974 | $ | 4,179 | $ | (1,205) | (28.8) | % | |||||||||||||||||||||||||||||||||||||
3
| SYNCHRONY FINANCIAL | ||||||||||||||||||||||||||||||||||||||
| STATEMENTS OF FINANCIAL POSITION | ||||||||||||||||||||||||||||||||||||||
| (unaudited, $ in millions) | ||||||||||||||||||||||||||||||||||||||
| Quarter Ended | ||||||||||||||||||||||||||||||||||||||
| Dec 31, 2022 | Sep 30, 2022 | June 30, 2022 | Mar 31, 2022 | Dec 31, 2021 | Dec 31, 2022 vs. Dec 31, 2021 | |||||||||||||||||||||||||||||||||
| Assets | ||||||||||||||||||||||||||||||||||||||
| Cash and equivalents | $ | 10,294 | $ | 11,962 | $ | 10,682 | $ | 10,541 | $ | 8,337 | $ | 1,957 | 23.5 | % | ||||||||||||||||||||||||
| Debt securities | 4,879 | 5,082 | 5,012 | 4,677 | 5,283 | (404) | (7.6) | % | ||||||||||||||||||||||||||||||
| Loan receivables: | ||||||||||||||||||||||||||||||||||||||
| Unsecuritized loans held for investment | 72,638 | 67,651 | 63,350 | 59,643 | 60,211 | 12,427 | 20.6 | % | ||||||||||||||||||||||||||||||
| Restricted loans of consolidated securitization entities | 19,832 | 18,361 | 19,324 | 19,273 | 20,529 | (697) | (3.4) | % | ||||||||||||||||||||||||||||||
| Total loan receivables | 92,470 | 86,012 | 82,674 | 78,916 | 80,740 | 11,730 | 14.5 | % | ||||||||||||||||||||||||||||||
| Less: Allowance for credit losses | (9,527) | (9,102) | (8,808) | (8,651) | (8,688) | (839) | 9.7 | % | ||||||||||||||||||||||||||||||
| Loan receivables, net | 82,943 | 76,910 | 73,866 | 70,265 | 72,052 | 10,891 | 15.1 | % | ||||||||||||||||||||||||||||||
| Loan receivables held for sale | — | — | — | 4,046 | 4,361 | (4,361) | (100.0) | % | ||||||||||||||||||||||||||||||
| Goodwill | 1,105 | 1,105 | 1,105 | 1,105 | 1,105 | — | — | % | ||||||||||||||||||||||||||||||
| Intangible assets, net | 1,287 | 1,033 | 1,118 | 1,149 | 1,168 | 119 | 10.2 | % | ||||||||||||||||||||||||||||||
| Other assets | 4,056 | 4,674 | 3,417 | 3,484 | 3,442 | 614 | 17.8 | % | ||||||||||||||||||||||||||||||
| Total assets | $ | 104,564 | $ | 100,766 | $ | 95,200 | $ | 95,267 | $ | 95,748 | $ | 8,816 | 9.2 | % | ||||||||||||||||||||||||
| Liabilities and Equity | ||||||||||||||||||||||||||||||||||||||
| Deposits: | ||||||||||||||||||||||||||||||||||||||
| Interest-bearing deposit accounts | $ | 71,336 | $ | 68,032 | $ | 64,328 | $ | 63,180 | $ | 61,911 | $ | 9,425 | 15.2 | % | ||||||||||||||||||||||||
| Non-interest-bearing deposit accounts | 399 | 372 | 381 | 395 | 359 | 40 | 11.1 | % | ||||||||||||||||||||||||||||||
| Total deposits | 71,735 | 68,404 | 64,709 | 63,575 | 62,270 | 9,465 | 15.2 | % | ||||||||||||||||||||||||||||||
| Borrowings: | ||||||||||||||||||||||||||||||||||||||
| Borrowings of consolidated securitization entities | 6,227 | 6,360 | 5,687 | 6,139 | 7,288 | (1,061) | (14.6) | % | ||||||||||||||||||||||||||||||
| Senior unsecured notes | 7,964 | 7,961 | 6,470 | 7,221 | 7,219 | 745 | 10.3 | % | ||||||||||||||||||||||||||||||
| Total borrowings | 14,191 | 14,321 | 12,157 | 13,360 | 14,507 | (316) | (2.2) | % | ||||||||||||||||||||||||||||||
| Accrued expenses and other liabilities | 5,765 | 5,029 | 4,941 | 4,914 | 5,316 | 449 | 8.4 | % | ||||||||||||||||||||||||||||||
| Total liabilities | 91,691 | 87,754 | 81,807 | 81,849 | 82,093 | 9,598 | 11.7 | % | ||||||||||||||||||||||||||||||
| Equity: | ||||||||||||||||||||||||||||||||||||||
| Preferred stock | 734 | 734 | 734 | 734 | 734 | — | — | % | ||||||||||||||||||||||||||||||
| Common stock | 1 | 1 | 1 | 1 | 1 | — | — | % | ||||||||||||||||||||||||||||||
| Additional paid-in capital | 9,718 | 9,685 | 9,663 | 9,643 | 9,669 | 49 | 0.5 | % | ||||||||||||||||||||||||||||||
| Retained earnings | 16,716 | 16,252 | 15,679 | 15,003 | 14,245 | 2,471 | 17.3 | % | ||||||||||||||||||||||||||||||
| Accumulated other comprehensive income (loss) | (125) | (187) | (149) | (121) | (69) | (56) | 81.2 | % | ||||||||||||||||||||||||||||||
| Treasury stock | (14,171) | (13,473) | (12,535) | (11,842) | (10,925) | (3,246) | 29.7 | % | ||||||||||||||||||||||||||||||
| Total equity | 12,873 | 13,012 | 13,393 | 13,418 | 13,655 | (782) | (5.7) | % | ||||||||||||||||||||||||||||||
| Total liabilities and equity | $ | 104,564 | $ | 100,766 | $ | 95,200 | $ | 95,267 | $ | 95,748 | $ | 8,816 | 9.2 | % | ||||||||||||||||||||||||
4
| SYNCHRONY FINANCIAL | |||||||||||||||||||||||||||||||||||||||||||||||||||||||||||||||||||||||||||||||||||||||||
| AVERAGE BALANCES, NET INTEREST INCOME AND NET INTEREST MARGIN | |||||||||||||||||||||||||||||||||||||||||||||||||||||||||||||||||||||||||||||||||||||||||
| (unaudited, $ in millions) | |||||||||||||||||||||||||||||||||||||||||||||||||||||||||||||||||||||||||||||||||||||||||
| Quarter Ended | |||||||||||||||||||||||||||||||||||||||||||||||||||||||||||||||||||||||||||||||||||||||||
| Dec 31, 2022 | Sep 30, 2022 | Jun 30, 2022 | Mar 31, 2022 | Dec 31, 2021 | |||||||||||||||||||||||||||||||||||||||||||||||||||||||||||||||||||||||||||||||||||||
| Interest | Average | Interest | Average | Interest | Average | Interest | Average | Interest | Average | ||||||||||||||||||||||||||||||||||||||||||||||||||||||||||||||||||||||||||||||||
| Average | Income/ | Yield/ | Average | Income/ | Yield/ | Average | Income/ | Yield/ | Average | Income/ | Yield/ | Average | Income/ | Yield/ | |||||||||||||||||||||||||||||||||||||||||||||||||||||||||||||||||||||||||||
| Balance | Expense | Rate | Balance | Expense | Rate | Balance | Expense | Rate | Balance | Expense | Rate | Balance | Expense | Rate | |||||||||||||||||||||||||||||||||||||||||||||||||||||||||||||||||||||||||||
| Assets | |||||||||||||||||||||||||||||||||||||||||||||||||||||||||||||||||||||||||||||||||||||||||
| Interest-earning assets: | |||||||||||||||||||||||||||||||||||||||||||||||||||||||||||||||||||||||||||||||||||||||||
| Interest-earning cash and equivalents | $ | 11,092 | $ | 104 | 3.72 | % | $ | 11,506 | $ | 65 | 2.24 | % | $ | 9,249 | $ | 20 | 0.87 | % | $ | 8,976 | $ | 5 | 0.23 | % | $ | 9,024 | $ | 4 | 0.18 | % | |||||||||||||||||||||||||||||||||||||||||||||||||||||||||||
| Securities available for sale | 5,002 | 28 | 2.22 | % | 4,861 | 19 | 1.55 | % | 5,063 | 15 | 1.19 | % | 5,513 | 9 | 0.66 | % | 5,517 | 7 | 0.50 | % | |||||||||||||||||||||||||||||||||||||||||||||||||||||||||||||||||||||
| Loan receivables, including held for sale: | |||||||||||||||||||||||||||||||||||||||||||||||||||||||||||||||||||||||||||||||||||||||||
| Credit cards | 83,597 | 4,462 | 21.18 | % | 79,354 | 4,153 | 20.76 | % | 78,912 | 3,943 | 20.04 | % | 78,564 | 3,913 | 20.20 | % | 77,642 | 3,946 | 20.16 | % | |||||||||||||||||||||||||||||||||||||||||||||||||||||||||||||||||||||
| Consumer installment loans | 2,991 | 78 | 10.35 | % | 2,884 | 74 | 10.18 | % | 2,775 | 69 | 9.97 | % | 2,682 | 66 | 9.98 | % | 2,641 | 65 | 9.76 | % | |||||||||||||||||||||||||||||||||||||||||||||||||||||||||||||||||||||
| Commercial credit products | 1,757 | 34 | 7.68 | % | 1,720 | 30 | 6.92 | % | 1,654 | 25 | 6.06 | % | 1,434 | 28 | 7.92 | % | 1,434 | 30 | 8.30 | % | |||||||||||||||||||||||||||||||||||||||||||||||||||||||||||||||||||||
| Other | 91 | 2 | 8.72 | % | 80 | 1 | 4.96 | % | 71 | 2 | 11.30 | % | 67 | 1 | NM | 67 | 1 | NM | |||||||||||||||||||||||||||||||||||||||||||||||||||||||||||||||||||||||
| Total loan receivables, including held for sale | 88,436 | 4,576 | 20.53 | % | 84,038 | 4,258 | 20.10 | % | 83,412 | 4,039 | 19.42 | % | 82,747 | 4,008 | 19.64 | % | 81,784 | 4,042 | 19.61 | % | |||||||||||||||||||||||||||||||||||||||||||||||||||||||||||||||||||||
| Total interest-earning assets | 104,530 | 4,708 | 17.87 | % | 100,405 | 4,342 | 17.16 | % | 97,724 | 4,074 | 16.72 | % | 97,236 | 4,022 | 16.78 | % | 96,325 | 4,053 | 16.69 | % | |||||||||||||||||||||||||||||||||||||||||||||||||||||||||||||||||||||
| Non-interest-earning assets: | |||||||||||||||||||||||||||||||||||||||||||||||||||||||||||||||||||||||||||||||||||||||||
| Cash and due from banks | 1,071 | 1,580 | 1,614 | 1,626 | 1,606 | ||||||||||||||||||||||||||||||||||||||||||||||||||||||||||||||||||||||||||||||||||||
| Allowance for credit losses | (9,167) | (8,878) | (8,651) | (8,675) | (8,648) | ||||||||||||||||||||||||||||||||||||||||||||||||||||||||||||||||||||||||||||||||||||
| Other assets | 5,772 | 5,587 | 5,386 | 5,369 | 5,424 | ||||||||||||||||||||||||||||||||||||||||||||||||||||||||||||||||||||||||||||||||||||
| Total non-interest-earning assets | (2,324) | (1,711) | (1,651) | (1,680) | (1,618) | ||||||||||||||||||||||||||||||||||||||||||||||||||||||||||||||||||||||||||||||||||||
| Total assets | $ | 102,206 | $ | 98,694 | $ | 96,073 | $ | 95,556 | $ | 94,707 | |||||||||||||||||||||||||||||||||||||||||||||||||||||||||||||||||||||||||||||||
| Liabilities | |||||||||||||||||||||||||||||||||||||||||||||||||||||||||||||||||||||||||||||||||||||||||
| Interest-bearing liabilities: | |||||||||||||||||||||||||||||||||||||||||||||||||||||||||||||||||||||||||||||||||||||||||
| Interest-bearing deposit accounts | $ | 69,343 | $ | 441 | 2.52 | % | $ | 66,787 | $ | 280 | 1.66 | % | $ | 63,961 | $ | 160 | 1.00 | % | $ | 62,314 | $ | 127 | 0.83 | % | $ | 61,090 | $ | 119 | 0.77 | % | |||||||||||||||||||||||||||||||||||||||||||||||||||||||||||
| Borrowings of consolidated securitization entities | 6,231 | 69 | 4.39 | % | 6,258 | 54 | 3.42 | % | 6,563 | 40 | 2.44 | % | 6,827 | 33 | 1.96 | % | 7,105 | 33 | 1.84 | % | |||||||||||||||||||||||||||||||||||||||||||||||||||||||||||||||||||||
| Senior unsecured notes | 7,962 | 92 | 4.58 | % | 7,102 | 80 | 4.47 | % | 6,974 | 72 | 4.14 | % | 7,219 | 73 | 4.10 | % | 6,999 | 71 | 4.02 | % | |||||||||||||||||||||||||||||||||||||||||||||||||||||||||||||||||||||
| Total interest-bearing liabilities | 83,536 | 602 | 2.86 | % | 80,147 | 414 | 2.05 | % | 77,498 | 272 | 1.41 | % | 76,360 | 233 | 1.24 | % | 75,194 | 223 | 1.18 | % | |||||||||||||||||||||||||||||||||||||||||||||||||||||||||||||||||||||
| Non-interest-bearing liabilities | |||||||||||||||||||||||||||||||||||||||||||||||||||||||||||||||||||||||||||||||||||||||||
| Non-interest-bearing deposit accounts | 388 | 371 | 396 | 374 | 343 | ||||||||||||||||||||||||||||||||||||||||||||||||||||||||||||||||||||||||||||||||||||
| Other liabilities | 5,217 | 4,938 | 4,717 | 5,091 | 5,137 | ||||||||||||||||||||||||||||||||||||||||||||||||||||||||||||||||||||||||||||||||||||
| Total non-interest-bearing liabilities | 5,605 | 5,309 | 5,113 | 5,465 | 5,480 | ||||||||||||||||||||||||||||||||||||||||||||||||||||||||||||||||||||||||||||||||||||
| Total liabilities | 89,141 | 85,456 | 82,611 | 81,825 | 80,674 | ||||||||||||||||||||||||||||||||||||||||||||||||||||||||||||||||||||||||||||||||||||
| Equity | |||||||||||||||||||||||||||||||||||||||||||||||||||||||||||||||||||||||||||||||||||||||||
| Total equity | 13,065 | 13,238 | 13,462 | 13,731 | 14,033 | ||||||||||||||||||||||||||||||||||||||||||||||||||||||||||||||||||||||||||||||||||||
| Total liabilities and equity | $ | 102,206 | $ | 98,694 | $ | 96,073 | $ | 95,556 | $ | 94,707 | |||||||||||||||||||||||||||||||||||||||||||||||||||||||||||||||||||||||||||||||
| Net interest income | $ | 4,106 | $ | 3,928 | $ | 3,802 | $ | 3,789 | $ | 3,830 | |||||||||||||||||||||||||||||||||||||||||||||||||||||||||||||||||||||||||||||||
Interest rate spread(1) | 15.01 | % | 15.11 | % | 15.31 | % | 15.54 | % | 15.51 | % | |||||||||||||||||||||||||||||||||||||||||||||||||||||||||||||||||||||||||||||||
Net interest margin(2) | 15.58 | % | 15.52 | % | 15.60 | % | 15.80 | % | 15.77 | % | |||||||||||||||||||||||||||||||||||||||||||||||||||||||||||||||||||||||||||||||
| (1) Interest rate spread represents the difference between the yield on total interest-earning assets and the rate on total interest-bearing liabilities. | |||||||||||||||||||||||||||||||||||||||||||||||||||||||||||||||||||||||||||||||||||||||||
| (2) Net interest margin represents net interest income divided by average interest-earning assets. | |||||||||||||||||||||||||||||||||||||||||||||||||||||||||||||||||||||||||||||||||||||||||
5
| SYNCHRONY FINANCIAL | |||||||||||||||||||||||||||||||||||
| AVERAGE BALANCES, NET INTEREST INCOME AND NET INTEREST MARGIN | |||||||||||||||||||||||||||||||||||
| (unaudited, $ in millions) | |||||||||||||||||||||||||||||||||||
| Twelve Months Ended Dec 31, 2022 | Twelve Months Ended Dec 31, 2021 | ||||||||||||||||||||||||||||||||||
| Interest | Average | Interest | Average | ||||||||||||||||||||||||||||||||
| Average | Income/ | Yield/ | Average | Income/ | Yield/ | ||||||||||||||||||||||||||||||
| Balance | Expense | Rate | Balance | Expense | Rate | ||||||||||||||||||||||||||||||
| Assets | |||||||||||||||||||||||||||||||||||
| Interest-earning assets: | |||||||||||||||||||||||||||||||||||
| Interest-earning cash and equivalents | $ | 10,215 | $ | 194 | 1.90 | % | $ | 11,673 | $ | 15 | 0.13 | % | |||||||||||||||||||||||
| Securities available for sale | 5,108 | 71 | 1.39 | % | 5,975 | 28 | 0.47 | % | |||||||||||||||||||||||||||
| Loan receivables, including held for sale: | |||||||||||||||||||||||||||||||||||
| Credit cards | 80,119 | 16,471 | 20.56 | % | 75,052 | 14,880 | 19.83 | % | |||||||||||||||||||||||||||
| Consumer installment loans | 2,834 | 287 | 10.13 | % | 2,460 | 241 | 9.80 | % | |||||||||||||||||||||||||||
| Commercial credit products | 1,642 | 117 | 7.13 | % | 1,359 | 103 | 7.58 | % | |||||||||||||||||||||||||||
| Other | 77 | 6 | 7.79 | % | 57 | 4 | 7.02 | % | |||||||||||||||||||||||||||
| Total loan receivables, including held for sale | 84,672 | 16,881 | 19.94 | % | 78,928 | 15,228 | 19.29 | % | |||||||||||||||||||||||||||
| Total interest-earning assets | 99,995 | 17,146 | 17.15 | % | 96,576 | 15,271 | 15.81 | % | |||||||||||||||||||||||||||
| Non-interest-earning assets: | |||||||||||||||||||||||||||||||||||
| Cash and due from banks | 1,472 | 1,597 | |||||||||||||||||||||||||||||||||
| Allowance for loan losses | (8,844) | (9,402) | |||||||||||||||||||||||||||||||||
| Other assets | 5,529 | 5,343 | |||||||||||||||||||||||||||||||||
| Total non-interest-earning assets | (1,843) | (2,462) | |||||||||||||||||||||||||||||||||
| Total assets | $ | 98,152 | $ | 94,114 | |||||||||||||||||||||||||||||||
| Liabilities | |||||||||||||||||||||||||||||||||||
| Interest-bearing liabilities: | |||||||||||||||||||||||||||||||||||
| Interest-bearing deposit accounts | $ | 65,624 | $ | 1,008 | 1.54 | % | $ | 60,953 | $ | 566 | 0.93 | % | |||||||||||||||||||||||
| Borrowings of consolidated securitization entities | 6,468 | 196 | 3.03 | % | 7,248 | 169 | 2.33 | % | |||||||||||||||||||||||||||
| Senior unsecured notes | 7,315 | 317 | 4.33 | % | 7,173 | 297 | 4.14 | % | |||||||||||||||||||||||||||
| Total interest-bearing liabilities | 79,407 | 1,521 | 1.92 | % | 75,374 | 1,032 | 1.37 | % | |||||||||||||||||||||||||||
| Non-interest-bearing liabilities | |||||||||||||||||||||||||||||||||||
| Non-interest-bearing deposit accounts | 382 | 349 | |||||||||||||||||||||||||||||||||
| Other liabilities | 4,991 | 4,668 | |||||||||||||||||||||||||||||||||
| Total non-interest-bearing liabilities | 5,373 | 5,017 | |||||||||||||||||||||||||||||||||
| Total liabilities | 84,780 | 80,391 | |||||||||||||||||||||||||||||||||
| Equity | |||||||||||||||||||||||||||||||||||
| Total equity | 13,372 | 13,723 | |||||||||||||||||||||||||||||||||
| Total liabilities and equity | $ | 98,152 | $ | 94,114 | |||||||||||||||||||||||||||||||
| Net interest income | $ | 15,625 | $ | 14,239 | |||||||||||||||||||||||||||||||
Interest rate spread(1) | 15.23 | % | 14.44 | % | |||||||||||||||||||||||||||||||
Net interest margin(2) | 15.63 | % | 14.74 | % | |||||||||||||||||||||||||||||||
| (1) Interest rate spread represents the difference between the yield on total interest-earning assets and the rate on total interest-bearing liabilities. | |||||||||||||||||||||||||||||||||||
| (2) Net interest margin represents net interest income divided by average interest-earning assets. | |||||||||||||||||||||||||||||||||||
6
| SYNCHRONY FINANCIAL | ||||||||||||||||||||||||||||||||||||||
| BALANCE SHEET STATISTICS | ||||||||||||||||||||||||||||||||||||||
| (unaudited, $ in millions, except per share statistics) | ||||||||||||||||||||||||||||||||||||||
| Quarter Ended | ||||||||||||||||||||||||||||||||||||||
| Dec 31, 2022 | Sep 30, 2022 | June 30, 2022 | Mar 31, 2022 | Dec 31, 2021 | Dec 31, 2022 vs. Dec 31, 2021 | |||||||||||||||||||||||||||||||||
| BALANCE SHEET STATISTICS | ||||||||||||||||||||||||||||||||||||||
| Total common equity | $ | 12,139 | $ | 12,278 | $ | 12,659 | $ | 12,684 | $ | 12,921 | $ | (782) | (6.1) | % | ||||||||||||||||||||||||
| Total common equity as a % of total assets | 11.61 | % | 12.18 | % | 13.30 | % | 13.31 | % | 13.49 | % | (1.88) | % | ||||||||||||||||||||||||||
| Tangible assets | $ | 102,172 | $ | 98,628 | $ | 92,977 | $ | 93,013 | $ | 93,475 | $ | 8,697 | 9.3 | % | ||||||||||||||||||||||||
Tangible common equity(1) | $ | 9,747 | $ | 10,140 | $ | 10,436 | $ | 10,430 | $ | 10,648 | $ | (901) | (8.5) | % | ||||||||||||||||||||||||
Tangible common equity as a % of tangible assets(1) | 9.54 | % | 10.28 | % | 11.22 | % | 11.21 | % | 11.39 | % | (1.85) | % | ||||||||||||||||||||||||||
Tangible common equity per share(1) | $ | 22.24 | $ | 22.10 | $ | 21.39 | $ | 20.60 | $ | 20.21 | $ | 2.03 | 10.0 | % | ||||||||||||||||||||||||
REGULATORY CAPITAL RATIOS(2)(3) | ||||||||||||||||||||||||||||||||||||||
| Basel III - CECL Transition | ||||||||||||||||||||||||||||||||||||||
Total risk-based capital ratio(4) | 15.0 | % | 16.5 | % | 17.4 | % | 17.2 | % | 17.8 | % | ||||||||||||||||||||||||||||
Tier 1 risk-based capital ratio(5) | 13.6 | % | 15.2 | % | 16.1 | % | 15.9 | % | 16.5 | % | ||||||||||||||||||||||||||||
Tier 1 leverage ratio(6) | 12.3 | % | 13.2 | % | 13.8 | % | 13.9 | % | 14.7 | % | ||||||||||||||||||||||||||||
| Common equity Tier 1 capital ratio | 12.8 | % | 14.3 | % | 15.2 | % | 15.0 | % | 15.6 | % | ||||||||||||||||||||||||||||
| (1) Tangible common equity ("TCE") is a non-GAAP measure. We believe TCE is a more meaningful measure of the net asset value of the Company to investors. For corresponding reconciliation of TCE to a GAAP financial measure, see Reconciliation of Non-GAAP Measures and Calculations of Regulatory Measures. | ||||||||||||||||||||||||||||||||||||||
| (2) Regulatory capital ratios at Deceember 31, 2022 are preliminary and therefore subject to change. | ||||||||||||||||||||||||||||||||||||||
| (3) Capital ratios starting March 31, 2020 reflect election to delay for two years an estimate of CECL’s effect on regulatory capital in accordance with the interim final rule issued by U.S. banking agencies in March 2020. Beginning in the first quarter of 2022, the effects are now being phased-in over a three-year transitional period through 2024. | ||||||||||||||||||||||||||||||||||||||
| (4) Total risk-based capital ratio is the ratio of total risk-based capital divided by risk-weighted assets. | ||||||||||||||||||||||||||||||||||||||
| (5) Tier 1 risk-based capital ratio is the ratio of Tier 1 capital divided by risk-weighted assets. | ||||||||||||||||||||||||||||||||||||||
| (6) Tier 1 leverage ratio is the ratio of Tier 1 capital divided by total average assets, after certain adjustments. | ||||||||||||||||||||||||||||||||||||||
7
| SYNCHRONY FINANCIAL | |||||||||||||||||||||||||||||||||||||||||||||||||||||||||||
| PLATFORM RESULTS | |||||||||||||||||||||||||||||||||||||||||||||||||||||||||||
| (unaudited, $ in millions) | |||||||||||||||||||||||||||||||||||||||||||||||||||||||||||
| Quarter Ended | Twelve Months Ended | ||||||||||||||||||||||||||||||||||||||||||||||||||||||||||
| Dec 31, 2022 | Sep 30, 2022 | June 30, 2022 | Mar 31, 2022 | Dec 31, 2021 | 4Q'22 vs. 4Q'21 | Dec 31, 2022 | Dec 31, 2021 | YTD'22vs. YTD'21 | |||||||||||||||||||||||||||||||||||||||||||||||||||
HOME & AUTO(6) | |||||||||||||||||||||||||||||||||||||||||||||||||||||||||||
Purchase volume(1) | $ | 11,860 | $ | 12,273 | $ | 12,895 | $ | 10,260 | $ | 10,919 | $ | 941 | 8.6 | % | $ | 47,288 | $ | 42,848 | $ | 4,440 | 10.4 | % | |||||||||||||||||||||||||||||||||||||
| Period-end loan receivables | $ | 29,978 | $ | 29,017 | $ | 27,989 | $ | 26,532 | $ | 26,781 | $ | 3,197 | 11.9 | % | $ | 29,978 | $ | 26,781 | $ | 3,197 | 11.9 | % | |||||||||||||||||||||||||||||||||||||
| Average loan receivables, including held for sale | $ | 29,402 | $ | 28,387 | $ | 27,106 | $ | 26,406 | $ | 26,455 | $ | 2,947 | 11.1 | % | $ | 27,835 | $ | 25,663 | $ | 2,172 | 8.5 | % | |||||||||||||||||||||||||||||||||||||
Average active accounts (in thousands)(3) | 18,539 | 18,350 | 17,942 | 17,473 | 17,655 | 884 | 5.0 | % | 18,080 | 17,414 | 666 | 3.8 | % | ||||||||||||||||||||||||||||||||||||||||||||||
| Interest and fees on loans | $ | 1,264 | $ | 1,210 | $ | 1,108 | $ | 1,088 | $ | 1,126 | $ | 138 | 12.3 | % | $ | 4,670 | $ | 4,247 | $ | 423 | 10.0 | % | |||||||||||||||||||||||||||||||||||||
| Other income | $ | 23 | $ | 20 | $ | 23 | $ | 21 | $ | 18 | $ | 5 | 27.8 | % | $ | 87 | $ | 69 | $ | 18 | 26.1 | % | |||||||||||||||||||||||||||||||||||||
| DIGITAL | |||||||||||||||||||||||||||||||||||||||||||||||||||||||||||
Purchase volume(1) | $ | 14,794 | $ | 12,941 | $ | 12,463 | $ | 11,196 | $ | 13,451 | $ | 1,343 | 10.0 | % | $ | 51,394 | $ | 44,701 | $ | 6,693 | 15.0 | % | |||||||||||||||||||||||||||||||||||||
| Period-end loan receivables | $ | 25,522 | $ | 22,925 | $ | 21,842 | $ | 21,075 | $ | 21,751 | $ | 3,771 | 17.3 | % | $ | 25,522 | $ | 21,751 | $ | 3,771 | 17.3 | % | |||||||||||||||||||||||||||||||||||||
| Average loan receivables, including held for sale | $ | 23,931 | $ | 22,361 | $ | 21,255 | $ | 21,160 | $ | 20,388 | $ | 3,543 | 17.4 | % | $ | 22,185 | $ | 19,475 | $ | 2,710 | 13.9 | % | |||||||||||||||||||||||||||||||||||||
Average active accounts (in thousands)(3) | 20,073 | 19,418 | 19,069 | 19,000 | 18,375 | 1,698 | 9.2 | % | 19,421 | 17,685 | 1,736 | 9.8 | % | ||||||||||||||||||||||||||||||||||||||||||||||
| Interest and fees on loans | $ | 1,322 | $ | 1,197 | $ | 1,058 | $ | 1,022 | $ | 1,025 | $ | 297 | 29.0 | % | $ | 4,599 | $ | 3,792 | $ | 807 | 21.3 | % | |||||||||||||||||||||||||||||||||||||
| Other income | $ | (14) | $ | (22) | $ | (13) | $ | (12) | $ | (28) | $ | 14 | (50.0) | % | $ | (61) | $ | (87) | $ | 26 | (29.9) | % | |||||||||||||||||||||||||||||||||||||
| DIVERSIFIED & VALUE | |||||||||||||||||||||||||||||||||||||||||||||||||||||||||||
Purchase volume(1) | $ | 16,266 | $ | 14,454 | $ | 14,388 | $ | 11,558 | $ | 14,154 | $ | 2,112 | 14.9 | % | $ | 56,666 | $ | 46,998 | $ | 9,668 | 20.6 | % | |||||||||||||||||||||||||||||||||||||
| Period-end loan receivables | $ | 18,617 | $ | 16,566 | $ | 16,076 | $ | 15,166 | $ | 16,075 | $ | 2,542 | 15.8 | % | $ | 18,617 | $ | 16,075 | $ | 2,542 | 15.8 | % | |||||||||||||||||||||||||||||||||||||
| Average loan receivables, including held for sale | $ | 17,274 | $ | 16,243 | $ | 15,498 | $ | 15,128 | $ | 14,999 | $ | 2,275 | 15.2 | % | $ | 16,042 | $ | 14,501 | $ | 1,541 | 10.6 | % | |||||||||||||||||||||||||||||||||||||
Average active accounts (in thousands)(3) | 20,386 | 19,411 | 19,026 | 19,201 | 18,829 | 1,557 | 8.3 | % | 19,594 | 17,953 | 1,641 | 9.1 | % | ||||||||||||||||||||||||||||||||||||||||||||||
| Interest and fees on loans | $ | 1,023 | $ | 935 | $ | 826 | $ | 826 | $ | 817 | $ | 206 | 25.2 | % | $ | 3,610 | $ | 3,115 | $ | 495 | 15.9 | % | |||||||||||||||||||||||||||||||||||||
| Other income | $ | (42) | $ | (19) | $ | (35) | $ | (9) | $ | (23) | $ | (19) | 82.6 | % | $ | (105) | $ | (28) | $ | (77) | 275.0 | % | |||||||||||||||||||||||||||||||||||||
| HEALTH & WELLNESS | |||||||||||||||||||||||||||||||||||||||||||||||||||||||||||
Purchase volume(1) | $ | 3,505 | $ | 3,514 | $ | 3,443 | $ | 3,107 | $ | 3,055 | $ | 450 | 14.7 | % | $ | 13,569 | $ | 11,715 | $ | 1,854 | 15.8 | % | |||||||||||||||||||||||||||||||||||||
| Period-end loan receivables | $ | 12,179 | $ | 11,590 | $ | 10,932 | $ | 10,407 | $ | 10,244 | $ | 1,935 | 18.9 | % | $ | 12,179 | $ | 10,244 | $ | 1,935 | 18.9 | % | |||||||||||||||||||||||||||||||||||||
| Average loan receivables, including held for sale | $ | 11,846 | $ | 11,187 | $ | 10,596 | $ | 10,251 | $ | 10,057 | $ | 1,789 | 17.8 | % | $ | 10,975 | $ | 9,623 | $ | 1,352 | 14.0 | % | |||||||||||||||||||||||||||||||||||||
Average active accounts (in thousands)(3) | 6,673 | 6,411 | 6,177 | 6,027 | 5,922 | 751 | 12.7 | % | 6,326 | 5,739 | 587 | 10.2 | % | ||||||||||||||||||||||||||||||||||||||||||||||
| Interest and fees on loans | $ | 744 | $ | 706 | $ | 644 | $ | 616 | $ | 603 | $ | 141 | 23.4 | % | $ | 2,710 | $ | 2,271 | $ | 439 | 19.3 | % | |||||||||||||||||||||||||||||||||||||
| Other income | $ | 60 | $ | 55 | $ | 49 | $ | 53 | $ | 42 | $ | 18 | 42.9 | % | $ | 217 | $ | 159 | $ | 58 | 36.5 | % | |||||||||||||||||||||||||||||||||||||
| LIFESTYLE | |||||||||||||||||||||||||||||||||||||||||||||||||||||||||||
Purchase volume(1) | $ | 1,498 | $ | 1,374 | $ | 1,431 | $ | 1,195 | $ | 1,462 | $ | 36 | 2.5 | % | $ | 5,498 | $ | 5,319 | $ | 179 | 3.4 | % | |||||||||||||||||||||||||||||||||||||
| Period-end loan receivables | $ | 5,970 | $ | 5,686 | $ | 5,558 | $ | 5,381 | $ | 5,479 | $ | 491 | 9.0 | % | $ | 5,970 | $ | 5,479 | $ | 491 | 9.0 | % | |||||||||||||||||||||||||||||||||||||
| Average loan receivables, including held for sale | $ | 5,772 | $ | 5,610 | $ | 5,443 | $ | 5,379 | $ | 5,297 | $ | 475 | 9.0 | % | $ | 5,552 | $ | 5,135 | $ | 417 | 8.1 | % | |||||||||||||||||||||||||||||||||||||
Average active accounts (in thousands)(3) | 2,585 | 2,524 | 2,510 | 2,582 | 2,548 | 37 | 1.5 | % | 2,559 | 2,515 | 44 | 1.7 | % | ||||||||||||||||||||||||||||||||||||||||||||||
| Interest and fees on loans | $ | 221 | $ | 208 | $ | 194 | $ | 191 | $ | 194 | $ | 27 | 13.9 | % | $ | 814 | $ | 744 | $ | 70 | 9.4 | % | |||||||||||||||||||||||||||||||||||||
| Other income | $ | 7 | $ | 8 | $ | 7 | $ | 6 | $ | 6 | $ | 1 | 16.7 | % | $ | 28 | $ | 23 | $ | 5 | 21.7 | % | |||||||||||||||||||||||||||||||||||||
CORP, OTHER(4)(6) | |||||||||||||||||||||||||||||||||||||||||||||||||||||||||||
Purchase volume(1)(2) | $ | — | $ | 1 | $ | 2,597 | $ | 3,174 | $ | 4,031 | $ | (4,031) | (100.0) | % | $ | 5,772 | $ | 14,273 | $ | (8,501) | (59.6) | % | |||||||||||||||||||||||||||||||||||||
Period-end loan receivables(5) | $ | 204 | $ | 228 | $ | 277 | $ | 355 | $ | 410 | $ | (206) | (50.2) | % | $ | 204 | $ | 410 | $ | (206) | (50.2) | % | |||||||||||||||||||||||||||||||||||||
| Average loan receivables, including held for sale | $ | 211 | $ | 250 | $ | 3,514 | $ | 4,423 | $ | 4,588 | $ | (4,377) | (95.4) | % | $ | 2,083 | $ | 4,531 | $ | (2,448) | (54.0) | % | |||||||||||||||||||||||||||||||||||||
Average active accounts (in thousands)(2)(3) | 117 | 152 | 3,947 | 5,844 | 6,068 | (5,951) | (98.1) | % | 2,647 | 6,028 | (3,381) | (56.1) | % | ||||||||||||||||||||||||||||||||||||||||||||||
| Interest and fees on loans | $ | 2 | $ | 2 | $ | 209 | $ | 265 | $ | 277 | $ | (275) | (99.3) | % | $ | 478 | $ | 1,059 | $ | (581) | (54.9) | % | |||||||||||||||||||||||||||||||||||||
| Other income | $ | (4) | $ | 2 | $ | 167 | $ | 49 | $ | 152 | $ | (156) | (102.6) | % | $ | 214 | $ | 345 | $ | (131) | (38.0) | % | |||||||||||||||||||||||||||||||||||||
| TOTAL SYF | |||||||||||||||||||||||||||||||||||||||||||||||||||||||||||
Purchase volume(1)(2) | $ | 47,923 | $ | 44,557 | $ | 47,217 | $ | 40,490 | $ | 47,072 | $ | 851 | 1.8 | % | $ | 180,187 | $ | 165,854 | $ | 14,333 | 8.6 | % | |||||||||||||||||||||||||||||||||||||
Period-end loan receivables(5) | $ | 92,470 | $ | 86,012 | $ | 82,674 | $ | 78,916 | $ | 80,740 | $ | 11,730 | 14.5 | % | $ | 92,470 | $ | 80,740 | $ | 11,730 | 14.5 | % | |||||||||||||||||||||||||||||||||||||
| Average loan receivables, including held for sale | $ | 88,436 | $ | 84,038 | $ | 83,412 | $ | 82,747 | $ | 81,784 | $ | 6,652 | 8.1 | % | $ | 84,672 | $ | 78,928 | $ | 5,744 | 7.3 | % | |||||||||||||||||||||||||||||||||||||
Average active accounts (in thousands)(2)(3) | 68,373 | 66,266 | 68,671 | 70,127 | 69,397 | (1,024) | (1.5) | % | 68,627 | 67,334 | 1,293 | 1.9 | % | ||||||||||||||||||||||||||||||||||||||||||||||
| Interest and fees on loans | $ | 4,576 | $ | 4,258 | $ | 4,039 | $ | 4,008 | $ | 4,042 | $ | 534 | 13.2 | % | $ | 16,881 | $ | 15,228 | $ | 1,653 | 10.9 | % | |||||||||||||||||||||||||||||||||||||
| Other income | $ | 30 | $ | 44 | $ | 198 | $ | 108 | $ | 167 | $ | (137) | (82.0) | % | $ | 380 | $ | 481 | $ | (101) | (21.0) | % | |||||||||||||||||||||||||||||||||||||
| (1) Purchase volume, or net credit sales, represents the aggregate amount of charges incurred on credit cards or other credit product accounts less returns during the period. | |||||||||||||||||||||||||||||||||||||||||||||||||||||||||||
| (2) Includes activity and balances associated with loan receivables held for sale. | |||||||||||||||||||||||||||||||||||||||||||||||||||||||||||
| (3) Active accounts represent credit card or installment loan accounts on which there has been a purchase, payment or outstanding balance in the current month. | |||||||||||||||||||||||||||||||||||||||||||||||||||||||||||
| (4) Includes activity and balances associated with the Gap Inc. and BP portfolios which were both sold in 2Q 2022. | |||||||||||||||||||||||||||||||||||||||||||||||||||||||||||
| (5) Reflects the reclassification of $0.5 billion to loan receivables held for sale in 4Q 2021. | |||||||||||||||||||||||||||||||||||||||||||||||||||||||||||
| (6) In December 2021, we entered into an agreement to sell $0.5 billion of loan receivables associated with our program agreement with BP. In connection with this agreement, revenue activities for the BP portfolio are no longer managed within our Home & Auto sales platform. All metrics for the BP portfolio previously reported within our Home & Auto sales platform, are now reported within our Corp, Other information. We have recast all prior-period reported metrics for our Home & Auto sales platform and Corp, Other to conform to the current-period presentation. | |||||||||||||||||||||||||||||||||||||||||||||||||||||||||||
8
| SYNCHRONY FINANCIAL | |||||||||||||||||||||||||||||||||||
RECONCILIATION OF NON-GAAP MEASURES AND CALCULATIONS OF REGULATORY MEASURES(1) | |||||||||||||||||||||||||||||||||||
| (unaudited, $ in millions, except per share statistics) | |||||||||||||||||||||||||||||||||||
| Quarter Ended | |||||||||||||||||||||||||||||||||||
| Dec 31, 2022 | Sep 30, 2022 | Jun 30, 2022 | Mar 31, 2022 | Dec 31, 2021 | |||||||||||||||||||||||||||||||
COMMON EQUITY AND REGULATORY CAPITAL MEASURES(2) | |||||||||||||||||||||||||||||||||||
| GAAP Total equity | $ | 12,873 | $ | 13,012 | $ | 13,393 | $ | 13,418 | $ | 13,655 | |||||||||||||||||||||||||
| Less: Preferred stock | (734) | (734) | (734) | (734) | (734) | ||||||||||||||||||||||||||||||
| Less: Goodwill | (1,105) | (1,105) | (1,105) | (1,105) | (1,105) | ||||||||||||||||||||||||||||||
| Less: Intangible assets, net | (1,287) | (1,033) | (1,118) | (1,149) | (1,168) | ||||||||||||||||||||||||||||||
| Tangible common equity | $ | 9,747 | $ | 10,140 | $ | 10,436 | $ | 10,430 | $ | 10,648 | |||||||||||||||||||||||||
| Add: CECL transition amount | 1,719 | 1,719 | 1,719 | 1,719 | 2,292 | ||||||||||||||||||||||||||||||
| Adjustments for certain deferred tax liabilities and certain items in accumulated comprehensive income (loss) | 293 | 419 | 391 | 371 | 329 | ||||||||||||||||||||||||||||||
| Common equity Tier 1 | $ | 11,759 | $ | 12,278 | $ | 12,546 | $ | 12,520 | $ | 13,269 | |||||||||||||||||||||||||
| Preferred stock | 734 | 734 | 734 | 734 | 734 | ||||||||||||||||||||||||||||||
| Tier 1 capital | $ | 12,493 | $ | 13,012 | $ | 13,280 | $ | 13,254 | $ | 14,003 | |||||||||||||||||||||||||
| Add: Allowance for credit losses includible in risk-based capital | 1,220 | 1,142 | 1,099 | 1,106 | 1,119 | ||||||||||||||||||||||||||||||
| Total Risk-based capital | $ | 13,713 | $ | 14,154 | $ | 14,379 | $ | 14,360 | $ | 15,122 | |||||||||||||||||||||||||
ASSET MEASURES(2) | |||||||||||||||||||||||||||||||||||
| Total average assets | $ | 102,206 | $ | 98,694 | $ | 96,073 | $ | 95,556 | $ | 94,707 | |||||||||||||||||||||||||
| Adjustments for: | |||||||||||||||||||||||||||||||||||
| Add: CECL transition amount | 1,719 | 1,719 | 1,719 | 1,719 | 2,292 | ||||||||||||||||||||||||||||||
| Less: Disallowed goodwill and other disallowed intangible assets (net of related deferred tax liabilities) and other | (2,046) | (1,776) | (1,878) | (1,964) | (1,999) | ||||||||||||||||||||||||||||||
| Total assets for leverage purposes | $ | 101,879 | $ | 98,637 | $ | 95,914 | $ | 95,311 | $ | 95,000 | |||||||||||||||||||||||||
| Risk-weighted assets | $ | 91,596 | $ | 85,664 | $ | 82,499 | $ | 83,251 | $ | 84,950 | |||||||||||||||||||||||||
| CECL FULLY PHASED-IN CAPITAL MEASURES | |||||||||||||||||||||||||||||||||||
| Tier 1 capital | $ | 12,493 | $ | 13,012 | $ | 13,280 | $ | 13,254 | $ | 14,003 | |||||||||||||||||||||||||
| Less: CECL transition adjustment | (1,719) | (1,719) | (1,719) | (1,719) | (2,292) | ||||||||||||||||||||||||||||||
| Tier 1 capital (CECL fully phased-in) | $ | 10,774 | $ | 11,293 | $ | 11,561 | $ | 11,535 | $ | 11,711 | |||||||||||||||||||||||||
| Add: Allowance for credit losses | 9,527 | 9,102 | 8,808 | 8,651 | 8,688 | ||||||||||||||||||||||||||||||
| Tier 1 capital (CECL fully phased-in) + Reserves for credit losses | $ | 20,301 | $ | 20,395 | $ | 20,369 | $ | 20,186 | $ | 20,399 | |||||||||||||||||||||||||
| Risk-weighted assets | $ | 91,596 | $ | 85,664 | $ | 82,499 | $ | 83,251 | $ | 84,950 | |||||||||||||||||||||||||
| Less: CECL transition adjustment | (870) | (870) | (870) | (870) | (1,353) | ||||||||||||||||||||||||||||||
| Risk-weighted assets (CECL fully phased-in) | $ | 90,726 | $ | 84,794 | $ | 81,629 | $ | 82,381 | $ | 83,597 | |||||||||||||||||||||||||
| TANGIBLE COMMON EQUITY PER SHARE | |||||||||||||||||||||||||||||||||||
| GAAP book value per share | $ | 27.70 | $ | 26.76 | $ | 25.95 | $ | 25.06 | $ | 24.53 | |||||||||||||||||||||||||
| Less: Goodwill | (2.52) | (2.41) | (2.27) | (2.18) | (2.10) | ||||||||||||||||||||||||||||||
| Less: Intangible assets, net | (2.94) | (2.25) | (2.29) | (2.28) | (2.22) | ||||||||||||||||||||||||||||||
| Tangible common equity per share | $ | 22.24 | $ | 22.10 | $ | 21.39 | $ | 20.60 | $ | 20.21 | |||||||||||||||||||||||||
| (1) Regulatory measures at December 31, 2022 are presented on an estimated basis. | |||||||||||||||||||||||||||||||||||
| (2) Capital ratios starting March 31, 2020 reflect election to delay for two years an estimate of CECL’s effect on regulatory capital in accordance with the interim final rule issued by U.S. banking agencies in March 2020. Beginning in the first quarter of 2022, the effects are now being phased-in over a three-year transitional period through 2024. | |||||||||||||||||||||||||||||||||||
9
| SYNCHRONY FINANCIAL | |||||||||||||||||||||||||||||||||||
| RECONCILIATION OF NON-GAAP MEASURES (Continued) | |||||||||||||||||||||||||||||||||||
| (unaudited, $ in millions) | |||||||||||||||||||||||||||||||||||
| Quarter Ended | |||||||||||||||||||||||||||||||||||
| Dec 31, 2022 | Dec 31, 2021 | ||||||||||||||||||||||||||||||||||
| CORE PURCHASE VOLUME | |||||||||||||||||||||||||||||||||||
| Purchase Volume | $ | 47,923 | $ | 47,072 | |||||||||||||||||||||||||||||||
| Less: Gap and BP Purchase volume | — | (4,032) | |||||||||||||||||||||||||||||||||
| Core Purchase volume | $ | 47,923 | $ | 43,040 | |||||||||||||||||||||||||||||||
| CORE LOAN RECEIVABLES | |||||||||||||||||||||||||||||||||||
| Loan receivables | $ | 92,470 | $ | 80,740 | |||||||||||||||||||||||||||||||
| Less: Gap and BP Loan receivables | (98) | (278) | |||||||||||||||||||||||||||||||||
| Core Loan receivables | $ | 92,372 | $ | 80,462 | |||||||||||||||||||||||||||||||
| CORE AVERAGE ACTIVE ACCOUNTS (in thousands) | |||||||||||||||||||||||||||||||||||
| Average active accounts | 68,373 | 69,397 | |||||||||||||||||||||||||||||||||
| Less: Gap and BP Average active accounts | (77) | (6,007) | |||||||||||||||||||||||||||||||||
| Core Average active accounts | 68,296 | 63,390 | |||||||||||||||||||||||||||||||||
| CORE NEW ACCOUNTS (in millions) | |||||||||||||||||||||||||||||||||||
| New accounts | 6.4 | 7.3 | |||||||||||||||||||||||||||||||||
| Less: Gap and BP New accounts | — | (0.7) | |||||||||||||||||||||||||||||||||
| Core New accounts | 6.4 | 6.6 | |||||||||||||||||||||||||||||||||
10
4Q'22 FINANCIAL RESULTS January 23, 2023 Exhibit 99.3
2 Cautionary Statement Regarding Forward-Looking Statements The following slides are part of a presentation by Synchrony Financial in connection with reporting quarterly financial results. No representation is made that the information in these slides is complete. For additional information, see the earnings release and financial supplement included as exhibits to our Current Report on Form 8-K filed today and available on our website (www.synchronyfinancial.com) and the SEC's website (www.sec.gov). All references to net earnings and net income are intended to have the same meaning. All comparisons are for the fourth quarter of 2022 compared to the fourth quarter of 2021, unless otherwise noted. This presentation contains certain forward-looking statements as defined in Section 27A of the Securities Act of 1933, as amended, and Section 21E of the Securities Exchange Act of 1934, as amended, which are subject to the "safe harbor" created by those sections. Forward-looking statements may be identified by words such as "expects," "intends," "anticipates," "plans," "believes," "seeks," "targets," "outlook," "estimates," "will," "should," "may" or words of similar meaning, but these words are not the exclusive means of identifying forward-looking statements. Forward- looking statements are based on management's current expectations and assumptions, and are subject to inherent uncertainties, risks and changes in circumstances that are difficult to predict. As a result, actual results could differ materially from those indicated in these forward-looking statements. Factors that could cause actual results to differ materially include global political, economic, business, competitive, market, regulatory and other factors and risks, such as: the impact of macroeconomic conditions and whether industry trends we have identified develop as anticipated, including the future impacts of the novel coronavirus disease (“COVID-19”) outbreak and measures taken in response thereto for which future developments are highly uncertain and difficult to predict; retaining existing partners and attracting new partners, concentration of our revenue in a small number of partners, and promotion and support of our products by our partners; cyber-attacks or other security breaches; disruptions in the operations of our and our outsourced partners' computer systems and data centers; the financial performance of our partners; the sufficiency of our allowance for credit losses and the accuracy of the assumptions or estimates used in preparing our financial statements, including those related to the CECL accounting guidance; higher borrowing costs and adverse financial market conditions impacting our funding and liquidity, and any reduction in our credit ratings; our ability to grow our deposits in the future; damage to our reputation; our ability to securitize our loan receivables, occurrence of an early amortization of our securitization facilities, loss of the right to service or sub-service our securitized loan receivables, and lower payment rates on our securitized loan receivables; changes in market interest rates and the impact of any margin compression; effectiveness of our risk management processes and procedures, reliance on models which may be inaccurate or misinterpreted, our ability to manage our credit risk; our ability to offset increases in our costs in retailer share arrangements; competition in the consumer finance industry; our concentration in the U.S. consumer credit market; our ability to successfully develop and commercialize new or enhanced products and services; our ability to realize the value of acquisitions and strategic investments; reductions in interchange fees; fraudulent activity; failure of third-parties to provide various services that are important to our operations; international risks and compliance and regulatory risks and costs associated with international operations; alleged infringement of intellectual property rights of others and our ability to protect our intellectual property; litigation and regulatory actions; our ability to attract, retain and motivate key officers and employees; tax legislation initiatives or challenges to our tax positions and/or interpretations, and state sales tax rules and regulations; regulation, supervision, examination and enforcement of our business by governmental authorities, the impact of the Dodd-Frank Wall Street Reform and Consumer Protection Act (the “Dodd-Frank Act”) and other legislative and regulatory developments and the impact of the Consumer Financial Protection Bureau’s (the “CFPB”) regulation of our business; impact of capital adequacy rules and liquidity requirements; restrictions that limit our ability to pay dividends and repurchase our common stock, and restrictions that limit the Bank’s ability to pay dividends to us; regulations relating to privacy, information security and data protection; use of third-party vendors and ongoing third-party business relationships; and failure to comply with anti-money laundering and anti-terrorism financing laws. For the reasons described above, we caution you against relying on any forward-looking statements, which should also be read in conjunction with the other cautionary statements that are included elsewhere in this presentation and in our public filings, including under the heading “Risk Factors Relating to Our Business” and “Risk Factors Relating to Regulation” in the Company's Annual Report on Form 10-K for the fiscal year ended December 31, 2021, as filed on February 10, 2022. You should not consider any list of such factors to be an exhaustive statement of all the risks, uncertainties, or potentially inaccurate assumptions that could cause our current expectations or beliefs to change. Further, any forward-looking statement speaks only as of the date on which it is made, and we undertake no obligation to update or revise any forward-looking statement to reflect events or circumstances after the date on which the statement is made or to reflect the occurrence of unanticipated events, except as otherwise may be required by law. Disclaimers
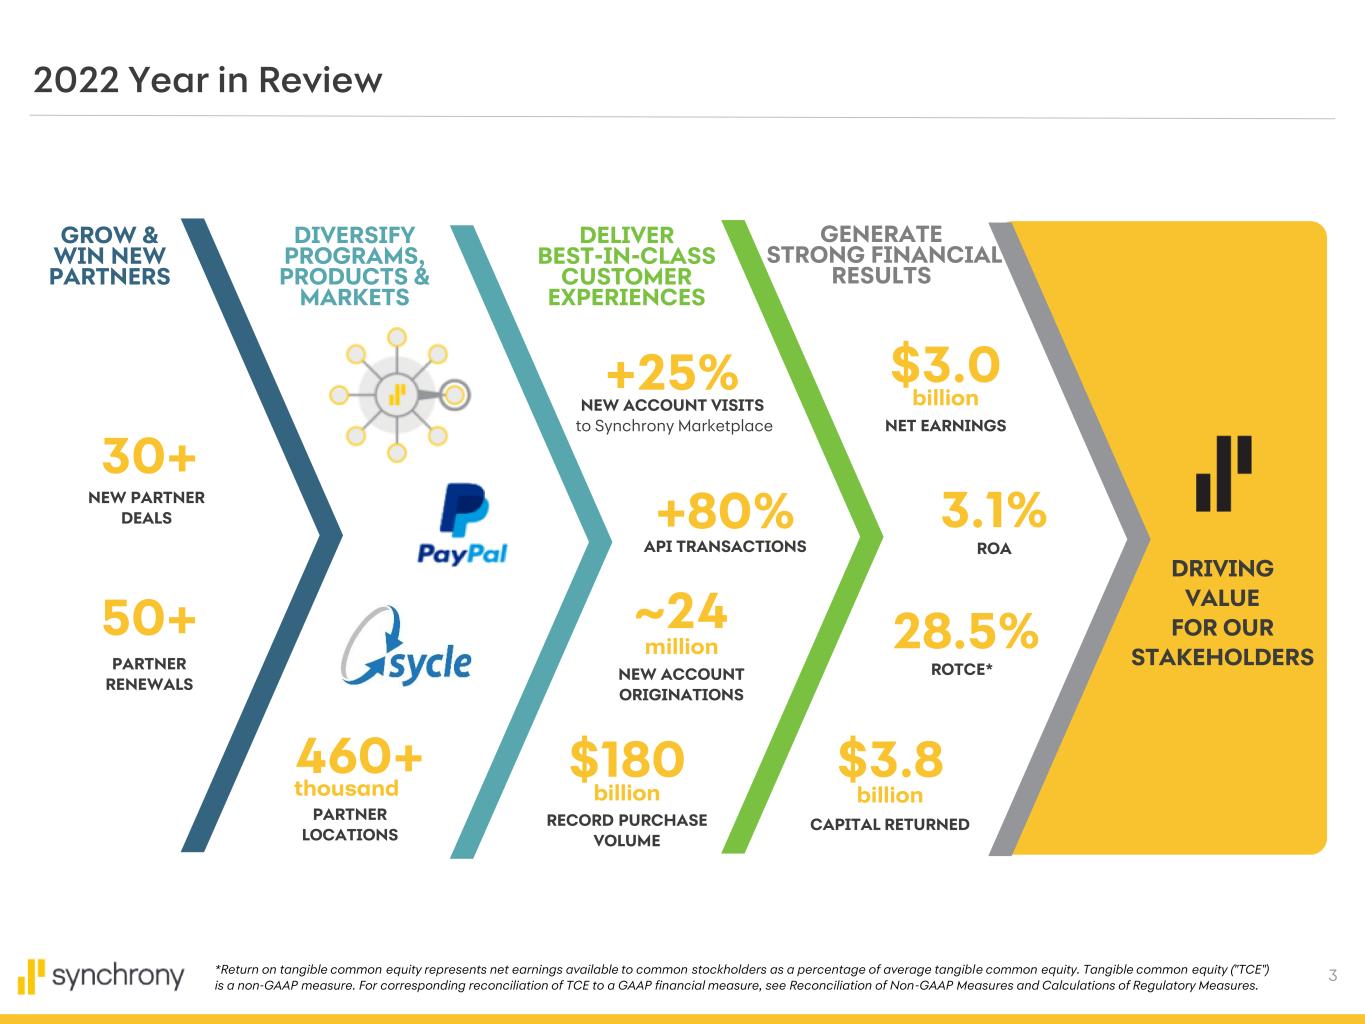
3 GENERATE STRONG FINANCIAL RESULTS DIVERSIFY PROGRAMS, PRODUCTS & MARKETS GROW & WIN NEW PARTNERS DELIVER BEST-IN-CLASS CUSTOMER EXPERIENCES 30+ NEW PARTNER DEALS ~24 NEW ACCOUNT ORIGINATIONS 50+ PARTNER RENEWALS ROTCE* ROA NET EARNINGS $180 RECORD PURCHASE VOLUME CAPITAL RETURNED DRIVING VALUE FOR OUR STAKEHOLDERS *Return on tangible common equity represents net earnings available to common stockholders as a percentage of average tangible common equity. Tangible common equity ("TCE") is a non-GAAP measure. For corresponding reconciliation of TCE to a GAAP financial measure, see Reconciliation of Non-GAAP Measures and Calculations of Regulatory Measures. 460+ million billion $3.0 billion 3.1% 28.5% $3.8 billion +25% NEW ACCOUNT VISITS to Synchrony Marketplace PARTNER LOCATIONS +80% API TRANSACTIONS thousand 2022 Year in Review
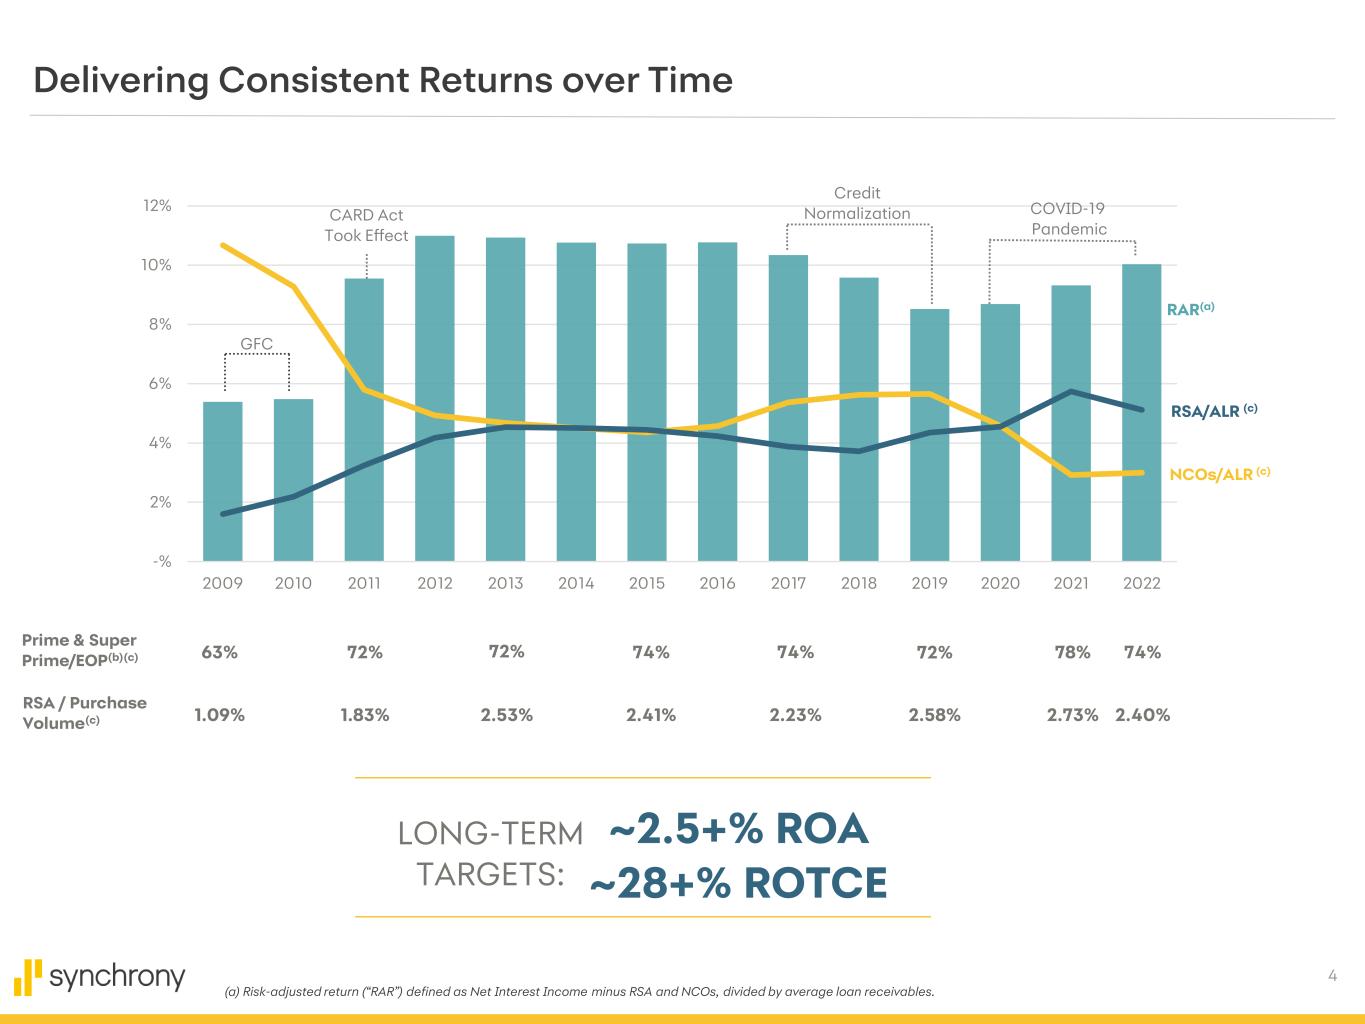
4 -% 2% 4% 6% 8% 10% 12% 2009 2010 2011 2012 2013 2014 2015 2016 2017 2018 2019 2020 2021 2022 ~2.5+% ROA ~28+% ROTCE (a) Risk-adjusted return (“RAR”) defined as Net Interest Income minus RSA and NCOs, divided by average loan receivables. RSA / Purchase Volume(c) Prime & Super Prime/EOP(b)(c) 74% 72% 78%72% 72% 74%63% 74% 1.09% 1.83% 2.53% 2.41% 2.23% 2.58% 2.73% 2.40% RAR(a) RSA/ALR (c) NCOs/ALR (c) LONG-TERM TARGETS: GFC CARD Act Took Effect Credit Normalization COVID-19 Pandemic Delivering Consistent Returns over Time
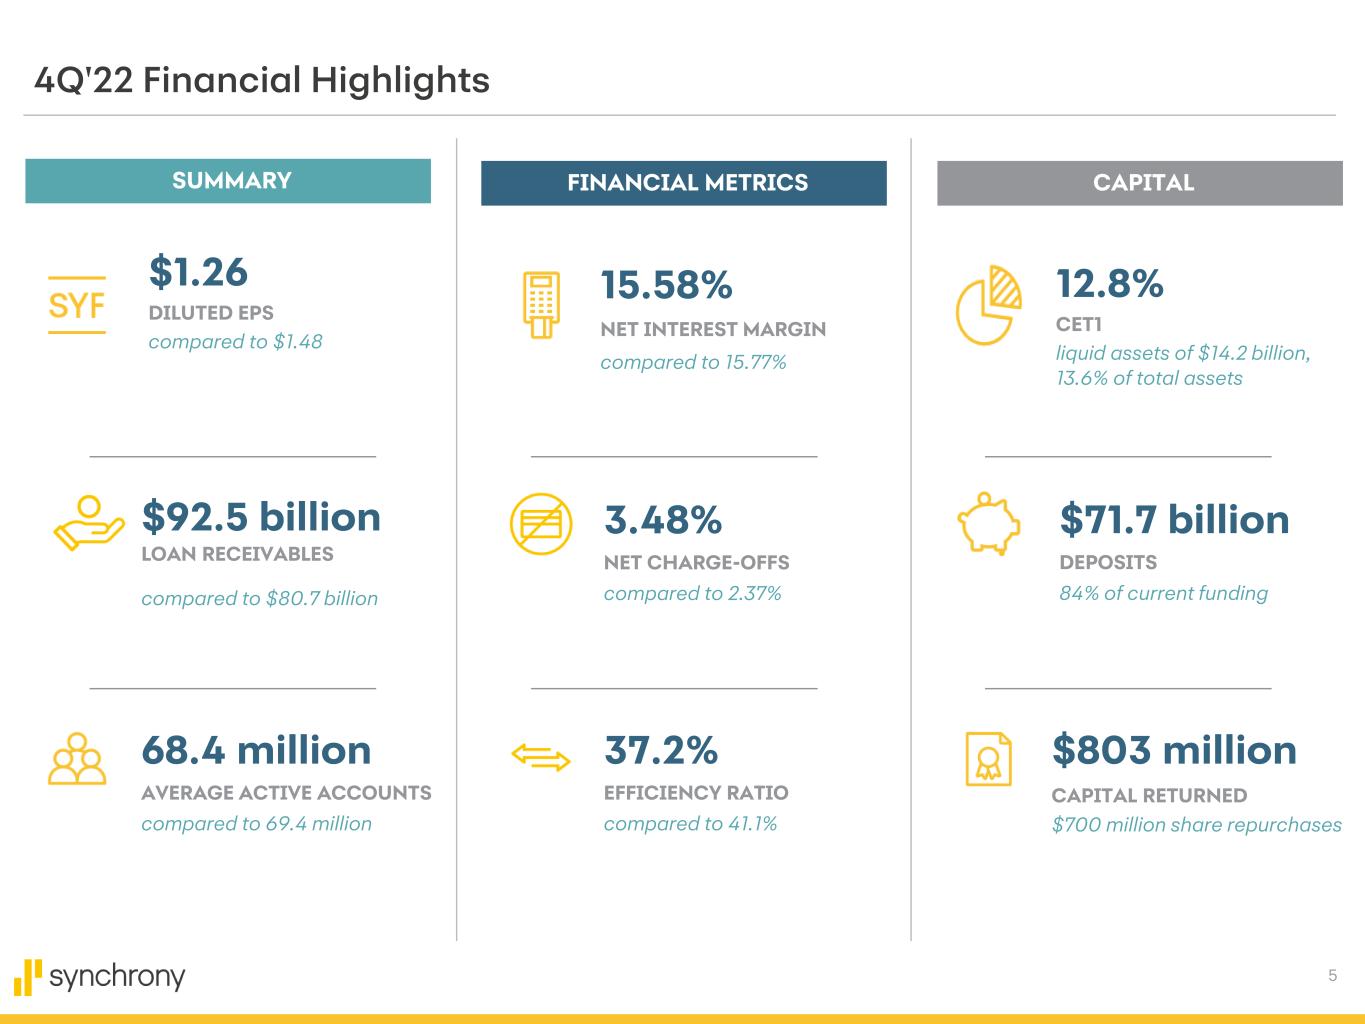
5 $1.26 DILUTED EPS compared to $1.48 15.58% NET INTEREST MARGIN compared to 15.77% 12.8% CET1 liquid assets of $14.2 billion, 13.6% of total assets SUMMARY FINANCIAL METRICS CAPITAL 4Q'22 Financial Highlights $92.5 billion LOAN RECEIVABLES compared to $80.7 billion $71.7 billion DEPOSITS 84% of current funding 3.48% NET CHARGE-OFFS compared to 2.37% 68.4 million AVERAGE ACTIVE ACCOUNTS compared to 69.4 million $803 million CAPITAL RETURNED $700 million share repurchases 37.2% EFFICIENCY RATIO compared to 41.1%
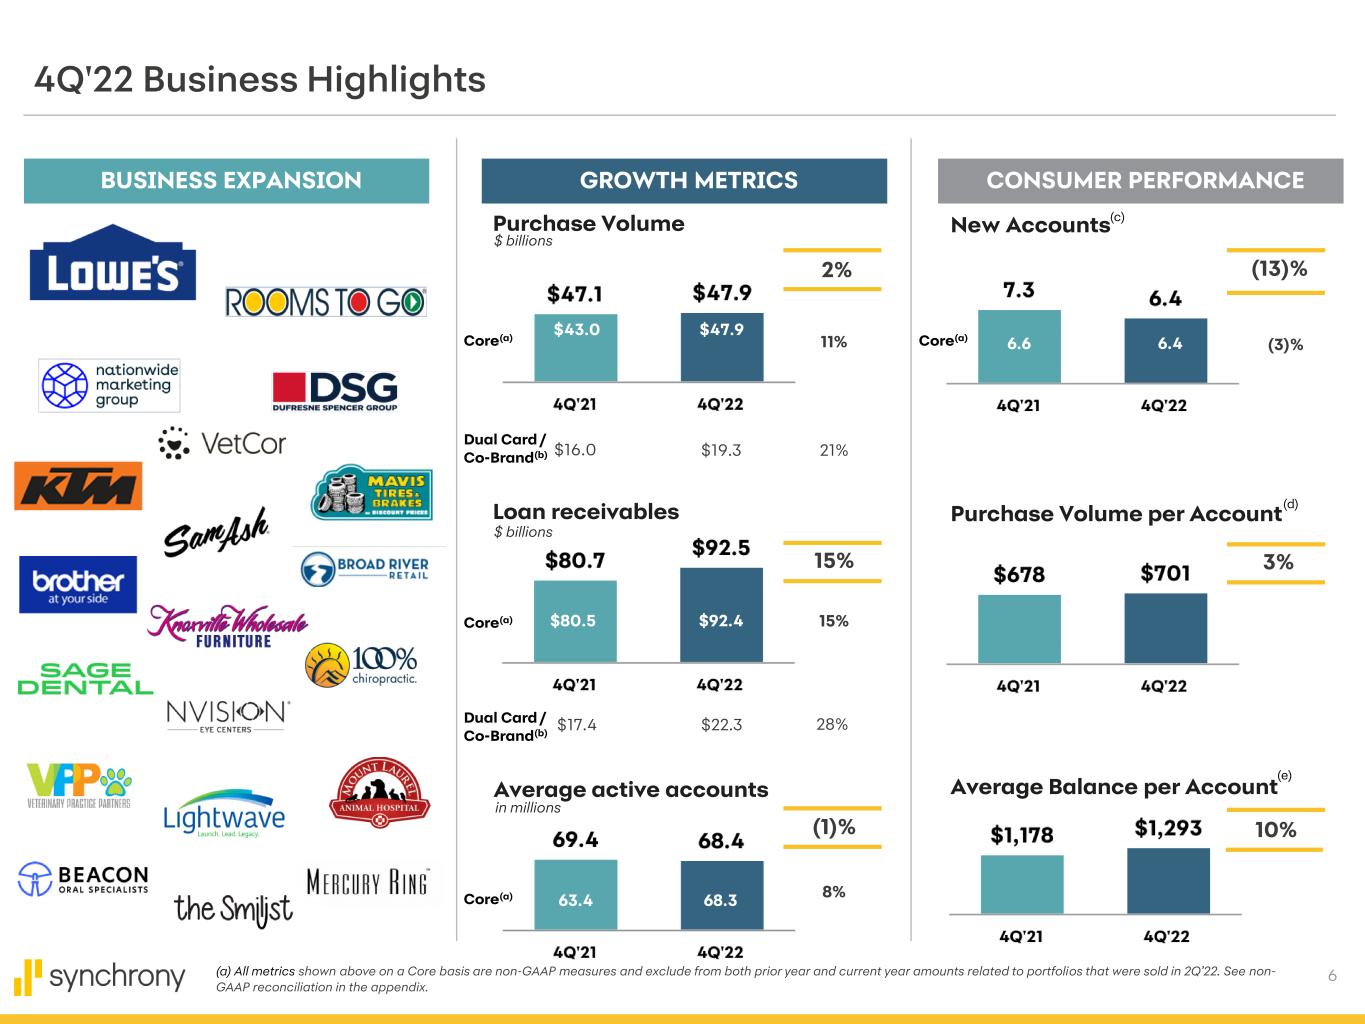
6 Dual Card / Co-Brand(b) BUSINESS EXPANSION CONSUMER PERFORMANCE (13)% 3% New Accounts Purchase Volume per Account Average Balance per Account (c) 10% (d) (e) GROWTH METRICS 2% 15% (1)% Purchase Volume Average active accounts 15% Loan receivables $80.5 $92.4Core(a) in millions $17.4 Dual Card / Co-Brand(b) $16.0 21%$19.3 $ billions $22.3 $ billions (a) All metrics shown above on a Core basis are non-GAAP measures and exclude from both prior year and current year amounts related to portfolios that were sold in 2Q’22. See non- GAAP reconciliation in the appendix. 4Q'22 Business Highlights 11% 8% Core(a) $43.0 $47.9 Core(a) 63.4 68.3 6.46.6Core(a) (3)% 28%
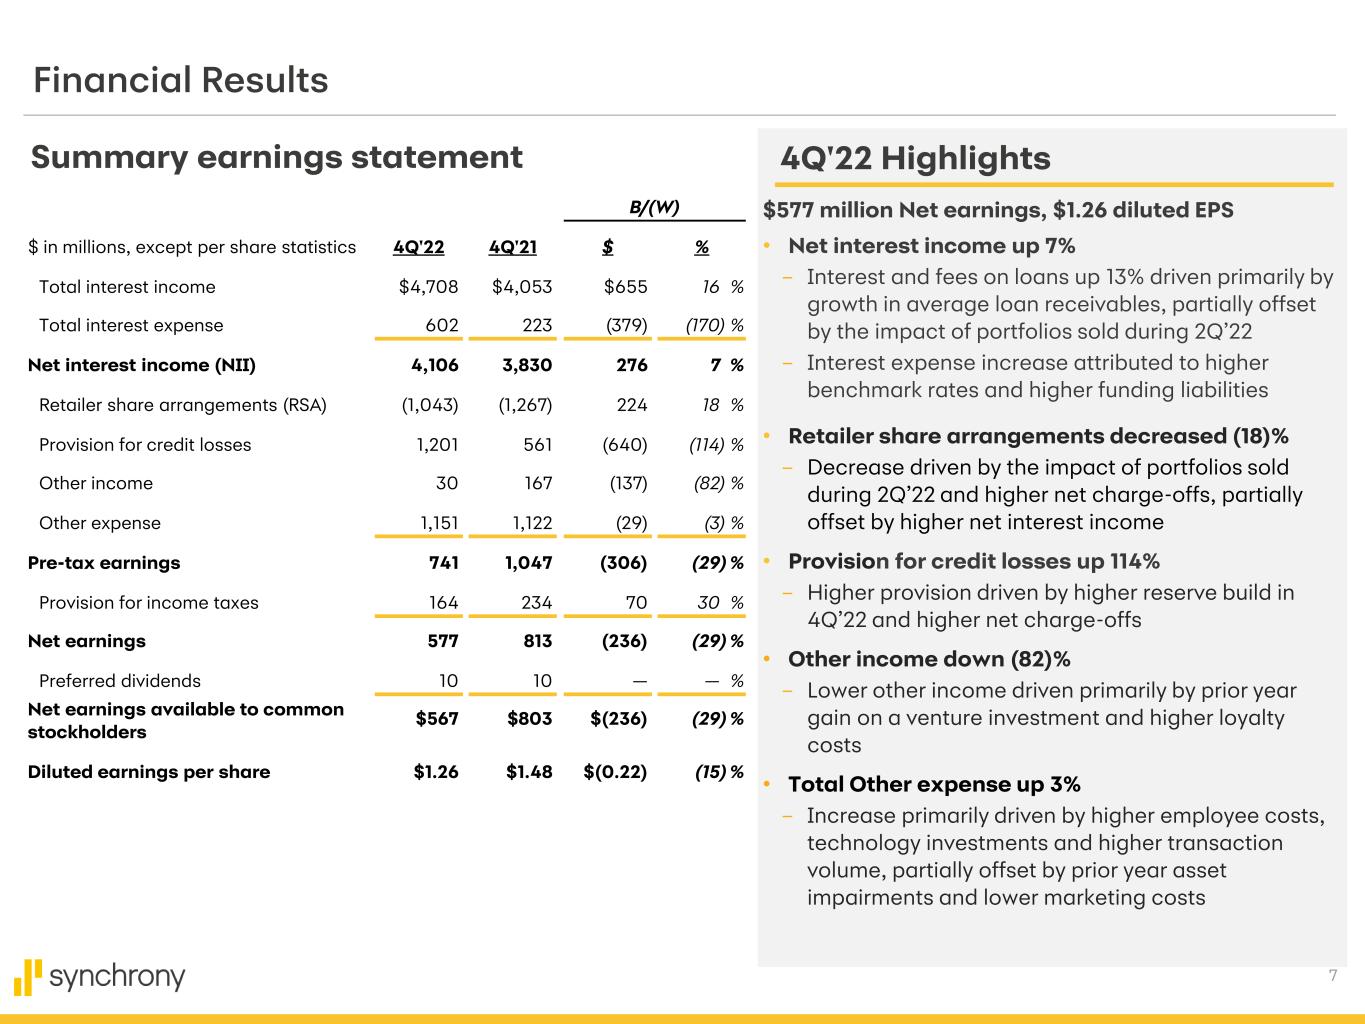
7 B/(W) $ in millions, except per share statistics 4Q'22 4Q'21 $ % Total interest income $4,708 $4,053 $655 16 % Total interest expense 602 223 (379) (170) % Net interest income (NII) 4,106 3,830 276 7 % Retailer share arrangements (RSA) (1,043) (1,267) 224 18 % Provision for credit losses 1,201 561 (640) (114) % Other income 30 167 (137) (82) % Other expense 1,151 1,122 (29) (3) % Pre-tax earnings 741 1,047 (306) (29) % Provision for income taxes 164 234 70 30 % Net earnings 577 813 (236) (29) % Preferred dividends 10 10 — — % Net earnings available to common stockholders $567 $803 $(236) (29) % Diluted earnings per share $1.26 $1.48 $(0.22) (15) % Summary earnings statement Financial Results 4Q'22 Highlights $577 million Net earnings, $1.26 diluted EPS • Net interest income up 7% – Interest and fees on loans up 13% driven primarily by growth in average loan receivables, partially offset by the impact of portfolios sold during 2Q’22 – Interest expense increase attributed to higher benchmark rates and higher funding liabilities • Retailer share arrangements decreased (18)% – Decrease driven by the impact of portfolios sold during 2Q’22 and higher net charge-offs, partially offset by higher net interest income • Provision for credit losses up 114% – Higher provision driven by higher reserve build in 4Q’22 and higher net charge-offs • Other income down (82)% – Lower other income driven primarily by prior year gain on a venture investment and higher loyalty costs • Total Other expense up 3% – Increase primarily driven by higher employee costs, technology investments and higher transaction volume, partially offset by prior year asset impairments and lower marketing costs
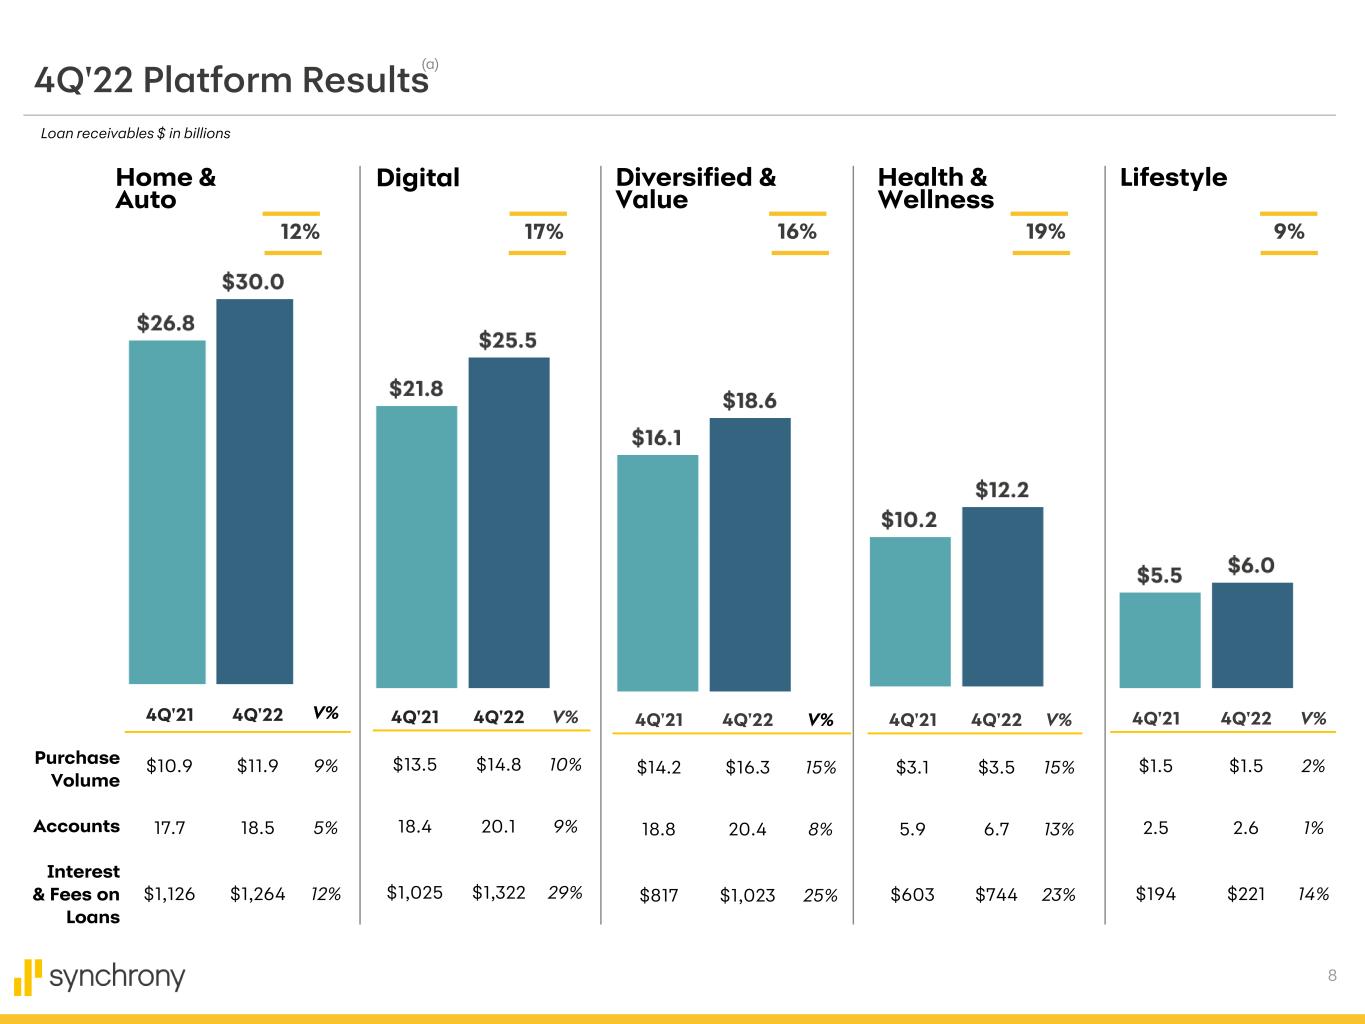
8 4Q'22 Platform Results Home & Auto Digital Diversified & Value Health & Wellness Lifestyle 12% 16% 19% 9%17% 4Q'21 4Q'22 V% $10.9 $11.9 9% 17.7 18.5 5% $1,126 $1,264 12% 4Q'21 4Q'22 V% $13.5 $14.8 10% 18.4 20.1 9% $1,025 $1,322 29% 4Q'21 4Q'22 V% $14.2 $16.3 15% 18.8 20.4 8% $817 $1,023 25% 4Q'21 4Q'22 V% $3.1 $3.5 15% 5.9 6.7 13% $603 $744 23% 4Q'21 4Q'22 V% $1.5 $1.5 2% 2.5 2.6 1% $194 $221 14% Loan receivables $ in billions (a) Purchase Volume Accounts Interest & Fees on Loans
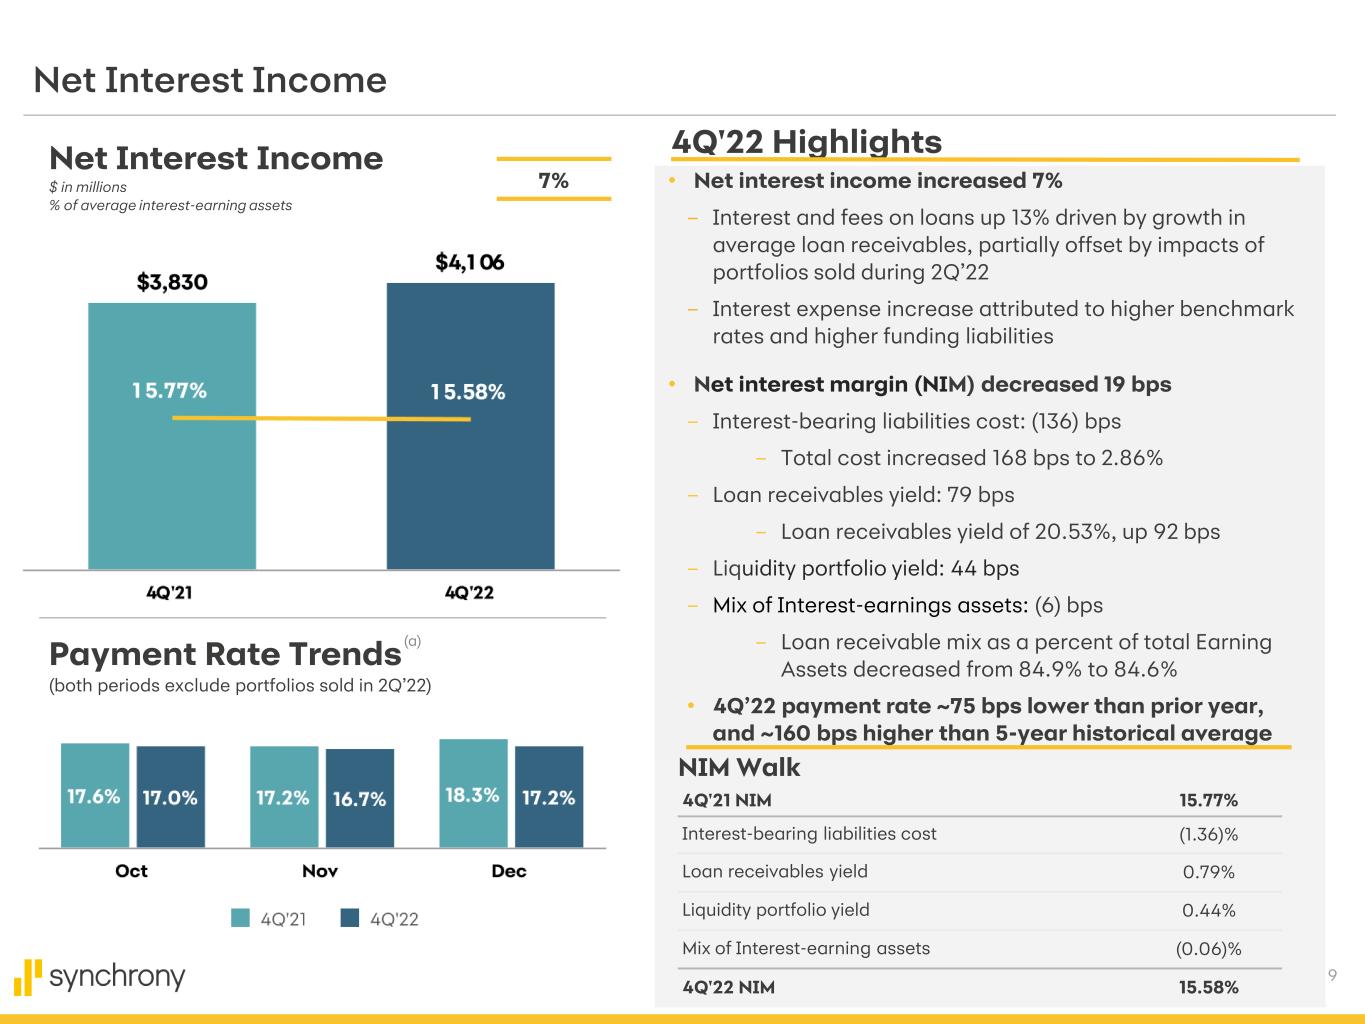
9 Net Interest Income Net Interest Income $ in millions % of average interest-earning assets 4Q'22 Highlights NIM Walk Payment Rate Trends (both periods exclude portfolios sold in 2Q’22) (a) 7% 4Q'21 NIM 15.77% Interest-bearing liabilities cost (1.36)% Loan receivables yield 0.79% Liquidity portfolio yield 0.44% Mix of Interest-earning assets (0.06)% 4Q'22 NIM 15.58% • Net interest income increased 7% – Interest and fees on loans up 13% driven by growth in average loan receivables, partially offset by impacts of portfolios sold during 2Q’22 – Interest expense increase attributed to higher benchmark rates and higher funding liabilities • Net interest margin (NIM) decreased 19 bps – Interest-bearing liabilities cost: (136) bps – Total cost increased 168 bps to 2.86% – Loan receivables yield: 79 bps – Loan receivables yield of 20.53%, up 92 bps – Liquidity portfolio yield: 44 bps – Mix of Interest-earnings assets: (6) bps – Loan receivable mix as a percent of total Earning Assets decreased from 84.9% to 84.6% • 4Q’22 payment rate ~75 bps lower than prior year, and ~160 bps higher than 5-year historical average
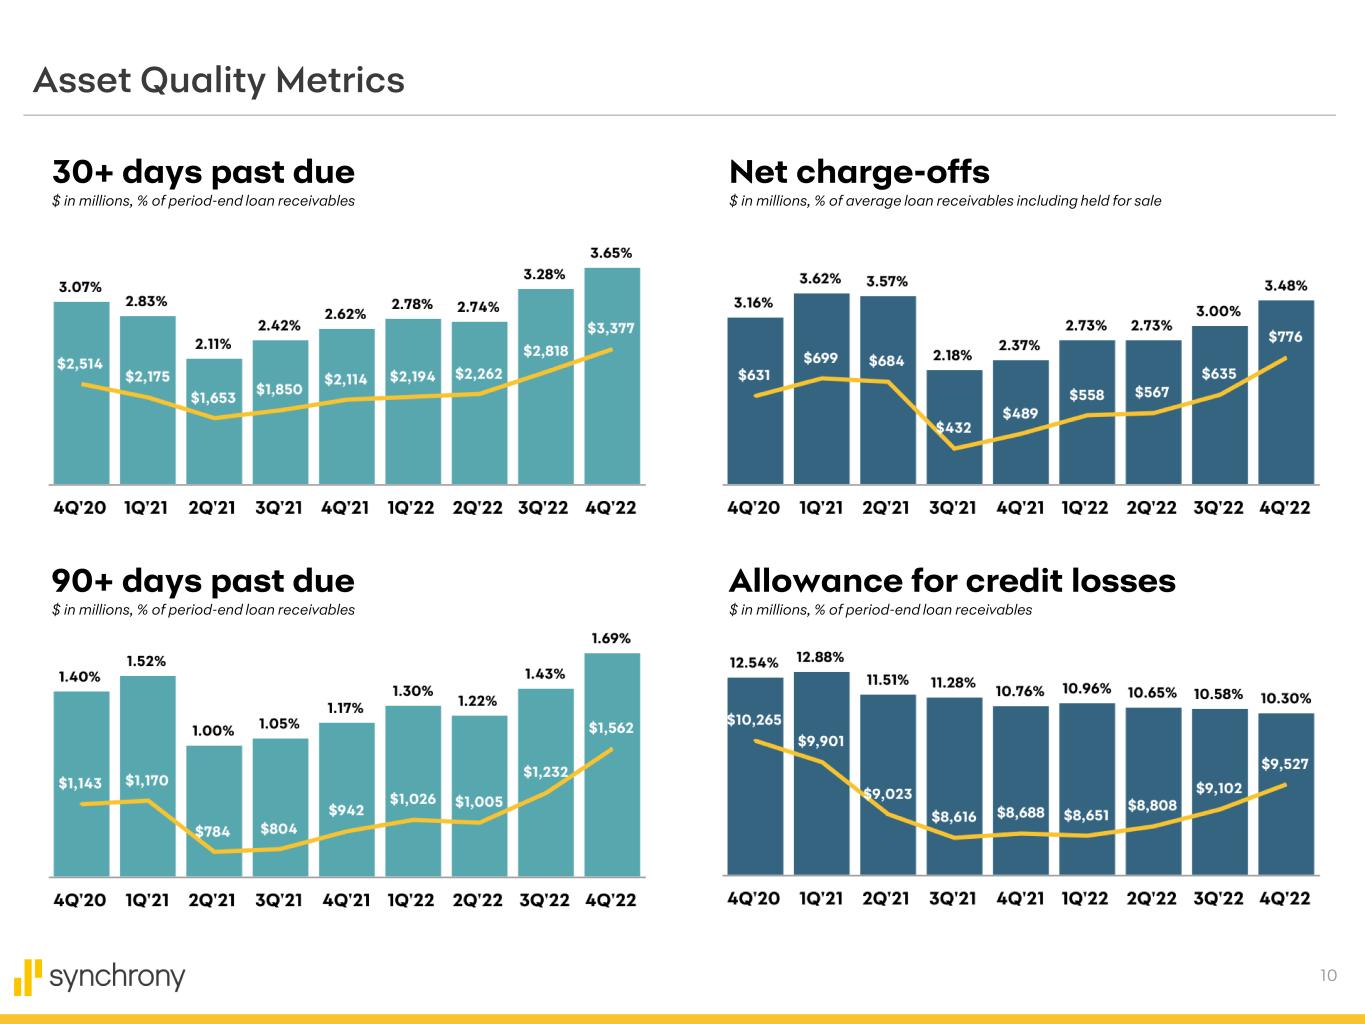
10 Asset Quality Metrics Allowance for credit losses $ in millions, % of period-end loan receivables Net charge-offs $ in millions, % of average loan receivables including held for sale 30+ days past due $ in millions, % of period-end loan receivables 90+ days past due $ in millions, % of period-end loan receivables
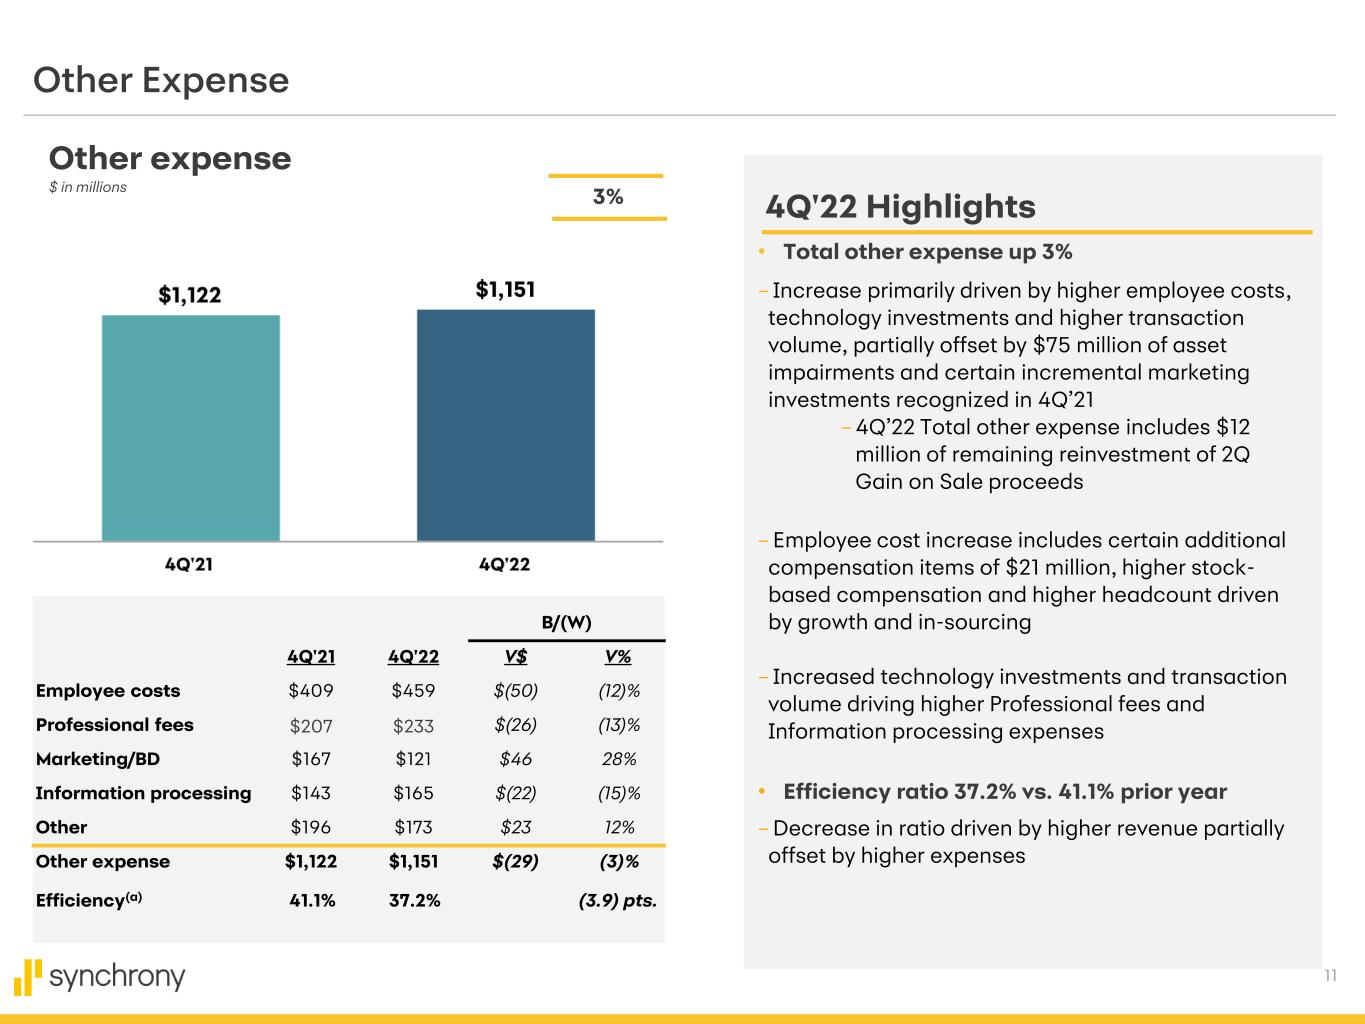
11 B/(W) 4Q'21 4Q'22 V$ V% Employee costs $409 $459 $(50) (12)% Professional fees $207 $233 $(26) (13)% Marketing/BD $167 $121 $46 28% Information processing $143 $165 $(22) (15)% Other $196 $173 $23 12% Other expense $1,122 $1,151 $(29) (3)% Efficiency(a) 41.1% 37.2% (3.9) pts. Other Expense Other expense $ in millions 4Q'22 Highlights3% • Total other expense up 3% – Increase primarily driven by higher employee costs, technology investments and higher transaction volume, partially offset by $75 million of asset impairments and certain incremental marketing investments recognized in 4Q’21 – 4Q’22 Total other expense includes $12 million of remaining reinvestment of 2Q Gain on Sale proceeds – Employee cost increase includes certain additional compensation items of $21 million, higher stock- based compensation and higher headcount driven by growth and in-sourcing – Increased technology investments and transaction volume driving higher Professional fees and Information processing expenses • Efficiency ratio 37.2% vs. 41.1% prior year – Decrease in ratio driven by higher revenue partially offset by higher expenses
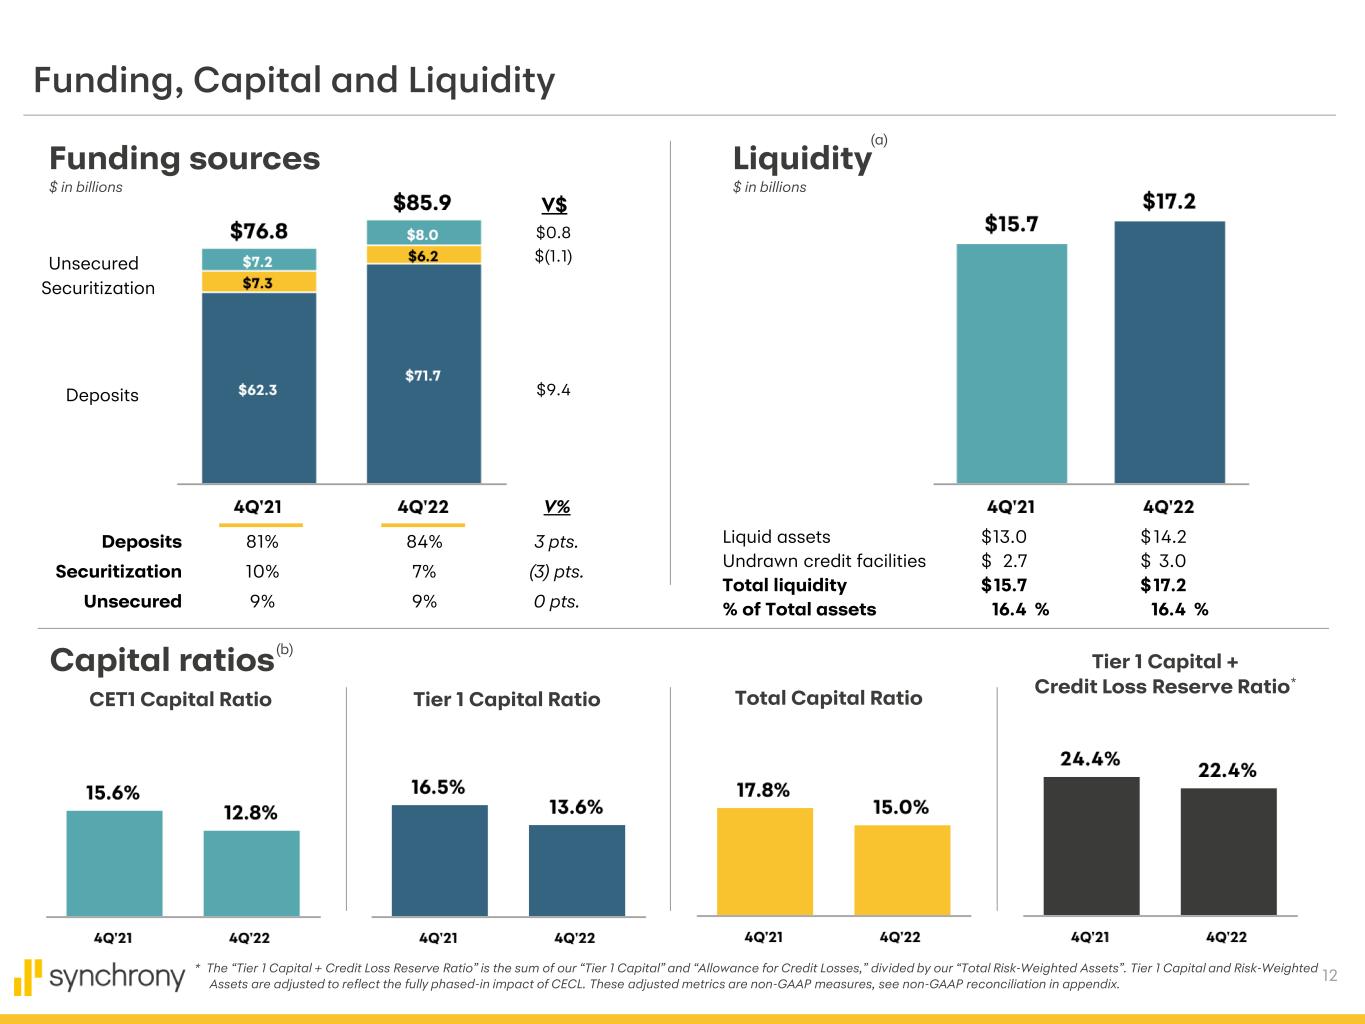
12 Tier 1 Capital + Credit Loss Reserve Ratio* Capital ratios Funding, Capital and Liquidity Funding sources $ in billions V$ $0.8 $(1.1) $9.4 V% Liquidity $ in billions CET1 Capital Ratio Tier 1 Capital Ratio Total Capital Ratio * The “Tier 1 Capital + Credit Loss Reserve Ratio” is the sum of our “Tier 1 Capital” and “Allowance for Credit Losses,” divided by our “Total Risk-Weighted Assets”. Tier 1 Capital and Risk-Weighted Assets are adjusted to reflect the fully phased-in impact of CECL. These adjusted metrics are non-GAAP measures, see non-GAAP reconciliation in appendix. Unsecured Securitization Deposits Deposits 81% 84% 3 pts. Securitization 10% 7% (3) pts. Unsecured 9% 9% 0 pts. Liquid assets $13.0 $14.2 Undrawn credit facilities $ 2.7 $ 3.0 Total liquidity $15.7 $17.2 % of Total assets 16.4 % 16.4 % (a) (b)
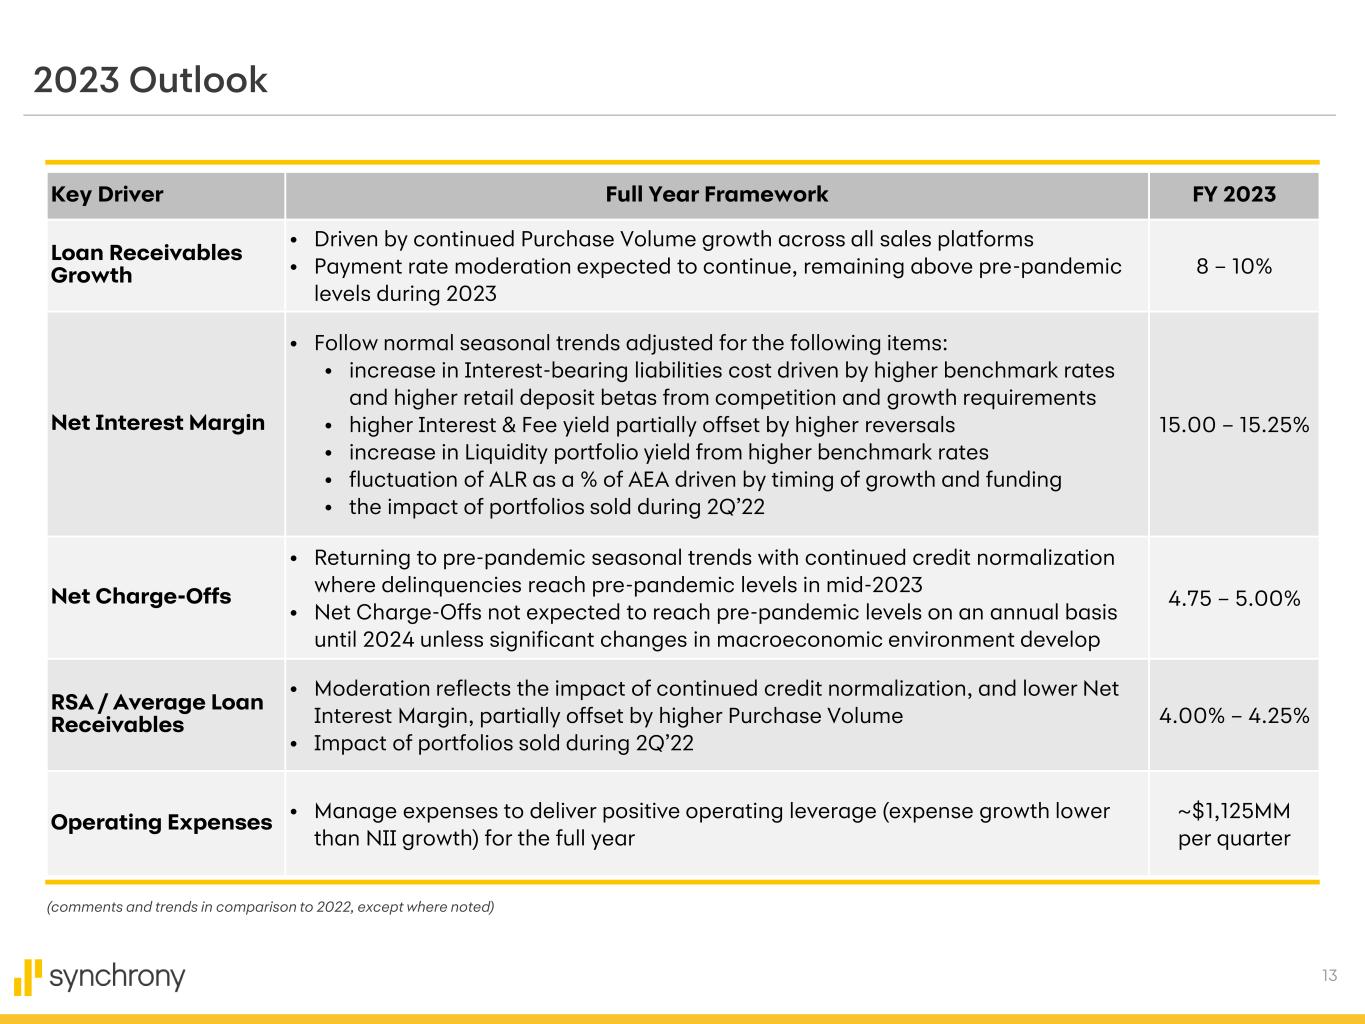
13 2023 Outlook Key Driver Full Year Framework FY 2023 Loan Receivables Growth • Driven by continued Purchase Volume growth across all sales platforms • Payment rate moderation expected to continue, remaining above pre-pandemic levels during 2023 8 – 10% Net Interest Margin • Follow normal seasonal trends adjusted for the following items: • increase in Interest-bearing liabilities cost driven by higher benchmark rates and higher retail deposit betas from competition and growth requirements • higher Interest & Fee yield partially offset by higher reversals • increase in Liquidity portfolio yield from higher benchmark rates • fluctuation of ALR as a % of AEA driven by timing of growth and funding • the impact of portfolios sold during 2Q’22 15.00 – 15.25% Net Charge-Offs • Returning to pre-pandemic seasonal trends with continued credit normalization where delinquencies reach pre-pandemic levels in mid-2023 • Net Charge-Offs not expected to reach pre-pandemic levels on an annual basis until 2024 unless significant changes in macroeconomic environment develop 4.75 – 5.00% RSA / Average Loan Receivables • Moderation reflects the impact of continued credit normalization, and lower Net Interest Margin, partially offset by higher Purchase Volume • Impact of portfolios sold during 2Q’22 4.00% – 4.25% Operating Expenses • Manage expenses to deliver positive operating leverage (expense growth lower than NII growth) for the full year ~$1,125MM per quarter (comments and trends in comparison to 2022, except where noted)
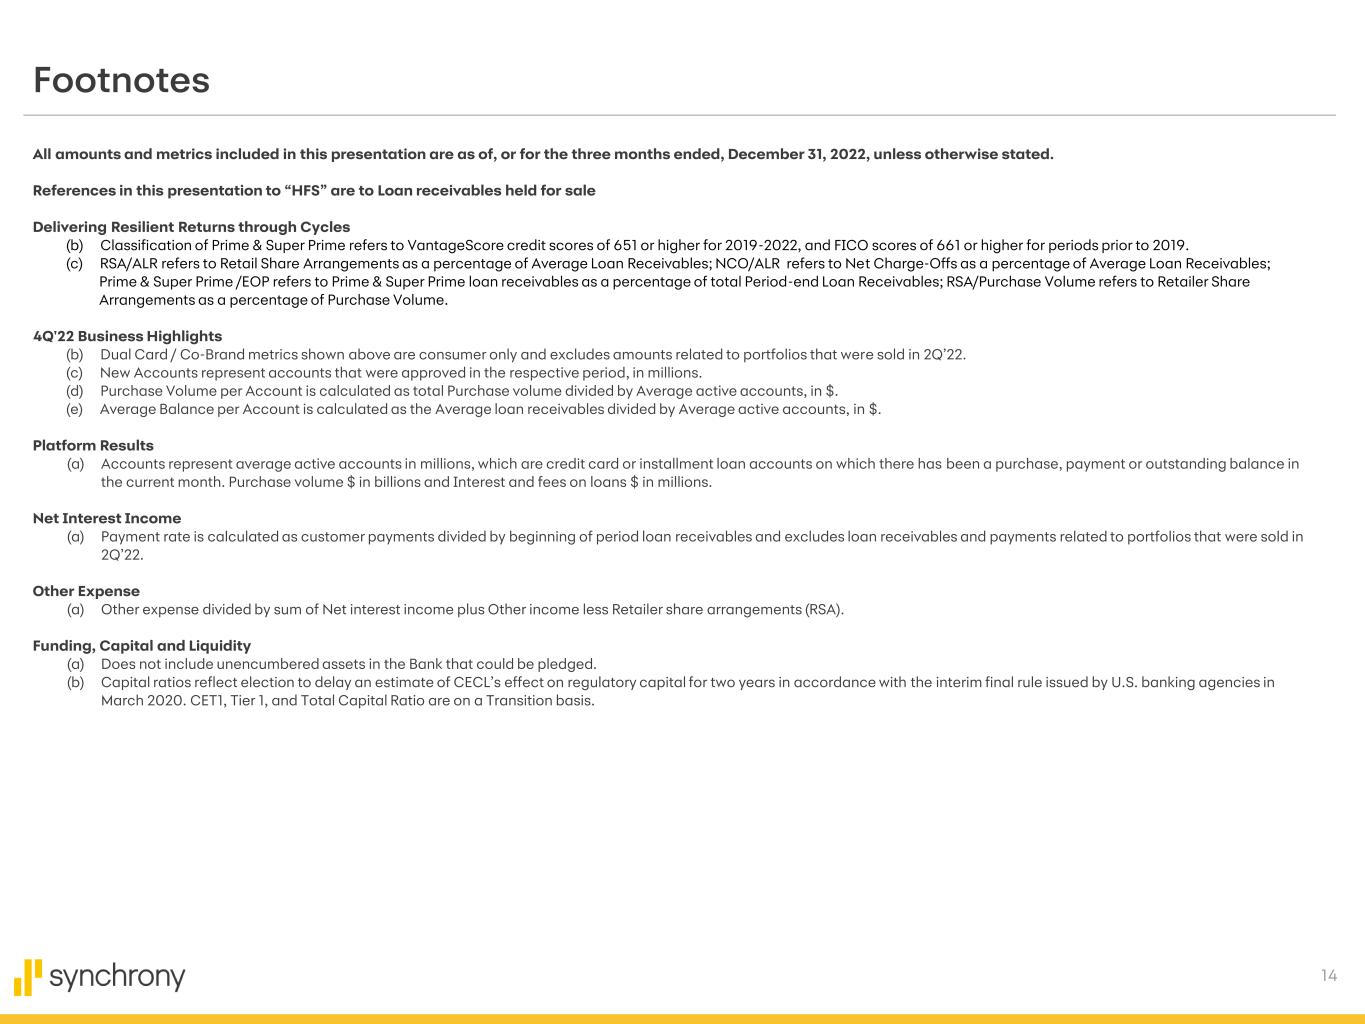
14 Footnotes All amounts and metrics included in this presentation are as of, or for the three months ended, December 31, 2022, unless otherwise stated. References in this presentation to “HFS” are to Loan receivables held for sale Delivering Resilient Returns through Cycles (b) Classification of Prime & Super Prime refers to VantageScore credit scores of 651 or higher for 2019-2022, and FICO scores of 661 or higher for periods prior to 2019. (c) RSA/ALR refers to Retail Share Arrangements as a percentage of Average Loan Receivables; NCO/ALR refers to Net Charge-Offs as a percentage of Average Loan Receivables; Prime & Super Prime /EOP refers to Prime & Super Prime loan receivables as a percentage of total Period-end Loan Receivables; RSA/Purchase Volume refers to Retailer Share Arrangements as a percentage of Purchase Volume. 4Q'22 Business Highlights (b) Dual Card / Co-Brand metrics shown above are consumer only and excludes amounts related to portfolios that were sold in 2Q’22. (c) New Accounts represent accounts that were approved in the respective period, in millions. (d) Purchase Volume per Account is calculated as total Purchase volume divided by Average active accounts, in $. (e) Average Balance per Account is calculated as the Average loan receivables divided by Average active accounts, in $. Platform Results (a) Accounts represent average active accounts in millions, which are credit card or installment loan accounts on which there has been a purchase, payment or outstanding balance in the current month. Purchase volume $ in billions and Interest and fees on loans $ in millions. Net Interest Income (a) Payment rate is calculated as customer payments divided by beginning of period loan receivables and excludes loan receivables and payments related to portfolios that were sold in 2Q’22. Other Expense (a) Other expense divided by sum of Net interest income plus Other income less Retailer share arrangements (RSA). Funding, Capital and Liquidity (a) Does not include unencumbered assets in the Bank that could be pledged. (b) Capital ratios reflect election to delay an estimate of CECL’s effect on regulatory capital for two years in accordance with the interim final rule issued by U.S. banking agencies in March 2020. CET1, Tier 1, and Total Capital Ratio are on a Transition basis.

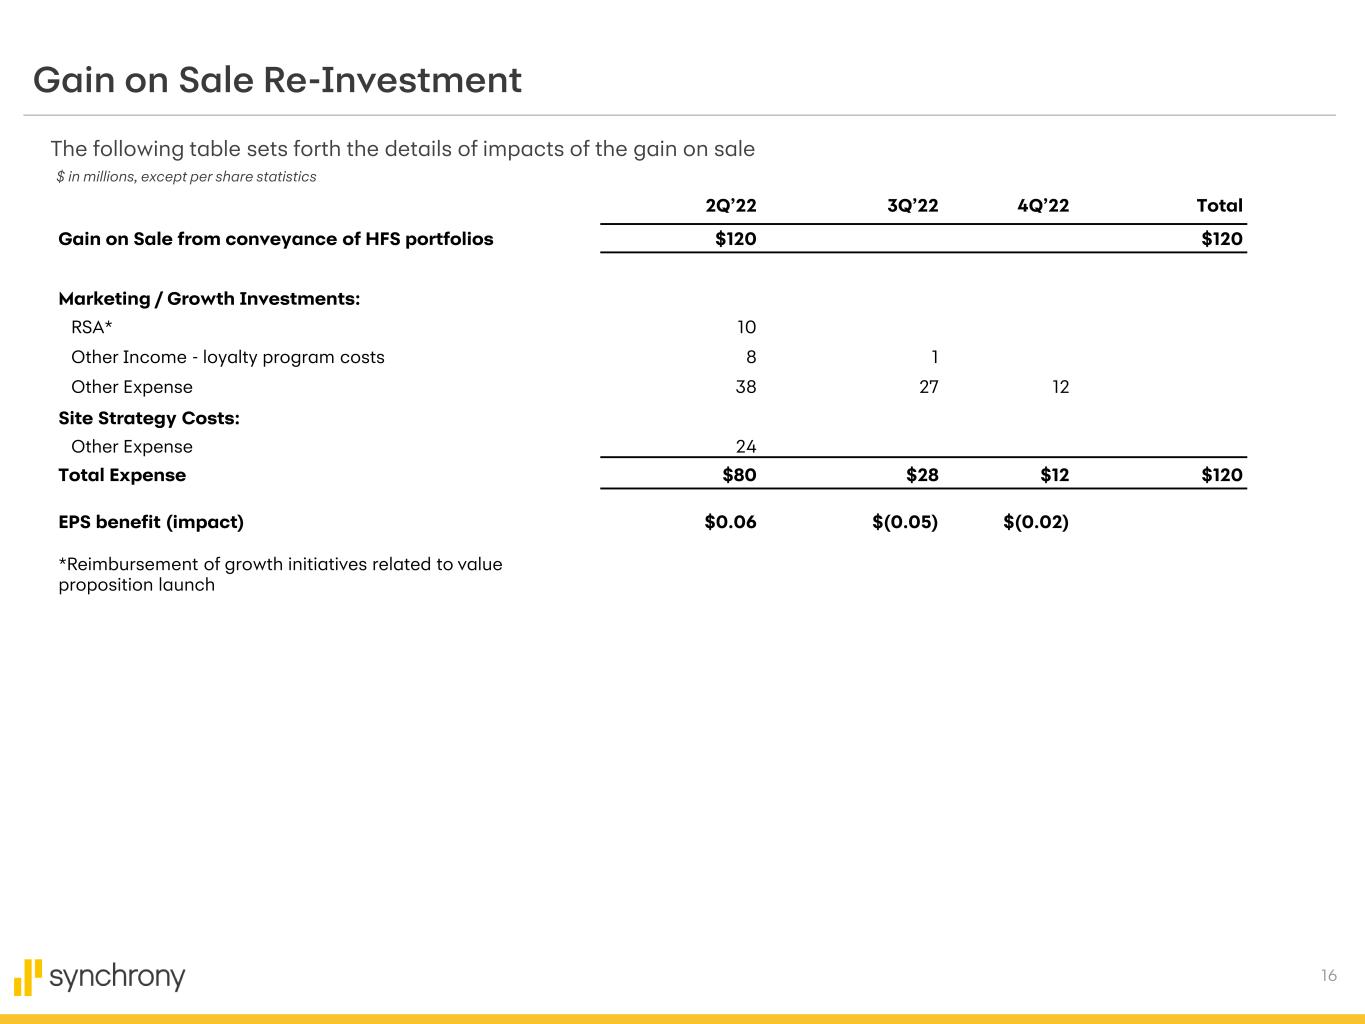
16 Gain on Sale Re-Investment 2Q’22 3Q’22 4Q’22 Total Gain on Sale from conveyance of HFS portfolios $120 $120 Marketing / Growth Investments: RSA* 10 Other Income - loyalty program costs 8 1 Other Expense 38 27 12 Site Strategy Costs: Other Expense 24 Total Expense $80 $28 $12 $120 EPS benefit (impact) $0.06 $(0.05) $(0.02) *Reimbursement of growth initiatives related to value proposition launch The following table sets forth the details of impacts of the gain on sale $ in millions, except per share statistics
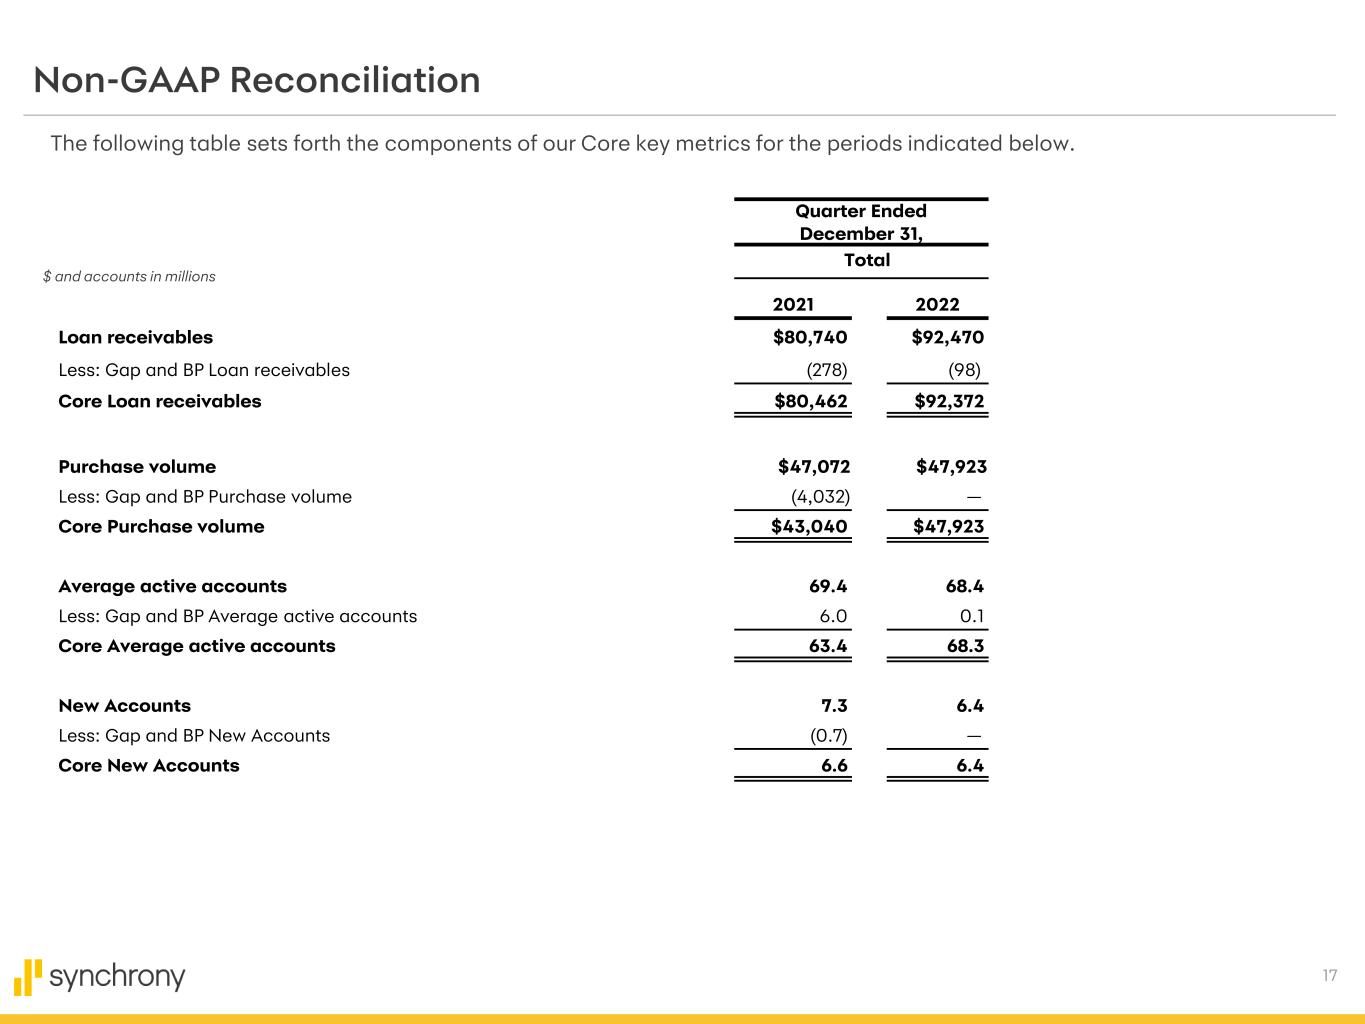
17 Non-GAAP Reconciliation The following table sets forth the components of our Core key metrics for the periods indicated below. $ and accounts in millions Quarter Ended December 31, Total 2021 2022 Loan receivables $80,740 $92,470 Less: Gap and BP Loan receivables (278) (98) Core Loan receivables $80,462 $92,372 Purchase volume $47,072 $47,923 Less: Gap and BP Purchase volume (4,032) — Core Purchase volume $43,040 $47,923 Average active accounts 69.4 68.4 Less: Gap and BP Average active accounts 6.0 0.1 Core Average active accounts 63.4 68.3 New Accounts 7.3 6.4 Less: Gap and BP New Accounts (0.7) — Core New Accounts 6.6 6.4
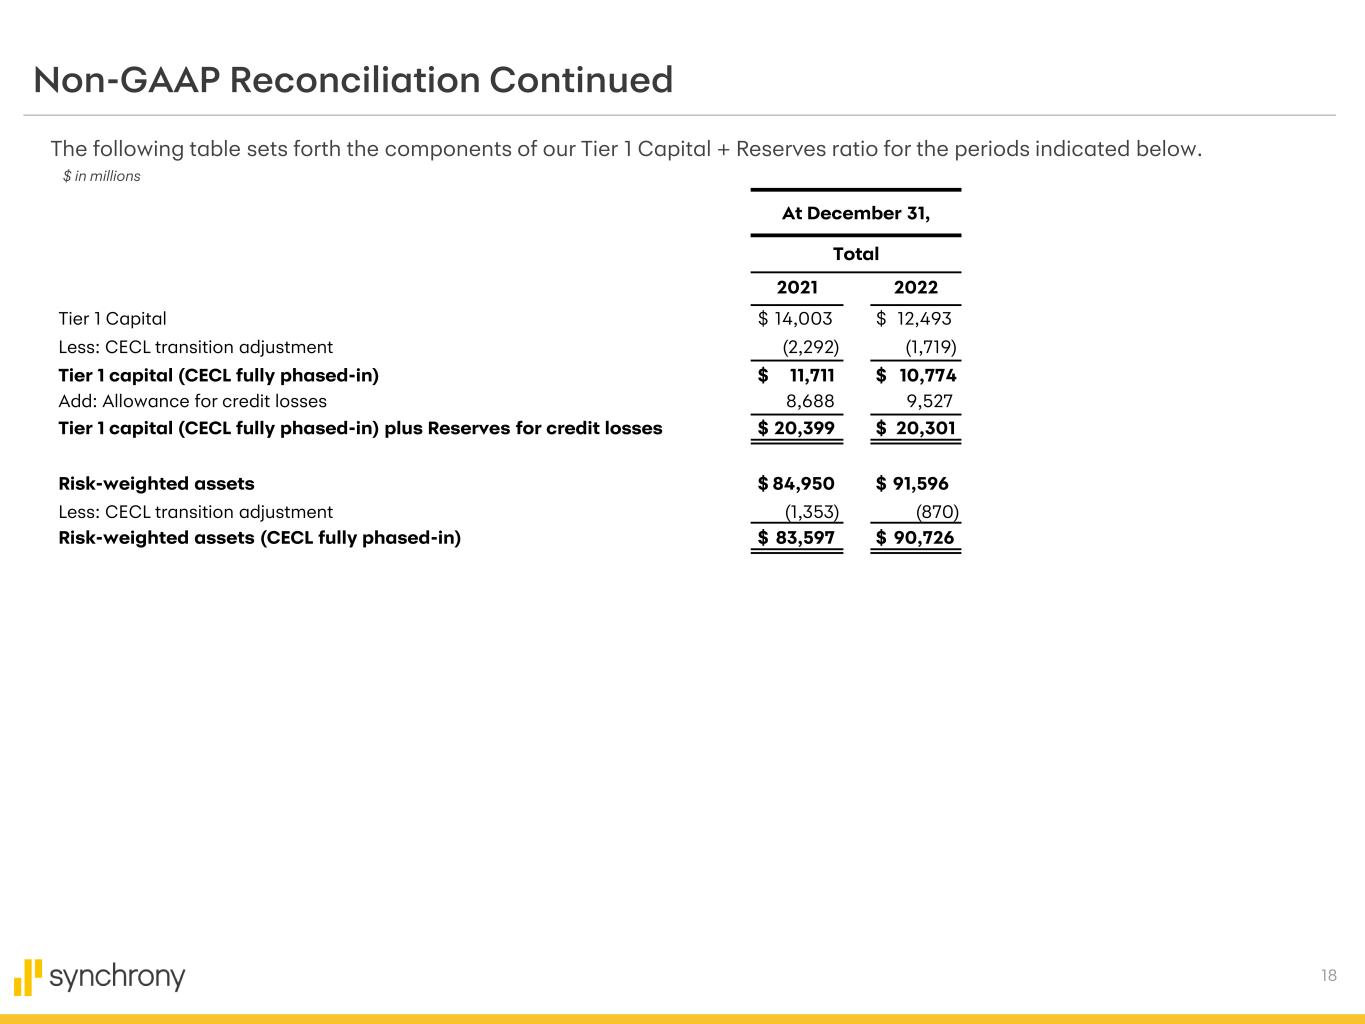
18 Non-GAAP Reconciliation Continued The following table sets forth the components of our Tier 1 Capital + Reserves ratio for the periods indicated below. $ in millions At December 31, Total 2021 2022 Tier 1 Capital $ 14,003 $ 12,493 Less: CECL transition adjustment (2,292) (1,719) Tier 1 capital (CECL fully phased-in) $ 11,711 $ 10,774 Add: Allowance for credit losses 8,688 9,527 Tier 1 capital (CECL fully phased-in) plus Reserves for credit losses $ 20,399 $ 20,301 Risk-weighted assets $ 84,950 $ 91,596 Less: CECL transition adjustment (1,353) (870) Risk-weighted assets (CECL fully phased-in) $ 83,597 $ 90,726
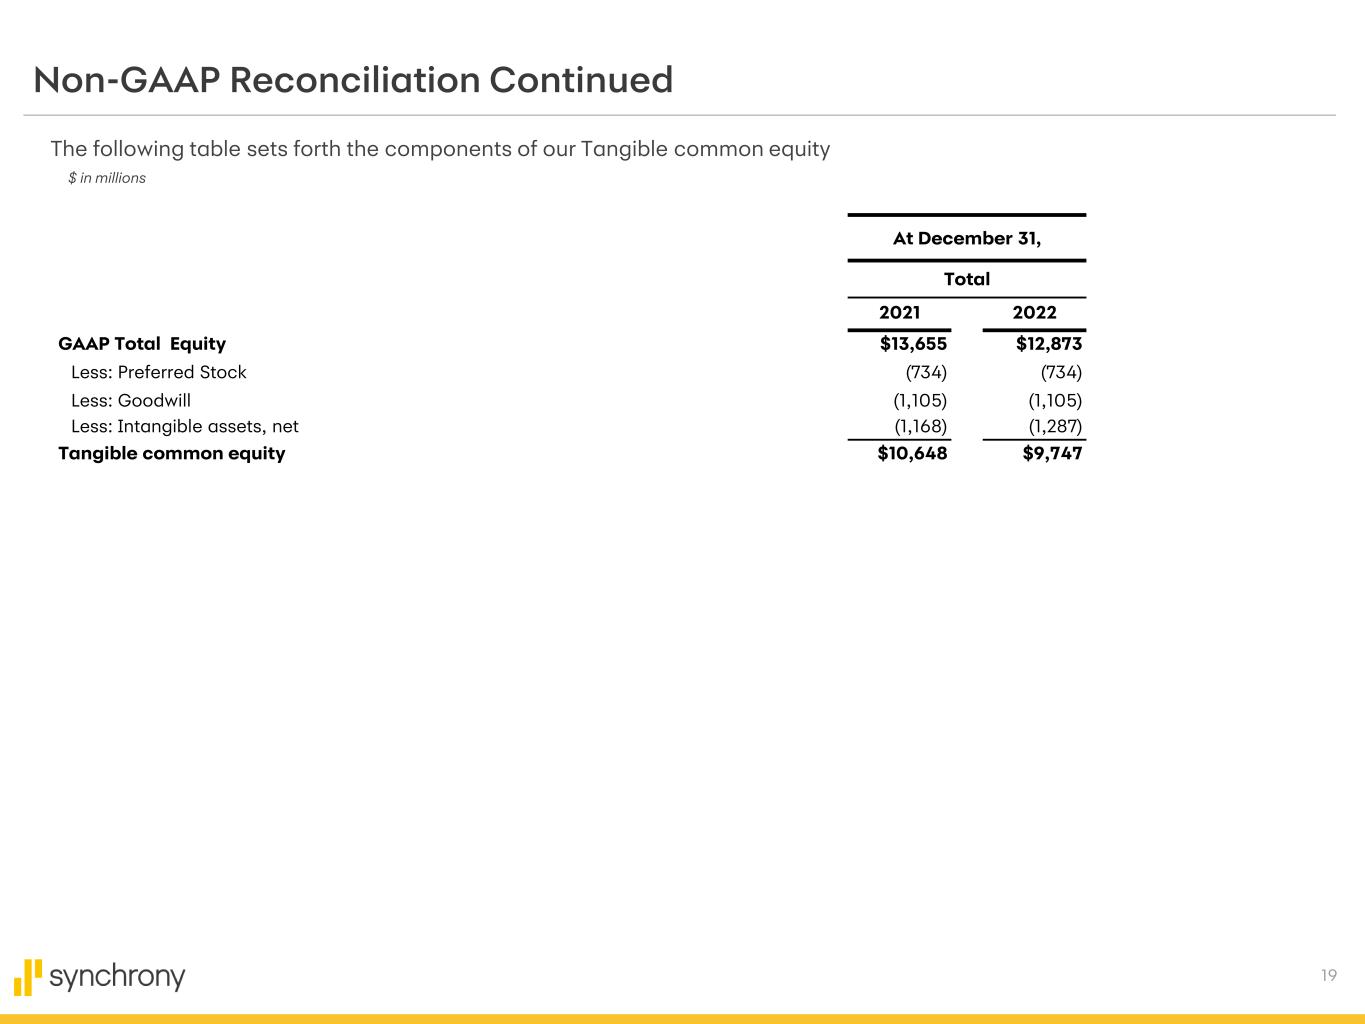
19 Non-GAAP Reconciliation Continued The following table sets forth the components of our Tangible common equity $ in millions At December 31, Total 2021 2022 GAAP Total Equity $13,655 $12,873 Less: Preferred Stock (734) (734) Less: Goodwill (1,105) (1,105) Less: Intangible assets, net (1,168) (1,287) Tangible common equity $10,648 $9,747
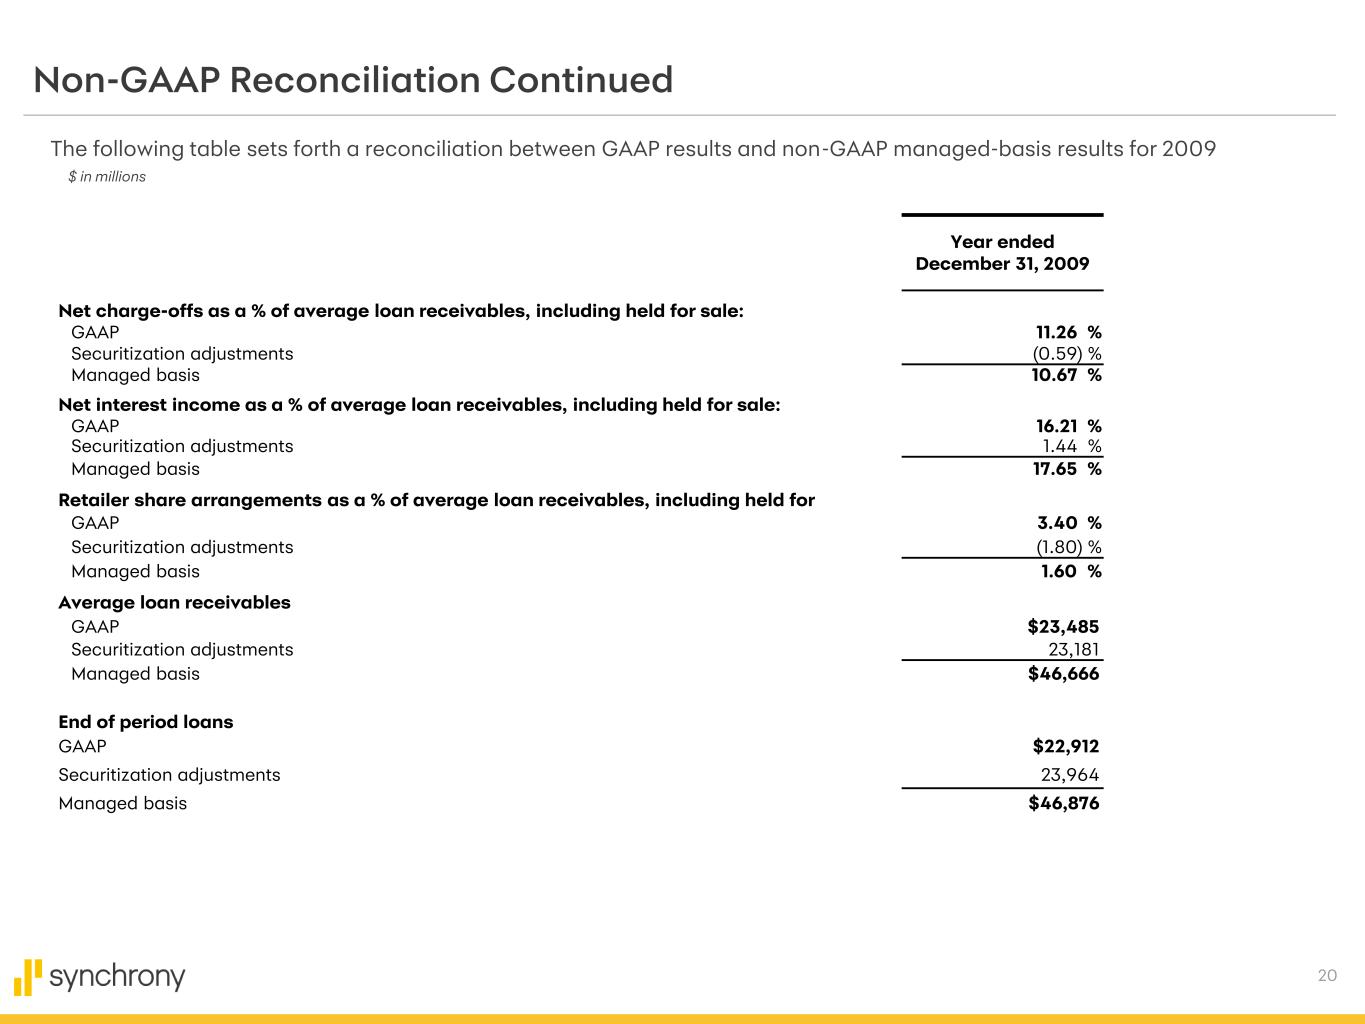
20 Non-GAAP Reconciliation Continued The following table sets forth a reconciliation between GAAP results and non-GAAP managed-basis results for 2009 $ in millions Year ended December 31, 2009 Net charge-offs as a % of average loan receivables, including held for sale: GAAP 11.26 % Securitization adjustments (0.59) % Managed basis 10.67 % Net interest income as a % of average loan receivables, including held for sale: GAAP 16.21 % Securitization adjustments 1.44 % Managed basis 17.65 % Retailer share arrangements as a % of average loan receivables, including held for GAAP 3.40 % Securitization adjustments (1.80) % Managed basis 1.60 % Average loan receivables GAAP $23,485 Securitization adjustments 23,181 Managed basis $46,666 End of period loans GAAP $22,912 Securitization adjustments 23,964 Managed basis $46,876
Exhibit 99.4
Explanation of Non-GAAP Measures
The information provided in this Form 8-K and exhibits includes measures which are not prepared in accordance with U.S. generally accepted accounting principles ("GAAP").
We present certain information on our loan receivables that have been adjusted to exclude amounts related to portfolio sales in the second quarter of 2022, which we refer to as "Core" financial measures, in this Form 8-K and exhibits. These Core financial measures are not measures presented in accordance with GAAP. We believe the presentation of certain Core financial measures is a more meaningful measure to investors of the Company's ongoing credit programs. The reconciliation of these Core financial measures to the comparable GAAP component is included in Exhibit 99.3.
In addition, we also present certain capital measures in this Form 8-K and exhibits. Our “fully-phased Tier 1 Capital and Credit Loss Reserve Ratio” is not required by regulators to be disclosed, and therefore is considered a non-GAAP measure. We believe this ratio is a useful measure to investors as it provides a meaningful measure of what the Company’s total loss absorption capacity would be if the transitional rules currently in effect, which permit the temporary deferral of the regulatory capital effects of CECL, were no longer available for us to apply.
We also present a measure we refer to as “tangible common equity” in this Form 8-K and exhibits. Tangible common equity itself is not a measure presented in accordance with GAAP. We believe tangible common equity is a more meaningful measure to investors of the net asset value of the Company.
The reconciliations of these capital and equity related non-GAAP measures to the applicable comparable GAAP financial measures are included in the detailed financial tables included in Exhibit 99.2.
Within Exhibit 99.3 we present certain historical financial information for 2009 on a "managed" basis. These metrics presented on a managed basis are non-GAAP measures. A reconciliation of the corresponding GAAP financial metrics to the financial information presented on a managed basis is included in the appendix of Exhibit 99.3.