Operator
Good morning, and welcome to the Bread Financial Fourth Quarter 2025 Earnings Conference Call. My name is Kevin, and I'll be coordinating your call today. At this time, all parties have been placed on listen-only mode. Following today's presentation, the floor will be open for your questions. To register a question, please press star 1-1. It is now my pleasure to introduce Mr. Brian Vrab, Head of Investor Relations at Bread Financial. The floor is yours.
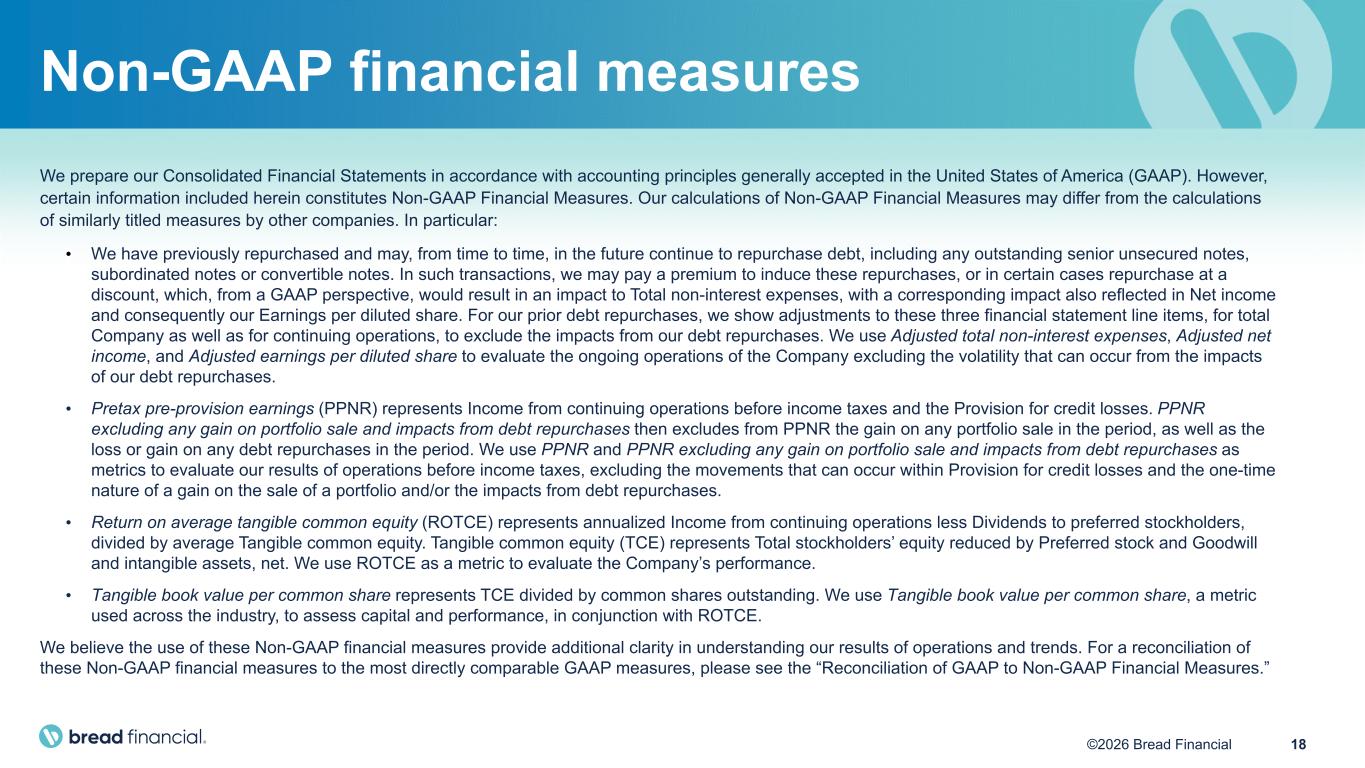
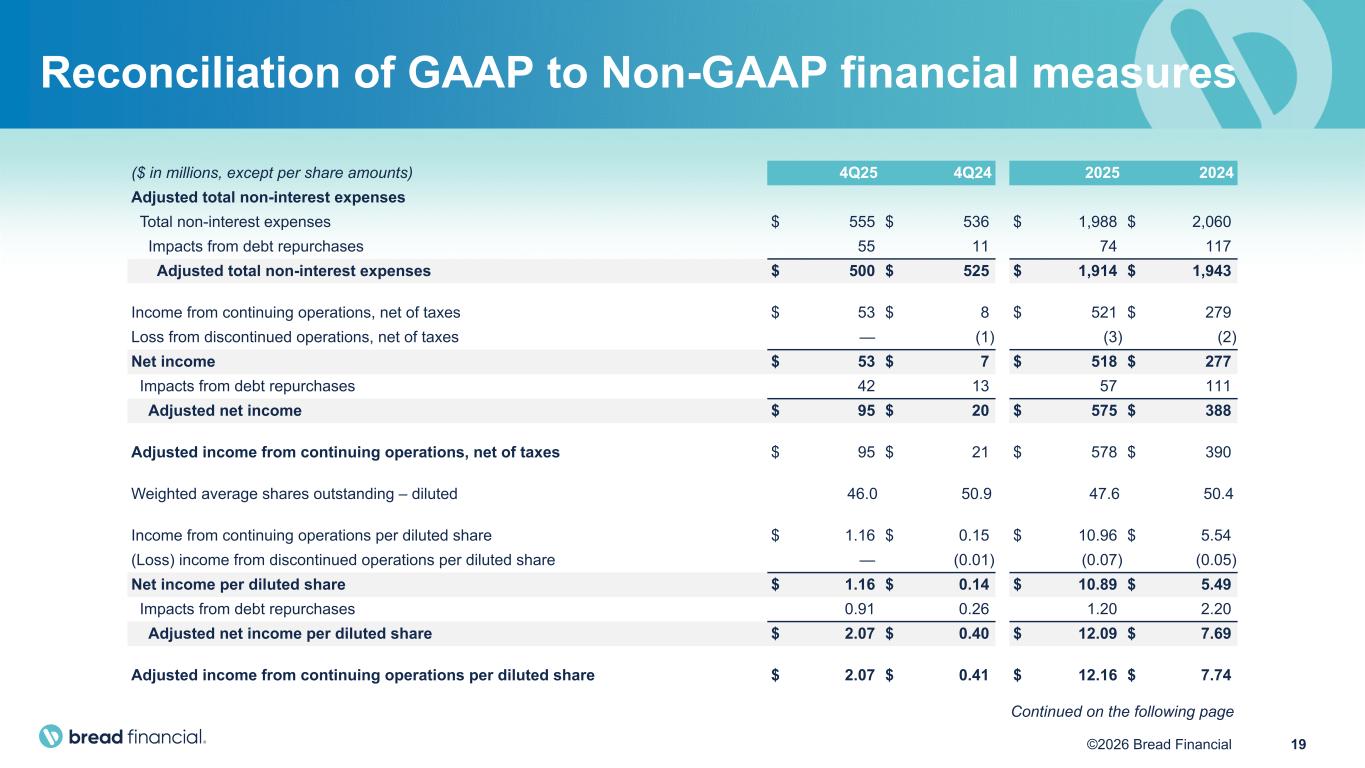
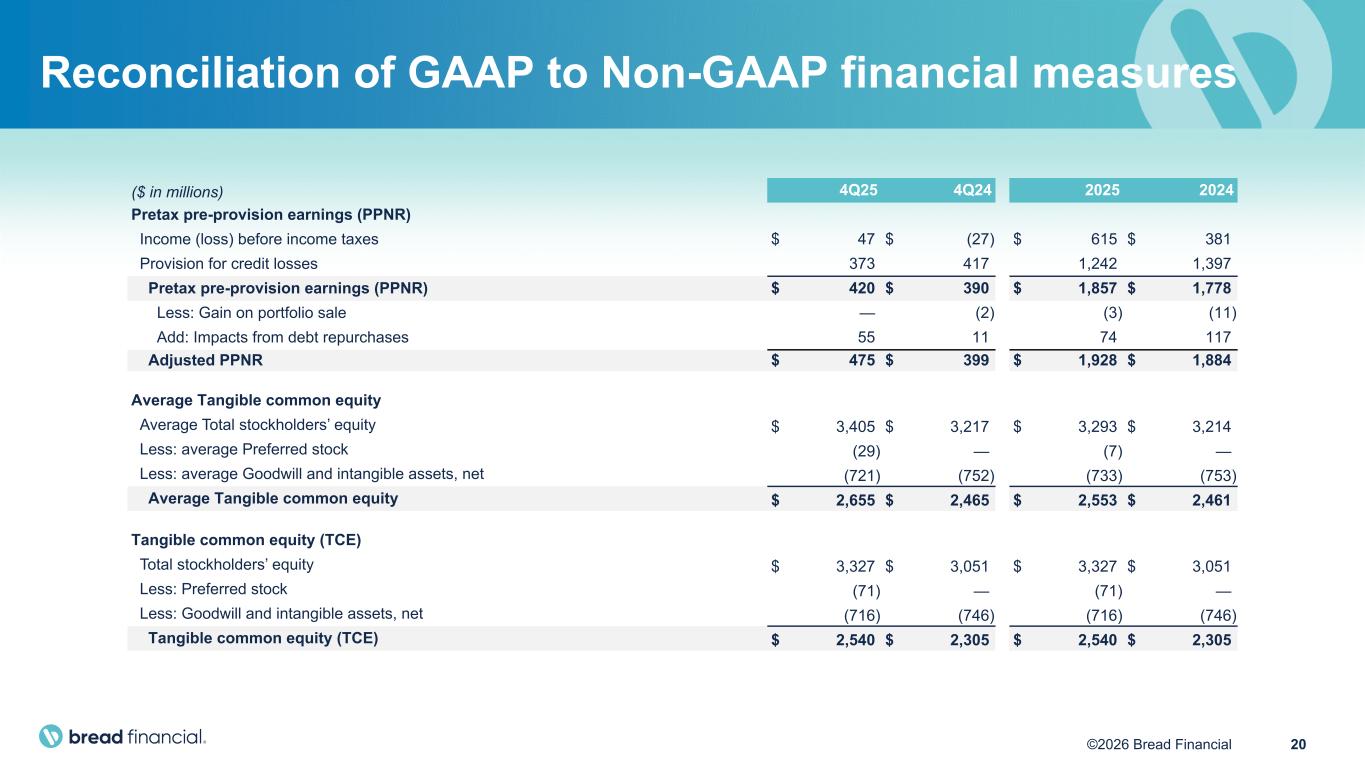
Copies of the slides we will be reviewing and the earnings release can be found on the investor relations section of our website at brettfinancial.com. On the call today, we have Ralph Andretta, President and Chief Executive Officer, and Perry Biberman, Executive Vice President and Chief Financial Officer. Before we begin, I would like to remind you that some of the comments made on today's call and some of the responses to your questions may contain forward-looking statements. These statements are based on management's current expectations and assumptions and are subject to the risks and uncertainties described in the company's earnings release and other filings with the SEC. Also on today's call, our speakers will reference certain non-GAAP financial measures which we believe will provide useful information for investors. Reconciliation of those measures to GAAP are included in our quarterly earnings materials posted on our Investor Relations website. With that, I would like to turn the call over to Ralph Thank you, Brian, and good morning to everyone joining the call.
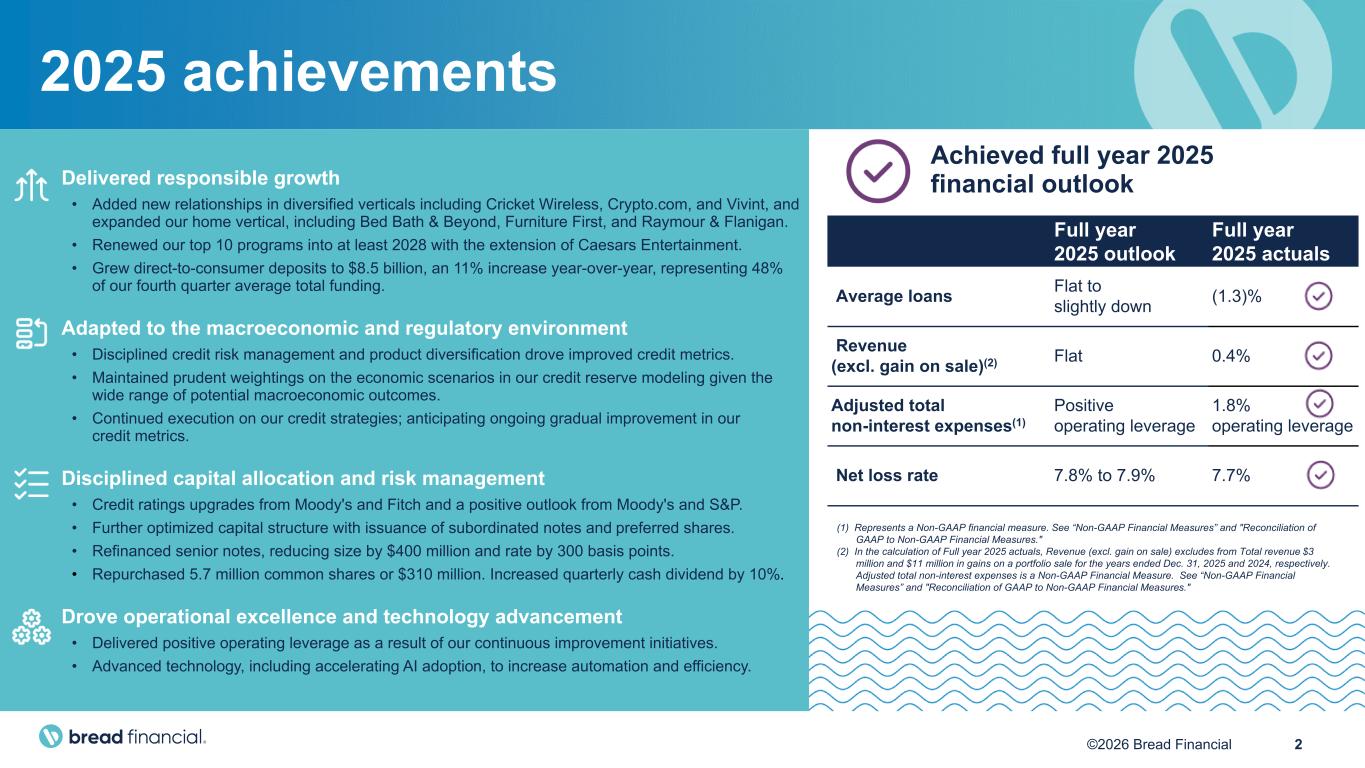
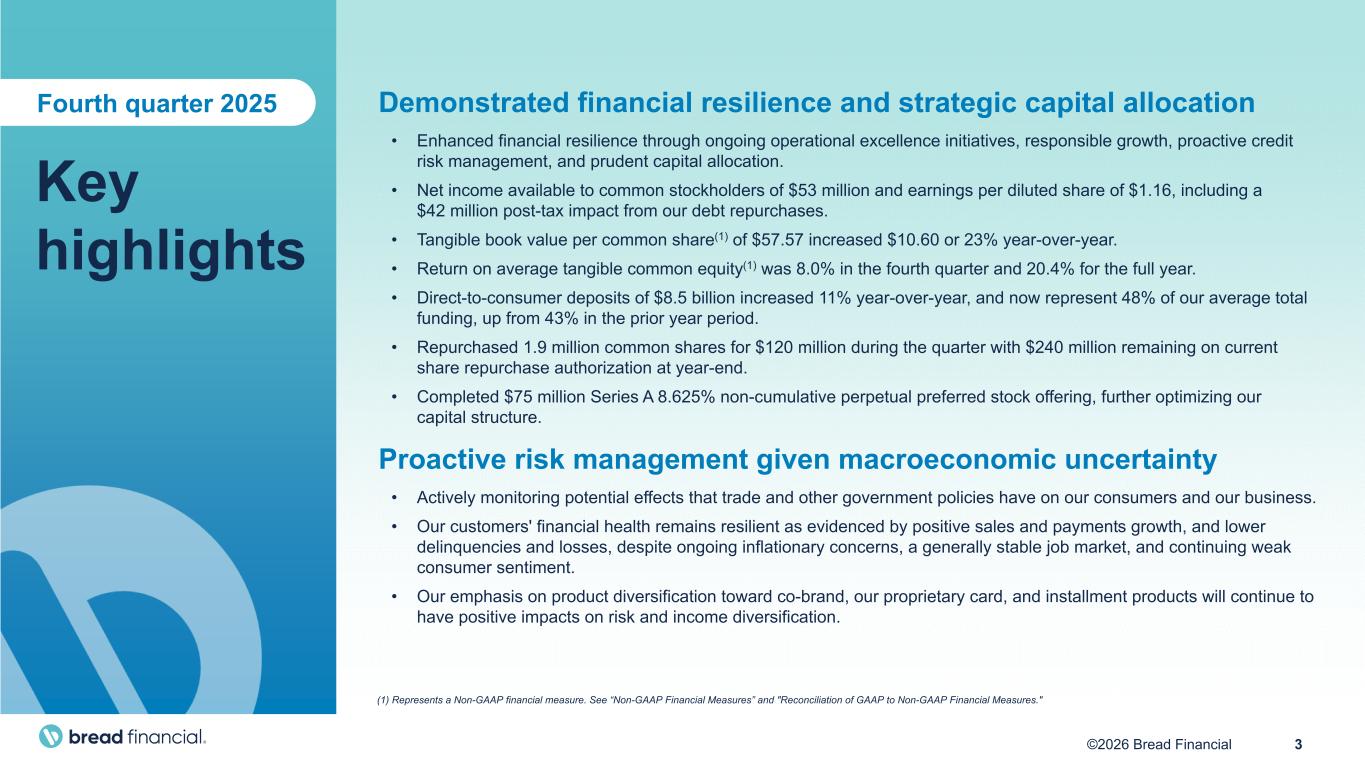
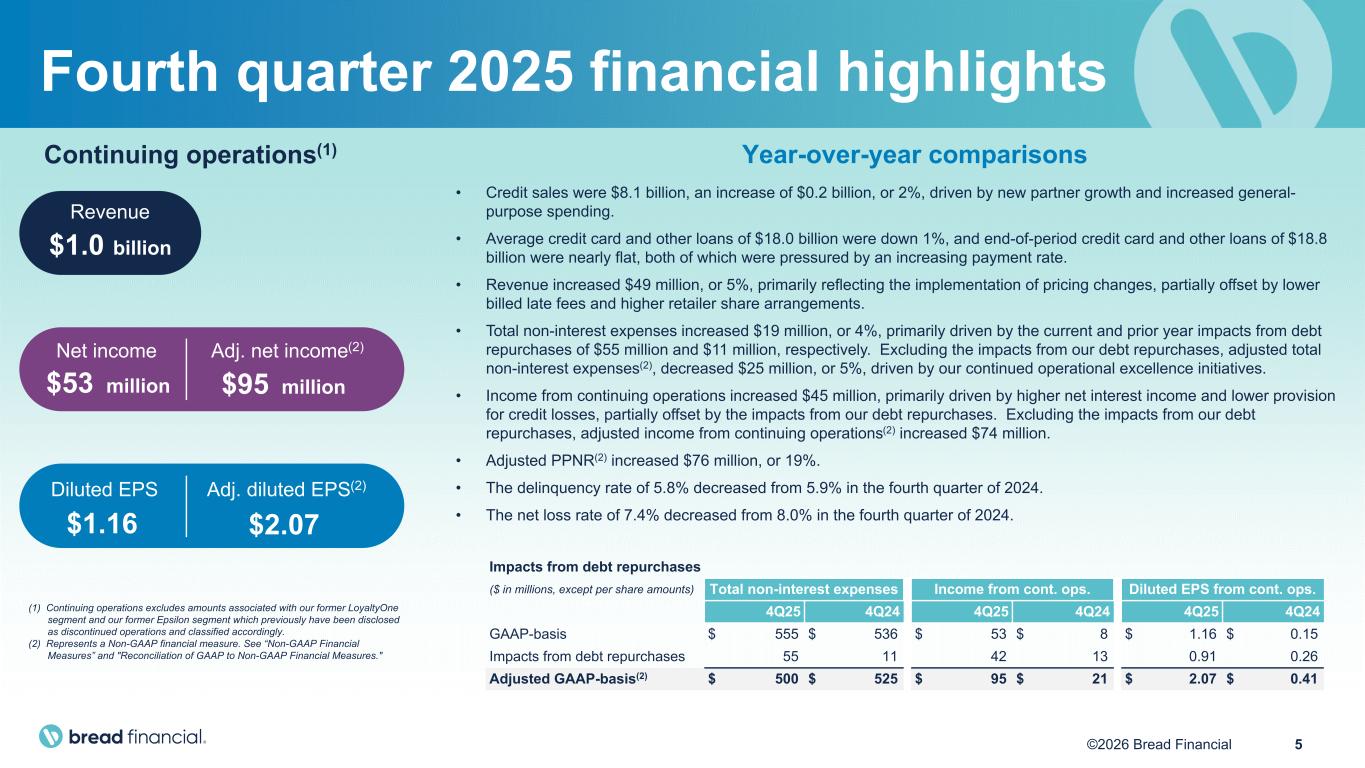
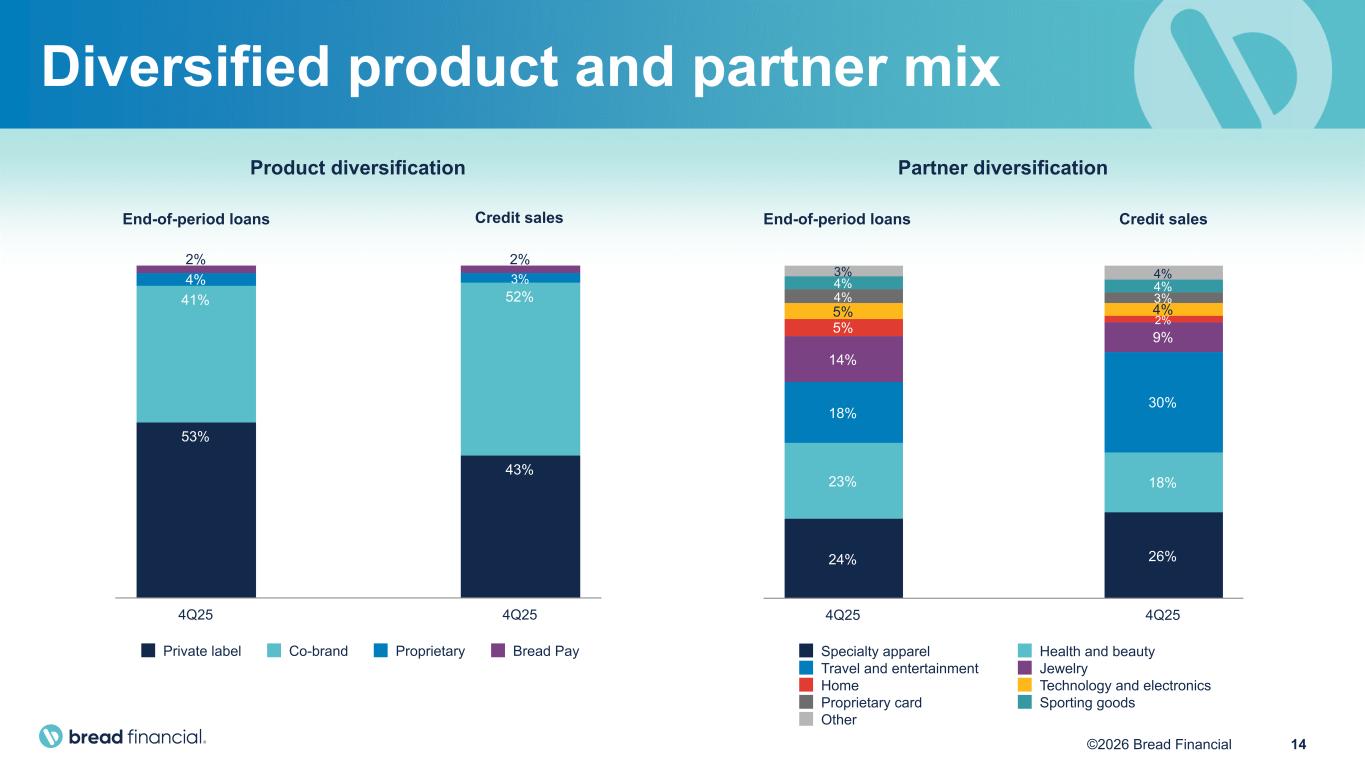
Today, Bread Financial reported strong fourth quarter and full year 2025 results in line with our expectations. Starting with our 2025 financial achievements on slide two, we are proud of the progress we have made executing on our focus areas during the year. Leveraging our experienced team of associates and full product suite, we delivered against our responsible growth objective with seven major new brand signings in 2025 and renewing multiple existing partners in a number of verticals. A home vertical expanded significantly in 2025 with the signings of Bed Bath & Beyond, an e-commerce retailer with ownership interests in various retail brands. Furniture First, a national cooperative buying group that serves hundreds of independent home furnishings and bedding retailers across the U.S., and Raymore and Flanagan, the largest furniture and mattress retailer in the Northeast and seventh largest nationwide. Additionally, we signed and launched Crypto.com, as well as BreadPay installment lending relationships with Cricut Wireless and Vivid, reflecting our flexible payment options and seamless integrations and solutions. These relationships demonstrate how our product solutions span all generational segments and are supported by our digital-first approach, creating value for our brand partners through increased sales, revenue, and lifetime customer value. Shifting to our renewals, we renewed multiple brand partners this year, including a multi-year extension with our long-term partner, Caesars Entertainment. All of our top ten programs are now renewed until at least 2028. Additionally, in June, we launched a new enhanced fee-based Caesars Rewards credit card that gives members more ways to earn accelerated rewards and enjoy unique experiences. This is a clear example of how we continue to innovate and evolve our product set to fit our brand partner and customer needs and enhance value propositions to drive sales and loyalty. Our vertical and product expansion efforts continue to have a positive impact on both risk management and income diversification across our portfolio, with co-brand comprising 52% of our credit sales in the fourth quarter, up from 48% in the fourth quarter of 2024. Red Financial continues to leverage our partner-first culture and experienced program management team to deliver full capabilities to brand partners and their customers. This includes providing a full suite of flexible payment options to unlock incremental sales and build loyalty through omni-channel delivery, seamless integrations, and exceptional customer experience. We are routinely chosen by industry-leading brands across a wide array of industry verticals to take their credit and loyalty programs to new heights. We continue to see success in our direct-to-consumer deposit program as it remains an important source of stable and lower-cost funding for the company. Our direct-to-consumer deposit balances increased 11% year-over-year and have grown 20 consecutive quarters, now representing 48% of our fourth-quarter average total funding, up from 43% a year ago. Regarding capital allocation in 2025, we returned $350 million in capital to shareholders. This includes $310 million in common share repurchases, resulting in the repurchase of 12% of our year-end 2024 outstanding shares. We also increased our quarterly common stock dividend by 10% during the fourth quarter of 2025. At the same time, we meaningfully strengthen and optimize our balance sheet by reducing and refinancing our senior debt and issuing subordinated debt and preferred equity. Lastly, we received a credit rating upgrade from Moody's and Fitch and positive outlooks from Moody's and S&P during the fourth quarter, acknowledging the actions we have taken to strengthen and improve our financial resilience and enhance our enterprise risk management. Our focus on operational excellence and technology advancements was evident this year as we achieved our goal of delivering positive operating leverage with over year-over-year adjusted expenses while continuing to invest in our business. During the year, we progressed our multi-year technology transformation, which included delivering new customer capabilities, continued cloud migration, and increased automation, including accelerating AI adoption. From a credit management perspective, we underwrite for profitability and returns, creating value for our partners and providing purchasing power for consumers. The effective execution of the disciplined credit strategies and continued product diversification coupled with a resilient consumer led to improving credit metrics throughout 2025. A full-year net loss rate of 7.7% was better than our outlook and meaningfully better than and our initial expectations for 2025. We anticipate that a gradual improvement in our credit metrics will continue in 2026. Overall, we are pleased with our 2025 financial and operational results and remain confident in our ability to generate returns. Moving to the fourth quarter key highlights on slide three. During the quarter, we generated net income available to common stockholders of $53 million, Excluding the $42 million post-tax impact from expenses related to debt repurchases in the quarter, adjusted net income and earnings per diluted share were $95 million and $2.07 respectively. Our tangible book value per common share grew 23% year-over-year to $57.57, and our return on average tangible common equity was 8% for the quarter and 20% for the full year. In the quarter, we repurchased $120 million or 1.9 million common shares with $240 million remaining on our current share repurchase authorization. We also issued $75 million in preferred shares. Consumer finance health remained resilient during the quarter, driving a 2% year-over-year increase in credit sales as a result of higher transaction sizes and increased transaction frequency. We are seeing consumers continue to allocate a larger portion of their budget towards non-discretionary spend. Within discretionary spend, we saw an increase in travel and entertainment spending compared to the fourth quarter of 2024. Additionally, our credit performance trends continue to improve. The fourth quarter net loss rate was 7.4%. The positive trajectory of our credit sales and credit metrics, along with our new business additions and stable partner base, give us confidence that we are nearing an inflection point for loan growth as we enter 2026. Our solid, sustainable results underscore our disciplined approach to growing responsibly, building financial resilience, and advancing operational excellence. Supported by strong capital levels and cash flow generation, we entered 2026 with strong momentum, which positions us well to execute on our capital and growth priorities while delivering sustainable long-term value for our shareholders. Now I will pass it over to Perry to review the financials in more detail. Thanks, Raoul.
Speaker 7
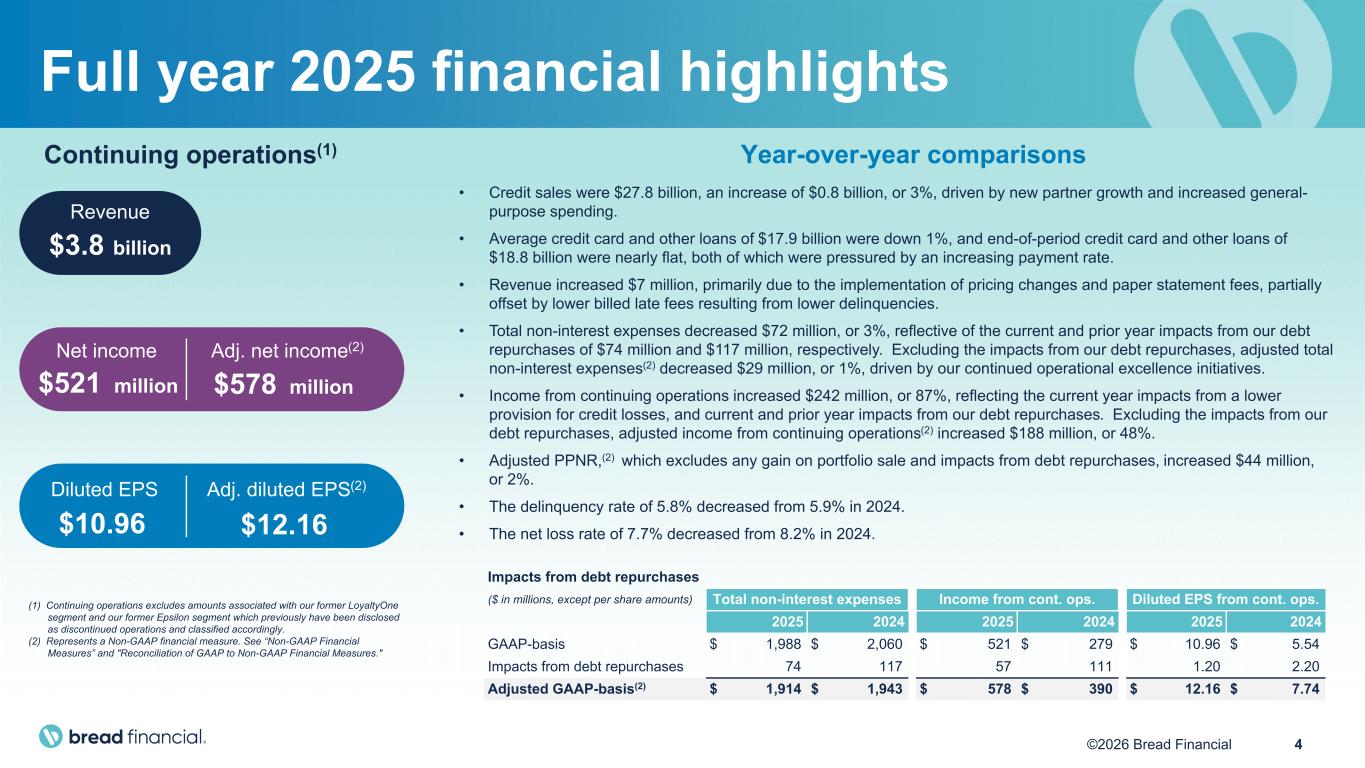
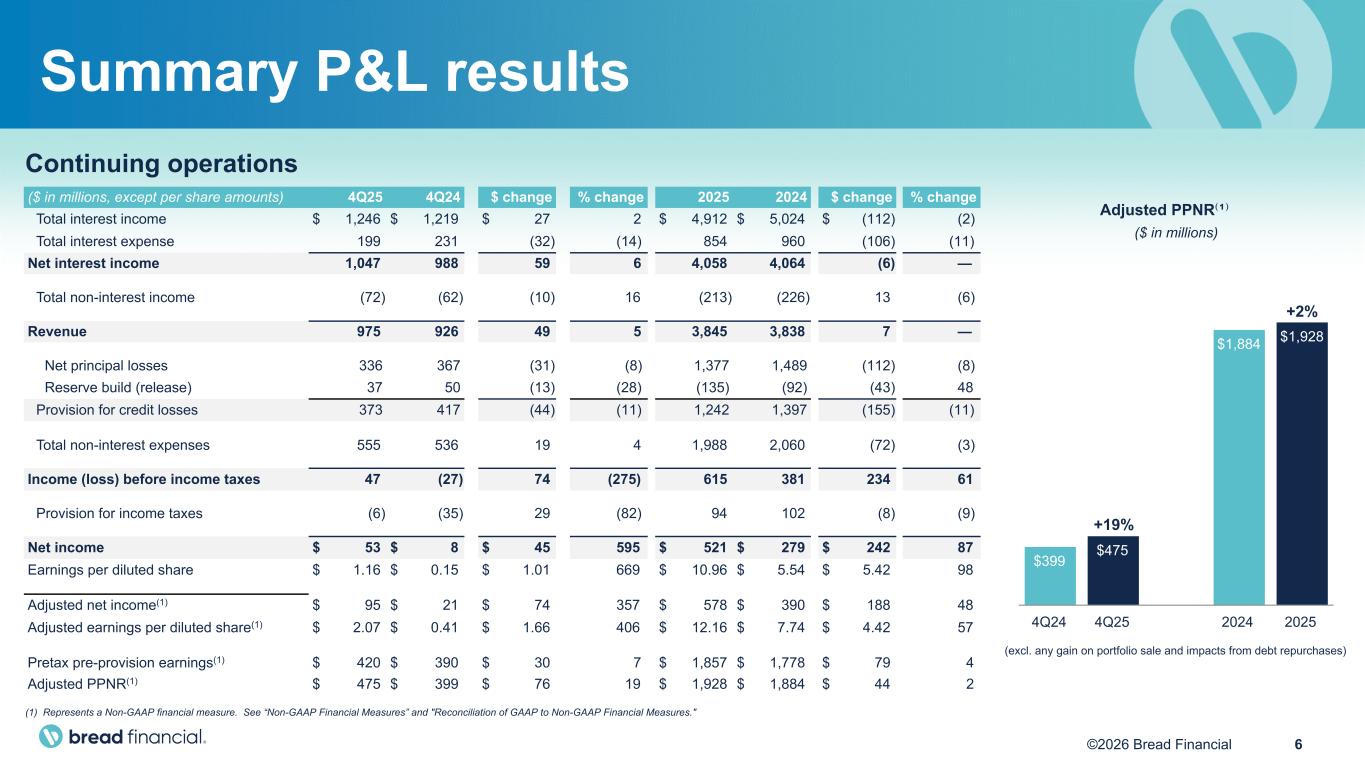
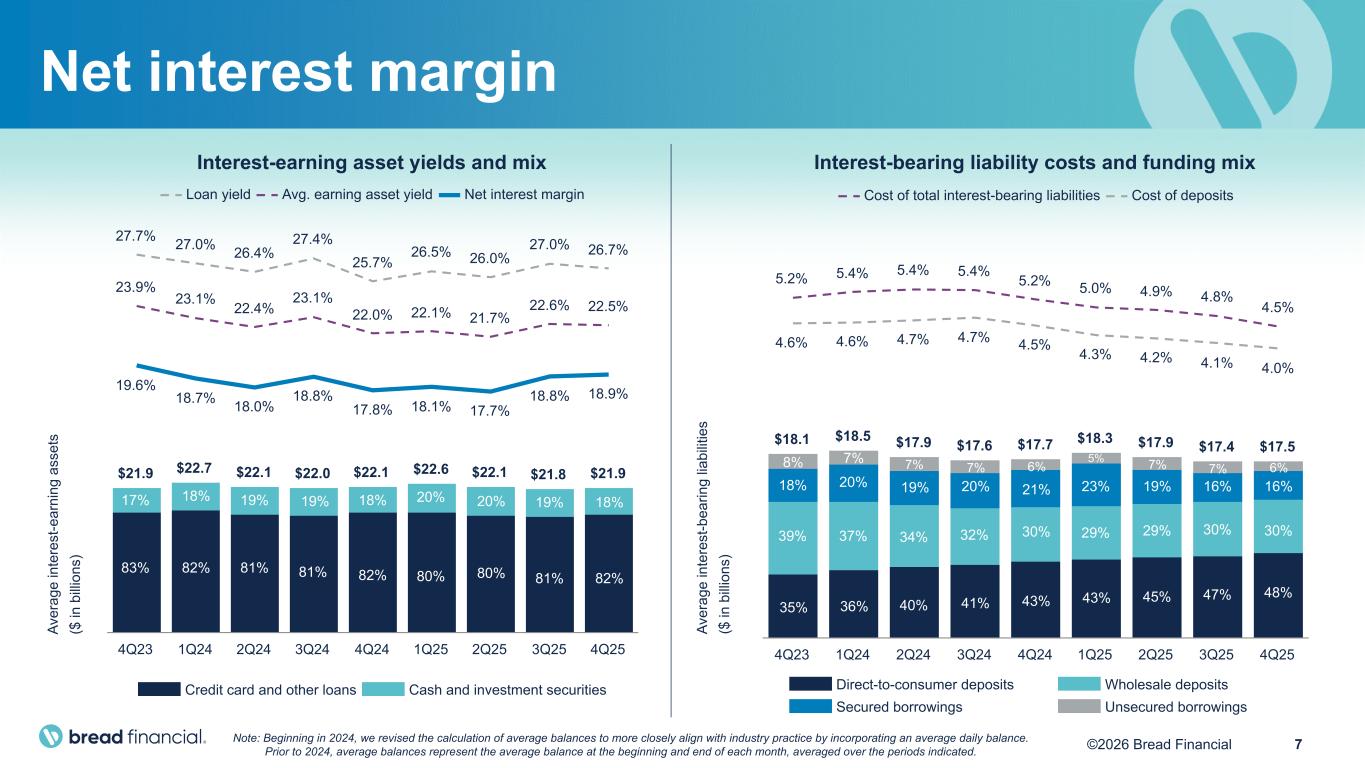
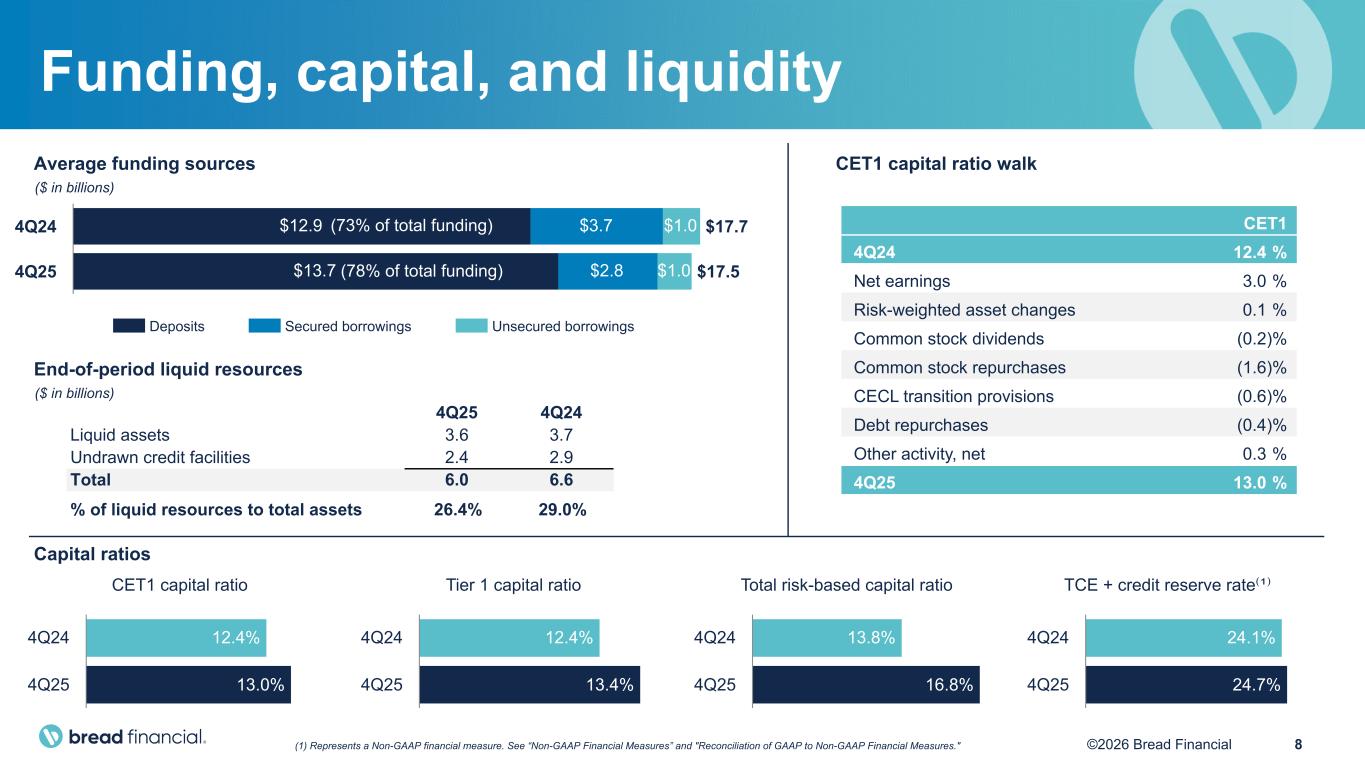
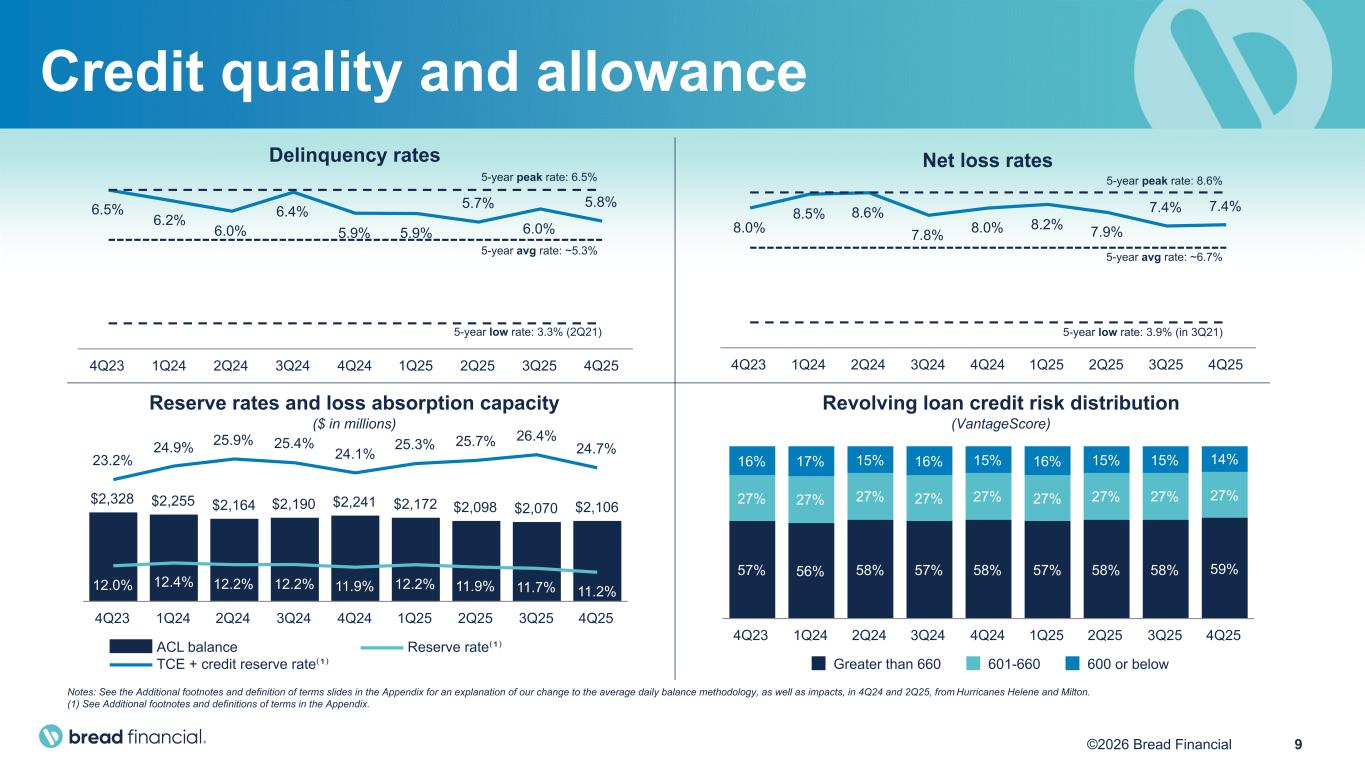
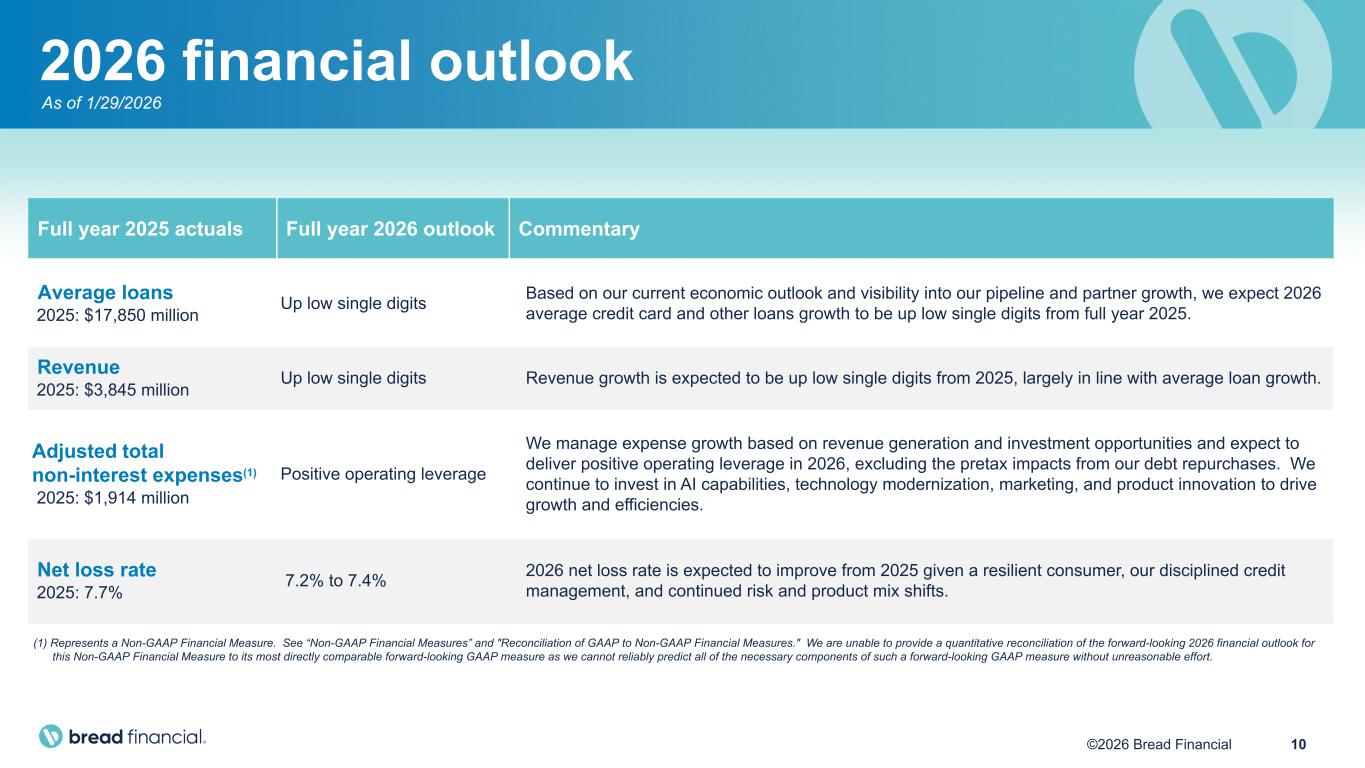
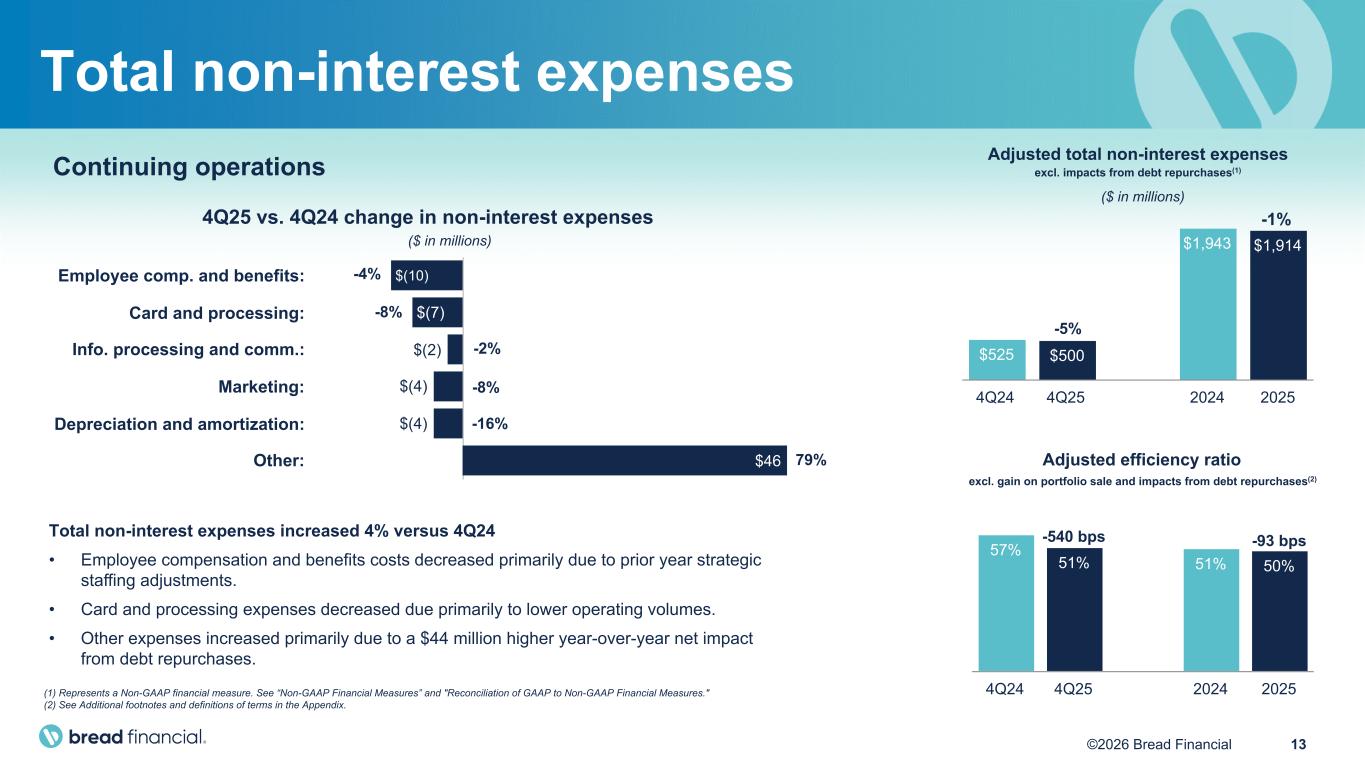
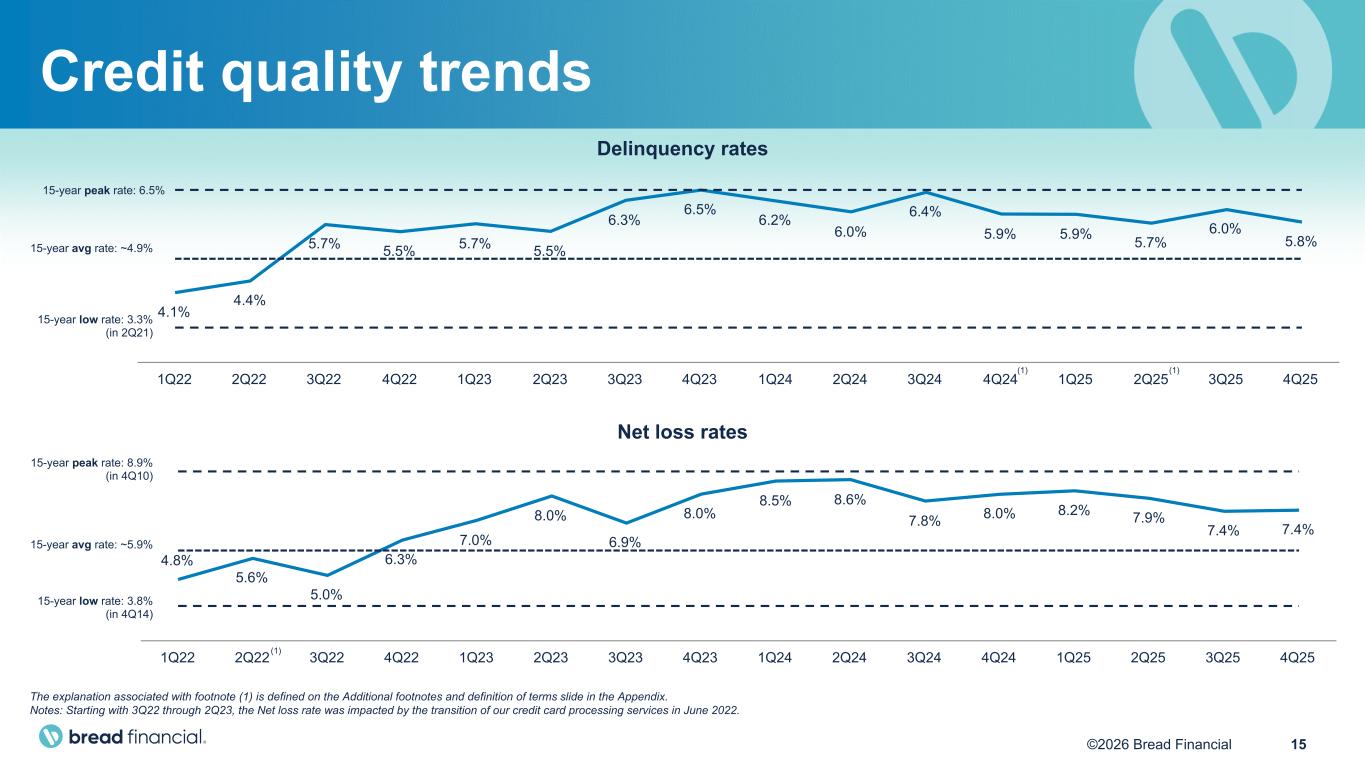
Starting on slide four, I will highlight our full-year 2025 financial performance. During the year, credit sales of $27.8 billion increased 3% year-over-year. The increase was driven by new partner growth and higher general purpose spending. Average loans of $17.9 billion were down 1%, and end-of-period credit card and other loans of $18.8 billion were nearly flat. Both were pressured by an increase in payment rate. Revenue increased $7 million, primarily due to the benefit of pricing changes and paper statement fees, partially offset by lower-billed late fees resulting from lower delinquencies. Total non-interest expenses decreased $72 million, or 3%, driven by a $43 million lower year-over-year net impact from debt repurchases. Excluding the impacts from our debt repurchases, adjusted total non-interest expenses decreased $29 million, or 1%, driven by benefits from our continued focus on operational excellence initiatives. Income from continuing operations increased $242 million, or 87% in 2025, benefiting from lower provision for credit losses and lower debt repurchase impacts. Excluding the impacts from our debt repurchases, adjusted income from continuing operations increased $188 million, or 48%. Adjusted pre-tax, pre-provision earnings, or adjusted PPNR, which excludes any gain on portfolio sales and impacts from debt repurchases, increased $44 million, or 2%. Moving to slide five, I will briefly highlight our fourth quarter performance. During the quarter, credit sales of $8.1 billion increased 2% year-over-year, while average loans of $18.0 billion decreased 1%, and end-of-period loans of $18.8 billion were nearly flat year-over-year. The various drivers for fourth-quarter credit sales and loans were consistent with the full-year drivers I previously mentioned. Revenue increased $49 million of 5%, primarily reflecting the implementation of pricing changes partially offset by lower bill late fees and higher retailer share arrangements. Total non-interest expenses increased $19 million, or 4%, primarily driven by a $44 million higher year-over-year net impact from debt repurchases. Excluding these impacts, adjusted total non-interest expenses decreased $25 million, or 5% driven by benefits from our continuing focus on operational excellence initiatives. Income from continuing operations increased $45 million, primarily driven by higher net interest income and lower provision for credit losses, partially offset by the impacts from our debt repurchases. Excluding the impact from our debt repurchases, adjusted income from continuing and operations increased $74 million. To read the financials in more detail on slide six, fourth quarter total net interest income increased 6% year-over-year driven by the gradual build of our pricing changes and lower interest expense. Non-interest income was $10 million lower year-over-year in the fourth quarter driven by higher retailer share arrangements partially offset by paper statement fees. Moving to total non-interest expense variances, which can be seen on slide 13 in the appendix, employee compensation and benefits costs decreased $10 million, primarily due to strategic staffing adjustments in the prior year. Card and processing expenses decreased $7 million, due primarily to lower operating volumes, including letter and statement costs. Other expenses increased $46 million, primarily due to the impact of debt repurchases that I previously mentioned. Adjusted PPNR for the quarter increased 19% year over year. Turning to slide 7, net interest margin of 18.9% increased compared to the fourth quarter of last year due to the continued gradual build of pricing changes, as well as lower funding costs resulting from our opportunistic debt actions and growth in direct-to-consumer deposits. We expect these tailwinds to continue into 2026, offset by pressure from an anticipated lower prime rate, the ongoing gradual improvement in our payment and delinquency rate trends, which will result in fewer billed LACEs, and a continued shift in product and risk mix, which helps lower credit losses but often comes with lower revenue yield. On the funding side, we are seeing interest expense decrease as our cost of funds benefits from growing our direct-to-consumer deposits and reducing and refinancing our debt. With our rating AC upgrades in the fourth quarter of 2025, we opportunistically issued a $500 million senior note at 6.75% and fully paid down our $900 million, 9.75% senior note. With this refinancing, we reduced our rate by 300 basis points and reduced the size of the note by $400 million, resulting in continued overall improvement in our cost of funds. Moving to slide eight, our liquidity position remains strong. The total liquid assets and undrawn credit facilities were $6.0 billion at the end of the quarter, representing 26.4% of total assets. At quarter end, deposits comprise 78% of our total funding, with the majority being FDIC-insured direct-to-consumer deposits. Shifting to capital, we ended the quarter with a CET1 ratio of 13.0%, up 60 basis points compared to last year. As you can see in the upper right table, our CET1 ratio benefited by 300 basis points from core earnings. The repurchase of $310 million in common shares and common stock dividends of $40 million over the past year reduced our capital ratios by 180 basis points. The last CECL phase-in adjustment occurred in the first quarter of 2025, resulting in a 60 basis point reduction to our ratio. Additionally, the impact from debt repurchases accounted for approximately 40 basis points of impact to CET1 since the fourth quarter of 2024. Finally, our total loss absorption capacity comprising total company tangible common equity plus credit reserves ended the quarter at 24.7% of total loans, demonstrating a strong margin of safety should more adverse economic conditions arise. We have a proven track record of accreting capital and generating strong cash flow through challenging economic environments. We've demonstrated our commitment to optimizing our capital structure through the issuance of preferred equity and support aid debt and appropriately returning capital to shareholders. During the fourth quarter, we issued $75 million of preferred shares, adding to our Tier 1 capital, providing additional capital flexibility. We will continue to opportunistically optimize our capital structure, which may include issuing additional preferred shares in the future. Our commitment to prudently return excess capital to shareholders is evidenced by our share repurchase activity and the 10% increase in our common share dividend in the fourth quarter. In 2025, we repurchased 5.7 million common shares at an average price of $54, which was below our year-end tangible book value per share. We remain well-positioned from a capital, liquidity, and reserve perspective, providing stability and flexibility to successfully navigate an ever-changing economic environment while delivering value to our shareholders. Moving to credit on slide nine, our delinquency rate for the fourth quarter was 5.8%, down 10 basis points from last year, and down 20 basis points sequentially. Our net loss rate was 7.4%, down 60 basis points from last year, and flat sequentially. Credit metrics continue to benefit from our multi-year credit actions, ongoing product mix shift, and overall consumer resilience. The fourth quarter reserve rate improved 70 basis points year-over-year to 11.2% as a result of our improving credit metrics and higher quality new vintages. Compared to prior quarter, the reserve rate declined 50 basis points impacted by higher seasonal transaction balances related to seasonal holiday spend and gradual credit quality improvements. We continue to maintain prudent weightings on the economic scenarios in our credit reserve modeling, given the wide range of potential macroeconomic outcomes. Our weightings remained unchanged again this quarter. As a reminder, the reserve rate typically increases sequentially in the first quarter as holiday transactor balances pay down. We are pleased with our year-over-year improvement in credit metrics driven by our discipline, credit risk management, and product diversification. As you can see on the bottom right chart, the percentage of cardholders with a greater than 660 prime credit score of 59% remain fairly steady both year-over-year and sequentially. We're going to slide 10 at our full-year 2026 financial outlook. Our 2026 outlook is based on continued consumer resilience, inflation remaining above the Federal Reserve target rate of 2%, and a generally stable labor market. Our outlook also anticipates interest rate decreases by the Federal Reserve, which will modestly pressure total net interest income. Note, as we remain slightly asset sensitive, a lower recent and future Fed and prime rate will pressure NIM as our variable rate assets repriced faster than our liabilities. As Ralph mentioned, we believe we are nearing an inflection point for loan growth. We expect full year 2026 average credit card and other loans growth growth to be up low single digits compared to 2025. Growth will be supported by our stable partner base and new business launches, building credit sales growth and continued credit loss rate improvement, partially offset by strong cardholder payment rates. Total revenue growth is anticipated to be up low single digits, largely in line with average loan growth. Net interest margin has a wide range of potential outcomes, given that it is impacted by many variables. Our baseline estimates have full-year net interest margin near to slightly above the full-year 2025 rate as a result of continued benefits from implemented pricing changes and improving costs to funds, offset by interest rate reductions by the Federal Reserve, lower billed fees from improving delinquencies, and a continued shift in risk and product mix. For non-interest income, we would expect higher retail share arrangements, or RSAs, as a result of higher sales, implemented pricing changes, and lower credit losses. We manage expense growth based on revenue generation and investment opportunities and expect to deliver positive operating leverage in 2026, excluding the pre-tax impacts from debt repurchases. We will continue to invest in technology modernization and product innovation, including AI, to drive growth and efficiencies. The degree of positive operating leverage will be macro-dependent and related to credit improvement, loan growth, and the pace and timing of further Fed interest cuts. For the first quarter of 2026, we expect total expenses, less costs associated with debt repurchases, to be down slightly sequentially from the fourth quarter adjusted expense figure of $500 million. We anticipate a year-over-year net loss rate in the 7.2% to 7.4% range for 2026. This range contemplates stable to improving macroeconomic conditions, continued risk and product mix shifts, and a resilient consumer. We are seeing good momentum going into 2026, which is a positive sign for continued improvement in the early part of the year. Given the less predictable nature of how consumers will respond to changing macroeconomic conditions, Sustaining this momentum and the degree of improvement through the entirety of the year is less certain at this time. We expect our full-year normalized effective tax rates to be in the range of 25% to 27% with quarter-to-quarter variability due to the timing of certain discrete items. The progress we made in 2025 along with our 2026 financial outlooks puts us on a path to achieve our longer-term, mid-20% ROTC target in the coming years. The key drivers of improvement include, first, generating responsible, sustainable growth while delivering on our efficiency initiatives, which leads to higher PPNR. Second, gradual improvements in our credit metrics closer to our historical loss rate level, leading to a lower provision for credit losses. And third, executing on our opportunities for additional capital optimization, including potentially issuing additional preferred shares. We are proud of the results we achieved in 2025 and expect to build upon our momentum as we enter 2026. Now, I will turn it back over to Ralph to review our 2026 focus areas.
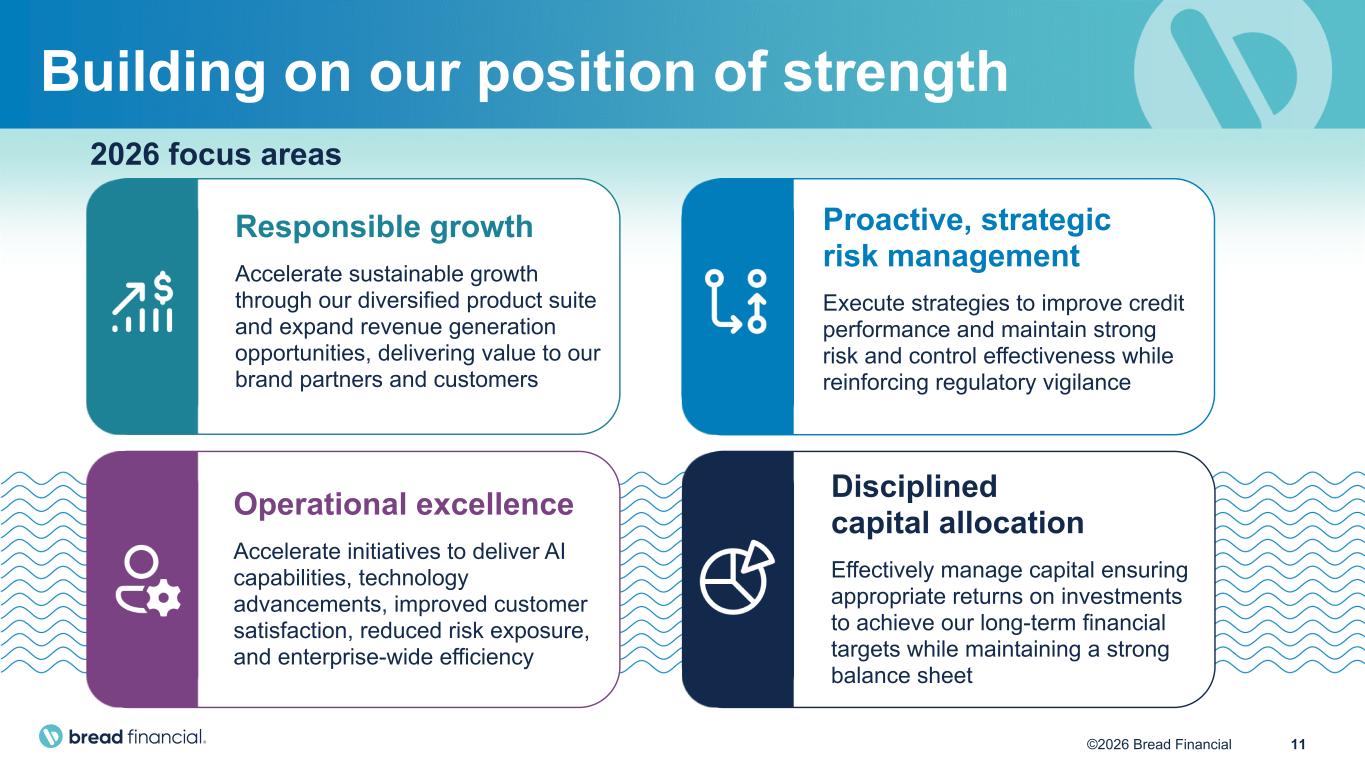
Thanks, Perry. Before we open it up for questions, I'm going to discuss a refreshed view of our focus areas as seen on slide 11. Our focus areas for 2026 is designed to capitalize on our strengths while fortifying our business to help offset any potential external pressures. While our focus areas have remained fairly consistent over the last few years, they continue to evolve with our transformation and the ever-changing business environment. First, our commitment to responsible growth will not change. The work we have done to expand our product suite while enhancing our product capabilities, along with improving consumer health, gives us confidence we can accelerate sustainable, profitable growth. Second, the proactive strategic execution of a disciplined credit management framework has been a key to the gradual improvement of our credit performance metrics. We proactively adopt our sophisticated models to effectively balance risk and reward and manage changes in a macroeconomic environment. In addition, we will continue to maintain strong risk and control effectiveness while reinforcing regulatory vigilance. Third, our operational excellence efforts have become part of our culture and are embedded across our business. This year, our initiatives will deliver AI capabilities, technology investments, improved customer satisfaction, reduced risk exposure, and enterprise-wide efficiency. Finally, supported by strong capital levels and cash flow generation, we are well positioned to execute on our capital and growth priorities while delivering sustainable long-term value for our shareholders. Our ongoing commitment to effectively manage capital will ensure appropriate returns on investments and help us achieve our long-term financial targets. In summary, our experienced leadership team remains focused on generating strong returns through prudent capital and risk management. This reflects our unwavering commitment to drive sustainable, profitable growth and build long-term value for our shareholders and other stakeholders. throughout dynamic, economic, and regulatory environments. Operator, we are now ready to open up the lines for questions.
Operator
Thank you, ladies and gentlemen. If you would like to ask a question, please press star 11 on your telephone keypad now. If you change your mind, please press star 11 again. When preparing to ask your question, please ensure that your phone line is unmuted locally. One moment for our first question. The question comes from Sanjay Sakharan with KBW. Your line is open.
Thank you. Good morning, and congratulations on navigating through a challenging year for you guys. Maybe just first a two-part question on loan growth. One, obviously very encouraging that we're starting to see a pickup in loan growth into 2026. I'm just curious, as we think about what's driving that growth, I know you guys mentioned sort of the stability of the partnership base and continuing to grow with them, but is there any sort of loosening of underwriting standards? I'm just curious what kind of appetite you're seeing from consumers out there. And then secondly, I was just looking at slide 14 in your deck, and I see bread pay still kind of small piece of the total. I'm just curious, would buy now, pay later growing? Do you anticipate growing that a little bit more in 2026?
Hey, Sanjay, how are you, Charles? You know, I think you answered part of my question. I think if you look at the pendants of loan growth, you know, it's really the resilient consumer, you know, sales momentum we're seeing as we go into the year. You know, you mentioned it, you know, partner stability and new partners that we're adding and improving credit. And you know, we're not doing anything out of the ordinary. We are underwriting the way we've always underwriting. We underwrite for profit. We make sure that it's awful underwriting so there's not a general loosening. It's a gradual look as credit improves. And that's how we've underwritten in the past, that's how we'll underwrite in the future. So nothing unusual there. In terms of bread pay, I expect bread pay volume to pick up. We've added some really good partners. I mentioned, you know, Cricket and Vivint, which is, you know, home security. Those are really good popular partners. We add partners to the BreadPay platform on a pretty regular basis. We've got a good handle around underwriting on that platform as well. So, we expect that to also improve in 2026.
Great. And then just a follow-up on credit quality. Understood, you know, you guys are seeing the improvement and sort of the tightening on writing. You know, I know the labor market seems pretty stable, but underneath it all, every day you're hearing about layoffs and such. I mean, are you guys seeing anything in your data that sort of leads you to believe that there might be stuff happening underneath the surface that might be choppier, or do you feel like your customers and your ability to underwrite are generally in a good place?
Speaker 7
Thanks, Anjan. This is Perry. You know, so I think when we look at it overall, we are encouraged by what we're seeing in our underlying data. You know, when we look at our roll rates while they're still elevated, you know, versus where they – where we'd like to have them, we're pleased with the improvements that we continue to see across all our vantage risk bands, and now they're starting to follow more normal seasonal trends. And the key here, though, you know, our early entry rate that we see is now below the pre-pandemic levels. And to your point, that's a lot due to the strategic actions we've taken, the product mix shifts and things of that nature. But we're also observing improvement in our late-stage roll rates. And that's what we called out early on. In order for our losses to continue to improve, we need to see that improve. So we're seeing that improvement. So, you know, for lots of the reasons you mentioned, we feel pretty encouraged that the consumer has been resilient. And, you know, while there could be pressures out there in the economy, overall, I think we're net constructive on it.
Operator
Okay, great. One moment for our next question. The question comes from Moshe Ornbudge with TD Cowan. Your line is open. Great.
One of the things in terms of, Ralph, you talked a little bit about, you know, kind of a new T&E product. And if you look, actually, in the, you know, in your slide 14, you've got that's one of the categories that, you know, that's been a big contributor both to volume and balance Could you talk a little bit about, you know, kind of where you sit in there both in terms of partners and proprietary products?
So, you know, we have an array of products. Obviously, Caesars has been a longtime partner, and we've been able to, you know, introduce new products over time with Caesars, and the one we've just introduced is the fee-based products would give their customers, you know, both our customers access to, you know, better rewards and experiences. And, you know, that's really consistent in the marketplace with high-end co-brand cards. You know, AAA is a partner of ours, and that's a really – that's a T&E card. We're seeing good spend in AAA, particularly we saw that in the fourth quarter of 2020 – of 2025. And, you know, one of our proprietary cards is really focused around rewards and redemption around rewards for travel. So, you know, we're able to offer our customers and our partners' customers, you know, that array of travel rewards. And it's become a really, you know, a good vertical for us in terms of volume. And like I said, it's, you know, in the fourth quarter, it was up substantially from the fourth quarter of 2024. And, you know, we continue to focus on, you know, good partners that give us good returns in that category. Thanks.
And maybe for the issue, you mentioned that net interest income should grow, you know, kind of around the same rate as you see in loan growth. Perry, could you just drill into that a little more, maybe talk about the puts and takes of things, because obviously, you know, you are expecting better credits, so that will have an impact on, you know, on late fees. You've got, you know, your pricing still rolling in. And obviously, you know, at the same time, you've also got, you know, a gradually lower interest rate. So just talk about all of that, how it kind of fits into that dynamic.
Speaker 7
It happens to be so, right? So you think about it, and then you've laid out a number of the elements. You know, so as we look in the next year, you know, we said right now we expect it to be pretty stable to slightly up versus 2025 on a full-year basis. And some of it's going to be dependent upon the timing and the number of prime rate reductions. You know, as we are currently asset sensitive, we'll get a little bit of a compression on that. We do expect to see continued lower billed late fees as delinquency and the product mix improves. And then as you, you know, kind of hit on this a little bit around whether it's co-brain and more proprietary or installment lending, The shift in new account production, and that results in overall product mix shift, while it lowers risk, it also means often having a lower APR because of the risk-based price, and that also means lower late fees associated with those accounts. As well, we'll have a little bit higher average cash mix in the year, and some of it's resulting, you know, the timing of when loan growth happens and some other things that we're caring for. And then, you know, the tailwinds, you also note that the continued, I'll say, working through the pricing changes that have been made from in 2004 and 2025. And then, you know, as gross losses do improve, we do have then some slower or better reversal of interest and fees. There's also a catch-up period where the lower billed fees, then you actually do end up with less of that benefit out there in the later quarter. So, you know, a lot of this is going to be variable by quarter, you know, the time of gross losses, the building of those pricing changes, and then, as I mentioned, the primary. And then I would note, though, as well, on the revenue side, as origination starts to pick up and profitability improves, the RSA, meaning the retail share arrangements that we have with the brand partners or customer awards, those will also become elevated as there's more profit to share and then the originations drive more the compensation for them as well.
Operator
Great. Thanks, Perry. I want to run over for our next question. This comes from John Heck with Jeffries. Your line is open.
Morning, guys. Thanks very much and congratulations on a productive year. The direct-to-consumer deposits, you guys mentioned It's almost 50% of funding at this point. You know, do you guys have objectives? Where can that go? And then what's the pricing on that versus, you know, the non-DTC deposits?
Speaker 7
Yeah, so we're very pleased with what we've achieved on our deposits. You know, when you think about this, Ralph put out there a goal of being at 50%, and that was under our current contract. Our longer-term goal is more in line with larger peers, which would say that our direct-to-consumer deposits would be probably 70%-plus of our portfolio, however, our total funding, and that will just happen gradually over time. And you should expect our pricing to remain competitive. Again, not having brick-and-mortar branches, we're able to be very competitive and, you know, have some online, you know, with the online presence. And it is still a, you know, better funding rate than we have in other things like our broker CDs of like tenor.
Okay. And then second question, you know, is on the reserve rate, you know, there's been a bridge down from the peak than, you know, and it's coming down a little bit because your credit's improving. What do you – where – what, you know, does it go back to day one levels, or is there any way to think about the direction of travel of the ALL, given that credit is stable and improving?
Speaker 7
Yeah, so, you know, reserve rates are always one of my favorite questions every quarter. But, you know, to your point, with the fourth quarter reserve rate at 11.2 percent, that's down 70 basis points versus the prior year and down 50 basis points one quarter. And the reserve rate so far has improved solely as a function of improving credit metrics. So, as I noted, we have maintained a what we call prudent credit risk overlay. We didn't change any of our risk weightings. And there's still a lot of uncertainty about how the tariffs will unfold. And, you know, even the Fed yesterday mentioned that they expect those impacts to peak kind of midway through this year. So we're watching that and what that means to our consumers. So, you know, we're going to continue to watch that. but candidly pretty optimistic that as these play out in the coming months that we'll be able to gradually move our weightings of the adverse and severely adverse scenarios and move our ways more to what I'll call a neutral position over time. You know, we'll continue to see the first quarter reserve rate increase seasonally as holiday transactors roll off. But the way I think about the reserve rate, you know, as you think about how it's going to traverse through the rest of this year and into next year, it'll follow the trajectory largely of the credit quality. So as credit quality, delinquency improves, the reserve rates should come down accordingly, and then as we're able to move that, those risk weights back to neutral, we'll get somewhere around, we've said around that 10% area. Over time, I'm not sure we get all the way back to day one because it's a different portfolio and we have a different philosophy on how to look at some of the risk weighting, so different scenarios.
Great. Thanks so much for the color. Cool.
Operator
One moment for our next question. The question comes from Mahir Bhatia with Bank of America. Your line is open. Hi.
Good morning. Thank you for taking my question. First, I just want to talk about credit. You're clearly making progress. You've tied in credit, and you're making progress getting back to your 6%, I think, target. I guess the question is, is this really a priority for you in the near term, or are you just comfortable being here in the 7% range and you're back to growth? Just trying to understand the balance between how much you'd lean in on growth versus get back to your longer-term target, if you will, on credit.
Speaker 7
Yeah, I appreciate the question. I'd say it's a priority to get back to 6% over time but not force it there. And we've talked about this previously, that we could choke off credit and really do things that would be detrimental to our brand partners and our customers. And we have been very disciplined that, again, our underwriting philosophy, you first talked about this, we underwrite for profit. You know, we have industry-leading ROTCs on this, and, you know, we're trying to get down towards that 6%. We underwrite each new vintage with that in mind, but we have an existing portfolio that, you know, is in the condition it's in because of the macro environment. We're paid for the risk we take. You know, again, we didn't, you know, swing the pendulum overly hard on credit tightening to the existing portfolio by dramatically reducing lines. I think you've seen, you know, others in the industry have swung one way. Now they're doing this loosening thing. Like you heard Ralph talk about, we're gradually, dynamically underwriting every day. And so when the credit quality is better, you underwrite deeper, you stop the line increases, and when it doesn't, they're low risk, you tighten. So it's a dynamic thing.
So we're not forcing our way down. it'll happen naturally with the newer vids just coming in and the existing corporate is backfield healing and so it's gonna take time got it so that makes sense and then maybe just going to the 2026 outlook I mean you can revenues 5% this quarter it is obviously help probably by like just an easier comp here is that like the main driver of the slowdown from 5% to low singles in your guidance, or is there something else also going on that we should keep in mind? Maybe just walk through some of the puts and takes on that line, on the revenue line, Adam.
Speaker 7
Yeah, I think when you look at the comparable period to fourth quarter of 2024, we had done some accommodations through fee waivers, interest waivers, as it related to the hurricanes in that season. So those modifications were in that comp. So that's a piece of why the quarter comp is a little higher than what ordinarily it should be. So I look more at, you know, the rate of NIM that we have this quarter, and then how does that then extrapolate forward into the coming year. And as we said, with all the puts and takes, we think that, you know, we should be able to deliver a stable to, you know, slightly up that interest margin.
Operator
Got it. One moment for our next question. Next question comes from Jeff Adelson with Morgan Stanley. Your line is open.
Hey, good morning, Ralph and Perry. Perry, maybe just to dig a little bit on the NIM further, appreciate all the color and the puts and the take. You know, NIM expected to be slightly higher this year. If I look at where you exited 25, and, you know, if we put aside some of the benefit you've gotten on funding costs, your loan yield was really strong in the fourth quarter in light of what is typically a weaker seasonal quarter as you see more of those transactors come into the mix. So could you maybe just unpack a little further what drove some of that underlying strength? Was there maybe a little bit more of a step up in the pricing changes, or was it more just that underlying reversal rate improving? And, you know, as we think about those pricing changes continuing to build their way in, you know, how much of the book is now reflecting that, and how long can that tail last for you? Do you expect that might slow as we exit 2026, or how should we be thinking about that benefit from here? Yeah.
Speaker 7
Yeah, so, again, I'm not going to reiterate all the puts and takes, so I think that you've got those. But you're right on the way to think about this is that we do have some tailwinds that are building through slowly and gradually as it relates to the pricing changes. Largely, the pricing changes are complete for, you know, what has been pulled through the portfolio. Now it's just a matter of the payment allocation working its way through. But largely, you'll continue to see a little bit of that gradual benefit from that, but that could be offset by product mix and how the new vintage looks when the final construction of the year comes through. So the end of 2026 will look different than right now, just in terms of portfolio mix. But on a static basis, I'd say, yes, you've got some of the tailwind from those pricing changes that will continue to ease into the book. But, again, some of that will be offset in the RSA line as more of that is shared with the brand partners through the profit share.
Got it. That's helpful. And just, you know, going back to credit, maybe just focusing on the delinquencies a bit, you know, I appreciate the commentary on NCOs and the rural rates improving. I think we've started to see your delinquency rate come a little bit more in line with seasonality, Still improving, obviously, year over year, but maybe at a bit of a slower pace. Just what's the path from here on delinquencies as you look at the end of 26 from here? Is that something you think will continue to improve or will it start to flatten out a little bit? And how are you factoring in the benefit for larger tax refunds this year in your outlook for credit?
Speaker 7
Yeah, so that's a good one. And I'm starting with the last piece of that is the tax refund is a little bit of the unknown in terms of how will customers use it. Like, I tell you, you know, we're optimistic that the 2026 tax, you know, refund season is going to be a positive. You know, we're not exactly sure how that's going to play out. In any year, it's always a guess in terms of how consumers are going to use it, whether they're going to use it to pay down debt, which obviously will improve our delinquency a little bit. Are they going to spend it? are they going to save it? But net, we believe it to be a positive, you know, with the tax refund plus the fact that, you know, they probably didn't, everybody didn't adjust their tax withholding. So overall, you know, we have, even despite, I say, lower consumer confidence out there, we think that the, we're going to see some improvement on that front. We, I say our guide cares for a modest bit of improvement, but, you know, let's hope for something better. Now, the government shutdown could put a little bit of a twist into that, so we'll have to monitor that. You know, when we look at it, I think overall we're thinking that we're going to get back to where that what's called DAU delinquency rate where it's going to flatten out some. You know, again, slow, gradual improvement. Some of it will be product mix dependent. Again, the thing that we're most watchful of is continued improvement in those late-stage roll rates because that's going to manifest itself really into the better loss outcomes.
Operator
One moment for our next question. Next question comes from John Pancari with Evercore. Your line is open.
Morning. On the operating leverage standpoint, you're guiding the positive operating leverage in 26 on top of what was, you know, a solid expense beat for the fourth quarter. Can you maybe help us think about the magnitude that you think is likely in terms of the operating leverage? You achieved 100 basis points or so in 25. Fair to assume we can remain at that pace as we look at 26?
Speaker 7
Thank you for the question. Yeah, we're really pleased with the progress that was made in 2025. You know, as Ralph has talked about, and I have as well, that, you know, our organization is really focused on operational excellence. And you think about what that means for us. It's driving continuous improvement savings. We're executing across a whole spectrum of transformation. This is around technology, servicing, collections, marketing, looking for new revenue opportunities. So all of this enabled us to accelerate and, you know, figure out how to do things better. And you think about the use and deployment of AI, that's going to unlock even greater value. Again, there's some investment that goes along with that, but we're very use case focused, so that's going to evolve. So I think overall, the degree of operating leverage is going to end up being largely dependent on macro conditions impacting the revenue side of it. So, loan growth higher or lower in the range, you know, what does it mean, the Fed cuts, the delinquency improvement resulting in lower late fees. So, you know, the op leverage, I think, is more on the, as I said, the revenue side. On the expense side, we've got that, you know, well in hand. We'll deliver positive operations. Yep, sir.
Okay, thanks. And then separately on the buyback front, you bought back $120 million in the fourth quarter. Here is CET1, you know, a solid at around 13%. Could you maybe help us think about the reasonable pace of buybacks as you look at this year in terms of, you know, factoring in the loan growth expectations but also the capital generation?
Speaker 7
Yeah, I think as you look at the year, as Ralph said, you know, we generate a lot of capital. And we're very proud of where we've landed with our capital ratios and targets. You heard me talk about the last phase in a CECL this last first quarter. That was 60 basis points. RWA will come down in the first quarter seasonally. So, again, we're focused on the capital targets that we set. And as we work through this coming year, we do have $240 million remaining share repurchases available. The pace will be dependent on loan growth and capital in excess of those stated capital targets.
Operator
For our next question, it comes from Reggie Smith with J.P. Morgan. Your line is open.
Hey, good morning, and thanks for taking the question. I see you guys are advertising or offering personal loans on your website. I was curious, I guess, your appetite for that, you know, channel and that business and how large that business is today, and maybe talk a little bit about the economics of that versus your core private label co-brand business that I have a follow-up?
Yeah, you know, we have, you know, we have many products in the marketplace, and, you know, private label is just one of them. I think if you look at us over the last five years, we've evolved to, you know, all these products, co-brand and buy now, pay later, and obviously personal loans. And, you know, the macroeconomic environment is going to dictate, you know, how we, you know, wade into, you know, into personal loans. We're going to support growth first. And personal loans is just a part of our growth equation.
And then – But it's a good way for us to acquire new customers.
Yeah. Is there any way to kind of size and frame that? And do you hold those loans on balance sheet? Like, where does that show up in your volume?
Yeah, it's part of our loans. And personal loans have different tenors, obviously. It's a small portion of what we're doing. It's currently small. And, you know, it'll grow gradually over time. And we'll, like every other product we enter into, we'll enter into it responsibly and manage it and be thoughtful about how we grow with personal loans. But it's on our balance sheet. Okay, cool.
And then I guess one, you know, kind of bigger picture question about AI and thinking about, you know, like how it may transform the business operationally or underwriting. You know, if I look out five years or so, like how do you think AI impacts the car-issuing business? Like where should we look for the most progress? And I would imagine it probably impacts, like, your variable headcount need. But I don't know, like, maybe talk a little bit about that and how those tools can help you get more out of what you have your employee base today.
Speaker 7
Reggie, thank you for the question on AI. It's certainly one that we think a lot about. We have a team of leaders, and there are people figuring out how to deploy it. But, you know, I'll tell you, for our company, you know, we continue to deploy AI responsibly across the enterprise to accelerate operational excellence, which includes increasing productivity, efficiency, driving innovation, strengthening our risk management. And so recall, for our company, we've leaned in on emerging technology, including AI, for years. And in doing so, we've established a solid governance model early on to ensure responsible use and oversight of AI. We have over 200 machine learning models embedded in our business. We've deployed thousands of bots to save over one million hours of manual work efforts. That goes to your point around what does it mean for, you know, people. Deployed call center agent-assisted tools, and that's just a few. So when we look at, you know, at our enterprise AI roadmap, you know, we now have more than 60 initiatives in motion with early wins contributing to improve fraud protection, better underwriting performance, enhanced call center effectiveness, and increased automation in our workflows. So I'd say, you know, we're continuing to build on that solid foundation of risk management through automated controls and leveraging our tools for what we call always-on monitoring. So you think about that, that's already permeating throughout the organization, how we can be more effective. So our go-forward areas of focus are on three basic things. You think about it as first, AI tools to improve what's called personal productivity and efficiency, and that means, like, content summarization, like, for contract and document reviews, content generation for personalized marketing collateral, customer communications, intelligent search capabilities, where it helps the associate folks or customers streamline how they can get an information and knowledge retrieval, turning on controlled use of AI in our SaaS applications that we have, which further enhances platform functionality and output. So that's the first part. And the second, we're going to accelerate development and advancement of our core technology and data platforms, specifically leveraging AI tools to modernize code and accelerate our movement to the cloud. And then the third one is, I think maybe where you're going, is where is commerce going? And so making sure that we are developing intelligent and agentic applications, and that will expand the reach of our products, automate whole processes, and unlock new and improved customer experiences. And that will ensure that we have a foundation of strategic select application for agentic-driven commerce and personalized service, among others. So, you know, overall, what I want you to take away, though, is that there's a lot of investments being made, but they're backed by disciplined value tracking, and we have a strong ROI that we're going to make sure we can deliver more table-stake capability. So, you know, we're moving with pace, rigor, governance, and confidence that you would expect for us as a regulated institution. But we feel real good about how we're being positioned for this.
Now, that sounds very exciting. I hope that we can continue to get little updates and nuggets as you guys progress through, even if they're small, like just to hear how you're using AI and the impact that it's having. And that stat about the man hours was fantastic. So good luck. Yeah, congrats on the quarter.
Operator
One moment for our next question. Our last question comes from Vincent Canetik with VTIG. Your line is open.
Hey, good morning. Thanks for taking my questions. A lot of detail already given, so just two follow-ups. So first on credit sales, and I actually wanted to specifically focus on the better 2026 tax benefits that you were talking about earlier. It does seem like this earnings season so far that there's been some enthusiasm from many of the merchants reporting earnings so far on the sales potential from the tax refund season and the lower tax withholdings. So, I'm wondering if you're seeing more merchant engagement on driving sales this tax refund season and then how you're expecting credit sales to do in 2026.
Yeah, I mean, I think we talked about we'll see credit sales in a low single digits and, you know, it remains to be seen about how people use that tax refund. I'm sure some people use that tax refund, you know, probably savings and investments, you'll see some of that. So some people pay down their debt, and you'll see some people increase their spend. So I think it's going to be across the board. But, you know, the guides we put out in terms of, you know, single-digit growth, we feel very comfortable with that, particularly since credit is trending in the right direction. We have a stable partner base, and the consumer has some resiliency. So we feel good about what we put out there in the marketplace.
Okay, great. And then the second follow-up on Neiman. And specifically wanted to get your thoughts on deposit beta. So it does seem like industry-wide expectations are for lower deposit betas this time, I think around 60%. So I wanted to get your take, your thoughts on your deposit beta. And I guess for the industry, are we seeing just higher competition for deposits, or are consumers more sensitive than historically to deposit rates? Just wanted to get to you.
Speaker 7
No, I think that's a – you kind of hit it right on the head there, right? I think previously we were thinking that deposit beta is probably close to high 70s, right around 80. Now it's probably widened that range a bit to 60 to 80 percent, 80 betas. But that will be market-dependent, as you said. So that's what I think we're going to watch for. But over time, I would expect to probably get back.
Operator
Okay, great. And I'd like to pass the call back over to Ralph Andretta for any closing remarks.
Well, thank you. Thank you all for joining our call today and for your continued interest in Red Financial. And we look forward to speaking with you in the next quarter. Everyone have a terrific day, and thanks again.
Operator
Ladies and gentlemen, this concludes today's presentation. You may now disconnect and have a wonderful day.