Operator
Good day, and welcome to the Hope Bancorp 2026 Second Quarter Earnings Conference Call. All participants will be in listen-only mode. Should you need assistance, please signal a conference specialist by pressing star than zero on your telephone keypad. After today's presentation, there will be an opportunity to ask questions. To ask a question, you may press star than one on your telephone keypad. To withdraw your question, please press star than two. Please note this event is being recorded. I would now like to turn the conference over to Maxime Olivan, Investor Relations Manager. Please go ahead.
Thank you, Drew. Good morning, everyone, and thank you for joining us for the Hope Bancorp Investor Conference Call for the second quarter of 2026. As usual, we will be using a slide presentation to accompany our discussion this morning, which is available on the presentations page of our Investor Relations website. Beginning on slide two, let me start with a brief statement regarding forward-looking remarks. The call today contains forward-looking projections regarding the future financial performance of the company and future events. Forward-looking statements are not guarantees of future performance. Actual outcomes and results may differ materially. Hope Bancorp assumes no obligation to revise any forward-looking projections that may be made on today's call. In addition, some of the information referenced during this call today includes non-GAAP financial measures. For a more detailed description of the risk factors and the reconciliation of GAAP to non-GAAP financial measures, please refer to the company's filings with the SEC, as well as the safe harbor statements in our earnings press release. Presenting for management today will be Kevin Kim, HOPE Bancorp Chairman, President and CEO, and Julianne Abeliska, HOPE Bancorp Chief Financial Officer. Peter Koh, Bank of HOPE President and Chief Operating Officer is also here with us as usual and will be available for the Q&A session. With that, let me turn the call over to Kevin Kim.
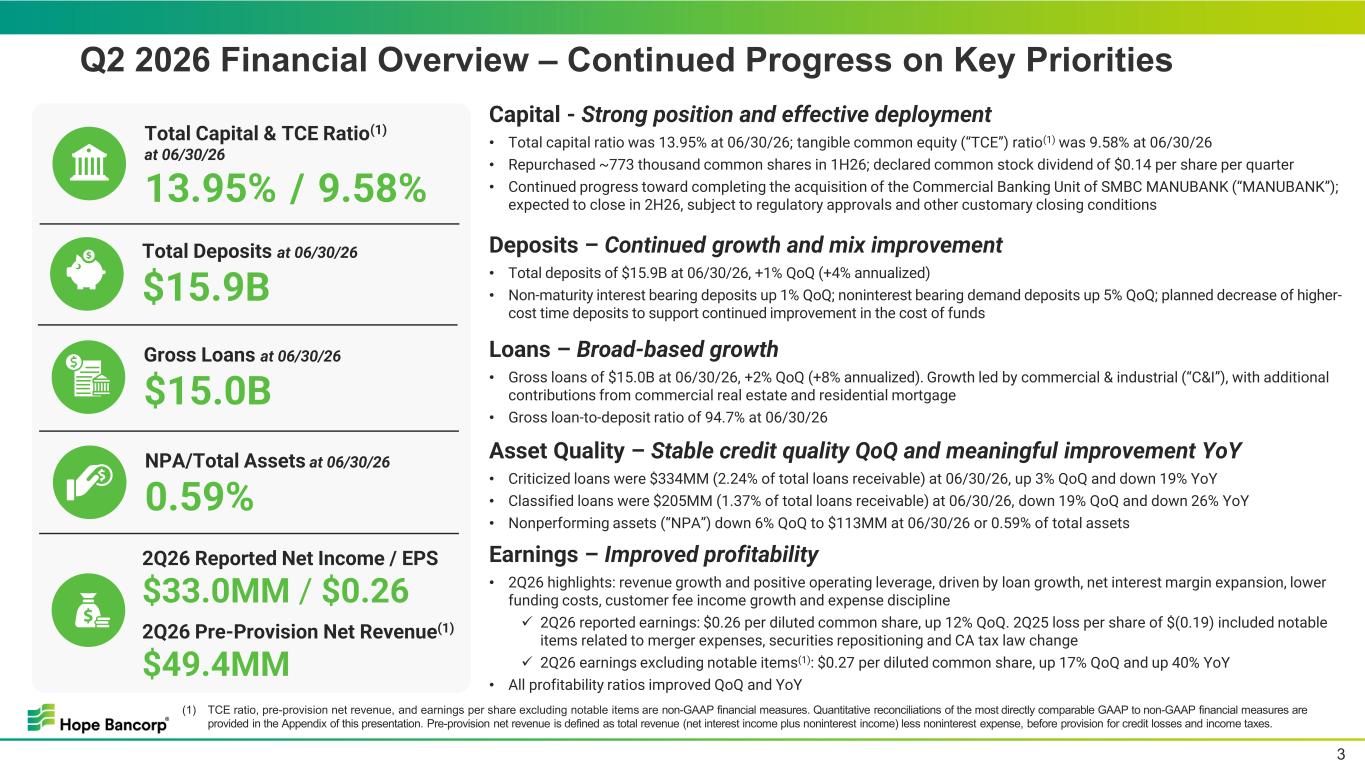
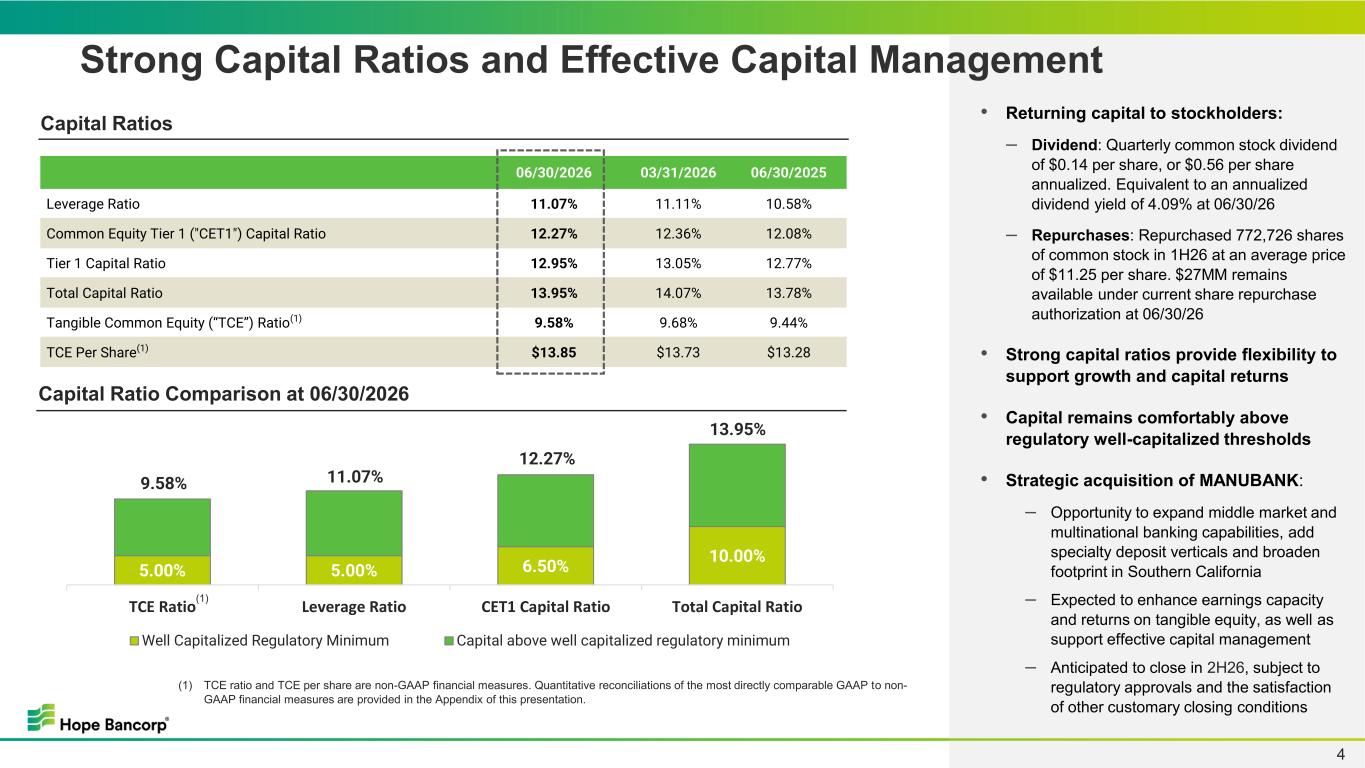
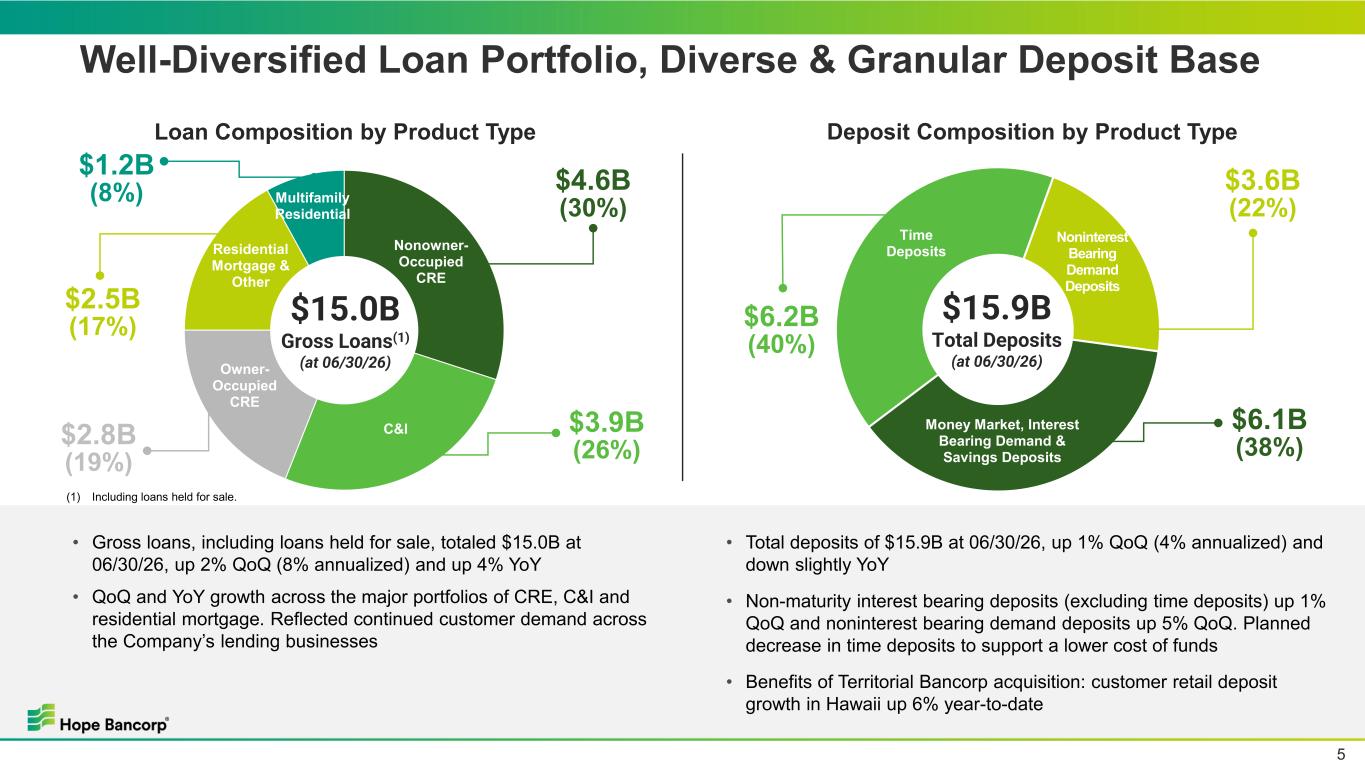
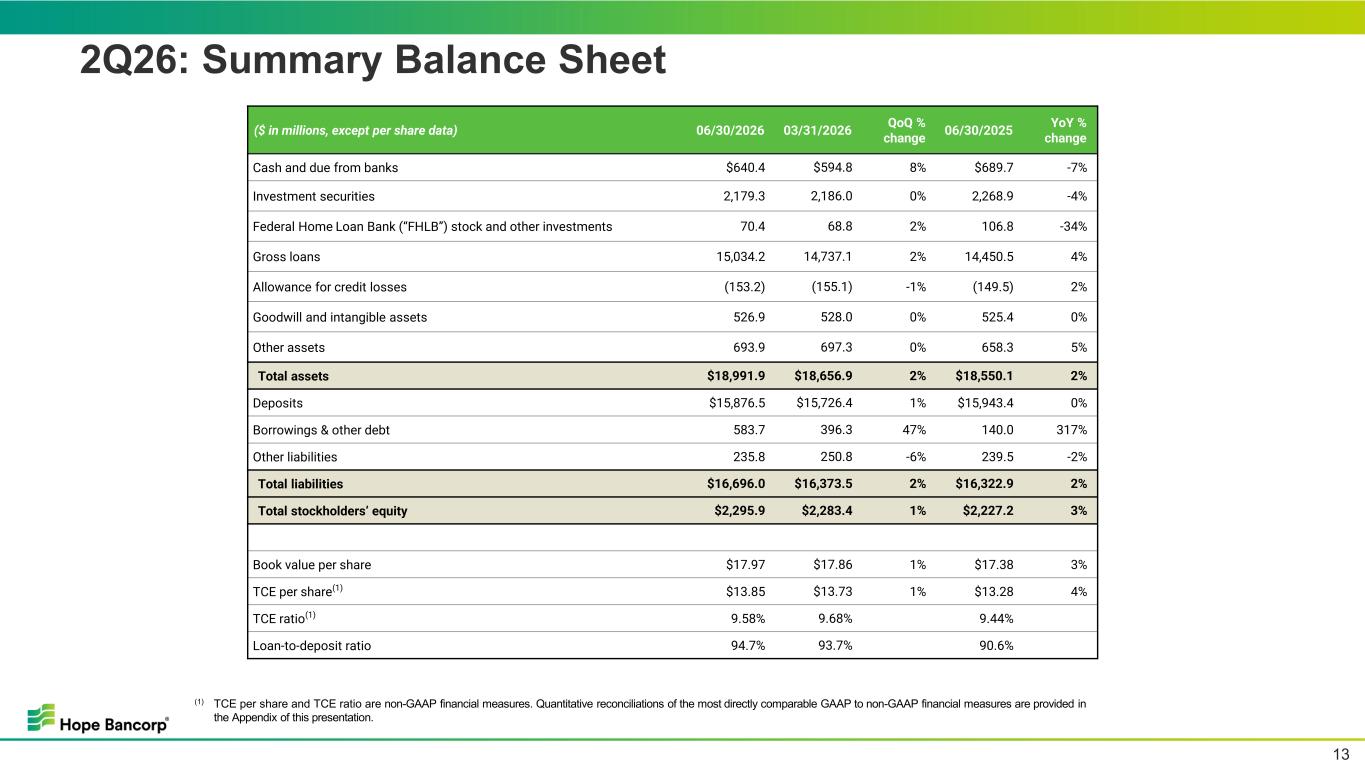
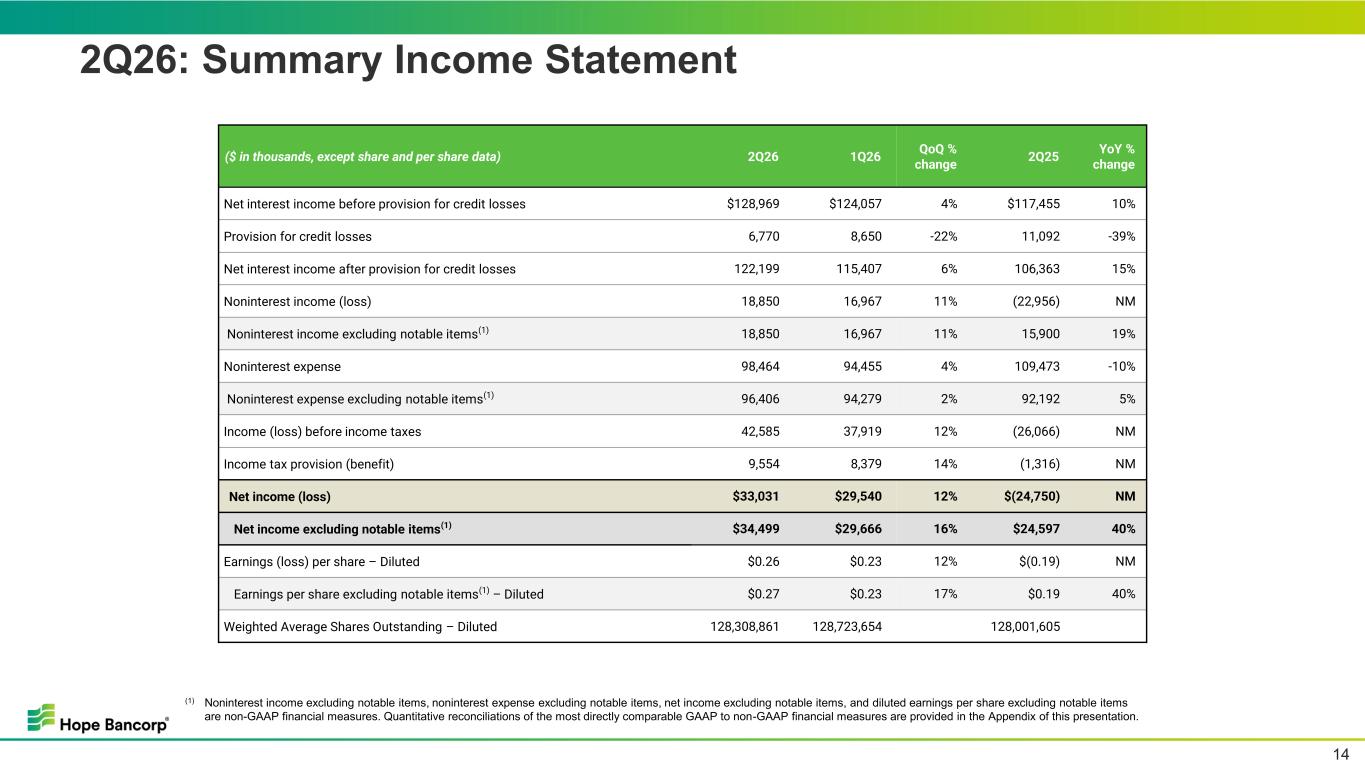
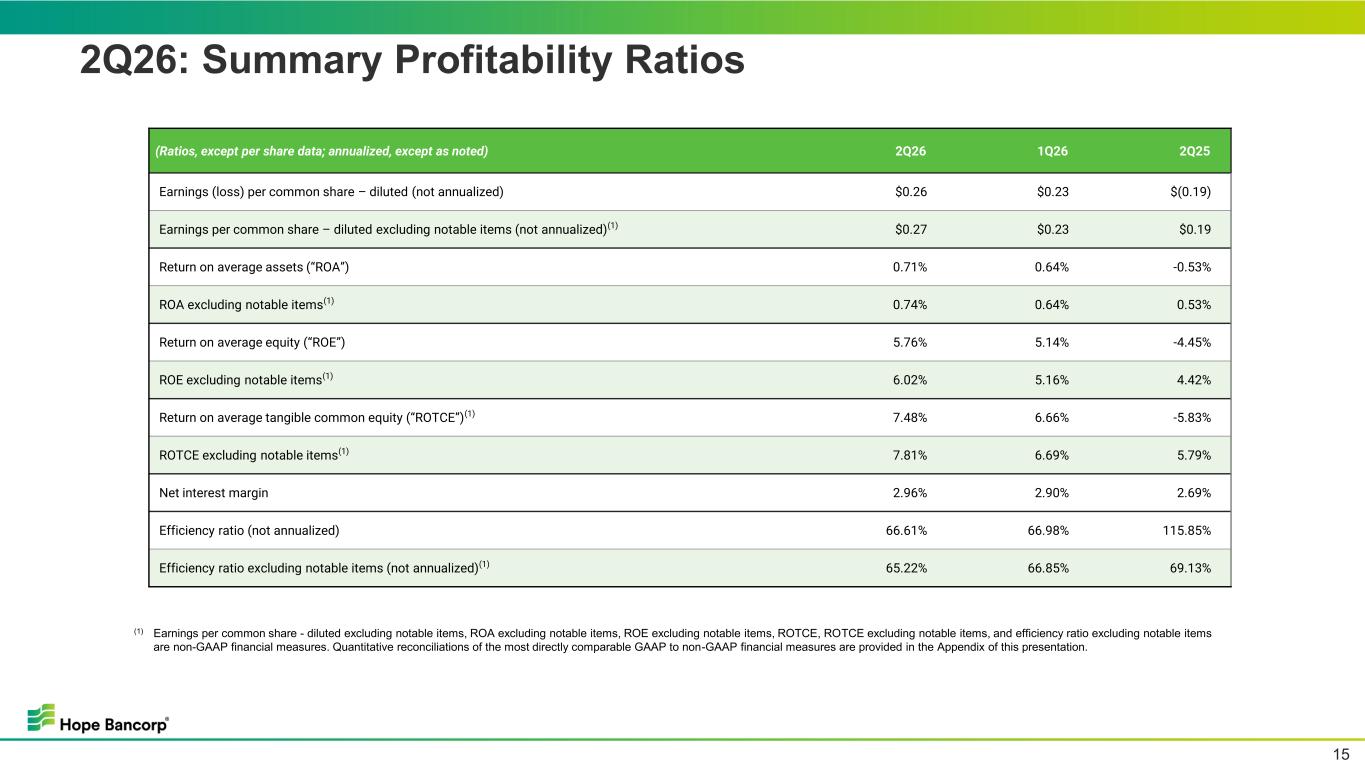
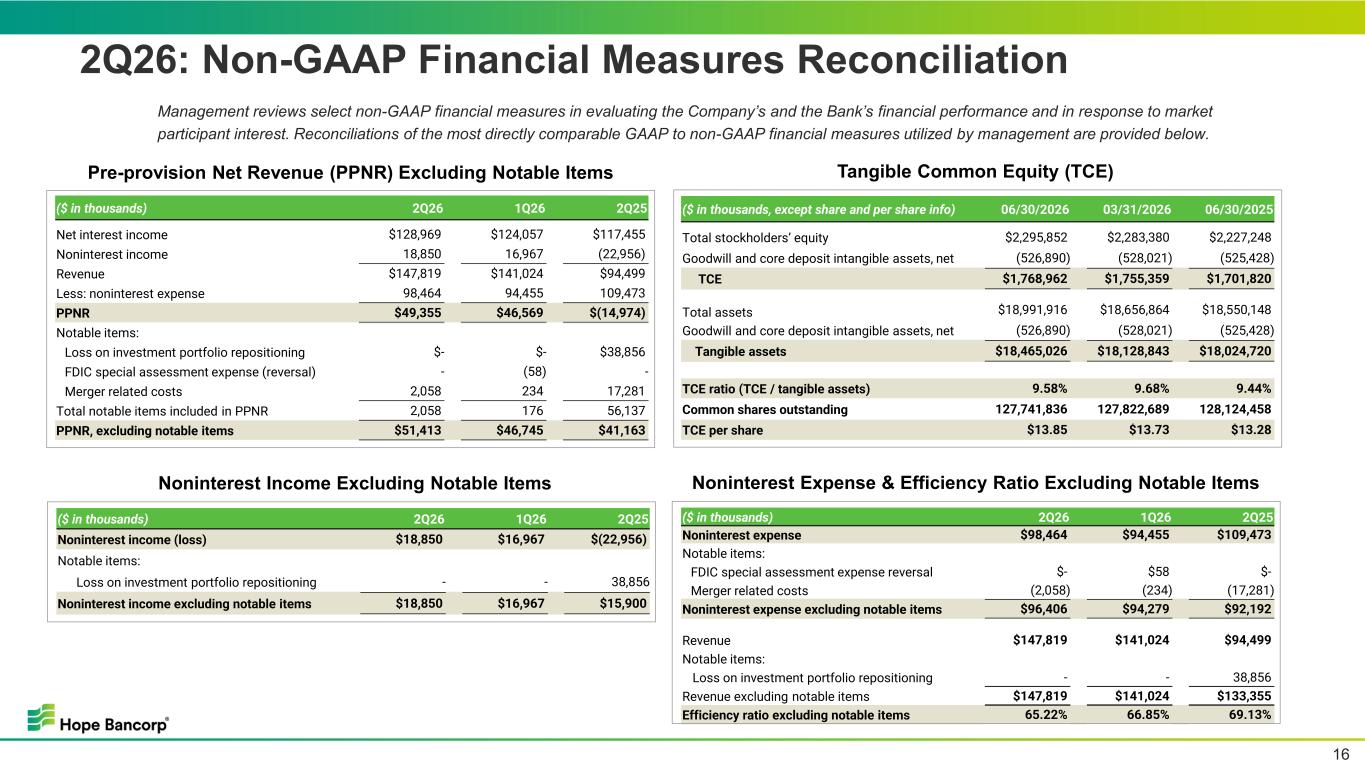
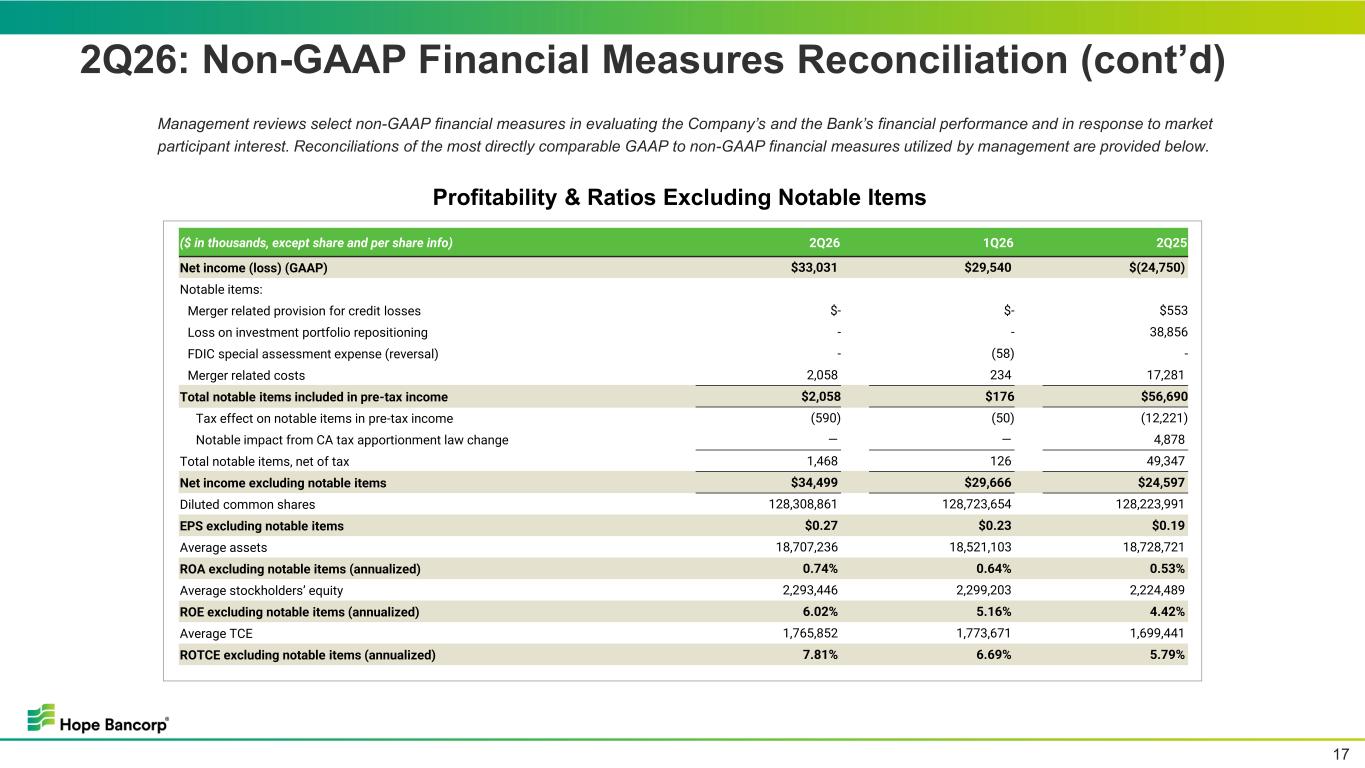
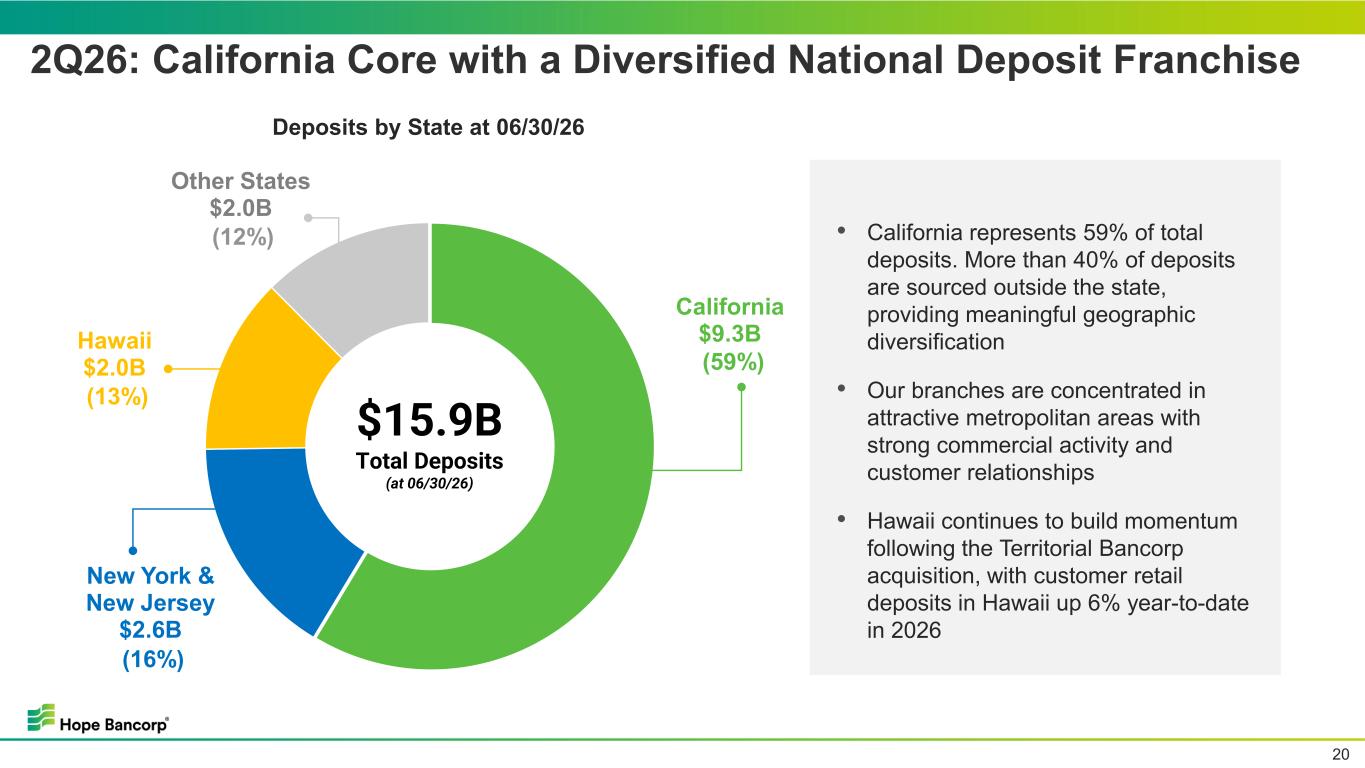
Thank you, Maxim. Good morning, everyone, and thank you for joining us today. Beginning with slide three, you will find a brief overview of our results. Overall, we delivered a strong second quarter and made solid progress during the first half of the year in executing against our key operating priorities. Second quarter 2026 revenue of $148 million drove reported diluted earnings per share of 26 cents, up 12 percent quarter over quarter, or diluted earnings per share excluding notable items of 27 cents, up 17 percent sequentially from 23 cents in the first quarter of 2026. Year over year, earnings per share excluding notable items were up 40 percent from 19 cents in the year-ago quarter. On a sequential quarter basis, the strong earnings growth was driven by revenue growth of 5%, net interest margin expansion of six basis points, and positive operating leverage. All our profitability ratios improved while loans and deposits grew. Pre-provision net revenue for the 2026 second quarter totaled $49 million, up 6% sequentially from $47 million in the first quarter of 2026. Excluding notable items, which were primarily merger-related, second quarter 2026 pre-provision net revenue was $51 million, up 10% from the prior quarter and up 25 percent year over year gross loans increased two percent or eight percent annualized to 15 billion dollars as of june 30 2026 and deposits increased one percent or four percent annualized to fifteen point nine billion dollars our deposit mix continued to improve with growth in non-maturity deposits more than offsetting a planned decline in time deposits to continue lowering our cost of funds. Moving on to slide four, at June 30, 2026, our common equity TO1 ratio was 12.27% and our total capital ratio was 13.95 percent our capital position is strong and enables us to support organic growth complete the pending acquisition of the commercial banking unit of smbc manubank and return capital to stockholders year to date in 2026 the company returned 45 million dollars of capital to stockholders through cash dividends and common stock repurchases year to date in 2026 the company repurchased approximately 773 000 shares of common stock at an average price of 11.25 dollars per share for a total of nine million dollars pursuant to its existing 50 million dollar share repurchase authorization at june 30 2026 27 million dollars remained available under the authorization providing flexibility for future capital management our board of directors declared a quarterly common stock dividend of 14 cents per share payable on or around august 20 of 2026 to stockholders of record as of August 6, 2026. On March 31st, 2026, we announced our pending acquisition of the commercial banking unit of SMBC Manubank. We expect the transaction to close in the second half of 2026, subject to regulatory approvals and customary closing conditions. This transaction aligns with our priorities to expand our middle market and multinational banking capabilities, develop specialty deposit verticals, broaden our presence in our core Southern California market, and enhance our balance sheet with quality loans and attractive deposits. Based on June 30, 2026 balances and And before failed value marks, this all-cash transaction is anticipated to add approximately $2.3 billion in loans and $2.6 billion in deposits and result in net cash flowing to bank of hope. Expect the transaction to enhance our core earnings and returns on tangible equity and to support efficient capital management. alongside the manubank acquisition we will enter into a collaboration and partnership agreement with smbc to support the local banking needs of their commercial and retail japanese customers seeking to do business in the united states our partnership with smbc will broaden our multinational client reach and contribute to differentiated long-term growth Continuing to slide 5, second quarter 2026 loan growth was led by commercial and industrial lending with additional contributions from commercial real estate and residential mortgage. Overall, loan growth is strengthening. At June 30, 2026, gross loans totaled $15 billion, up 2% quarter of a quarter, equivalent to 8% annualized and up 4% year over year. On the deposit side, deposits totaled $15.9 billion at June 30, 2026, up 1% quarter of a quarter or 4% annualized. Non-interest bearing demand deposits increased 5% from the prior quarter and time deposits declined 1%. Compared with the year-ago quarter, non-interest-bearing demand deposits increased 2%, while time deposits decreased 2%. Decreases in time deposits have been planned to help improve our deposit mix and lower our funding costs. In addition, we are benefiting from the addition of territorial savings, which operate in Hawaii, a market with lower deposit costs. Year-to-date, our customer retail deposits in Hawaii have grown 6%. With that, I will turn the call over to Juliana to review our financial performance for the second quarter in more detail. Juliana?
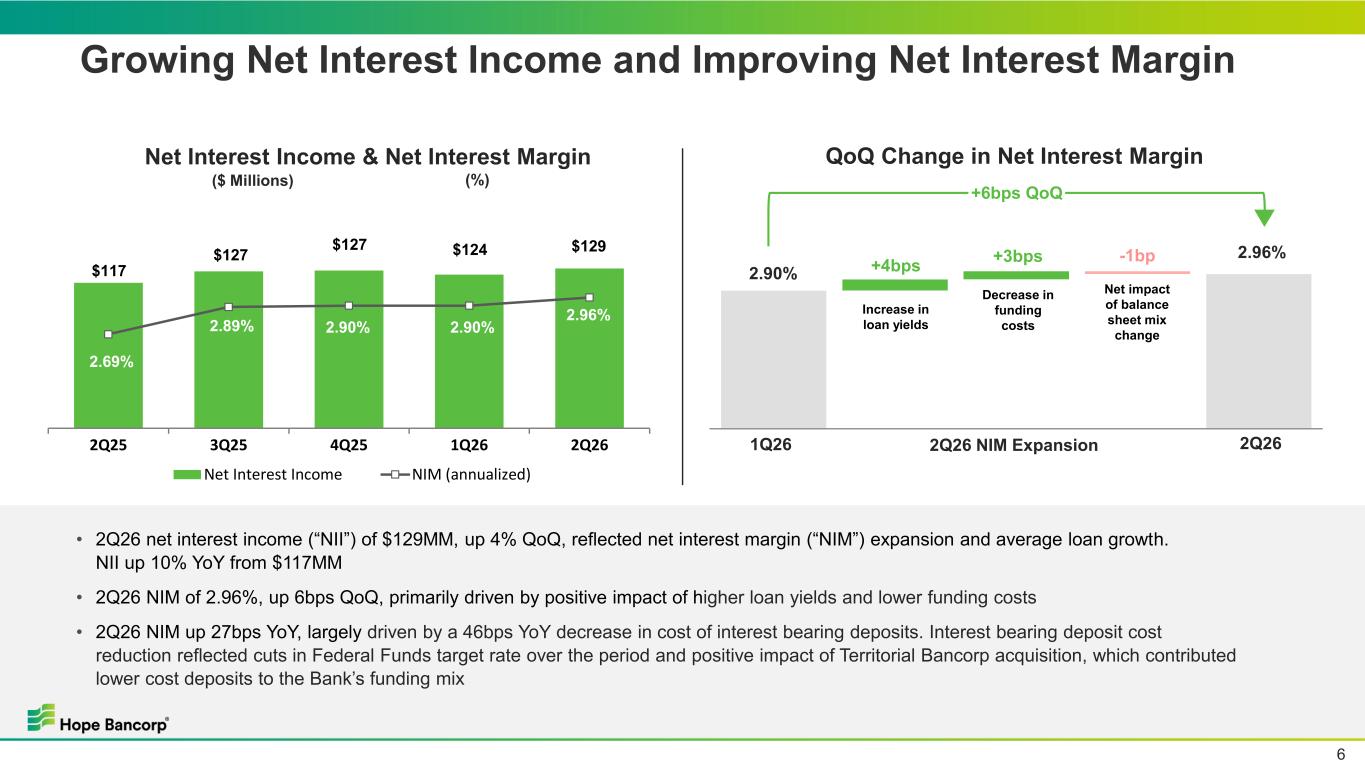
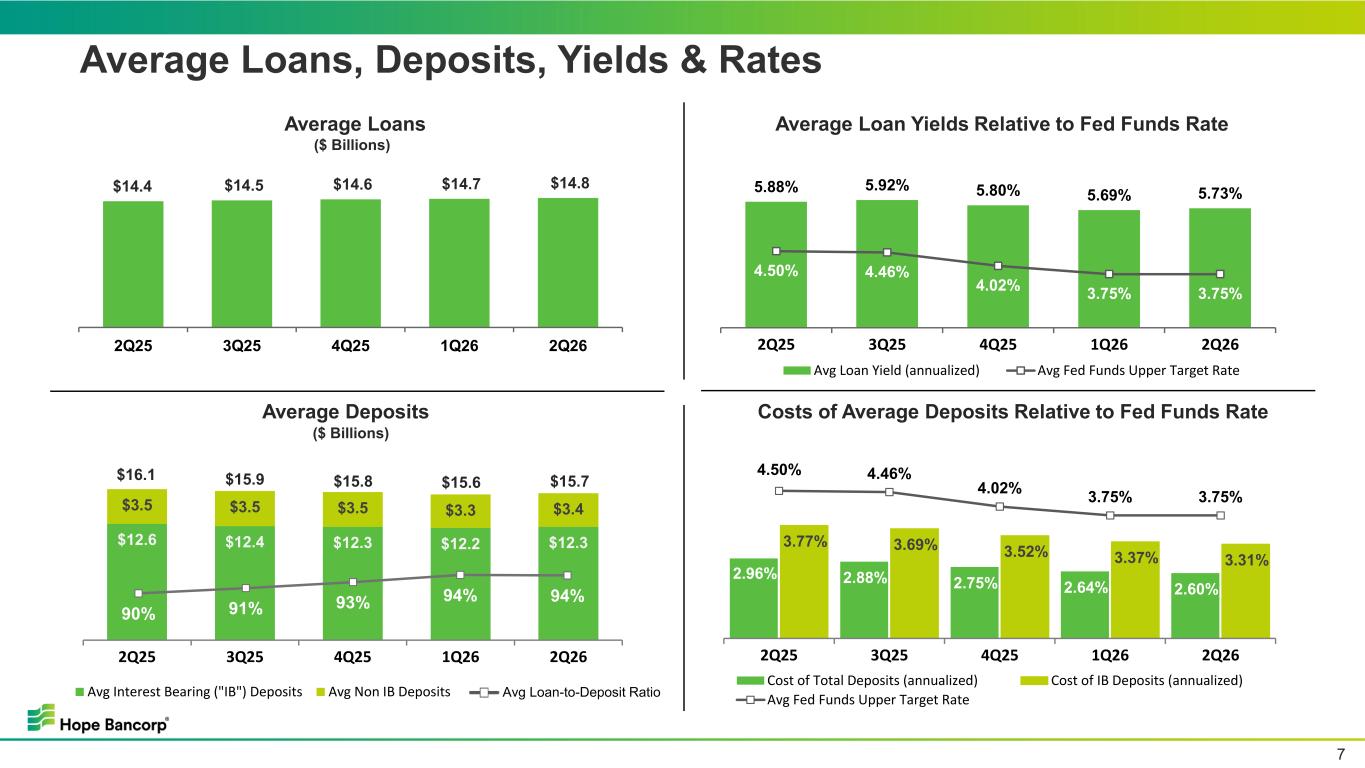
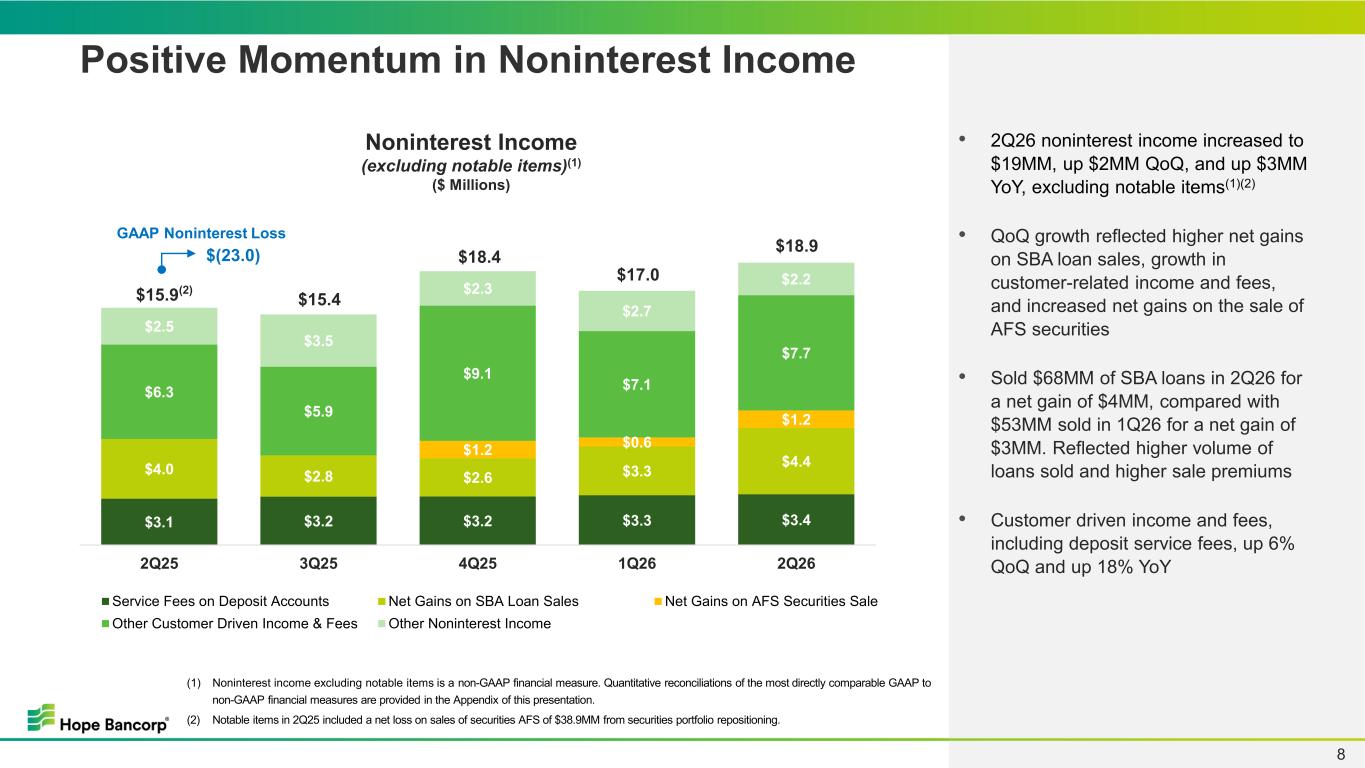
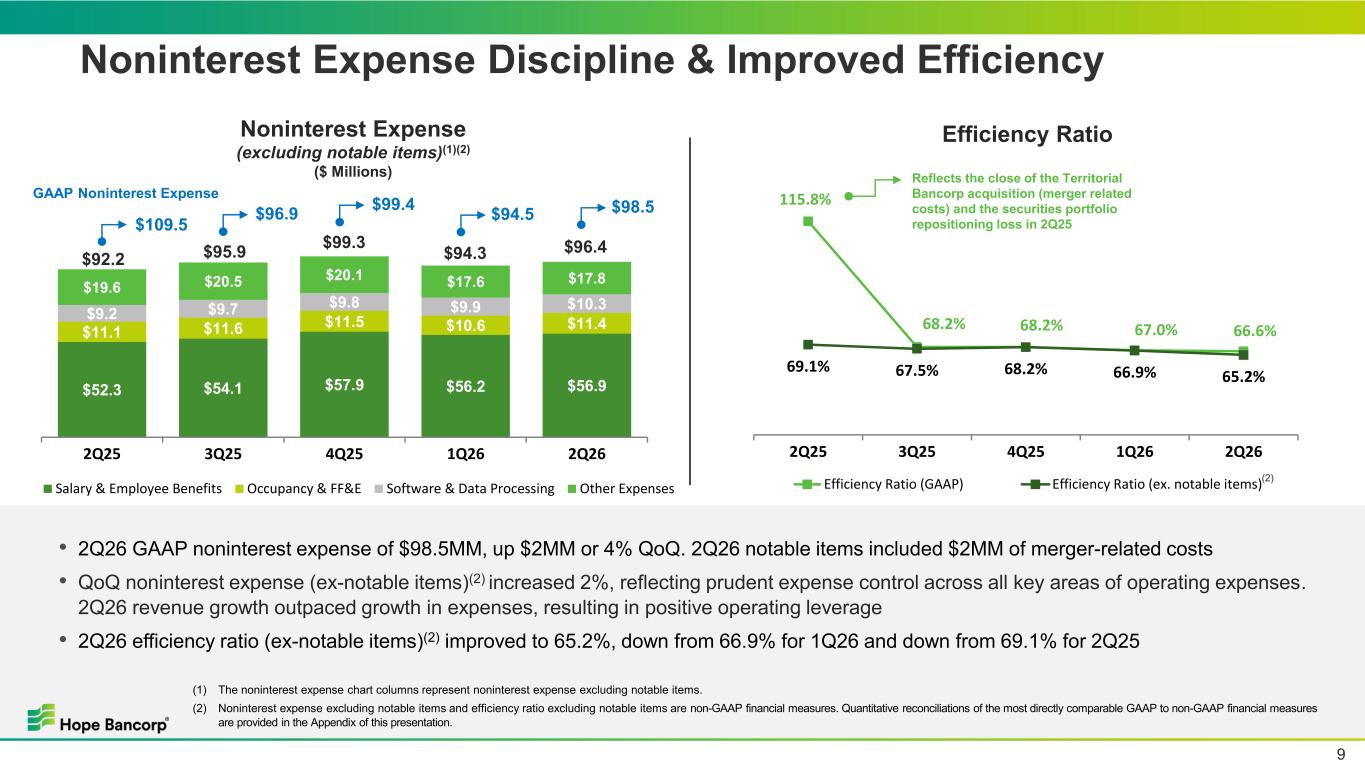
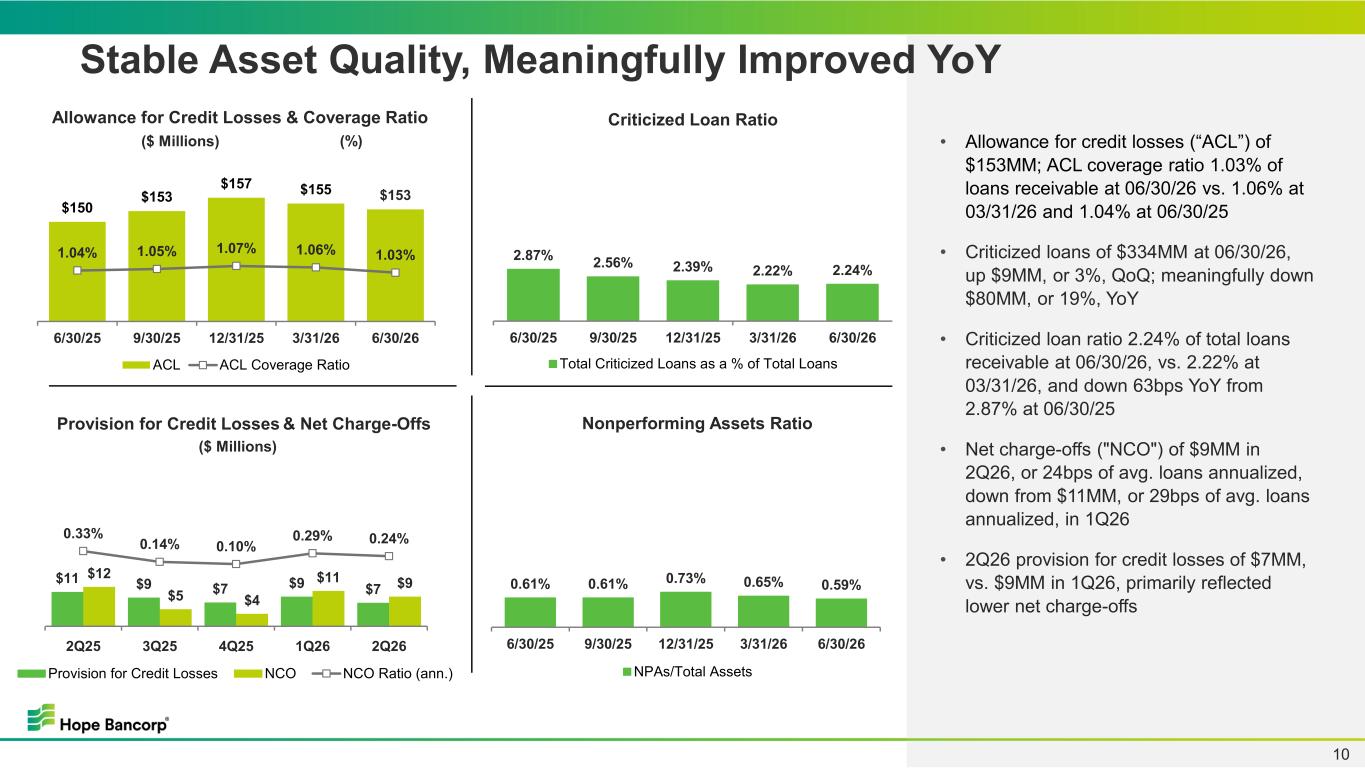
Thank you, Kevin, and good morning, everyone. Beginning on slide 6, our net interest income totaled $129 million for the second quarter of 2026, up $5 million or 4% from the first quarter of 2026 and up $12 million or 10% from the second quarter of 2025. Second quarter 2026 average loans of $14.8 billion grew 1% quarter over quarter and 3% year over year and our net interest margin expanded. Second quarter 2026 net interest margin was 2.96 percent, up six basis points from 2.90 percent in the prior quarter and up 27 basis points from 2.69 percent in the year-ago quarter. The sequential quarter net interest margin expansion was primarily driven by higher loan yields and a lower cost of funds. On slide seven, we provide more detail on balance trends, yields and rates for our average loans and deposits on to slide eight for the second quarter 2026 non-interest income totaled 19 million dollars and up 11 percent from the prior quarter and up 19 percent from the year ago quarter excluding notable items the quarter over quarter increase in non-interest income was primarily due to growth in net gains on sales of SBA loans growth in customer related income and fees and higher net gains on sales of available for sale securities. During the second quarter we sold 68 million dollars of SBA loans for a net gain on sale of four million dollars compared with sales of 53 million dollars in the first quarter for net gain on sale of three million dollars. This reflects both higher sale volume and higher sale premiums in the second quarter customer related income and fees including deposit service fees grew six percent quarter over quarter and 18 year-over-year reflecting higher customer activity across the number of fee income lines of business moving on to non-interest expense on slide nine non-interest expense totaled 98 million dollars in the second quarter of 2026 up from $94 million in the first quarter, excluding merger-related costs, non-interest expense totaled $96 million, up 2% from the prior quarter and up 5% year-over-year, reflecting continued prudent expense management across all areas of operating expenses. 2026 second quarter revenue growth exceeded operating expense growth, resulting in positive operating leverage and improving our efficiency accordingly our efficiency ratio excluding notable items improved to 65.2 percent down from 66.9 percent in the prior quarter and down from 69.1 percent in the year ago quarter next on to slide 10 i will review our asset quality which remained broadly stable during the quarter and compared favorably with a year ago period Our priority is early identification and problem loan resolution. Our credit trends remain healthy, and criticized loans improved meaningfully from the year-ago period. Criticized loans sold $334 million on June 30, 2026, up $9 million from March 31, 2026, and meaningfully down by $80 million, or 19%, from June 30, 2025. The criticized loan ratio was 2.24% of loans receivable at June 30th, 2026, improving 63 basis points from 2.87% a year ago. Non-performing assets were $113 million, or 59 basis points of total assets, at June 30th, 2026, compared with 65 basis points at March 31st, 2026, and 61 basis points at June 30th, 2025. Second quarter 2026 net charge-offs were $9 million or annualized 24 basis points of average loans, down from $11 million or annualized 29 basis points in the prior quarter, and down from annualized 33 basis points in the year-ago quarter. Accordingly, the provision for credit losses was $7 million in the 2026 second quarter, compared with $9 million in the first quarter. At June 30th, 2026, the allowance for credit losses totaled $153 million, with a coverage ratio of 1.03% of loans receivable. With that, let me turn the call back to Kevin.
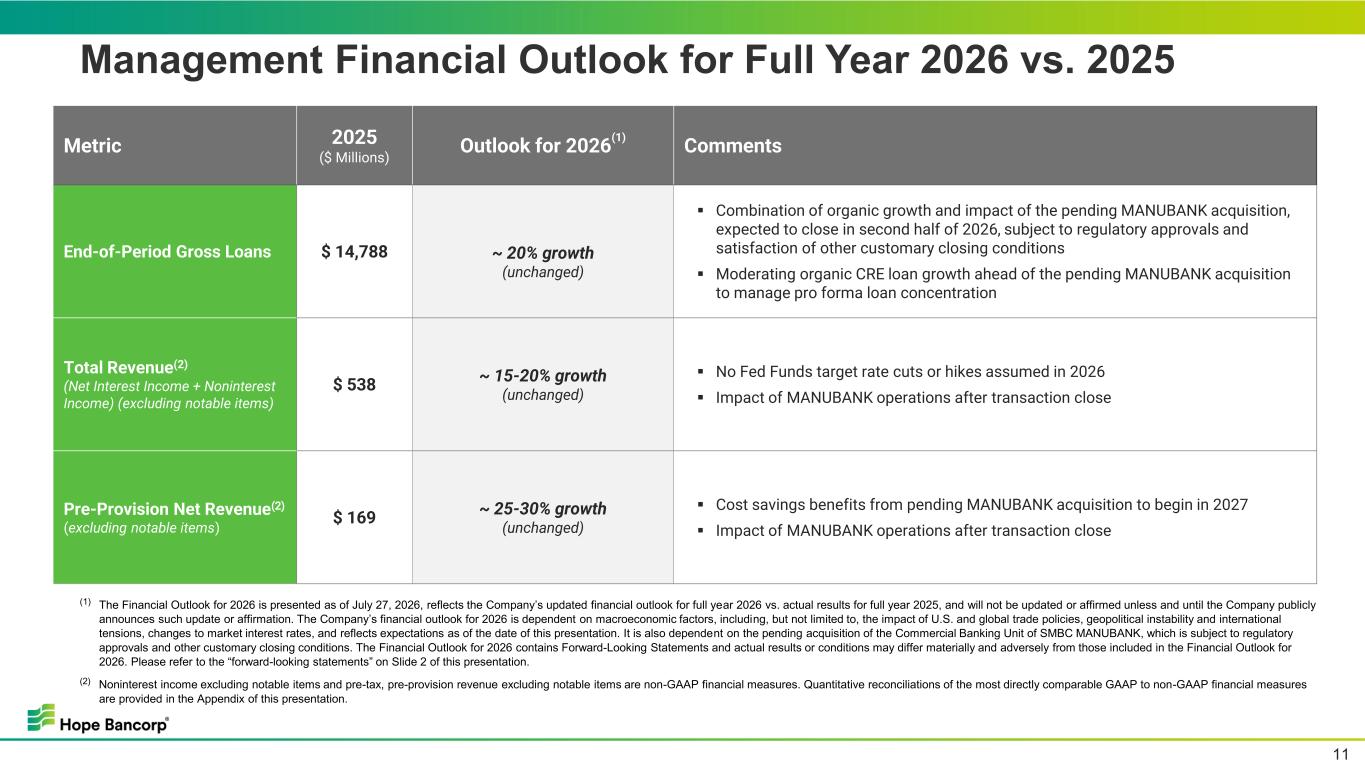
Thank you, Juliana. Moving on to the outlook on slide 11, as we enter the second half of 2026, We believe HOPE is well-positioned to build on the progress made during the first half of the year. Our full-year 2026 management outlook is essentially unchanged. We continue to expect end-of-period loan growth of approximately 20%, including Manubank loan balances. We continue to expect revenue growth in the range of 15 to 20 percent and pre-provisioned net revenue growth in the range of 25 to 30 percent, both excluding notable items and including the impact of Manubank's operations for the fourth quarter. Our priorities remain consistent. Prudent balance sheet growth, operating expense discipline, and active credit oversight, all in support of sustainable and profitable earnings growth and effective capital management across a range of operating environments. requirements. Our loan pipelines are active, and we are pursuing opportunities that meet our pricing, structure, and credit standards. On deposits, we continue to improve mix and manage funding costs in support of profitable growth. Our expenses, on expenses, we are balancing prudent expense control with targeted investments in technology, talent, risk management, and commercial banking capabilities. Finally, the pending Manubank transaction is closely aligned with our commercial banking strategy and long-term earnings objective. With that, operator, please open up the call for questions.
Operator
We will now begin the question and answer session. To ask a question, you may press star then 1 on your telephone keypad. To withdraw your question, please press star then 2. If at any time your question has been addressed and you would like to withdraw your question, please press star then 2. Please limit yourself to two questions. At this time, we will pause momentarily to assemble our roster. The first question comes from Matthew Clark with Piper Sandler. Please go ahead.
Hey, good morning, everyone. Let's start on the margin. Juliana, if you had the spot rate on deposits at the end of June, the margin in the month of June, and then just thoughts around deposit costs in general from here.
So the spot rate on deposits at the end of June was 2.58% and on interest-bearing deposits it was 3.32%. And as we look forward in terms of our net interest margin for the rest of the year, we should have a few basis points increase each quarter but it'll be much more uh much more uh much more um much not as great as the first quarter to second quarter but we're still looking for continuous margin expansion the net interest margin in june was 2.98 percent and as you recall from prior conversations we continue to benefit from the repricing of our cd portfolio which helps to bolster margin expansion and just thoughts on deposit pricing in general from here and costs i mean we're working very hard to continue to improve it by improving our deposit mix but i mean it's competitive out there yep fair enough and then just on the sba again on sale looked a lot stronger this quarter.
Just any commentary on the outlook there? Should we expect to reset maybe a little lower from here, or are you going to try to keep that pace?
Yeah. The premiums in the secondary market remain healthy, and the current premium range from mid to low eights, we will continue our balance between gain on sales economics with portfolio retention decisions. And although we will be flexible, our current outlook for 2026 will be around $16 to $17 million of SBA gains on sale.
Operator
Thank you. The next question comes from Gary Tenner with DA Davidson. Please go ahead.
Thank you. Good morning. Just a follow-up question on time deposits, Kevin. I think you've kind of talked about really working to lower those further as a percentage of the overall portfolio. Give us a sense of what that looks like.
Is there a target you're trying to get to or maybe what your longer term mix uh preferences would be hi gary this is juliana um you know longer term we would like to continue to reduce our reliance on or the mix of cds in our overall deposit book but it takes time to move the mix even one percentage point as you well know um and our core customer base is uh cds is a preferred product for our core customer base so over time we're continuing to diversify the franchise with um you know the acquisition of territorial bank corp last year the pending acquisition of manubank which will bring different sources of deposits to the mix and that will overall help us lower the percentage of cds in the total book but as far as stating a particular target just the reality is this will take time to reduce closer to industry norms yep makes sense and and you know you also flagged pretty good success year-to-date on growing deposits in the hawaii franchise can you talk about the relative pricing of what you're seeing from that part of the franchise versus mainland deposits lower than mainland thank you thank you the next question comes from kelly mata with kbw please go ahead
good morning thanks for the question um on the pending manubank transaction do you have any updated insight in terms of time and close i believe you're still waiting for regulatory approvals but any help there as well as what's assumed in your guide would be helpful for modeling purposes. Thank you.
Kelly, we still expect the transaction to close in the second half of 2026. And I think our timeline is right on track. But it ultimately depends upon the actual timing of the approvals. But I think we'll feel we are feeling pretty comfortable about the the second half closing of this transaction.
Great, and Juliana, I believe your guide includes some contribution from Manubank, is that about a quarter?
Yes, for modeling purposes, as you can see from Kevin's remarks in our outlook slide, we're assuming a quarter's worth of contribution from Manubank operations, but I mean, that's just merely taking the midpoint of second half into a model and as Kevin clearly stated the timing is dependent on uh approvals and other factors rather than just you know a clean midpoint you know yep understood totally um that's helpful um and then in terms of kind of the I know we hit on it um at Ozium but the deposit
a competitive landscape. Obviously, Monubank helps quite a bit with that. I'm wondering what the cost of new money is coming in at this stage. It seems rather competitive.
The cost of new money is ranging between $350 and $380 on the incremental interest-bearing deposits depending on sub-markets, sub-products. I would say a range is a, you know, time deposits on the higher end of that range, money markets on the lower end of that range, and, you know, low-cost IB deposits even lower than that range. But the incremental competitive deposit, I would say, is somewhere between 350 and 380, if that helps.
That's really helpful. And then closing the loop on deposits you guys have some really nice non-interest bearing growth this quarter um i'm wondering it it looks like um it's above the averages if if you could provide any color in terms of the drivers of that and if there was any sort of shorter term fluctuations that we should be mindful of when thinking through the outlook ahead um one one driver i can point you or not driver one uh one item that um i can highlight uh in dba growth this quarter i would say is we saw an inflow of tariff refund money into a number of our commercial and small business
customers um so that helped uh with deposit growth this quarter thank you the next question comes from Tim Coffey with Breen Capital.
Operator
Please go ahead.
Thank you, Morten, everybody. I have some questions about kind of the loan origination activity in the quarter and how that might have compared to the first quarter.
Well, our loan production was pretty robust in the second quarter, and our pipeline coming into the third quarter is also pretty, pretty solid. So we expect uh a robust uh loan origination again in the third quarter uh but uh what i want to point out is that uh you know we are continuing our efforts to prioritize the relationship economics structure and credit quality over headline growth right okay that's helpful and then what were what were new loan yields in the quarter?
The new loan yields this quarter, um, they ranged from, um, about 6% on commercial real estate, a little above 6% on commercial real estate to, um, close to 8% on SBA. So there was a full gamut of new loan yield range.
Okay, but, but all pretty much higher than the average yield for the quarter. um and and then um if you wanted to average it out okay okay that's great thanks um and then does the company have a uh on buybacks the company have a 10b5 or some other tools to continue to repurchase shares through the close of the transaction we do have a plan out there like that yes okay great thank you this concludes our question and answer session i would like to
turn the conference back over to management for any closing remarks thank you as we look ahead remain we remain committed to building a more profitable and resilient franchise and delivering sustainable long-term value for our stockholders in closing i want to thank our colleagues for their dedication and commitment. Their efforts are essential to executing our strategy and strengthening our organization. Thank you all for joining us today and we look forward to speaking with you again next quarter.
Operator
The conference has now concluded. Thank you for attending today's presentation. You may now disconnect.