
Kite Realty Group Trust 8-K, filed Feb 14, 2022
Kite Realty Group Trust (KRG)
8-K
2022-02-14
For: 2022-02-14
View Original
Added on
July 04, 2026
About this 8-K
Kite Realty Group Trust filed this 8-K on February 14, 2022.
Items reported
- Item 2.02: Financial results
- Item 9.01: Financial statements and exhibits
UNITED STATES
SECURITIES AND EXCHANGE COMMISSION
Washington, D.C. 20549
FORM 8-K
CURRENT REPORT
Pursuant to Section 13 or 15(d) of the Securities Exchange Act of 1934
Date of Report (Date of earliest event reported): February 14, 2022
(Exact name of registrant as specified in its charter)
| (State or other jurisdiction or incorporation) | (Commission File Number) | (IRS Employer Identification Number) | ||||||
(Address of principal executive offices) (Zip Code)
(Registrant’s telephone number including area code)
Not Applicable
(Former name or former address, if changed since last report)
Check the appropriate box below if the Form 8-K filing is intended to simultaneously satisfy the filing obligation of the registrant under any of the following provisions (see General Instruction A.2. below):
Securities registered pursuant to Section 12(b) of the Act:
| Title of each class | Trading Symbol | Name of each exchange on which registered | ||||||||||||
Indicate by check mark whether the registrant is an emerging growth company as defined in Rule 405 of the Securities Act of 1933 (§230.405 of this chapter) or Rule 12b-2 of the Securities Exchange Act of 1934 (§240.12b-2 of this chapter).
Emerging growth company ☐
If an emerging growth company, indicate by check mark if the registrant has elected not to use the extended transition period for complying with any new or revised financial accounting standards provided pursuant to Section 13(a) of the Exchange Act. ☐
Item 2.02. Results of Operations and Financial Condition.
On February 14, 2022, Kite Realty Group Trust (the “Company”) announced its consolidated financial results for the quarter ended December 31, 2021. A copy of the Company’s press release is furnished as Exhibit 99.1 to this current report on Form 8-K. A copy of the Company’s Fourth Quarter 2021 Supplemental Disclosure is furnished as Exhibit 99.2 to this current report on Form 8-K. The information contained in Item 2.02 of this current report on Form 8-K, including Exhibits 99.1 and 99.2, shall not be deemed “filed” with the Securities and Exchange Commission nor incorporated by reference in any registration statement filed by the Company under the Securities Act of 1933, as amended.
Item 9.01. Financial Statements and Exhibits.
(a) Not applicable.
(b) Not applicable.
(c) Not applicable.
(d) Exhibits.
| Exhibit No. | Description | |||||||
| 99.1 | Kite Realty Group Trust Press Release dated February 14, 2022 | |||||||
| 99.2 | Kite Realty Group Trust Fourth Quarter 2021 Supplemental Disclosure | |||||||
SIGNATURES
Pursuant to the requirements of the Securities Exchange Act of 1934, the registrant has duly caused this report to be signed on its behalf by the undersigned hereunto duly authorized.
| KITE REALTY GROUP TRUST | ||||||||
| Date: February 14, 2022 | By: | /s/ HEATH R. FEAR | ||||||
| Heath R. Fear | ||||||||
| Executive Vice President and | ||||||||
| Chief Financial Officer | ||||||||
EXHIBIT INDEX
| Exhibit No. | Document | |||||||
| 99.1 | ||||||||
| 99.2 | ||||||||
| Exhibit 99.1 | ||||||||
PRESS RELEASE
Contact Information: Kite Realty Group Trust
Jason Colton
SVP, Capital Markets & Investor Relations
317.713.2762
jcolton@kiterealty.com
Kite Realty Group Trust Reports 2021 Operating Results and 2022 Guidance
Indianapolis, Indiana, February 14, 2022 – Kite Realty Group Trust (NYSE: KRG), a premier owner and operator of high-quality, open-air grocery-anchored neighborhood and community centers, along with vibrant mixed-use assets, reported today its operating results for the fourth quarter and year ended December 31, 2021.
“2021 was a monumental year for KRG, highlighted by outstanding operational results and the completion of the transformative merger with RPAI,” said John A. Kite, Chairman and CEO. “KRG’s best-in-class operating platform continues to leverage the strong retail environment as evidenced by our tremendous leasing volume, double-digit cash leasing spreads and $33 million of signed-not-open NOI. This game-changing merger checks every synergistic box including significant earnings accretion reflected in our 2022 FFO per share guidance, which is a 33% increase over KRG’s 2020 FFO per share. Armed with a higher quality portfolio, a stronger balance sheet and a high-performing team, KRG is in the beginning stages of long-term value creation.”
Full Year Financial and Operational Results
▪Net loss attributable to common shareholders of $80.8 million, or $0.73 per diluted share, compared to net loss of $16.2 million, or $0.19 per diluted share, for the years ended December 31, 2021 and 2020, respectively. Full year 2021 net loss attributable to common shareholders was primarily driven by $86.5 million of merger and acquisition costs incurred during the year.
▪Generated NAREIT Funds From Operations of the Operating Partnership (FFO) of $88.4 million, or $0.78 per diluted share.
▪Generated FFO, as adjusted, of the Operating Partnership of $171.2 million, or $1.50 per diluted share.
▪Excludes a positive impact of $3.7 million of 2020 Collection Impact related to the recovery of 2020 cash and non-cash bad debt and accounts receivable in 2021.
▪Excludes the impact of $86.5 million of merger and acquisition costs.
▪Executed 363 new and renewal leases representing approximately 2.6 million square feet.
▪Same Property Net Operating Income (NOI) increased by 6.1% (excluding legacy RPAI properties).
Fourth Quarter Financial Results
▪Net loss attributable to common shareholders of $98.2 million, or $0.52 per diluted share, compared to net loss of $6.8 million, or $0.08 per diluted share, for the quarters ended December 31, 2021 and 2020, respectively. The fourth quarter 2021 net loss attributable to common shareholders was primarily driven by $76.6 million of merger and acquisition costs incurred during the quarter.
▪Generated NAREIT FFO of the Operating Partnership of $6.2 million, or $0.03 per diluted share.
▪Generated FFO, as adjusted, of the Operating Partnership of $82.4 million, or $0.43 per diluted share.
▪Excludes a positive impact of $0.4 million of 2020 Collection Impact related to the recovery of 2020 cash and non-cash bad debt and accounts receivable in 2021.
▪Excludes the impact of $76.6 million of merger and acquisition costs.
▪Same Property Net Operating Income (NOI) increased by 7.2% (excluding legacy RPAI properties).
Fourth Quarter Portfolio Operations
▪Executed 132 new and renewal leases representing over 927,000 square feet.
▪Cash leasing spreads of 27.4% on 23 comparable new leases, 8.3% on 60 comparable renewals, and 12.9% on a blended basis.
1
▪Operating retail portfolio annualized base rent (ABR) per square foot of $19.36 at December 31, 2021, a 5% increase year-over-year.
▪Retail portfolio percent leased of 93.4% at December 31, 2021, a sequential increase of 60 basis points.
▪Portfolio leased-to-occupied spread of 250 basis points, which equates to $33.0 million of signed-not-open NOI.
Fourth Quarter Capital and Development Activity
▪As previously disclosed, sold Westside Market (Dallas/Fort Worth, TX) for $24.8 million.
▪Acquired two small shop buildings adjacent to Nora Plaza (Indianapolis, IN) for a purchase price of $13.5 million.
▪In conjunction with the merger, repaid the $24.1 million mortgage on Peoria Crossing (Phoenix, AZ).
Subsequent Capital and Development Activity
▪Sold a portion of Hamilton Crossing Centre (Carmel, IN) and entered into a fee development agreement to build a corporate campus for Republic Airways. In addition to the $6.9 million KRG received for the land, KRG will earn significant development fees and development profits, while contributing no incremental capital.
▪Repaid the $41.2 million mortgage on Bayonne Crossing (Bayonne, NJ).
Balance Sheet Overview
▪As of December 31, 2021, KRG’s net debt to Adjusted EBITDA was 6.0x.
▪Pro forma for $33.0 million of signed-not-open NOI (represents expected revenue associated with leases that have been executed as of December 31, 2021, but have yet to commence rent payments), net debt to adjusted EBITDA was 5.6x.
▪As previously disclosed, received an inaugural credit rating of BBB with a stable outlook from Fitch Ratings.
Dividend
▪On February 9, 2022, KRG’s Board of Trustees declared a first quarter 2022 dividend of $0.20 per common share, up 5% from the previous quarter. The first quarter dividend will be paid on April 15, 2022, to shareholders of record as of April 8, 2022.
2022 Earnings Guidance
KRG expects to generate FFO, as adjusted, of $1.69 to $1.75 per diluted share in 2022, based, in part, on the following key assumptions at the midpoint:
▪2022 same property NOI, which excludes prior period adjustments, however, includes RPAI same-property pool acquired in the merger, of 2.0%.
▪Bad debt of 1.5% of total revenues.
▪Any transaction activity is expected to be earnings neutral.
The following table reconciles the Company’s 2022 consolidated net income guidance range to the Company’s 2022 FFO, as adjusted, guidance range:
| Low | High | ||||||||||
| Consolidated net loss | $ | (0.35) | $ | (0.29) | |||||||
| Depreciation and amortization | 2.02 | 2.02 | |||||||||
| NAREIT FFO | $ | 1.67 | $ | 1.73 | |||||||
| Non-recurring merger and acquisition costs | 0.02 | 0.02 | |||||||||
| FFO, as adjusted | $ | 1.69 | $ | 1.75 | |||||||
2
Earnings Conference Call
Kite Realty Group Trust will conduct a conference call to discuss its financial results on Tuesday, February 15, 2022, at 11:00 a.m. Eastern Time. A live webcast of the conference call will be available on KRG’s website at www.kiterealty.com. The dial-in numbers are (844) 309-0605 for domestic callers and (574) 990-9933 for international callers (Conference ID: 3958479). In addition, a webcast replay link will be available on KRG’s website.
About Kite Realty Group Trust
Kite Realty Group Trust (NYSE: KRG) is a real estate investment trust (REIT) headquartered in Indianapolis, IN that is one of the largest publicly traded owners and operators of open-air shopping centers and mixed-use assets. The company’s primarily grocery-anchored portfolio is located in high-growth warmer and cheaper markets and select strategic gateway markets. The combination of necessity-based grocery-anchored neighborhood and community centers, along with vibrant mixed-use assets makes the KRG portfolio an ideal mix for both retailers and consumers. Publicly listed since 2004, KRG has nearly 60 years of experience in developing, constructing and operating real estate. Using operational, investment, development, and redevelopment expertise, KRG continuously optimizes its portfolio to maximize value and return to shareholders. As of December 31, 2021, the Company owned interests in 180 U.S. open-air shopping centers and mixed-use assets, comprising approximately 29.0 million square feet of gross leasable space. For more information, please visit kiterealty.com.
Connect with KRG: LinkedIn | Twitter | Instagram | Facebook
Safe Harbor
This release, together with other statements and information publicly disseminated by us, contains certain forward-looking statements within the meaning of Section 27A of the Securities Act of 1933 (the “Securities Act”) and Section 21E of the Securities Exchange Act of 1934. Such statements are based on assumptions and expectations that may not be realized and are inherently subject to risks, uncertainties and other factors, many of which cannot be predicted with accuracy and some of which might not even be anticipated. Future events and actual results, performance, transactions or achievements, financial or otherwise, may differ materially from the results, performance, transactions or achievements, financial or otherwise, expressed or implied by the forward-looking statements.
Currently, one of the most significant factors that could cause actual outcomes to differ significantly from our forward-looking statements is the adverse effect of the current pandemic of the novel coronavirus, or COVID-19, including possible resurgences, variants and mutations, on the financial condition, results of operations, cash flows and performance of the Company and its tenants, the real estate market and the global economy and financial markets. COVID-19 has impacted us and our tenants significantly, and the extent to which it will continue to impact us and our tenants will depend on future developments, which are highly uncertain and cannot be predicted with confidence, including the scope, severity and duration of the pandemic, treatment developments, public adoption rates of COVID-19 vaccines, including booster shots, and their effectiveness against variants of COVID-19, such as Delta and Omicron, the direct and indirect economic effects of the pandemic and containment measures, and potential sustained changes in consumer behavior, among others. Moreover, investors are cautioned to interpret many of the risks identified under the section titled “Risk Factors” in our Annual Report on Form 10-K for the fiscal year ended December 31, 2020 and in the Company’s quarterly reports on Form 10-Q as being heightened as a result of the ongoing and numerous adverse impacts of the COVID-19 pandemic.
Additional risks, uncertainties and other factors that might cause such differences, some of which could be material, include but are not limited to: the risks associated with the merger with RPAI, including the integration of the businesses of the combined company, the ability to achieve expected synergies or costs savings and potential disruptions to the Company’s plans and operations; national and local economic, business, real estate and other market conditions, particularly in connection with low or negative growth in the U.S. economy as well as economic uncertainty (including the potential effects of inflation); the risk that our actual NOI for leases that have signed but not yet opened will not be consistent with expected NOI for leases that have signed but not yet opened; financing risks, including the availability of, and costs associated with, sources of liquidity; the Company’s ability to refinance, or extend the maturity dates of, the Company’s indebtedness; the level and volatility of interest rates; the financial stability of tenants; the competitive environment in which the Company operates, including potential oversupplies of and reduction in demand for rental space; acquisition, disposition, development and joint venture risks; property ownership and management risks, including the relative illiquidity of real estate investments, and expenses, vacancies or the inability to rent space on favorable terms or at all; the Company’s ability to maintain the Company’s status as a real estate investment trust for U.S. federal income tax purposes; potential environmental and other liabilities; impairment in the value of real estate
3
property the Company owns; the attractiveness of our properties to tenants, the actual and perceived impact of e-commerce on the value of shopping center assets and changing demographics and customer traffic patterns; risks related to our current geographical concentration of the Company’s properties in Texas, Florida, New York, Maryland, and North Carolina; civil unrest, acts of terrorism or war, acts of God, climate change, epidemics, pandemics (including COVID-19), natural disasters and severe weather conditions, including such events that may result in underinsured or uninsured losses or other increased costs and expenses; changes in laws and government regulations including governmental orders affecting the use of the Company’s properties or the ability of its tenants to operate, and the costs of complying with such changed laws and government regulations; possible short-term or long-term changes in consumer behavior due to COVID-19 and the fear of future pandemics; our ability to satisfy environmental, social or governance standards set by various constituencies; insurance costs and coverage; risks associated with cybersecurity attacks and the loss of confidential information and other business disruptions; other factors affecting the real estate industry generally; and other risks identified in reports the Company files with the Securities and Exchange Commission (“the SEC”) or in other documents that it publicly disseminates, including, in particular, the section titled “Risk Factors” in the Company’s Annual Report on Form 10-K for the fiscal year ended December 31, 2020, and in the Company’s quarterly reports on Form 10-Q. The Company undertakes no obligation to publicly update or revise these forward-looking statements, whether as a result of new information, future events or otherwise.
This Earnings Release also includes certain forward-looking non-GAAP information. Due to high variability and difficulty in making accurate forecasts and projections of some of the information excluded from these estimates, together with some of the excluded information not being ascertainable or accessible, the Company is unable to quantify certain amounts that would be required to be included in the most directly comparable GAAP financial measures without unreasonable efforts.
4
Kite Realty Group Trust
Consolidated Balance Sheets
(dollars in thousands)
(unaudited)
| December 31, 2021 | December 31, 2020 | ||||||||||
| Assets: | |||||||||||
| Investment properties at cost: | $ | 7,497,811 | $ | 3,143,961 | |||||||
| Less: accumulated depreciation | (884,809) | (755,100) | |||||||||
| Net investment properties | 6,613,002 | 2,388,861 | |||||||||
| Cash and cash equivalents | 93,241 | 43,648 | |||||||||
Tenant and other receivables, including accrued straight-line rent of $28,071 and $24,783, respectively | 68,444 | 57,154 | |||||||||
| Restricted cash and escrow deposits | 7,122 | 2,938 | |||||||||
| Deferred costs, net | 601,853 | 63,171 | |||||||||
| Short-term deposits | 125,000 | — | |||||||||
| Prepaid and other assets | 84,826 | 39,975 | |||||||||
| Investments in unconsolidated subsidiaries | 11,885 | 12,792 | |||||||||
| Total assets | $ | 7,605,373 | $ | 2,608,539 | |||||||
| Liabilities and Shareholders' Equity: | |||||||||||
| Mortgage and other indebtedness, net | $ | 3,150,808 | $ | 1,170,794 | |||||||
| Accounts payable and accrued expenses | 184,982 | 77,469 | |||||||||
| Deferred revenue and other liabilities | 287,217 | 85,649 | |||||||||
| Total liabilities | 3,623,007 | 1,333,912 | |||||||||
| Commitments and contingencies | |||||||||||
Limited Partners’ interests in the Operating Partnership and other redeemable noncontrolling interests | 55,173 | 43,275 | |||||||||
| Shareholders' Equity: | |||||||||||
| Kite Realty Group Trust Shareholders' Equity: | |||||||||||
Common Shares, $0.01 par value, 490,000,000 and 225,000,000 shares authorized, 218,949,569 and 84,187,999 shares issued and outstanding at December 31, 2021 and 2020, respectively | 2,189 | 842 | |||||||||
| Additional paid-in capital | 4,898,673 | 2,085,003 | |||||||||
| Accumulated other comprehensive loss | (15,902) | (30,885) | |||||||||
| Accumulated deficit | (962,913) | (824,306) | |||||||||
| Total Kite Realty Group Trust shareholders' equity | 3,922,047 | 1,230,654 | |||||||||
| Noncontrolling interests | 5,146 | 698 | |||||||||
| Total equity | 3,927,193 | 1,231,352 | |||||||||
| Total liabilities and shareholders' equity | $ | 7,605,373 | $ | 2,608,539 | |||||||
5
Kite Realty Group Trust
Consolidated Statements of Operations
(dollars in thousands, except per share amounts)
(unaudited)
| Three Months Ended December 31, | Year Ended December 31, | ||||||||||||||||||||||
| 2021 | 2020 | 2021 | 2020 | ||||||||||||||||||||
| Revenue: | |||||||||||||||||||||||
| Rental income | $ | 161,302 | $ | 66,311 | $ | 367,399 | $ | 257,670 | |||||||||||||||
| Other property-related revenue | 1,550 | 1,970 | 4,683 | 8,597 | |||||||||||||||||||
| Fee income | 98 | 79 | 1,242 | 378 | |||||||||||||||||||
| Total revenue | 162,950 | 68,360 | 373,324 | 266,645 | |||||||||||||||||||
| Expenses: | |||||||||||||||||||||||
| Property operating | 24,583 | 10,562 | 55,561 | 41,012 | |||||||||||||||||||
| Real estate taxes | 22,956 | 9,316 | 49,530 | 35,867 | |||||||||||||||||||
| General, administrative and other | 10,308 | 10,855 | 33,984 | 30,840 | |||||||||||||||||||
| Merger and acquisition costs | 76,564 | — | 86,522 | — | |||||||||||||||||||
| Depreciation and amortization | 109,835 | 31,818 | 200,460 | 128,648 | |||||||||||||||||||
| Total expenses | 244,246 | 62,551 | 426,057 | 236,367 | |||||||||||||||||||
| Gain (loss) on sales of operating properties, net | 3,692 | (159) | 31,209 | 4,733 | |||||||||||||||||||
| Operating (loss) income | (77,604) | 5,650 | (21,524) | 35,011 | |||||||||||||||||||
| Interest expense | (23,061) | (12,284) | (60,447) | (50,399) | |||||||||||||||||||
| Income tax benefit of taxable REIT subsidiary | 2 | 200 | 310 | 696 | |||||||||||||||||||
| Equity in earnings (loss) of unconsolidated subsidiaries | 342 | (429) | (416) | (1,685) | |||||||||||||||||||
| Other income, net | 166 | 21 | 355 | 254 | |||||||||||||||||||
| Net loss | (100,155) | (6,842) | (81,722) | (16,123) | |||||||||||||||||||
| Net loss (income) attributable to noncontrolling interests | 1,974 | 48 | 916 | (100) | |||||||||||||||||||
Net loss attributable to Kite Realty Group Trust common shareholders | $ | (98,181) | $ | (6,794) | $ | (80,806) | $ | (16,223) | |||||||||||||||
| Net loss per common share – basic and diluted | $ | (0.52) | $ | (0.08) | $ | (0.73) | $ | (0.19) | |||||||||||||||
| Weighted average common shares outstanding – basic and diluted | 188,291,354 | 84,192,462 | 110,637,562 | 84,142,261 | |||||||||||||||||||
| Dividends paid per common share | $ | 0.18 | $ | 0.08 | $ | 0.68 | $ | 0.4495 | |||||||||||||||
6
Kite Realty Group Trust
Funds From Operations (“FFO”)1,2
(dollars in thousands, except per share amounts)
(unaudited)
| Three Months Ended December 31, | Year Ended December 31, | ||||||||||||||||||||||
| 2021 | 2020 | 2021 | 2020 | ||||||||||||||||||||
| Consolidated net loss | $ | (100,155) | $ | (6,842) | $ | (81,722) | $ | (16,123) | |||||||||||||||
| Less: net income attributable to noncontrolling interests in properties | (118) | (132) | (514) | (528) | |||||||||||||||||||
| Less: (gain) loss on sales of operating properties, net | (3,692) | 159 | (31,209) | (4,733) | |||||||||||||||||||
Add: depreciation and amortization of consolidated and unconsolidated entities, net of noncontrolling interests | 110,185 | 32,265 | 201,834 | 130,091 | |||||||||||||||||||
FFO of the Operating Partnership1 | 6,220 | 25,450 | 88,389 | 108,707 | |||||||||||||||||||
| Less: Limited Partners' interests in FFO | 356 | (662) | (1,945) | (2,826) | |||||||||||||||||||
FFO attributable to Kite Realty Group Trust common shareholders1 | $ | 6,576 | $ | 24,788 | $ | 86,444 | $ | 105,881 | |||||||||||||||
| FFO, as defined by NAREIT, per share of the Operating Partnership – basic | $ | 0.03 | $ | 0.29 | $ | 0.78 | $ | 1.26 | |||||||||||||||
| FFO, as defined by NAREIT, per share of the Operating Partnership – diluted | $ | 0.03 | $ | 0.29 | $ | 0.78 | $ | 1.26 | |||||||||||||||
FFO of the Operating Partnership1 | $ | 6,220 | $ | 25,450 | $ | 88,389 | $ | 108,707 | |||||||||||||||
| Add: merger and acquisition costs | 76,564 | — | 86,522 | — | |||||||||||||||||||
| Add: severance charges | — | 3,253 | — | 3,253 | |||||||||||||||||||
| Less: 2020 Collection Impact | (378) | — | (3,707) | — | |||||||||||||||||||
| FFO, as adjusted, of the Operating Partnership | $ | 82,406 | $ | 28,703 | $ | 171,204 | $ | 111,960 | |||||||||||||||
| FFO, as adjusted, per share of the Operating Partnership – basic | $ | 0.43 | $ | 0.33 | $ | 1.51 | $ | 1.30 | |||||||||||||||
| FFO, as adjusted, per share of the Operating Partnership – diluted | $ | 0.43 | $ | 0.33 | $ | 1.50 | $ | 1.29 | |||||||||||||||
| Weighted average common shares outstanding – basic | 188,291,354 | 84,192,462 | 110,637,562 | 84,142,261 | |||||||||||||||||||
| Weighted average common shares outstanding – diluted | 189,419,768 | 84,371,027 | 111,524,655 | 84,309,712 | |||||||||||||||||||
| Weighted average common shares and units outstanding – basic | 190,706,414 | 86,420,398 | 113,103,177 | 86,361,139 | |||||||||||||||||||
| Weighted average common shares and units outstanding – diluted | 191,834,828 | 86,598,962 | 113,990,269 | 86,528,591 | |||||||||||||||||||
| FFO, as defined by NAREIT, per diluted share/unit | |||||||||||||||||||||||
| Consolidated net loss | $ | (0.52) | $ | (0.08) | $ | (0.72) | $ | (0.19) | |||||||||||||||
| Less: net income attributable to noncontrolling interests in properties | — | — | — | (0.01) | |||||||||||||||||||
| Less: (gain) loss on sales of operating properties, net | (0.02) | — | (0.27) | (0.05) | |||||||||||||||||||
Add: depreciation and amortization of consolidated and unconsolidated entities, net of noncontrolling interests | 0.57 | 0.37 | 1.78 | 1.50 | |||||||||||||||||||
FFO, as defined by NAREIT, of the Operating Partnership per diluted share/unit1,2 | $ | 0.03 | $ | 0.29 | $ | 0.78 | $ | 1.26 | |||||||||||||||
| Add: merger and acquisition costs | 0.40 | — | 0.76 | — | |||||||||||||||||||
| Add: severance charges | — | 0.04 | — | 0.04 | |||||||||||||||||||
| Less: 2020 Collection Impact | — | — | (0.03) | — | |||||||||||||||||||
FFO, as adjusted, of the Operating Partnership per diluted share/unit2 | $ | 0.43 | $ | 0.33 | $ | 1.50 | $ | 1.29 | |||||||||||||||
| 1 | “FFO of the Operating Partnership" measures 100% of the operating performance of the Operating Partnership’s real estate properties. “FFO attributable to Kite Realty Group Trust common shareholders” reflects a reduction for the redeemable noncontrolling weighted average diluted interest in the Operating Partnership. | |||||||
| 2 | Per share/unit amounts of components will not necessarily sum to the total due to rounding to the nearest cent. | |||||||
Funds from Operations (“FFO”) is a widely used performance measure for real estate companies and is provided here as a supplemental measure of operating performance. The Company calculates FFO, a non-GAAP financial measure, in accordance with the best practices described in the April 2002 National Policy Bulletin of the National Association of Real Estate Investment Trusts ("NAREIT"), as restated in 2018. The NAREIT white paper defines FFO as net income (calculated in accordance with GAAP), excluding depreciation and amortization related to real estate, gains and losses from the sale of certain real estate assets, gains and losses from change in control, and impairment write-downs of certain real estate assets and investments in entities when the impairment is directly attributable to decreases in the value of depreciable real estate held by the entity.
Considering the nature of our business as a real estate owner and operator, the Company believes that FFO is helpful to investors in measuring our operational performance because it excludes various items included in net income that do not relate to or are not indicative of our operating performance, such as gains or losses from sales of depreciated property and depreciation and amortization, which can make periodic and peer analyses of operating performance more difficult. FFO excludes the gain on the sale of the ground lease portfolio as these sales were part of our capital strategy distinct from our ongoing operating strategy of selling individual land parcels from time to time. FFO (a) should not be considered as an alternative to net income (calculated in accordance with GAAP) for the purpose of measuring our financial performance, (b) is not an alternative to cash flow from operating activities (calculated in accordance with GAAP) as a measure of our liquidity, and (c) is not indicative of funds available to satisfy our cash needs, including our ability to make distributions. Our computation of FFO may not be comparable to FFO reported by other REITs that do not define the term in accordance with the current NAREIT definition or that interpret the current NAREIT definition differently than we do.
From time to time, the Company may report or provide guidance with respect to “FFO as adjusted” which removes the impact of certain non-recurring and non-operating transactions or other items the Company does not consider to be representative of its core operating results including, without limitation, gains or losses associated with the early extinguishment of debt, gains or losses associated with litigation involving the Company that is not in the normal course of business, merger and acquisition costs, the impact on earnings from employee severance, the excess of redemption value over carrying value of preferred stock redemption, and the impact of 2020 bad debt or 2020 accounts receivable ("2020 Collection Impact"), which are not otherwise adjusted in the Company’s calculation of FFO.
7
Kite Realty Group Trust
Same Property Net Operating Income (“NOI”)
(dollars in thousands)
(unaudited)
| Three Months Ended December 31, | Year Ended December 31, | ||||||||||||||||||||||||||||||||||
| 2021 | 2020 | Change | 2021 | 2020 | Change | ||||||||||||||||||||||||||||||
Number of properties for the period1 | 82 | 82 | |||||||||||||||||||||||||||||||||
| Leased percentage at period end | 93.1 | % | 91.4 | % | 93.1 | % | 91.4 | % | |||||||||||||||||||||||||||
Economic occupancy percentage2 | 89.0 | % | 90.4 | % | 89.1 | % | 92.0 | % | |||||||||||||||||||||||||||
| Minimum rent | $ | 49,629 | $ | 48,809 | $ | 199,014 | $ | 199,615 | |||||||||||||||||||||||||||
| Tenant recoveries | 14,878 | 15,631 | 59,669 | 61,231 | |||||||||||||||||||||||||||||||
| Bad debt (provision) recovery | (498) | (2,880) | 709 | (12,065) | |||||||||||||||||||||||||||||||
| Other income, net | 562 | 169 | 1,396 | 626 | |||||||||||||||||||||||||||||||
| Total revenue | 64,571 | 61,729 | 260,788 | 249,407 | |||||||||||||||||||||||||||||||
| Property operating expenses | (9,461) | (9,301) | (36,001) | (34,838) | |||||||||||||||||||||||||||||||
| Real estate taxes | (8,484) | (8,915) | (34,555) | (35,244) | |||||||||||||||||||||||||||||||
| Total expenses | (17,945) | (18,216) | (70,556) | (70,082) | |||||||||||||||||||||||||||||||
| Same Property NOI | $ | 46,626 | $ | 43,513 | 7.2 | % | $ | 190,232 | $ | 179,325 | 6.1 | % | |||||||||||||||||||||||
Reconciliation of Same Property NOI to most directly comparable GAAP measure: | |||||||||||||||||||||||||||||||||||
| Net operating income – same properties | $ | 46,626 | $ | 43,513 | $ | 190,232 | $ | 179,325 | |||||||||||||||||||||||||||
Net operating income – non-same activity3 | 68,687 | 4,890 | 76,759 | 10,063 | |||||||||||||||||||||||||||||||
| Total property net operating income | 115,313 | 48,403 | 138.2 | % | 266,991 | 189,388 | 41.0 | % | |||||||||||||||||||||||||||
| Other income (expense), net | 608 | (129) | 1,491 | (357) | |||||||||||||||||||||||||||||||
| General, administrative and other | (10,308) | (10,855) | (33,984) | (30,840) | |||||||||||||||||||||||||||||||
| Merger and acquisition costs | (76,564) | — | (86,522) | — | |||||||||||||||||||||||||||||||
| Depreciation and amortization | (109,835) | (31,818) | (200,460) | (128,648) | |||||||||||||||||||||||||||||||
| Interest expense | (23,061) | (12,284) | (60,447) | (50,399) | |||||||||||||||||||||||||||||||
| Gain (loss) on sales of operating properties, net | 3,692 | (159) | 31,209 | 4,733 | |||||||||||||||||||||||||||||||
Net loss (income) attributable to noncontrolling interests | 1,974 | 48 | 916 | (100) | |||||||||||||||||||||||||||||||
| Net (loss) income attributable to common shareholders | $ | (98,181) | $ | (6,794) | $ | (80,806) | $ | (16,223) | |||||||||||||||||||||||||||
| 1 | Same Property NOI excludes (i) the recently completed Glendale Town Center and Eddy Street Commons – Phase II, (ii) development and redevelopment projects noted on page 13, (iii) the 2020 acquisition of Eastgate Crossing, (iv) the legacy RPAI portfolio, and (v) office properties. | ||||
| 2 | Excludes leases that are signed but for which tenants have not yet commenced the payment of cash rent. Calculated as a weighted average based on the timing of cash rent commencement and expiration during the period. | ||||
| 3 | Includes non-cash activity across the portfolio as well as net operating income from properties not included in the same property pool including properties sold during both periods. | ||||
The Company uses same property NOI ("Same Property NOI"), a non-GAAP financial measure, to evaluate the performance of our properties. Same Property NOI excludes properties that have not been owned for the full period presented. It also excludes net gains from outlot sales, straight-line rent revenue, lease termination income in excess of lost rent, amortization of lease intangibles and significant prior period expense recoveries and adjustments, if any. When the Company receives payments in excess of any accounts receivable for terminating a lease, Same Property NOI will include such excess payments as monthly rent until the earlier of the expiration of 12 months or the start date of a replacement tenant. The Company believes that Same Property NOI is helpful to investors as a measure of our operating performance because it includes only the NOI of properties that have been owned for the full periods presented. The Company believes such presentation eliminates disparities in net income due to the acquisition or disposition of properties during the particular periods presented and thus provides a more consistent metric for the comparison of our properties. Same Property NOI includes the results of properties that have been owned for the entire current and prior year reporting periods.
NOI and Same Property NOI should not, however, be considered as alternatives to net income (calculated in accordance with GAAP) as indicators of our financial performance. The Company’s computation of NOI and Same Property NOI may differ from the methodology used by other REITs and, therefore, may not be comparable to such other REITs.
When evaluating the properties that are included in the same property pool, the Company has established specific criteria for determining the inclusion of properties acquired or those recently under development. An acquired property is included in the same property pool when there is a full quarter of operations in both years subsequent to the acquisition date. Development and redevelopment properties are included in the same property pool four full quarters after the properties have been transferred to the operating portfolio. A redevelopment property is first excluded from the same property pool when the execution of a redevelopment plan is likely and the Company (a) begins recapturing space from tenants or (b) the contemplated plan significantly impacts the operations of the property. For the quarter ended December 31, 2021, the Company excluded two redevelopment properties and the recently completed Glendale Town Center redevelopment from the same property pool that met these criteria and were owned in both comparable periods. In addition, the Company excluded the portfolio acquired in the merger with RPAI and one recently acquired property from the same property pool.
8
Kite Realty Group Trust
Earnings Before Interest, Tax, Depreciation, and Amortization (“EBITDA”)
(dollars in thousands)
(unaudited)
| Three Months Ended December 31, 2021 | |||||
| Consolidated net loss | $ | (100,155) | |||
| Adjustments to net loss: | |||||
| Depreciation and amortization | 109,835 | ||||
| Interest expense | 23,061 | ||||
| Income tax benefit of taxable REIT subsidiary | (2) | ||||
| EBITDA | 32,739 | ||||
| Adjustments to EBITDA: | |||||
| Unconsolidated EBITDA | 882 | ||||
| Merger and acquisition costs | 76,564 | ||||
| Pro forma adjustments | 14,368 | ||||
| Gain on sales of operating properties, net | (3,692) | ||||
| Other income and expense, net | (508) | ||||
| Noncontrolling interests | (118) | ||||
| Adjusted EBITDA | 120,235 | ||||
Annualized Adjusted EBITDA1 | $ | 480,939 | |||
| Company share of net debt: | |||||
| Mortgage and other indebtedness, net | $ | 3,150,808 | |||
Less: Partner share of consolidated joint venture debt2 | (580) | ||||
| Less: cash, cash equivalents, restricted cash and short-term deposits | (226,644) | ||||
| Plus: Company share of unconsolidated joint venture debt | 30,164 | ||||
| Plus: net premiums on acquired debt and issuance costs | (58,583) | ||||
| Company share of Net Debt | $ | 2,895,165 | |||
| Net Debt to Adjusted EBITDA | 6.0x | ||||
| 1 | Represents Adjusted EBITDA for the three months ended December 31, 2021 (as shown in the table above) multiplied by four. | ||||
| 2 | Partner share of consolidated joint venture debt is calculated based upon the partner's pro-rata ownership of the joint venture, multiplied by the related secured debt balance. | ||||
The Company defines EBITDA, a non-GAAP financial measure, as net income before depreciation and amortization, interest expense and income tax expense of the taxable REIT subsidiary. For informational purposes, the Company also provides Adjusted EBITDA, which the Company defines as EBITDA less (i) EBITDA from unconsolidated entities, (ii) gains on sales of operating properties or impairment charges, (iii) merger and acquisition costs, (iv) other income and expense, (v) noncontrolling interest EBITDA, and (vi) other non-recurring activity or items impacting comparability from period to period. Annualized Adjusted EBITDA is Adjusted EBITDA for the most recent quarter multiplied by four. Net Debt to Adjusted EBITDA is the Company's share of net debt divided by Annualized Adjusted EBITDA. EBITDA, Adjusted EBITDA, Annualized Adjusted EBITDA and Net Debt to Adjusted EBITDA, as calculated by the Company, are not comparable to EBITDA and EBITDA-related measures reported by other REITs that do not define EBITDA and EBITDA-related measures exactly as we do. EBITDA, Adjusted EBITDA and Annualized Adjusted EBITDA do not represent cash generated from operating activities in accordance with GAAP and should not be considered an alternative to net income as an indicator of performance or as an alternative to cash flows from operating activities as an indicator of liquidity.
Considering the nature of our business as a real estate owner and operator, the Company believes that EBITDA, Adjusted EBITDA and the ratio of Net Debt to Adjusted EBITDA are helpful to investors in measuring our operational performance because they exclude various items included in net income that do not relate to or are not indicative of the Company’s operating performance, such as gains or losses from sales of depreciated property and depreciation and amortization, which can make periodic and peer analyses of operating performance more difficult. For informational purposes, the Company also provides Annualized Adjusted EBITDA, adjusted as described above. The Company believes this supplemental information provides a meaningful measure of its operating performance. The Company believes presenting EBITDA and the related measures in this manner allows investors and other interested parties to form a more meaningful assessment of the Company’s operating results.
9
| Exhibit 99.2 | ||||||||
Kite Realty Group Trust
Quarterly Financial Supplemental as of December 31, 2021
T A B L E O F C O N T E N T S
| Earnings Press Release | |||||
| Contact Information | |||||
| Results Overview | |||||
| Consolidated Balance Sheets | |||||
| Consolidated Statements of Operations | |||||
| Same Property Net Operating Income | |||||
| Net Operating Income and EBITDA by Quarter | |||||
| Funds From Operations | |||||
| Joint Venture Summary | |||||
| Key Debt Metrics | |||||
| Summary of Outstanding Debt | |||||
| Maturity Schedule of Outstanding Debt | |||||
| Acquisitions and Dispositions | |||||
| Development and Redevelopment Projects | |||||
| Geographic Diversification – ABR by Region and State | |||||
| Top 25 Tenants by ABR | |||||
| Retail Leasing Spreads | |||||
| Lease Expirations | |||||
| Components of Net Asset Value | |||||
| Non-GAAP Financial Measures | |||||
Kite Realty Group Trust | 30 South Meridian Street, Suite 1100 | Indianapolis, Indiana 46204 | 888.577.5600 | www.kiterealty.com
PRESS RELEASE
Contact Information: Kite Realty Group Trust
Jason Colton
SVP, Capital Markets & Investor Relations
317.713.2762
jcolton@kiterealty.com
Kite Realty Group Trust Reports 2021 Operating Results and 2022 Guidance
Indianapolis, Indiana, February 14, 2022 – Kite Realty Group Trust (NYSE: KRG), a premier owner and operator of high-quality, open-air grocery-anchored neighborhood and community centers, along with vibrant mixed-use assets, reported today its operating results for the fourth quarter and year ended December 31, 2021.
“2021 was a monumental year for KRG, highlighted by outstanding operational results and the completion of the transformative merger with RPAI,” said John A. Kite, Chairman and CEO. “KRG’s best-in-class operating platform continues to leverage the strong retail environment as evidenced by our tremendous leasing volume, double-digit cash leasing spreads and $33 million of signed-not-open NOI. This game-changing merger checks every synergistic box including significant earnings accretion reflected in our 2022 FFO per share guidance, which is a 33% increase over KRG’s 2020 FFO per share. Armed with a higher quality portfolio, a stronger balance sheet and a high-performing team, KRG is in the beginning stages of long-term value creation.”
Full Year Financial and Operational Results
▪Net loss attributable to common shareholders of $80.8 million, or $0.73 per diluted share, compared to net loss of $16.2 million, or $0.19 per diluted share, for the years ended December 31, 2021 and 2020, respectively. Full year 2021 net loss attributable to common shareholders was primarily driven by $86.5 million of merger and acquisition costs incurred during the year.
▪Generated NAREIT Funds From Operations of the Operating Partnership (FFO) of $88.4 million, or $0.78 per diluted share.
▪Generated FFO, as adjusted, of the Operating Partnership of $171.2 million, or $1.50 per diluted share.
▪Excludes a positive impact of $3.7 million of 2020 Collection Impact related to the recovery of 2020 cash and non-cash bad debt and accounts receivable in 2021.
▪Excludes the impact of $86.5 million of merger and acquisition costs.
▪Executed 363 new and renewal leases representing approximately 2.6 million square feet.
▪Same Property Net Operating Income (NOI) increased by 6.1% (excluding legacy RPAI properties).
Fourth Quarter Financial Results
▪Net loss attributable to common shareholders of $98.2 million, or $0.52 per diluted share, compared to net loss of $6.8 million, or $0.08 per diluted share, for the quarters ended December 31, 2021 and 2020, respectively. The fourth quarter 2021 net loss attributable to common shareholders was primarily driven by $76.6 million of merger and acquisition costs incurred during the quarter.
▪Generated NAREIT FFO of the Operating Partnership of $6.2 million, or $0.03 per diluted share.
▪Generated FFO, as adjusted, of the Operating Partnership of $82.4 million, or $0.43 per diluted share.
▪Excludes a positive impact of $0.4 million of 2020 Collection Impact related to the recovery of 2020 cash and non-cash bad debt and accounts receivable in 2021.
▪Excludes the impact of $76.6 million of merger and acquisition costs.
▪Same Property Net Operating Income (NOI) increased by 7.2% (excluding legacy RPAI properties).
Fourth Quarter Portfolio Operations
▪Executed 132 new and renewal leases representing over 927,000 square feet.
▪Cash leasing spreads of 27.4% on 23 comparable new leases, 8.3% on 60 comparable renewals, and 12.9% on a blended basis.
i | |||||
▪Operating retail portfolio annualized base rent (ABR) per square foot of $19.36 at December 31, 2021, a 5% increase year-over-year.
▪Retail portfolio percent leased of 93.4% at December 31, 2021, a sequential increase of 60 basis points.
▪Portfolio leased-to-occupied spread of 250 basis points, which equates to $33.0 million of signed-not-open NOI.
Fourth Quarter Capital and Development Activity
▪As previously disclosed, sold Westside Market (Dallas/Fort Worth, TX) for $24.8 million.
▪Acquired two small shop buildings adjacent to Nora Plaza (Indianapolis, IN) for a purchase price of $13.5 million.
▪In conjunction with the merger, repaid the $24.1 million mortgage on Peoria Crossing (Phoenix, AZ).
Subsequent Capital and Development Activity
▪Sold a portion of Hamilton Crossing Centre (Carmel, IN) and entered into a fee development agreement to build a corporate campus for Republic Airways. In addition to the $6.9 million KRG received for the land, KRG will earn significant development fees and development profits, while contributing no incremental capital.
▪Repaid the $41.2 million mortgage on Bayonne Crossing (Bayonne, NJ).
Balance Sheet Overview
▪As of December 31, 2021, KRG’s net debt to Adjusted EBITDA was 6.0x.
▪Pro forma for $33.0 million of signed-not-open NOI (represents expected revenue associated with leases that have been executed as of December 31, 2021, but have yet to commence rent payments), net debt to adjusted EBITDA was 5.6x.
▪As previously disclosed, received an inaugural credit rating of BBB with a stable outlook from Fitch Ratings.
Dividend
▪On February 9, 2022, KRG’s Board of Trustees declared a first quarter 2022 dividend of $0.20 per common share, up 5% from the previous quarter. The first quarter dividend will be paid on April 15, 2022, to shareholders of record as of April 8, 2022.
2022 Earnings Guidance
KRG expects to generate FFO, as adjusted, of $1.69 to $1.75 per diluted share in 2022, based, in part, on the following key assumptions at the midpoint:
▪2022 same property NOI, which excludes prior period adjustments, however, includes RPAI same-property pool acquired in the merger, of 2.0%.
▪Bad debt of 1.5% of total revenues.
▪Any transaction activity is expected to be earnings neutral.
The following table reconciles the Company’s 2022 consolidated net income guidance range to the Company’s 2022 FFO, as adjusted, guidance range:
| Low | High | ||||||||||
| Consolidated net loss | $ | (0.35) | $ | (0.29) | |||||||
| Depreciation and amortization | 2.02 | 2.02 | |||||||||
| NAREIT FFO | $ | 1.67 | $ | 1.73 | |||||||
| Non-recurring merger and acquisition costs | 0.02 | 0.02 | |||||||||
| FFO, as adjusted | $ | 1.69 | $ | 1.75 | |||||||
ii | |||||
Earnings Conference Call
Kite Realty Group Trust will conduct a conference call to discuss its financial results on Tuesday, February 15, 2022, at 11:00 a.m. Eastern Time. A live webcast of the conference call will be available on KRG’s website at www.kiterealty.com. The dial-in numbers are (844) 309-0605 for domestic callers and (574) 990-9933 for international callers (Conference ID: 3958479). In addition, a webcast replay link will be available on KRG’s website.
About Kite Realty Group Trust
Kite Realty Group Trust (NYSE: KRG) is a real estate investment trust (REIT) headquartered in Indianapolis, IN that is one of the largest publicly traded owners and operators of open-air shopping centers and mixed-use assets. The company’s primarily grocery-anchored portfolio is located in high-growth warmer and cheaper markets and select strategic gateway markets. The combination of necessity-based grocery-anchored neighborhood and community centers, along with vibrant mixed-use assets makes the KRG portfolio an ideal mix for both retailers and consumers. Publicly listed since 2004, KRG has nearly 60 years of experience in developing, constructing and operating real estate. Using operational, investment, development, and redevelopment expertise, KRG continuously optimizes its portfolio to maximize value and return to shareholders. As of December 31, 2021, the Company owned interests in 180 U.S. open-air shopping centers and mixed-use assets, comprising approximately 29.0 million square feet of gross leasable space. For more information, please visit kiterealty.com.
Connect with KRG: LinkedIn | Twitter | Instagram | Facebook
Safe Harbor
This release, together with other statements and information publicly disseminated by us, contains certain forward-looking statements within the meaning of Section 27A of the Securities Act of 1933 (the “Securities Act”) and Section 21E of the Securities Exchange Act of 1934. Such statements are based on assumptions and expectations that may not be realized and are inherently subject to risks, uncertainties and other factors, many of which cannot be predicted with accuracy and some of which might not even be anticipated. Future events and actual results, performance, transactions or achievements, financial or otherwise, may differ materially from the results, performance, transactions or achievements, financial or otherwise, expressed or implied by the forward-looking statements.
Currently, one of the most significant factors that could cause actual outcomes to differ significantly from our forward-looking statements is the adverse effect of the current pandemic of the novel coronavirus, or COVID-19, including possible resurgences, variants and mutations, on the financial condition, results of operations, cash flows and performance of the Company and its tenants, the real estate market and the global economy and financial markets. COVID-19 has impacted us and our tenants significantly, and the extent to which it will continue to impact us and our tenants will depend on future developments, which are highly uncertain and cannot be predicted with confidence, including the scope, severity and duration of the pandemic, treatment developments, public adoption rates of COVID-19 vaccines, including booster shots, and their effectiveness against variants of COVID-19, such as Delta and Omicron, the direct and indirect economic effects of the pandemic and containment measures, and potential sustained changes in consumer behavior, among others. Moreover, investors are cautioned to interpret many of the risks identified under the section titled “Risk Factors” in our Annual Report on Form 10-K for the fiscal year ended December 31, 2020 and in the Company’s quarterly reports on Form 10-Q as being heightened as a result of the ongoing and numerous adverse impacts of the COVID-19 pandemic.
Additional risks, uncertainties and other factors that might cause such differences, some of which could be material, include but are not limited to: the risks associated with the merger with RPAI, including the integration of the businesses of the combined company, the ability to achieve expected synergies or costs savings and potential disruptions to the Company’s plans and operations; national and local economic, business, real estate and other market conditions, particularly in connection with low or negative growth in the U.S. economy as well as economic uncertainty (including the potential effects of inflation); the risk that our actual NOI for leases that have signed but not yet opened will not be consistent with expected NOI for leases that have signed but not yet opened; financing risks, including the availability of, and costs associated with, sources of liquidity; the Company’s ability to refinance, or extend the maturity dates of, the Company’s indebtedness; the level and volatility of interest rates; the financial stability of tenants; the competitive environment in which the Company operates, including potential oversupplies of and reduction in demand for rental space; acquisition, disposition, development and joint venture risks; property ownership and management risks, including the relative illiquidity of real estate investments, and expenses, vacancies or the inability to rent space on favorable terms or at all; the Company’s ability to maintain the Company’s status as a real estate investment trust for U.S. federal income tax purposes; potential environmental and other liabilities; impairment in the value of real estate
iii | |||||
property the Company owns; the attractiveness of our properties to tenants, the actual and perceived impact of e-commerce on the value of shopping center assets and changing demographics and customer traffic patterns; risks related to our current geographical concentration of the Company’s properties in Texas, Florida, New York, Maryland, and North Carolina; civil unrest, acts of terrorism or war, acts of God, climate change, epidemics, pandemics (including COVID-19), natural disasters and severe weather conditions, including such events that may result in underinsured or uninsured losses or other increased costs and expenses; changes in laws and government regulations including governmental orders affecting the use of the Company’s properties or the ability of its tenants to operate, and the costs of complying with such changed laws and government regulations; possible short-term or long-term changes in consumer behavior due to COVID-19 and the fear of future pandemics; our ability to satisfy environmental, social or governance standards set by various constituencies; insurance costs and coverage; risks associated with cybersecurity attacks and the loss of confidential information and other business disruptions; other factors affecting the real estate industry generally; and other risks identified in reports the Company files with the Securities and Exchange Commission (“the SEC”) or in other documents that it publicly disseminates, including, in particular, the section titled “Risk Factors” in the Company’s Annual Report on Form 10-K for the fiscal year ended December 31, 2020, and in the Company’s quarterly reports on Form 10-Q. The Company undertakes no obligation to publicly update or revise these forward-looking statements, whether as a result of new information, future events or otherwise.
This Earnings Release also includes certain forward-looking non-GAAP information. Due to high variability and difficulty in making accurate forecasts and projections of some of the information excluded from these estimates, together with some of the excluded information not being ascertainable or accessible, the Company is unable to quantify certain amounts that would be required to be included in the most directly comparable GAAP financial measures without unreasonable efforts.
iv | |||||
Kite Realty Group Trust
Contact Information
Corporate Office
30 South Meridian Street, Suite 1100
Indianapolis, IN 46204
(888) 577-5600
(317) 577-5600
www.kiterealty.com
| Investor Relations Contact | Analyst Coverage | Analyst Coverage | ||||||||||||
| Jason Colton | Robert W. Baird & Co. | Green Street Advisors, Inc. | ||||||||||||
| Senior Vice President, Capital Markets and IR | Mr. Wes Golladay | Mr. Vince Tibone | ||||||||||||
| Kite Realty Group Trust | (216) 737-7510 | (949) 640-8780 | ||||||||||||
| 30 South Meridian Street, Suite 1100 | wgolladay@rwbaird.com | vtibone@greenstreet.com | ||||||||||||
| Indianapolis, IN 46204 | ||||||||||||||
| (317) 713-2762 | Bank of America/Merrill Lynch | Jefferies LLC | ||||||||||||
| jcolton@kiterealty.com | Mr. Jeffrey Spector/Mr. Craig Schmidt | Ms. Linda Tsai | ||||||||||||
| (646) 855-1363/(646) 855-3640 | (212) 778-8011 | |||||||||||||
| jeff.spector@bofa.com | ltsai@jefferies.com | |||||||||||||
| Transfer Agent | craig.schmidt@bofa.com | |||||||||||||
| Broadridge Financial Solutions | KeyBanc Capital Markets | |||||||||||||
| Ms. Kristen Tartaglione | Barclays | Mr. Jordan Sadler/Mr. Todd Thomas | ||||||||||||
2 Journal Square, 7th Floor | Mr. Anthony F. Powell | (917) 368-2280/(917) 368-2286 | ||||||||||||
| Jersey City, NJ 07306 | (212) 526-8768 | tthomas@keybanccm.com | ||||||||||||
| (201) 714-8094 | anthony.powell@barclays.com | jsadler@keybanccm.com | ||||||||||||
| BTIG | Raymond James | |||||||||||||
| Stock Specialist | Mr. Michael Gorman | Mr. RJ Milligan | ||||||||||||
| GTS | (212) 738-6138 | (727) 567-2585 | ||||||||||||
| 545 Madison Avenue | mgorman@btig.com | rjmilligann@raymondjames.com | ||||||||||||
| 15th Floor | ||||||||||||||
| New York, NY 10022 | Capital One Securities, Inc. | Piper Sandler | ||||||||||||
| (212) 715-2830 | Mr. Christopher Lucas | Mr. Alexander Goldfarb | ||||||||||||
| (571) 633-8151 | (212) 466-7937 | |||||||||||||
| christopher.lucas@capitalone.com | alexander.goldfarb@psc.com | |||||||||||||
| Citigroup Global Markets | Wells Fargo Securities, LLC | |||||||||||||
| Mr. Michael Bilerman/Ms. Katy McConnell | Ms. Tamara Fique | |||||||||||||
| (212) 816-1383/(212) 816-6981 | (617) 603-4262/(443) 263-6568 | |||||||||||||
| michael.bilerman@citigroup.com | tamara.fique@wellsfargo.com | |||||||||||||
| katy.mcconnell@citigroup.com | ||||||||||||||
| Compass Point Research & Trading, LLC | ||||||||||||||
| Mr. Floris van Dijkum | ||||||||||||||
| (646) 757-2621 | ||||||||||||||
| fvandijkum@compasspointllc.com | ||||||||||||||
| 4th Quarter 2021 Supplemental Financial and Operating Statistics | 1 | ||||
Kite Realty Group Trust
Results Overview
(dollars in thousands, except per share and per square foot amounts)
| Three Months Ended December 31, | Year Ended December 31, | ||||||||||||||||||||||
| Summary Financial Results | 2021 | 2020 | 2021 | 2020 | |||||||||||||||||||
| Total revenue (page 4) | $ | 162,950 | $ | 68,360 | $ | 373,324 | $ | 266,645 | |||||||||||||||
| Net loss attributable to common shareholders (page 4) | $ | (98,181) | $ | (6,794) | $ | (80,806) | $ | (16,223) | |||||||||||||||
| Net loss per diluted share (page 4) | $ | (0.52) | $ | (0.08) | $ | (0.73) | $ | (0.19) | |||||||||||||||
| Net operating income (NOI) (page 6) | $ | 115,312 | $ | 48,403 | $ | 266,988 | $ | 189,389 | |||||||||||||||
| Adjusted EBITDA (page 6) | $ | 105,103 | $ | 37,627 | $ | 234,247 | $ | 158,926 | |||||||||||||||
| NAREIT Funds From Operations (FFO) (page 7) | $ | 6,220 | $ | 25,450 | $ | 88,389 | $ | 108,707 | |||||||||||||||
| NAREIT FFO per diluted share (page 7) | $ | 0.03 | $ | 0.29 | $ | 0.78 | $ | 1.26 | |||||||||||||||
| FFO, as adjusted (page 7) | $ | 82,406 | $ | 28,703 | $ | 171,204 | $ | 111,960 | |||||||||||||||
| FFO, as adjusted per diluted share (page 7) | $ | 0.43 | $ | 0.33 | $ | 1.50 | $ | 1.29 | |||||||||||||||
| Dividends paid per share (page 4) | $ | 0.18 | $ | 0.08 | $ | 0.68 | $ | 0.4495 | |||||||||||||||
| Dividend payout ratio (as % of NAREIT FFO, as adjusted) | 42 | % | 24 | % | 45 | % | 35 | % | |||||||||||||||
| Three Months Ended | |||||||||||||||||||||||||||||
| Summary Operating and Financial Ratios | December 31, 2021 | September 30, 2021 | June 30, 2021 | March 31, 2021 | December 31, 2020 | ||||||||||||||||||||||||
| NOI margin (page 6) | 71.0 | % | 73.7 | % | 73.4 | % | 72.0 | % | 71.5 | % | |||||||||||||||||||
| NOI margin – retail (page 6) | 71.6 | % | 74.3 | % | 74.0 | % | 72.7 | % | 72.3 | % | |||||||||||||||||||
| Same property NOI performance (page 5) | 7.2 | % | 10.8 | % | 10.1 | % | (2.9) | % | (10.5) | % | |||||||||||||||||||
| Total property NOI performance (page 5) | 138.2 | % | 15.2 | % | 11.0 | % | (1.6) | % | (11.2) | % | |||||||||||||||||||
| Net debt to Adjusted EBITDA, current quarter (page 9) | 6.0x | 6.1x | 6.4x | 6.5x | 7.0x | ||||||||||||||||||||||||
| Recovery ratio of retail operating properties (page 6) | 84.7 | % | 89.4 | % | 88.1 | % | 90.6 | % | 92.8 | % | |||||||||||||||||||
| Recovery ratio of consolidated portfolio (page 6) | 79.2 | % | 86.1 | % | 84.1 | % | 87.3 | % | 89.1 | % | |||||||||||||||||||
| Outstanding Classes of Stock | |||||||||||||||||||||||||||||
| Common shares and units outstanding (page 18) | 221,327,346 | 87,004,756 | 87,002,502 | 86,967,035 | 86,711,910 | ||||||||||||||||||||||||
| Summary Portfolio Statistics | |||||||||||||||||||||||||||||
| Number of properties | |||||||||||||||||||||||||||||
| Operating retail (page 14) | 180 | 83 | 83 | 83 | 83 | ||||||||||||||||||||||||
| Office and other components | 12 | 4 | 4 | 4 | 4 | ||||||||||||||||||||||||
| Development and redevelopment projects (page 13) | 8 | 5 | 3 | 3 | 3 | ||||||||||||||||||||||||
Owned retail operating gross leasable area (GLA)1 (page 14) | 29.0 | M | 11.7 | M | 11.7 | M | 11.7 | M | 11.7 | M | |||||||||||||||||||
| Owned office GLA (page 14) | 1.6 | M | 0.4 | M | 0.4 | M | 0.4 | M | 0.4 | M | |||||||||||||||||||
| Number of multifamily units | 972 | 576 | 291 | 291 | 291 | ||||||||||||||||||||||||
| Percent leased – total | 93.3 | % | 93.0 | % | 91.7 | % | 90.8 | % | 91.4 | % | |||||||||||||||||||
| Percent leased – retail | 93.4 | % | 92.8 | % | 91.5 | % | 90.5 | % | 91.2 | % | |||||||||||||||||||
| Anchor | 95.9 | % | 94.8 | % | 93.2 | % | 92.0 | % | 92.9 | % | |||||||||||||||||||
| Small shop | 88.3 | % | 88.7 | % | 87.8 | % | 87.5 | % | 87.6 | % | |||||||||||||||||||
| Annualized base rent (ABR) per square foot | $ | 19.36 | $ | 18.54 | $ | 18.48 | $ | 18.53 | $ | 18.42 | |||||||||||||||||||
| Total new and renewal lease GLA (page 16) | 927,065 | 584,820 | 637,995 | 426,937 | 533,569 | ||||||||||||||||||||||||
| New lease cash rent spread (page 16) | 27.4 | % | 20.6 | % | 19.7 | % | 25.3 | % | (4.1) | % | |||||||||||||||||||
| Renewal lease cash rent spread (page 16) | 8.3 | % | 10.4 | % | 7.5 | % | 2.0 | % | 1.0 | % | |||||||||||||||||||
| Total new and renewal lease cash rent spread (page 16) | 12.9 | % | 13.4 | % | 9.2 | % | 6.4 | % | (0.7) | % | |||||||||||||||||||
| 2022 Guidance | Current (as of 2/14/22) | ||||
| NAREIT FFO per diluted share | $1.67 to $1.73 | ||||
| Credit Ratings and Outlook | |||||
| Moody's Investors Services | Baa3 / Stable | ||||
| Standard & Poor's Rating Services | BBB- / Stable | ||||
| Fitch Ratings | BBB / Stable | ||||
1Owned GLA represents gross leasable area owned by the Company and excludes the square footage of non-retail property components and development and redevelopment projects.
| 4th Quarter 2021 Supplemental Financial and Operating Statistics | 2 | ||||
Kite Realty Group Trust
Consolidated Balance Sheets
(dollars in thousands)
(unaudited)
| December 31, 2021 | December 31, 2020 | ||||||||||
| Assets: | |||||||||||
| Investment properties, at cost | $ | 7,497,811 | $ | 3,143,961 | |||||||
| Less: accumulated depreciation | (884,809) | (755,100) | |||||||||
| Net investment properties | 6,613,002 | 2,388,861 | |||||||||
| Cash and cash equivalents | 93,241 | 43,648 | |||||||||
Tenant and other receivables, including accrued straight-line rent of $28,071 and $24,783, respectively | 68,444 | 57,154 | |||||||||
| Restricted cash and escrow deposits | 7,122 | 2,938 | |||||||||
| Deferred costs, net | 601,853 | 63,171 | |||||||||
| Short-term deposits | 125,000 | — | |||||||||
| Prepaid and other assets | 84,826 | 39,975 | |||||||||
| Investments in unconsolidated subsidiaries | 11,885 | 12,792 | |||||||||
| Total assets | $ | 7,605,373 | $ | 2,608,539 | |||||||
| Liabilities and Shareholders’ Equity: | |||||||||||
| Mortgage and other indebtedness, net | $ | 3,150,808 | $ | 1,170,794 | |||||||
| Accounts payable and accrued expenses | 184,982 | 77,469 | |||||||||
| Deferred revenue and other liabilities | 287,217 | 85,649 | |||||||||
| Total liabilities | 3,623,007 | 1,333,912 | |||||||||
| Commitments and contingencies | |||||||||||
Limited Partners’ interests in the Operating Partnership and other redeemable noncontrolling interests | 55,173 | 43,275 | |||||||||
| Shareholders’ Equity: | |||||||||||
| Kite Realty Group Trust Shareholders’ Equity: | |||||||||||
Common Shares, $0.01 par value, 490,000,000 and 225,000,000 shares authorized, 218,949,569 and 84,187,999 shares issued and outstanding at December 31, 2021 and 2020, respectively | 2,189 | 842 | |||||||||
| Additional paid-in capital | 4,898,673 | 2,085,003 | |||||||||
| Accumulated other comprehensive loss | (15,902) | (30,885) | |||||||||
| Accumulated deficit | (962,913) | (824,306) | |||||||||
| Total Kite Realty Group Trust shareholders’ equity | 3,922,047 | 1,230,654 | |||||||||
| Noncontrolling interests | 5,146 | 698 | |||||||||
| Total equity | 3,927,193 | 1,231,352 | |||||||||
| Total liabilities and shareholders’ equity | $ | 7,605,373 | $ | 2,608,539 | |||||||
| 4th Quarter 2021 Supplemental Financial and Operating Statistics | 3 | ||||
Kite Realty Group Trust
Consolidated Statements of Operations
(dollars in thousands, except per share amounts)
(unaudited)
| Three Months Ended December 31, | Year Ended December 31, | ||||||||||||||||||||||
| 2021 | 2020 | 2021 | 2020 | ||||||||||||||||||||
| Revenue: | |||||||||||||||||||||||
| Rental income | $ | 161,302 | $ | 66,311 | $ | 367,399 | $ | 257,670 | |||||||||||||||
| Other property-related revenue | 1,550 | 1,970 | 4,683 | 8,597 | |||||||||||||||||||
| Fee income | 98 | 79 | 1,242 | 378 | |||||||||||||||||||
| Total revenue | 162,950 | 68,360 | 373,324 | 266,645 | |||||||||||||||||||
| Expenses: | |||||||||||||||||||||||
| Property operating | 24,583 | 10,562 | 55,561 | 41,012 | |||||||||||||||||||
| Real estate taxes | 22,956 | 9,316 | 49,530 | 35,867 | |||||||||||||||||||
| General, administrative and other | 10,308 | 10,855 | 33,984 | 30,840 | |||||||||||||||||||
| Merger and acquisition costs | 76,564 | — | 86,522 | — | |||||||||||||||||||
| Depreciation and amortization | 109,835 | 31,818 | 200,460 | 128,648 | |||||||||||||||||||
| Total expenses | 244,246 | 62,551 | 426,057 | 236,367 | |||||||||||||||||||
| Gain (loss) on sales of operating properties, net | 3,692 | (159) | 31,209 | 4,733 | |||||||||||||||||||
| Operating (loss) income | (77,604) | 5,650 | (21,524) | 35,011 | |||||||||||||||||||
| Interest expense | (23,061) | (12,284) | (60,447) | (50,399) | |||||||||||||||||||
| Income tax benefit of taxable REIT subsidiary | 2 | 200 | 310 | 696 | |||||||||||||||||||
| Equity in earnings (loss) of unconsolidated subsidiaries | 342 | (429) | (416) | (1,685) | |||||||||||||||||||
| Other income, net | 166 | 21 | 355 | 254 | |||||||||||||||||||
| Net loss | (100,155) | (6,842) | (81,722) | (16,123) | |||||||||||||||||||
| Net loss (income) attributable to noncontrolling interests | 1,974 | 48 | 916 | (100) | |||||||||||||||||||
Net loss attributable to Kite Realty Group Trust common shareholders | $ | (98,181) | $ | (6,794) | $ | (80,806) | $ | (16,223) | |||||||||||||||
| Net loss per common share – basic and diluted | $ | (0.52) | $ | (0.08) | $ | (0.73) | $ | (0.19) | |||||||||||||||
| Weighted average common shares outstanding – basic and diluted | 188,291,354 | 84,192,462 | 110,637,562 | 84,142,261 | |||||||||||||||||||
| Dividends paid per common share | $ | 0.18 | $ | 0.08 | $ | 0.68 | $ | 0.4495 | |||||||||||||||
| 4th Quarter 2021 Supplemental Financial and Operating Statistics | 4 | ||||
Kite Realty Group Trust
Same Property Net Operating Income (“NOI”)
(dollars in thousands)
(unaudited)
| Three Months Ended December 31, | Year Ended December 31, | ||||||||||||||||||||||||||||||||||
| 2021 | 2020 | Change | 2021 | 2020 | Change | ||||||||||||||||||||||||||||||
Number of properties for the period1 | 82 | 82 | 82 | 82 | |||||||||||||||||||||||||||||||
| Leased percentage at period end | 93.1 | % | 91.4 | % | 93.1 | % | 91.4 | % | |||||||||||||||||||||||||||
Economic occupancy percentage2 | 89.0 | % | 90.4 | % | 89.1 | % | 92.0 | % | |||||||||||||||||||||||||||
| Minimum rent | $ | 49,629 | $ | 48,809 | $ | 199,014 | $ | 199,615 | |||||||||||||||||||||||||||
| Tenant recoveries | 14,878 | 15,631 | 59,669 | 61,231 | |||||||||||||||||||||||||||||||
| Bad debt (provision) recovery | (498) | (2,880) | 709 | (12,065) | |||||||||||||||||||||||||||||||
| Other income, net | 562 | 169 | 1,396 | 626 | |||||||||||||||||||||||||||||||
| Total revenue | 64,571 | 61,729 | 260,788 | 249,407 | |||||||||||||||||||||||||||||||
| Property operating expenses | (9,461) | (9,301) | (36,001) | (34,838) | |||||||||||||||||||||||||||||||
| Real estate taxes | (8,484) | (8,915) | (34,555) | (35,244) | |||||||||||||||||||||||||||||||
| Total expenses | (17,945) | (18,216) | (70,556) | (70,082) | |||||||||||||||||||||||||||||||
| Same Property NOI | $ | 46,626 | $ | 43,513 | 7.2 | % | $ | 190,232 | $ | 179,325 | 6.1 | % | |||||||||||||||||||||||
Reconciliation of Same Property NOI to most directly comparable GAAP measure: | |||||||||||||||||||||||||||||||||||
| Net operating income – same properties | $ | 46,626 | $ | 43,513 | $ | 190,232 | $ | 179,325 | |||||||||||||||||||||||||||
Net operating income – non-same activity3 | 68,687 | 4,890 | 76,759 | 10,063 | |||||||||||||||||||||||||||||||
| Total property net operating income | 115,313 | 48,403 | 138.2 | % | 266,991 | 189,388 | 41.0 | % | |||||||||||||||||||||||||||
| Other income (expense), net | 608 | (129) | 1,491 | (357) | |||||||||||||||||||||||||||||||
| General, administrative and other | (10,308) | (10,855) | (33,984) | (30,840) | |||||||||||||||||||||||||||||||
| Merger and acquisition costs | (76,564) | — | (86,522) | — | |||||||||||||||||||||||||||||||
| Depreciation and amortization | (109,835) | (31,818) | (200,460) | (128,648) | |||||||||||||||||||||||||||||||
| Interest expense | (23,061) | (12,284) | (60,447) | (50,399) | |||||||||||||||||||||||||||||||
| Gain (loss) on sales of operating properties, net | 3,692 | (159) | 31,209 | 4,733 | |||||||||||||||||||||||||||||||
Net loss (income) attributable to noncontrolling interests | 1,974 | 48 | 916 | (100) | |||||||||||||||||||||||||||||||
| Net loss attributable to common shareholders | $ | (98,181) | $ | (6,794) | $ | (80,806) | $ | (16,223) | |||||||||||||||||||||||||||
| 1 | Same Property NOI excludes (i) the recently completed Glendale Town Center and Eddy Street Commons – Phase II, (ii) development and redevelopment projects noted on page 13, (iii) the 2020 acquisition of Eastgate Crossing, (iv) the legacy RPAI portfolio, and (v) office properties. | ||||
| 2 | Excludes leases that are signed but for which tenants have not yet commenced the payment of cash rent. Calculated as a weighted average based on the timing of cash rent commencement and expiration during the period. | ||||
| 3 | Includes non-cash activity across the portfolio as well as net operating income from properties not included in the same property pool including properties sold during both periods. | ||||
| 4th Quarter 2021 Supplemental Financial and Operating Statistics | 5 | ||||
Kite Realty Group Trust
Net Operating Income and EBITDA by Quarter
(dollars in thousands)
(unaudited)
| Three Months Ended | |||||||||||||||||||||||||||||
| December 31, 2021 | September 30, 2021 | June 30, 2021 | March 31, 2021 | December 31, 2020 | |||||||||||||||||||||||||
| Revenue: | |||||||||||||||||||||||||||||
Minimum rent1 | $ | 121,615 | $ | 49,497 | $ | 49,097 | $ | 49,801 | $ | 49,506 | |||||||||||||||||||
| Minimum rent – ground leases | 7,129 | 3,663 | 3,656 | 4,038 | 4,190 | ||||||||||||||||||||||||
| Tenant reimbursements | 33,870 | 15,186 | 14,308 | 15,389 | 15,863 | ||||||||||||||||||||||||
| Bad debt (expense) recovery | (1,636) | 1,709 | 597 | (1,420) | (3,412) | ||||||||||||||||||||||||
| Other property-related revenue | 450 | 258 | 336 | 549 | 1,675 | ||||||||||||||||||||||||
| Overage rent | 324 | 161 | 332 | 82 | 164 | ||||||||||||||||||||||||
Parking revenue, net2 | 552 | 320 | 152 | (1) | (257) | ||||||||||||||||||||||||
| Total revenue | 162,304 | 70,794 | 68,478 | 68,438 | 67,729 | ||||||||||||||||||||||||
| Expenses: | |||||||||||||||||||||||||||||
Property operating – recoverable3 | 19,991 | 9,185 | 8,666 | 8,407 | 8,688 | ||||||||||||||||||||||||
Property operating – non-recoverable3 | 4,237 | 1,001 | 1,229 | 1,547 | 1,516 | ||||||||||||||||||||||||
| Real estate taxes | 22,764 | 8,444 | 8,343 | 9,212 | 9,122 | ||||||||||||||||||||||||
| Total expenses | 46,992 | 18,630 | 18,238 | 19,166 | 19,326 | ||||||||||||||||||||||||
| Net Operating Income | 115,312 | 52,164 | 50,240 | 49,272 | 48,403 | ||||||||||||||||||||||||
| Other (expense) income: | |||||||||||||||||||||||||||||
| General, administrative and other | (10,307) | (8,241) | (8,159) | (7,276) | (7,602) | ||||||||||||||||||||||||
| Severance charges | — | — | — | — | (3,253) | ||||||||||||||||||||||||
| Fee income | 98 | 195 | 515 | 434 | 79 | ||||||||||||||||||||||||
| Total other (expense) income | (10,209) | (8,046) | (7,644) | (6,842) | (10,776) | ||||||||||||||||||||||||
| Adjusted EBITDA | 105,103 | 44,118 | 42,596 | 42,430 | 37,627 | ||||||||||||||||||||||||
| Depreciation and amortization | (109,835) | (30,193) | (29,798) | (30,634) | (31,818) | ||||||||||||||||||||||||
| Merger and acquisition costs | (76,564) | (9,198) | (760) | — | — | ||||||||||||||||||||||||
| Interest expense | (23,061) | (12,878) | (12,266) | (12,242) | (12,284) | ||||||||||||||||||||||||
| Equity in earnings (loss) of unconsolidated subsidiaries | 342 | (196) | (244) | (318) | (429) | ||||||||||||||||||||||||
| Income tax benefit of taxable REIT subsidiary | 2 | 91 | 100 | 118 | 200 | ||||||||||||||||||||||||
| Other income (expense), net | 166 | 168 | 227 | (206) | 21 | ||||||||||||||||||||||||
| Gain (loss) on sales of operating properties, net | 3,692 | 1,260 | 50 | 26,207 | (159) | ||||||||||||||||||||||||
| Net (loss) income | (100,155) | (6,828) | (95) | 25,355 | (6,842) | ||||||||||||||||||||||||
Less: net loss (income) attributable to noncontrolling interests | 1,974 | (132) | (147) | (778) | 48 | ||||||||||||||||||||||||
| Net (loss) income attributable to Kite Realty Group Trust | $ | (98,181) | $ | (6,960) | $ | (242) | $ | 24,577 | $ | (6,794) | |||||||||||||||||||
| NOI/Revenue – Retail Properties | 71.6 | % | 74.3 | % | 74.0 | % | 72.7 | % | 72.3 | % | |||||||||||||||||||
| NOI/Revenue | 71.0 | % | 73.7 | % | 73.4 | % | 72.0 | % | 71.5 | % | |||||||||||||||||||
Recovery Ratios4 | |||||||||||||||||||||||||||||
| – Retail Properties | 84.7 | % | 89.4 | % | 88.1 | % | 90.6 | % | 92.8 | % | |||||||||||||||||||
| – Consolidated | 79.2 | % | 86.1 | % | 84.1 | % | 87.3 | % | 89.1 | % | |||||||||||||||||||
| 1 | Minimum rent includes $0.5 million, $33,000, $0.3 million, $1.2 million, and $0.6 million of lease termination income for the three months ended December 31, 2021, September 30, 2021, June 30, 2021, March 31, 2021, and December, 31, 2020, respectively. | ||||
| 2 | Parking revenue, net represents the net operating results of the Eddy Street Parking Garage, the Union Station Parking Garage, and the Pan Am Plaza Parking Garage. | ||||
| 3 | Recoverable expenses include recurring G&A expense of $2.8 million allocable to the property operations in the three months ended December 31, 2021, a portion of which is recoverable. Non-recoverable expenses primarily include ground rent, professional fees, and marketing costs. | ||||
| 4 | “Recovery Ratios” are computed by dividing tenant reimbursements by the sum of recoverable property operating expense and real estate tax expense. | ||||
| 4th Quarter 2021 Supplemental Financial and Operating Statistics | 6 | ||||
Kite Realty Group Trust
Funds From Operations (“FFO”)1,2
(dollars in thousands, except per share amounts)
(unaudited)
| Three Months Ended December 31, | Year Ended December 31, | ||||||||||||||||||||||
| 2021 | 2020 | 2021 | 2020 | ||||||||||||||||||||
| Consolidated net loss | $ | (100,155) | $ | (6,842) | $ | (81,722) | $ | (16,123) | |||||||||||||||
| Less: net income attributable to noncontrolling interests in properties | (118) | (132) | (514) | (528) | |||||||||||||||||||
| Less: (gain) loss on sales of operating properties, net | (3,692) | 159 | (31,209) | (4,733) | |||||||||||||||||||
Add: depreciation and amortization of consolidated and unconsolidated entities, net of noncontrolling interests | 110,185 | 32,265 | 201,834 | 130,091 | |||||||||||||||||||
FFO of the Operating Partnership1 | 6,220 | 25,450 | 88,389 | 108,707 | |||||||||||||||||||
| Less: Limited Partners' interests in FFO | 356 | (662) | (1,945) | (2,826) | |||||||||||||||||||
FFO attributable to Kite Realty Group Trust common shareholders1 | $ | 6,576 | $ | 24,788 | $ | 86,444 | $ | 105,881 | |||||||||||||||
| FFO, as defined by NAREIT, per share of the Operating Partnership – basic | $ | 0.03 | $ | 0.29 | $ | 0.78 | $ | 1.26 | |||||||||||||||
| FFO, as defined by NAREIT, per share of the Operating Partnership – diluted | $ | 0.03 | $ | 0.29 | $ | 0.78 | $ | 1.26 | |||||||||||||||
FFO of the Operating Partnership1 | $ | 6,220 | $ | 25,450 | $ | 88,389 | $ | 108,707 | |||||||||||||||
| Add: merger and acquisition costs | 76,564 | — | 86,522 | — | |||||||||||||||||||
| Add: severance charges | — | 3,253 | — | 3,253 | |||||||||||||||||||
| Less: 2020 Collection Impact | (378) | — | (3,707) | — | |||||||||||||||||||
| FFO, as adjusted, of the Operating Partnership | $ | 82,406 | $ | 28,703 | $ | 171,204 | $ | 111,960 | |||||||||||||||
| FFO, as adjusted, per share of the Operating Partnership – basic | $ | 0.43 | $ | 0.33 | $ | 1.51 | $ | 1.30 | |||||||||||||||
| FFO, as adjusted, per share of the Operating Partnership – diluted | $ | 0.43 | $ | 0.33 | $ | 1.50 | $ | 1.29 | |||||||||||||||
| Weighted average common shares outstanding – basic | 188,291,354 | 84,192,462 | 110,637,562 | 84,142,261 | |||||||||||||||||||
| Weighted average common shares outstanding – diluted | 189,419,768 | 84,371,027 | 111,524,655 | 84,309,712 | |||||||||||||||||||
| Weighted average common shares and units outstanding – basic | 190,706,414 | 86,420,398 | 113,103,177 | 86,361,139 | |||||||||||||||||||
| Weighted average common shares and units outstanding – diluted | 191,834,828 | 86,598,962 | 113,990,269 | 86,528,591 | |||||||||||||||||||
| FFO, as defined by NAREIT, per diluted share/unit | |||||||||||||||||||||||
| Consolidated net loss | $ | (0.52) | $ | (0.08) | $ | (0.72) | $ | (0.19) | |||||||||||||||
| Less: net income attributable to noncontrolling interests in properties | — | — | — | (0.01) | |||||||||||||||||||
| Less: (gain) loss on sales of operating properties, net | (0.02) | — | (0.27) | (0.05) | |||||||||||||||||||
Add: depreciation and amortization of consolidated and unconsolidated entities, net of noncontrolling interests | 0.57 | 0.37 | 1.78 | 1.50 | |||||||||||||||||||
FFO, as defined by NAREIT, of the Operating Partnership per diluted share/unit1,2 | $ | 0.03 | $ | 0.29 | $ | 0.78 | $ | 1.26 | |||||||||||||||
| Add: merger and acquisition costs | 0.40 | — | 0.76 | — | |||||||||||||||||||
| Add: severance charges | — | 0.04 | — | 0.04 | |||||||||||||||||||
| Less: 2020 Collection Impact | — | — | (0.03) | — | |||||||||||||||||||
FFO, as adjusted, of the Operating Partnership per diluted share/unit2 | $ | 0.43 | $ | 0.33 | $ | 1.50 | $ | 1.29 | |||||||||||||||
| Reconciliation of FFO, as adjusted, to Adjusted Funds from Operations (AFFO) | |||||||||||||||||||||||
| FFO, as adjusted, of the Operating Partnership | $ | 82,406 | $ | 28,703 | $ | 171,204 | $ | 111,960 | |||||||||||||||
| Less (plus): non-cash income adjustments | 4,834 | 454 | 261 | (6,440) | |||||||||||||||||||
| Less: maintenance capital expenditures | 2,954 | 455 | 3,761 | 1,740 | |||||||||||||||||||
Less: tenant-related capital expenditures3 | 9,343 | 4,467 | 14,667 | 11,957 | |||||||||||||||||||
| Total Recurring AFFO of the Operating Partnership | $ | 65,275 | $ | 23,327 | $ | 152,515 | $ | 104,703 | |||||||||||||||
| 1 | “FFO of the Operating Partnership” measures 100% of the operating performance of the Operating Partnership’s real estate properties. “FFO attributable to Kite Realty Group Trust common shareholders” reflects a reduction for the redeemable noncontrolling weighted average diluted interest in the Operating Partnership. | ||||
| 2 | Per share/unit amounts of components will not necessarily sum to the total due to rounding to the nearest cent. | ||||
| 3 | Excludes landlord work, tenant improvements and leasing commissions relating to development and redevelopment projects. | ||||
| 4th Quarter 2021 Supplemental Financial and Operating Statistics | 7 | ||||
Kite Realty Group Trust
Joint Venture Summary as of December 31, 2021
(dollars in thousands)
| Consolidated Investments | ||||||||||||||||||||||||||||||||||||||
| Investments | Total Debt | Partner Economic Ownership Interest1 | Partner Share of Debt | Partner Share of Annual Income | ||||||||||||||||||||||||||||||||||
| Delray Marketplace | $ | 29,013 | 2 | % | $ | 580 | $ | — | ||||||||||||||||||||||||||||||
| Crossing at Killingly Commons | — | 10 | % | — | 528 | |||||||||||||||||||||||||||||||||
| One Loudoun – Pads G&H Residential | — | 10 | % | — | (14) | |||||||||||||||||||||||||||||||||
| Total | $ | 29,013 | $ | 580 | $ | 514 | ||||||||||||||||||||||||||||||||
| Unconsolidated Investments | ||||||||||||||||||||||||||||||||||||||||||||||||||||||||
| Investments | Retail GLA | Multifamily Units | Total Debt | KRG Economic Ownership Interest | KRG Share of Debt | KRG Investment | KRG Share of Quarterly EBITDA | KRG Share of Quarterly EBITDA Annualized | ||||||||||||||||||||||||||||||||||||||||||||||||
Three Property Retail Portfolio | 416,576 | — | $ | 51,890 | 20 | % | $ | 10,378 | $ | 7,930 | $ | 335 | $ | 1,340 | ||||||||||||||||||||||||||||||||||||||||||
Glendale Center Apartments | — | 267 | 21,861 | 12 | % | 2,514 | 1,449 | 39 | 156 | |||||||||||||||||||||||||||||||||||||||||||||||
Embassy Suites at Eddy Street Commons | — | — | 33,634 | 35 | % | 11,772 | — | 474 | 1,896 | |||||||||||||||||||||||||||||||||||||||||||||||
| The Corner (development) | 24,000 | 285 | 11,000 | 50 | % | 5,500 | — | — | — | |||||||||||||||||||||||||||||||||||||||||||||||
| Other investments | — | — | — | — | % | — | 2,500 | 34 | 136 | |||||||||||||||||||||||||||||||||||||||||||||||
| Total | 440,576 | 552 | $ | 118,385 | $ | 30,164 | $ | 11,879 | $ | 882 | $ | 3,528 | ||||||||||||||||||||||||||||||||||||||||||||
| 1 | Economic ownership % represents the partner's share of cash flow. | ||||
| 4th Quarter 2021 Supplemental Financial and Operating Statistics | 8 | ||||
Kite Realty Group Trust
Key Debt Metrics as of December 31, 2021
(dollars in thousands)
| Senior Unsecured Notes Covenants | |||||||||||
| December 31, 2021 | Debt Covenant Threshold1 | ||||||||||
| Total debt to undepreciated assets | 38% | <60% | |||||||||
| Secured debt to undepreciated assets | 5% | <40% | |||||||||
| Undepreciated unencumbered assets to unsecured debt | 275% | >150% | |||||||||
| Debt service coverage | 3.9x | >1.5x | |||||||||
| Unsecured Credit Facility Covenants | |||||||||||
| December 31, 2021 | Debt Covenant Threshold1 | ||||||||||
| Maximum leverage | 39% | <60% | |||||||||
| Minimum fixed charge coverage | 3.8x | >1.50x | |||||||||
| Secured indebtedness | 5% | <45% | |||||||||
| Unsecured debt interest coverage | 4.1x | >1.75x | |||||||||
| Unsecured leverage | 38.5% | <60% | |||||||||
| Senior Unsecured Debt Ratings | |||||||||||
| Moody's Investors Service | Baa3/Stable | ||||||||||
| Standard & Poor's Rating Services | BBB-/Stable | ||||||||||
| Fitch Ratings | BBB/Stable | ||||||||||
| Liquidity ($ in thousands) | |||||||||||
| Cash, cash equivalents, and short-term deposits | $ | 218,241 | |||||||||
| Availability under unsecured credit facility | 793,500 | ||||||||||
| $ | 1,011,741 | ||||||||||
| Unencumbered NOI as a % of Total NOI | 90 | % | |||||||||
| 1 | For a complete listing of all debt covenants related to the Company's Senior Unsecured Notes and Unsecured Credit Facility, as well as definitions of the terms, refer to the Company's filings with the SEC. | |||||||||||||
| Net Debt to EBITDA | |||||||||||
| Company's consolidated debt and share of unconsolidated debt | $ | 3,121,809 | |||||||||
| Less: cash, cash equivalents, restricted cash, and short-term deposits | (226,644) | ||||||||||
| $ | 2,895,165 | ||||||||||
| Q4 2021 EBITDA, Annualized: | |||||||||||
| – Consolidated EBITDA | $ | 420,412 | |||||||||
– Unconsolidated EBITDA1 | 3,528 | ||||||||||
– Pro forma adjustments2 | 57,471 | ||||||||||
– Minority interest EBITDA1 | (472) | 480,939 | |||||||||
| Ratio of Company share of Net Debt to EBITDA | 6.0x | ||||||||||
| 1 | See page 8 for details | ||||||||||||||||||||||
| 2 | Pro forma adjustments to reflect as if the properties (including the legacy RPAI portfolio) acquired during the 4th quarter of 2021 were owned for the entire period. | ||||||||||||||||||||||
| 4th Quarter 2021 Supplemental Financial and Operating Statistics | 9 | ||||
Kite Realty Group Trust
Summary of Outstanding Debt as of December 31, 2021
(dollars in thousands)
| Total Outstanding Debt | Amount Outstanding | Ratio | Weighted Average Interest Rate | Weighted Average Years to Maturity | |||||||||||||||||||
Fixed rate debt1 | $ | 2,853,212 | 91 | % | 4.00 | % | 4.6 | ||||||||||||||||
Variable rate debt2 | 239,013 | 8 | % | 3.01 | % | 4.2 | |||||||||||||||||
| Net premiums on acquired debt and issuance costs | 58,583 | N/A | N/A | N/A | |||||||||||||||||||
| Total consolidated debt | 3,150,808 | 99 | % | 3.92 | % | 4.6 | |||||||||||||||||
| KRG share of unconsolidated debt | 30,164 | 1 | % | 3.61 | % | 6.3 | |||||||||||||||||
| Total | $ | 3,180,972 | 100 | % | 3.92 | % | 4.6 | ||||||||||||||||
| Schedule of Maturities by Year | |||||||||||||||||||||||||||||||||||
| Secured Debt | |||||||||||||||||||||||||||||||||||
| Scheduled Principal Payments | Term Maturities | Unsecured Debt3 | Total Consolidated Debt | Total Unconsolidated Debt | Total Debt Outstanding | ||||||||||||||||||||||||||||||
| 2022 | $ | 3,674 | $ | 153,500 | $ | — | $ | 157,174 | $ | 341 | $ | 157,515 | |||||||||||||||||||||||
| 2023 | 2,600 | 191,605 | 295,000 | 489,205 | 270 | 489,475 | |||||||||||||||||||||||||||||
| 2024 | 2,721 | — | 269,635 | 272,356 | 2,796 | 275,152 | |||||||||||||||||||||||||||||
| 2025 | 2,848 | — | 430,000 | 432,848 | 10,879 | 443,727 | |||||||||||||||||||||||||||||
| 2026 | 2,981 | — | 550,000 | 552,981 | — | 552,981 | |||||||||||||||||||||||||||||
| 2027 and beyond | 30,181 | 2,480 | 1,155,000 | 1,187,661 | 15,878 | 1,203,539 | |||||||||||||||||||||||||||||
| Net premiums on acquired debt and issuance costs | — | 1,798 | 56,785 | 58,583 | — | 58,583 | |||||||||||||||||||||||||||||
| Total | $ | 45,005 | $ | 349,383 | $ | 2,756,420 | $ | 3,150,808 | $ | 30,164 | $ | 3,180,972 | |||||||||||||||||||||||
| 1 | Fixed rate debt includes the portion of variable rate debt that has been hedged by interest rate swaps. As of December 31, 2021, $720.0 million in variable rate debt is hedged to a fixed rate for a weighted average of 3.2 years. | ||||
| 2 | Variable rate debt includes the portion of fixed rate debt that has been hedged by interest rate swaps. As of December 31, 2021, $155.0 million in fixed rate debt is hedged to a floating rate for a weighted average of 3.7 years. | ||||
| 3 | This presentation reflects the Company's exercise of its option to extend the maturity date of its unsecured credit facility by one year to January 8, 2027. The ability to exercise this option is subject to certain customary conditions, which the Company does not unilaterally control. | ||||
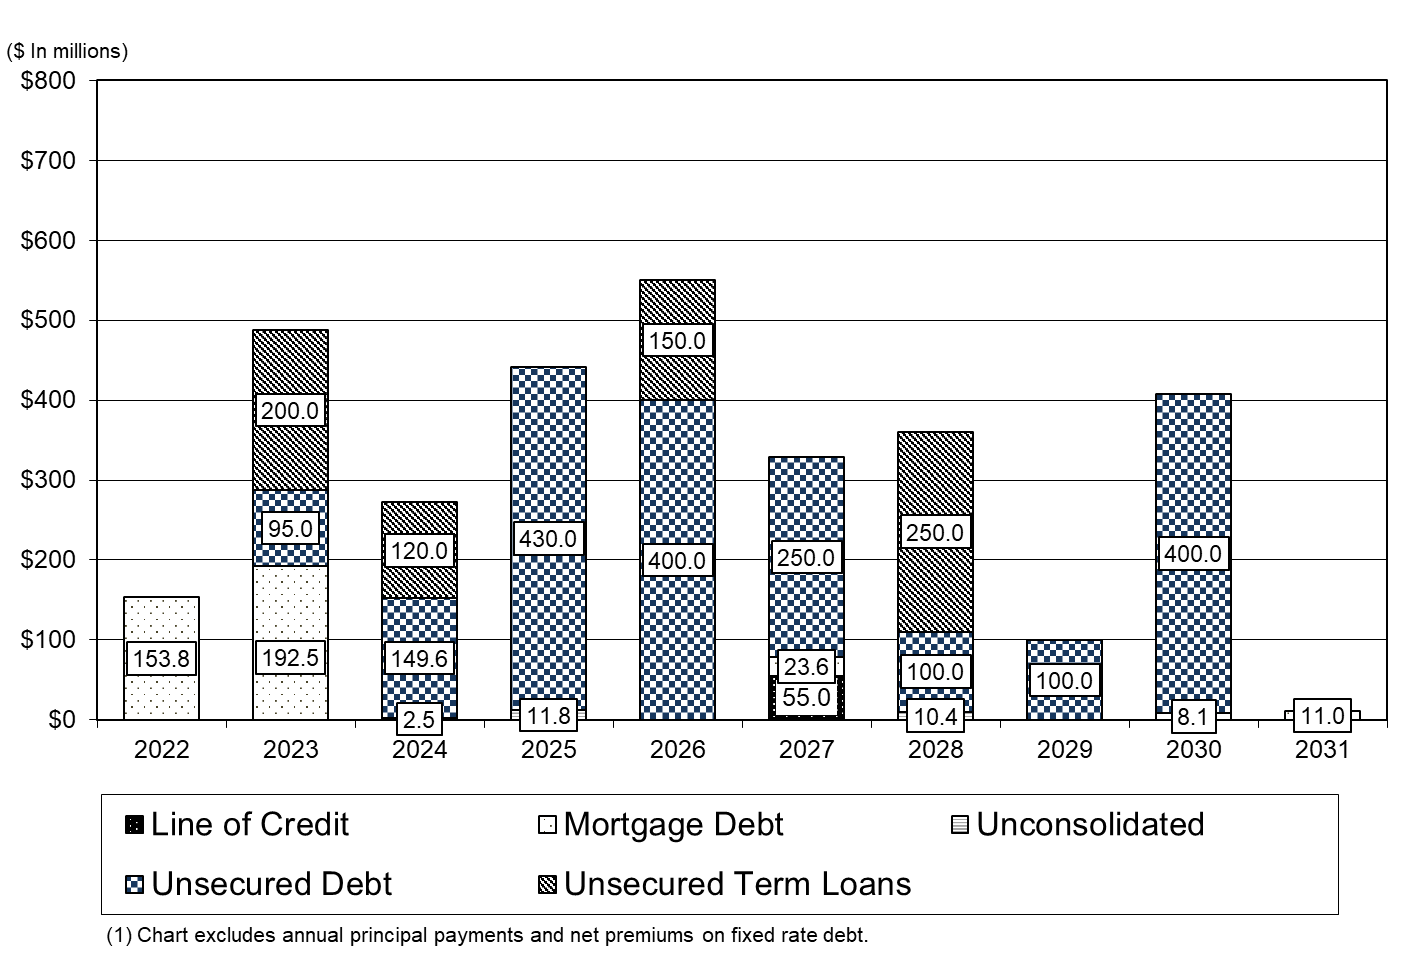
| 4th Quarter 2021 Supplemental Financial and Operating Statistics | 10 | ||||
Kite Realty Group Trust
Maturity Schedule of Outstanding Debt as of December 31, 2021
(dollars in thousands)
| Description | Interest Rate1 | Maturity Date | Balance as of December 31, 2021 | % of Total Outstanding | ||||||||||||||||||||||
Delray Marketplace2 | LIBOR + 160 | 2/5/2022 | $ | 29,013 | ||||||||||||||||||||||
| Bayonne Crossing | 4.43% | 4/1/2022 | 41,249 | |||||||||||||||||||||||
| Saxon Crossing | 4.65% | 7/1/2022 | 11,400 | |||||||||||||||||||||||
| Shops at Moore | 4.29% | 9/1/2022 | 21,300 | |||||||||||||||||||||||
| Shops at Julington Creek | 4.60% | 9/1/2022 | 4,785 | |||||||||||||||||||||||
| Centre Point Commons | 4.34% | 10/1/2022 | 14,410 | |||||||||||||||||||||||
| Miramar Square | 4.16% | 12/1/2022 | 31,625 | |||||||||||||||||||||||
| 2022 Debt Maturities | 153,782 | 5 | % | |||||||||||||||||||||||
| Centennial Gateway | 3.81% | 1/1/2023 | 23,962 | |||||||||||||||||||||||
| Gateway Village | 4.14% | 1/1/2023 | 30,996 | |||||||||||||||||||||||
| Centennial Center | 3.83% | 1/6/2023 | 70,455 | |||||||||||||||||||||||
| Eastern Beltway | 3.83% | 1/6/2023 | 34,100 | |||||||||||||||||||||||
| The Corner (AZ) | 4.10% | 3/1/2023 | 14,750 | |||||||||||||||||||||||
| Chapel Hill | 3.78% | 4/1/2023 | 18,250 | |||||||||||||||||||||||
| Senior Unsecured Note | 4.23% | 9/10/2023 | 95,000 | |||||||||||||||||||||||
Unsecured Term Loan3 | 4.10% | 11/22/2023 | 200,000 | |||||||||||||||||||||||
| 2023 Debt Maturities | 487,513 | 15 | % | |||||||||||||||||||||||
| Senior Unsecured Note | 4.58% | 6/30/2024 | 149,635 | |||||||||||||||||||||||
Unsecured Term Loan4 | 2.88% | 7/17/2024 | 120,000 | |||||||||||||||||||||||
| 2024 Debt Maturities | 269,635 | 8 | % | |||||||||||||||||||||||
| Senior Unsecured Note | 4.00% | 3/15/2025 | 350,000 | |||||||||||||||||||||||
Senior Unsecured Note5 | LIBOR + 365 | 9/10/2025 | 80,000 | |||||||||||||||||||||||
| 2025 Debt Maturities | 430,000 | 14 | % | |||||||||||||||||||||||
Unsecured Term Loan6 | 2.97% | 7/17/2026 | 150,000 | |||||||||||||||||||||||
| Senior Unsecured Note | 4.08% | 9/30/2026 | 100,000 | |||||||||||||||||||||||
| Senior Unsecured Note | 4.00% | 10/1/2026 | 300,000 | |||||||||||||||||||||||
| 2026 Debt Maturities | 550,000 | 17 | % | |||||||||||||||||||||||
Unsecured Credit Facility7 | LIBOR + 110 | 1/8/2027 | 55,000 | |||||||||||||||||||||||
| Senior Unsecured Exchangeable Notes | 0.75% | 4/1/2027 | 175,000 | |||||||||||||||||||||||
| Northgate North | 4.50% | 6/1/2027 | 23,632 | |||||||||||||||||||||||
Senior Unsecured Note5 | LIBOR + 375 | 9/10/2027 | 75,000 | |||||||||||||||||||||||
Unsecured Term Loan8 | 5.09% | 10/24/2028 | 250,000 | |||||||||||||||||||||||
| Senior Unsecured Note | 4.24% | 12/28/2028 | 100,000 | |||||||||||||||||||||||
| Senior Unsecured Note | 4.82% | 6/28/2029 | 100,000 | |||||||||||||||||||||||
| Rampart Commons | 5.73% | 6/10/2030 | 8,097 | |||||||||||||||||||||||
| Senior Unsecured Note | 4.75% | 9/15/2030 | 400,000 | |||||||||||||||||||||||
| The Shoppes at Union Hill | 3.75% | 6/1/2031 | 10,988 | |||||||||||||||||||||||
| Nora Plaza Shops | 3.80% | 2/1/2032 | 3,578 | |||||||||||||||||||||||
| 2027 and beyond Debt Maturities | 1,201,295 | 38 | % | |||||||||||||||||||||||
| Net premiums on acquired debt and issuance costs | 58,583 | |||||||||||||||||||||||||
| Total debt per consolidated balance sheet | $ | 3,150,808 | 99 | % | ||||||||||||||||||||||
| KRG share of unconsolidated debt | ||||||||||||||||||||||||||
| Embassy Suites at Eddy Street Commons | LIBOR + 250 | 7/1/2025 | $ | 11,772 | ||||||||||||||||||||||
| Glendale Center Apartments | LIBOR + 280 | 5/31/2024 | 2,514 | |||||||||||||||||||||||
| Three Property Retail Portfolio | 4.09% | 7/1/2028 | 10,378 | |||||||||||||||||||||||
| The Corner | 5.26% | 8/1/2035 | 5,500 | |||||||||||||||||||||||
| Total KRG share of unconsolidated debt | 30,164 | 1 | % | |||||||||||||||||||||||
| Total consolidated and KRG share of unconsolidated debt | $ | 3,180,972 | ||||||||||||||||||||||||
| 1 | At December 31, 2021, one-month LIBOR was 0.10% and three-month LIBOR was 0.21%. | ||||
| 2 | Property is held in a joint venture. The loan is guaranteed by Kite Realty Group, LP. | ||||
| 3 | Term loan is hedged to a fixed rate of 2.85% plus a credit spread of 1.25%. | ||||
| 4 | Term loan is hedged to a fixed rate of 1.68% plus a credit spread of 1.20%. | ||||
| 5 | Notes due 2025 are hedged to a floating rate until September 10, 2025. Notes due 2027 are hedged to a floating rate until September 10, 2025 and revert back to a fixed rate of 4.57% until maturity in 2027. | ||||
| 6 | Term loan is hedged to a fixed rate of 1.77% plus a credit spread of 1.20%. | ||||
| 7 | Assumes the Company exercises its option to extend the maturity date by one year to 2027. | ||||
| 8 | Assumes the Company exercises three one-year options to extend the maturity date to 2028. Term loan is hedged to a fixed rate of 5.09% until the initial maturity of October 24, 2025. Term loan interest rate reverts back to a floating rate of LIBOR + 200 bps beyond the initial maturity date. | ||||
| 4th Quarter 2021 Supplemental Financial and Operating Statistics | 11 | ||||
Kite Realty Group Trust
Acquisitions and Dispositions
(dollars in thousands)
Acquisitions
| Property Name | Acquisition Date | Metropolitan Statistical Area (MSA) | Property Type | GLA | Acquisition Price | |||||||||||||||||||||||||||
| Nora Plaza Shops | December 22, 2021 | Indianapolis, IN | Multi-tenant retail outparcel | 23,722 | $ | 13,500 | ||||||||||||||||||||||||||
| Total acquisitions | 23,722 | $ | 13,500 | |||||||||||||||||||||||||||||
Dispositions
| Property Name | Disposition Date | MSA | Property Type | GLA | Sales Price | |||||||||||||||||||||||||||
| Westside Market | October 26, 2021 | Dallas/Fort Worth | Multi-tenant retail | 93,377 | $ | 24,775 | ||||||||||||||||||||||||||
| Hamilton Crossing Centre | January 26, 2022 | Indianapolis | Redevelopment | — | 6,900 | |||||||||||||||||||||||||||
| Total dispositions | 93,377 | $ | 31,675 | |||||||||||||||||||||||||||||
| 4th Quarter 2021 Supplemental Financial and Operating Statistics | 12 | ||||
Kite Realty Group Trust
Development and Redevelopment Projects
(dollars in thousands)
| Project | MSA | KRG Ownership % | Projected Completion Date1 | Total Commercial GLA | Total Multifamily Units | Total Project Costs2 | KRG Equity Requirement2 | KRG Remaining Spend | Estimated Stabilized NOI to KRG | Remaining NOI to Come Online3 | ||||||||||||||||||||||||||||||||||||||||||||||||||||
| Active Projects | ||||||||||||||||||||||||||||||||||||||||||||||||||||||||||||||
| Eddy Street Commons at Notre Dame, IN – Phase III | South Bend, IN | 100% | Q1 2022 | 18,600 | — | $ | 7,500 | $ | 7,500 | $ | 1,200 | $0.6M–$0.7M | $0.4M–$0.5M | |||||||||||||||||||||||||||||||||||||||||||||||||
| Shoppes at Quarterfield | Washington, D.C./Baltimore | 100% | Q2 2022 | 58,000 | — | 4,800 | 4,800 | 3,900 | $1.0M–$1.1M | $0.0M–$0.1M | ||||||||||||||||||||||||||||||||||||||||||||||||||||
| One Loudoun – Residential | Washington, D.C./Baltimore | 90% | Q2 2022 | — | 378 | 13,500 | 13,500 | 8,325 | $6.3M–$6.5M | $4.8M–$5.0M | ||||||||||||||||||||||||||||||||||||||||||||||||||||
| Circle East | Washington, D.C./Baltimore | 100% | Q3 2022 | 82,000 | 370 | 15,100 | 15,100 | 14,700 | $1.9M–$2.2M | $1.1M–$1.4M | ||||||||||||||||||||||||||||||||||||||||||||||||||||
| One Loudoun – Pads G&H Commercial | Washington, D.C./Baltimore | 100% | Q2 2023 | 67,000 | — | 10,200 | 10,200 | 8,600 | $1.7M–$2.1M | $0.2M–$0.6M | ||||||||||||||||||||||||||||||||||||||||||||||||||||
| The Landing at Tradition – Phase II | Port St. Lucie, FL | 100% | Q2 2023 | 39,900 | — | 10,900 | 10,900 | 10,800 | $1.1M–$1.2M | $0.6M–$0.7M | ||||||||||||||||||||||||||||||||||||||||||||||||||||
| Carillon MOB | Washington, D.C./Baltimore | 100% | Q4 2024 | 126,000 | — | 59,700 | 59,700 | 57,600 | $3.5M–$4.0M | $3.1M–$3.6M | ||||||||||||||||||||||||||||||||||||||||||||||||||||
The Corner – IN4 | Indianapolis, IN | 50% | Q4 2024 | 24,000 | 285 | 63,900 | — | — | $1.7M–$1.9M | $1.7M–$1.9M | ||||||||||||||||||||||||||||||||||||||||||||||||||||
| Total | 415,500 | 1,033 | $ | 185,600 | $ | 121,700 | $ | 105,125 | $17.8M–$19.7M | $11.9M–$13.8M | ||||||||||||||||||||||||||||||||||||||||||||||||||||
Future Opportunities5 | ||||||||
| Hamilton Crossing Centre – Phase II | Indianapolis, IN | Addition of mixed-use (multifamily and retail) components to complement the relocation of the Republic Airways headquarters. | ||||||
| Carillon | Washington, D.C./Baltimore | Potential of 1.2 million square feet of commercial GLA and 3,000 multifamily units for additional expansion. | ||||||
| One Loudoun | Washington, D.C./Baltimore | Potential of 2.9 million square feet of commercial GLA for additional expansion. | ||||||
| Main Street Promenade | Chicago, IL | Potential of 10,000 square feet of commercial GLA and 47 multifamily units for additional expansion. | ||||||
| Downtown Crown | Washington, D.C./Baltimore | Potential of 42,000 square feet of commercial GLA for additional expansion. | ||||||
| 1 | Completion date represents the earlier of one year after completion of project construction or substantial occupancy of the property. | |||||||||||||||||||||||||||||||
| 2 | Total project costs and KRG equity requirement represent costs to KRG post-merger and exclude any costs spent to date prior to the merger. | |||||||||||||||||||||||||||||||
| 3 | Excludes in-place NOI and NOI related to tenants that have signed leases but have not yet commenced paying rent. | |||||||||||||||||||||||||||||||
| 4 | KRG does not have any equity requirements related to this development. Total project costs are at 100% and are net of a $13.5 million TIF. | |||||||||||||||||||||||||||||||
| 5 | These opportunities are deemed potential at this time and are subject to various contingencies, many of which could be beyond the Company's control. | |||||||||||||||||||||||||||||||
| 4th Quarter 2021 Supplemental Financial and Operating Statistics | 13 | ||||
Kite Realty Group Trust
Geographic Diversification – ABR by Region and State as of December 31, 2021
(dollars in thousands)
| Total Retail Operating Portfolio | Total Office Components | |||||||||||||||||||||||||||||||||||||||||||
| Region/State | Number of Properties1 | Owned GLA/NRA2 | Total Weighted ABR3 | % of Weighted ABR3 | Owned GLA/NRA2 | Total Weighted ABR3 | % of Weighted ABR3 | |||||||||||||||||||||||||||||||||||||
| South | ||||||||||||||||||||||||||||||||||||||||||||
| Texas | 45 | 7,718 | $ | 141,449 | 24.0 | % | 434 | $ | 11,350 | 1.9 | % | |||||||||||||||||||||||||||||||||
| Florida | 29 | 3,537 | 58,314 | 9.9 | % | 38 | 1,054 | 0.2 | % | |||||||||||||||||||||||||||||||||||
| Maryland | 7 | 1,745 | 34,147 | 5.8 | % | 224 | 3,314 | 0.6 | % | |||||||||||||||||||||||||||||||||||
| North Carolina | 8 | 1,537 | 30,306 | 5.1 | % | — | — | — | % | |||||||||||||||||||||||||||||||||||
| Virginia | 7 | 1,121 | 27,864 | 4.7 | % | 158 | 5,007 | 0.8 | % | |||||||||||||||||||||||||||||||||||
| Georgia | 10 | 1,706 | 25,716 | 4.4 | % | — | — | — | % | |||||||||||||||||||||||||||||||||||
| Tennessee | 3 | 580 | 8,158 | 1.4 | % | — | — | — | % | |||||||||||||||||||||||||||||||||||
| Oklahoma | 3 | 505 | 7,455 | 1.3 | % | — | — | — | % | |||||||||||||||||||||||||||||||||||
| South Carolina | 2 | 258 | 3,073 | 0.5 | % | — | — | — | % | |||||||||||||||||||||||||||||||||||
| Total South | 114 | 18,707 | 336,482 | 57.1 | % | 854 | 20,725 | 3.5 | % | |||||||||||||||||||||||||||||||||||
| West | ||||||||||||||||||||||||||||||||||||||||||||
| Washington | 10 | 1,682 | 29,702 | 5.0 | % | — | — | — | % | |||||||||||||||||||||||||||||||||||
| Nevada | 4 | 766 | 23,976 | 4.1 | % | — | — | — | % | |||||||||||||||||||||||||||||||||||
| California | 3 | 652 | 14,738 | 2.5 | % | — | — | — | % | |||||||||||||||||||||||||||||||||||
| Arizona | 5 | 727 | 14,425 | 2.4 | % | — | — | — | % | |||||||||||||||||||||||||||||||||||
| Utah | 2 | 392 | 7,417 | 1.3 | % | — | — | — | % | |||||||||||||||||||||||||||||||||||
| Total West | 24 | 4,219 | 90,258 | 15.3 | % | — | — | — | % | |||||||||||||||||||||||||||||||||||
| Midwest | ||||||||||||||||||||||||||||||||||||||||||||
| Indiana | 16 | 1,618 | 28,220 | 4.8 | % | 369 | 7,285 | 1.2 | % | |||||||||||||||||||||||||||||||||||
| Illinois | 9 | 1,264 | 25,958 | 4.4 | % | 163 | 4,013 | 0.7 | % | |||||||||||||||||||||||||||||||||||
| Michigan | 1 | 308 | 6,602 | 1.1 | % | — | — | — | % | |||||||||||||||||||||||||||||||||||
| Missouri | 1 | 453 | 4,124 | 0.7 | % | — | — | — | % | |||||||||||||||||||||||||||||||||||
| Ohio | 1 | 236 | 1,899 | 0.3 | % | — | — | — | % | |||||||||||||||||||||||||||||||||||
| Total Midwest | 28 | 3,879 | 66,803 | 11.3 | % | 532 | 11,298 | 1.9 | % | |||||||||||||||||||||||||||||||||||
| Northeast | ||||||||||||||||||||||||||||||||||||||||||||
| New York | 8 | 1,212 | 34,312 | 5.8 | % | 174 | 7,527 | 1.3 | % | |||||||||||||||||||||||||||||||||||
| New Jersey | 4 | 343 | 10,999 | 1.9 | % | — | — | — | % | |||||||||||||||||||||||||||||||||||
| Massachusetts | 1 | 272 | 5,435 | 0.9 | % | — | — | — | % | |||||||||||||||||||||||||||||||||||
| Connecticut | 1 | 206 | 3,625 | 0.6 | % | — | — | — | % | |||||||||||||||||||||||||||||||||||
| Pennsylvania | 1 | 136 | 1,982 | 0.4 | % | — | — | — | % | |||||||||||||||||||||||||||||||||||
| Total Northeast | 15 | 2,169 | 56,353 | 9.6 | % | 174 | 7,527 | 1.3 | % | |||||||||||||||||||||||||||||||||||
| Total | 181 | 28,974 | $ | 549,896 | 93.3 | % | 1,560 | $ | 39,550 | 6.7 | % | |||||||||||||||||||||||||||||||||
1Number of properties represents consolidated and unconsolidated retail properties and the Company’s single standalone office property in Indianapolis, IN.
2Owned GLA/NRA represents gross leasable area owned by the Company and excludes the square footage of development and redevelopment projects.
3Weighted ABR and percent of weighted ABR includes ground lease rent and represents the Company’s share of the ABR at consolidated and unconsolidated properties.
| 4th Quarter 2021 Supplemental Financial and Operating Statistics | 14 | ||||
Kite Realty Group Trust
Top 25 Tenants by ABR as of December 31, 2021
(dollars in thousands, except per square foot data)
This table includes the Company’s retail operating properties.
| Tenant | Number of Stores1 | Total Leased GLA/NRA2 | ABR3 | ABR per Sq. Ft.3 | % of Weighted ABR4 | |||||||||||||||||||||||||||
The TJX Companies, Inc.5 | 44 | 1,294 | $ | 14,536 | $ | 11.24 | 2.5 | % | ||||||||||||||||||||||||
Best Buy Co., Inc.6 | 16 | 633 | 10,915 | 17.25 | 2.0 | % | ||||||||||||||||||||||||||
| Ross Stores, Inc. | 31 | 885 | 10,444 | 11.80 | 1.9 | % | ||||||||||||||||||||||||||
| PetSmart, Inc. | 31 | 637 | 10,241 | 16.07 | 1.8 | % | ||||||||||||||||||||||||||
| Michaels Stores, Inc. | 29 | 651 | 8,814 | 13.54 | 1.6 | % | ||||||||||||||||||||||||||
Gap Inc.7 | 35 | 468 | 8,490 | 18.14 | 1.5 | % | ||||||||||||||||||||||||||
Bed Bath & Beyond Inc.8 | 23 | 613 | 8,303 | 13.55 | 1.5 | % | ||||||||||||||||||||||||||
Dick's Sporting Goods, Inc.9 | 12 | 591 | 7,187 | 12.15 | 1.3 | % | ||||||||||||||||||||||||||
| Publix Super Markets, Inc. | 14 | 669 | 6,884 | 10.28 | 1.3 | % | ||||||||||||||||||||||||||
Albertsons Companies, Inc.10 | 9 | 481 | 6,613 | 13.74 | 1.2 | % | ||||||||||||||||||||||||||
| Lowe's Companies, Inc. | 7 | 168 | 400 | 2.38 | 1.1 | % | ||||||||||||||||||||||||||
The Kroger Co.11 | 10 | 355 | 3,460 | 9.73 | 1.0 | % | ||||||||||||||||||||||||||
Petco Health And Wellness Company, Inc. | 22 | 299 | 5,346 | 17.90 | 1.0 | % | ||||||||||||||||||||||||||
| Ulta Beauty, Inc. | 24 | 248 | 5,589 | 22.51 | 0.9 | % | ||||||||||||||||||||||||||
| Total Wine & More | 13 | 305 | 5,069 | 16.60 | 0.9 | % | ||||||||||||||||||||||||||
| BJ's Wholesale Club, Inc. | 2 | 245 | 4,939 | 20.18 | 0.9 | % | ||||||||||||||||||||||||||
| Five Below, Inc. | 29 | 258 | 4,901 | 18.97 | 0.9 | % | ||||||||||||||||||||||||||
| Kohl's Corporation | 7 | 361 | 2,993 | 8.28 | 0.9 | % | ||||||||||||||||||||||||||
| Burlington Stores, Inc. | 8 | 445 | 4,496 | 10.11 | 0.8 | % | ||||||||||||||||||||||||||
Ahold U.S.A. Inc.12 | 4 | 239 | 4,464 | 18.66 | 0.8 | % | ||||||||||||||||||||||||||
Mattress Firm Group Inc.13 | 32 | 158 | 4,417 | 27.97 | 0.8 | % | ||||||||||||||||||||||||||
DSW Designer Shoe Warehouse | 16 | 314 | 4,678 | 14.92 | 0.8 | % | ||||||||||||||||||||||||||
Office Depot, Inc.14 | 14 | 308 | 4,347 | 14.11 | 0.8 | % | ||||||||||||||||||||||||||
| Fitness International, LLC | 5 | 205 | 4,092 | 19.92 | 0.7 | % | ||||||||||||||||||||||||||
| Party City Holdings Inc. | 18 | 263 | 3,988 | 15.17 | 0.7 | % | ||||||||||||||||||||||||||
| Total Top Tenants | 455 | 11,093 | $ | 155,606 | $ | 14.03 | 29.6 | % | ||||||||||||||||||||||||
| 1 | Number of stores represents stores at consolidated and unconsolidated properties. | ||||
| 2 | Excludes the square footage of structures located on land owned by the Company and ground-leased to tenants. | ||||
| 3 | ABR represents the monthly contractual rent for December 31, 2021, for each applicable tenant multiplied by 12 and does not include tenant reimbursements. ABR represents 100% of the ABR at consolidated properties and the Company's share of the ABR at unconsolidated properties excluding ground lease rent. | ||||
| 4 | Percent of weighted ABR includes ground lease rent and represents the Company's share of the ABR at consolidated and unconsolidated properties. | ||||
| 5 | Includes TJ Maxx (19), Marshalls (13), HomeGoods (10), Homesense (1) and T.J. Maxx & HomeGoods combined (1). | ||||
| 6 | Includes Best Buy (15) and Pacific Sales (1). | ||||
| 7 | Includes Old Navy (25), The Gap (5), Banana Republic (3) and Athleta (2). | ||||
| 8 | Includes Bed Bath and Beyond (14) and buybuy BABY (9). | ||||
| 9 | Includes Dick's Sporting Goods (11) and Golf Galaxy (1). | ||||
| 10 | Includes Safeway (4), Jewel-Osco (3) and Tom Thumb (2). | ||||
| 11 | Includes Kroger (6), Harris Teeter (2), QFC (1) and Smith's (1). | ||||
| 12 | Includes Stop & Shop (3) and Giant Foods (1). | ||||
| 13 | Includes Mattress Firm (27) and Sleepy's (5). | ||||
| 14 | Includes Office Depot (11) and OfficeMax (3). | ||||
| 4th Quarter 2021 Supplemental Financial and Operating Statistics | 15 | ||||
Kite Realty Group Trust
Retail Leasing Spreads
Comparable Space1,2 | ||||||||||||||||||||||||||||||||||||||||||||||||||||||||
Category | Total Leases | Total Sq. Ft. | Leases | Sq. Ft. | Prior Rent PSF3 | New Rent PSF4 | Cash Rent Spread | TI, LL Work, Lease Commissions PSF5 | ||||||||||||||||||||||||||||||||||||||||||||||||
| New Leases – Q4 2021 | 47 | 236,615 | 23 | 134,201 | $ | 19.76 | $ | 25.18 | 27.4 | % | ||||||||||||||||||||||||||||||||||||||||||||||
| New Leases – Q3 2021 | 38 | 239,157 | 17 | 124,864 | 13.47 | 16.23 | 20.6 | % | ||||||||||||||||||||||||||||||||||||||||||||||||
| New Leases – Q2 2021 | 27 | 159,497 | 11 | 35,612 | 25.86 | 30.95 | 19.7 | % | ||||||||||||||||||||||||||||||||||||||||||||||||
| New Leases – Q1 2021 | 20 | 100,604 | 16 | 89,791 | 15.20 | 19.06 | 25.3 | % | ||||||||||||||||||||||||||||||||||||||||||||||||
| Total | 132 | 735,873 | 67 | 384,468 | $ | 17.22 | $ | 21.38 | 24.2 | % | $ | 69.98 | ||||||||||||||||||||||||||||||||||||||||||||
| Renewals – Q4 2021 | 85 | 690,450 | 60 | 515,802 | $ | 16.08 | $ | 17.41 | 8.3 | % | ||||||||||||||||||||||||||||||||||||||||||||||
| Renewals – Q3 2021 | 44 | 345,663 | 33 | 220,843 | 18.68 | 20.63 | 10.4 | % | ||||||||||||||||||||||||||||||||||||||||||||||||
| Renewals – Q2 2021 | 46 | 478,498 | 39 | 395,202 | 14.93 | 16.05 | 7.5 | % | ||||||||||||||||||||||||||||||||||||||||||||||||
| Renewals – Q1 2021 | 56 | 326,333 | 46 | 300,894 | 19.67 | 20.06 | 2.0 | % | ||||||||||||||||||||||||||||||||||||||||||||||||
| Total | 231 | 1,840,944 | 178 | 1,432,741 | $ | 16.92 | $ | 18.09 | 6.9 | % | $ | 0.88 | ||||||||||||||||||||||||||||||||||||||||||||
| Total – Q4 2021 | 132 | 927,065 | 83 | 650,003 | $ | 16.84 | $ | 19.02 | 12.9 | % | ||||||||||||||||||||||||||||||||||||||||||||||
| Total – Q3 2021 | 82 | 584,820 | 50 | 345,707 | 16.79 | 19.04 | 13.4 | % | ||||||||||||||||||||||||||||||||||||||||||||||||
| Total – Q2 2021 | 73 | 637,995 | 50 | 430,814 | 15.83 | 17.28 | 9.2 | % | ||||||||||||||||||||||||||||||||||||||||||||||||
| Total – Q1 2021 | 76 | 426,937 | 62 | 390,685 | 18.64 | 19.83 | 6.4 | % | ||||||||||||||||||||||||||||||||||||||||||||||||
| Total | 363 | 2,576,817 | 245 | 1,817,209 | $ | 16.98 | $ | 18.79 | 10.7 | % | $ | 15.50 | ||||||||||||||||||||||||||||||||||||||||||||
| 1 | Comparable space leases on this report are included for second generation retail spaces. Comparable leases represent those leases for which there was a former tenant within the last 12 months. Leases at our two office properties, Thirty South Meridian and Eddy Street Commons, and ground leases are excluded. | ||||
| 2 | Comparable renewals exclude leases with terms 24 months or shorter. | ||||
| 3 | Prior rent represents minimum rent, if any, paid by the prior tenant in the final 12 months of the term. All amounts reported at lease execution. | ||||
| 4 | Contractual rent represents contractual minimum rent per square foot for the first 12 months of the lease. | ||||
| 5 | Includes redevelopment costs for tenant specific landlord work and tenant allowances provided to tenants. | ||||
| 4th Quarter 2021 Supplemental Financial and Operating Statistics | 16 | ||||
Kite Realty Group Trust
Lease Expirations as of December 31, 2021
(dollars in thousands, except per square foot data)
These tables include the following:
▪Operating retail properties;
▪Operating office properties; and
▪Development/Redevelopment property tenants open for business who commenced paying rent as of December 31, 2021.
| Retail Portfolio | ||||||||||||||||||||||||||||||||||||||||||||||||||||||||||||||
Expiring GLA - Retail2 | Expiring ABR per Sq. Ft.3 | |||||||||||||||||||||||||||||||||||||||||||||||||||||||||||||
Number of Expiring Leases1 | Shop Tenants | Anchor Tenants | Expiring ABR (Pro-rata) | % of Total ABR (Pro-rata) | Shop Tenants | Anchor Tenants | Total | |||||||||||||||||||||||||||||||||||||||||||||||||||||||
| 2022 | 520 | 1,177,508 | 1,196,248 | $ | 47,408 | 9.1 | % | $ | 28.33 | $ | 11.81 | $ | 19.99 | |||||||||||||||||||||||||||||||||||||||||||||||||
| 2023 | 585 | 1,361,374 | 2,634,810 | 78,221 | 15.0 | % | 30.43 | 13.99 | 19.59 | |||||||||||||||||||||||||||||||||||||||||||||||||||||
| 2024 | 584 | 1,334,044 | 2,580,920 | 75,482 | 14.5 | % | 32.09 | 13.50 | 20.06 | |||||||||||||||||||||||||||||||||||||||||||||||||||||
| 2025 | 442 | 1,061,370 | 2,551,286 | 64,728 | 12.4 | % | 30.80 | 12.86 | 18.17 | |||||||||||||||||||||||||||||||||||||||||||||||||||||
| 2026 | 436 | 984,890 | 2,447,939 | 63,743 | 12.3 | % | 30.43 | 14.11 | 18.86 | |||||||||||||||||||||||||||||||||||||||||||||||||||||
| 2027 | 309 | 763,399 | 1,915,123 | 46,774 | 9.0 | % | 29.40 | 12.88 | 17.61 | |||||||||||||||||||||||||||||||||||||||||||||||||||||
| 2028 | 166 | 422,238 | 956,761 | 28,473 | 5.5 | % | 33.39 | 15.07 | 20.67 | |||||||||||||||||||||||||||||||||||||||||||||||||||||
| 2029 | 154 | 359,184 | 1,111,043 | 30,350 | 5.8 | % | 32.76 | 16.78 | 20.67 | |||||||||||||||||||||||||||||||||||||||||||||||||||||
| 2030 | 124 | 375,170 | 565,268 | 19,201 | 3.7 | % | 28.97 | 15.10 | 20.57 | |||||||||||||||||||||||||||||||||||||||||||||||||||||
| 2031 | 123 | 339,768 | 606,950 | 20,070 | 3.9 | % | 31.09 | 15.83 | 21.27 | |||||||||||||||||||||||||||||||||||||||||||||||||||||
| Beyond | 149 | 328,386 | 2,067,162 | 45,829 | 8.8 | % | 31.66 | 17.43 | 19.37 | |||||||||||||||||||||||||||||||||||||||||||||||||||||
| 3,592 | 8,507,331 | 18,633,510 | $ | 520,279 | 100.0 | % | $ | 30.61 | $ | 14.23 | $ | 19.40 | ||||||||||||||||||||||||||||||||||||||||||||||||||
| Office Portfolio | ||||||||||||||||||||||||||||||||||||||||||||||||||||||||||||||
Expiring GLA2 | ||||||||||||||||||||||||||||||||||||||||||||||||||||||||||||||
Number of Expiring Leases1 | Office Tenants | Expiring ABR (Pro-rata) | % of Total ABR (Pro-rata) | Expiring ABR per Sq. Ft.3 | ||||||||||||||||||||||||||||||||||||||||||||||||||||||||||
| 2022 | 47 | 361,608 | $ | 8,872 | 22.4 | % | $ | 24.53 | ||||||||||||||||||||||||||||||||||||||||||||||||||||||
| 2023 | 35 | 126,396 | 3,878 | 9.8 | % | 30.68 | ||||||||||||||||||||||||||||||||||||||||||||||||||||||||
| 2024 | 42 | 234,639 | 6,354 | 16.1 | % | 27.08 | ||||||||||||||||||||||||||||||||||||||||||||||||||||||||
| 2025 | 11 | 166,084 | 3,531 | 8.9 | % | 21.26 | ||||||||||||||||||||||||||||||||||||||||||||||||||||||||
| 2026 | 11 | 51,422 | 1,727 | 4.4 | % | 33.59 | ||||||||||||||||||||||||||||||||||||||||||||||||||||||||
| 2027 | 10 | 61,513 | 2,094 | 5.3 | % | 34.03 | ||||||||||||||||||||||||||||||||||||||||||||||||||||||||
| 2028 | 5 | 112,519 | 2,951 | 7.5 | % | 26.23 | ||||||||||||||||||||||||||||||||||||||||||||||||||||||||
| 2029 | 5 | 75,943 | 2,813 | 7.1 | % | 37.04 | ||||||||||||||||||||||||||||||||||||||||||||||||||||||||
| 2030 | 4 | 41,061 | 903 | 2.3 | % | 21.99 | ||||||||||||||||||||||||||||||||||||||||||||||||||||||||
| 2031 | 4 | 121,003 | 3,058 | 7.7 | % | 25.28 | ||||||||||||||||||||||||||||||||||||||||||||||||||||||||
| Beyond | 4 | 90,599 | 3,369 | 8.5 | % | 37.19 | ||||||||||||||||||||||||||||||||||||||||||||||||||||||||
| 178 | 1,442,787 | $ | 39,550 | 100.0 | % | $ | 27.41 | |||||||||||||||||||||||||||||||||||||||||||||||||||||||
| 1 | Lease expiration table reflects rents in place as of December 31, 2021 and does not include option periods; 2022 expirations include 74 month-to-month retail tenants and 10 month-to-month office tenants. This column also excludes ground leases. | ||||
| 2 | Expiring GLA excludes estimated square footage attributable to non-owned structures on land owned by the Company and ground-leased to tenants. | ||||
| 3 | ABR represents the monthly contractual rent as of December 31, 2021 for each applicable tenant multiplied by 12. Excludes tenant reimbursements and ground lease revenue. | ||||
| 4th Quarter 2021 Supplemental Financial and Operating Statistics | 17 | ||||
Kite Realty Group Trust
Components of Net Asset Value as of December 31, 2021
(dollars in thousands)
| Cash Net Operating Income (NOI) | Page | Other Assets | Page | |||||||||||||||||
| GAAP property NOI (incl. ground lease revenue) | $ | 115,312 | 6 | Cash, cash equivalents and restricted cash | $ | 100,363 | 3 | |||||||||||||
| Below-market lease intangibles, net | (1,183) | Short-term deposits | 125,000 | 3 | ||||||||||||||||
| Straight-line rent | (3,696) | Tenant and other receivables (net of SLR) | 40,371 | 3 | ||||||||||||||||
| Other property-related revenue | (450) | 6 | Prepaid and other assets | 84,826 | 3 | |||||||||||||||
| Ground lease ("GL") revenue | (7,129) | 6 | ||||||||||||||||||
| Consolidated Cash Property NOI (excl. GL) | $ | 102,854 | ||||||||||||||||||
| Annualized Consolidated Cash Property NOI (excl. ground leases) | $ | 411,416 | ||||||||||||||||||
| Adjustments To Normalize Annualized Cash NOI | Liabilities | |||||||||||||||||||
Remaining NOI to come online from development and redevelopment projects 1 | 12,820 | 13 | Mortgage and other indebtedness, net | $ | (3,092,225) | 3 | ||||||||||||||
| Unconsolidated EBITDA | 3,528 | 8 | Pro-rate adjustment for joint venture debt | (29,584) | 8 | |||||||||||||||
Pro forma adjustments2 | 57,471 | 9 | Accounts payable and accrued expenses | (184,982) | 3 | |||||||||||||||
| General and administrative expense allocable to property management activities included in property expenses ($2.8 million in Q4) | 11,200 | 6, note 3 | Other liabilities | (287,217) | 3 | |||||||||||||||
| Total Adjustments | 85,019 | Noncontrolling redeemable joint venture interest | (10,070) | |||||||||||||||||
Projected remaining under construction development/redevelopment3 | (105,125) | 13 | ||||||||||||||||||
Annualized Normalized Portfolio Cash NOI (excl. ground leases) | $ | 496,435 | ||||||||||||||||||
| Annualized ground lease NOI | 28,516 | |||||||||||||||||||
| Total Annualized Portfolio Cash NOI | $ | 524,951 | Common Shares and Units Outstanding | 221,327,346 | ||||||||||||||||
| 1 | Excludes the projected cash NOI and related cost from the future opportunities outlined on page 13. | ||||
| 2 | Pro forma adjustments to reflect as if the properties acquired during the 4th quarter of 2021 were owned for the entire period and as if the merger had occurred for the entire quarter. | ||||
| 3 | Remaining costs on page 13 for development projects. | ||||
| 4th Quarter 2021 Supplemental Financial and Operating Statistics | 18 | ||||
Kite Realty Group Trust
Non-GAAP Financial Measures
Funds from Operations
Funds from Operations (“FFO”) is a widely used performance measure for real estate companies and is provided here as a supplemental measure of operating performance. The Company calculates FFO, a non-GAAP financial measure, in accordance with the best practices described in the April 2002 National Policy Bulletin of the National Association of Real Estate Investment Trusts ("NAREIT"), as restated in 2018. The NAREIT white paper defines FFO as net income (calculated in accordance with GAAP), excluding depreciation and amortization related to real estate, gains and losses from the sale of certain real estate assets, gains and losses from change in control, and impairment write-downs of certain real estate assets and investments in entities when the impairment is directly attributable to decreases in the value of depreciable real estate held by the entity.
Considering the nature of our business as a real estate owner and operator, the Company believes that FFO is helpful to investors in measuring our operational performance because it excludes various items included in net income that do not relate to or are not indicative of our operating performance, such as gains or losses from sales of depreciated property and depreciation and amortization, which can make periodic and peer analyses of operating performance more difficult. FFO excludes the gain on the sale of the ground lease portfolios as these sales were part of our capital strategy distinct from our ongoing operating strategy of selling individual land parcels from time to time. FFO (a) should not be considered as an alternative to net income (calculated in accordance with GAAP) for the purpose of measuring our financial performance, (b) is not an alternative to cash flow from operating activities (calculated in accordance with GAAP) as a measure of our liquidity, and (c) is not indicative of funds available to satisfy our cash needs, including our ability to make distributions. The Company’s computation of FFO may not be comparable to FFO reported by other REITs that do not define the term in accordance with the current NAREIT definition or that interpret the current NAREIT definition differently than we do. A reconciliation of net income (calculated in accordance with GAAP) to FFO is included elsewhere in this Financial Supplement.
From time to time, the Company may report or provide guidance with respect to “FFO as adjusted” which starts with FFO, as defined by NAREIT, and then removes the impact of certain non-recurring and non-operating transactions or other items the Company does not consider to be representative of its core operating results including, without limitation, gains or losses associated with the early extinguishment of debt, gains or losses associated with litigation involving the Company that is not in the normal course of business, merger and acquisition costs, the impact on earnings from employee severance, the excess of redemption value over carrying value of preferred stock redemption, and the impact of 2020 bad debt or 2020 accounts receivable ("2020 Collection Impact"), which are not otherwise adjusted in the Company’s calculation of FFO.
Adjusted Funds from Operations
Adjusted Funds from Operations (“AFFO”) is a non-GAAP financial measure of operating performance used by many companies in the REIT industry. AFFO modifies FFO, as adjusted for certain cash and non-cash transactions not included in FFO. AFFO should not be considered an alternative to net income as an indication of the Company's performance or as an alternative to cash flow as a measure of liquidity or the Company’s ability to make distributions. Management considers AFFO a useful supplemental measure of the Company’s performance. The Company’s computation of AFFO may differ from the methodology for calculating AFFO used by other REITs, and therefore, may not be comparable to such other REITs. A reconciliation of net income (calculated in accordance with GAAP) to AFFO is included elsewhere in this Financial Supplement.
Net Operating Income and Same Property Net Operating Income
The Company uses property net operating income (“NOI”), a non-GAAP financial measure, to evaluate the performance of our properties. The Company defines NOI as income from our real estate, including lease termination fees received from tenants, less our property operating expenses. NOI excludes amortization of capitalized tenant improvement costs and leasing commissions and certain corporate level expenses, including merger and acquisition costs. The Company believes that NOI is helpful to investors as a measure of our operating performance because it excludes various items included in net income that do not relate to or are not indicative of our operating performance, such as depreciation and amortization, interest expense, and impairment, if any.
The Company also uses same property NOI ("Same Property NOI"), a non-GAAP financial measure, to evaluate the performance of our properties. Same Property NOI excludes properties that have not been owned for the full period presented. It also excludes net gains from outlot sales, straight-line rent revenue, lease termination income in excess of lost rent, amortization of lease intangibles and significant prior period expense recoveries and adjustments, if any. When the Company receives payments in excess of any accounts receivable for terminating a lease, Same Property NOI will include such excess payments as monthly rent until the earlier of the expiration of 12 months or the start date of a replacement tenant. The Company believes that Same Property NOI is helpful to investors as a measure of our operating performance because it includes only the NOI of properties that have been owned for the full periods presented. The Company believes such presentation eliminates disparities in net income due to the acquisition or disposition of properties during the particular periods presented and thus provides a more consistent metric for the comparison of our properties. Same Property NOI includes the results of properties that have been owned for the entire current and prior year reporting periods.
| 4th Quarter 2021 Supplemental Financial and Operating Statistics | 19 | ||||
Kite Realty Group Trust
Non-GAAP Financial Measures (continued)
Net Operating Income and Same Property Net Operating Income (continued)
NOI and Same Property NOI should not, however, be considered as alternatives to net income (calculated in accordance with GAAP) as indicators of our financial performance. The Company’s computation of NOI and Same Property NOI may differ from the methodology used by other REITs and, therefore, may not be comparable to such other REITs.
When evaluating the properties that are included in the same property pool, the Company has established specific criteria for determining the inclusion of properties acquired or those recently under development. An acquired property is included in the same property pool when there is a full quarter of operations in both years subsequent to the acquisition date. Development and redevelopment properties are included in the same property pool four full quarters after the properties have been transferred to the operating portfolio. A redevelopment property is first excluded from the same property pool when the execution of a redevelopment plan is likely and the Company (a) begins recapturing space from tenants or (b) the contemplated plan significantly impacts the operations of the property. For the quarter ended December 31, 2021, the Company excluded two redevelopment properties and the recently completed Glendale Town Center redevelopment from the same property pool that met these criteria and were owned in both comparable periods. In addition, the Company excluded the portfolio acquired in the merger with RPAI and one recently acquired property from the same property pool.
Earnings Before Interest Expense, Income Tax Expense, Depreciation and Amortization (EBITDA) and Net Debt to EBITDA
The Company defines EBITDA, a non-GAAP financial measure, as net income before depreciation and amortization, interest expense and income tax expense of the taxable REIT subsidiary. For informational purposes, the Company also provides Adjusted EBITDA, which the Company defines as EBITDA less (i) EBITDA from unconsolidated entities, (ii) gains on sales of operating properties or impairment charges, (iii) merger and acquisition costs, (iv) other income and expense, (v) noncontrolling interest EBITDA, and (vi) other non-recurring activity or items impacting comparability from period to period. Annualized Adjusted EBITDA is Adjusted EBITDA for the most recent quarter multiplied by four. Net Debt to Adjusted EBITDA is the Company's share of net debt divided by Annualized Adjusted EBITDA. EBITDA, Adjusted EBITDA, Annualized Adjusted EBITDA and Net Debt to Adjusted EBITDA, as calculated by the Company, are not comparable to EBITDA and EBITDA-related measures reported by other REITs that do not define EBITDA and EBITDA-related measures exactly as we do. EBITDA, Adjusted EBITDA and Annualized Adjusted EBITDA do not represent cash generated from operating activities in accordance with GAAP and should not be considered an alternative to net income as an indicator of performance or as an alternative to cash flows from operating activities as an indicator of liquidity.
Considering the nature of our business as a real estate owner and operator, the Company believes that EBITDA, Adjusted EBITDA and the ratio of Net Debt to Adjusted EBITDA are helpful to investors in measuring our operational performance because they exclude various items included in net income that do not relate to or are not indicative of the Company’s operating performance, such as gains or losses from sales of depreciated property and depreciation and amortization, which can make periodic and peer analyses of operating performance more difficult. For informational purposes, the Company also provides Annualized Adjusted EBITDA, adjusted as described above. The Company believes this supplemental information provides a meaningful measure of its operating performance. The Company believes presenting EBITDA and the related measures in this manner allows investors and other interested parties to form a more meaningful assessment of the Company’s operating results.
| 4th Quarter 2021 Supplemental Financial and Operating Statistics | 20 | ||||