Operator
Thank you for standing by. My name is Chad, and I will be your conference operator today. At this time, I would like to welcome everyone to the Miami International Holdings, Inc. First Quarter 2026 earnings call. All lines have been placed on mute to prevent any background noise. After the speaker's remarks, there will be a question and answer session. Should you need assistance, please signal a conference specialist by pressing the star key followed by zero. Please note, this event is being recorded. It is now my pleasure to turn the call over to John T. Williams, Senior Vice President and Head of Investor Relations. You may begin your conference.
Thank you, Operator. Good afternoon, and thank you for joining us for Miami International Holdings, Inc., or MIAC's first quarter 2026 earnings conference call. I'm John T. Williams, Head of Investor Relations. With us today are Thomas P. Gallagher, Chairman and Chief Executive Officer, and Lance Emmons, Chief Financial Officer. We will also have Douglas Schaefer, Jr., Chief Information Officer, and Shelley Brown, Chief Executive Officer of MIACS Futures and Chief Strategy Officer of MIH, joining us for the Q&A session following our prepared remarks prior to this call, and we've published an accompanying slide presentation on our Investor Relations website at ir.miacsglobal.com. Webcasts and an archived version will be available there shortly after the conclusion of the call. It includes forward-looking statements that are based on the expectations, estimates, and projections regarding the company's future performance, anticipated events or trends, and other matters that are not historical statements in our discussion are subject to various assumptions, risks, uncertainties, and other factors that are difficult to predict and which could cause actual results to differ materially from those expressed or implied in the forward-looking statements. These statements are not guarantees of future performance, and therefore you should not place undue reliance on them. We refer you to our earnings press release and filings with the SEC for a more detailed discussion of the risks and uncertainties that could impact the future operating results and financial condition. Update any forward-looking statements made on this conference call to reflect events or circumstances after today or to reflect new information or the occurrence of unanticipated events except as required by law. During today's call, we will refer to non-GAAP measures as defined and reconciled in our earnings materials.
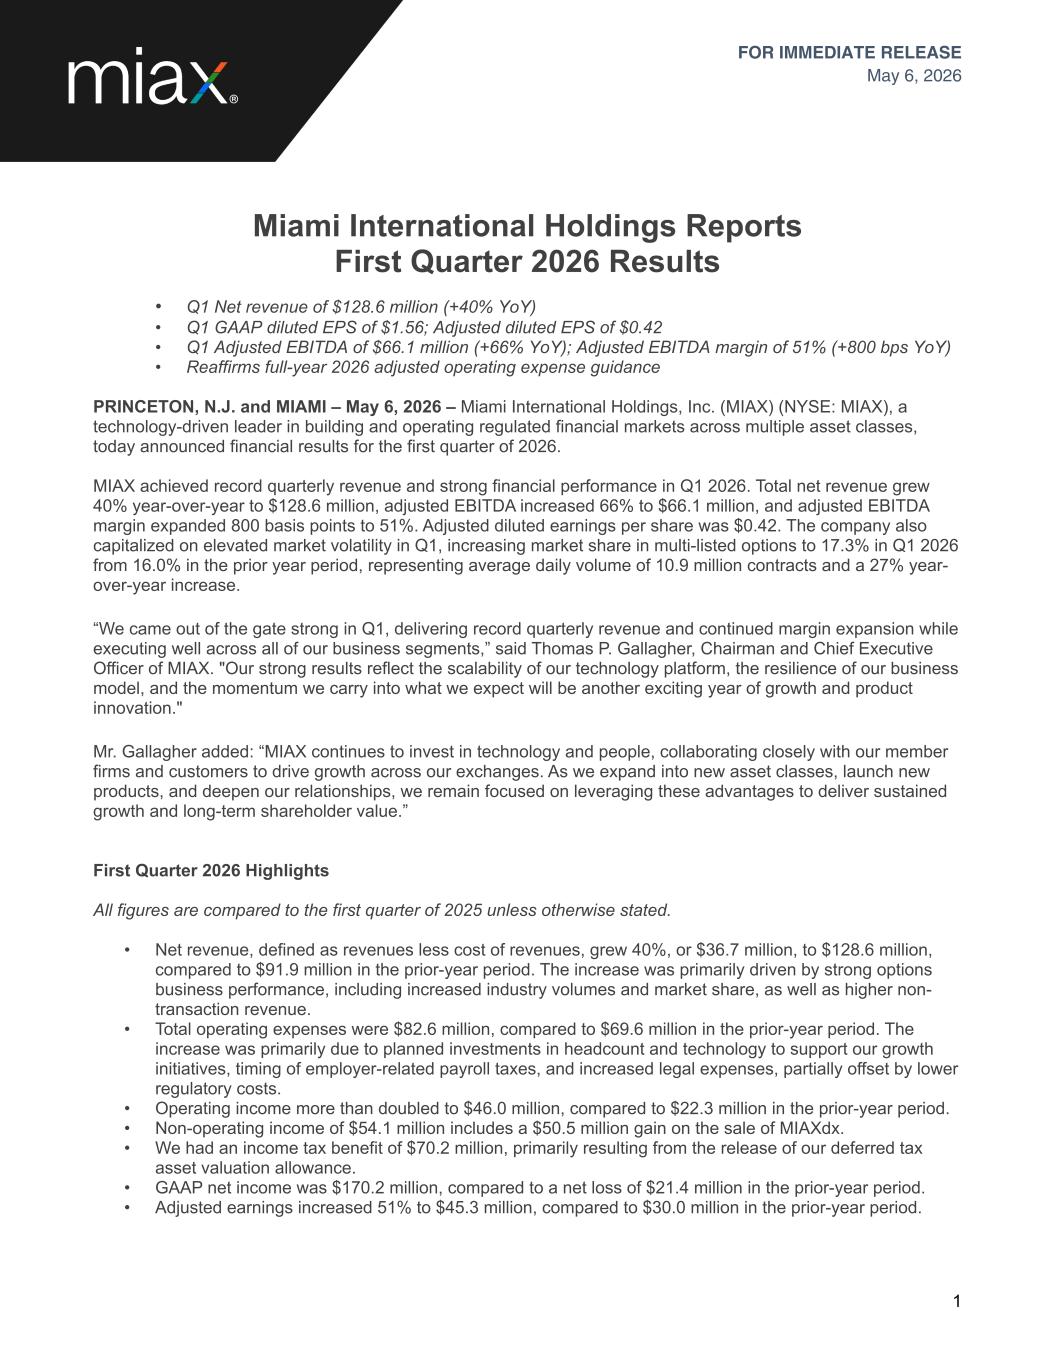
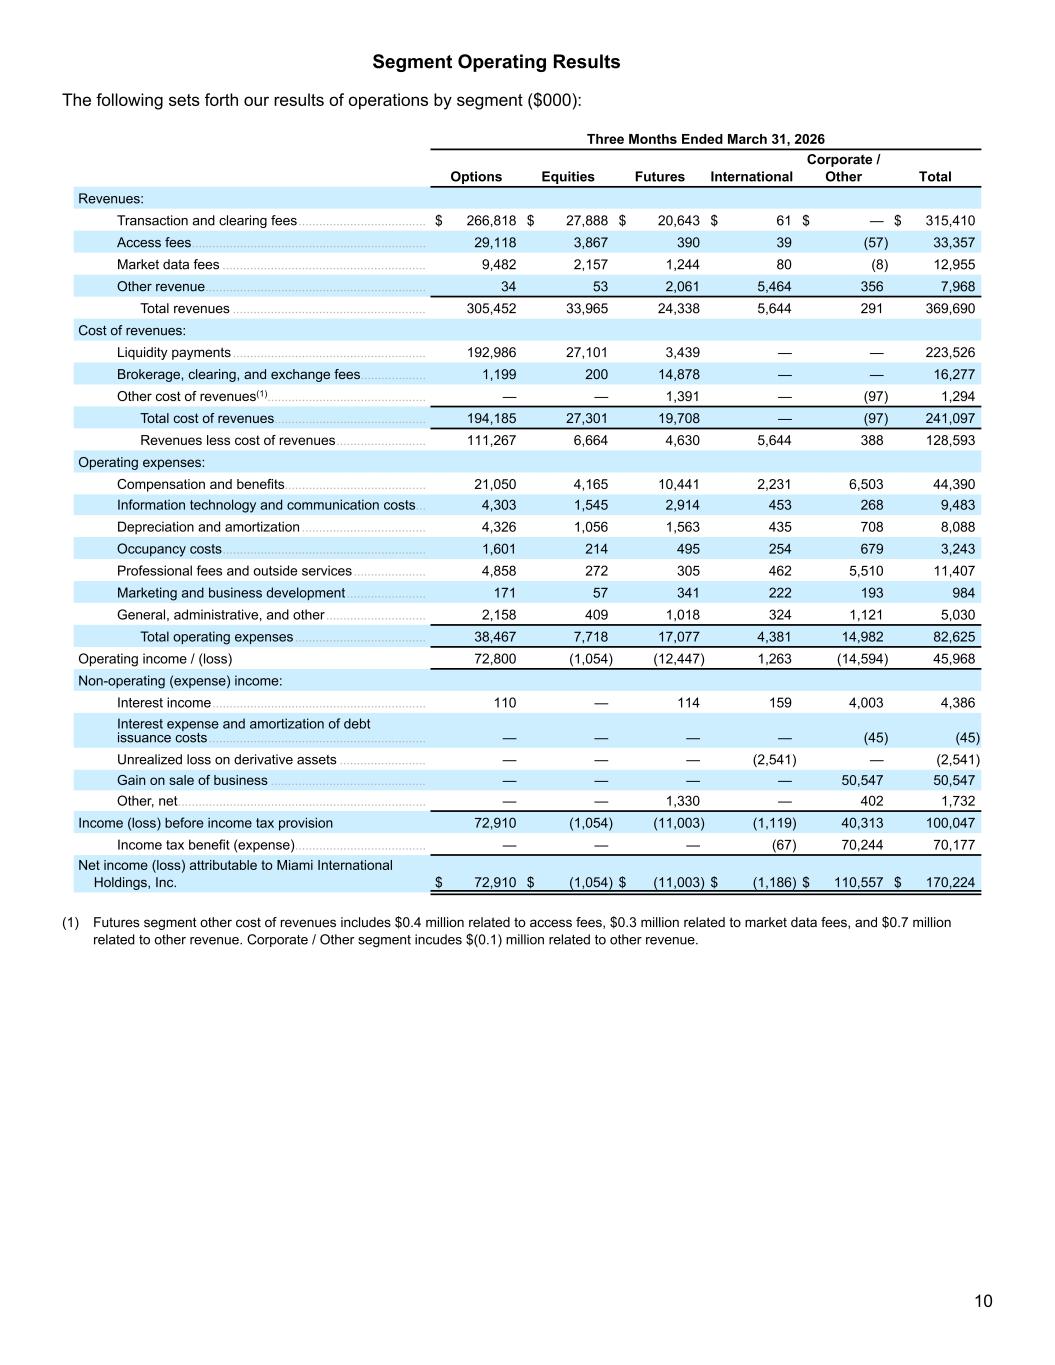
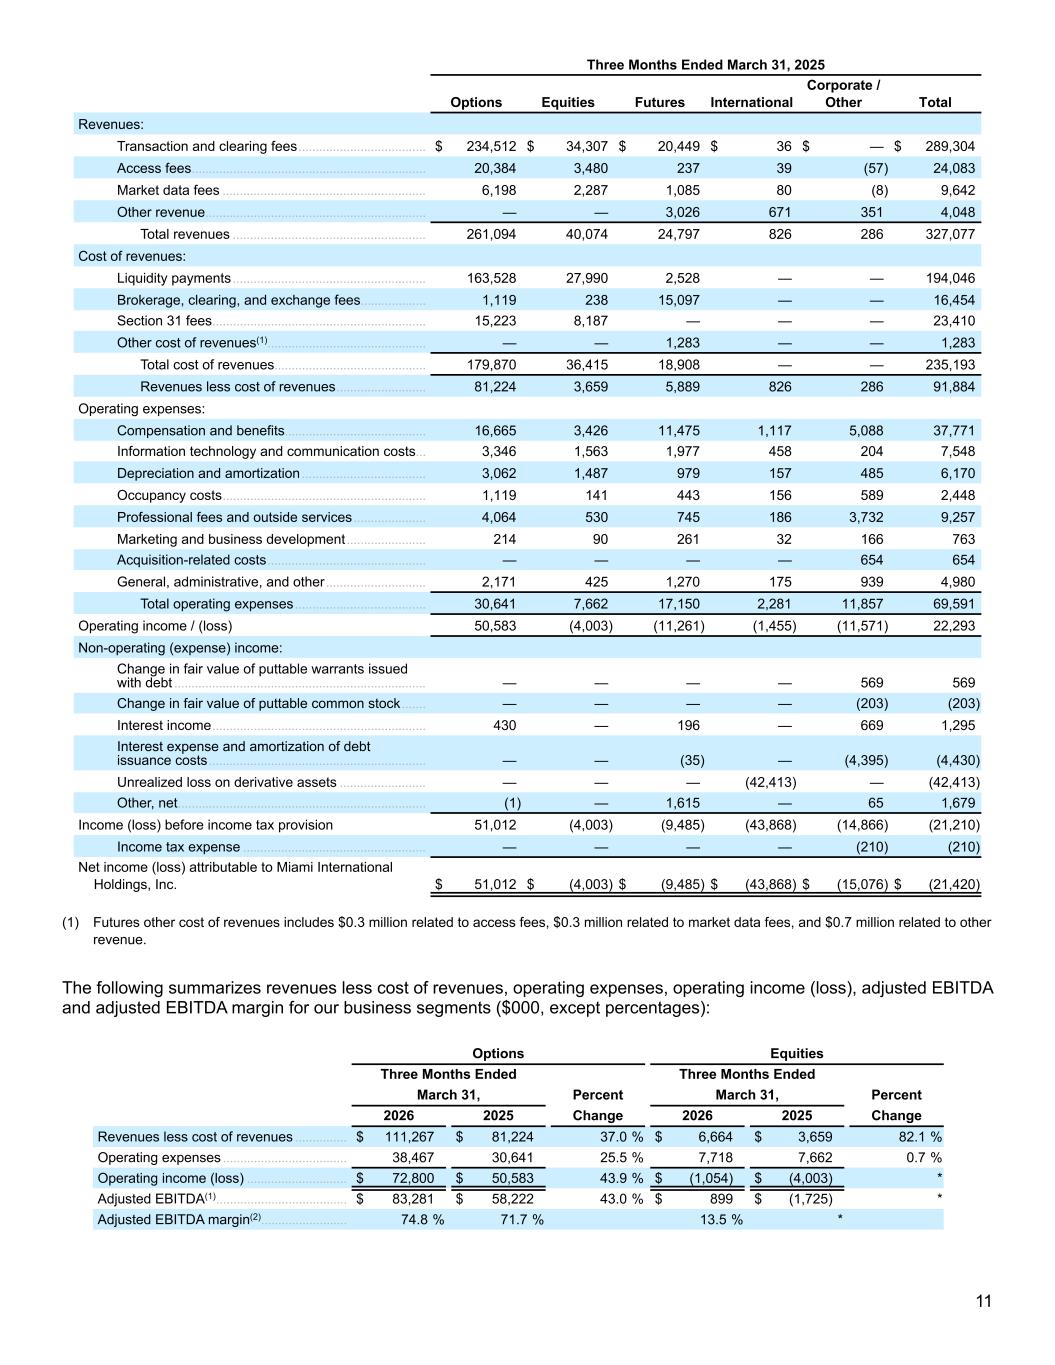
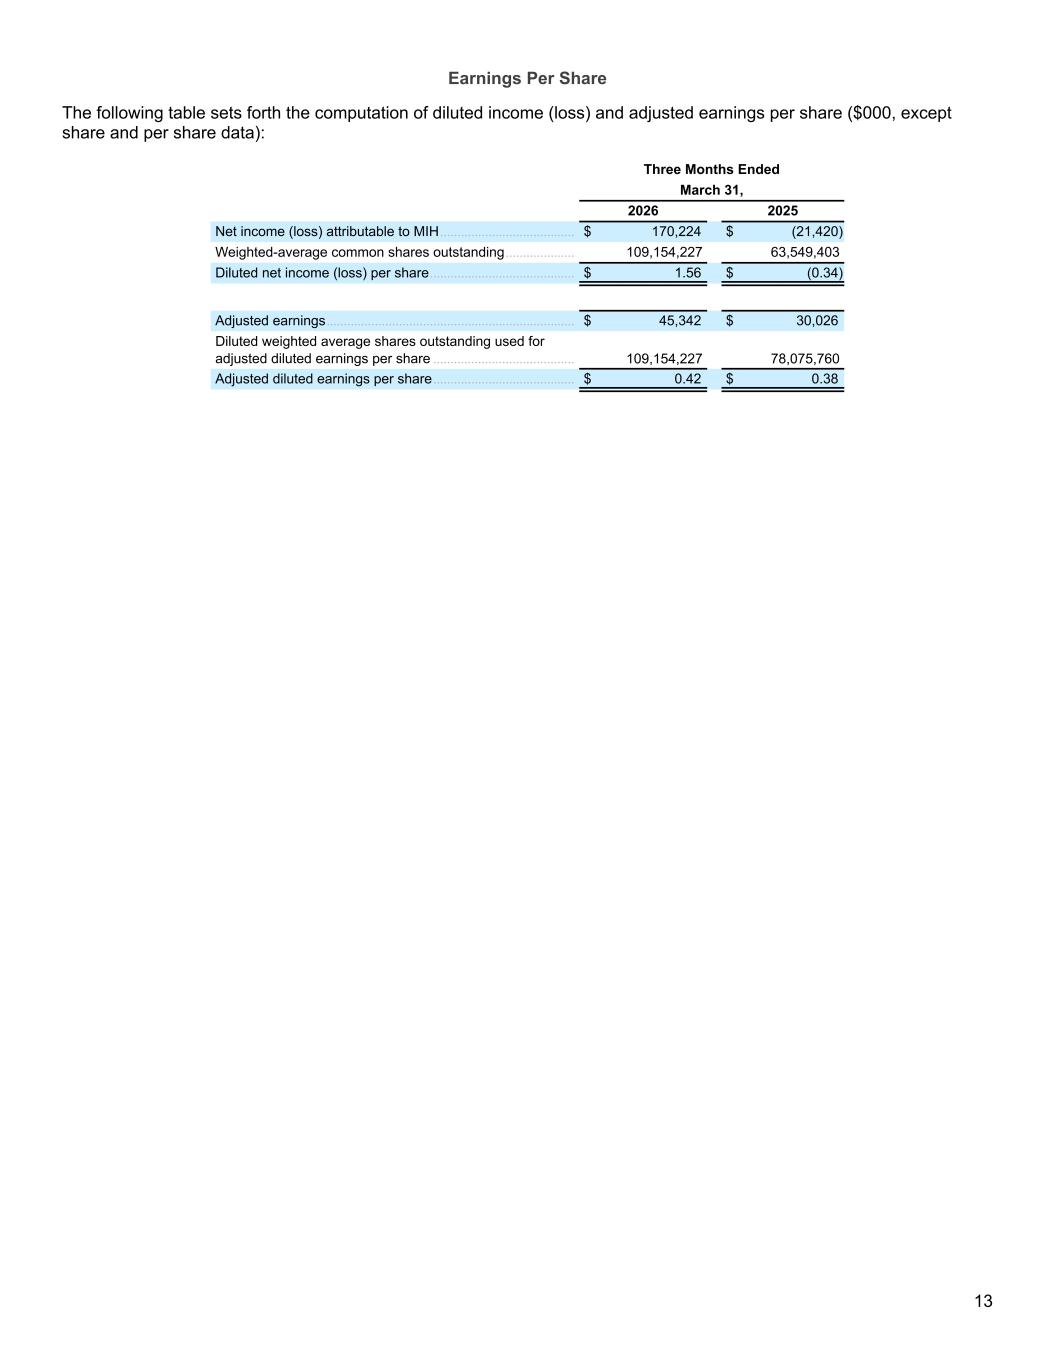
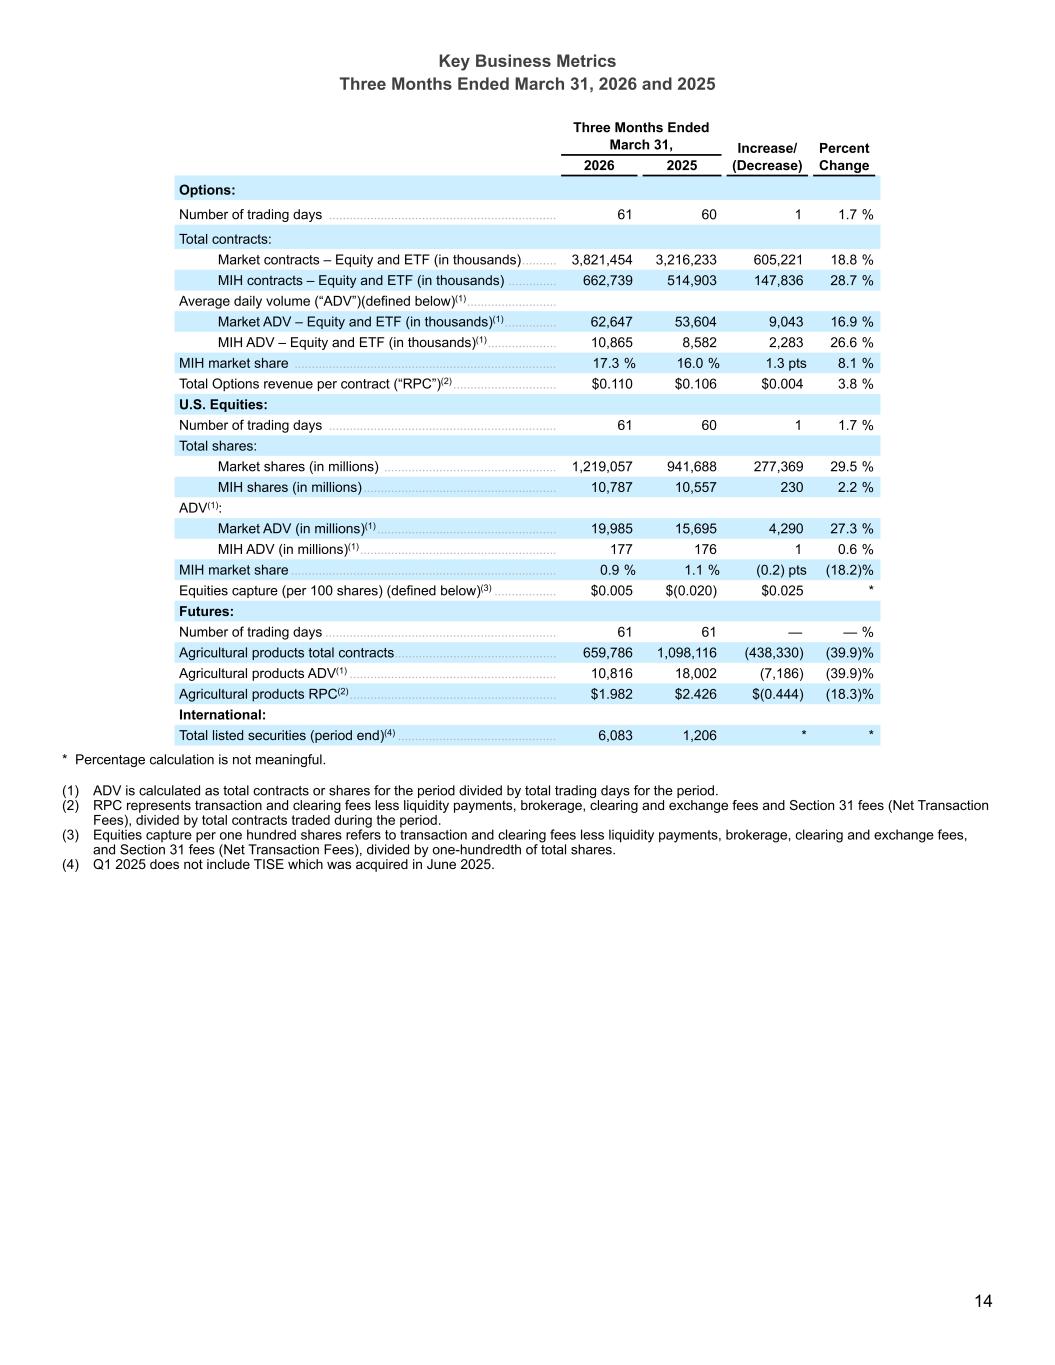
And good afternoon, everyone. We appreciate you joining us today. In Q1, we executed well and continued to benefit from industry tailwinds, posting record quarterly revenue in a volatile market environment. That is the story of this quarter, and I want to spend a few minutes walking you through what drove our results before Lance takes you through the financial details. I'll first highlight three things I hope every investor takes away from today's call. First, we continue to execute well and our options business had another strong quarter. We are seeing the benefits of our technology investment show up in sustained year-over-year volume growth and healthy revenue per contract levels. This continued strong performance is the result of the strong relationships we have built over the last decade. We continue to benefit from powerful secular tailwinds in our core market. Options industry ADV reached 63 million contracts in Q1, up 17 percent year over year, driven by elevated volatility, broad investor participation, and growing volume in the new short-term expirations in single-name stocks. On top of that, when the market gets volatile, industry volumes tend to rise. We are seeing broadening revenue and margin contributions across our business and continue to invest in offerings that will drive the next leg of our growth. Our equities business maintained its positive trajectory, and our international segment performed well. Our futures business is set to expand as we are on track for the May 17th launch of our Bloomberg equity futures. Q1 was defined by elevated volatility across asset classes driven by geopolitical tensions, trade policy uncertainty, and shifting expectations around rates and growth. While most businesses are volatility adverse, for my ex, elevated volatility is good for our business. Sustained geopolitical volatility drives an increased need for risk management tools for virtually all market participants. Institutions hedging equity exposure, corporations managing exposure to underlying markets, or retail investors protecting positions. Options are an important tool that can help end users manage risk, and increased hedging demand translates directly into higher contract volumes on our exchanges. All of these factors contribute to our Q1 performance. First quarter total net revenue grew 40 percent year over year to $129 million, and adjusted EBITDA margin improved by 800 basis points year over year to 51%. Q1 adjusted diluted EPS was $0.42. These results reflect the continued strength of our options business, the operating leverage in our model, and the broadening contributions we are seeing across the platform. To order a look at our business segments, our options franchise continued to perform well in Q1, with market share and volumes tracking ahead of level seen in the first quarter of 2025. Our market share and multi-listed options was 17.3% in the first quarter, up from 16% in the prior year period. We continue to see opportunity for share gains over time as we build out new functionality and bring new products to market. Our Sapphire trading floor continues to build momentum, and on April 14th of this year, we had our first million contract day. We've also seen improvements in our equities business with improved capture rates during Q1 and line of sight to sustain profitability. Our international segment delivered another strong quarter, and looking ahead, we'll continue to streamline operations across Tice and BSX to maximize revenue as well as cost synergies. In futures, our Onyx platform continues to perform well, and we are in the final stages of industry testing ahead of the launch of our new Bloomberg Equity Index futures. We will be launching the first product, a retail-sized contract, based on the Bloomberg 100 Equity Index on the evening of May 17th. We are launching with three different contracts designed to serve both institutional and retail participants. The full B500 contract provides large notional exposure for institutions, while the teeny B500 and B100 contracts are smaller-sized versions of those indexes targeted at retail investors with fees that we expect will be very competitive with existing contracts traded by our peers. These new futures will clear at the Options Clearing Corporation, giving our members real margin efficiencies as part of their broader equity derivatives activity. The Bloomberg 500 and the Bloomberg 100 indices are built differently than the competing futures and options market benchmarks. Rather than relying on a committee to make decisions about which companies belong in the index, Bloomberg uses a transparent, rules-based, algorithmic methodology. Constituents are added and removed based on predetermined criteria, eliminating subjectivity and delays, and newly minted public companies can be added faster than under a committee-driven process. We think this is a better construction and a meaningful structural advantage as the IPO pipeline improves, and we believe the market will come to appreciate these differences. We have been working closely with liquidity providers on both onboarding and platform integration, and Bloomberg is an active partner in our go-to-market effort. The market takes time, but we are doing it in the right way. The infrastructure is in place, the participants are engaged, and we are confident in the long-term opportunity this product suite creates for MyX, Bloomberg, and our members. Following our Bloomberg product launch, and given clear customer demand, we intend to bring additional commodity and agricultural products to the market. I also want to provide a brief update on our sale of MyXDX, now called Rothera. As previously announced back in January, we completed the sale of 90% of the business to a joint venture established by Robinhood Markets in partnership with Susquehanna International Group. MyX retains a 10% equity stake in that joint venture, giving us accelerated access to the predictions marketplace without tying up capital or resources. We will carry that stake it costs with any future distributions flowing through as dividend income. In other words, this is not something investors should be building into their revenue models. What it represents for MyEx is real long-term optionality, a position in a growing market alongside two strong partners with upside if the prediction market volumes scale the way we believe they can. We remain focused on what we can control, which is running our business exceptionally well. With positive free cash flow, we are generating cash and ended Q1 with more than $550 million in cash on our balance sheet. Our capital allocation priorities are unchanged. Organic growth opportunities, including our futures business, supporting the Bloomberg product launch, and investing in technology and people. Beyond that, we are open to opportunistic acquisitions that fit our strategy and make sense for our business. We understand that our cash position is a competitive advantage, and we intend to deploy it thoughtfully. With that, I will turn it over to Lance to walk through the financial details.
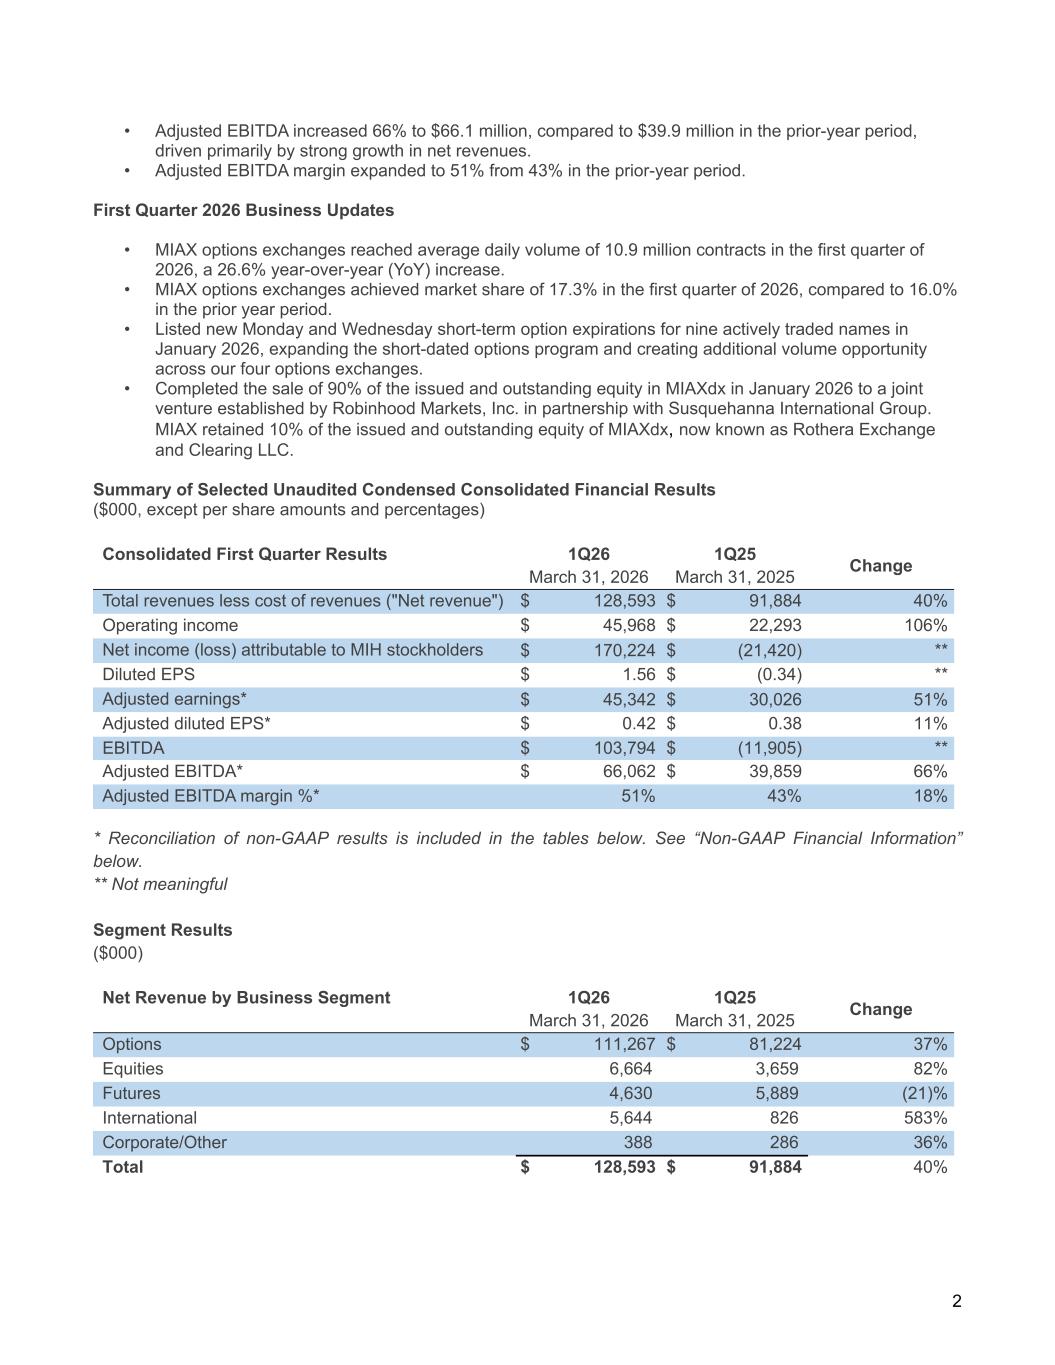
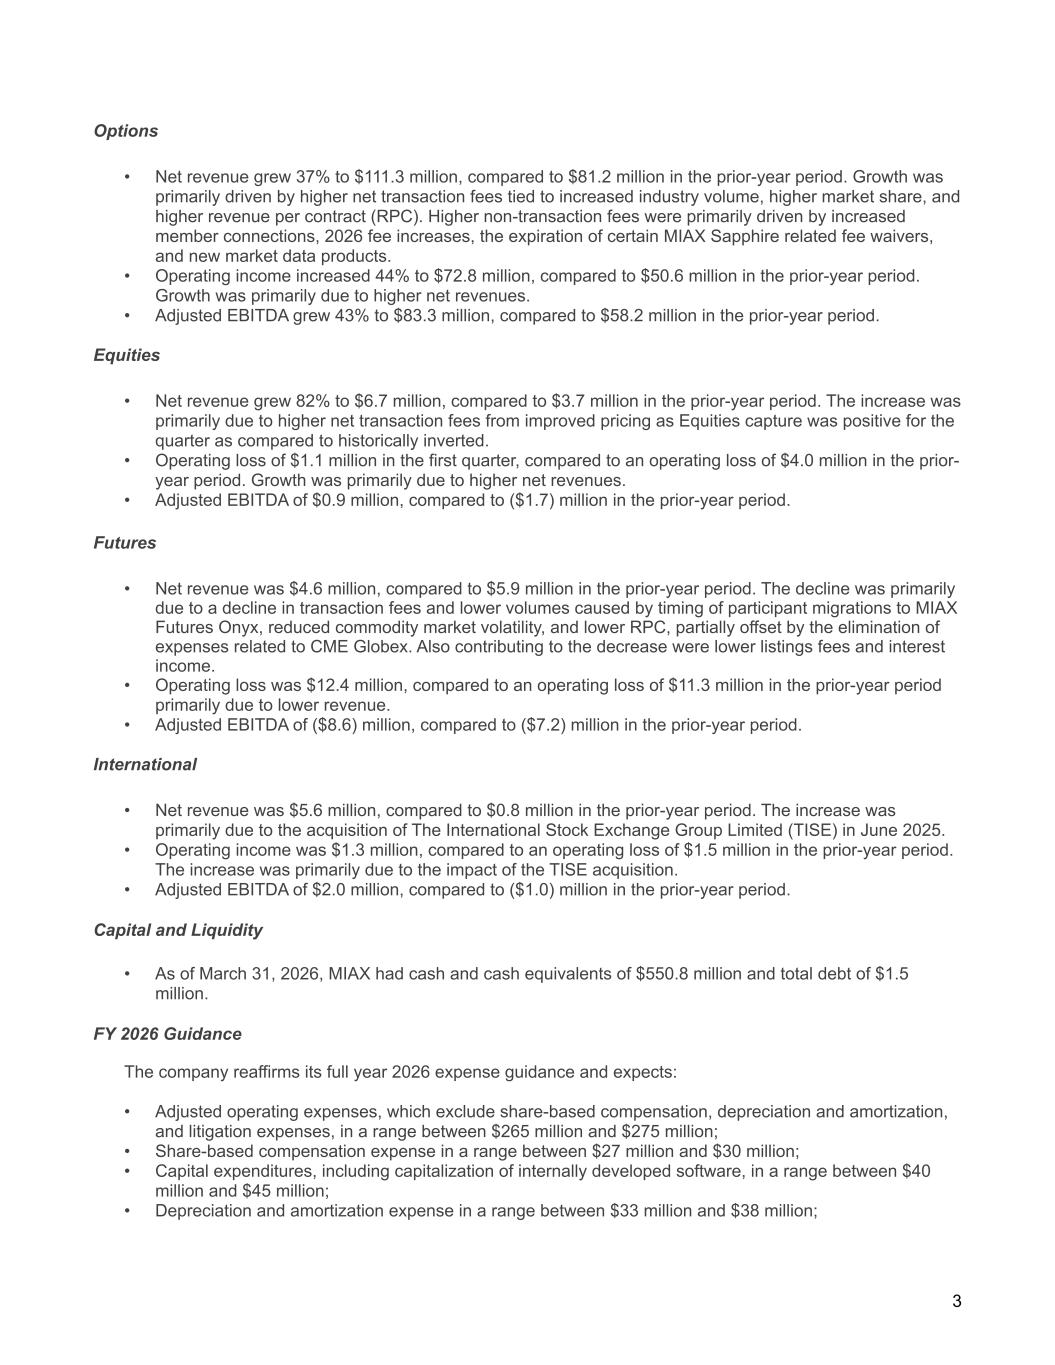
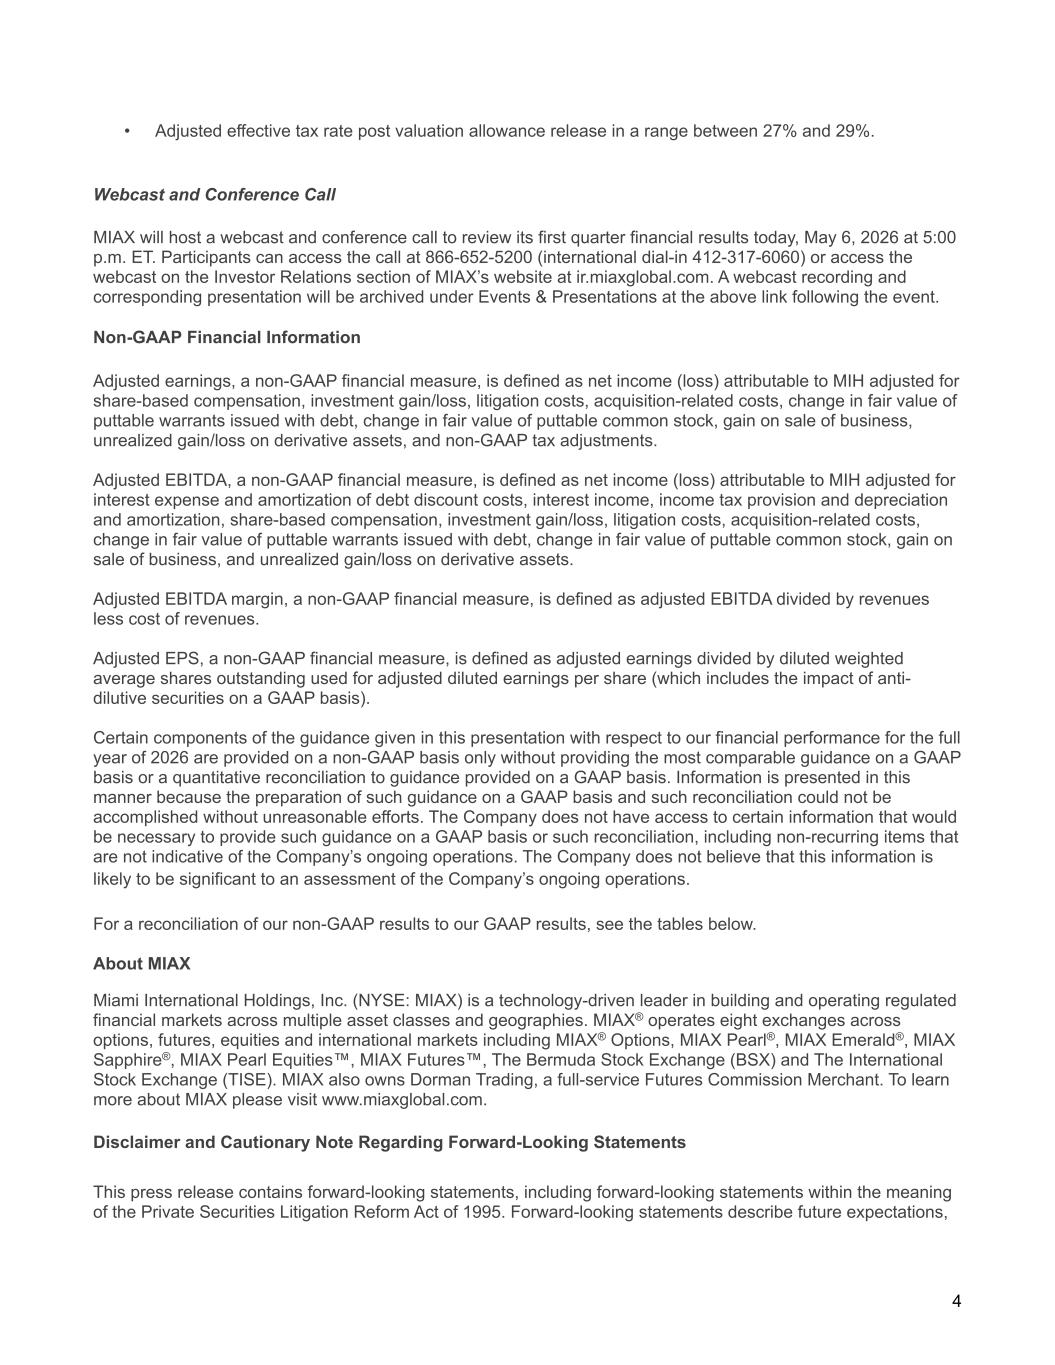
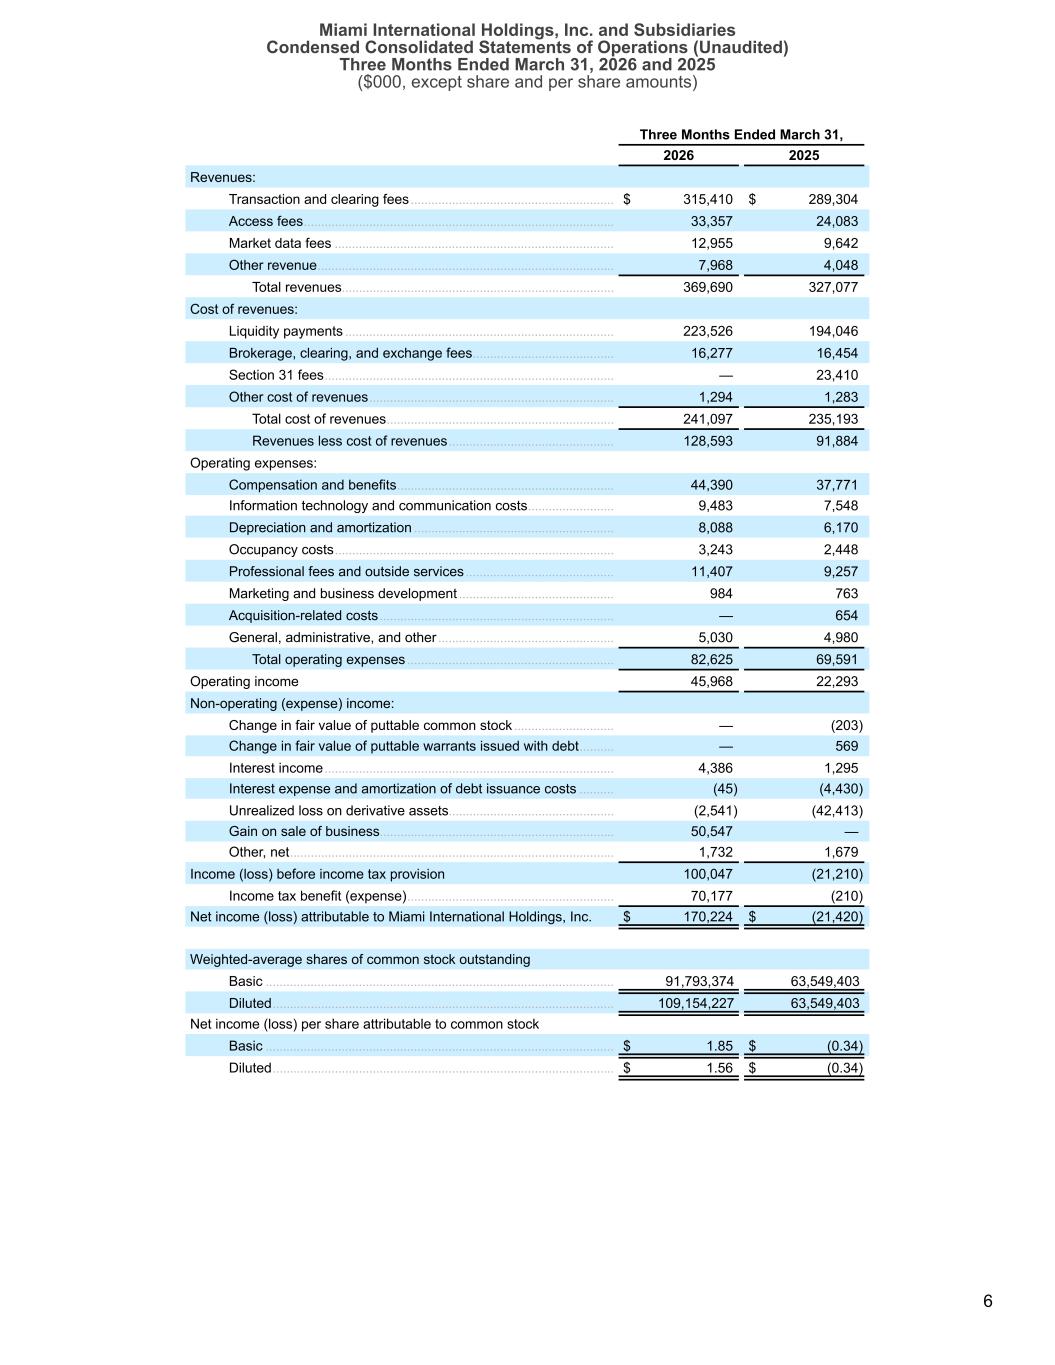
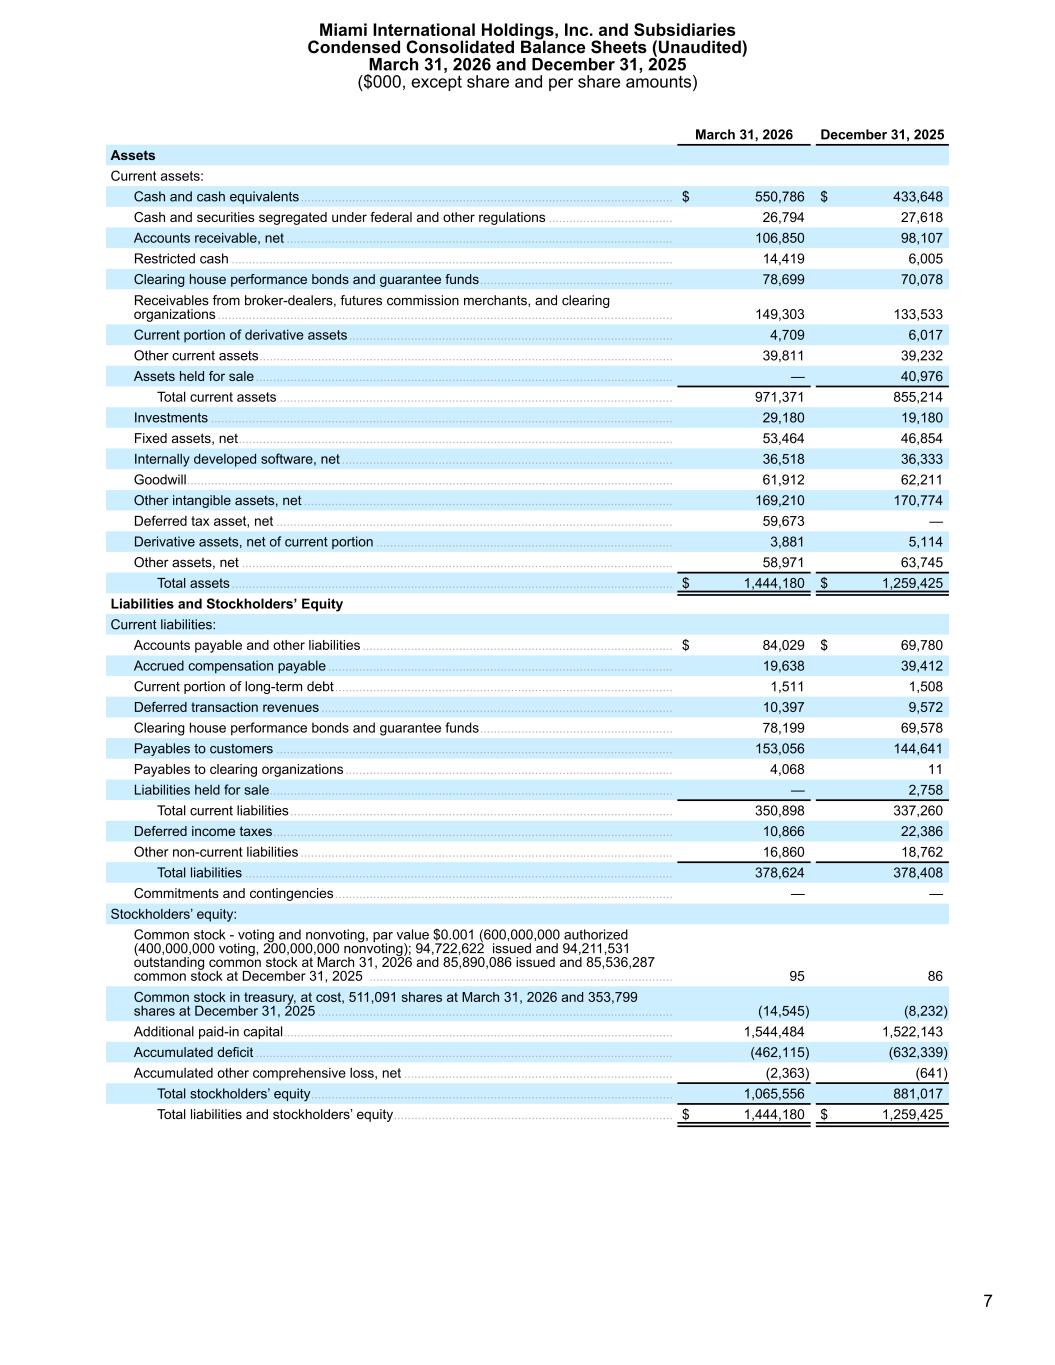
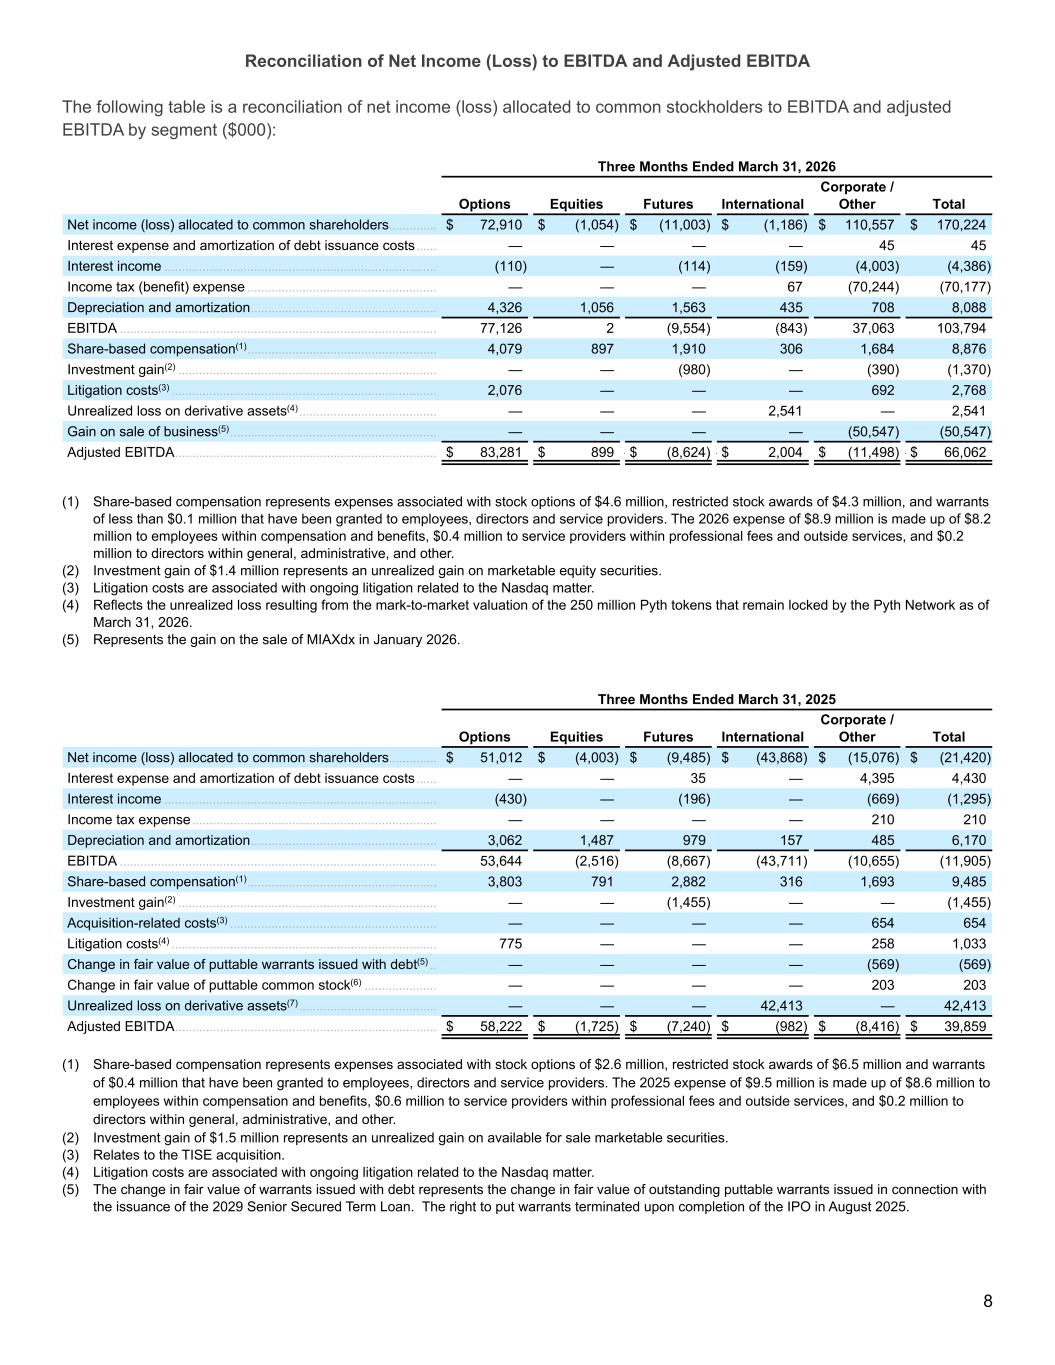
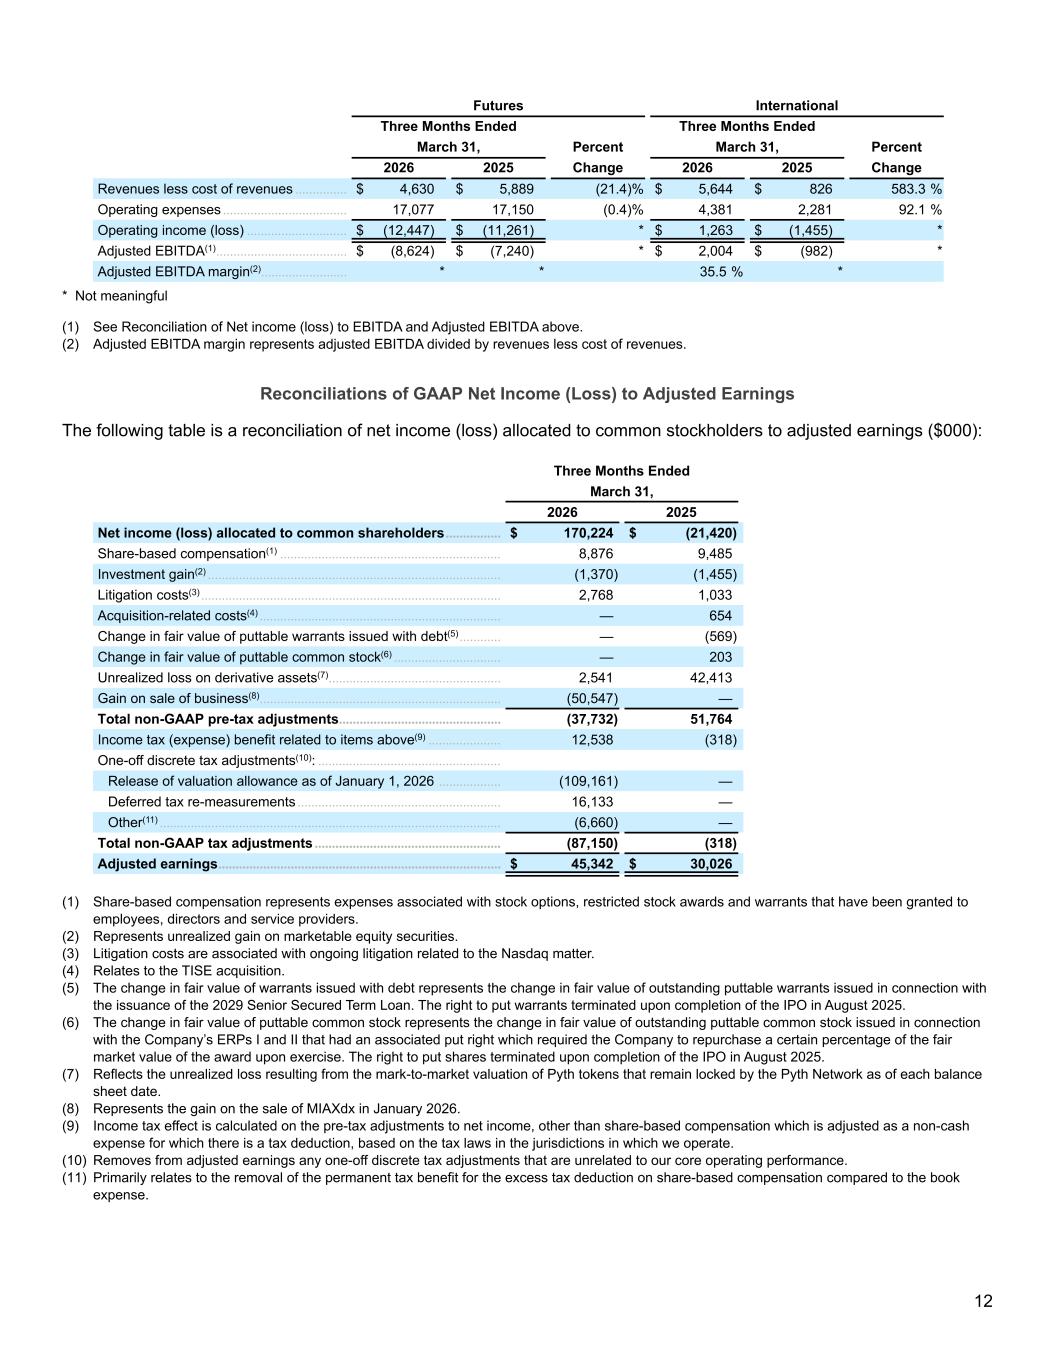
Good afternoon. We are pleased with how the quarter came together across the board. Before I get into the numbers, let me briefly remind you of MyEx's revenue model. We generate revenue from transaction and non-transaction fees. Our key performance drivers for transaction fees include industry trading volumes, market share, and revenue per contract or share, which measures the average revenue we earn per contracts or shares traded. We provide RPC and capture rates on a three-month rolling average basis on our fees. We generate revenue from access fees, which we charge customers to connect to our exchanges, from market data, which we earn through direct subscriptions and through our participation in the U.S. tape plans, and from listings fees, primarily in our international segment. Q1 total net revenue grew 40% year-over-year to a record $129 million, reflecting strong performance in our options business and growing contributions from our other business segments. Organic net revenue growth, excluding the contribution from TICE, was approximately 35% year-over-year. Adjusted Q1 operating expenses were $63 million compared to $52 million in the prior year period. This increase was primarily due to planned expansion of headcount to support our growth initiatives and higher employer payroll taxes tied to the timing of incentive compensation payments. Adjusted EBITDA was $66 million, up 66% year-over-year, and adjusted EBITDA margin was 51%, up 800 basis points year-over-year. This reflects the operating leverage in our model as revenue scales across a largely fixed cost base. Income of $170 million includes a $51 million gain on the sale of MyXDX and a $70 million income tax benefit for the quarter, primarily resulting from the lease of our valuation allowance of cumulative positive pre-tax income and our expectations for future profitability. Percent year-over-year to $45 million in Q1 compared to $30 million in the prior year period. Q1 segment performance. Option segment net revenue is $111 million of 37% year-over-year. This represents average daily volume of 10.9 million contracts, a 27% year-over-year increase that outpaces industry ADV of 17%. Oxen-segment net revenue growth was driven by an increase in both net transaction fees and non-transaction fees. Growth in net transaction fees reflected higher industry average daily volume, continued year-over-year market share gains, and higher revenue per contract. Non-transaction fee growth of 45% was primarily due to increases in member connections, fee increases, market data sales, and the expiration of certain MyExSapphire fee waivers. That Q126 included $2.7 million in ad hoc historical market data sales from a new market data offering. We expect this type of revenue will be episodic in nature, and we would not recommend modeling as a run rate item. Options market share for the quarter was 17.3%, up year over year, but down slightly on a sequential basis. Market share fluctuates quarter to quarter, and we continue to manage our business for the right mix of volume and economics rather than for a headline share number. With that in mind, we do continue to see opportunities to grow share over time. Our technology remains differentiated. Our complex order franchise continues to grow, and the Sapphire floor is performing well. RPC remains strong, reflecting the quality of order flow we are attracting. That includes complex orders and high-touch flow routed through our Sapphire trading floor, which carry higher capture rates. Early market share in the single-name Monday and Wednesday expirations across the nine names has largely tracked in line with our historical share in those classes. We view this as an additive volume driver and support expansion to additional names over time, subject to market demand, and record segment net revenue was $7 million, up from $4 million in the prior year period, primarily due to higher net transaction fees from improved pricing. Equities capture was net positive for the quarter compared to inverted in the year-ago period. future segment net revenue was five million dollars compared to six million dollars in the prior year period due to lower listings and interest revenues and decreased net transaction fees. Natural segment net revenue was six million dollars compared to one million dollars in the year ago period due to the acquisition of TICE in June of 2025. Following our TICE acquisition we're beginning to streamline sales and marketing processes across our international operations to better serve global debt issuers and listings clients. We ended the quarter with cash and cash equivalents of $551 million and outstanding debt of less than $2 million through our 2026 guidance. We are reaffirming our full year 2026 adjusted operating expense guidance of $265 million to $275 million. Our expense expectations for the rest of the year include planned increases in marketing costs, including for quarter incentives associated with our Bloomberg index futures products, excellence in every exchange nationwide average. Full-year share-based compensation expense in a range between $27 million and $30 million. We also continued to expect full-year capital expenditures in a range between $40 million and $45 million. CapEx was a bit front-loaded in Q1, as we locked in many equipment purchases ahead of AI-driven price increases. Given that, we were comfortable with reiterating our full-year guide. Excludes the release of our deferred tax valuation allowance was 27.2%. Beginning in Q2, we expect our tax rate will be in the 27% to 29% range, consistent with the guidance we provided in February. I'll now turn it back over to Tom.
Thanks, Lance. We are very excited about our recent progress and look forward to another productive year in 2026. We'll keep doing the things we said we'll do and leverage the four competitive pillars you've heard me talk about before. Our high-performance technology, our broad range of regulatory licenses, our diverse and expanding product range, and our deep customer relationships that now include Bloomberg. These remain real competitive advantages and will help us drive long-term shareholder value. We like what we see ahead. The upcoming launch of our Bloomberg Index Futures products represents a major milestone, and the growth we are seeing in single-name, short-dated expirations is encouraging. We also see incremental volume opportunities for our exchanges given an improving IPO pipeline and continued growth in structured products that use options as part of their strategies. Before we close, I want to acknowledge the recent sudden passing of our friend and board member, Mary Stahl, who passed away a few weeks ago. Mary was an exceptional leader who brought insight and integrity to our board, and his positive impact will be felt by our team for years to come. One of the things Murray believed is that there is a real opportunity for a truly global exchange operator. Thanks to him and the support of our employees, members, and shareholders, we're well on our way towards realizing this vision. We're grateful to each of you for joining us today, and as a reminder, Doug and Shelley are here with Lance and I for Q&A, So let's begin. Operator?
Operator
Thank you. We will now begin the question and answer session. To ask a question, you may press star then one on your touchtone phone. To withdraw your question, please press star then two. And at this time, we will pause momentarily to assemble our roster. The first question will be from Patrick Moley from Piper Sandler. Please go ahead.
Yes, good afternoon. Thanks for taking the question. Maybe just starting off with one on options, market share. The year of your growth has been quite impressive, and you mentioned that you were optimistic on some of the opportunities for further market share gains there. I understand the Bloomberg options would probably be part of that, but maybe if you could just walk us through what you think are the biggest opportunities to grow market share and how we should think about some of the puts and takes here throughout the rest of the year. Thanks.
Thanks very much, Patrick, for that question. I'll start and maybe I'll turn to some of my colleagues here. There always are normal shifts in volume and market share quarter to quarter, and obviously myself and our team watch it really closely. With regards to Q1, our RPC was very strong, And I think it reflected order flow quality and market share gains in areas with higher capture rates. So anecdotally, I did see some shifts in what I would call lower capture or negative capture volume. But I consider this the normal quarter-to-quarter migrations from time to time. At my disposal, we have a range of pricing mechanisms. that we can use to grow market share. And, you know, what we really do is try and target the right mix of volume and economics rather than, you know, look for a headline share number. Maybe I'll turn it over to Shelly to talk about some of the ways that we think we can increase that market share that we experienced here in Q1 of 17.3%. Shelly?
Thank you, Tom. Tom, and thank you, Patrick, for the question. As Tom said, we focus not just on market share but also capture rate. And by changing market share in terms of less low capture volume and less negative capture volume, it's truly a positive from a revenue perspective. But as Tom said, we do have some ability to raise market share by focusing on other lower quality or lower volume, excuse me, lower capture products. And it's a constant mix between that market share and net capture.
Delia, in terms of the dials to increase our volumes and our market shares, can you just talk about quickly the Sapphire floor and maybe some other releases coming out in 2026?
Absolutely, Tom. We continue to see growth in the Sapphire floor. That's higher capture business rather than the electronic business, which tends to be lower capture. We're seeing growth there, and we have additional releases coming throughout the year, first one next month, to enhance functionality, which we believe will draw a greater flow to the trading floor. Again, that trading floor is higher capture than the electronic markets.
And, Shelley, just quickly to finalize the question from Patrick, give us a sense of what the volumes were on floors in Q4 versus Q1 of this year.
Mark, market shares in the trading floors have been ranging from about 6% to 8%. The first quarter this year, it was 8.1% across all the trading floors versus 6.5% in 25%. So we're seeing growth in the volume on trading floors, and we're seeing some growth from our trading floor as well, and I expect continued growth with the new functionality.
Patrick, you know, the secular tailwinds that have been driving ADV in the industry and driving ours, to me, they remain intact. Some of the same concerns and issues with global strife, interest rate questions, a political season, those are still creating the tailwinds that we had as we ended 2025. So thank you for the question.
Operator
And the next question will come from Michael Cypress from Morgan Stanley. Please go ahead.
Great. Thanks so much for taking the question. I was just hoping to dig in a little bit further on the market share. You mentioned scope for new functionality, new products. I was hoping you could elaborate exactly on what that entails, what the timing looks like, what the sort of, I guess, benefit and ramping that you expect on the back of that. Thank you. Yeah.
I think, Shelly, if you wouldn't mind just following up on that, you know, and the things that I'm thinking about are the, you know, the expanded single name expiration, Shelly, and the IPOs. But do you want to throw a little more color on that for Michael?
Absolutely, Michael. Thank you for the question. So there's multiple aspects of this, as Tom said. We see continued growth still very early in the daily weeklies on equity options. That's been very positive for the industry and positive for us as well. Our overall market share in those names tends to be higher and continues to be higher than the other names that we trade. flow of IPOs in the marketplace has improved over the last year and it's going to accelerate into this year. As you're aware, there's three, I think they're calling them mega IPOs, expected to happen this year. And we believe there'll be tremendous option volume in those classes once they become options eligible. So there's definitely tailwinds here. And then the functionality enhancements, it's a constant. We're constantly working with our members in the trading floor to see what we can do to help them bring additional volume here to our marketplace. And that growth, we believe, will continue throughout the year with the additional releases, bringing additional volume to the trading floor.
And Shelley, would you speak for a moment about maybe increases in the folks that are joining the Sapphire floor, and how does that look?
There's continued growth in the floor. We have additional brokers coming to the floor as well as additional market makers. There's a lot of interest in what's going on on our trading floor when members from other exchanges come down to visit the floor. They're very impressed with the functionality, with the feature set we've built, and the environment, and, of course, the fabulous economic environment in Miami. So there's a lot of excitement about our floor, and I believe there are more members to come, which will, of course, bring additional value.
Operator
Thank you, Michael. And the next question comes from Ken Worthington from J.P. Morgan. Please go ahead.
Good afternoon. Thanks for taking the question. So on the short-dated company options, clearly they're off to the races. Maybe first, could you refresh us on your market share in these short-term company options in the quarter? And you mentioned the mega IPOs, but how are you thinking about the build-out of new single-company options? I think to my question last quarter, you said you preferred the build-out of new options rather than doing the Tuesdays and the Thursdays. So how does the pathway to more listings look for you?
Yeah, Shelley, why don't you take that as well, Shell?
Sure, thank you. Our market share in those nine classes range between 18% and 20% of the multi-listed volume, which is higher than our overall market share across all classes. That's why we believe we win these new listings. So we're excited about that program eventually expanding. It's an open discussion, and there's actually been discussion at several recent industry events, including this week at OIC, about whether the growth in the single-name weekly options will come from adding Tuesdays and Thursdays or adding additional classes. The reality is both options are available to the industry. It's not our decision individually as an exchange to decide. This is these listings, whichever exchange adds new classes or would add Tuesdays and Thursdays, the entire industry will follow. I believe that expanding the program across additional classes is probably the next wave, but it's still very early in the program, and we're still just letting the industry absorb this new volume and these new products, and that the decision will be made over the next several months as to which way that we will build out additional volume. Thank you.
Operator
Thank you very much, Ken. The next question will be from Jeff Schmidt with William Blair. Please go ahead.
So the EBITDA margin expansion continues to be really strong, held by higher volatility in the quarter, but what do you think is kind of a good run rate there in a more normalized environment? Obviously, it should go up over time, but, you know, would you expect that to fall a bit as volatility comes down?
Thanks for the question, Jeff. We're very excited about the continued margin expansion, that 800 basis points, very proud of. And we'll give you some more details. Lance?
Yeah, Jeff. Yeah, I mean, look, we do focus on maintaining and growing that EBIT margin and getting that above 50 percent, obviously was a big milestone for us in the fourth quarter and continued in the first quarter. We do expect to grow that over time, especially as we bring in revenues outside of the options business. You can see the equities business has remained profitable in the quarter, a nice contribution in the international business now with the acquisition of Tice. I think in the futures business, as we see new revenue come in from the Bloomberg and other products we're going to launch, you know, that will come at a very high incremental margin. You know, quarter to quarter, you might see some shifts, particularly, you know, in the next couple quarters as we start to spend more on branding and marketing initiatives and incentives around the launch of the Bloomberg products. But again, we'll be very judicious in how we spend those. But we really think we've got some really good opportunities to bring in volume and new revenue in the futures business.
And then the physical trading floor, I may have missed it, but did you mention what your share was of those industry volumes, which I think you said were, like, hovering around 6% to 8%? And, you know, do you see that floor helping with adoption of index options potentially later this year? I mean, aren't a lot of those volumes still traded on floors?
Yeah, I'll cover the market share and tell you you can discuss the index options. But the market share for the quarter was about 40 to 50 basis points. So slowly ticking up, but, again, we think as we release additional functionality over the next several months that we'll be able to capture even more than our sort of one-sixth of that day.
Yes, thank you. To add on what Lance said about the market share, we've been steadily rising from about 5% of floor volume to about 10% of floor volume. There's an ebb and flow each day, but that's growing over time. With regards to index options in the trading floor, the first point I want to make is we're listing the cash settle options on the Bloomberg indexes on MIX options, and our trading floor is Sapphire options. So they are two different exchanges within the MIX family. That being said, we certainly have the optionality to carve out part of the physical space on the existing Sapphire trading floor and make that a MyAX Options trading floor specifically for index products, and that is one option we have in our back pocket. But it's really an open question as to whether or not an index product really needs a trading floor. Certainly, our competitor has a trading floor. The products initially traded in the trading floors before they went electronic many years ago, and they've seen a steady shift of volume from the floor to the screens. That being said, we did experience during COVID the shutdown of the trading floors, and 100% of that index volume went electronic for several months, eventually coming back to the trading floor. My belief is that you can operate a full suite of index options on an electronic marketplace without a trading floor that the incumbent chooses to keep the trading floor open because that's what they've traditionally done and they have a lot of members on that trading floor. I believe having a fully electronic market would lead to better quality markets, more screen activity because of tighter markets and more liquidity being shown because the electronic market makers who are also the floor market makers aren't competing with themselves in the electronic versus floor. A lot of the floor business is also complex business, and the incumbents do not allow electronic auctions over a certain size. We think those are disadvantages to customers, and we will automate those functions. So, therefore, we think our product will be a superior product because of the electronic features. Great. Thank you.
Operator
Great. The next question is from Chris Allen from KBW. Please go ahead.
Good afternoon, everyone. Appreciate you taking the question. I was wondering if you could unpack the growth in access fees, a very nice trajectory, both on a year-over-year sequential basis. I know you mentioned member connections and fee increases. I just wonder if you could maybe quantify the impact of the fee increases, whether any of the MIAC Sapphire fee waivers were in there as well, just trying to understand organic growth trajectory in terms of what's being driven by new connections, new sales versus fee increases.
That's a great question, Chris. Lance, you want to take that?
Good to hear from you. Yeah, it's basically split down the middle between new member connections, for the most part, and fee changes. On the fee changes, it was both fee increases we made January 1st, as well as the expiration of some Sapphire fee waivers, just like we've done in the past when we launched a new exchange. We tend to either waive fees or discount them and then kind of remove those waivers over time. So, net-net half is fee increases and half is new member connections. Thanks, everybody.
Operator
Thanks, Chris. The next question is from Patrick O'Shaughnessy from Raymond James. Please go ahead.
Hey, good afternoon. Curious if you guys anticipate any impact, either positively or negatively, from options regulatory fee reform that looks like it's going to take place on July 1st.
As have other exchanges, we have, in fact, filed rule changes that may or may not be effective on July 1, depending upon whether the industry is capable to do what they have to do from the technology perspective. We have not finalized our rates as of this time. So I really don't have an opinion as to whether or not these will cost us, you know, impact revenues or they'll be neutral. So right now, this evening, I'm really not in a position to tell you how that's going to impact our regulatory expense reimbursement or any other exchange. Lance, any color on that you want to add? No, I think you covered it, Tim.
All right. I appreciate that. And then for my follow-up, so you mentioned that you're launching the Bloomberg 100 product on May 17th. What's the sequencing then for launching the 500 products, and why are you starting with the 100 rather than the 500?
Good question, Patrick. Shelley, you want to pick up?
Thank you, Patrick. That was a very good question. It was an interesting call between the three initial futures, which the list first. Working closely with our retail firms that are interested in the product, many of them felt that their retail customers would have more interest in the B100 index initially because of the makeup of the index. They find a lot of their retail likes to trade in that family of indexes. than the software technology companies. So that's why we made that choice. As far as the rollout, we certainly wanted to start slow. So we're starting with just one product and day one on May 18th. We're listing the B500 teeny contract two weeks later on June 1st and the B500 big contract a week later from that June 8th. But we want a slow rollout. It's a new product. It's a new data center for us, a new relationship because we're clearing these products at OCC, which benefits the entire industry from a margin and capital perspective. So that was the decision process.
And then when do we follow with the big, Shelley, to answer the back end of the question?
The big is June 8th. The B500 big will be June 8th. It's the third rollout.
Very helpful. Thank you. Of course.
Thank you. Shelly, maybe before we break, Shelly, just a question, I mean, a point to make. What has you excited about this new proprietary product suite now that we've finished the Onyx trading platform, the clearing, and now the relationship with OCC for futures? What has you excited about this launch?
The buzz in the industry has been there hasn't been a real strong competitor to the existing index complex. I believe over 95% of index volume is concentrated in two products, the SPX and the VIX. The industry of buzz is we need competition. We'd like to see competition in these products. We'd like to see competition across exchanges. We believe these are better constructed indexes for all the reasons Tom mentioned earlier. We believe our technology is a differentiator. It's how we've gone from zero to 17-plus percent market share just since the last 15 years. Combining those with, again, electronic trading and some of the other functionality we built, the buzz both from the market makers who are interested in trading the product and the retail firms has been very positive.
Thank you, Shelley. I think we have time for one more question.
Operator
Certainly, and that question will be from Chris Brendler from Rosenblatt. Please go ahead.
Hey, thanks. Good afternoon, and congrats on really strong results here. I wanted to ask a question just given it's topical, since I covered more of the crypto names. Bullish's acquisition recently sort of thrown some ideas around about tokenization. It seems like it's really gathering steam. How do you guys think about tokenization and how it might impact your business?
Well, great question, Chris. Tokenization is not our focus right now. Our focus is really on the core business and maximizing the new product launches, particularly in the futures area, based on the investments that we've made over the last several years. You know, we're going to We're going to watch it. We're going to see what develops over the course of the next year. But, you know, I really want to focus on the businesses that we've acquired and the organic growth and the technology we've just, you know, brought to the futures market. So, you know, we're watching it closely, but I just want to be very frank. It's not a core focus today.
Yeah, it makes sense. I'll ask a core business question as a follow-up. I may have missed this, but is the impact from the new single stock weeklies, I assume it's still negligible at this point? It's not actually having a material impact on your results?
Yeah, yeah, that's correct. And Lance, you want to just add some color to that?
Yeah, we're seeing the same things in the data. It's still early days. I mean, we all sort of believe across the industry that it is additive, but as I said, it's still a small negligible contributor at this point. But we do think it could grow over.
Just to add to the second year, Terrell, thanks so much, guys.
Operator
Thanks, Chris. And, ladies and gentlemen, this concludes today's question and answer session. I would like to turn the conference back to Tom Gallagher for any closing remarks.
Well, thank you very much, everyone, for joining on this evening. Obviously, we've had a great quarter, and we're very grateful for the support of all of our member firms and our shareholders that have helped us get to this spot. I'm continuing to focus on our four pillars that have gotten us here, and we're going to continue to work closely with the members that we have developed relationships since our first launch in 2012. And we're really proud of the new relationship with Bloomberg, and I think we've got a real exciting future here in 2026. So thanks very much for your participation this evening, and we're happy to follow up individually over the next few days. So have a nice evening. Thank you again.
Operator
And thank you, sir. The conference has now concluded. Thank you for attending today's presentation. You may now disconnect.