Operator
Greetings. Welcome to Orion Properties' first quarter 2026 earnings call. As a reminder, this conference is being recorded. I would now like to turn the call over to Paul Hughes, General Counsel. Thank you. You may begin.
Thank you and good morning, everyone. Yesterday, Orion released its results for the quarter-ended March 31, 2026, filed its Form 10-Q with the Securities and Exchange Commission, and posted its earnings supplement to its website at onlreit.com. During the call today, we will be discussing Orion's guidance estimates for calendar year 2026 and other forward-looking statements, which are based on management's current expectations and are subject to certain risks that could cause actual results to differ materially from our estimates. The risks are discussed in our earnings release as well as in our Form 10-Q and other SEC filings, and Orion undertakes no duty to update any forward-looking statements made during this call. We will be discussing non-GAAP financial measures such as Funds from Operations, or FFO, and Core Funds from Operations, or Core FFO. These non-GAAP financial measures are not a substitute for financial information presented in accordance with GAAP, and Orion's earnings release and supplement include a reconciliation of our non-GAAP financial measures to the most directly comparable GAAP measure. Hosting the call today are Orion's Chief Executive Officer, Paul McDowell, and Chief Financial Officer, Gavin Brandon. And joining us for the Q&A session will be Chris Day, our Chief Operating Officer. With that, I am now going to turn the call over to Paul McDowell.
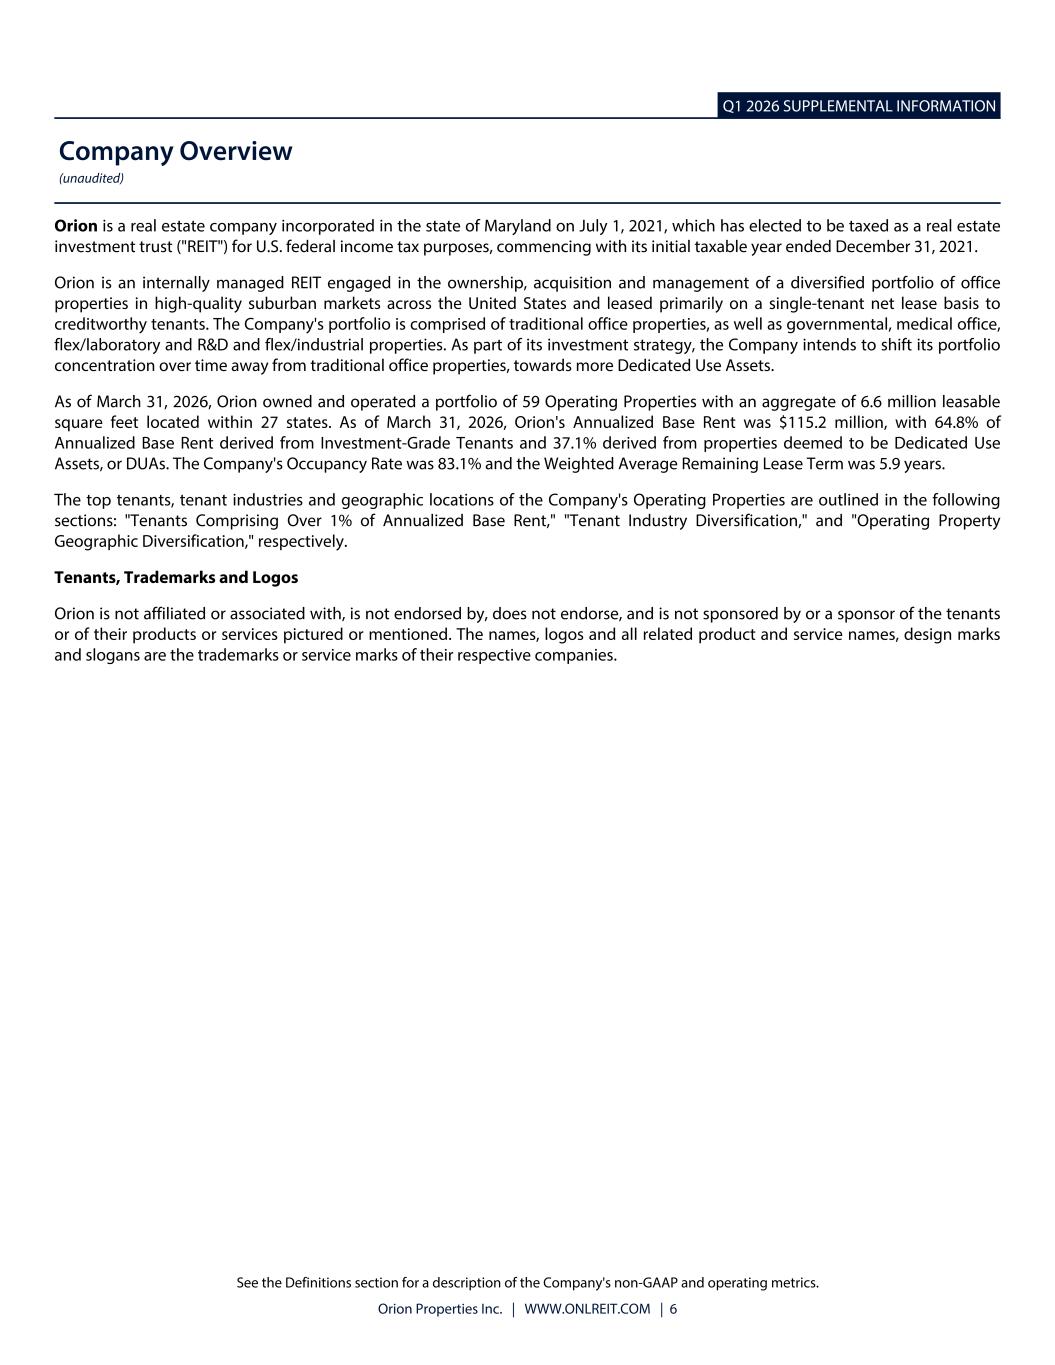
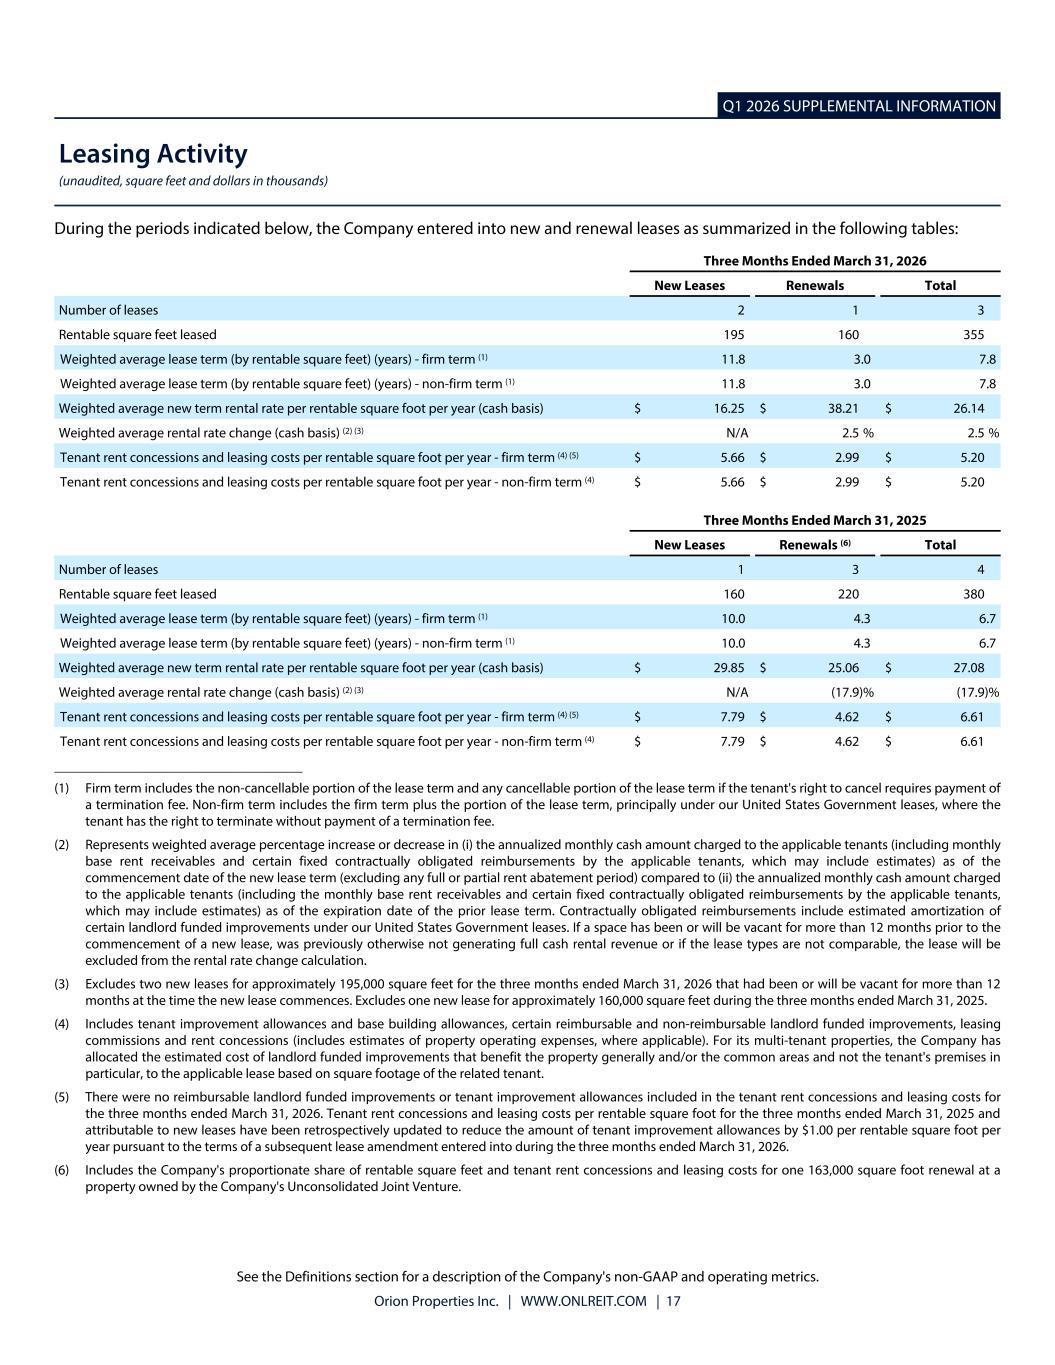
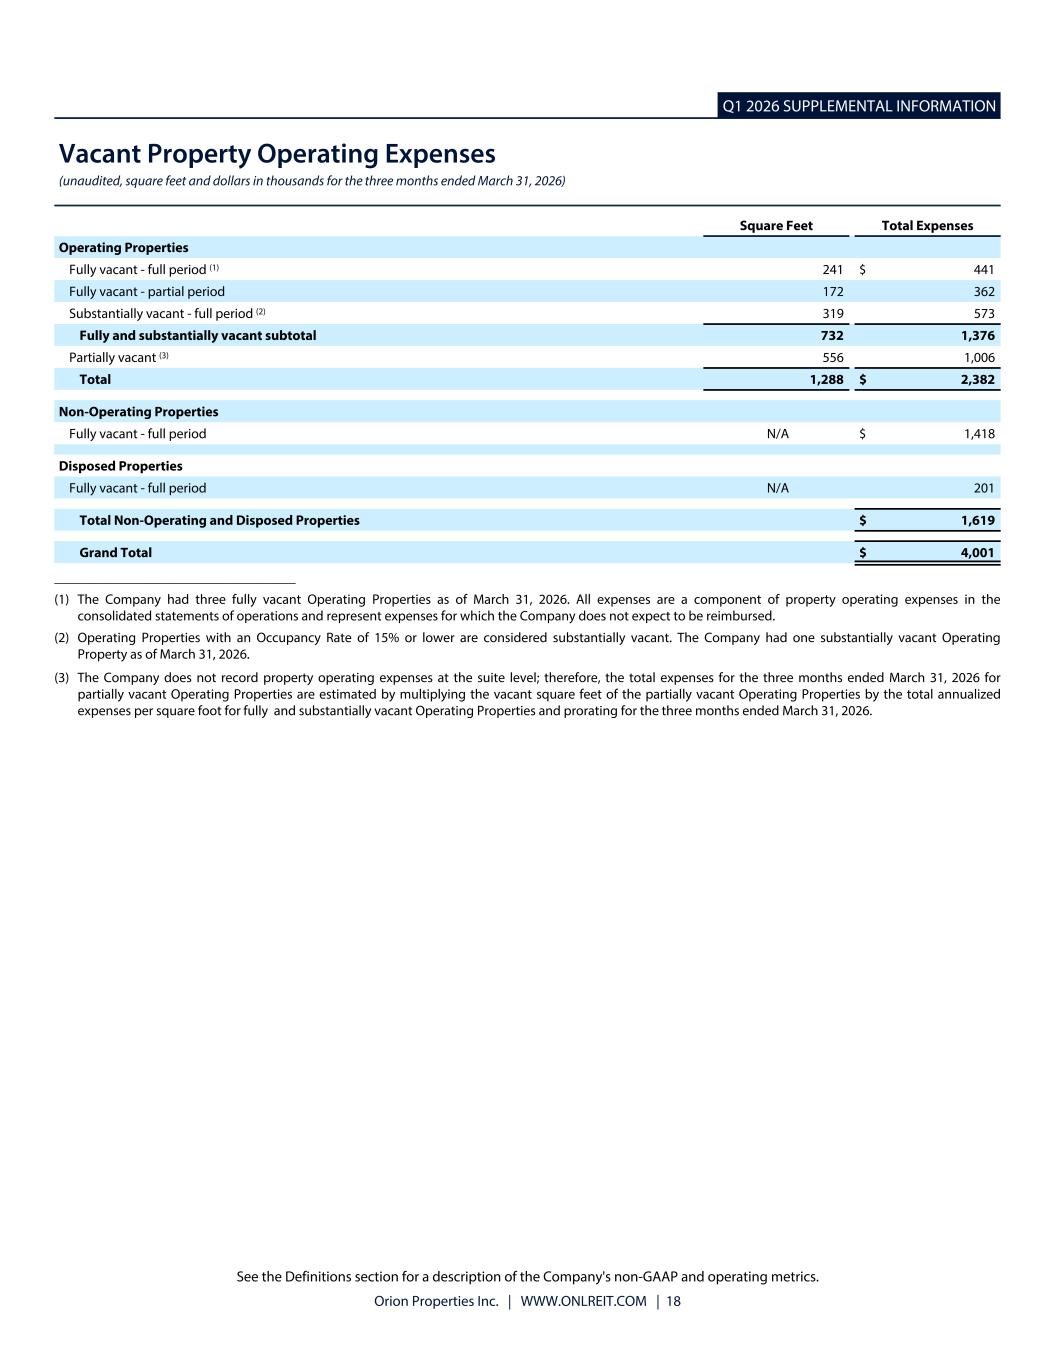
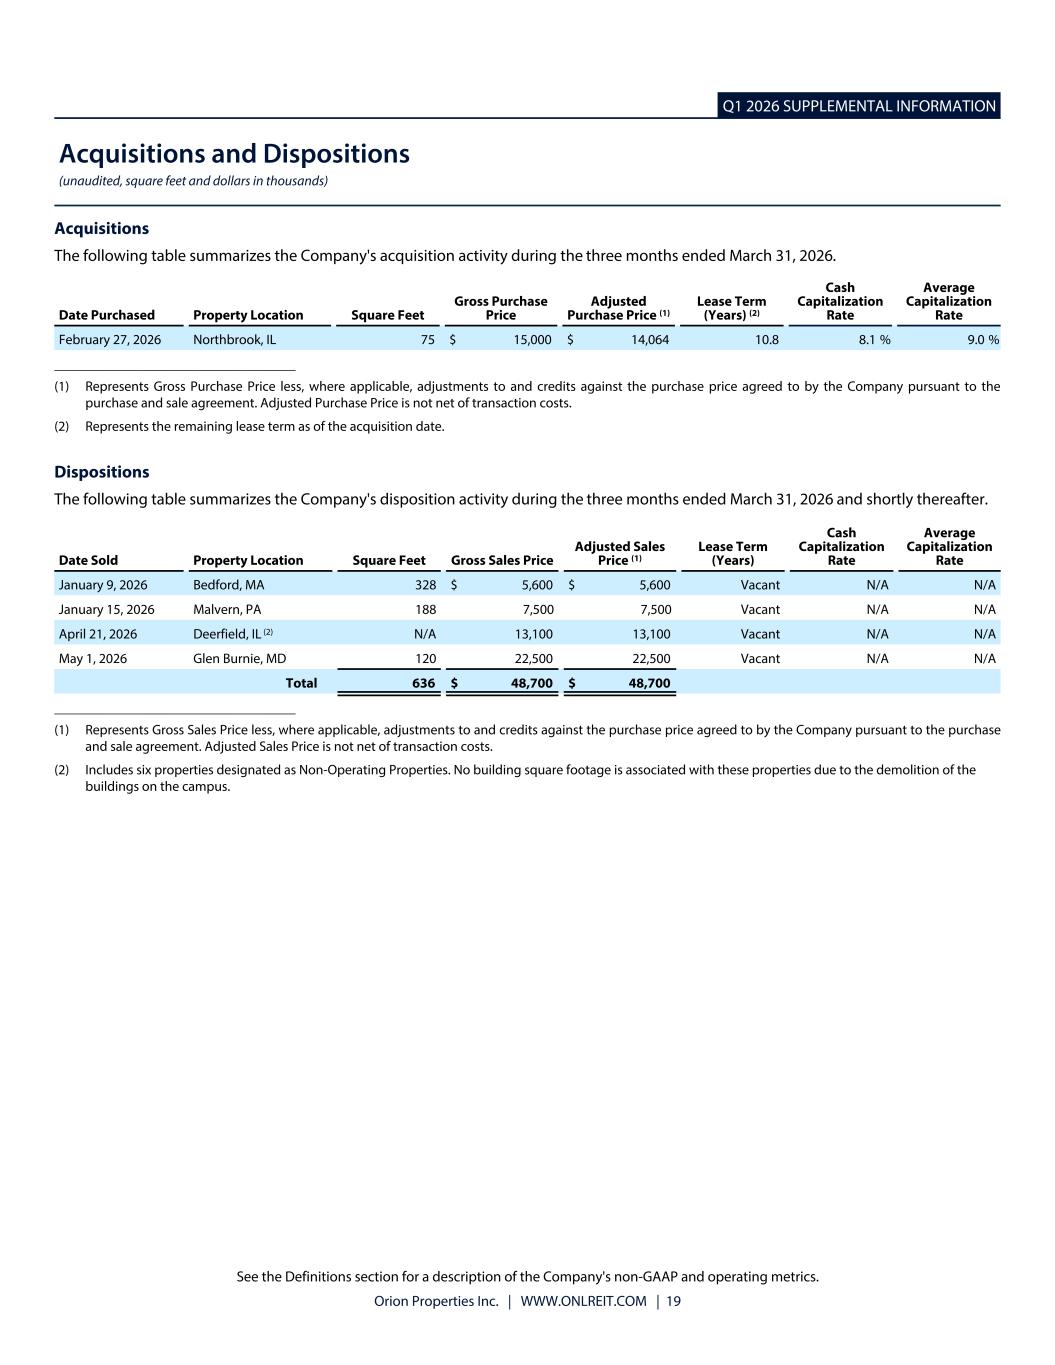
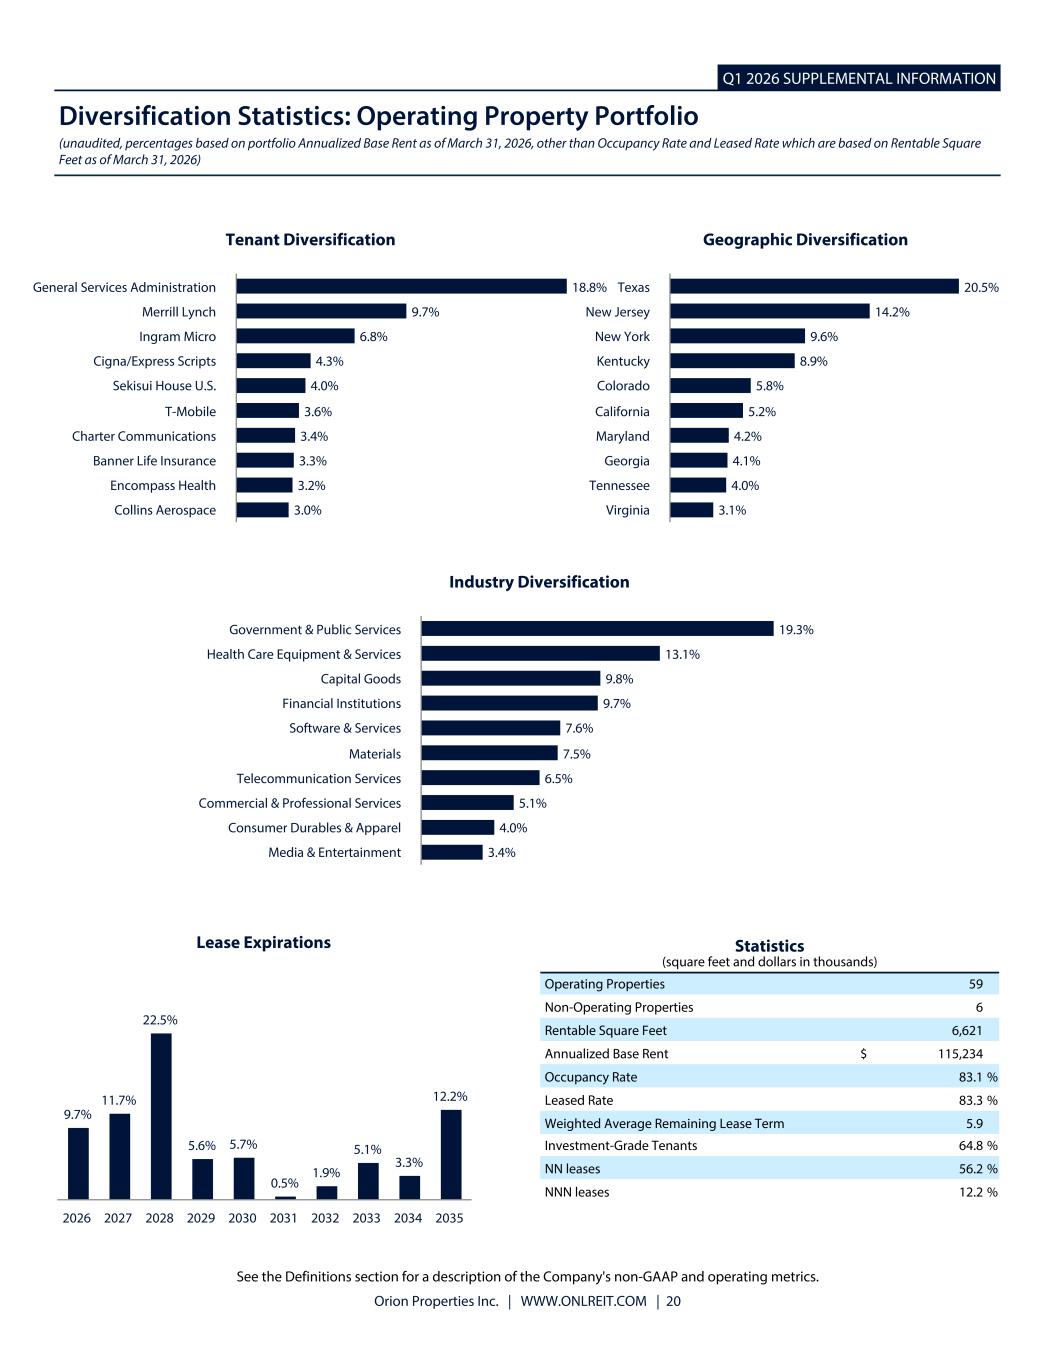
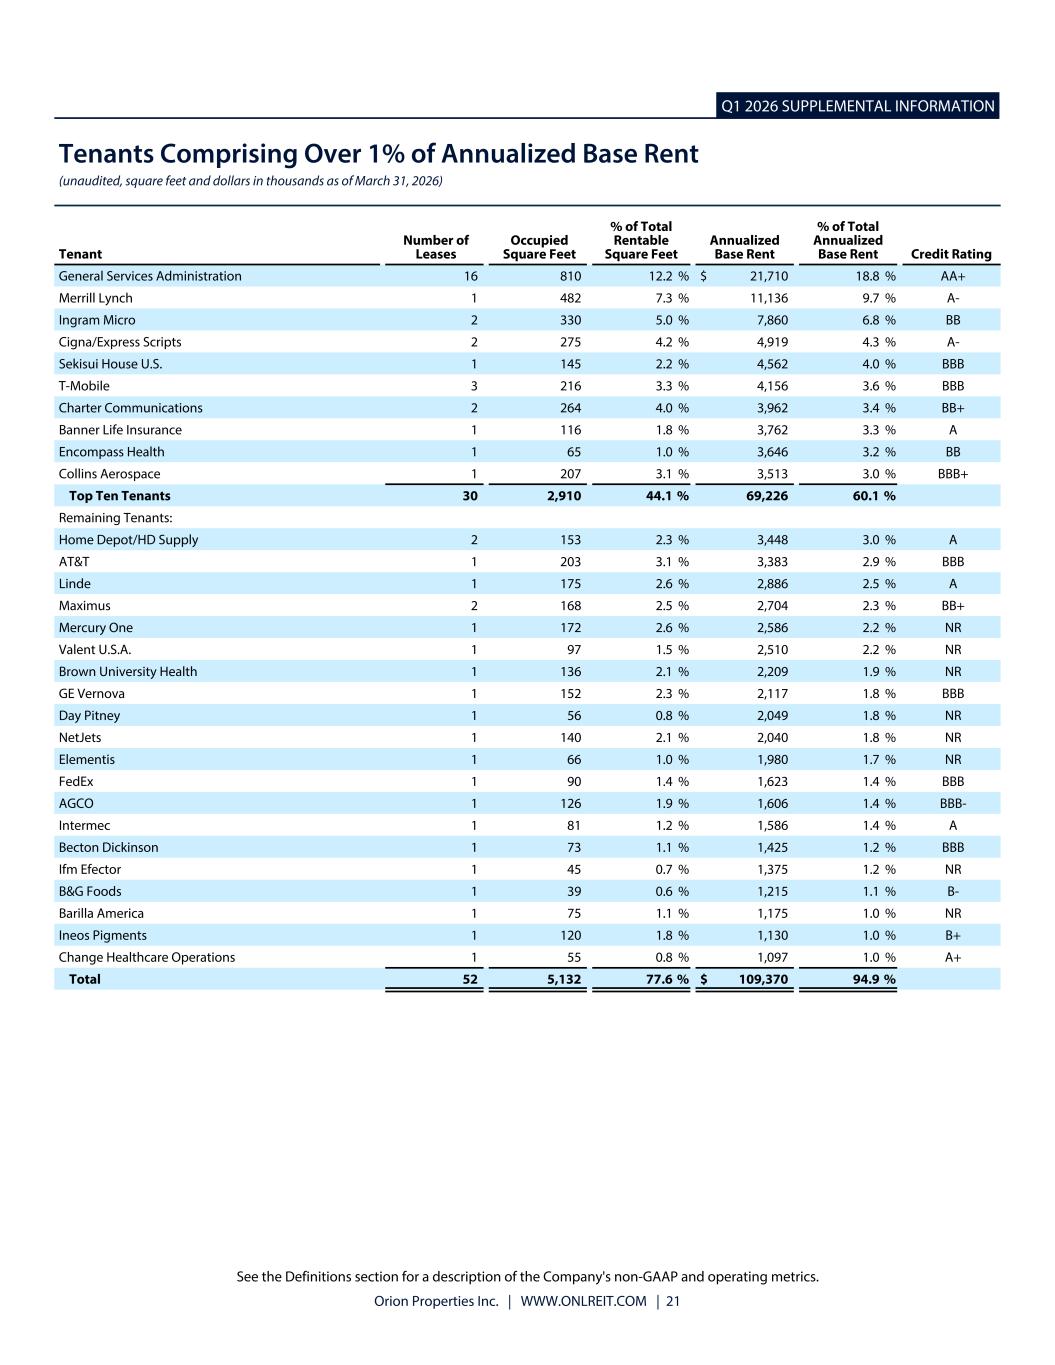
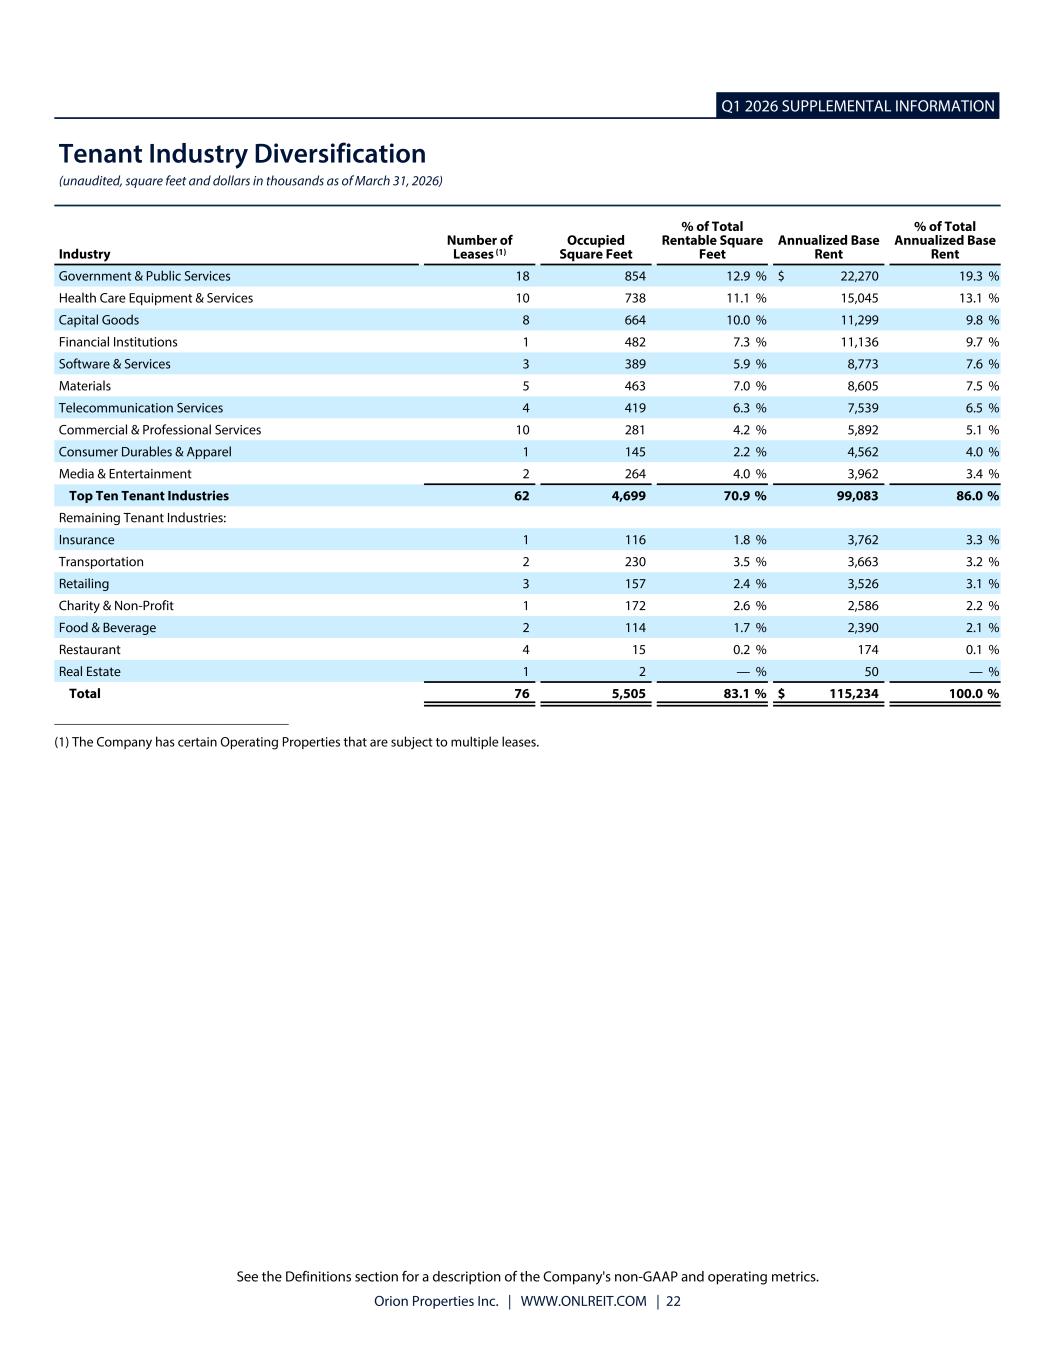
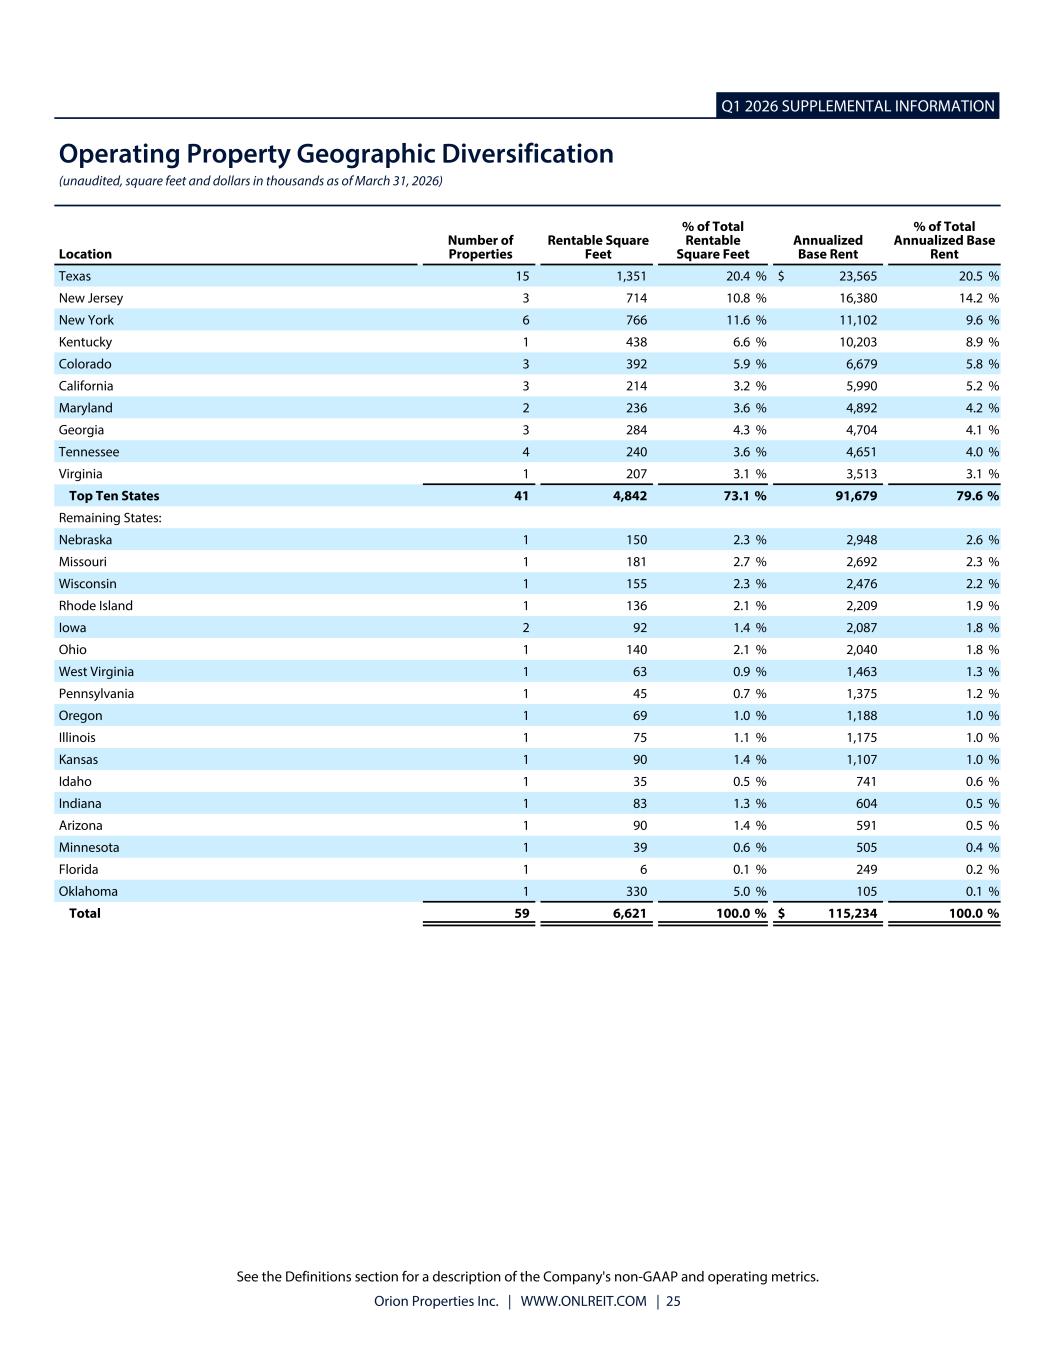
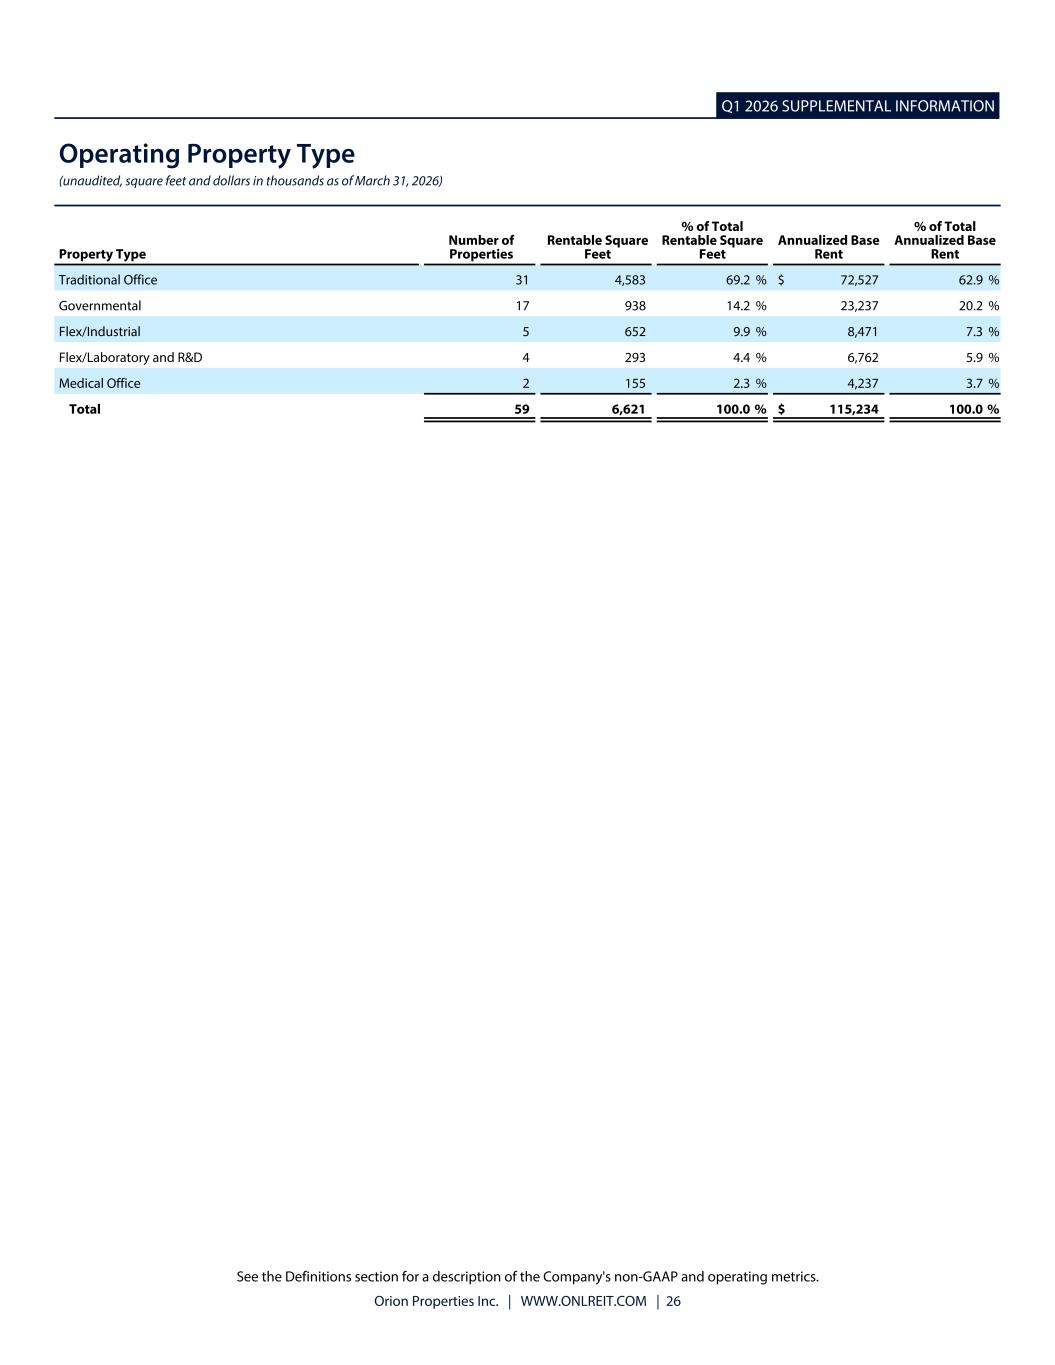
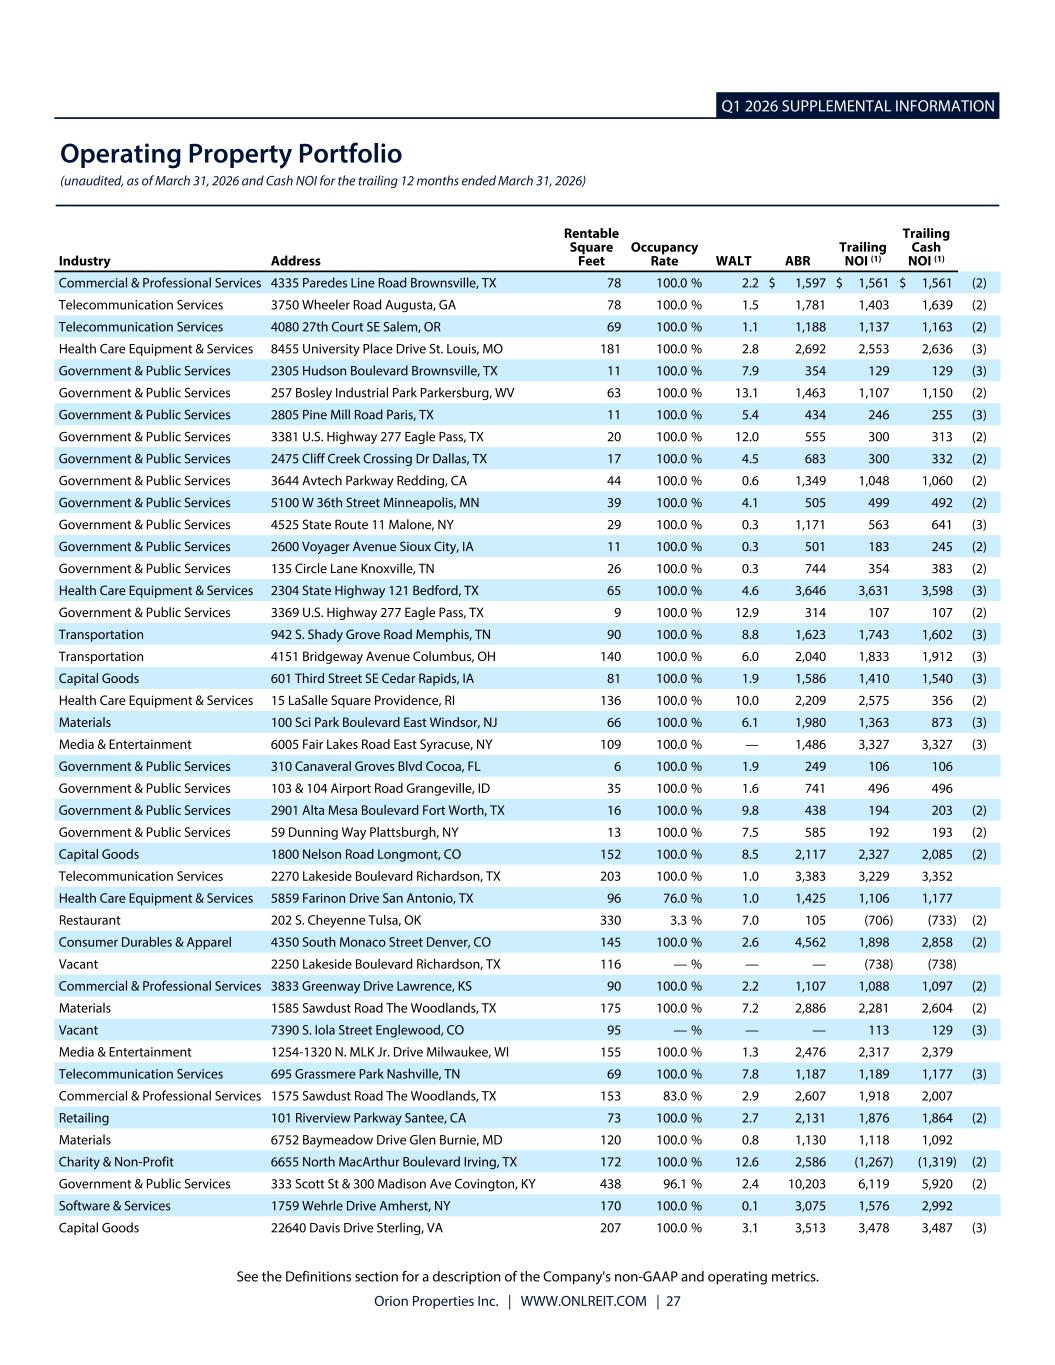
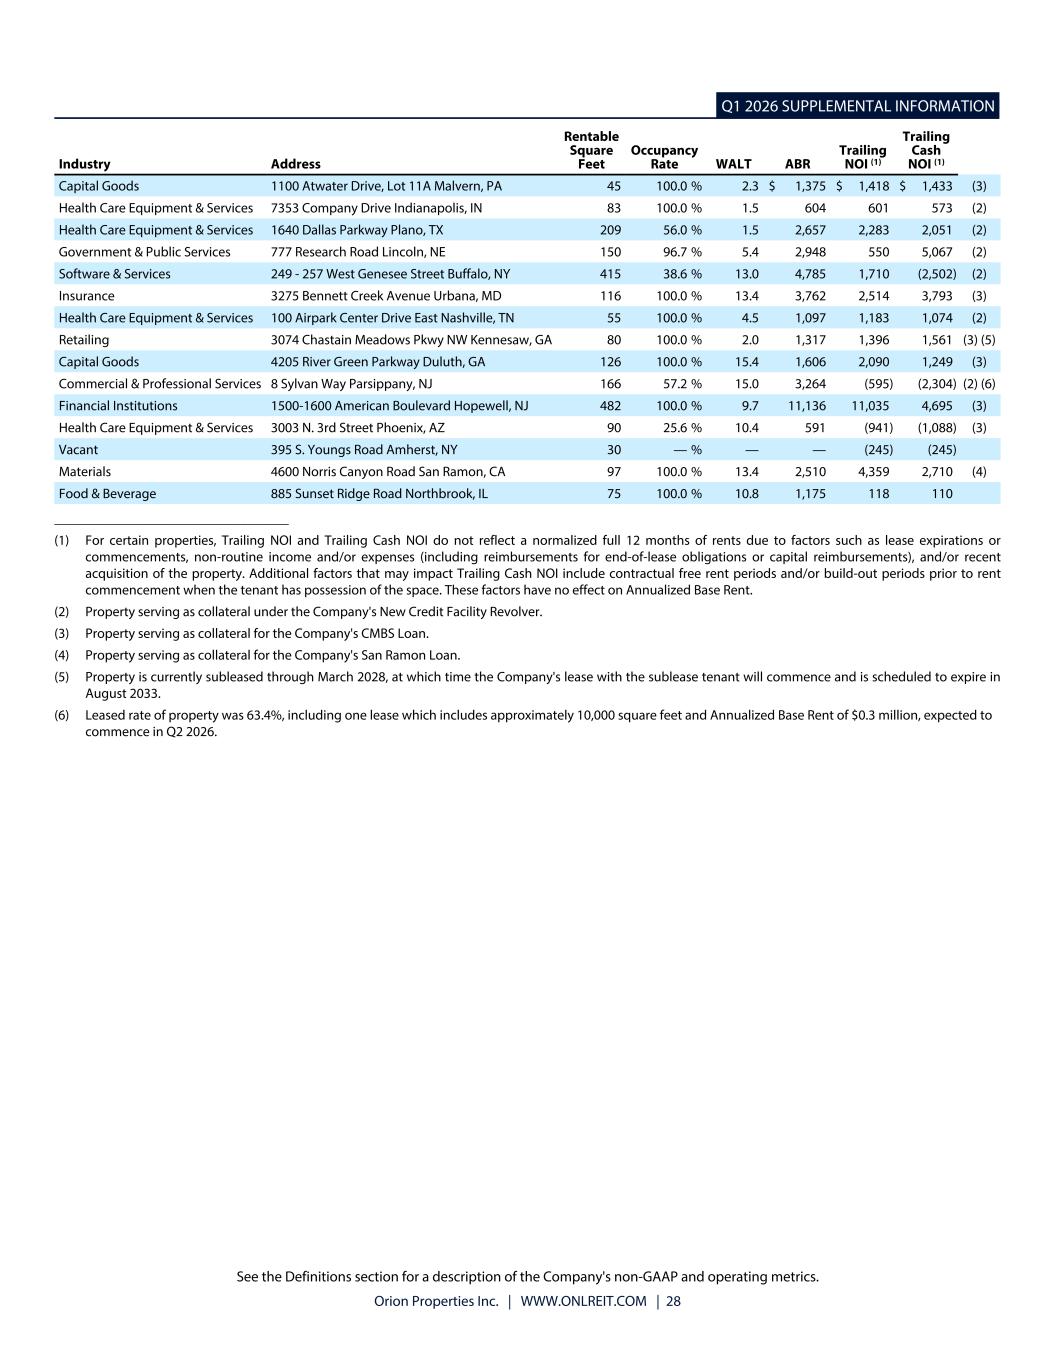
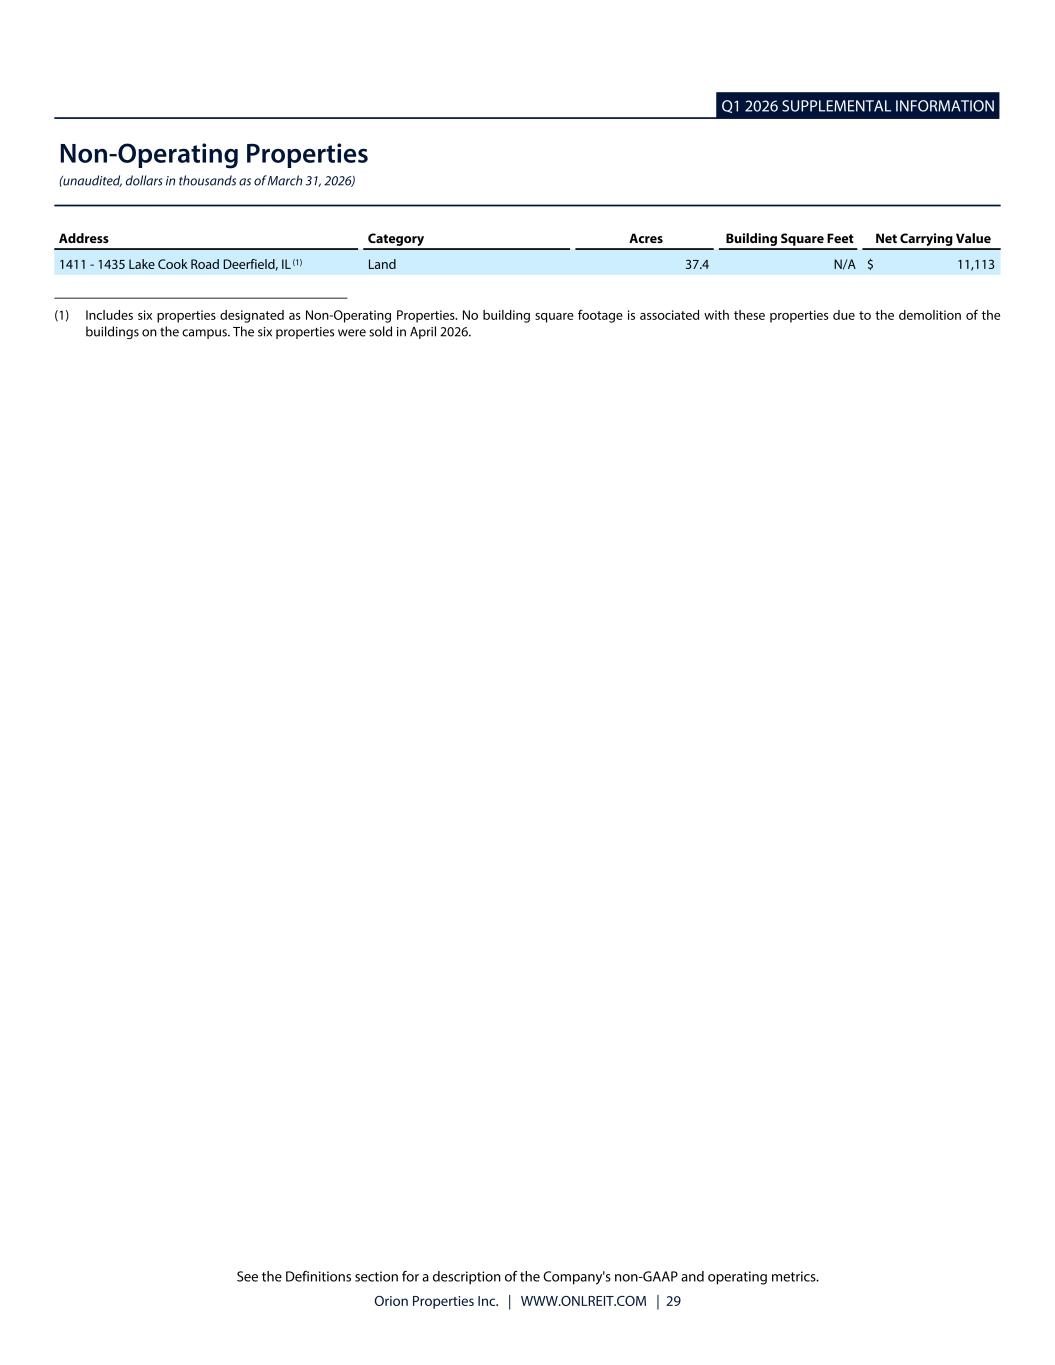
Good morning, everyone, and thank you for joining us. I would like to start the call today with a few comments about Orion's strategic options review process, which is ongoing and progressing well. The board and management continue to work closely and diligently with Orion's financial advisors at Wells Fargo and J.P. Morgan. And we remain open and fully committed to pursuing any actionable proposals that maximize shareholder value. We are conducting this process in a customary and thorough manner, and it will take time to conclude. While we have made significant progress so far, we are not yet in a position to comment on any specifics. We also can't comment on when the process will conclude, though we are working as expeditiously as possible. I also want to emphasize that the execution of our business plan continues to be positive. Our improving results reflect ongoing confidence in our standalone prospects should the strategic review determine that is the best path forward. We appreciate your patience while we work through the strategic options process, and we'll have more to say at the appropriate time. The remainder of today's call will focus on our operating performance and the meaningful progress we continue to make on our business plan. Our strategy remains centered on the stabilization of the portfolio through increased leasing activity, the timely disposition of non-core assets, managing leverage, and very selective capital recycling into new DUA assets. We expect these efforts to result in core FFO per share growth in 2026 and beyond. During the first quarter, we continued to build on the 2 million square feet we leased over the past two years by completing 355,000 square feet of leasing activity. The leasing highlight for this quarter is a 172,000 square foot full building lease of 12 years at our previously vacant Irving, Texas property. During 2024 and 2025, we strategically invested capital of about $5 per square foot to enhance the common areas and improve the overall appearance of this core property, enabling us to launch an aggressive leasing effort and secure a full building tenant. Importantly, our weighted average lease term, or WALT, averaged nearly 12 years on new leases signed during the quarter. Overall, the average wall for the consolidated portfolio continues to move in the right direction and is approaching six years. Cash rent spreads on the first quarter renewals were up for the fourth consecutive quarter at 2.5%. As we have said many times before, rent spreads can and will be volatile quarter over quarter, though we feel positive about current trends overall. all. Our leasing efforts and non-core asset dispositions have resulted in our consolidated portfolio occupancy rate rising to 83.1% at the end of the first quarter, up from 73.7% in the first quarter of last year. Like rent spreads, our occupancy will show some volatility quarter to quarter as we have leases role in our largely single-tenant portfolio, though we see occupancy continuing to improve overall in coming years. Beyond the leasing-completed year to date, our pipeline remains in excess of 1 million square feet. That is in either discussion or documentation stages. This includes several full building leases, as well as some possible longer duration renewals, and new leases with terms materially greater than the average of our portfolio. Overall, we are quite pleased with leasing velocity to start the year. A second part of our strategy towards stabilization has been through the timely and strategic sale of non-core properties. Since our spinoff, we have sold 38 properties totaling 4.1 million square feet. This includes first quarter sales of two vacant Northeast properties, one in Massachusetts and one in Pennsylvania for aggregate gross proceeds of 13.1 million, as well as the second quarter sales of the 37.4 acre Deerfield, Illinois properties for $13.1 million, and the 120,000-square-foot property in Glen Burnie, Maryland for $22.5 million. Regarding the Glen Burnie disposition, this was a very successful and accretive disposition for Orion, as the tenant's lease was terminated a few days prior to the sale, and pricing represented a 5% capitalization rate on expiring rent, or $188 per square foot. In addition, we are currently under contract to sell an additional three properties for gross proceeds of $46 million, nearly all of which will be used to reduce debt. Our overall focus on selling properties, primarily with difficult releasing prospects and high carrying costs, has proven very effective. These sale transactions continue to substantially reduce the carry costs associated with vacant properties. Our 2025 and 2026 vacant or near-term vacant property sales are estimated to save more than $12 million in annual carrying costs. Our ongoing targeted disposition efforts are expected to enable us to continue to reduce debt levels while still funding vital tenant improvement allowances, leasing commissions, and other capital expenditures in support of our strong leasing activity. Beyond continuing to reduce leverage, we also continue to search for and actively evaluate opportunities to recycle a modest percentage of asset sale proceeds into accretive cash-flowing acquisitions. We employed this targeted approach with the $15 million acquisition of the Barilla America headquarters, an R&D facility in Northbrook, Illinois, during the first quarter. It remains our intention to continue shifting our portfolio concentration towards dedicated use assets where our tenants perform work that cannot be replicated from home or relocated to a generic office setting and away from traditional suburban office properties. These property types include medical, lab, R&D, flex, and government properties, all of which we already own. Our experience is that these assets tend to exhibit stronger renewal trends, higher tenant investments, and more durable cash flows. At quarter end, approximately 37.1% of our consolidated portfolio by annualized base rent consisted of dedicated use assets versus 32.2% at the end of the first quarter 2025. And we expect this percentage will continue to increase over time through disposition activity of traditional office and targeted acquisitions of DUA properties. We continue to evolve the portfolio toward stabilization and have positioned the company for meaningful per-share core FFO growth in the coming years. For the balance of 2026, our benchmarks will be to remain focused on improving portfolio quality, lengthen wall, renew tenants, and fill or sell vacant space, all while prudently managing expenses and leverage as we work to maximize Orion's value for investors and potential strategic partners. With that, I'll turn the call over to Gavin.
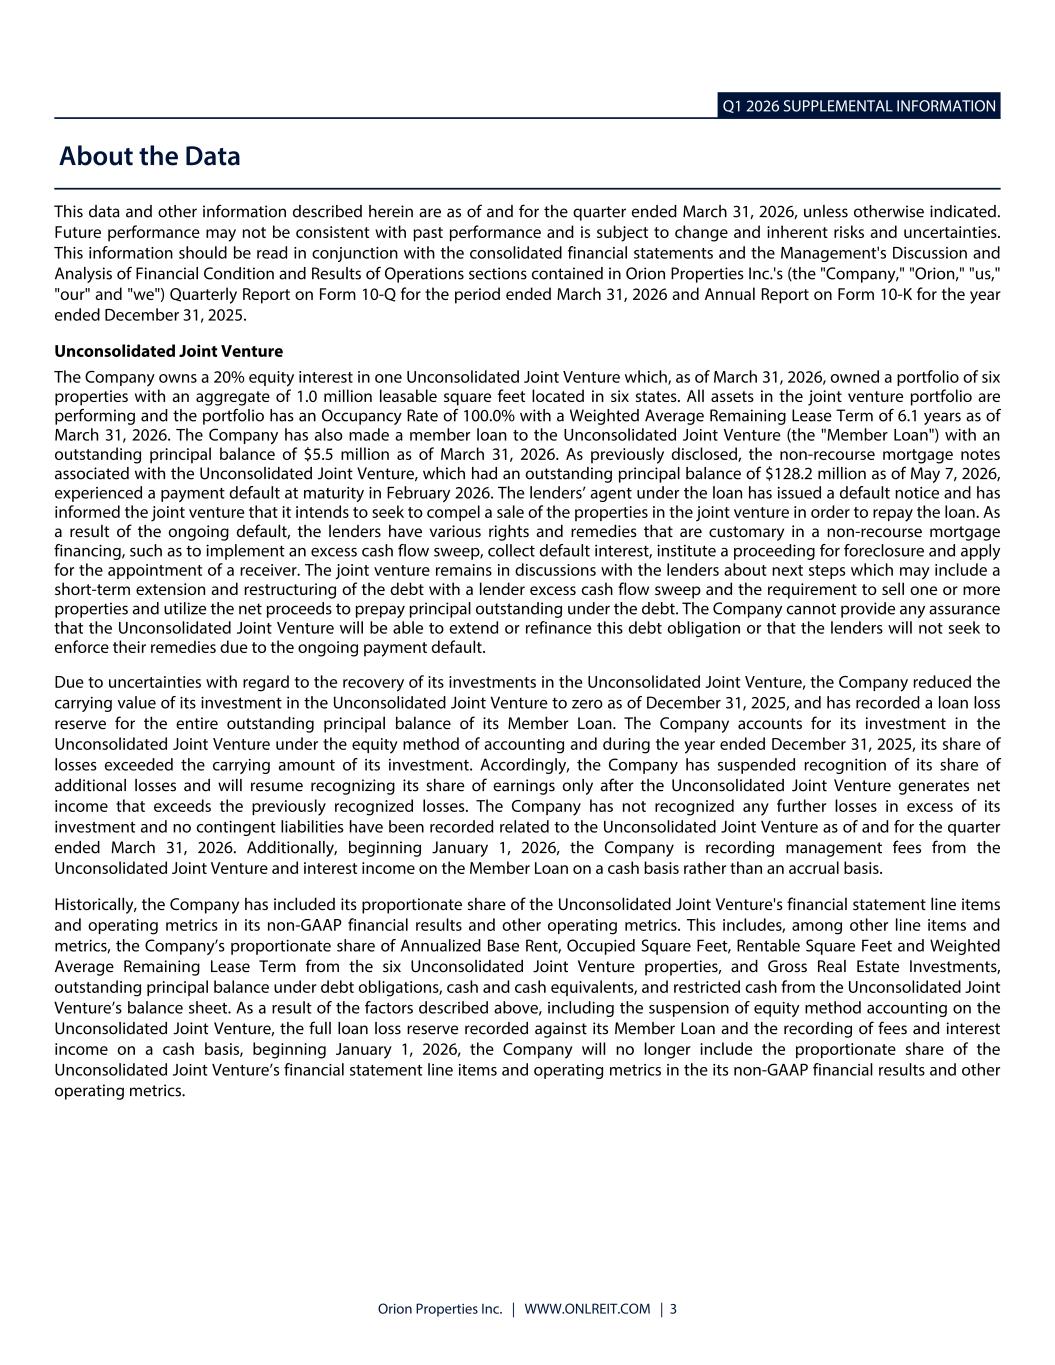
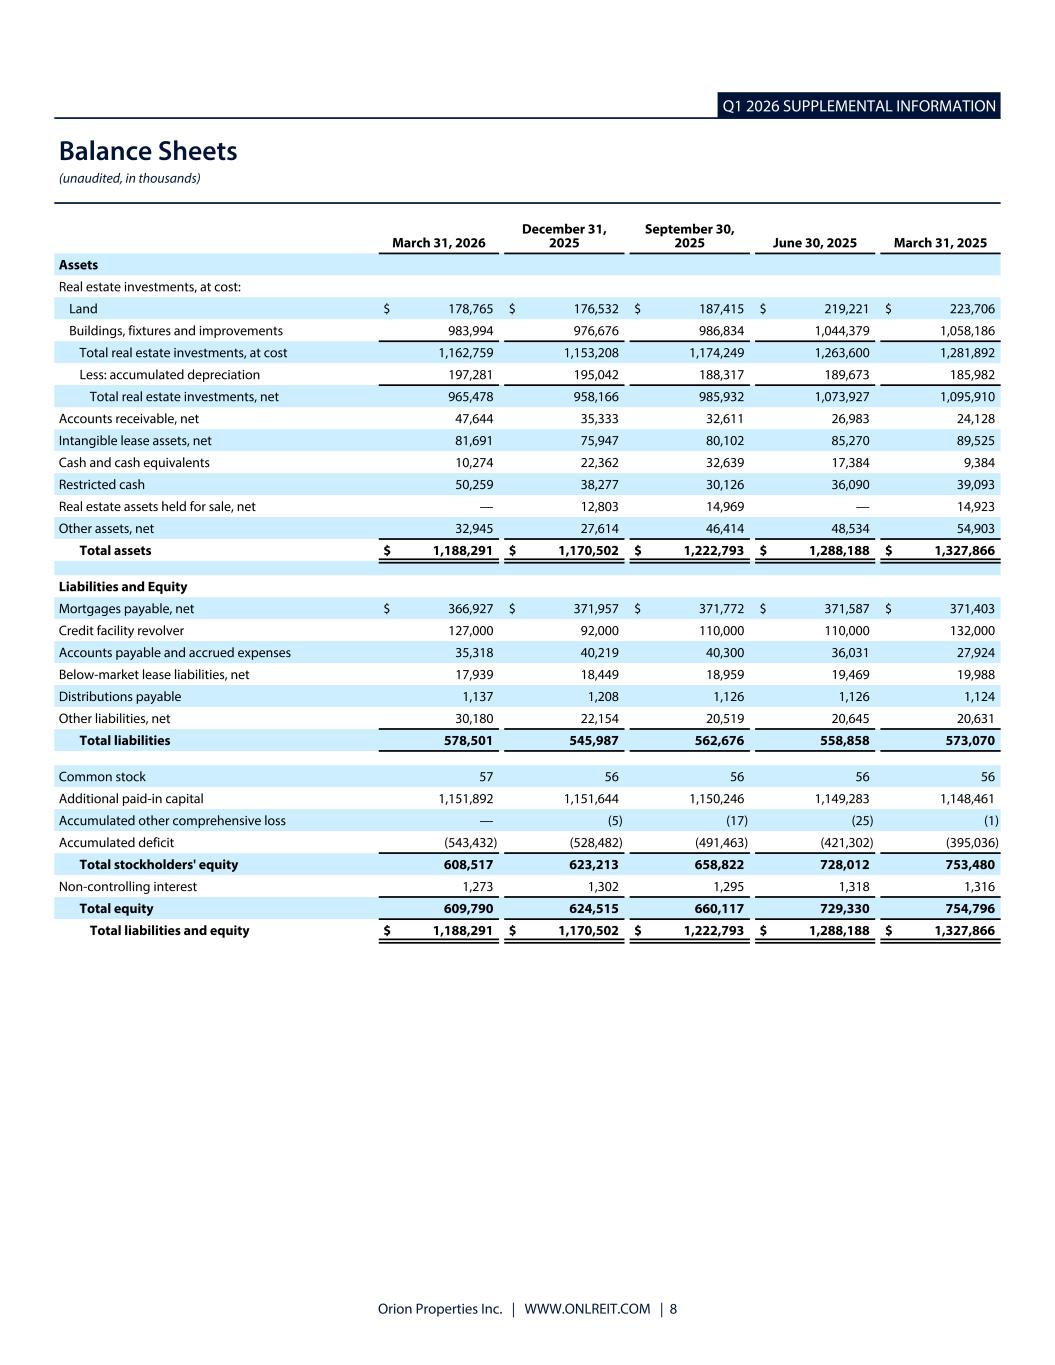
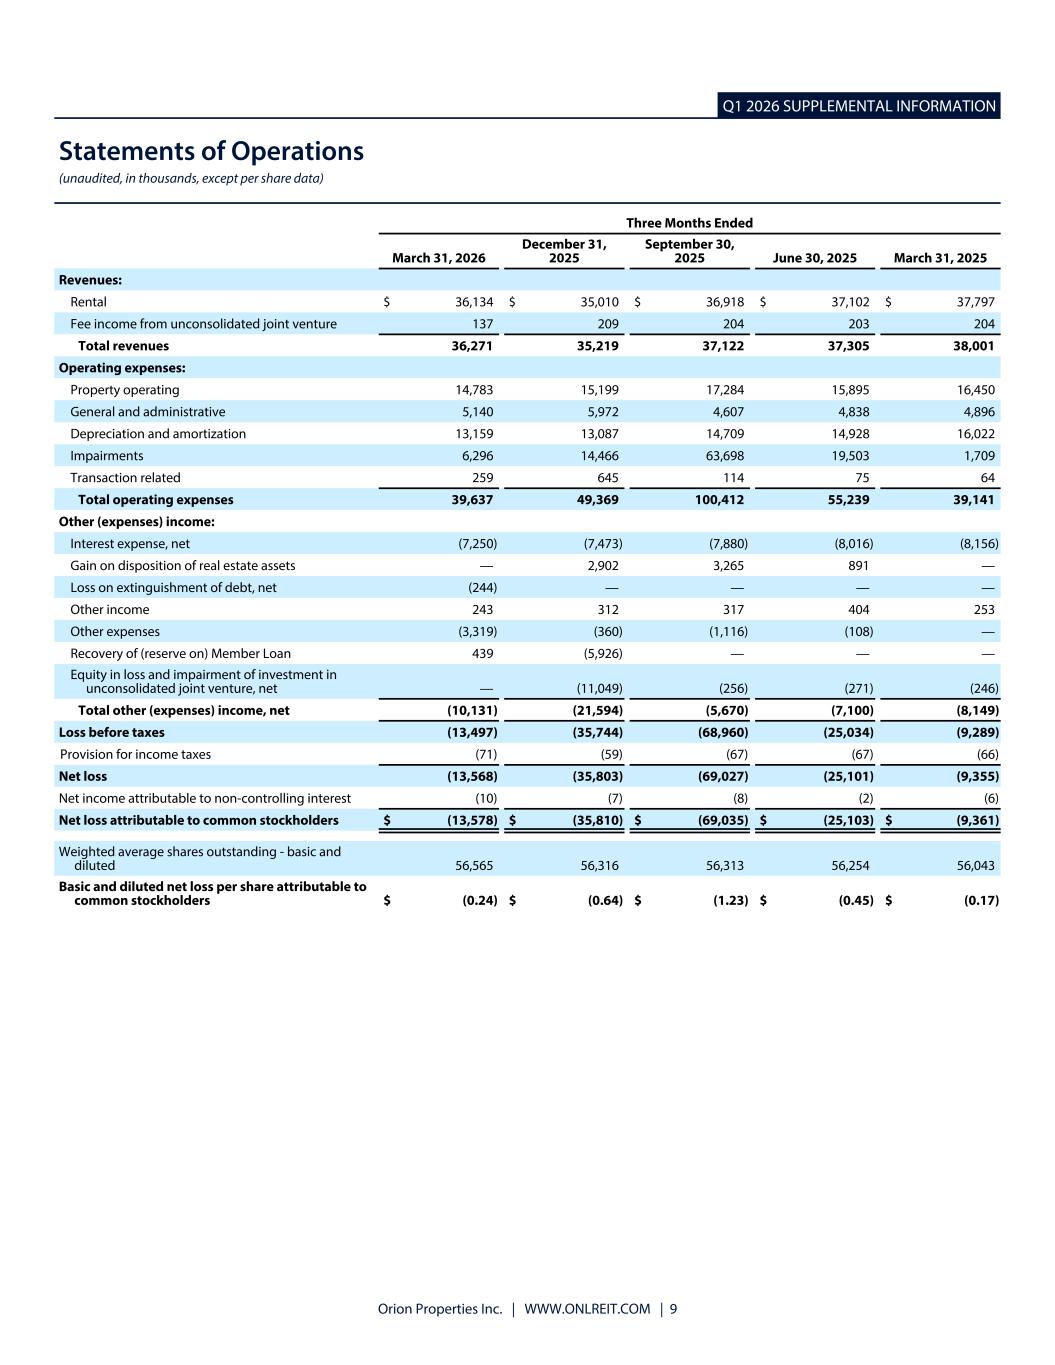
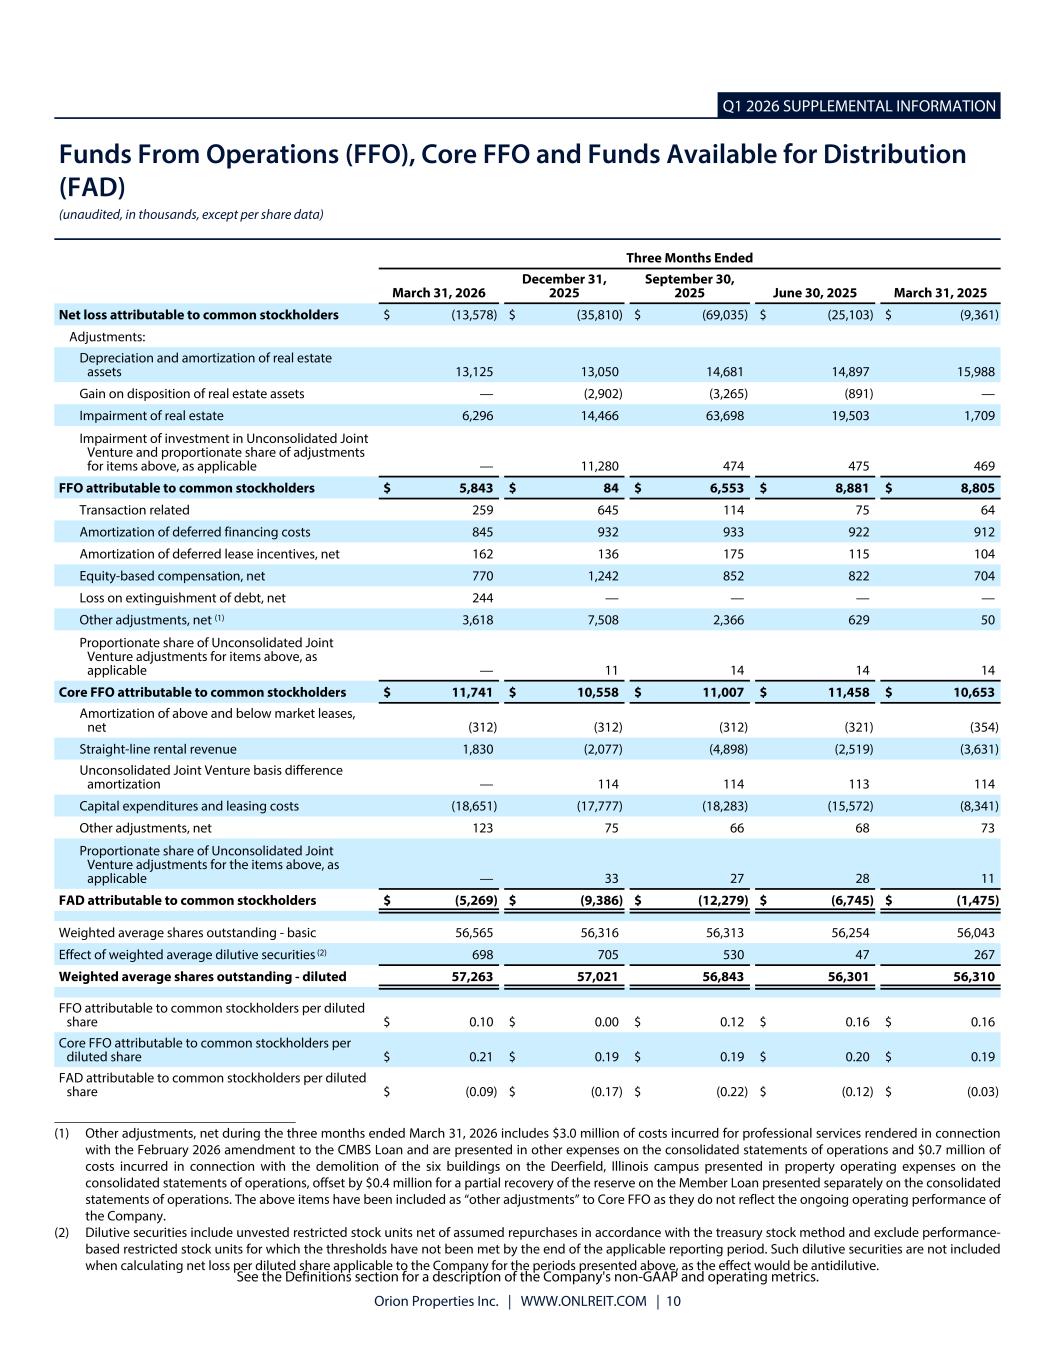
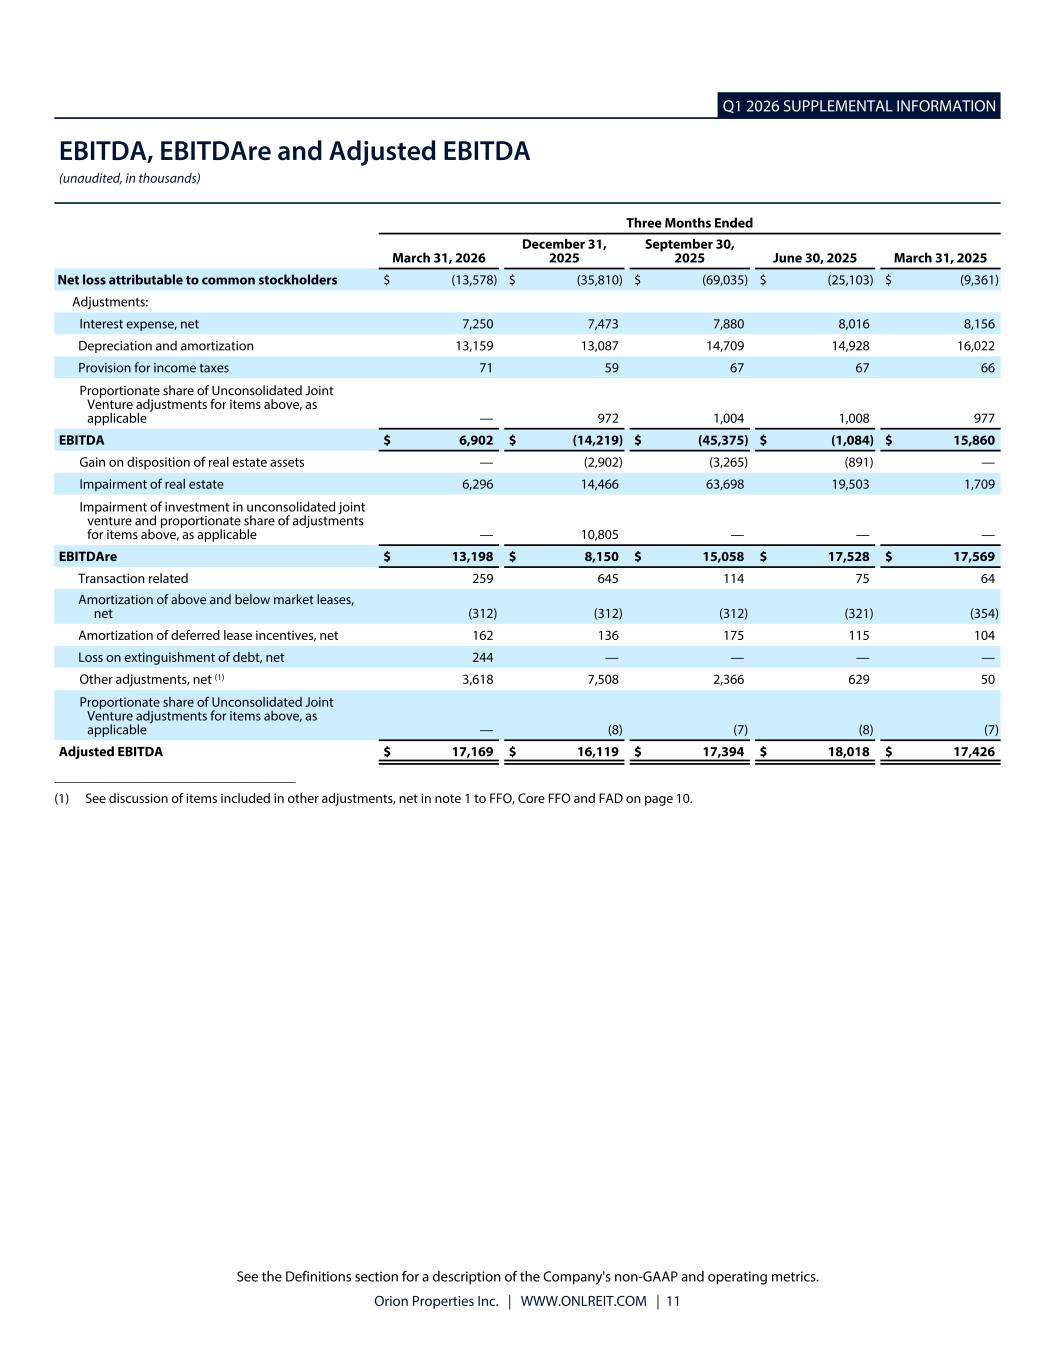
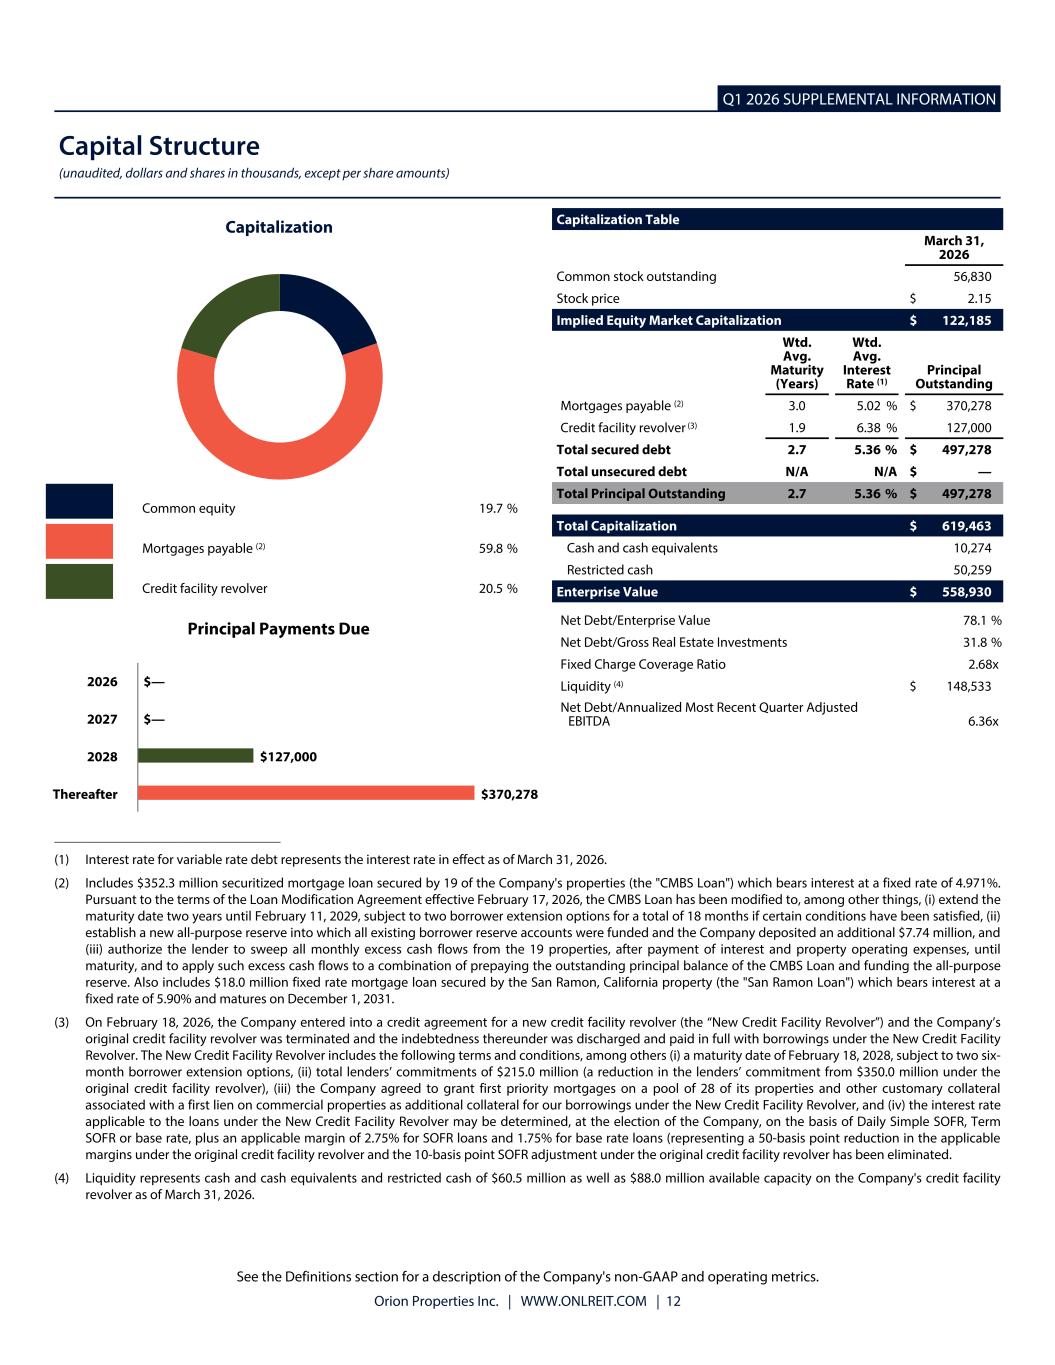
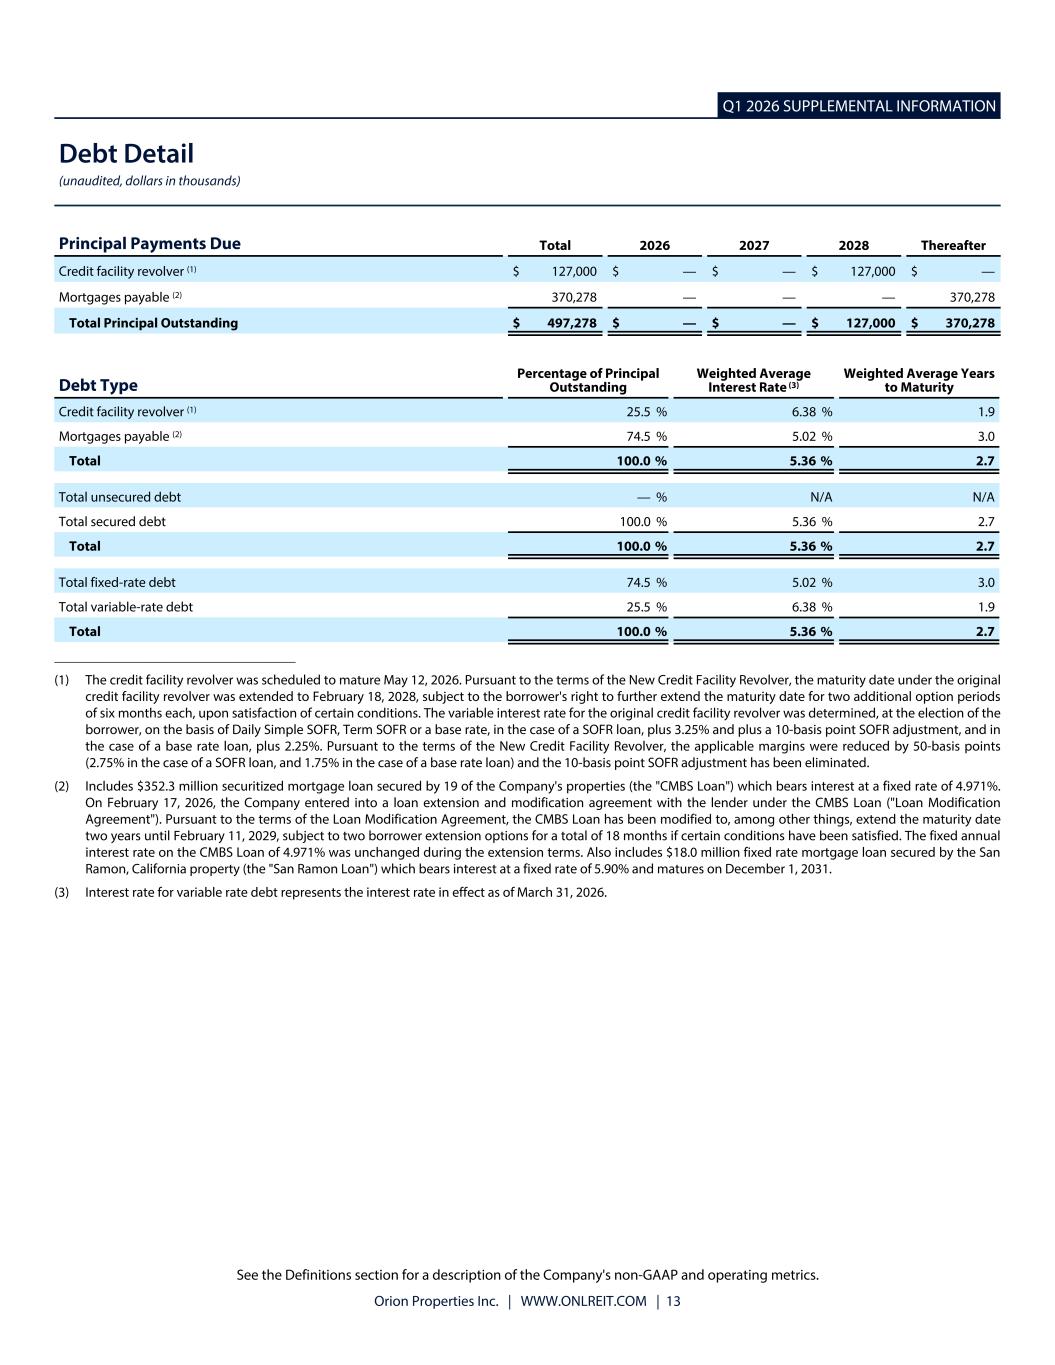
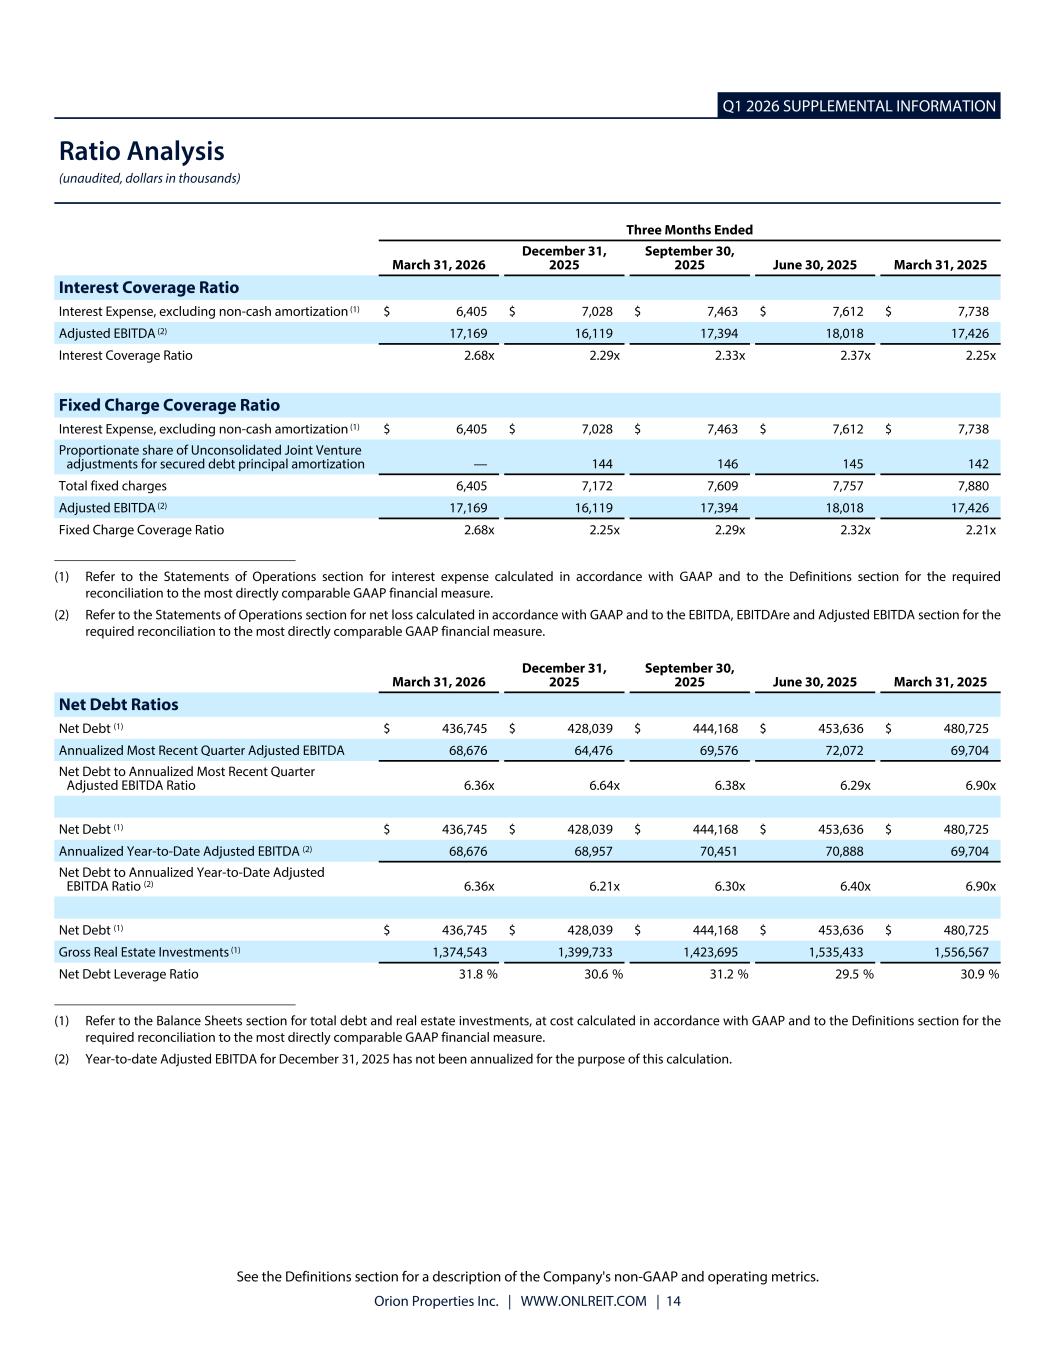
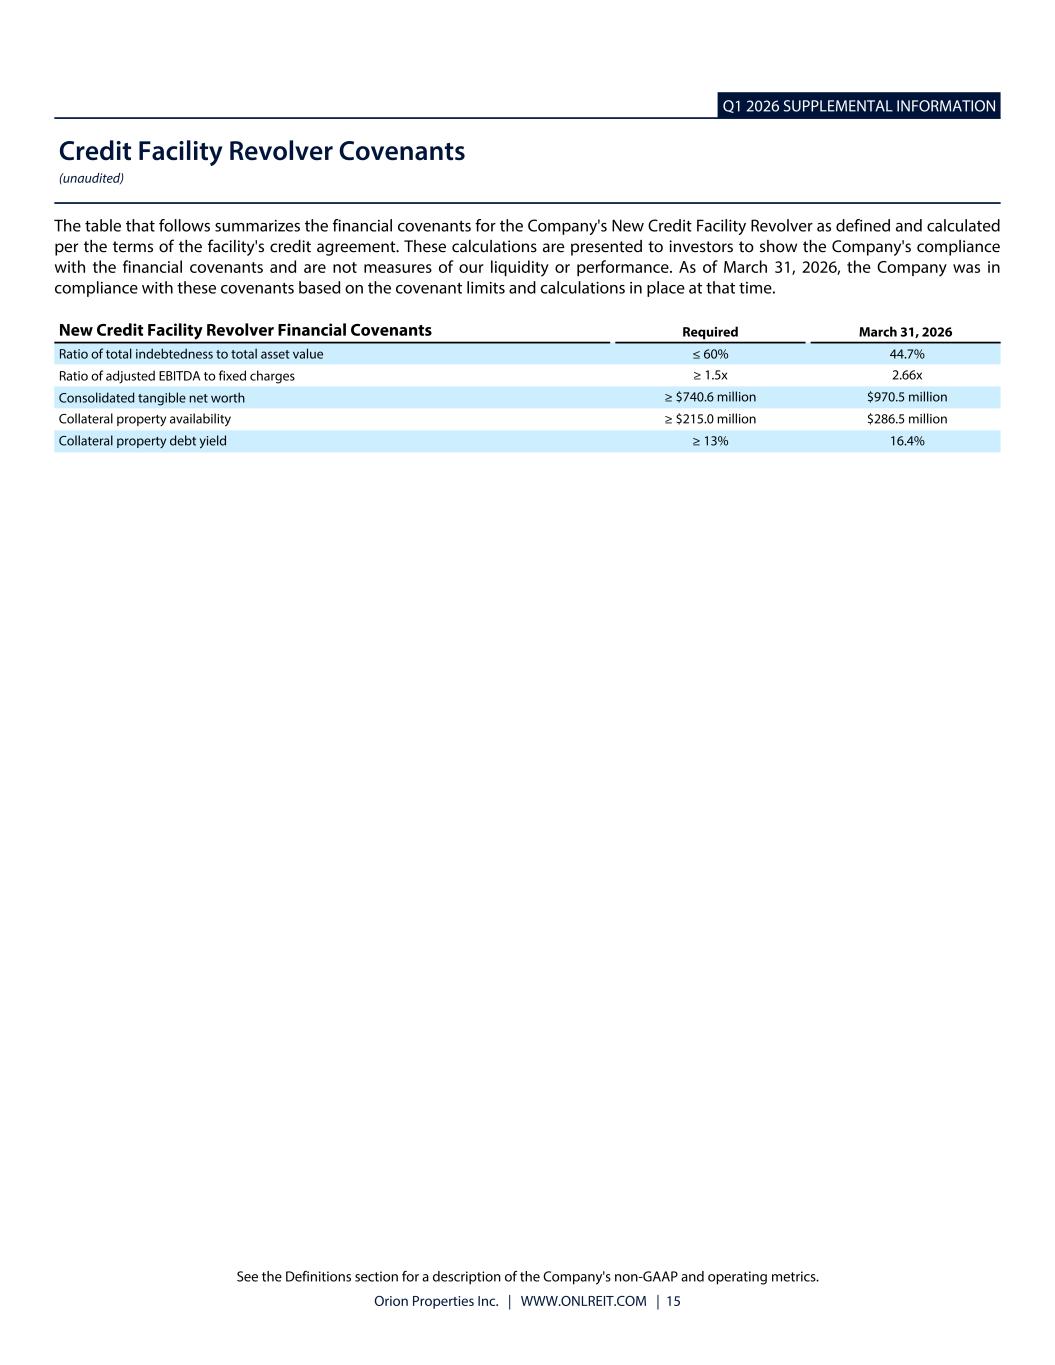
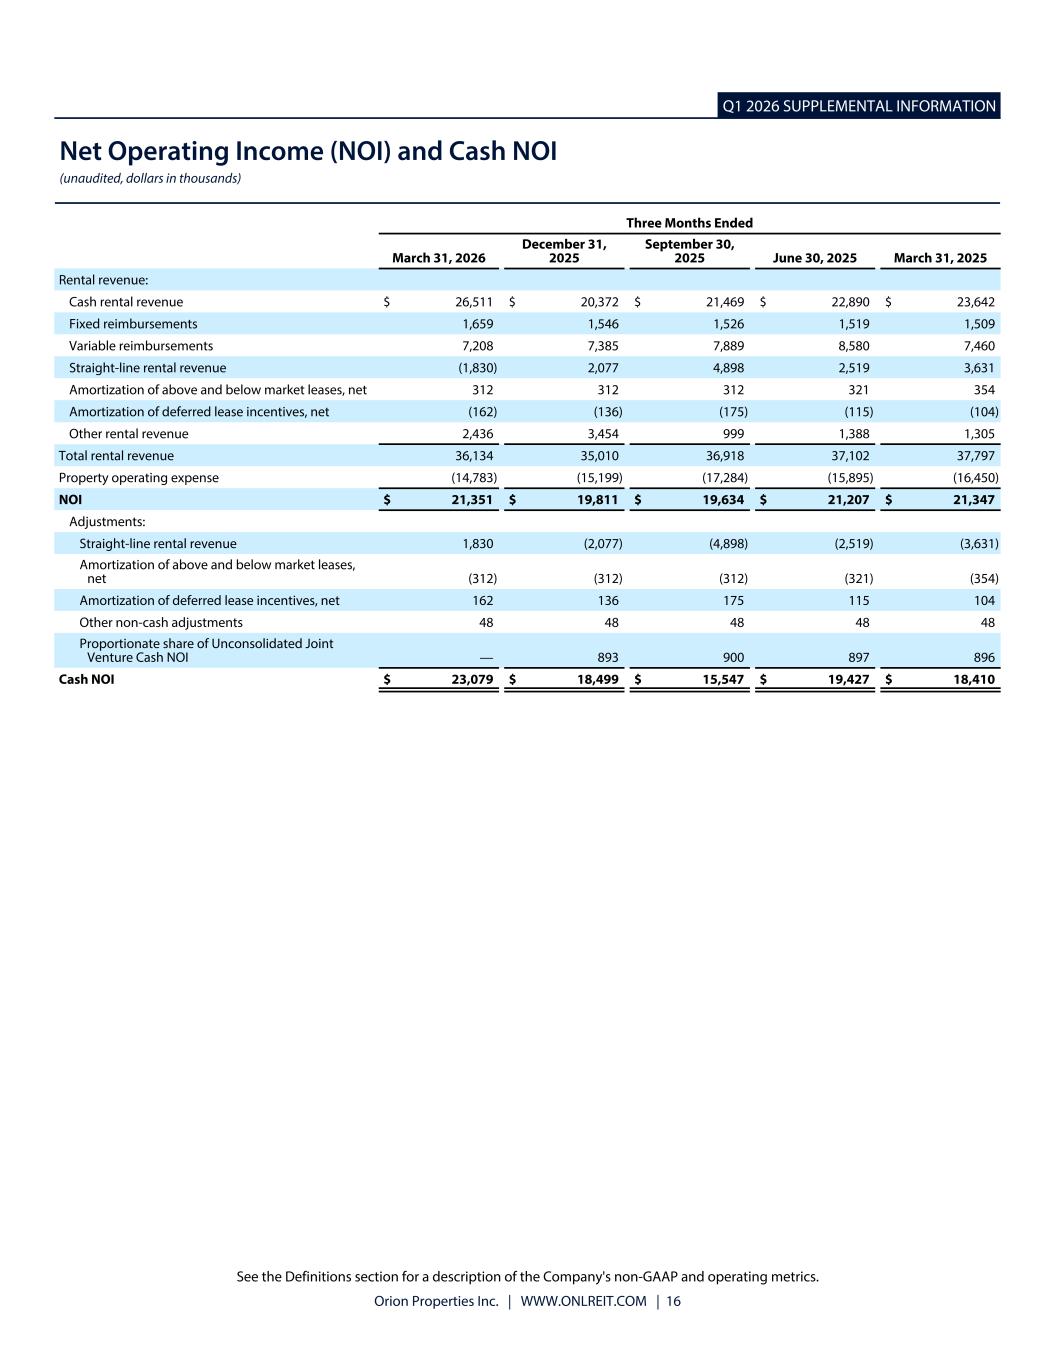
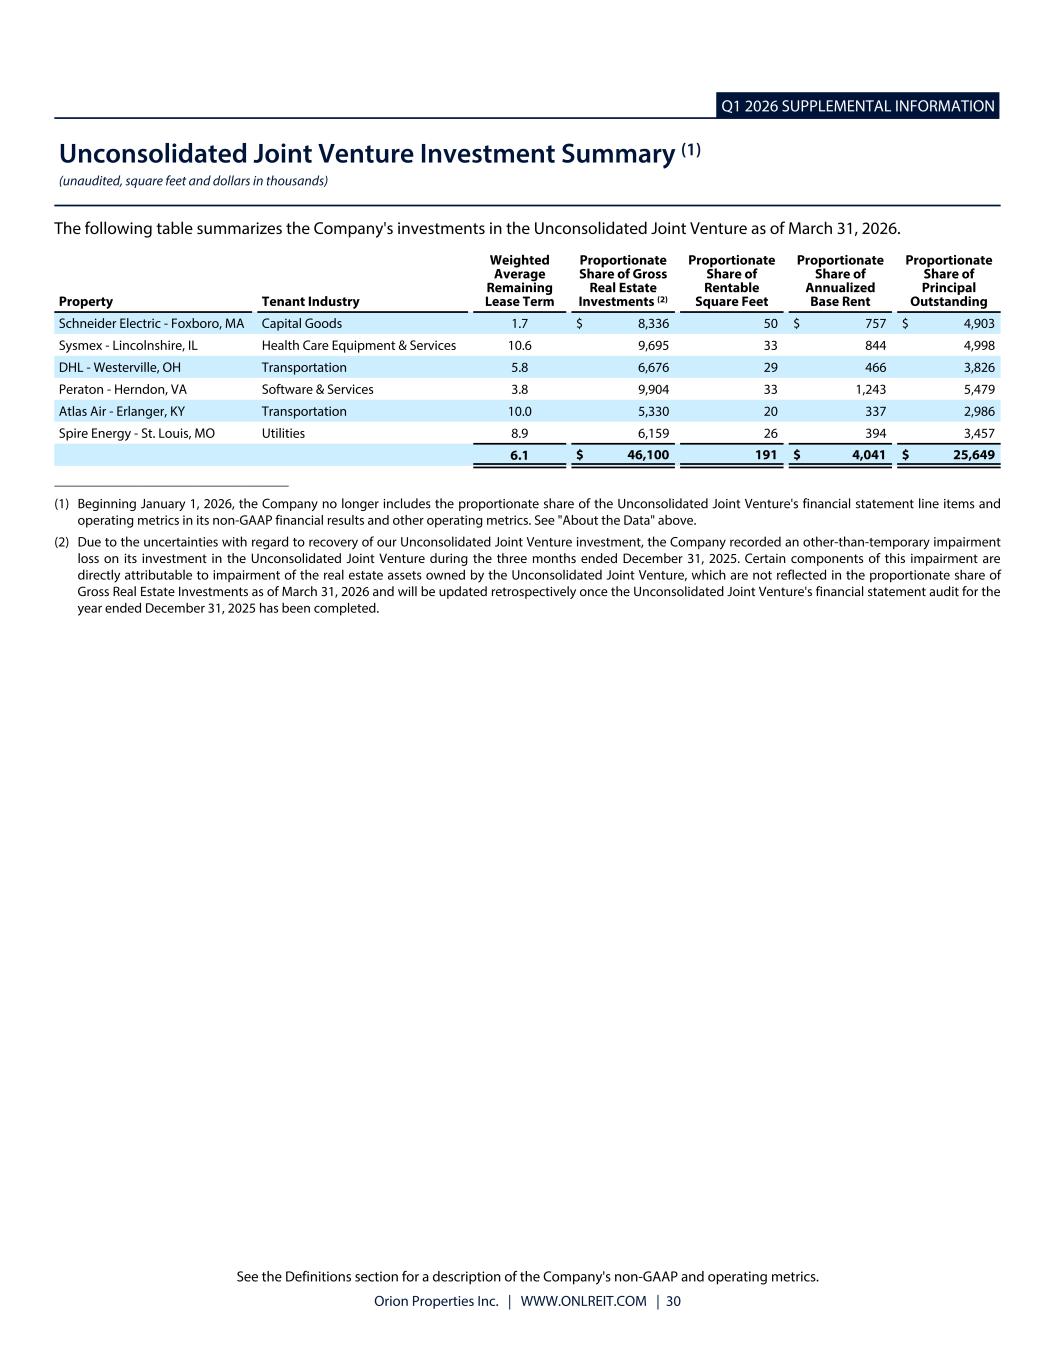
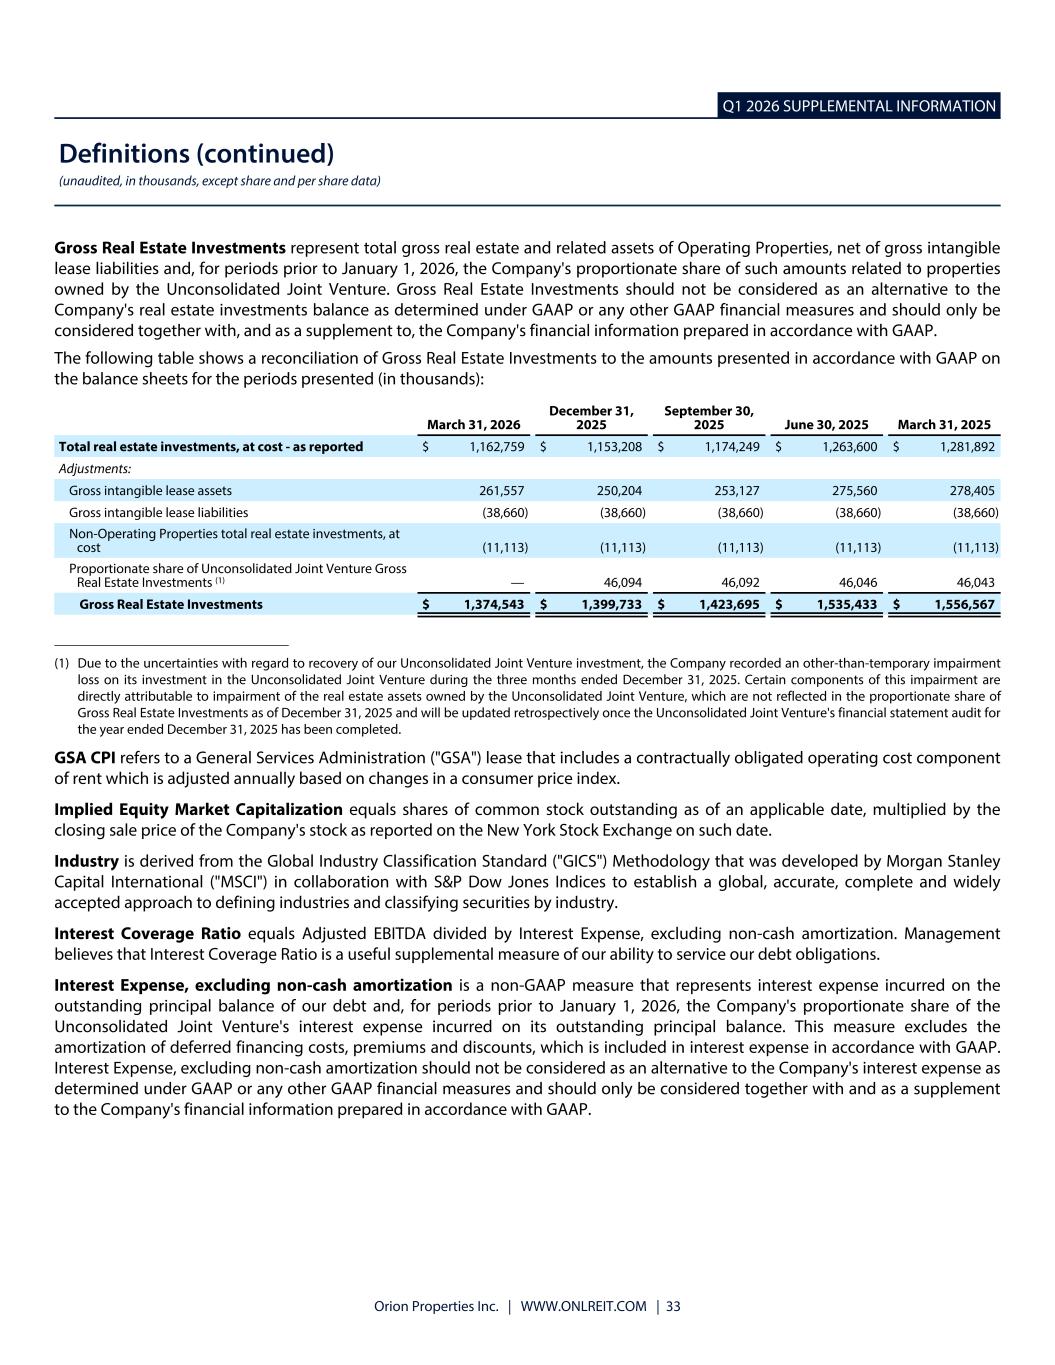
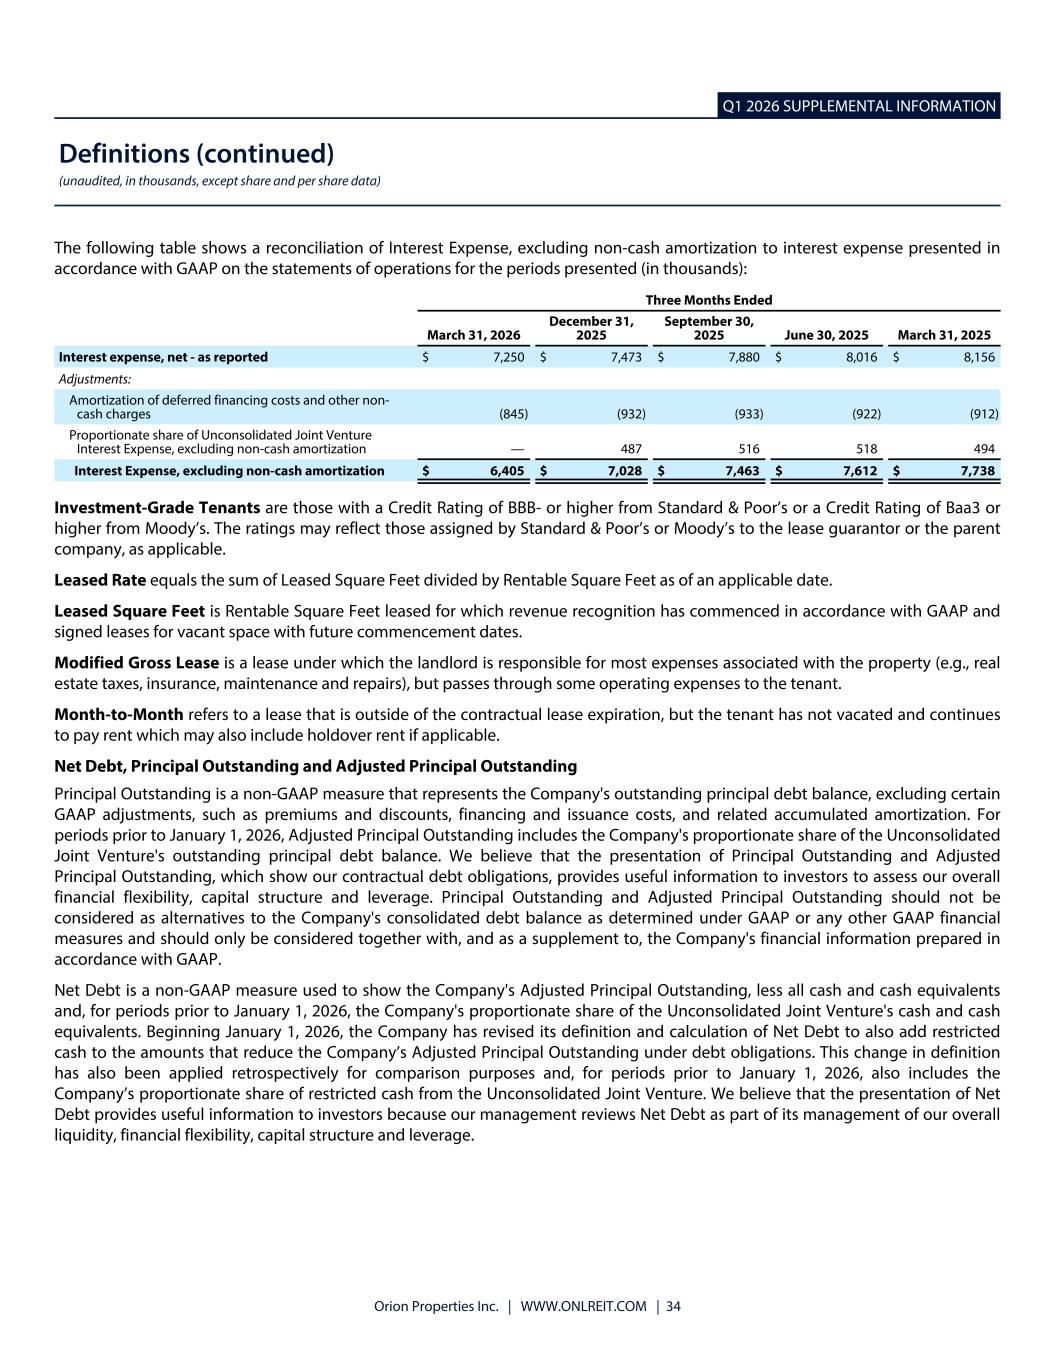
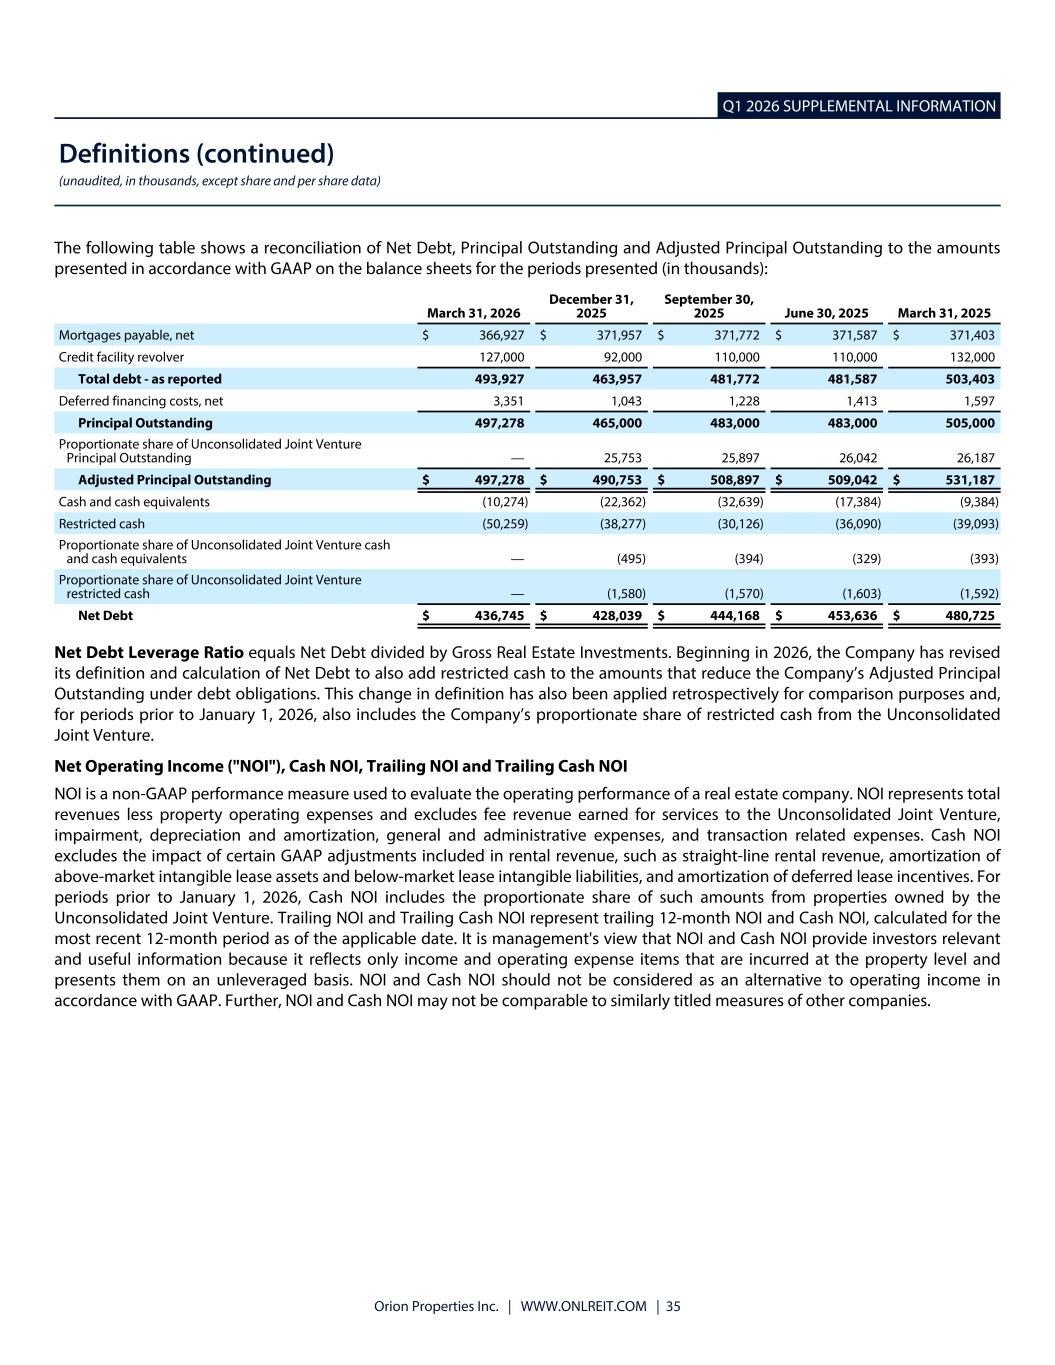
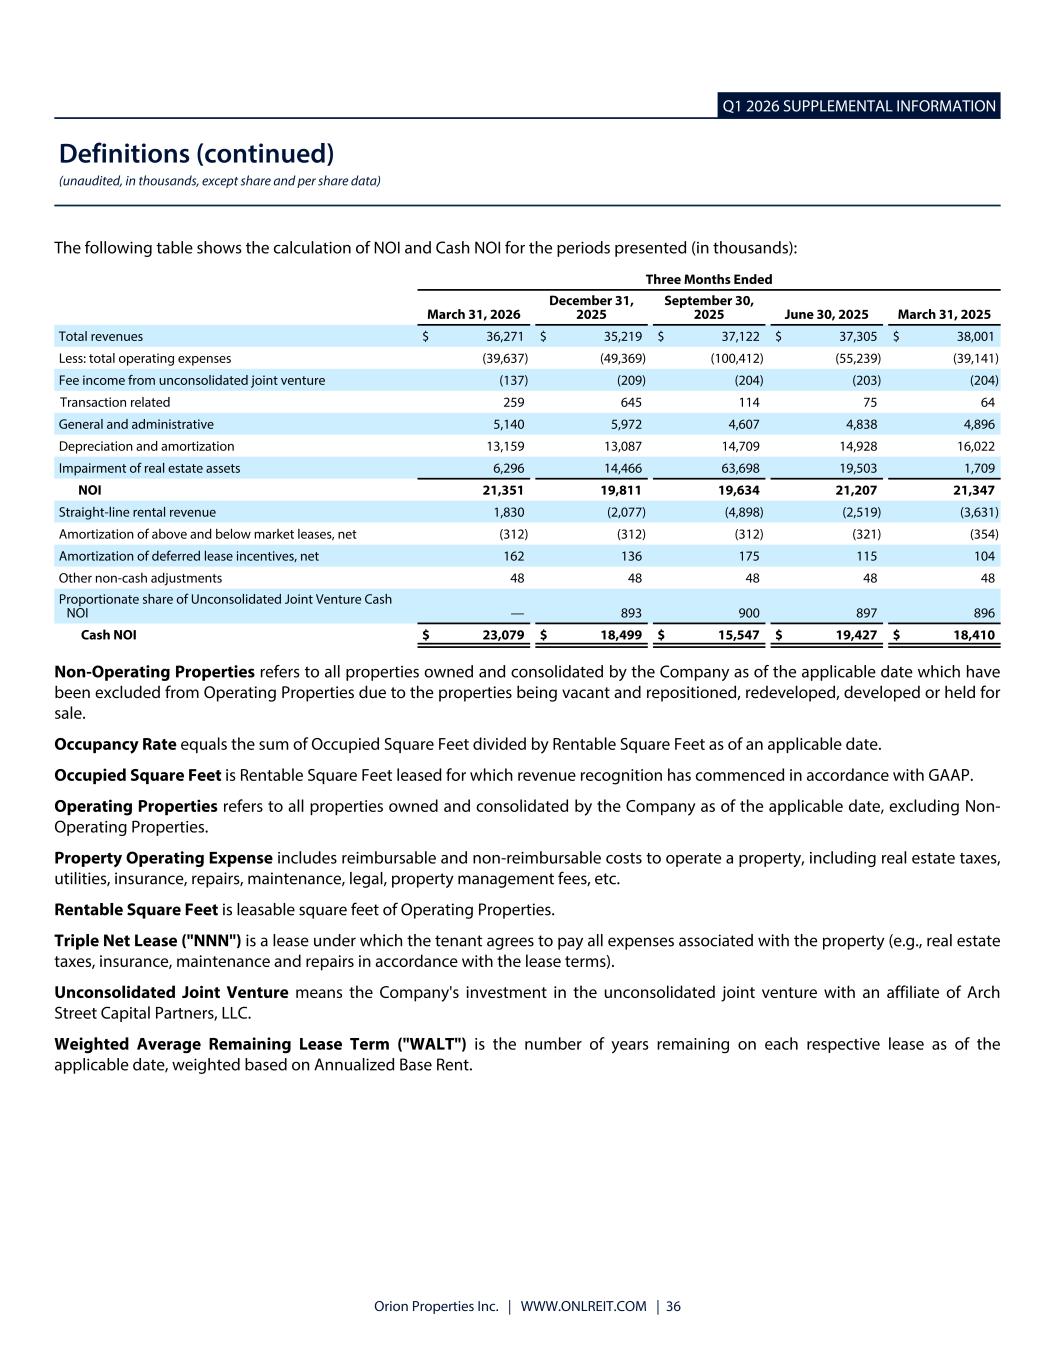
Thanks, Paul. For the first quarter of 2026, compared to the first quarter of 2025, Orion had total revenues of $36.3 million compared to $38 million. Net loss of $0.24 per share compared to $0.17 per share. Core FFO of $0.21 per share compared to $0.19 per share. The $0.21 per share of this quarter's core FFO includes a one-time expected lease termination payment of $1.9 million associated with our East Syracuse, New York property. Adjusted EBITDA was $17.2 million compared to $17.4 million. GNA came in as expected at $5.1 million compared to $4.9 million, with the increase primarily driven by approximately $100,000 illegal expenses related to the ongoing strategic option review process and activist-shareholder relations costs. CapEx and leasing costs were $18.7 million compared to $8.3 million. The increase in CapEx in the first quarter of 2026 was primarily due to the completion of landlord and tenant improvement work relating to the acceleration in our leasing activity as we have previously discussed capex timing is dependent on when leases are signed and work is completed on properties we expect to allocate more capital to capex over time as leases roll and new and existing tenants draw upon their tenant improvement allowances our net debt to annualize the most recent quarter adjusted EBITDA was a relatively conservative 6.36 times a quarter end. As of March 31st, we had total liquidity of $148.5 million, including $60.5 million of cash and cash equivalents and restricted cash, and $88 million of available revolver capacity. Orion continues to manage leverage while maintaining significant liquidity to support our ongoing leasing efforts and provide the financial flexibility needed to execute on our business plan for the next several years. Since our spin, and including a recent repayment, we have repaid a net $166 million of outstanding debt. As previously announced, during the first quarter, we entered into a new senior secured credit facility revolver, which refinances our original credit facility revolver and extends the maturity date until February, 2029, inclusive of two six-month borrower extension options. The updated terms of the agreement have also right-sized our borrowing capacity and lowered the interest rate on our borrowings. As of March 31st, we had $127 million outstanding and $88 million of borrowing capacity under our new credit facility revolver. Subsequent to the quarter, we repaid $25 million and now have $113 million of available borrowing capacity. As communicated previously, we also successfully amended our CMBS loan in the first quarter. The Loan Modification Agreement extends the maturity to August 2030, inclusive of two borrower extension options for a total of 18 months. During all extension periods, the fixed interest rate on the CMBS loan remains at 4.971%, and excess cash flows will be used by the lender to prepay the outstanding principal balance of the loan and to fund an all-purpose reserve, which we can access to pay leasing costs and capital expenditures. As of March 31st, we had $352.3 million outstanding under the CMBS loan and $46.1 million in reserves. Turning to our unconsolidated joint venture, while we have written our investment in the JV down to zero and recorded a loan loss reserve for the full amount of our member loan due to the uncertainty around the mortgage debt financing, We continue to believe that the portfolio which is performing with an occupancy rate of 100% and a weighted average lease term of 6.1 years has positive equity, net of the mortgage debt, and our outstanding member loan. We intend to continue to work with our partner and lenders to maximize the value of the portfolio and recover both our member loan and as much equity as possible. As part of these efforts, we are working on a disposition plan with our partner and the lenders and continue to explore refinancing options. The Joy Venture has entered into an agreement to sell one of the properties in the portfolio, and if it closes, we intend to use the net proceeds from the sell to reduce the principal balance of the mortgage debt. As for the dividend, on May 5th, Orion's Board of Directors declared a quarterly cash dividend of $0.02 per share for the second quarter of 2026. Turning to our 2026 outlook, as our recent leasing and capital initiatives begin to translate into improved recurring earnings power for 2026 and beyond, we believe the positive trajectory will continue to take hold as we move ahead. Accordingly, we are affirming our previously announced guidance. Core FFO for the year is expected to range from $0.69 to $0.76 per diluted share. G&A is expected to range from $19.8 to $20.8 million. Excluding non-cash compensation, we expect 2026 G&A will be in line or slightly better than 2025. We also do not expect G&A to rise significantly in future periods, including non-cash compensation. As a percentage of revenue and total assets, our G&A remains in line with other similarly sized public REITs. Net debt to adjusted EBITDA is expected to range from 6.5 times to 7.3 times. With that, we will open the line for questions. Operator?
Operator
Thank you. If you'd like to ask a question, please press star 1 on your telephone keypad. A confirmation tone will indicate your line is in the question queue. You may press star 2 if you'd like to remove your question from the queue. For participants using speaker equipment, it may be necessary to pick up your handset before pressing the star keys. Our first question comes from the line of Matthew Erdner with Jones Trading. Please proceed with your question.
Hey, good morning, guys. Thanks for taking the question. So you touched on the pipeline, kind of about a million square feet, you know, that you guys are talking to right now. You know, how much of that is the leases that are going to expire this year versus next year? You know, just what should we expect in terms of momentum as we, you know, progress throughout the year?
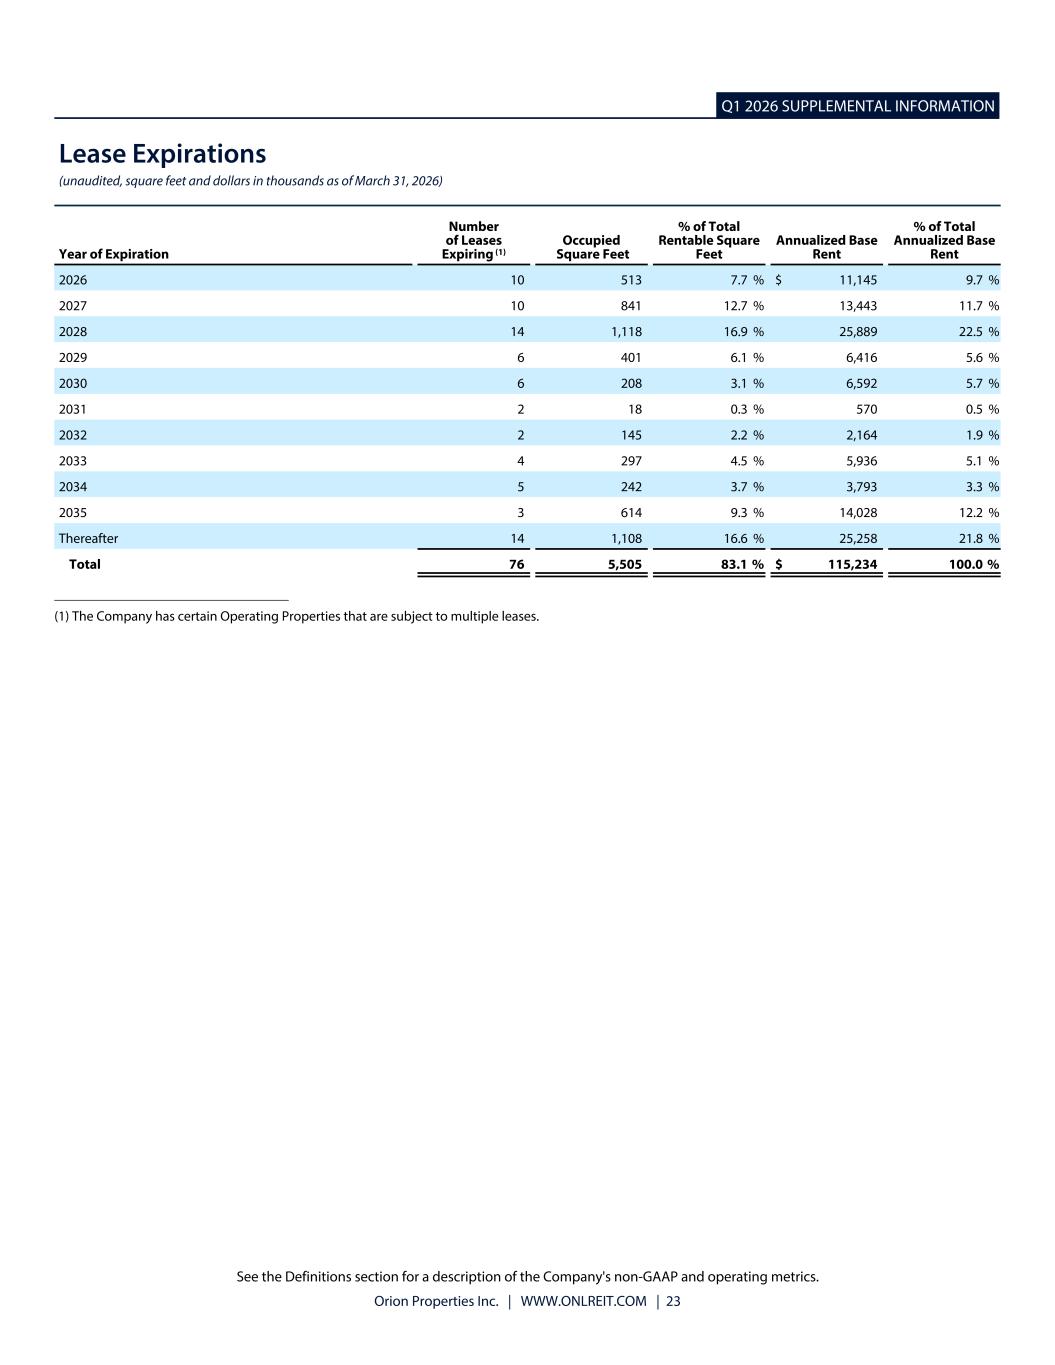
Good morning. This is Paul. A lot of the renewals that we're working on are summer 2026, but most are for 2027 and even actually in beyond that in 2028 as well. As you know, we don't have too much lease rollover for the remainder of this year. And we've got good momentum on the renewal on the rollover for next. We also have got pretty good momentum on filling some of our vacant space. We've got a bunch of leases that we're in discussion with potential tenants for in our vacancy. So, you know, we feel in general pretty good about our pipeline. And it's been, you know, our pipeline has been roughly the same size for the past few quarters. you know, which is reflected in our overall leasing momentum, you know, that we had in both in 2024 and 25 and now the beginning of 26.
Got it. That's helpful. And then shifting to the guidance, you know, you guys reaffirmed there, came in at 21 cents this quarter. So just looking at that, you know, from an annualized basis that would put you above the guidance, you know, were there any kind of one-time things or, you know, stuff that we should be thinking about that's going to drive that a little bit lower based off of that 21 cents?
Sure. Gavin, why don't you answer that?
Hey, Matt. Gavin here. So this quarter we had a $1.9 million lease termination payment that came in on the first quarter. And then we also had a reimbursement from some of our GSA work we did in Lincoln, Nebraska. The one-time reimbursement for the Lincoln, Nebraska work will be straight-lined versus recognized in the full period quarter. So the $1.9 million for the lease termination income really drove up the first quarter in our model. But as far as the remaining of the year goes, we haven't accrued for or expecting a significant amount of lease termination income coming in.
Got it. That's helpful. Appreciate the comments.
Operator
Thank you. Our next question comes from the line of Mitch Germain with Citizens JMP. Please proceed with your question.
Thank you very much. Paul, what's the profile of the buyers of these vacant properties, and are most of them being repurposed to other uses?
Yeah, good question, Mitch. You know, the profile is sort of mixed. The Walgreens properties, or the property in Deerfield, Illinois, we call it the Walgreens properties, their former headquarters. We actually tore the buildings down there and sold raw land to a developer. So the Glen Burnie property that we sold at such a terrific premium, that was sold to a user who happened to be a next door neighbor. So that property was, you know, very valuable to them. So, you know, over our sale process over the past few years, you know, we've had the best outcomes are from, you know, people who are going to either repurpose the property into something else. users. And then when you have somebody who's just buying the property as an investor hoping to release it, you know, those are the most challenging buyers, but sometimes they're the only ones in the market.
Gotcha. That's helpful. You only have three vacant assets remaining, which is quite an accomplishment considering I think that metric's been, you you know, kind of double-digit for you the last couple of years. Is the goal for those three remaining, are those sale candidates, or is some of that part of your leasing pipeline as well?
We hope to lease all three of those properties up, Mitch. You know, so we've made a lot of progress, obviously, in the property in Buffalo with moving Ingram Micro into that property. The property in Tulsa, Oklahoma, is a very high quality class A building. And that is currently vacant, but we've started to get some good leasing momentum there. We're in discussion and in negotiation with a few leases in that property. So our goal is to lease up that vacancy. But as you may have noticed over the past year or so, given our accelerated disposition volume, we're taking a very, very hard look quickly at whether or not that leasing interest is going to turn into true leases signed in buildings. And if we come to the conclusion that it is, we're going to lease these properties up. If we come to the conclusion that leasing is stalling, we're going to take a hard look and perhaps sell those assets. But just to be clear, the vacant assets we have remaining, for the most part, we expect to be able to lease up.
That's super helpful, which then leads me to, it seems like the next phase of dispositions is going to be, you know, some of your stable properties that have some wall, fairly decent tenant, but just may not fit some of that criteria that you mentioned, you know, the critical use criteria. Is that a way to think about the next phase if there is a go-forward plan for you guys?
I think that's pretty good. I mean, I think, you know, we look at things, Mitch, as, you know, sort of everything's for sale. So, we'll comment on it probably next quarter. But, you know, one of the properties we're announcing that we, you know, we have under contract for sale is where, you know, we have a tenant is interested in buying the property And they offered us a price we frankly couldn't refuse. So you say, OK, if you're willing to pay a price and it makes sense for them because they're already in the building and it makes sense for us because they're paying us a significant value for the real estate. So I think we'll look at sales opportunistically. And then once we get those proceeds, we'll look at what do we do with those proceeds. You know, in the case of the property I just mentioned, we're going to utilize it to pay down debt. But in the future, we will utilize some of those sales to recycle capital into dedicated use assets, just as you described.
That's it for me. Thank you.
Operator
Thank you Thank you Ladies and gentlemen, that concludes our question and answer session I'll turn the floor back to Mr. McDowell for any final comments Thank you all for participating in the call today And we look forward to further updates at the end of the second quarter Have a good day Thank you This concludes today's conference You may disconnect your lines at this time Thank you for your participation