Sensient Technologies Corp 8-K, filed Feb 13, 2026
Sensient Technologies Corp (SXT)
8-K
2026-02-13
For: 2026-02-13
View Original
Added on
April 10, 2026
About this 8-K
Sensient Technologies Corp filed this 8-K on February 13, 2026.
Items reported
- Item 2.02: Financial results
- Item 7.01: Regulation FD disclosure
- Item 9.01: Financial statements and exhibits
UNITED STATES SECURITIES AND EXCHANGE COMMISSION
WASHINGTON, D.C. 20549
FORM 8-K
CURRENT REPORT
Pursuant to Section 13 or 15(d) of the Securities Exchange Act of 1934
(Date of Report/Date of earliest event reported)
(Exact name of registrant as specified in its charter)
|
|
|
|
|
(State or other jurisdiction of incorporation)
|
(Commission File Number)
|
(IRS Employer Identification No.)
|
(Address and zip code of principal executive offices)
(414 ) 271-6755
(Registrant’s telephone number, including area code)
N/A
(Former name or former address, if changed since last report)
Check the appropriate box below if the Form 8-K filing is intended to simultaneously satisfy the filing obligation of the registrant under any of the following
provisions:
|
Written communications pursuant to Rule 425 under the Securities Act (17 CFR 230.425)
|
|
Soliciting material pursuant to Rule 14a-12 under the Exchange Act (17 CFR 240.14a-12)
|
|
Pre-commencement communications pursuant to Rule 14d-2(b) under the Exchange Act (17 CFR 240.14d-2(b))
|
|
Pre-commencement communications pursuant to Rule 13e-4(c) under the Exchange Act (17 CFR 240.13e-4(c))
|
Securities registered pursuant to Section 12(b) of the Act:
|
Title of each class
|
Trading Symbol(s)
|
Name of each exchange on which registered
|
|
|
|
Indicate by check mark whether the registrant is an emerging growth company as defined in Rule 405 of the Securities Act of 1933 (§230.405 of this chapter) or Rule 12b-2
of the Securities Exchange Act of 1934 (§240.12b-2 of this chapter).
Emerging growth company ☐
If an emerging growth company, indicate by check mark if the registrant has elected not to use the extended transition period for complying with any new or revised
financial accounting standards provided pursuant to Section 13(a) of the Exchange Act. ☐
| Item 2.02 |
Results of Operations and Financial Condition.
|
Sensient Technologies Corporation (the “Company”) issued a press release on February 13, 2026, disclosing its results of operations for its quarter and year ended
December 31, 2025, and its financial condition at that date. The press release is furnished as Exhibit 99.1 to this Current Report on Form 8-K.
The information contained in this Item 2.02 (including Exhibit 99.1) is intended to be furnished under Item 2.02 of Form 8-K and shall not be deemed
“filed” for purposes of Section 18 of the Securities Exchange Act of 1934, as amended (the “Exchange Act”), or otherwise subject to the liabilities of that section, nor shall it be deemed to be incorporated by reference into any registration
statement or other document filed under the Securities Act of 1933, as amended, or the Exchange Act.
| Item 7.01 |
Regulation FD Disclosure.
|
On February 13, 2026, the Company also posted an updated investor presentation for its quarter and year ended December 31, 2025, on the “Investor
Information” section of its website. A copy of the investor presentation is furnished as Exhibit 99.2 to this Current Report on Form 8-K.
The information contained in this Item 7.01 (including Exhibit 99.2) is intended to be furnished under Item 7.01 of Form 8-K and shall not be deemed
“filed” for purposes of Section 18 of the Exchange Act, or otherwise subject to the liabilities of that section, nor shall it be deemed to be incorporated by reference into any registration statement or other document filed under the Securities
Act of 1933, as amended, or the Exchange Act.
| Item 9.01 |
Financial Statements and Exhibits.
|
| (d) | Exhibits. The following exhibits are furnished with this Current Report on Form 8-K: |
EXHIBIT INDEX
|
Exhibit
Number
|
Description
|
|
Sensient Technologies Corporation Earnings Press Release for the Quarter and Year Ended December 31, 2025.
|
|
|
Sensient Technologies Corporation Investor Presentation – Q4 2025.
|
|
|
104
|
Cover Page Interactive Data File (embedded within the Inline XBRL document).
|
SIGNATURES
Pursuant to the requirements of the Securities Exchange Act of 1934, the registrant has duly caused this report to be signed on its behalf by the undersigned hereunto
duly authorized.
|
SENSIENT TECHNOLOGIES CORPORATION
|
|||
|
By:
|
/s/ John J. Manning
|
||
|
Name:
|
John J. Manning
|
||
|
Title:
|
Senior Vice President, General Counsel, and Secretary
|
||
|
Date:
|
February 13, 2026
|
||
Exhibit 99.1
 |
Contact:
David Plautz
(414) 347-3706
investor.relations@sensient.com
|
Sensient Technologies Corporation
Reports Results for the Quarter Ended December 31, 2025
MILWAUKEE— February 13, 2026 — Sensient Technologies Corporation (NYSE: SXT), a leading provider of flavors and
colors for the food, pharmaceutical, and personal care markets, today reported financial results for the fourth quarter ended December 31, 2025.
Fourth Quarter Consolidated Results
| • |
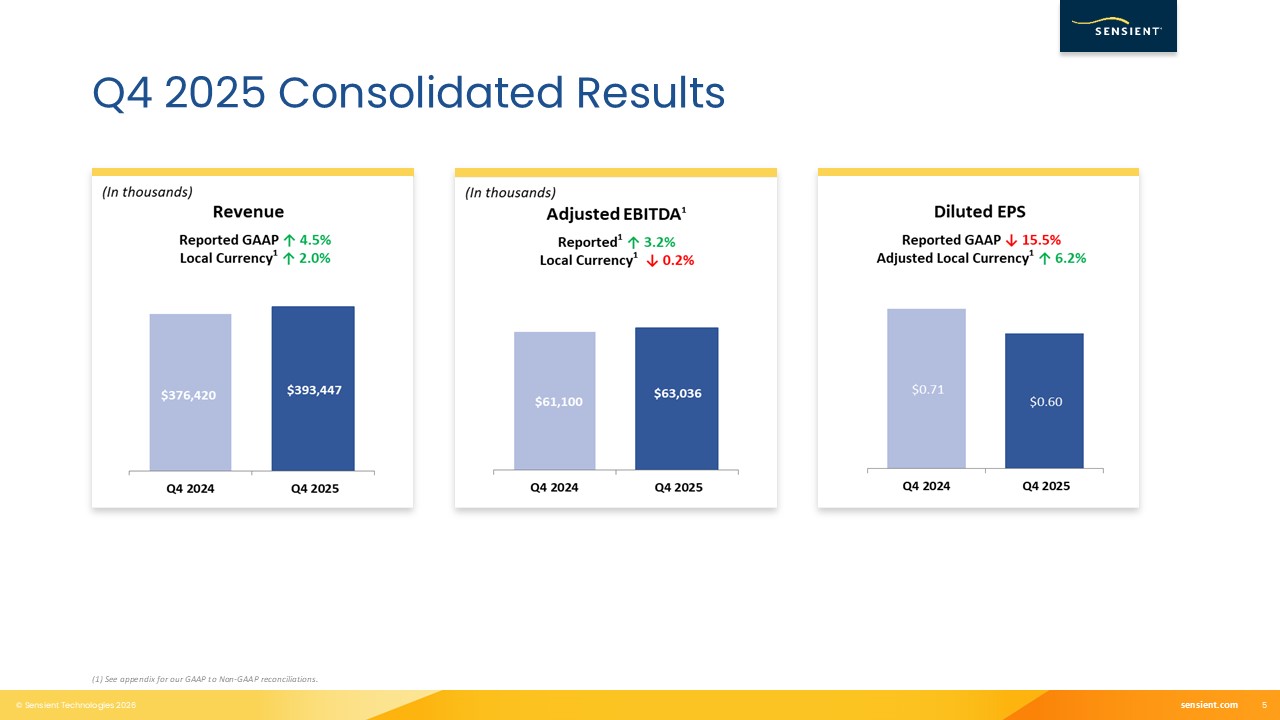
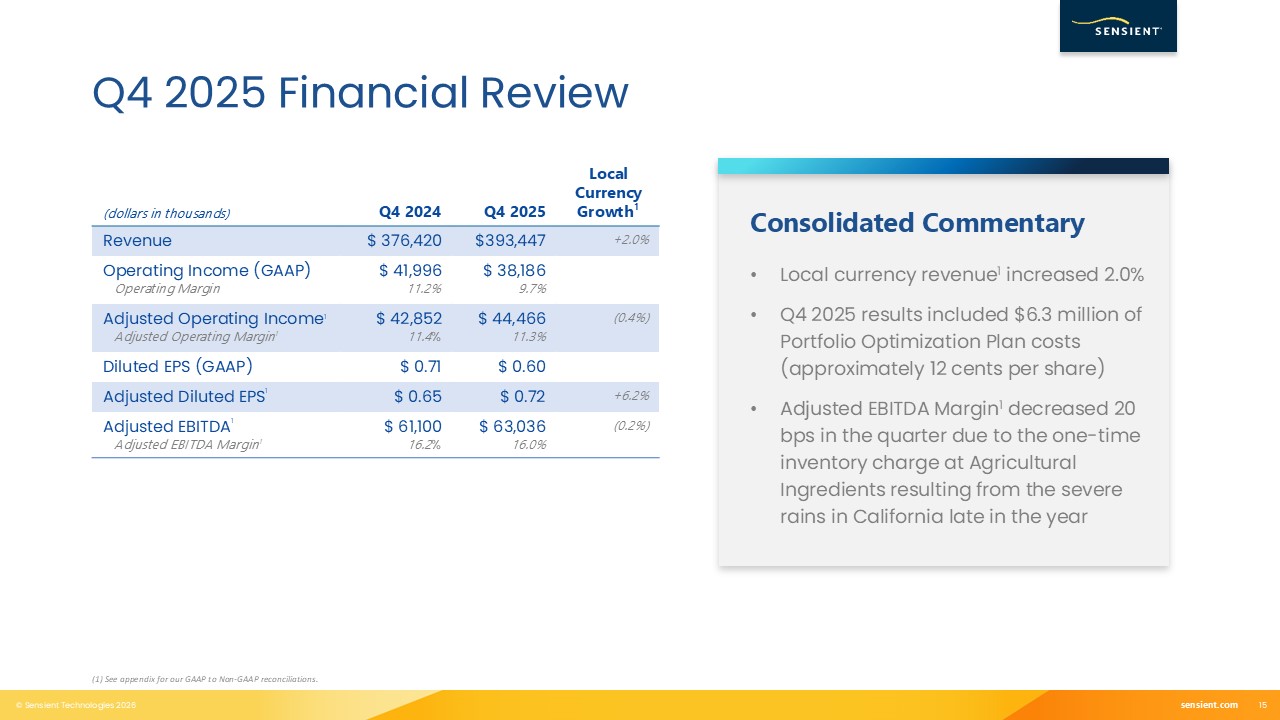
Reported revenue increased 4.5% to $393.4 million in the fourth quarter of 2025 versus last year’s fourth quarter results of $376.4 million. On a local currency basis(1), revenue
increased 2.0%.
|
| • |
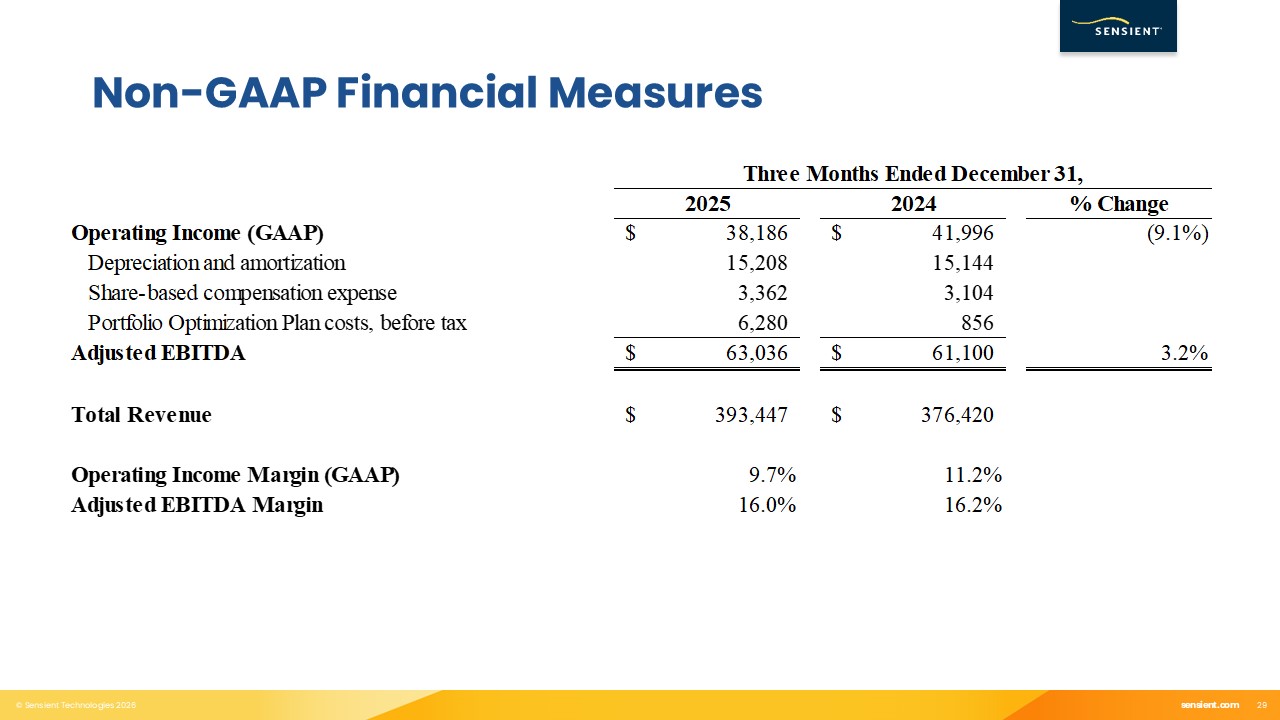
Reported operating income decreased 9.1% to $38.2 million compared to $42.0 million recorded in the fourth quarter of 2024. In the fourth quarter of 2025, the Company recorded $6.3 million of
costs related to its Portfolio Optimization Plan versus last year’s $0.9 million in the fourth quarter. Local currency adjusted operating income(1) and local currency adjusted EBITDA(1) were both flat in the fourth
quarter.
|
| • |
Reported earnings per share decreased 15.5% to 60 cents in the fourth quarter of 2025 compared to 71 cents in the fourth quarter of 2024. Local currency adjusted diluted EPS(1)
increased 6.2% in the fourth quarter.
|
“Sensient delivered strong results in 2025 driven by exceptional new sales wins. We
executed on our strategy, delivered meaningful value to our customers, and strengthened our position for the opportunities ahead. I remain very confident about our performance and the momentum we have going forward,” said Paul Manning, Sensient’s Chairman, President, and Chief Executive Officer.
|
Sensient Technologies Corporation
Earnings Release – Quarter Ended December 31, 2025
February 13, 2026
|
Page 2
|
Fourth Quarter Group Results
|
Reported
|
Local Currency(1)
|
|||||||||||||||
|
Revenue
|
Quarter
|
Year-to-Date
|
Quarter
|
Year-to-Date
|
||||||||||||
|
Flavors & Extracts
|
-0.6%
|
-0.9%
|
-2.4%
|
-1.3%
|
||||||||||||
|
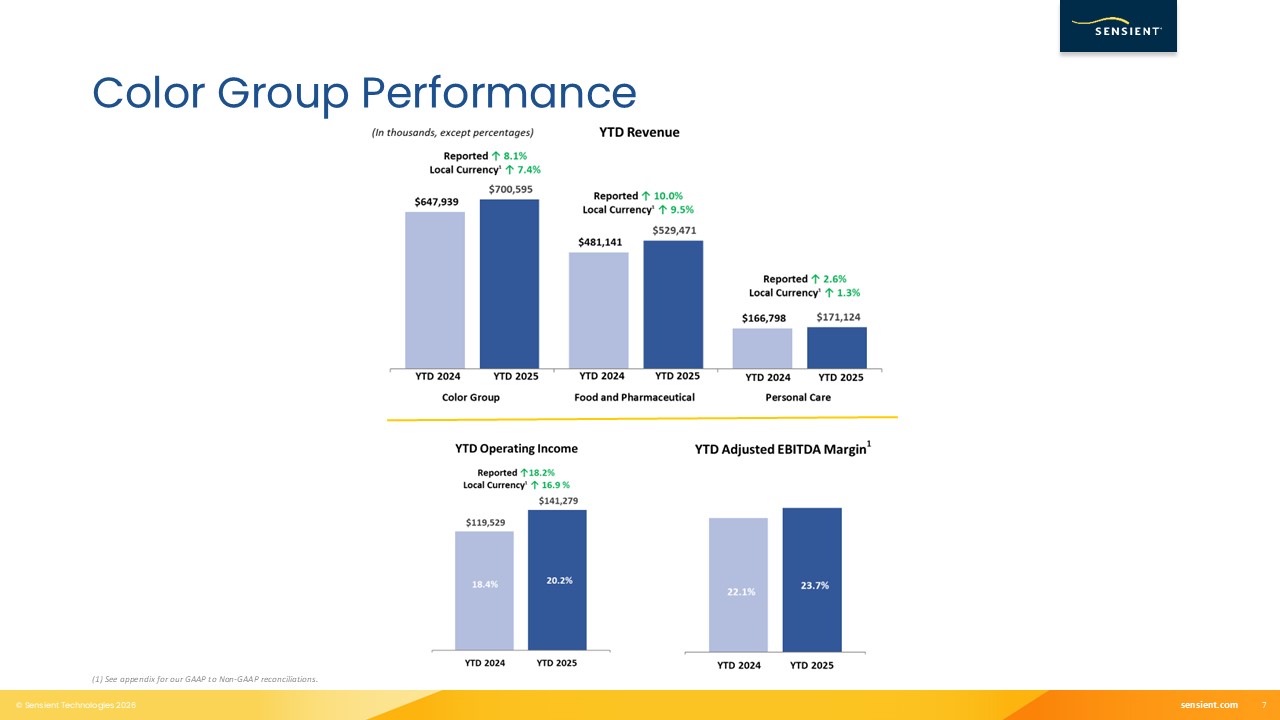
Color
|
10.9%
|
8.1%
|
7.0%
|
7.4%
|
||||||||||||
|
Asia Pacific
|
-1.0%
|
3.5%
|
-1.9%
|
2.4%
|
||||||||||||
|
Total Revenue
|
4.5%
|
3.5%
|
2.0%
|
2.9%
|
||||||||||||
|
Reported
|
Local Currency Adjusted(1)
|
|||||||||||||||
|
Operating Income
|
Quarter
|
Year-to-Date
|
Quarter
|
Year-to-Date
|
||||||||||||
|
Flavors & Extracts
|
-10.0%
|
3.8%
|
-11.6%
|
3.4%
|
||||||||||||
|
Color
|
12.2%
|
18.2%
|
7.2%
|
16.9%
|
||||||||||||
|
Asia Pacific
|
2.4%
|
6.3%
|
0.6%
|
3.8%
|
||||||||||||
|
Total Operating Income
|
-9.1%
|
8.1%
|
-0.4%
|
11.1%
|
||||||||||||
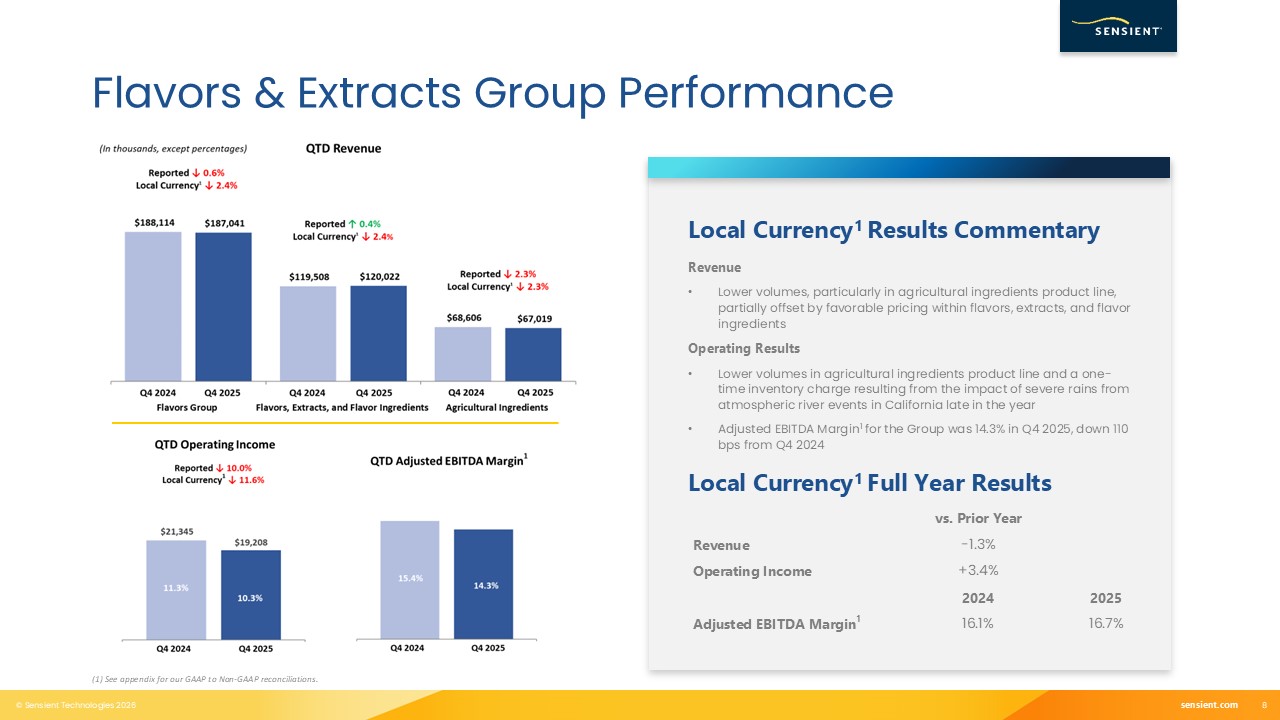
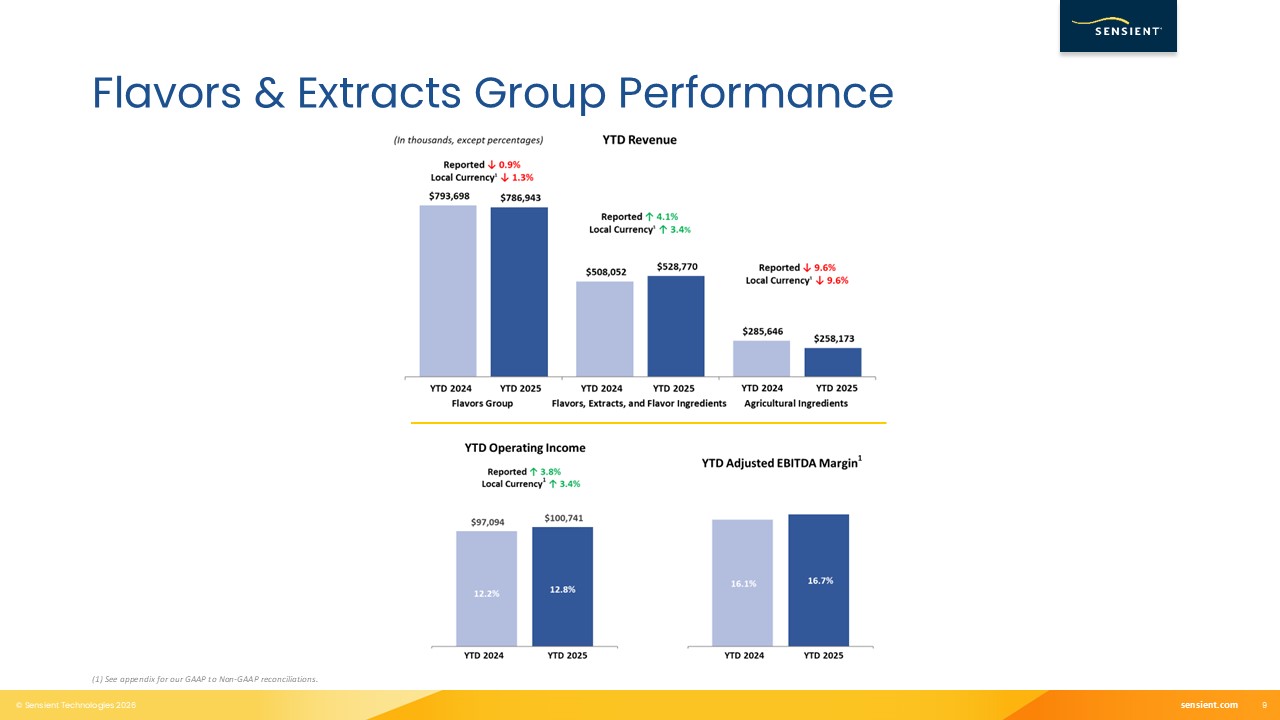
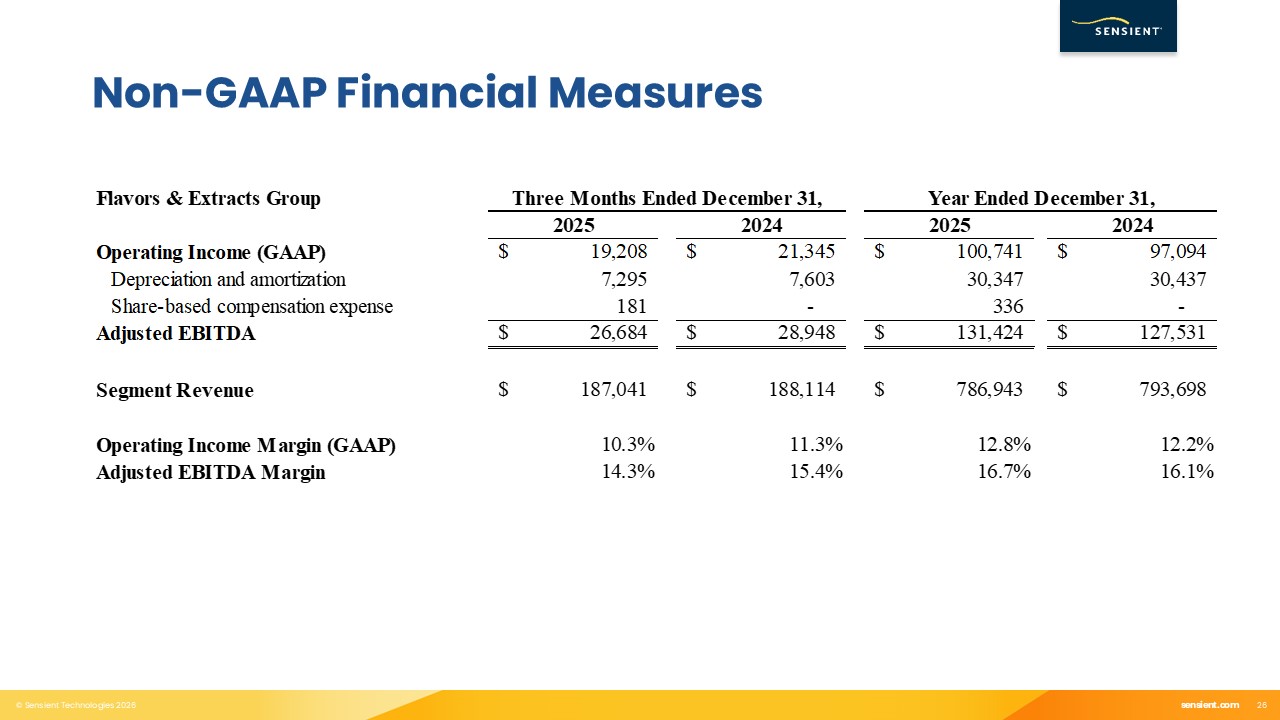
The Flavors & Extracts Group reported fourth quarter 2025 revenue of $187.0 million, a decrease of $1.1 million versus the prior year’s fourth
quarter. The Group’s revenue was unfavorably impacted by lower volumes, particularly in the agricultural ingredients product line. This decline was partially offset by higher prices. Segment operating income was $19.2 million in the fourth
quarter of 2025, a decrease of $2.1 million compared to the prior year’s fourth quarter. The decrease in segment operating income was driven by the decline in the volume in the agricultural ingredients product line along with a one-time charge of
approximately $3 million stemming from the impact of severe rains from atmospheric river events late in the year that disrupted the harvest and production.
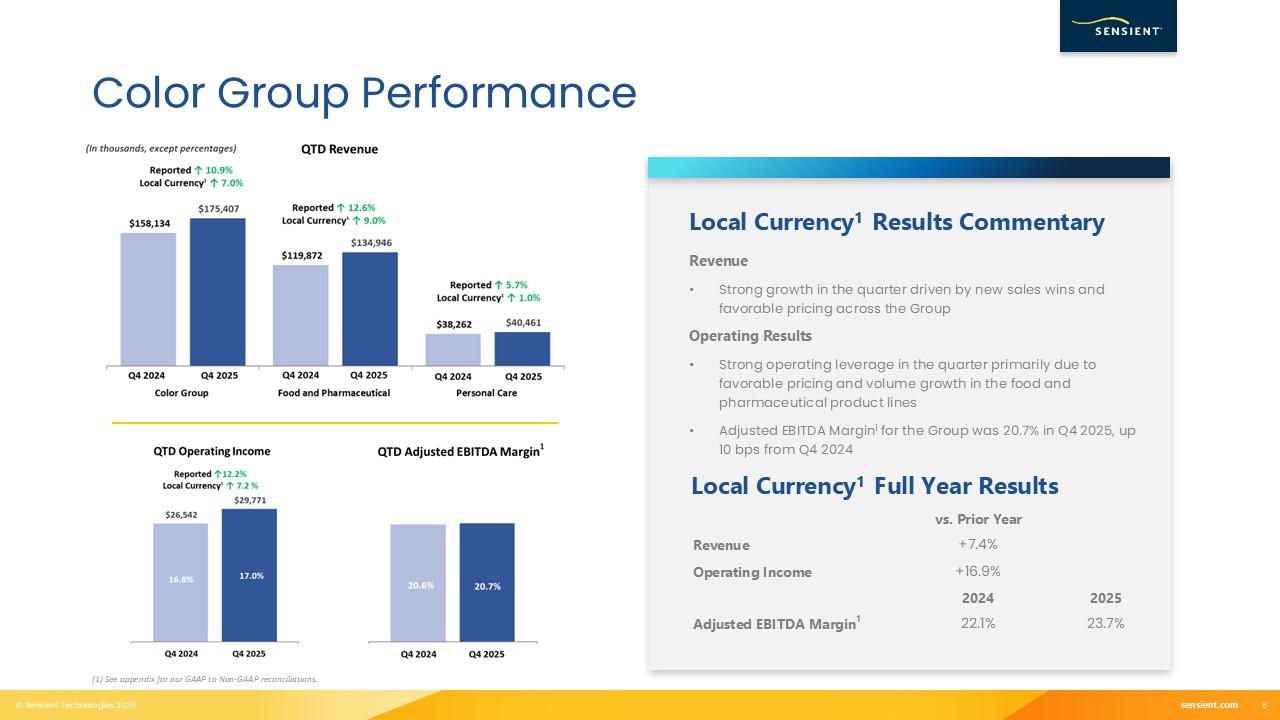
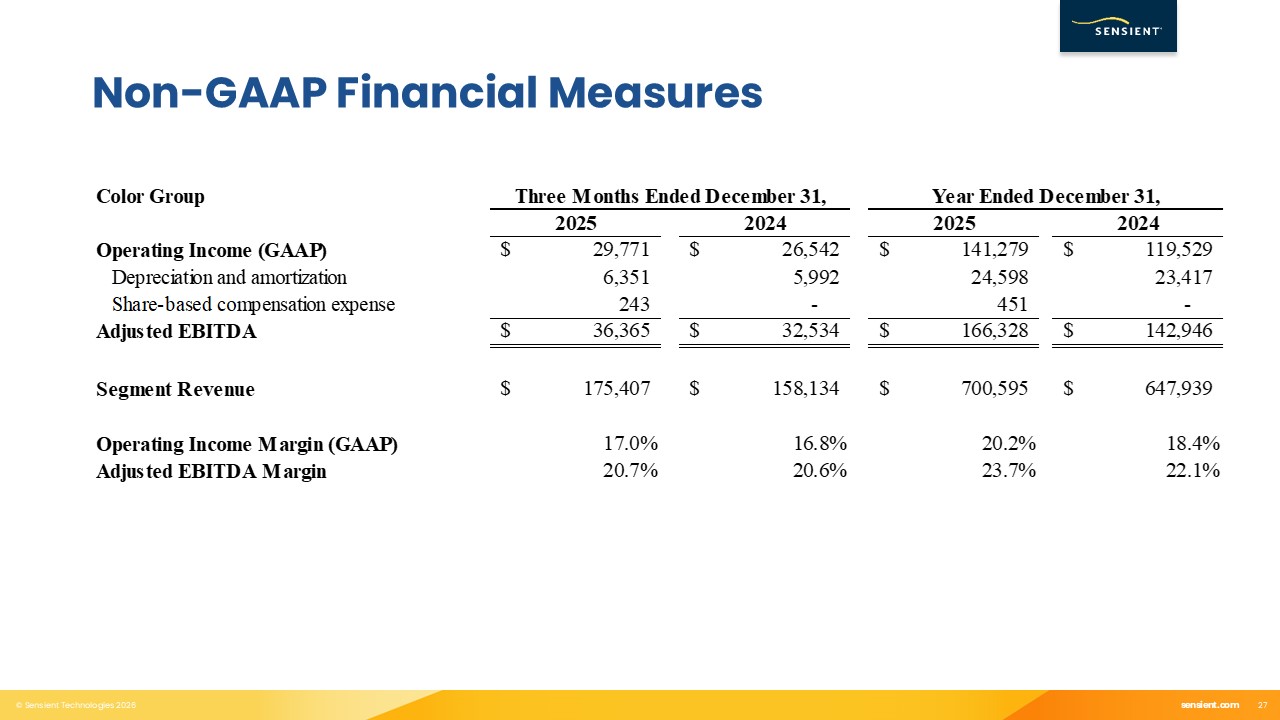
The Color Group reported revenue of $175.4 million in the fourth quarter of 2025, an increase of $17.3 million compared to the prior year’s fourth
quarter. The Group’s revenue increase was driven by strong volume growth and higher prices in the food and pharmaceutical product lines. Segment operating income was $29.8 million in the fourth quarter of 2025, an increase of $3.2 million
compared to the prior year’s fourth quarter results.
|
Sensient Technologies Corporation
Earnings Release – Quarter Ended December 31, 2025
February 13, 2026
|
Page 3
|
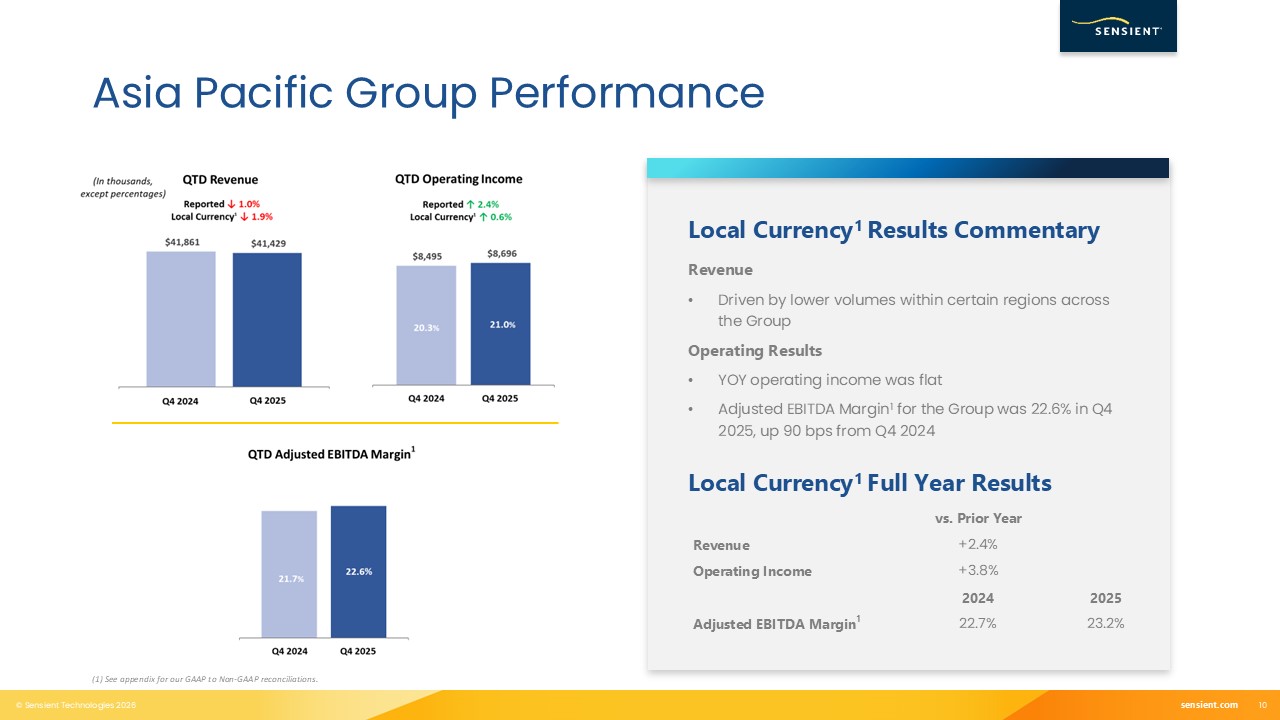
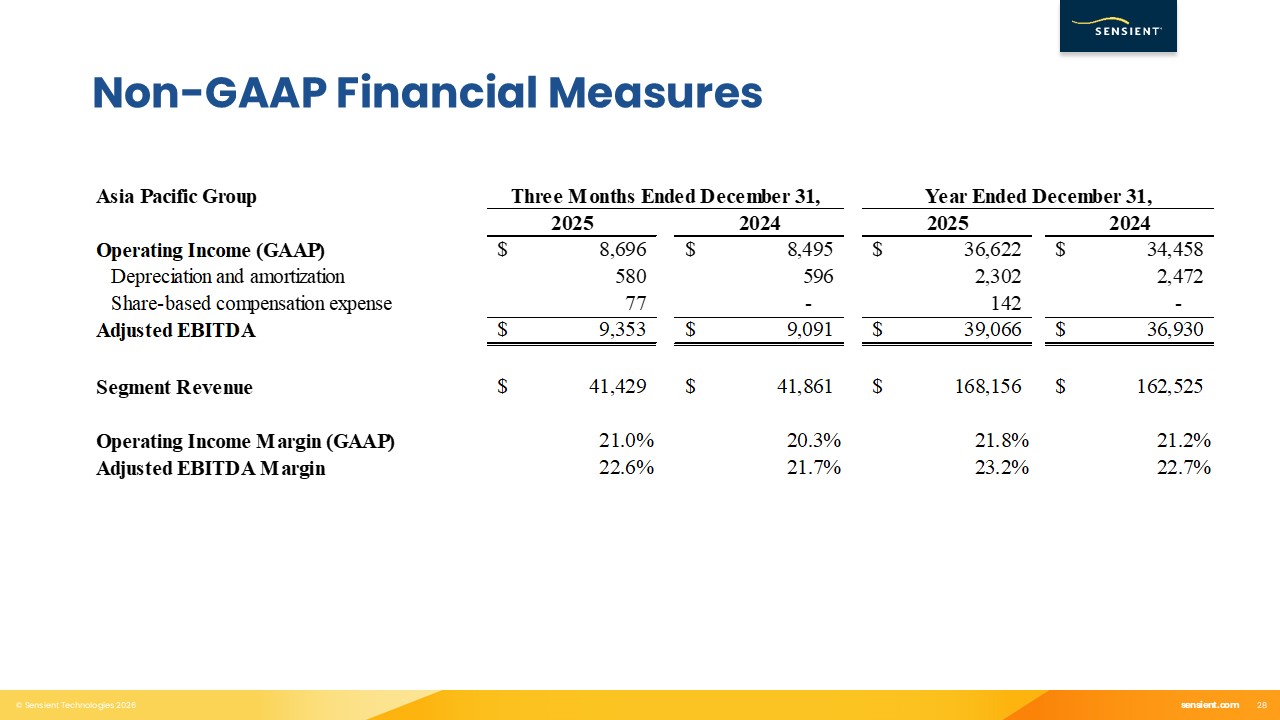
The Asia Pacific Group reported revenue of $41.4 million in the fourth quarter of 2025, a decrease of $0.4 million compared to the prior year’s
fourth quarter. Segment operating income was $8.7 million in the quarter, an increase of $0.2 million compared to the prior year’s fourth quarter.
Corporate & Other reported operating expenses were $19.5 million in the fourth quarter of 2025, compared to $14.4 million of operating expenses
reported in the prior year’s fourth quarter. The higher operating expenses were primarily due to higher Portfolio Optimization Plan costs in the quarter. Local currency adjusted operating expenses(1) for Corporate & Other decreased
$0.3 million compared to the prior year’s fourth quarter, primarily due to lower performance-based compensation costs recorded in 2025.
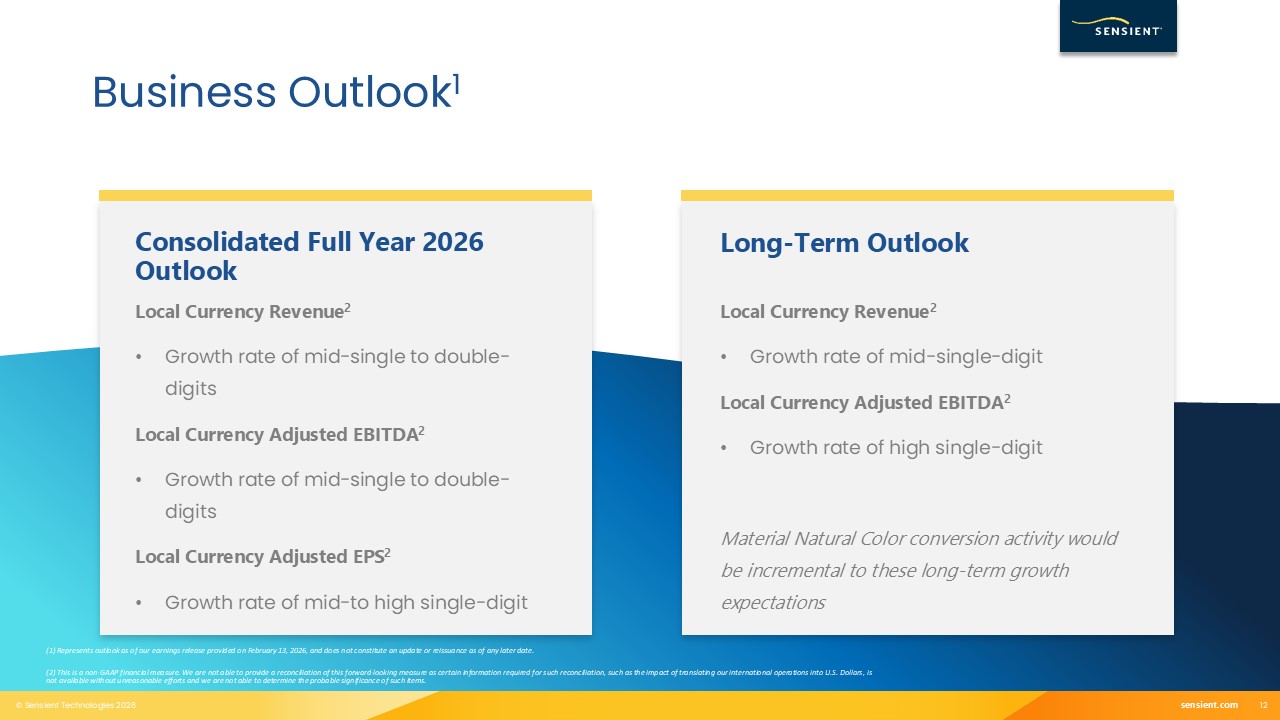
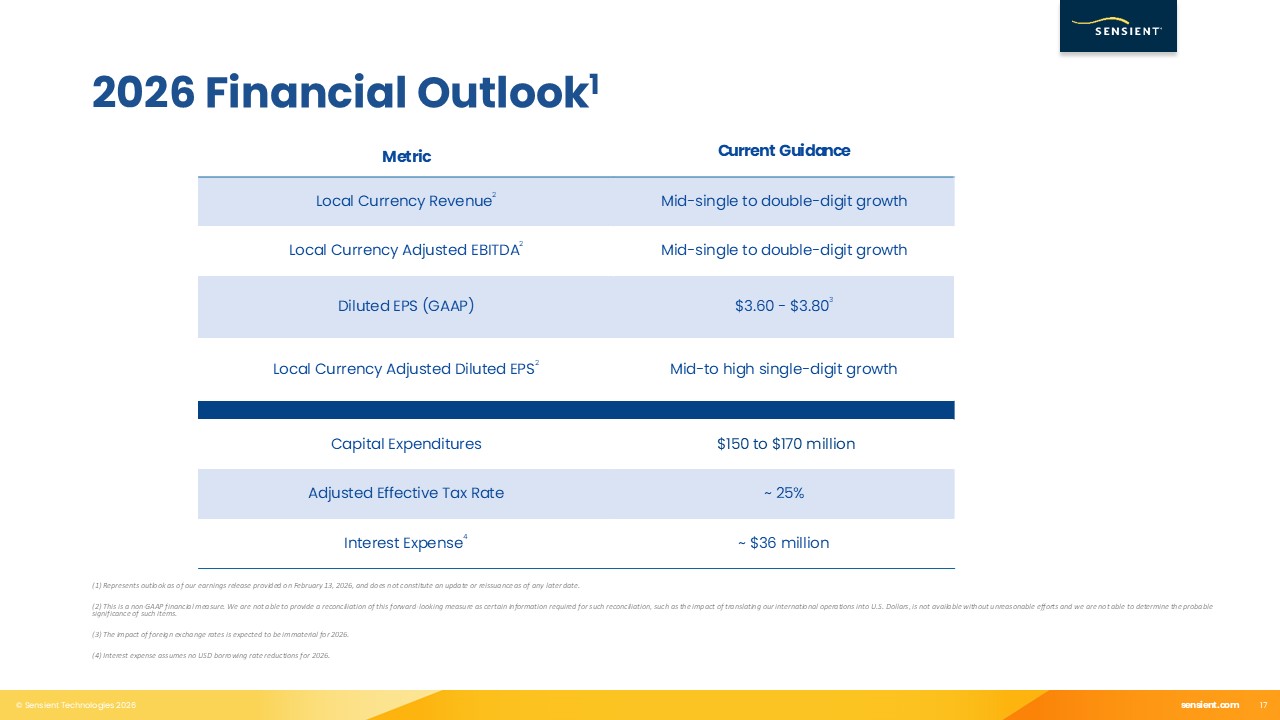
2026 OUTLOOK
|
Metric
|
Current Guidance
|
|
|
Local Currency Revenue(1)
|
Mid-Single-Digit to Double-Digit Growth
|
|
|
Local Currency Adjusted EBITDA(1)
|
Mid-Single-Digit to Double-Digit Growth
|
|
|
Diluted EPS (GAAP)
|
Between $3.60 and $3.80*
|
|
|
Local Currency Adjusted Diluted EPS(1)
|
Mid-Single-Digit to High Single-Digit Growth
|
|
| *Based on current exchange rates, foreign currency impact is expected to be immaterial for the year. | ||
The Company’s guidance is based on current conditions and economic and market trends in the markets in which the Company operates and is subject to
various risks and uncertainties as described below.
| (1) |
Please refer to “Reconciliation of Non-GAAP Amounts” at the end of this release for more information regarding our
non-GAAP financial measures.
|
|
Sensient Technologies Corporation
Earnings Release – Quarter Ended December 31, 2025
February 13, 2026
|
Page 4
|
USE OF NON-GAAP FINANCIAL MEASURES
The Company’s non-GAAP financial measures eliminate the impact of certain items, which, depending on the measure, include: currency movements,
depreciation and amortization, Portfolio Optimization Plan costs, and non-cash share-based compensation. These measures are provided to enhance the overall understanding of the Company’s performance when viewed together with the GAAP results.
Refer to “Reconciliation of Non-GAAP Amounts” at the end of this release.
CONFERENCE CALL
The Company will host a conference call to discuss its 2025 fourth quarter financial results at 8:30 a.m. CST on Friday, February 13, 2026. To
participate in the conference call, contact Chorus Call Inc. at (844) 492-3726 or (412) 317-1078, and ask to join the Sensient Technologies Corporation conference call. Alternatively, the call can be accessed by using the webcast link that is
available on the Investor Information section of the Company’s web site at www.sensient.com.
A replay of the call will be available one hour after the end of the conference call through February 20, 2026 by calling (855) 669-9658 and using
access code 4128932. An audio replay and written transcript of the call will also be posted on the Investor Information section of the Company’s web site at www.sensient.com on or after February 18, 2026.
|
Sensient Technologies Corporation
Earnings Release – Quarter Ended December 31, 2025
February 13, 2026
|
Page 5
|
This release contains statements that may constitute “forward-looking statements” within the meaning of Federal securities laws
including in the quote from our Chairman, President, and Chief Executive Officer and under “2026 Outlook” above. Such forward-looking statements are not guarantees of future performance and involve known and unknown risks, uncertainties, and
other factors concerning the Company’s operations and business environment. Important factors that could cause actual results to differ materially from those suggested by these forward-looking statements and that could adversely affect the
Company’s future financial performance include the following: the Company’s ability to manage general business, economic, and capital market conditions, including actions taken by customers in response to such market conditions, and the impact of
recessions and economic downturns; the impact of macroeconomic and geopolitical volatility, including inflation and shortages impacting the availability and cost of raw materials, energy, and other supplies, disruptions and delays in the
Company’s supply chain, and the conflicts between Russia and Ukraine and in the Middle East; industry, regulatory, legal, and economic factors related to the Company’s domestic and international business; the effects of tariffs, trade barriers,
and disputes; the availability and cost of labor, logistics, and transportation; the pace and nature of new product introductions by the Company and the Company’s customers; the Company’s ability to anticipate and respond to changing consumer
preferences, changing technologies, and changing regulations; the Company’s ability to successfully implement its growth strategies; the outcome of the Company’s various productivity-improvement and cost-reduction efforts, acquisition and
divestiture activities, and Portfolio Optimization Plan; growth in markets for products in which the Company competes; industry and customer acceptance of price increases; actions by competitors; the Company’s ability to enhance its innovation
efforts and drive cost efficiencies; currency exchange rate fluctuations; and other factors included in “Risk Factors” in the Company's Annual Report on Form 10-K for the year ended December 31, 2025, and in other documents that the Company files
with the SEC. The risks and uncertainties identified above are not the only risks the Company faces. Additional risks and uncertainties not presently known to the Company or that it currently believes to be immaterial also may adversely affect
the Company. Should any known or unknown risks and uncertainties develop into actual events, these developments could have material adverse effects on our business, financial condition, and results of operations. This release contains
time-sensitive information that reflects management’s best analysis only as of the date of this release. Except to the extent required by applicable laws, the Company does not undertake to publicly update or revise its forward-looking statements
even if experience or future changes make it clear that any projected results expressed or implied herein will not be realized.
ABOUT SENSIENT TECHNOLOGIES
Sensient Technologies Corporation is a leading global manufacturer and marketer of colors, flavors, and other specialty ingredients. Sensient uses
advanced technologies and robust global supply chain capabilities to develop specialized solutions for food and beverages, as well as products that serve the pharmaceutical, nutraceutical, and personal care industries. Sensient’s customers range
in size from small entrepreneurial businesses to major international manufacturers representing some of the world’s best-known brands. Sensient is headquartered in Milwaukee, Wisconsin.
www.sensient.com
|
Sensient Technologies Corporation
(In thousands, except percentages and per share
amounts)
(Unaudited)
|
Page 6
|
|
Consolidated Statements of Earnings
|
Three Months Ended December 31,
|
Year Ended December 31,
|
||||||||||||||||||||
|
2025
|
2024
|
% Change
|
2025
|
2024
|
% Change
|
|||||||||||||||||
|
Revenue
|
$
|
393,447
|
$
|
376,420
|
4.5
|
%
|
$
|
1,612,111
|
$
|
1,557,228
|
3.5
|
%
|
||||||||||
|
Cost of products sold
|
270,098
|
257,002
|
5.1
|
%
|
1,072,811
|
1,050,135
|
2.2
|
%
|
||||||||||||||
|
Selling and administrative expenses
|
85,163
|
77,422
|
10.0
|
%
|
332,172
|
315,514
|
5.3
|
%
|
||||||||||||||
|
Operating income
|
38,186
|
41,996
|
(9.1
|
%)
|
207,128
|
191,579
|
8.1
|
%
|
||||||||||||||
|
Interest expense
|
7,521
|
6,387
|
29,581
|
28,781
|
||||||||||||||||||
|
Earnings before income taxes
|
30,665
|
35,609
|
177,547
|
162,798
|
||||||||||||||||||
|
Income taxes
|
5,181
|
5,505
|
43,058
|
38,132
|
||||||||||||||||||
|
Net earnings
|
$
|
25,484
|
$
|
30,104
|
(15.3
|
%)
|
$
|
134,489
|
$
|
124,666
|
7.9
|
%
|
||||||||||
|
Earnings per share of common stock:
|
||||||||||||||||||||||
|
Basic
|
$
|
0.60
|
$
|
0.71
|
$
|
3.18
|
$
|
2.96
|
||||||||||||||
|
|
||||||||||||||||||||||
|
Diluted
|
$
|
0.60
|
$
|
0.71
|
$
|
3.16
|
$
|
2.94
|
||||||||||||||
|
Average common shares outstanding:
|
||||||||||||||||||||||
|
Basic
|
42,254
|
42,163
|
42,236
|
42,145
|
||||||||||||||||||
|
|
||||||||||||||||||||||
|
Diluted
|
42,669
|
42,454
|
42,595
|
42,396
|
||||||||||||||||||
|
Results by Segment
|
Three Months Ended December 31,
|
Year Ended December 31,
|
||||||||||||||||||||
|
Revenue
|
2025
|
2024
|
% Change
|
2025
|
2024
|
% Change
|
||||||||||||||||
|
Flavors & Extracts
|
$
|
187,041
|
$
|
188,114
|
(0.6
|
%)
|
$
|
786,943
|
$
|
793,698
|
(0.9
|
%)
|
||||||||||
|
Color
|
175,407
|
158,134
|
10.9
|
%
|
700,595
|
647,939
|
8.1
|
%
|
||||||||||||||
|
Asia Pacific
|
41,429
|
41,861
|
(1.0
|
%)
|
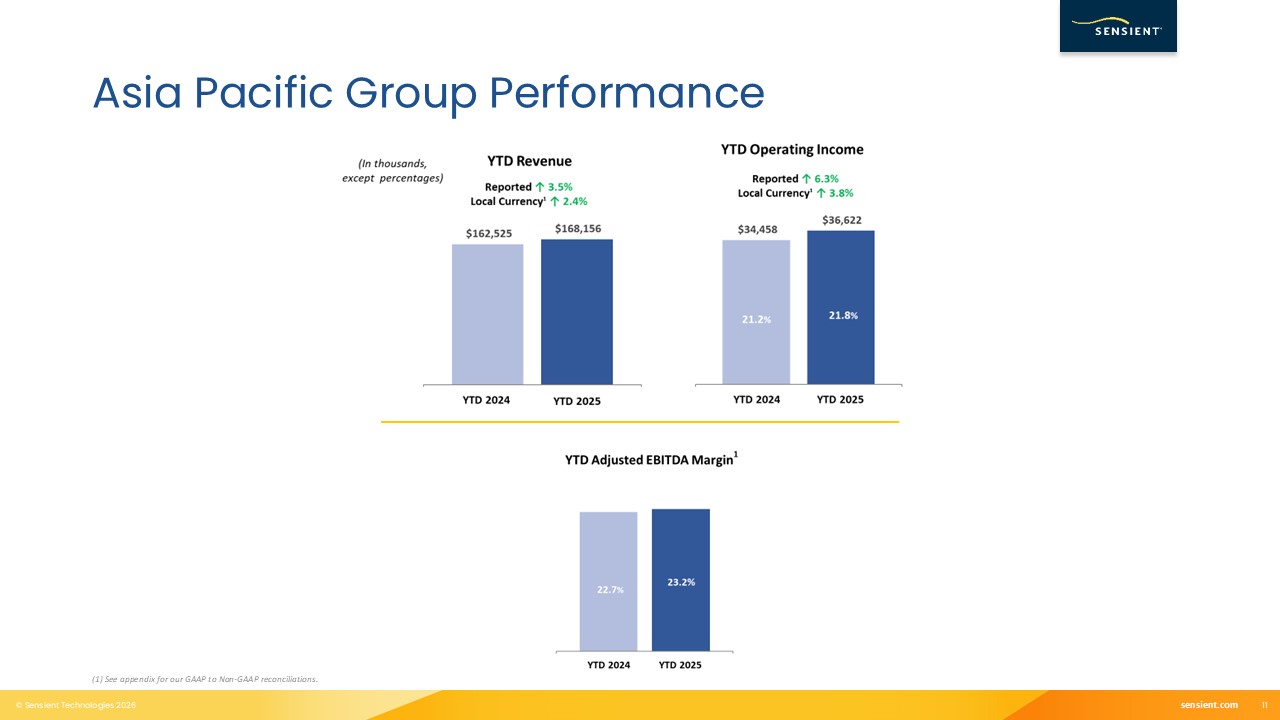
168,156
|
162,525
|
3.5
|
%
|
||||||||||||||
|
Intersegment elimination
|
(10,430
|
)
|
(11,689
|
)
|
(43,583
|
)
|
(46,934
|
)
|
||||||||||||||
|
Consolidated
|
$
|
393,447
|
$
|
376,420
|
4.5
|
%
|
$
|
1,612,111
|
$
|
1,557,228
|
3.5
|
%
|
||||||||||
|
Operating Income
|
||||||||||||||||||||||
|
Flavors & Extracts
|
$
|
19,208
|
$
|
21,345
|
(10.0
|
%)
|
$
|
100,741
|
$
|
97,094
|
3.8
|
%
|
||||||||||
|
Color
|
29,771
|
26,542
|
12.2
|
%
|
141,279
|
119,529
|
18.2
|
%
|
||||||||||||||
|
Asia Pacific
|
8,696
|
8,495
|
2.4
|
%
|
36,622
|
34,458
|
6.3
|
%
|
||||||||||||||
|
Corporate & Other
|
(19,489
|
)
|
(14,386
|
)
|
(71,514
|
)
|
(59,502
|
)
|
||||||||||||||
|
Consolidated
|
$
|
38,186
|
$
|
41,996
|
(9.1
|
%)
|
$
|
207,128
|
$
|
191,579
|
8.1
|
%
|
||||||||||
|
Sensient Technologies Corporation
(In thousands)
(Unaudited)
|
Page 7
|
|
Consolidated Condensed Balance Sheets
|
December 31,
|
December 31,
|
||||||
|
2025
|
2024
|
|||||||
|
Cash and cash equivalents
|
$
|
36,533
|
$
|
26,626
|
||||
|
Trade accounts receivable
|
305,380
|
290,087
|
||||||
|
Inventories
|
678,220
|
600,302
|
||||||
|
Prepaid expenses and other current assets
|
59,717
|
44,871
|
||||||
|
Fixed assets held for sale
|
1,598
|
-
|
||||||
|
Total Current Assets
|
1,081,448
|
961,886
|
||||||
|
Goodwill & intangible assets (net)
|
449,827
|
423,658
|
||||||
|
Property, plant, and equipment (net)
|
539,296
|
491,587
|
||||||
|
Other assets
|
173,566
|
146,663
|
||||||
|
Total Assets
|
$
|
2,244,137
|
$
|
2,023,794
|
||||
|
Trade accounts payable
|
$
|
138,344
|
$
|
139,052
|
||||
|
Short-term borrowings
|
352
|
19,848
|
||||||
|
Other current liabilities
|
124,887
|
111,739
|
||||||
|
Total Current Liabilities
|
263,583
|
270,639
|
||||||
|
Long-term debt
|
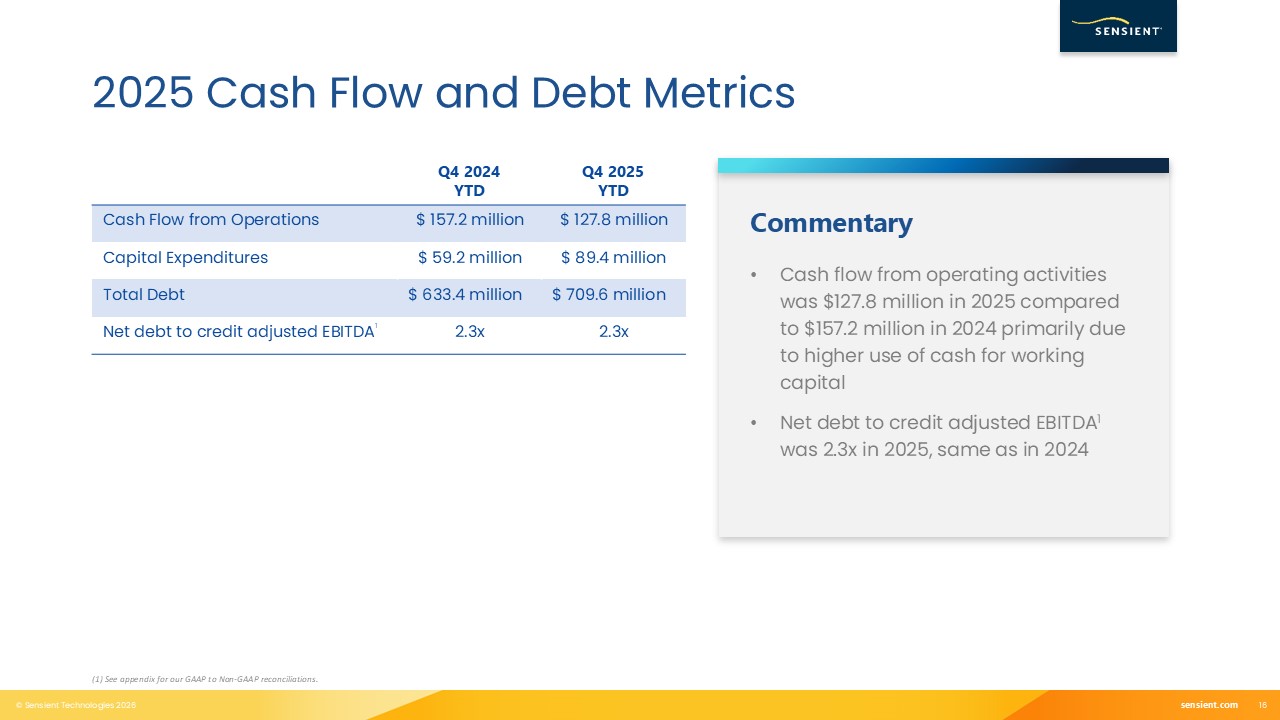
709,232
|
613,523
|
||||||
|
Accrued employee and retiree benefits
|
24,045
|
24,499
|
||||||
|
Other liabilities
|
53,763
|
54,147
|
||||||
|
Shareholders' Equity
|
1,193,514
|
1,060,986
|
||||||
|
Total Liabilities and Shareholders' Equity
|
$
|
2,244,137
|
$
|
2,023,794
|
||||
|
Sensient Technologies Corporation
(In thousands, except per share amounts)
(Unaudited)
|
Page 8
|
|
Consolidated Statements of Cash Flows
|
||||||||
|
Year Ended December 31,
|
||||||||
|
2025
|
2024
|
|||||||
|
Cash flows from operating activities:
|
||||||||
|
Net earnings
|
$
|
134,489
|
$
|
124,666
|
||||
|
Adjustments to arrive at net cash provided by operating activities:
|
||||||||
|
Depreciation and amortization
|
61,098
|
60,329
|
||||||
|
Share-based compensation expense
|
13,946
|
10,084
|
||||||
|
Net loss (gain) on assets
|
289
|
(140
|
)
|
|||||
|
Portfolio Optimization Plan costs
|
5,273
|
1,415
|
||||||
|
Deferred income taxes
|
(2,705
|
)
|
(18,598
|
)
|
||||
|
Changes in operating assets and liabilities:
|
||||||||
|
Trade accounts receivable
|
(1,106
|
)
|
(29,638
|
)
|
||||
|
Inventories
|
(62,226
|
)
|
(18,295
|
)
|
||||
|
Prepaid expenses and other assets
|
(19,036
|
)
|
(5,407
|
)
|
||||
|
Trade accounts payable and other accrued expenses
|
(1,445
|
)
|
8,995
|
|||||
|
Accrued salaries, wages, and withholdings
|
(5,093
|
)
|
22,518
|
|||||
|
Income taxes
|
1,839
|
(810
|
)
|
|||||
|
Other liabilities
|
2,503
|
2,032
|
||||||
|
Net cash provided by operating activities
|
127,826
|
157,151
|
||||||
|
Cash flows from investing activities:
|
||||||||
|
Acquisition of property, plant, and equipment
|
(89,409
|
)
|
(59,212
|
)
|
||||
|
Proceeds from sale of assets
|
496
|
339
|
||||||
|
Acquisition of new business
|
(4,867
|
)
|
-
|
|||||
|
Other investing activities
|
1,098
|
(336
|
)
|
|||||
|
Net cash used in investing activities
|
(92,682
|
)
|
(59,209
|
)
|
||||
|
Cash flows from financing activities:
|
||||||||
|
Proceeds from additional borrowings
|
216,485
|
159,321
|
||||||
|
Debt payments
|
(177,592
|
)
|
(167,073
|
)
|
||||
|
Dividends paid
|
(69,614
|
)
|
(69,399
|
)
|
||||
|
Other financing activities
|
(4,314
|
)
|
(4,395
|
)
|
||||
|
Net cash used in financing activities
|
(35,035
|
)
|
(81,546
|
)
|
||||
|
Effect of exchange rate changes on cash and cash equivalents
|
9,798
|
(18,704
|
)
|
|||||
|
Net increase (decrease) in cash and cash equivalents
|
9,907
|
(2,308
|
)
|
|||||
|
Cash and cash equivalents at beginning of period
|
26,626
|
28,934
|
||||||
|
Cash and cash equivalents at end of period
|
$
|
36,533
|
$
|
26,626
|
||||
|
Supplemental Information
|
||||||||
|
Year Ended December 31,
|
2025
|
2024
|
||||||
|
Dividends paid per share
|
$
|
1.64
|
$
|
1.64
|
||||
|
Sensient Technologies Corporation
(In thousands, except percentages and per share amounts)
(Unaudited)
|
Page 9
|
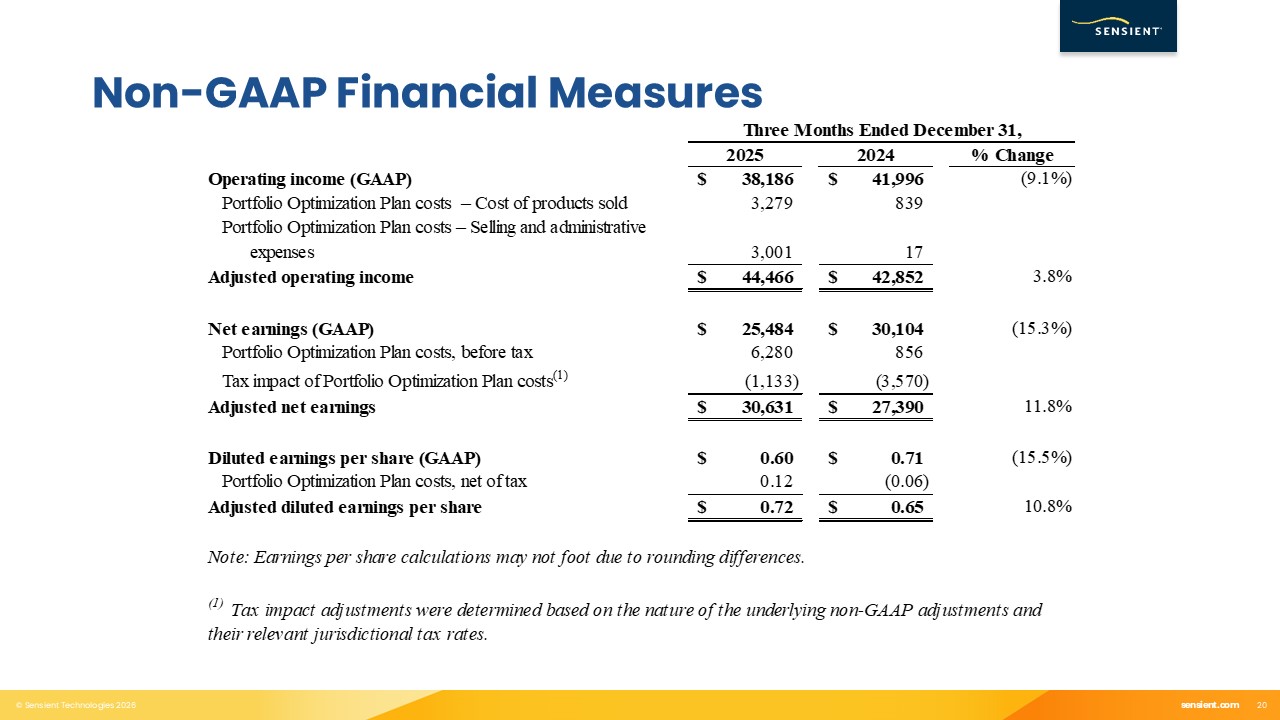
Reconciliation of Non-GAAP Amounts
The Company's results for the three and twelve months ended December 31, 2025 and 2024 include adjusted operating
income, adjusted net earnings, and adjusted diluted earnings per share, which, in each case, exclude Portfolio Optimization Plan costs.
|
Three Months Ended December 31,
|
Year Ended December 31,
|
|||||||||||||||||||||||
|
2025
|
2024
|
% Change
|
2025
|
2024
|
% Change
|
|||||||||||||||||||
|
Operating income (GAAP)
|
$
|
38,186
|
$
|
41,996
|
(9.1
|
%)
|
$
|
207,128
|
$
|
191,579
|
8.1
|
%
|
||||||||||||
|
Portfolio Optimization Plan costs – Cost of products sold
|
3,279
|
839
|
7,531
|
1,362
|
||||||||||||||||||||
|
Portfolio Optimization Plan costs – Selling and administrative expenses
|
3,001
|
17
|
8,275
|
5,269
|
||||||||||||||||||||
|
Adjusted operating income
|
$
|
44,466
|
$
|
42,852
|
3.8
|
%
|
$
|
222,934
|
$
|
198,210
|
12.5
|
%
|
||||||||||||
|
|
||||||||||||||||||||||||
|
Net earnings (GAAP)
|
$
|
25,484
|
$
|
30,104
|
(15.3
|
%)
|
$
|
134,489
|
$
|
124,666
|
7.9
|
%
|
||||||||||||
|
Portfolio Optimization Plan costs, before tax
|
6,280
|
856
|
15,806
|
6,631
|
||||||||||||||||||||
|
Tax impact of Portfolio Optimization Plan costs(1)
|
(1,133
|
)
|
(3,570
|
)
|
(2,001
|
)
|
(4,156
|
)
|
||||||||||||||||
|
Adjusted net earnings
|
$
|
30,631
|
$
|
27,390
|
11.8
|
%
|
$
|
148,294
|
$
|
127,141
|
16.6
|
%
|
||||||||||||
|
|
||||||||||||||||||||||||
|
Diluted earnings per share (GAAP)
|
$
|
0.60
|
$
|
0.71
|
(15.5
|
%)
|
$
|
3.16
|
$
|
2.94
|
7.5
|
%
|
||||||||||||
|
Portfolio Optimization Plan costs, net of tax
|
0.12
|
(0.06
|
)
|
0.32
|
0.06
|
|||||||||||||||||||
|
Adjusted diluted earnings per share
|
$
|
0.72
|
$
|
0.65
|
10.8
|
%
|
$
|
3.48
|
$
|
3.00
|
16.0
|
%
|
||||||||||||
Note: Earnings per share calculations may not foot due to rounding differences.
(1) Tax impact adjustments were determined based on the nature of the underlying non-GAAP adjustments and their relevant
jurisdictional tax rates.
|
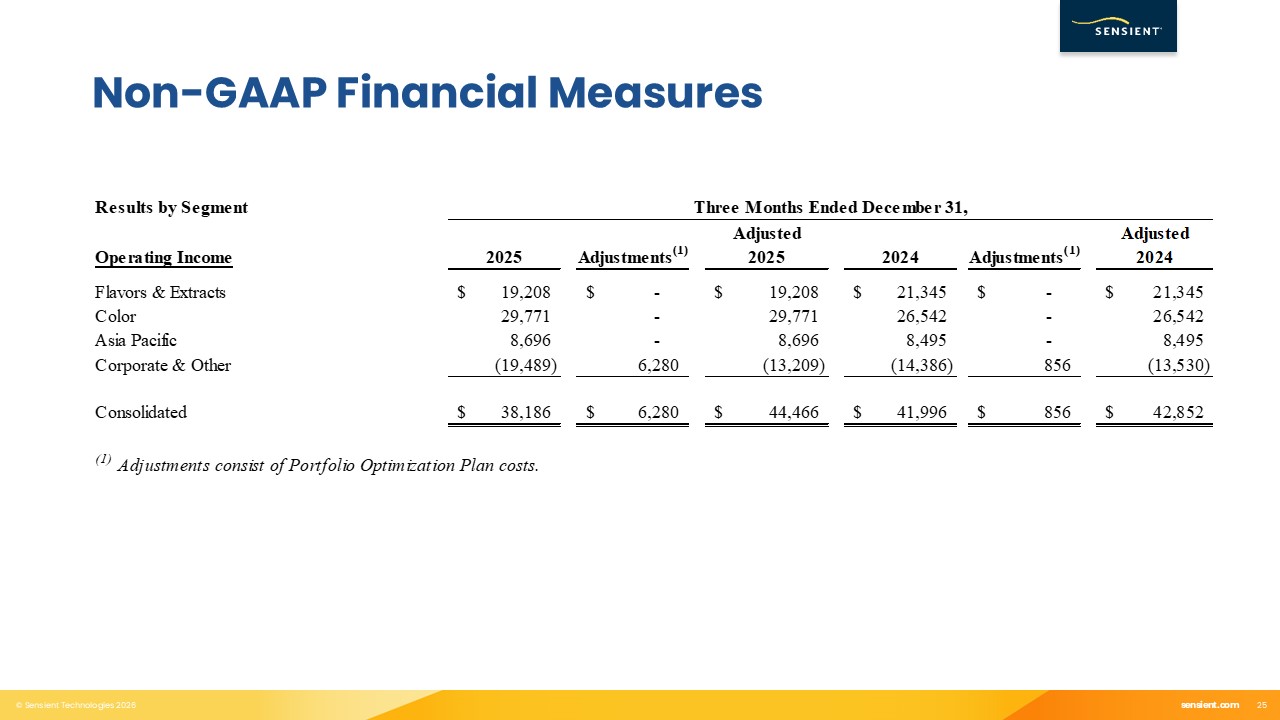
Results by Segment
|
Three Months Ended December 31,
|
|||||||||||||||||||||||
|
Adjusted
|
Adjusted
|
|||||||||||||||||||||||
|
Operating Income
|
2025
|
Adjustments(2)
|
2025
|
2024
|
Adjustments(2)
|
2024
|
||||||||||||||||||
|
Flavors & Extracts
|
$
|
19,208
|
$
|
-
|
$
|
19,208
|
$
|
21,345
|
$
|
-
|
$
|
21,345
|
||||||||||||
|
Color
|
29,771
|
-
|
29,771
|
26,542
|
-
|
26,542
|
||||||||||||||||||
|
Asia Pacific
|
8,696
|
-
|
8,696
|
8,495
|
-
|
8,495
|
||||||||||||||||||
|
Corporate & Other
|
(19,489
|
)
|
6,280
|
(13,209
|
)
|
(14,386
|
)
|
856
|
(13,530
|
)
|
||||||||||||||
|
Consolidated
|
$
|
38,186
|
$
|
6,280
|
$
|
44,466
|
$
|
41,996
|
$
|
856
|
$
|
42,852
|
||||||||||||
|
Year Ended December 31,
|
||||||||||||||||||||||||
|
Adjusted
|
Adjusted
|
|||||||||||||||||||||||
|
Operating Income
|
2025
|
Adjustments(2)
|
2025
|
2024
|
Adjustments(2)
|
2024
|
||||||||||||||||||
|
Flavors & Extracts
|
$
|
100,741
|
$
|
-
|
$
|
100,741
|
$
|
97,094
|
$
|
-
|
$
|
97,094
|
||||||||||||
|
Color
|
141,279
|
-
|
141,279
|
119,529
|
-
|
119,529
|
||||||||||||||||||
|
Asia Pacific
|
36,622
|
-
|
36,622
|
34,458
|
-
|
34,458
|
||||||||||||||||||
|
Corporate & Other
|
(71,514
|
)
|
15,806
|
(55,708
|
)
|
(59,502
|
)
|
6,631
|
(52,871
|
)
|
||||||||||||||
|
Consolidated
|
$
|
207,128
|
$
|
15,806
|
$
|
222,934
|
$
|
191,579
|
$
|
6,631
|
$
|
198,210
|
||||||||||||
(2) Adjustments consist of Portfolio Optimization Plan costs.
|
Sensient Technologies Corporation
(Unaudited)
|
Page 10
|
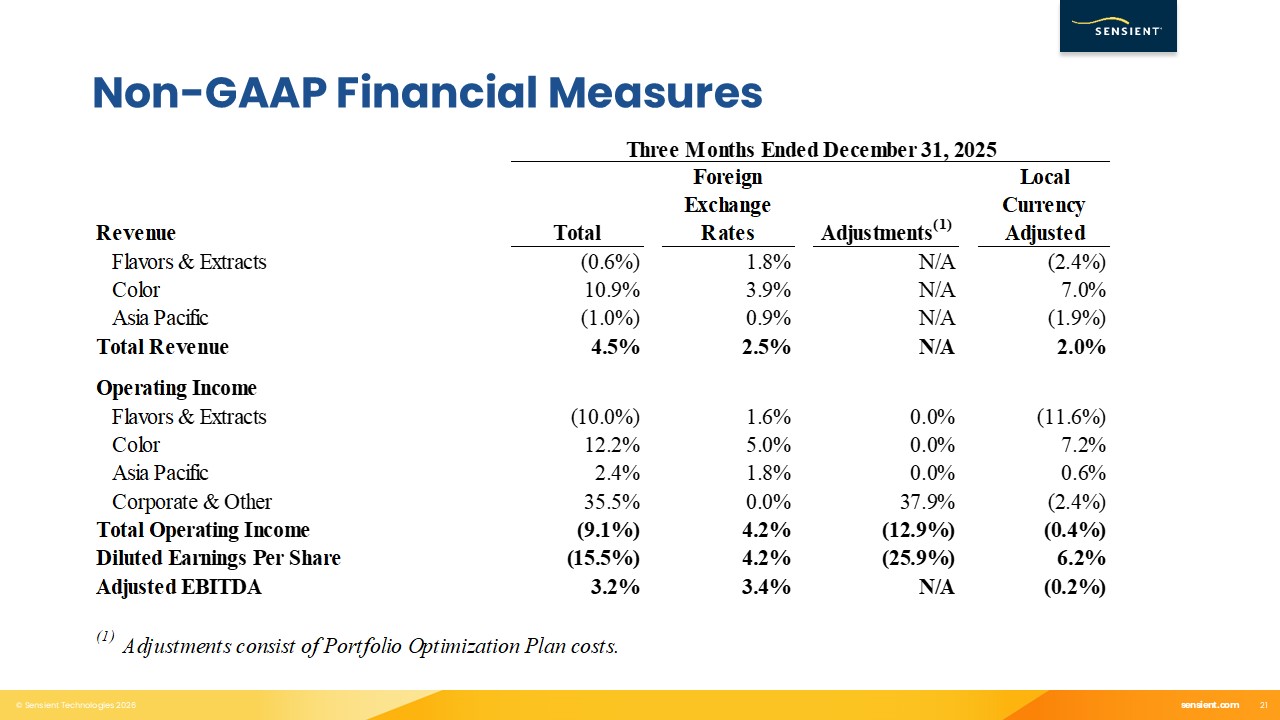
Reconciliation of Non-GAAP Amounts - Continued
The following table summarizes the percentage change in the 2025 results compared to the 2024 results for the corresponding
periods.
|
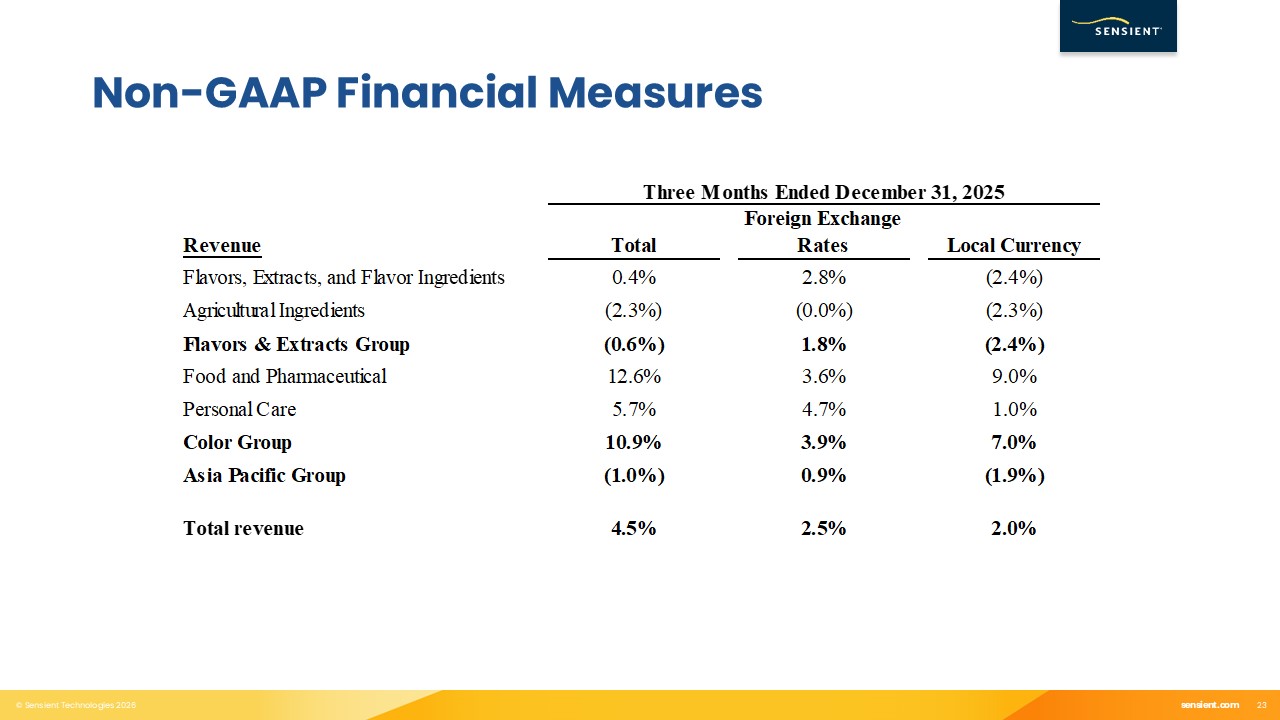
Three Months Ended December 31, 2025
|
||||||||||||||||
|
Revenue
|
Total
|
Foreign
Exchange
Rates
|
Adjustments(3)
|
Local
Currency
Adjusted
|
||||||||||||
|
Flavors & Extracts
|
(0.6
|
%)
|
1.8
|
%
|
N/A
|
(2.4
|
%)
|
|||||||||
|
Color
|
10.9
|
%
|
3.9
|
%
|
N/A
|
7.0
|
%
|
|||||||||
|
Asia Pacific
|
(1.0
|
%)
|
0.9
|
%
|
N/A
|
(1.9
|
%)
|
|||||||||
|
Total Revenue
|
4.5
|
%
|
2.5
|
%
|
N/A
|
2.0
|
%
|
|||||||||
|
Operating Income
|
||||||||||||||||
|
Flavors & Extracts
|
(10.0
|
%)
|
1.6
|
%
|
0.0
|
%
|
(11.6
|
%)
|
||||||||
|
Color
|
12.2
|
%
|
5.0
|
%
|
0.0
|
%
|
7.2
|
%
|
||||||||
|
Asia Pacific
|
2.4
|
%
|
1.8
|
%
|
0.0
|
%
|
0.6
|
%
|
||||||||
|
Corporate & Other
|
35.5
|
%
|
0.0
|
%
|
37.9
|
%
|
(2.4
|
%)
|
||||||||
|
Total Operating Income
|
(9.1
|
%)
|
4.2
|
%
|
(12.9
|
%)
|
(0.4
|
%)
|
||||||||
|
Diluted Earnings Per Share
|
(15.5
|
%)
|
4.2
|
%
|
(25.9
|
%)
|
6.2
|
%
|
||||||||
|
Adjusted EBITDA
|
3.2
|
%
|
3.4
|
%
|
N/A
|
(0.2
|
%)
|
|||||||||
|
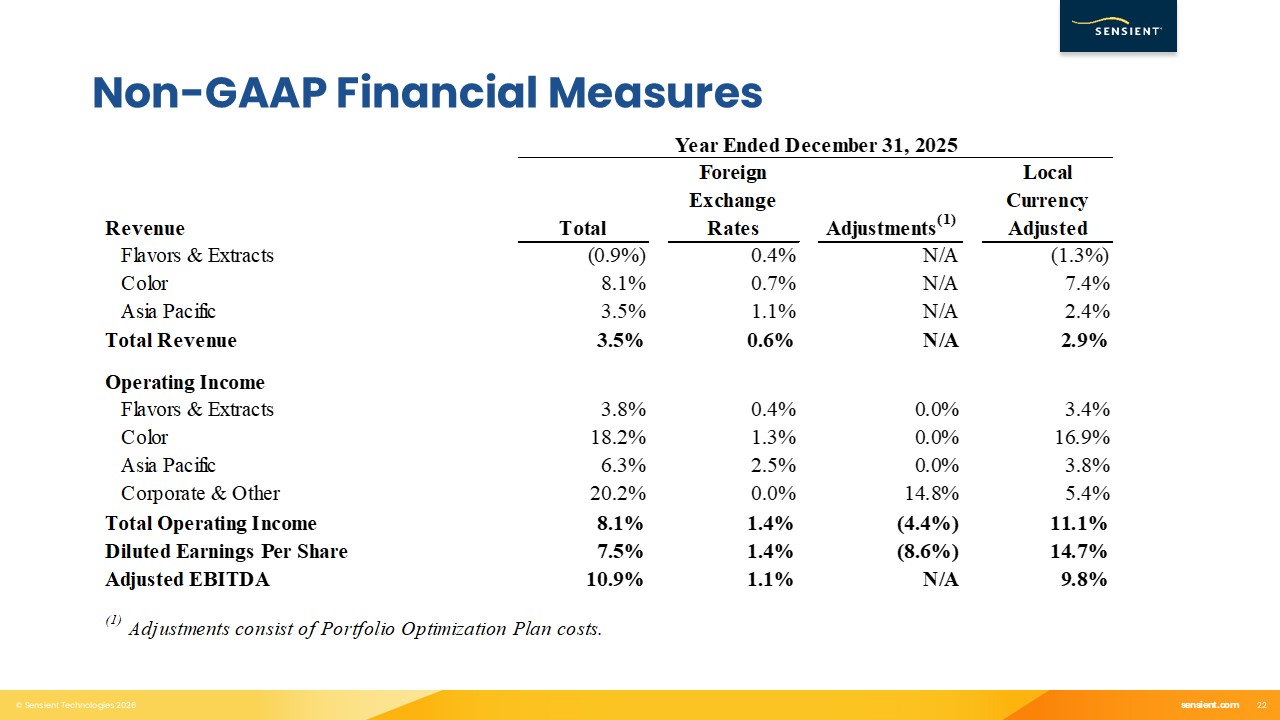
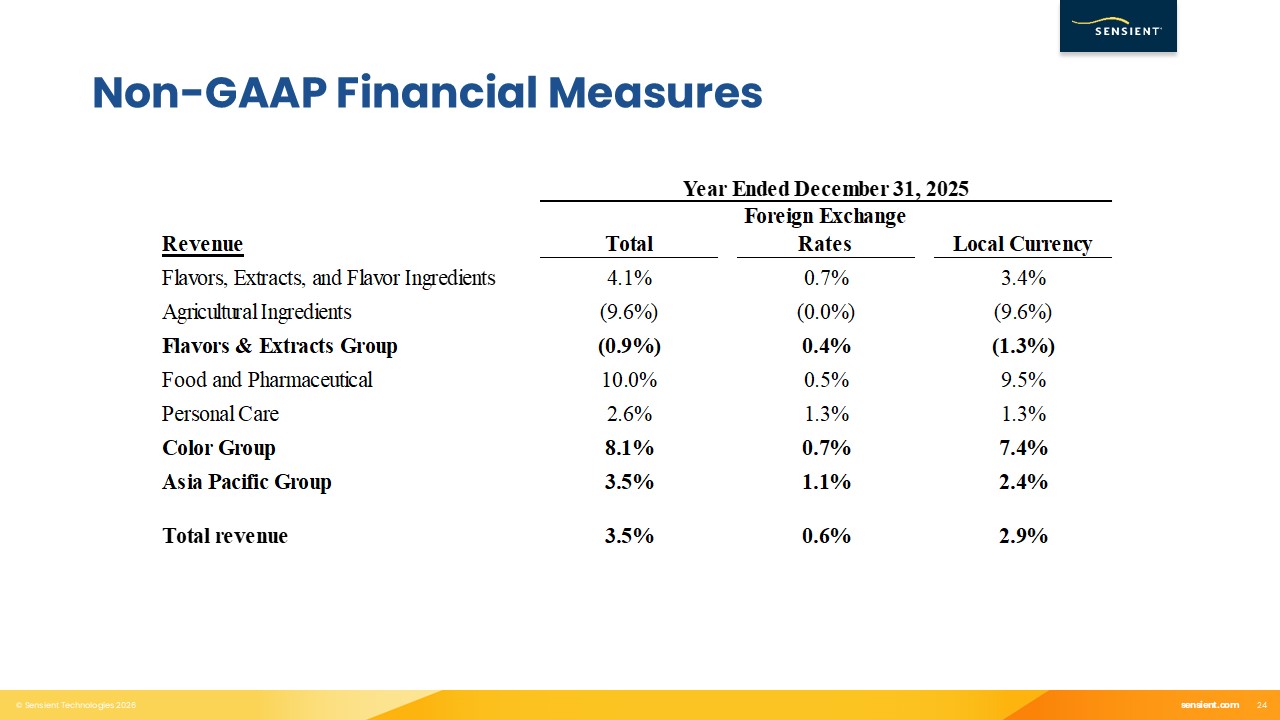
Year Ended December 31, 2025
|
||||||||||||||||
|
Revenue
|
Total
|
Foreign
Exchange
Rates
|
Adjustments(3)
|
Local
Currency
Adjusted
|
||||||||||||
|
Flavors & Extracts
|
(0.9
|
%)
|
0.4
|
%
|
N/A
|
(1.3
|
%)
|
|||||||||
|
Color
|
8.1
|
%
|
0.7
|
%
|
N/A
|
7.4
|
%
|
|||||||||
|
Asia Pacific
|
3.5
|
%
|
1.1
|
%
|
N/A
|
2.4
|
%
|
|||||||||
|
Total Revenue
|
3.5
|
%
|
0.6
|
%
|
N/A
|
2.9
|
%
|
|||||||||
|
Operating Income
|
||||||||||||||||
|
Flavors & Extracts
|
3.8
|
%
|
0.4
|
%
|
0.0
|
%
|
3.4
|
%
|
||||||||
|
Color
|
18.2
|
%
|
1.3
|
%
|
0.0
|
%
|
16.9
|
%
|
||||||||
|
Asia Pacific
|
6.3
|
%
|
2.5
|
%
|
0.0
|
%
|
3.8
|
%
|
||||||||
|
Corporate & Other
|
20.2
|
%
|
0.0
|
%
|
14.8
|
%
|
5.4
|
%
|
||||||||
|
Total Operating Income
|
8.1
|
%
|
1.4
|
%
|
(4.4
|
%)
|
11.1
|
%
|
||||||||
|
Diluted Earnings Per Share
|
7.5
|
%
|
1.4
|
%
|
(8.6
|
%)
|
14.7
|
%
|
||||||||
|
Adjusted EBITDA
|
10.9
|
%
|
1.1
|
%
|
N/A
|
9.8
|
%
|
|||||||||
(3) Adjustments consist of Portfolio Optimization Plan costs.
|
Sensient Technologies Corporation
(In thousands, except percentages)
(Unaudited)
|
Page 11
|
Reconciliation of Non-GAAP Amounts - Continued
The following table summarizes the reconciliation between Operating Income (GAAP) and Adjusted EBITDA for the three and
twelve months ended December 31, 2025 and 2024.
|
Three Months Ended December 31,
|
Year Ended December 31,
|
|||||||||||||||||||||||
|
2025
|
2024
|
% Change
|
2025
|
2024
|
% Change
|
|||||||||||||||||||
|
Operating income (GAAP)
|
$
|
38,186
|
$
|
41,996
|
(9.1
|
%)
|
$
|
207,128
|
$
|
191,579
|
8.1
|
%
|
||||||||||||
|
Depreciation and amortization
|
15,208
|
15,144
|
61,098
|
60,329
|
||||||||||||||||||||
|
Share-based compensation expense
|
3,362
|
3,104
|
13,946
|
10,084
|
||||||||||||||||||||
|
Portfolio Optimization Plan costs, before tax
|
6,280
|
856
|
15,806
|
6,631
|
||||||||||||||||||||
|
Adjusted EBITDA
|
$
|
63,036
|
$
|
61,100
|
3.2
|
%
|
$
|
297,978
|
$
|
268,623
|
10.9
|
%
|
||||||||||||
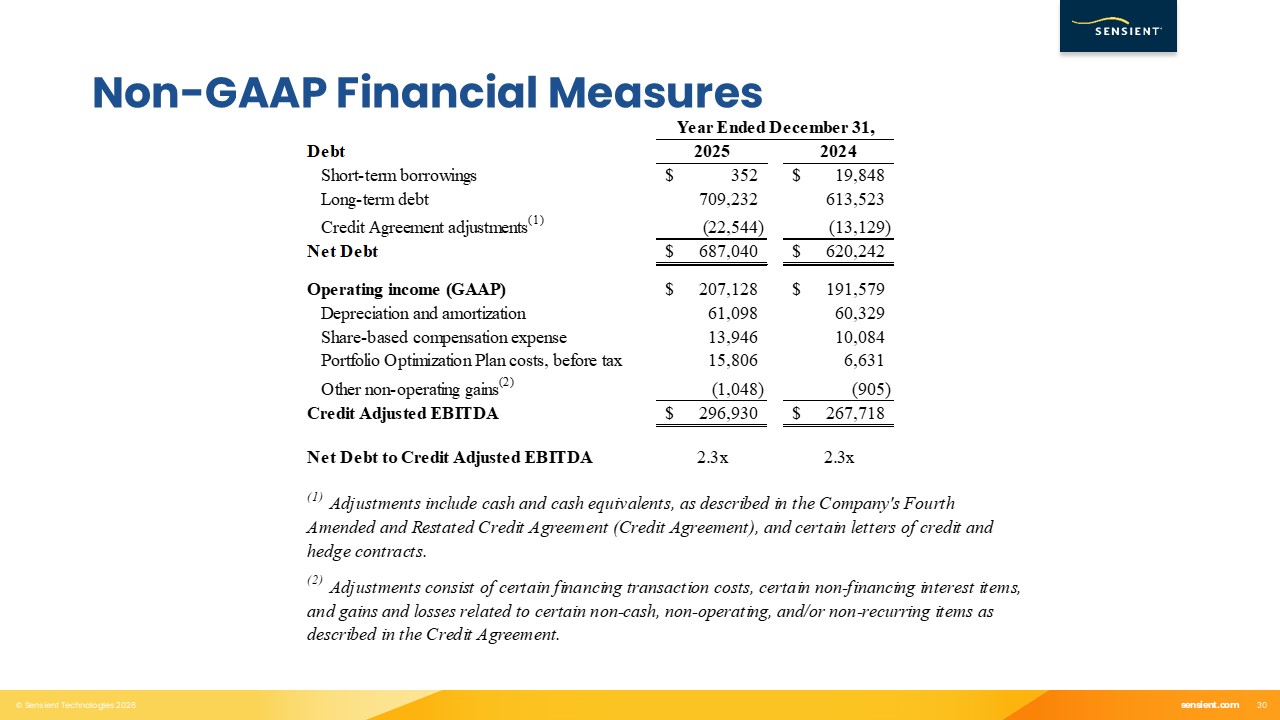
The following table summarizes the reconciliation between Debt (GAAP) and Net Debt, and Operating Income (GAAP) and Credit Adjusted EBITDA for
the year ended December 31, 2025 and 2024.
|
Year Ended December 31,
|
||||||||
|
Debt
|
2025
|
2024
|
||||||
|
Short-term borrowings
|
$
|
352
|
$
|
19,848
|
||||
|
Long-term debt
|
709,232
|
613,523
|
||||||
|
Credit Agreement adjustments(4)
|
(22,544
|
)
|
(13,129
|
)
|
||||
|
Net Debt
|
$
|
687,040
|
$
|
620,242
|
||||
|
|
||||||||
|
Operating income (GAAP)
|
$
|
207,128
|
$
|
191,579
|
||||
|
Depreciation and amortization
|
61,098
|
60,329
|
||||||
|
Share-based compensation expense
|
13,946
|
10,084
|
||||||
|
Portfolio Optimization Plan costs, before tax
|
15,806
|
6,631
|
||||||
|
Other non-operating gains(5)
|
(1,048
|
)
|
(905
|
)
|
||||
|
Credit Adjusted EBITDA
|
$
|
296,930
|
$
|
267,718
|
||||
|
|
||||||||
|
Net Debt to Credit Adjusted EBITDA
|
2.3x
|
|
2.3x
|
|
||||
(4) Adjustments include cash and cash equivalents, as described in the Company's Fourth Amended and Restated
Credit Agreement (Credit Agreement), and certain letters of credit and hedge contracts.
(5) Adjustments consist of certain financing transaction costs, certain non-financing interest items, and gains
and losses related to certain non-cash, non-operating, and/or non-recurring items as described in the Credit Agreement.
We have included each of these non-GAAP measures in order to provide additional information regarding our underlying operating results and
comparable period-over-period performance. Such information is supplemental to information presented in accordance with GAAP and is not intended to represent a presentation in accordance with GAAP. These non-GAAP measures should not be
considered in isolation. Rather, they should be considered together with GAAP measures and the rest of the information included in this release and our SEC filings. Management internally reviews each of these non-GAAP measures to evaluate
performance on a comparative period-to-period basis and to gain additional insight into underlying operating and performance trends, and we believe the information can be beneficial to investors for the same purposes. These non-GAAP measures
may not be comparable to similarly titled measures used by other companies.
Exhibit 99.2