
TFC 8-K
Truist Financial Corp (TFC)
8-K
2022-10-18
For: 2022-10-18
View Original
Added on
April 05, 2026
UNITED STATES
SECURITIES AND EXCHANGE COMMISSION
Washington, D.C. 20549
_____________________________________________
Form 8-K
Current Report
_____________________________________________
Pursuant to Section 13 or 15(d)
of the Securities Exchange Act of 1934
Date of Report (Date of earliest event reported)
(Exact name of registrant as specified in its charter)
_____________________________________________
(State or other jurisdiction of incorporation) | (Commission File Number) | (I.R.S. Employer Identification No.) | ||||||
(Address of principal executive offices) | (Zip Code) | |||||||
(336 ) 733-2000
(Registrant’s telephone number, including area code)
_____________________________________________
Check the appropriate box below if the Form 8-K filing is intended to simultaneously satisfy the filing obligation of the registrant under any of the following provisions:
Securities registered pursuant to Section 12(b) of the Act:
| Title of each class | Trading Symbol | Name of each exchange on which registered | ||||||||||||
Indicate by check mark whether the registrant is an emerging growth company as defined in Rule 405 of the Securities Act of 1933 (§230.405 of this chapter) or Rule 12b-2 of the Securities Exchange Act of 1934 (§240.12b-2 of this chapter).
Emerging growth company ☐
If an emerging growth company, indicate by check mark if the registrant has elected not to use the extended transition period for complying with any new or revised financial accounting standards provided pursuant to Section 13(a) of the Exchange Act. ¨
ITEM 2.02 Results of Operations and Financial Condition.
On October 18, 2022, Truist Financial Corporation (“Truist”) issued a press release reporting third quarter 2022 results and posted on its website its third quarter 2022 Earnings Release, Quarterly Performance Summary, and Earnings Release Presentation. The materials contain forward-looking statements regarding Truist and include cautionary language identifying important factors that could cause actual results to differ materially from those anticipated. The Earnings Release, Quarterly Performance Summary, and Earnings Release Presentation are furnished as Exhibits 99.1, 99.2, and 99.3, respectively. Consequently, they are not deemed “filed” for purposes of Section 18 of the Securities Exchange Act of 1934 or otherwise subject to the liabilities of that section. Such materials may only be incorporated by reference into another filing under the Exchange Act or Securities Act of 1933 if such subsequent filing specifically references this Form 8-K. All information in the Earnings Release, Quarterly Performance Summary, and Earnings Release Presentation speaks as of the date thereof, and Truist does not assume any obligation to update such information in the future.
ITEM 9.01 Financial Statements and Exhibits.
(d) Exhibits
| Exhibit No. | Description of Exhibit | |||||||
| Earnings Release issued October 18, 2022. | ||||||||
| Quarterly Performance Summary issued October 18, 2022. | ||||||||
| Earnings Release Presentation issued October 18, 2022. | ||||||||
| 104 | The cover page from this Current Report on Form 8-K, formatted in Inline XBRL. | |||||||
SIGNATURE
Pursuant to the requirements of the Securities Exchange Act of 1934, the registrant has duly caused this report to be signed on its behalf by the undersigned hereunto duly authorized.
TRUIST FINANCIAL CORPORATION | ||||||||
(Registrant) | ||||||||
| By: | /s/ Cynthia B. Powell | |||||||
Cynthia B. Powell | ||||||||
Executive Vice President and Corporate Controller | ||||||||
(Principal Accounting Officer) | ||||||||
Date: October 18, 2022
`
 | News Release | |||||||
| Contact: | ||||||||
| Investors: | Ankur Vyas 404.827.6714 | [email protected] | |||||||
| Media: | Shelley Miller 704.692.1518 | [email protected] | |||||||
Truist reports third quarter 2022 results
Third quarter 2022 GAAP earnings of $1.5 billion, or $1.15 per diluted share
Third quarter 2022 Adjusted earnings of $1.7 billion, or $1.24 per diluted share
Results reflect strong loan growth and expanded NIM given higher rates and strong deposit franchise
Fee revenues tempered by market conditions
Capital, liquidity, and credit quality remain strengths
CHARLOTTE, N.C., (October 18, 2022) — Truist Financial Corporation (NYSE: TFC) today reported earnings for the third quarter of 2022.
Net income available to common shareholders of $1.5 billion was down 5.0% from the third quarter of 2021. Earnings per diluted common share were $1.15, a decrease of 4.2% compared with the same period last year. Results for the third quarter produced an annualized return on average assets (ROA) of 1.19%, an annualized return on average common shareholders’ equity (ROCE) of 10.7%, and an annualized return on tangible common shareholders’ equity (ROTCE) of 23.5%.
Adjusted net income available to common shareholders was $1.7 billion, or $1.24 per diluted share, excluding merger-related and restructuring charges of $62 million ($48 million after-tax) and incremental operating expenses related to the merger of $90 million ($69 million after-tax). Adjusted results produced an annualized ROA of 1.28%, an annualized ROCE of 11.5%, and an annualized ROTCE of 25.1%.
“Truist’s third-quarter performance reflected strong progress in many areas of the business, as we delivered strong broad-based loan growth, significant margin expansion and continued exceptional asset quality. Overall financial results were mixed, however, as the challenging market environment impacted our capital markets related revenue,” said Chairman and CEO Bill Rogers.
“Our company purpose continues to drive our actions to care for our teammates, clients and the communities we serve, and this was even more apparent in the aftermath of Hurricane Ian, when our teammates acted quickly to support each other and our local communities through humanitarian aid and volunteer efforts. We were able to quickly deploy a $1.25 million philanthropic donation from the Truist Foundation to support the communities most impacted, and we’ll continue to care for these communities as they rebuild and recover from this deadly and disastrous storm.
“More broadly, I continue to remain highly confident in Truist’s trajectory given the diversity of our business mix, our strong markets, conservative risk culture, and the substantial opportunities that lie ahead post integration.”
- 1 -
Third Quarter 2022 Performance Highlights
•Earnings per diluted common share for the third quarter of 2022 were $1.15
◦Adjusted diluted earnings per share were $1.24, up $0.04 per share, or 3.3%, compared to second quarter 2022 and down $0.18 per share, or 13%, compared to third quarter 2021
▪Decline compared to third quarter 2021 impacted by a reserve release in the prior quarter
◦ROA was 1.19%; adjusted ROA was 1.28%
◦ROCE was 10.7%; adjusted ROCE was 11.5%
◦ROTCE was 23.5%; adjusted ROTCE was 25.1%
•Pre-provision net revenue (PPNR) for the third quarter of 2022 was $2.3 billion, up 8.0% compared to second quarter 2022 and 24% compared to third quarter 2021
◦Adjusted PPNR was up 4.9% compared to second quarter 2022 and 8.3% compared to third quarter 2021
◦GAAP operating leverage was 920 basis points compared to the third quarter of 2021 and 540 basis points year-to-date 2022 compared to 2021
◦Adjusted operating leverage was 260 basis points compared to the third quarter of 2021 and (50) basis points year-to-date 2022 compared to 2021
•Taxable-equivalent revenue for the third quarter of 2022 was $5.9 billion, up 3.6% compared to second quarter 2022 and up 4.6% compared to third quarter 2021
◦Taxable-equivalent net interest income was up 10% compared to second quarter 2022 and up 16% compared to third quarter 2021
▪The increase compared to second quarter 2022 was primarily due to higher market interest rates coupled with well controlled deposit costs and loan growth, partially offset by lower purchase accounting accretion
◦Noninterest income was down 6.5% compared to second quarter 2022 and down 11% compared to third quarter 2021
▪The decline compared to the second quarter of 2022 was primarily due to seasonally lower insurance revenues and lower investment banking revenues due to continued challenging capital markets conditions
▪The decline compared to the third quarter of 2021 was primarily due to lower residential mortgage, investment banking and other income, partially offset by growth in insurance revenues
◦Net interest margin was 3.12%, up 23 basis points from second quarter 2022
▪Core net interest margin was 3.02%, up 30 basis points from second quarter 2022, driven by higher market interest rates coupled with well controlled deposit costs
•Noninterest expense for the third quarter of 2022 was $3.6 billion, up 0.9% compared to second quarter 2022 and down 4.8% compared to third quarter 2021
◦Adjusted noninterest expense was $3.3 billion, up $83 million, or 2.6%, compared to second quarter 2022 due to higher professional fees, personnel expenses, and operational losses
◦Adjusted noninterest expenses increased $64 million, or 2.0%, compared to third quarter 2021 primarily due to higher operational losses, professional fees and marketing costs, partially offset by lower equipment, personnel, and software expenses
◦GAAP efficiency ratio was 61.8%, compared to 63.3% for second quarter 2022
◦Adjusted efficiency ratio was 56.4%, compared to 57.0% for second quarter 2022
- 2 -
•Average loans and leases held for investment for the third quarter of 2022 were $309.4 billion, up $12.7 billion, or 4.3%, compared to the second quarter of 2022
◦Average commercial loans were up $6.3 billion, or 3.7%, driven by broad based growth within the commercial and industrial portfolio
◦Average consumer loans were up $6.3 billion, or 5.3%, with growth across all portfolios except student lending
•Asset quality remains excellent, reflecting Truist’s prudent risk culture and diverse portfolio
◦Net charge-offs were 0.27% of average loans and leases, up five basis points compared to second quarter 2022
◦The ALLL ratio was 1.34% compared to 1.38% for second quarter 2022
▪The ALLL coverage ratio was 4.98X annualized net charge-offs, versus 6.54X for second quarter 2022
•Capital and liquidity levels remained strong; deployed capital through organic loan growth, dividends, and acquisition
◦Common equity tier 1 to risk-weighted assets was 9.1%
◦Increased common dividend of 8% for the third quarter 2022
◦Acquired BenefitMall, the nation’s largest benefits wholesale general insurance agency, effective September 1, 2022
◦Consolidated average LCR ratio was 111%
| EARNINGS HIGHLIGHTS | Change 3Q22 vs. | ||||||||||||||||
| (dollars in millions, except per share data) | 3Q22 | 2Q22 | 3Q21 | 2Q22 | 3Q21 | ||||||||||||
| Net income available to common shareholders | $ | 1,536 | $ | 1,454 | $ | 1,616 | $ | 82 | $ | (80) | |||||||
| Diluted earnings per common share | 1.15 | 1.09 | 1.20 | 0.06 | (0.05) | ||||||||||||
| Net interest income - taxable equivalent | $ | 3,783 | $ | 3,435 | $ | 3,261 | $ | 348 | $ | 522 | |||||||
| Noninterest income | 2,102 | 2,248 | 2,365 | (146) | (263) | ||||||||||||
| Total taxable-equivalent revenue | $ | 5,885 | $ | 5,683 | $ | 5,626 | $ | 202 | $ | 259 | |||||||
| Less taxable-equivalent adjustment | 38 | 28 | 28 | ||||||||||||||
| Total revenue | $ | 5,847 | $ | 5,655 | $ | 5,598 | |||||||||||
| Return on average assets | 1.19 | % | 1.14 | % | 1.28 | % | 0.05 | % | (0.09) | % | |||||||
| Return on average risk-weighted assets (current quarter is preliminary) | 1.55 | 1.52 | 1.77 | 0.03 | (0.22) | ||||||||||||
| Return on average common shareholders’ equity | 10.7 | 10.3 | 10.2 | 0.4 | 0.5 | ||||||||||||
Return on average tangible common shareholders’ equity (1) | 23.5 | 22.7 | 19.3 | 0.8 | 4.2 | ||||||||||||
| Net interest margin - taxable equivalent | 3.12 | 2.89 | 2.81 | 0.23 | 0.31 | ||||||||||||
(1)Excludes certain items as detailed in the non-GAAP reconciliations in the Quarterly Performance Summary.
Third Quarter 2022 compared to Second Quarter 2022
Total taxable-equivalent revenue was $5.9 billion for the third quarter of 2022, an increase of $202 million, or 3.6%, compared to the prior quarter.
Taxable-equivalent net interest income for the third quarter of 2022 was up $348 million, or 10%, compared to the prior quarter due primarily to higher market interest rates coupled with well controlled deposits costs and loan growth, partially offset by lower purchase accounting accretion. Average earning assets increased $6.5 billion, or 1.4%, due to growth in average total loans of $12.0 billion, or 4.0%, partially offset by a decrease in average securities of $3.3 billion, or 2.2%. Average deposits decreased $3.7 billion, or 0.9%, while average short-term borrowings increased $7.8 billion, or 81%.
- 3 -
The net interest margin was 3.12% for the third quarter, up 23 basis points compared to the prior quarter. The yield on the total loan portfolio for the third quarter was 4.49%, up 58 basis points compared to the prior quarter primarily due to higher market interest rates, partially offset by lower purchase accounting accretion. The yield on the average securities portfolio for the third quarter was 1.95%, up 13 basis points compared to the prior quarter primarily due to the higher rate environment. Core net interest margin was 3.02% for the third quarter, up 30 basis points compared to the prior quarter driven primarily by higher market interest rates coupled with well controlled deposit costs.
The average cost of total deposits was 0.31%, up 22 basis points compared to the prior quarter. The average cost of short-term borrowings was 2.34%, up 108 basis points compared to the prior quarter. The average cost of long-term debt was 2.43%, up 68 basis points compared to the prior quarter. The increase in rates on deposits and other funding sources was largely attributable to the higher rate environment.
The provision for credit losses was $234 million for the third quarter, compared to $171 million for the prior quarter. The increase in the current quarter provision expense primarily reflects higher net charge-offs. Net charge-offs for the third quarter of 2022 totaled $213 million compared to $159 million for the prior quarter. The net charge-off ratio for the current quarter of 0.27% was up five basis points compared to second quarter 2022, primarily driven by normalizing trends and seasonality across certain consumer loan portfolios.
Noninterest income was $2.1 billion, a decrease of $146 million, or 6.5%, compared to the prior quarter. Insurance income decreased $100 million, or 12%, primarily due to seasonally lower property and casualty commissions. Investment banking and trading income decreased $33 million, or 13%, primarily due to lower structured real estate, bond originations and loan syndication fees, partially offset by higher merger and acquisitions fees. Lending related fees decreased $20 million, or 20%, primarily due to gains in the prior quarter. Commercial mortgage banking income increased $24 million, or 92%, primarily due to higher production income and higher valuations. Other income decreased primarily due to valuation related marks.
Noninterest expense was $3.6 billion for the third quarter, up $33 million, or 0.9%, compared to the prior quarter. Merger-related and restructuring charges and incremental operating expenses related to the merger decreased $59 million and $27 million, respectively, compared to second quarter 2022, given diminishing integration-related activities. The prior quarter included a $39 million gain on the redemption of FHLB advances. Excluding the aforementioned items and the amortization of intangibles, adjusted noninterest expense increased $83 million, or 2.6%, compared to the prior quarter. Personnel expense increased $14 million ($23 million, or 1.1%, on an adjusted basis) compared to second quarter 2022 due to investments in revenue producing businesses and enterprise technology along with additional personnel expenses from the BenefitMall acquisition. Professional services and outside processing was stable, but was up $34 million, or 14%, on an adjusted basis primarily due to increased project spend for enterprise technology investments. Other expense increased primarily due to higher operational losses.
The provision for income taxes was $363 million for the third quarter of 2022, compared to $372 million for the prior quarter. The effective tax rate for the third quarter of 2022 was 18.2%, compared to 19.5% for the prior quarter. The decrease in the effective tax rate was primarily driven by discrete tax benefits recognized in the current quarter and changes in the full year forecasted effective tax rate.
- 4 -
Third Quarter 2022 compared to Third Quarter 2021
Total taxable-equivalent revenues were $5.9 billion for the third quarter of 2022, an increase of $259 million, or 4.6%, compared to the earlier quarter.
Taxable equivalent net interest income for the third quarter of 2022 was up $522 million, or 16%, compared to the earlier quarter primarily due to strong loan growth, higher market interest rates coupled with well controlled deposit costs and solid deposit growth. These increases were partially offset by lower purchase accounting accretion and lower PPP revenue. Average earning assets increased $20.6 billion, or 4.5%, compared to the earlier quarter primarily due to growth in average total loans of $21.5 billion, or 7.4%. Average deposits increased $17.4 billion, or 4.3%, and average short-term borrowings increased $12.0 billion compared to the earlier quarter, while average long-term debt decreased $5.9 billion, or 16%.
Net interest margin was 3.12%, up 31 basis points compared to the earlier quarter. The yield on the total loan portfolio for the third quarter of 2022 was 4.49%, up 59 basis points compared to the earlier quarter, primarily reflecting higher market interest rates, partially offset by lower purchase accounting accretion and lower PPP revenue. The yield on the average securities portfolio was 1.95%, up 45 basis points compared to the earlier quarter primarily due to the higher rate environment. Core net interest margin was 3.02% for the third quarter, up 44 basis points compared to the earlier quarter driven by higher market interest rates coupled with well controlled deposit costs.
The average cost of total deposits was 0.31%, up 28 basis points compared to the earlier quarter. The average cost of short-term borrowings was 2.34%, up 166 basis points compared to the earlier quarter. The average cost of long-term debt was 2.43%, up 82 basis points compared to the earlier quarter. The increase in rates on deposits and other funding sources was largely attributable to the higher rate environment.
The provision for credit losses was $234 million, compared to a benefit of $324 million for the earlier quarter. The earlier quarter included a reserve release due to the improving credit environment during that period. Net charge-offs for the third quarter of 2022 totaled $213 million compared to $135 million in the earlier quarter. The net charge-off ratio for the current quarter of 0.27% was up eight basis points compared to the earlier quarter primarily driven by normalizing trends across certain consumer portfolios.
Noninterest income for the third quarter of 2022 decreased $263 million, or 11%, compared to the earlier quarter. Other income decreased $139 million due to valuation changes from assets held for certain post-retirement benefits, which is primarily offset by lower personnel expense, and lower investment income and valuation marks from the Company’s SBIC and other strategic investments. Residential mortgage income decreased $107 million, or 60%, as lower production income (due to lower margins and refinance volumes resulting from the higher rate environment) was partially offset by higher servicing income (due to lower prepayments and servicing portfolio purchases). Investment banking and trading income decreased $94 million, or 30%, due to lower bond and equity originations and merger and acquisition fees, partially offset by higher trading income. These decreases were partially offset by an increase of $80 million, or 12%, in insurance income due to organic growth and acquisitions.
- 5 -
Noninterest expense for the third quarter of 2022 was down $182 million, or 4.8%, compared to the earlier quarter. Merger-related and restructuring charges decreased $110 million and incremental operating expenses related to the merger decreased $101 million due to diminishing integration-related activities. The earlier quarter included a $30 million professional fee to develop an ongoing program to identify, prioritize, and roadmap teammate generated revenue growth and expense savings opportunities beyond the merger. Excluding the aforementioned items and the amortization of intangibles, adjusted noninterest expense increased $64 million, or 2.0%, compared to the earlier quarter. Other expense increased $81 million ($87 million, or 104%, on an adjusted basis) primarily due to increased operational losses and teammate travel expenses. Professional fees and outside processing expenses decreased $20 million, but was up $70 million, or 33%, on an adjusted basis due to increased project spend for enterprise technology investments and increased call center staffing. Equipment expense decreased $32 million ($38 million, or 25%, on an adjusted basis) primarily due to laptop purchases in the prior period. Software expense decreased $26 million ($24 million, or 9.6%, on an adjusted basis) primarily due to lower maintenance expense and decommissioned software. Personnel expense decreased $71 million ($32 million, or 1.5%, on an adjusted basis) due to lower other employee benefits as a result of the decrease in noninterest income for post-retirement benefits and lower incentives, partially offset by higher salaries due to annual merit increases, investments in revenue producing businesses and enterprise technology, as well as additional personnel costs for acquisitions.
The provision for income taxes was $363 million for the third quarter of 2022, compared to $423 million for the earlier quarter. The effective tax rate for the third quarter of 2022 was 18.2%, compared to 19.9% for the earlier quarter. The decrease in the effective tax rate was primarily driven by an increase in discrete tax benefits and changes in the full year forecasted effective tax rate.
| LOANS AND LEASES | ||||||||||||||
| (dollars in millions) Average balances | 3Q22 | 2Q22 | Change | % Change | ||||||||||
| Commercial: | ||||||||||||||
| Commercial and industrial | $ | 152,123 | $ | 145,558 | $ | 6,565 | 4.5 | % | ||||||
| CRE | 22,245 | 22,508 | (263) | (1.2) | ||||||||||
| Commercial construction | 5,284 | 5,256 | 28 | 0.5 | ||||||||||
| Total commercial | 179,652 | 173,322 | 6,330 | 3.7 | ||||||||||
| Consumer: | ||||||||||||||
| Residential mortgage | 53,271 | 49,237 | 4,034 | 8.2 | ||||||||||
| Residential home equity and direct | 25,394 | 25,124 | 270 | 1.1 | ||||||||||
| Indirect auto | 28,057 | 26,496 | 1,561 | 5.9 | ||||||||||
| Indirect other | 12,300 | 11,471 | 829 | 7.2 | ||||||||||
| Student | 5,958 | 6,331 | (373) | (5.9) | ||||||||||
| Total consumer | 124,980 | 118,659 | 6,321 | 5.3 | ||||||||||
| Credit card | 4,755 | 4,728 | 27 | 0.6 | ||||||||||
| Total loans and leases held for investment | $ | 309,387 | $ | 296,709 | $ | 12,678 | 4.3 | |||||||
Average loans and leases held for investment for the third quarter of 2022 were $309.4 billion, up $12.7 billion, or 4.3%, compared to the second quarter of 2022.
Average commercial loans increased $6.3 billion, or 3.7%, due to broad-based growth of $6.6 billion, or 4.5%, within the commercial and industrial portfolio.
- 6 -
Average consumer loans increased $6.3 billion, or 5.3%, due to a $4.0 billion increase in residential mortgages due to correspondent channel production and lower prepayments. In addition, indirect auto increased $1.6 billion primarily in the prime segment of the portfolio and indirect other increased $829 million primarily due to growth from the Service Finance, recreational lending and Sheffield portfolios, partially offset by runoff in other partnership lending programs. Residential home equity and direct increased $270 million, primarily due to growth from the LightStream portfolio. These increases were partially offset by $373 million of runoff in student loans.
| DEPOSITS | ||||||||||||||
| (dollars in millions) Average balances | 3Q22 | 2Q22 | Change | % Change | ||||||||||
| Noninterest-bearing deposits | $ | 146,041 | $ | 148,610 | $ | (2,569) | (1.7) | % | ||||||
| Interest checking | 111,645 | 112,375 | (730) | (0.6) | ||||||||||
| Money market and savings | 147,659 | 148,632 | (973) | (0.7) | ||||||||||
| Time deposits | 14,751 | 14,133 | 618 | 4.4 | ||||||||||
| Total deposits | $ | 420,096 | $ | 423,750 | $ | (3,654) | (0.9) | |||||||
Average deposits for the third quarter of 2022 were $420.1 billion, a decrease of $3.7 billion, or 0.9%, compared to the prior quarter. The decrease in deposits was primarily driven by the impacts of monetary tightening, as well as higher consumer spending and seasonal patterns. Average noninterest bearing deposits decreased 1.7% compared to the prior quarter and represented 34.8% of total deposits for the third quarter of 2022. Average money market and savings and interest checking declined 0.7% and 0.6%, respectively, compared to the prior quarter. Average time deposits increased 4.4% primarily due to an increase in negotiable certificates of deposit.
| CAPITAL RATIOS | 3Q22 | 2Q22 | 1Q22 | 4Q21 | 3Q21 | ||||||||||||
| Risk-based: | (preliminary) | ||||||||||||||||
| Common equity Tier 1 | 9.1 | % | 9.2 | % | 9.4 | % | 9.6 | % | 10.1 | % | |||||||
| Tier 1 | 10.7 | 10.8 | 11.0 | 11.3 | 11.9 | ||||||||||||
| Total | 12.6 | 12.6 | 13.0 | 13.2 | 13.9 | ||||||||||||
| Leverage | 8.5 | 8.6 | 8.6 | 8.7 | 9.0 | ||||||||||||
| Supplementary leverage | 7.3 | 7.3 | 7.3 | 7.4 | 7.8 | ||||||||||||
Capital ratios remained strong compared to the regulatory requirements for well capitalized banks. Truist declared common dividends of $0.52 per share during the third quarter of 2022, an increase of 8% compared to the prior quarter. The dividend payout ratio for the third quarter of 2022 was 45%. Truist did not repurchase any shares in the third quarter of 2022.
Truist CET1 ratio was 9.1% as of September 30, 2022. The decline compared to the June 30, 2022 CET1 ratio primarily reflects the BenefitMall acquisition and strong loan growth.
Truist’s average LCR was 111% for the three months ended September 30, 2022, compared to the regulatory minimum of 100%. Truist continues to maintain a strong liquidity position and is well prepared to meet the funding needs of its clients.
- 7 -
| ASSET QUALITY | |||||||||||||||||
| (dollars in millions) | 3Q22 | 2Q22 | 1Q22 | 4Q21 | 3Q21 | ||||||||||||
| Total nonperforming assets | $ | 1,240 | $ | 1,173 | $ | 1,135 | $ | 1,163 | $ | 1,204 | |||||||
| Total performing TDRs | 1,873 | 1,693 | 1,515 | 1,390 | 1,475 | ||||||||||||
| Total loans 90 days past due and still accruing | 1,709 | 1,787 | 1,914 | 1,930 | 1,872 | ||||||||||||
| Total loans 30-89 days past due | 1,957 | 2,091 | 2,101 | 2,044 | 1,823 | ||||||||||||
Nonperforming loans and leases as a percentage of loans and leases held for investment | 0.35 | % | 0.36 | % | 0.36 | % | 0.38 | % | 0.38 | % | |||||||
| Nonperforming loans and leases as a percentage of loans and leases, including loans held for sale | 0.37 | 0.37 | 0.37 | 0.38 | 0.40 | ||||||||||||
Nonperforming assets as a percentage of total assets | 0.23 | 0.22 | 0.21 | 0.21 | 0.23 | ||||||||||||
Loans 30-89 days past due and still accruing as a percentage of loans and leases | 0.62 | 0.69 | 0.72 | 0.71 | 0.64 | ||||||||||||
Loans 90 days or more past due and still accruing as a percentage of loans and leases | 0.54 | 0.59 | 0.66 | 0.67 | 0.66 | ||||||||||||
| Loans 90 days or more past due and still accruing as a percentage of loans and leases, excluding PPP and other government guaranteed | 0.04 | 0.04 | 0.04 | 0.03 | 0.03 | ||||||||||||
Allowance for loan and lease losses as a percentage of loans and leases held for investment | 1.34 | 1.38 | 1.44 | 1.53 | 1.65 | ||||||||||||
Net charge-offs as a percentage of average loans and leases, annualized | 0.27 | 0.22 | 0.25 | 0.25 | 0.19 | ||||||||||||
Ratio of allowance for loan and lease losses to net charge-offs, annualized | 4.98x | 6.54x | 5.78x | 6.14x | 8.79x | ||||||||||||
Ratio of allowance for loan and lease losses to nonperforming loans and leases held for investment | 3.80x | 3.84x | 3.99x | 4.07x | 4.35x | ||||||||||||
Nonperforming assets totaled $1.2 billion at September 30, 2022, up $67 million compared to June 30, 2022 due to an increase in the commercial and industrial portfolio and nonperforming loans held for sale. Nonperforming loans and leases held for investment were 0.35% of loans and leases held for investment at September 30, 2022, down one basis point compared to June 30, 2022.
Performing TDRs were up $180 million compared to the prior quarter primarily due to increases in the government guaranteed residential mortgage and the commercial and industrial portfolios.
Loans 90 days or more past due and still accruing totaled $1.7 billion at September 30, 2022, down $78 million, or five basis points, as a percentage of loans and leases compared with the prior quarter primarily due to a decline in government guaranteed residential mortgages. Excluding government guaranteed loans, the ratio of loans 90 days or more past due and still accruing as a percentage of loans and leases was 0.04% at September 30, 2022, flat from June 30, 2022.
Loans 30-89 days past due and still accruing of $2.0 billion at September 30, 2022 were down $134 million, or seven basis points as a percentage of loans and leases, compared to the prior quarter primarily due to declines in the commercial and industrial and student loan portfolios.
Net charge-offs during the third quarter totaled $213 million, or 0.27% as a percentage of average loans, and were up five basis points compared to the prior quarter, primarily driven by normalizing trends and seasonality across certain consumer loan portfolios.
The allowance for credit losses was $4.5 billion and includes $4.2 billion for the allowance for loan and lease losses and $250 million for the reserve for unfunded commitments. The ALLL ratio was 1.34% compared to 1.38% at June 30, 2022. The decline in the ALLL ratio was due to strong portfolio performance and growth in higher quality loans, partially offset by a moderately slower economic outlook. The ALLL covered nonperforming loans and leases held for investment 3.80X compared to 3.84X at June 30, 2022. At September 30, 2022, the ALLL was 4.98X annualized net charge-offs, compared to 6.54X at June 30, 2022.
- 8 -
| SEGMENT RESULTS | Change 3Q22 vs. | ||||||||||||||||
| (dollars in millions) | |||||||||||||||||
| Segment Net Income | 3Q22 | 2Q22 | 3Q21 | 2Q22 | 3Q21 | ||||||||||||
| Consumer Banking and Wealth | $ | 986 | $ | 776 | $ | 933 | $ | 210 | $ | 53 | |||||||
| Corporate and Commercial Banking | 1,164 | 962 | 1,181 | 202 | (17) | ||||||||||||
| Insurance Holdings | 95 | 179 | 111 | (84) | (16) | ||||||||||||
| Other, Treasury & Corporate | (608) | (385) | (521) | (223) | (87) | ||||||||||||
| Total net income | $ | 1,637 | $ | 1,532 | $ | 1,704 | $ | 105 | $ | (67) | |||||||
Truist operates and measures business activity across three segments: Consumer Banking and Wealth, Corporate and Commercial Banking, and Insurance Holdings, with functional activities included in Other, Treasury and Corporate. The Company’s business segment structure is based on the manner in which financial information is evaluated by management as well as the products and services provided or the type of client served. For additional information, see “Note 21. Operating Segments” of the Annual Report on Form 10-K for the year ended December 31, 2021.
Third Quarter 2022 compared to Second Quarter 2022
Consumer Banking and Wealth (“CB&W”)
CB&W net income was $986 million for the third quarter of 2022, an increase of $210 million compared to the prior quarter. Segment net interest income increased $368 million primarily driven by favorable funding credits on deposits attributable to a higher rate environment and higher average loan balances, partially offset by a decrease in loan spreads and lower purchase accounting accretion. The allocated provision for credit losses increased $84 million due to an increase in net charge-offs and higher loan growth. Noninterest income was relatively stable with higher service charges on deposits offsetting lower card and payment related fees and wealth income. Noninterest expense was stable with lower merger-related and restructuring charges offsetting higher operational losses, marketing and customer development, and salaries.
Average loans held for investment increased $6.0 billion, or 4.5%, compared to the prior quarter primarily due to an increase in residential mortgages due to correspondent channel production and slower prepayments, an increase in the indirect auto prime portfolio, an increase in other consumer loans primarily due to growth from the Service Finance, LightStream, recreational lending and Sheffield portfolios, partially offset by runoff in other partnership lending programs and student loans. Average total deposits decreased $5.6 billion, or 2.2%, compared to the prior quarter primarily due to declines in interest bearing checking and money market and savings deposits as well as time deposits and noninterest bearing deposits.
Corporate and Commercial Banking (“C&CB”)
C&CB net income was $1.2 billion for the third quarter of 2022, an increase of $202 million compared to the prior quarter. Segment net interest income increased $278 million due to higher funding credit on deposits, higher average loan balances, partially offset by lower deposit balances, reduced purchase accounting accretion and PPP fees. The allocated provision for credit losses decreased $22 million which reflects a higher reserve release compared to the prior quarter, partially offset by a decrease in net recoveries. Noninterest income decreased $32 million primarily due to lower investment banking income. Noninterest expense increased $14 million primarily driven by increased personnel expenses due to strategic hiring in the current quarter.
- 9 -
Average loans held for investment increased $6.1 billion, or 3.8%, compared to the prior quarter primarily due to increases in core commercial and industrial loans partially offset by decreases in average PPP loans (commercial and industrial) and average commercial real estate loans. Average total deposits decreased $1.2 billion, or 0.8%, compared to the prior quarter primarily due to declines in noninterest bearing deposits, partially offset by increases in money market and savings deposits and interest bearing checking.
Insurance Holdings (“IH”)
IH net income was $95 million for the third quarter of 2022, a decrease of $84 million compared to the prior quarter. Noninterest income decreased $99 million primarily due to seasonally lower property and casualty commissions, partially offset by higher employee benefit plan commissions due to the BenefitMall acquisition. Noninterest expense increased $17 million primarily due to higher merger-related and restructuring charges and salaries driven by the BenefitMall acquisition.
Other, Treasury & Corporate (“OT&C”)
OT&C generated a net loss of $608 million for the third quarter of 2022, compared to a net loss of $385 million for the prior quarter. Net interest income decreased $313 million primarily due to higher funding credit on deposits to other segments largely due to the higher rate environment. Noninterest income and noninterest expense were both flat compared to prior quarter.
Third Quarter 2022 compared to Third Quarter 2021
Consumer Banking and Wealth
CB&W net income was $986 million for the third quarter of 2022, an increase of $53 million compared to the earlier quarter. Segment net interest income increased $495 million primarily driven by favorable funding credit on deposits attributable to the higher rate environment and higher average loan balances, partially offset by decreased loan spreads and lower purchase accounting accretion. The allocated provision for credit losses increased $288 million reflecting a reserve release in the earlier quarter and higher loan growth and increased charge-offs in the current quarter. Noninterest income decreased $146 million compared to earlier quarter primarily due to a decrease in residential mortgage income as well as a decline in wealth income attributed to market declines. These decreases were partially offset by higher card and payment fees driven by higher consumer spend. Noninterest expense decreased $33 million compared to the earlier quarter primarily due to lower merger-related and restructuring charges, net occupancy, and incentive expense, partially offset by increased operational losses.
Corporate and Commercial Banking
C&CB net income was $1.2 billion for the third quarter of 2022, a decrease of $17 million compared to the earlier quarter. Segment net interest income increased $339 million primarily due to higher funding credit on deposits and higher average loan balances, partially offset by lower purchase accounting accretion and lower PPP revenue. The allocated provision for credit losses increased $214 million primarily reflecting an allowance release in the earlier quarter and higher loan growth in the current quarter. Noninterest income decreased $148 million compared to the earlier quarter primarily due to lower investment banking revenue as well as lower income from the Company’s SBIC and other strategic investments, partially offset by higher trading income. Noninterest expense was stable compared to the earlier quarter.
- 10 -
Insurance Holdings
IH net income was $95 million for the third quarter of 2022, a decrease of $16 million compared to the earlier quarter. Noninterest income increased $82 million primarily due to continued organic growth and acquisitions. Noninterest expense increased $103 million primarily due to higher performance-based incentives, in addition to the impact of acquisitions.
Other, Treasury & Corporate
OT&C generated a net loss of $608 million in the third quarter of 2022, compared to a net loss of $521 million in the earlier quarter. Net interest income decreased $327 million primarily due to higher funding credit on deposits to other segments, partially offset by higher earnings in the securities portfolio from the higher rate environment. Noninterest income decreased $51 million primarily due to valuation changes from assets held for certain post-retirement benefits, which is primarily offset by lower personnel expense. Noninterest expense decreased $243 million compared to the earlier quarter primarily due to lower merger-related and restructuring charges and incremental operating expenses related to the merger as well as lower personnel expense due to lower other employee benefits as a result of the decrease in noninterest income for post-retirement benefits and lower incentives, partially offset by an increase in professional fees and outside processing due to increased project spend for enterprise technology investments.
Earnings Presentation and Quarterly Performance Summary
To listen to Truist’s live third quarter 2022 earnings conference call at 8 a.m. ET today, please call 855-303-0072 and enter the participant code 100038. A presentation will be used during the earnings conference call and is available on our website at https://ir.truist.com/events-and-presentation. Replays of the conference call will be available for 30 days by dialing 888-203-1112 (access code 100038).
The presentation, including an appendix reconciling non-GAAP disclosures, and Truist’s Third Quarter 2022 Quarterly Performance Summary, which contains detailed financial schedules, are available at https://ir.truist.com/earnings.
About Truist
Truist Financial Corporation is a purpose-driven financial services company committed to inspiring and building better lives and communities. Truist has leading market share in many high-growth markets in the country, and offers a wide range of products and services through our retail and small business banking, commercial banking, corporate and investment banking, insurance, wealth management, and specialized lending businesses. Headquartered in Charlotte, North Carolina, Truist is a top 10 U.S. commercial bank with total assets of $548 billion as of September 30, 2022. Truist Bank, Member FDIC. Learn more at Truist.com.
#-#-#
Capital ratios and return on risk-weighted assets are preliminary.
- 11 -
This news release contains financial information and performance measures determined by methods other than in accordance with accounting principles generally accepted in the United States of America (“GAAP”). Truist’s management uses these “non-GAAP” measures in their analysis of the Corporation’s performance and the efficiency of its operations. Management believes these non-GAAP measures provide a greater understanding of ongoing operations, enhance comparability of results with prior periods and demonstrate the effects of significant items in the current period. The Corporation believes a meaningful analysis of its financial performance requires an understanding of the factors underlying that performance. Truist’s management believes investors may find these non-GAAP financial measures useful. These disclosures should not be viewed as a substitute for financial measures determined in accordance with GAAP, nor are they necessarily comparable to non-GAAP performance measures that may be presented by other companies. Below is a listing of the types of non-GAAP measures used in this news release:
•Adjusted Efficiency Ratio - The adjusted efficiency ratio is non-GAAP in that it excludes securities gains (losses), amortization of intangible assets, merger-related and restructuring charges, and other selected items. Truist’s management uses this measure in their analysis of the Corporation’s performance. Truist’s management believes this measure provides a greater understanding of ongoing operations and enhances comparability of results with prior periods, as well as demonstrates the effects of significant gains and charges.
•Adjusted Operating Leverage - The adjusted operating leverage ratio is non-GAAP in that it excludes securities gains (losses), amortization of intangible assets, merger-related and restructuring charges, and other selected items. Truist’s management uses this measure in their analysis of the Corporation’s performance. Truist’s management believes this measure provides a greater understanding of ongoing operations and enhances comparability of results with prior periods, as well as demonstrates the effects of significant gains and charges.
•Pre-Provision Net Revenue (PPNR) - Pre-provision net revenue is a non-GAAP measure that adjusts net income determined in accordance with GAAP to exclude the impact of the provision for credit losses and provision for income taxes. Adjusted pre-provision net revenue is a non-GAAP measure that additionally excludes securities gains (losses), merger-related and restructuring charges, amortization of intangible assets, and other selected items. Truist’s management believes these measures provide a greater understanding of ongoing operations and enhances comparability of results with prior periods.
•Tangible Common Equity and Related Measures - Tangible common equity and related measures are non-GAAP measures that exclude the impact of intangible assets, net of deferred taxes, and their related amortization. These measures are useful for evaluating the performance of a business consistently, whether acquired or developed internally. Truist’s management uses these measures to assess the quality of capital and returns relative to balance sheet risk.
•Core NIM - Core net interest margin is a non-GAAP measure that adjusts net interest margin to exclude the impact of purchase accounting. The purchase accounting marks and related amortization for loans, deposits, and long-term debt from SunTrust and other acquisitions are excluded to approximate the yields paid by clients. Truist’s management believes the adjustments to the calculation of net interest margin for certain assets and liabilities acquired provide investors with useful information related to the performance of Truist’s earning assets.
•Adjusted Diluted EPS - The adjusted diluted earnings per share is non-GAAP in that it excludes merger-related and restructuring charges and other selected items, net of tax. Truist’s management uses this measure in their analysis of the Corporation’s performance. Truist’s management believes this measure provides a greater understanding of ongoing operations and enhances comparability of results with prior periods, as well as demonstrates the effects of significant gains and charges.
•Performance Ratios - The adjusted performance ratios, including adjusted return on average assets, adjusted return on average common shareholders’ equity, and adjusted return on average tangible common shareholders’ equity, are non-GAAP in that they exclude merger-related and restructuring charges, selected items, and, in the case of return on average tangible common shareholders’ equity, amortization of intangible assets. Truist’s management uses these measures in their analysis of the Corporation’s performance. Truist’s management believes these measures provide a greater understanding of ongoing operations and enhance comparability of results with prior periods, as well as demonstrate the effects of significant gains and charges.
•Insurance Holdings Adjusted EBITDA - EBITDA is a non-GAAP measurement of operating profitability that is calculated by adding back interest, taxes, depreciation, and amortization to net income. Truist’s management also adds back merger-related and restructuring charges, incremental operating expenses related to the merger, and other selected items. Truist’s management uses this measure in its analysis of the Corporation’s Insurance Holdings segment. Truist’s management believes this measure provides a greater understanding of ongoing operations and enhances comparability of results with prior periods, as well as demonstrates the effects of significant gains and charges.
•Allowance for Loan and Lease Losses and Unamortized Fair Value Mark as a Percentage of Gross Loans and Leases - Allowance for loan and lease losses and unamortized fair value mark as a percentage of gross loans and leases is a non-GAAP measurement of credit reserves that is calculated by adjusting the ALLL and loans and leases held for investment by the unamortized fair value mark. Truist’s management uses these measures to assess loss absorption capacity.
A reconciliation of each of these non-GAAP measures to the most directly comparable GAAP measure is included in the appendix to Truist’s Third Quarter 2022 Earnings Presentation, which is available at https://ir.truist.com/earnings.
- 12 -
This news release contains “forward-looking statements” within the meaning of the Private Securities Litigation Reform Act of 1995, regarding the financial condition, results of operations, business plans and the future performance of Truist. Words such as “anticipates,” “believes,” “estimates,” “expects,” “forecasts,” “intends,” “plans,” “projects,” “may,” “will,” “should,” “would,” “could” and other similar expressions are intended to identify these forward-looking statements.
Forward-looking statements are not based on historical facts but instead represent management’s expectations and assumptions regarding Truist’s business, the economy, and other future conditions. Such statements involve inherent uncertainties, risks, and changes in circumstances that are difficult to predict. As such, Truist’s actual results may differ materially from those contemplated by forward-looking statements. While there can be no assurance that any list of risks and uncertainties or risk factors is complete, important factors that could cause actual results to differ materially from those contemplated by forward-looking statements include the following, without limitation, as well as the risks and uncertainties more fully discussed under Part I, Item 1A-Risk Factors in our Annual Report on Form 10-K for the year ended December 31, 2021 and in Truist’s subsequent filings with the Securities and Exchange Commission:
•residual risks and uncertainties relating to the Merger of heritage BB&T and heritage SunTrust, including the ability to realize the anticipated benefits of the Merger;
•expenses relating to the Merger and application and data center decommissioning;
•deposit attrition, client loss or revenue loss following completed mergers or acquisitions may be greater than anticipated;
•the COVID-19 pandemic disrupted the global economy and adversely impacted Truist’s financial condition and results of operations, including through increased expenses, reduced fee income and net interest margin, decreased demand for certain types of loans, and increases in the allowance for credit losses; a resurgence of the pandemic, whether due to new variants of the coronavirus or other factors, could reintroduce or prolong these negative impacts and also adversely affect Truist’s capital and liquidity position or cost of capital, impair the ability of borrowers to repay outstanding loans, cause an outflow of deposits, and impair goodwill or other assets;
•Truist is subject to credit risk by lending or committing to lend money, and may have more credit risk and higher credit losses to the extent that loans are concentrated by loan type, industry segment, borrower type or location of the borrower or collateral;
•changes in the interest rate environment, including the replacement of LIBOR as an interest rate benchmark, which could adversely affect Truist’s revenue and expenses, the value of assets and obligations, and the availability and cost of capital, cash flows, and liquidity;
•inability to access short-term funding or liquidity, loss of client deposits or changes in Truist’s credit ratings, which could increase the cost of funding or limit access to capital markets;
•risk management oversight functions may not identify or address risks adequately, and management may not be able to effectively manage credit risk;
•risks resulting from the extensive use of models in Truist’s business, which may impact decisions made by management and regulators;
•failure to execute on strategic or operational plans, including the ability to successfully complete or integrate mergers and acquisitions;
•increased competition, including from (i) new or existing competitors that could have greater financial resources or be subject to different regulatory standards, and (ii) products and services offered by non-bank financial technology companies, may reduce Truist’s client base, cause Truist to lower prices for its products and services in order to maintain market share or otherwise adversely impact Truist’s businesses or results of operations;
•failure to maintain or enhance Truist’s competitive position with respect to new products, services and technology, whether it fails to anticipate client expectations or because its technological developments fail to perform as desired or do not achieve market acceptance or regulatory approval or for other reasons, may cause Truist to lose market share or incur additional expense;
•negative public opinion, which could damage Truist’s reputation;
•increased scrutiny regarding Truist’s consumer sales practices, training practices, incentive compensation design, and governance;
•regulatory matters, litigation or other legal actions, which may result in, among other things, costs, fines, penalties, restrictions on Truist’s business activities, reputational harm, negative publicity, or other adverse consequences;
•evolving legislative, accounting and regulatory standards, including with respect to climate, capital, and liquidity requirements, and results of regulatory examinations may adversely affect Truist’s financial condition and results of operations;
•the monetary and fiscal policies of the federal government and its agencies, including in response to rising inflation, could have a material adverse effect on the economy and Truist’s profitability;
•accounting policies and processes require management to make estimates about matters that are uncertain, including the potential write down to goodwill if there is an elongated period of decline in market value for Truist’s stock and adverse economic conditions are sustained over a period of time;
•general economic or business conditions, either globally, nationally or regionally, may be less favorable than expected, including as a result of supply chain disruptions, inflationary pressures and labor shortages, and instability in global geopolitical matters or volatility in financial markets could result in, among other things, slower deposit or asset growth, a deterioration in credit quality, or a reduced demand for credit, insurance, or other services;
- 13 -
•risks related to originating and selling mortgages, including repurchase and indemnity demands from purchasers related to representations and warranties on loans sold, which could result in an increase in the amount of losses for loan repurchases;
•risks relating to Truist’s role as a loan servicer, including an increase in the scope or costs of the services Truist is required to perform, without any corresponding increase in servicing fees or a breach of Truist’s obligations as servicer;
•Truist’s success depends on hiring and retaining key teammates, and if these individuals leave or change roles without effective replacements, Truist’s operations and integration activities could be adversely impacted, which could be exacerbated in the increased work-from-home environment caused by the COVID-19 pandemic as job markets may be less constrained by physical geography;
•fraud or misconduct by internal or external parties, which Truist may not be able to prevent, detect, or mitigate;
•security risks, including denial of service attacks, hacking, social engineering attacks targeting Truist’s teammates and clients, malware intrusion, data corruption attempts, system breaches, cyber-attacks, which have increased in frequency with current geopolitical tensions, identity theft, ransomware attacks, and physical security risks, such as natural disasters, environmental conditions, and intentional acts of destruction, could result in the disclosure of confidential information, adversely affect Truist’s business or reputation or create significant legal or financial exposure; and
•widespread outages of operational, communication, or other systems, whether internal or provided by third parties, natural or other disasters (including acts of terrorism and pandemics), and the effects of climate change, including physical risks, such as more frequent and intense weather events, and risks related to the transition to a lower carbon economy, such as regulatory or technological changes or shifts in market dynamics or consumer preferences, could have an adverse effect on Truist’s financial condition and results of operations, lead to material disruption of Truist’s operations or the ability or willingness of clients to access Truist’s products and services.
Readers are cautioned not to place undue reliance on these forward-looking statements, which speak only as of the date they are made. Except to the extent required by applicable law or regulation, Truist undertakes no obligation to revise or update any forward-looking statements.
- 14 -

Quarterly Performance Summary
Truist Financial Corporation
Third Quarter 2022
| Table of Contents | ||||||||
| Quarterly Performance Summary | ||||||||
| Truist Financial Corporation | ||||||||
| Page | ||||||||
| Financial Highlights | ||||||||
| Financial Highlights - Five Quarter Trend | ||||||||
| Consolidated Statements of Income | ||||||||
| Consolidated Statements of Income - Five Quarter Trend | ||||||||
| Consolidated Ending Balance Sheets - Five Quarter Trend | ||||||||
| Average Balance Sheets | ||||||||
| Average Balance Sheets - Five Quarter Trend | ||||||||
| Average Balances and Rates - Quarters | ||||||||
| Average Balances and Rates - Year-To-Date | ||||||||
| Credit Quality | ||||||||
| Segment Financial Performance - Five Quarter Trend | ||||||||
| Capital Information - Five Quarter Trend | ||||||||
| Selected Mortgage Banking Information & Additional Information | ||||||||
| Selected Items | ||||||||
| Non-GAAP Reconciliations | ||||||||
| Financial Highlights | ||||||||||||||||||||||||||||||||||||||
| Quarter Ended | Year-to-Date | |||||||||||||||||||||||||||||||||||||
| September 30 | % | September 30 | % | |||||||||||||||||||||||||||||||||||
| (Dollars in millions, except per share data, shares in thousands) | 2022 | 2021 | Change | 2022 | 2021 | Change | ||||||||||||||||||||||||||||||||
| Summary Income Statement | ||||||||||||||||||||||||||||||||||||||
| Interest income - taxable equivalent (1) | $ | 4,407 | $ | 3,454 | 27.6 | % | $ | 11,491 | $ | 10,447 | 10.0 | % | ||||||||||||||||||||||||||
| Interest expense | 624 | 193 | NM | 1,064 | 600 | 77.3 | ||||||||||||||||||||||||||||||||
| Net interest income - taxable equivalent | 3,783 | 3,261 | 16.0 | 10,427 | 9,847 | 5.9 | ||||||||||||||||||||||||||||||||
| Less: Taxable-equivalent adjustment | 38 | 28 | 35.7 | 92 | 84 | 9.5 | ||||||||||||||||||||||||||||||||
| Net interest income | 3,745 | 3,233 | 15.8 | 10,335 | 9,763 | 5.9 | ||||||||||||||||||||||||||||||||
| Provision for credit losses | 234 | (324) | (172.2) | 310 | (710) | (143.7) | ||||||||||||||||||||||||||||||||
| Net interest income after provision for credit losses | 3,511 | 3,557 | (1.3) | 10,025 | 10,473 | (4.3) | ||||||||||||||||||||||||||||||||
| Noninterest income | 2,102 | 2,365 | (11.1) | 6,492 | 6,967 | (6.8) | ||||||||||||||||||||||||||||||||
| Noninterest expense | 3,613 | 3,795 | (4.8) | 10,867 | 11,416 | (4.8) | ||||||||||||||||||||||||||||||||
| Income before income taxes | 2,000 | 2,127 | (6.0) | 5,650 | 6,024 | (6.2) | ||||||||||||||||||||||||||||||||
| Provision for income taxes | 363 | 423 | (14.2) | 1,065 | 1,189 | (10.4) | ||||||||||||||||||||||||||||||||
| Net income | 1,637 | 1,704 | (3.9) | 4,585 | 4,835 | (5.2) | ||||||||||||||||||||||||||||||||
| Noncontrolling interests | 4 | — | NM | 6 | (3) | NM | ||||||||||||||||||||||||||||||||
| Net income available to the bank holding company | 1,633 | 1,704 | (4.2) | 4,579 | 4,838 | (5.4) | ||||||||||||||||||||||||||||||||
| Preferred stock dividends and other | 97 | 88 | 10.2 | 262 | 329 | (20.4) | ||||||||||||||||||||||||||||||||
| Net income available to common shareholders | 1,536 | 1,616 | (5.0) | 4,317 | 4,509 | (4.3) | ||||||||||||||||||||||||||||||||
| Per Common Share Data | ||||||||||||||||||||||||||||||||||||||
| Earnings per share-basic | $ | 1.16 | $ | 1.21 | (4.1) | % | $ | 3.25 | $ | 3.37 | (3.6) | % | ||||||||||||||||||||||||||
| Earnings per share-diluted | 1.15 | 1.20 | (4.2) | 3.22 | 3.34 | (3.6) | ||||||||||||||||||||||||||||||||
| Earnings per share-adjusted diluted (2) | 1.24 | 1.42 | (12.7) | 3.66 | 4.15 | (11.8) | ||||||||||||||||||||||||||||||||
| Cash dividends declared | 0.52 | 0.48 | 8.3 | 1.48 | 1.38 | 7.2 | ||||||||||||||||||||||||||||||||
| Common shareholders’ equity | 40.79 | 46.62 | (12.5) | 40.79 | 46.62 | (12.5) | ||||||||||||||||||||||||||||||||
| Tangible common shareholders’ equity (2) | 18.36 | 26.34 | (30.3) | 18.36 | 26.34 | (30.3) | ||||||||||||||||||||||||||||||||
| End of period shares outstanding | 1,326,766 | 1,334,892 | (0.6) | 1,326,766 | 1,334,892 | (0.6) | ||||||||||||||||||||||||||||||||
| Weighted average shares outstanding-basic | 1,326,539 | 1,334,825 | (0.6) | 1,328,569 | 1,339,558 | (0.8) | ||||||||||||||||||||||||||||||||
| Weighted average shares outstanding-diluted | 1,336,659 | 1,346,854 | (0.8) | 1,339,071 | 1,351,712 | (0.9) | ||||||||||||||||||||||||||||||||
| Performance Ratios | ||||||||||||||||||||||||||||||||||||||
| Return on average assets | 1.19 | % | 1.28 | % | 1.13 | % | 1.25 | % | ||||||||||||||||||||||||||||||
| Return on average risk-weighted assets (current period is preliminary) | 1.55 | 1.77 | 1.51 | 1.70 | ||||||||||||||||||||||||||||||||||
| Return on average common shareholders’ equity | 10.7 | 10.2 | 10.0 | 9.7 | ||||||||||||||||||||||||||||||||||
| Return on average tangible common shareholders’ equity (2) | 23.5 | 19.3 | 21.5 | 18.2 | ||||||||||||||||||||||||||||||||||
| Net interest margin - taxable equivalent | 3.12 | 2.81 | 2.93 | 2.90 | ||||||||||||||||||||||||||||||||||
| Fee income ratio | 36.0 | 42.2 | 38.6 | 41.6 | ||||||||||||||||||||||||||||||||||
| Efficiency ratio-GAAP | 61.8 | 67.8 | 64.6 | 68.2 | ||||||||||||||||||||||||||||||||||
| Efficiency ratio-adjusted (2) | 56.4 | 57.9 | 57.2 | 57.0 | ||||||||||||||||||||||||||||||||||
| Credit Quality | ||||||||||||||||||||||||||||||||||||||
| Nonperforming assets as a percentage of: | ||||||||||||||||||||||||||||||||||||||
| Assets, including LHFS | 0.23 | % | 0.23 | % | 0.23 | % | 0.23 | % | ||||||||||||||||||||||||||||||
| Loans and leases plus foreclosed property | 0.37 | 0.40 | 0.37 | 0.40 | ||||||||||||||||||||||||||||||||||
| Net charge-offs as a percentage of average loans and leases | 0.27 | 0.19 | 0.25 | 0.24 | ||||||||||||||||||||||||||||||||||
| Allowance for loan and lease losses as a percentage of LHFI | 1.34 | 1.65 | 1.34 | 1.65 | ||||||||||||||||||||||||||||||||||
| Ratio of allowance for loan and lease losses to nonperforming LHFI | 3.80x | 4.35x | 3.80x | 4.35x | ||||||||||||||||||||||||||||||||||
| Average Balances | ||||||||||||||||||||||||||||||||||||||
| Assets | $ | 545,606 | $ | 526,685 | 3.6 | % | $ | 540,754 | $ | 518,163 | 4.4 | % | ||||||||||||||||||||||||||
| Securities (3) | 145,396 | 146,272 | (0.6) | 148,895 | 134,810 | 10.4 | ||||||||||||||||||||||||||||||||
| Loans and leases | 311,876 | 290,338 | 7.4 | 301,478 | 294,248 | 2.5 | ||||||||||||||||||||||||||||||||
| Deposits | 420,096 | 402,728 | 4.3 | 419,713 | 394,128 | 6.5 | ||||||||||||||||||||||||||||||||
| Common shareholders’ equity | 56,813 | 62,680 | (9.4) | 57,899 | 62,215 | (6.9) | ||||||||||||||||||||||||||||||||
| Total shareholders’ equity | 63,510 | 69,353 | (8.4) | 64,591 | 69,353 | (6.9) | ||||||||||||||||||||||||||||||||
| Period-End Balances | ||||||||||||||||||||||||||||||||||||||
| Assets | $ | 548,438 | $ | 529,884 | 3.5 | % | $ | 548,438 | $ | 529,884 | 3.5 | % | ||||||||||||||||||||||||||
| Securities (3) | 131,732 | 151,038 | (12.8) | 131,732 | 151,038 | (12.8) | ||||||||||||||||||||||||||||||||
| Loans and leases | 316,639 | 290,655 | 8.9 | 316,639 | 290,655 | 8.9 | ||||||||||||||||||||||||||||||||
| Deposits | 415,992 | 405,857 | 2.5 | 415,992 | 405,857 | 2.5 | ||||||||||||||||||||||||||||||||
| Common shareholders’ equity | 54,115 | 62,227 | (13.0) | 54,115 | 62,227 | (13.0) | ||||||||||||||||||||||||||||||||
| Total shareholders’ equity | 60,811 | 68,900 | (11.7) | 60,811 | 68,900 | (11.7) | ||||||||||||||||||||||||||||||||
| Capital Ratios (current quarter is preliminary) | ||||||||||||||||||||||||||||||||||||||
| Common equity Tier 1 | 9.1 | % | 10.1 | % | 9.1 | % | 10.1 | % | ||||||||||||||||||||||||||||||
| Tier 1 | 10.7 | 11.9 | 10.7 | 11.9 | ||||||||||||||||||||||||||||||||||
| Total | 12.6 | 13.9 | 12.6 | 13.9 | ||||||||||||||||||||||||||||||||||
| Leverage | 8.5 | 9.0 | 8.5 | 9.0 | ||||||||||||||||||||||||||||||||||
| Supplementary leverage | 7.3 | 7.8 | 7.3 | 7.8 | ||||||||||||||||||||||||||||||||||
| Applicable ratios are annualized. | ||||||||||||||||||||||||||||||||||||||
NM - not meaningful | ||||||||||||||||||||||||||||||||||||||
| (1) Interest income includes certain fees, deferred costs, fair value mark accretion, and dividends. | ||||||||||||||||||||||||||||||||||||||
| (2) Represents a non-GAAP measure. See the calculations and management’s reasons for using these measures in the Non-GAAP Reconciliations and Preliminary Capital Information - Five Quarter Trend sections of this supplement. | ||||||||||||||||||||||||||||||||||||||
| (3) Includes AFS and HTM securities. Average balances reflect both AFS and HTM securities at amortized cost. Period-end balances reflect AFS securities at fair value and HTM securities at amortized cost. | ||||||||||||||||||||||||||||||||||||||
Truist Financial Corporation 1
| Financial Highlights - Five Quarter Trend | ||||||||||||||||||||||||||||||||
| Quarter Ended | ||||||||||||||||||||||||||||||||
| Sept. 30 | June 30 | March 31 | Dec. 31 | Sept. 30 | ||||||||||||||||||||||||||||
| (Dollars in millions, except per share data, shares in thousands) | 2022 | 2022 | 2022 | 2021 | 2021 | |||||||||||||||||||||||||||
| Summary Income Statement | ||||||||||||||||||||||||||||||||
| Interest income - taxable equivalent (1) | $ | 4,407 | $ | 3,701 | $ | 3,383 | $ | 3,435 | $ | 3,454 | ||||||||||||||||||||||
| Interest expense | 624 | 266 | 174 | 168 | 193 | |||||||||||||||||||||||||||
| Net interest income - taxable equivalent | 3,783 | 3,435 | 3,209 | 3,267 | 3,261 | |||||||||||||||||||||||||||
| Less: Taxable-equivalent adjustment | 38 | 28 | 26 | 24 | 28 | |||||||||||||||||||||||||||
| Net interest income | 3,745 | 3,407 | 3,183 | 3,243 | 3,233 | |||||||||||||||||||||||||||
| Provision for credit losses | 234 | 171 | (95) | (103) | (324) | |||||||||||||||||||||||||||
| Net interest income after provision for credit losses | 3,511 | 3,236 | 3,278 | 3,346 | 3,557 | |||||||||||||||||||||||||||
| Noninterest income | 2,102 | 2,248 | 2,142 | 2,323 | 2,365 | |||||||||||||||||||||||||||
| Noninterest expense | 3,613 | 3,580 | 3,674 | 3,700 | 3,795 | |||||||||||||||||||||||||||
| Income before income taxes | 2,000 | 1,904 | 1,746 | 1,969 | 2,127 | |||||||||||||||||||||||||||
| Provision for income taxes | 363 | 372 | 330 | 367 | 423 | |||||||||||||||||||||||||||
| Net income | 1,637 | 1,532 | 1,416 | 1,602 | 1,704 | |||||||||||||||||||||||||||
| Noncontrolling interests | 4 | 1 | 1 | — | — | |||||||||||||||||||||||||||
| Net income available to the bank holding company | 1,633 | 1,531 | 1,415 | 1,602 | 1,704 | |||||||||||||||||||||||||||
| Preferred stock dividends and other | 97 | 77 | 88 | 78 | 88 | |||||||||||||||||||||||||||
| Net income available to common shareholders | 1,536 | 1,454 | 1,327 | 1,524 | 1,616 | |||||||||||||||||||||||||||
| Per Common Share Data | ||||||||||||||||||||||||||||||||
| Earnings per share-basic | $ | 1.16 | $ | 1.09 | $ | 1.00 | $ | 1.15 | $ | 1.21 | ||||||||||||||||||||||
| Earnings per share-diluted | 1.15 | 1.09 | 0.99 | 1.13 | 1.20 | |||||||||||||||||||||||||||
| Earnings per share-adjusted diluted (2) | 1.24 | 1.20 | 1.23 | 1.38 | 1.42 | |||||||||||||||||||||||||||
| Cash dividends declared | 0.52 | 0.48 | 0.48 | 0.48 | 0.48 | |||||||||||||||||||||||||||
| Common shareholders’ equity | 40.79 | 42.45 | 43.82 | 47.14 | 46.62 | |||||||||||||||||||||||||||
| Tangible common shareholders’ equity (2) | 18.36 | 20.51 | 21.87 | 25.47 | 26.34 | |||||||||||||||||||||||||||
| End of period shares outstanding | 1,326,766 | 1,326,393 | 1,331,414 | 1,327,818 | 1,334,892 | |||||||||||||||||||||||||||
| Weighted average shares outstanding-basic | 1,326,539 | 1,330,160 | 1,329,037 | 1,329,979 | 1,334,825 | |||||||||||||||||||||||||||
| Weighted average shares outstanding-diluted | 1,336,659 | 1,338,864 | 1,341,563 | 1,343,029 | 1,346,854 | |||||||||||||||||||||||||||
| Performance Ratios | ||||||||||||||||||||||||||||||||
| Return on average assets | 1.19 | % | 1.14 | % | 1.07 | % | 1.19 | % | 1.28 | % | ||||||||||||||||||||||
| Return on average risk-weighted assets (current quarter is preliminary) | 1.55 | 1.52 | 1.46 | 1.64 | 1.77 | |||||||||||||||||||||||||||
| Return on average common shareholders’ equity | 10.7 | 10.3 | 9.0 | 9.8 | 10.2 | |||||||||||||||||||||||||||
| Return on average tangible common shareholders’ equity (2) | 23.5 | 22.7 | 18.6 | 18.9 | 19.3 | |||||||||||||||||||||||||||
| Net interest margin - taxable equivalent | 3.12 | 2.89 | 2.76 | 2.76 | 2.81 | |||||||||||||||||||||||||||
| Fee income ratio | 36.0 | 39.7 | 40.2 | 41.7 | 42.2 | |||||||||||||||||||||||||||
| Efficiency ratio-GAAP | 61.8 | 63.3 | 69.0 | 66.5 | 67.8 | |||||||||||||||||||||||||||
| Efficiency ratio-adjusted (2) | 56.4 | 57.0 | 58.3 | 56.0 | 57.9 | |||||||||||||||||||||||||||
| Credit Quality | ||||||||||||||||||||||||||||||||
| Nonperforming assets as a percentage of: | ||||||||||||||||||||||||||||||||
| Assets, including LHFS | 0.23 | % | 0.22 | % | 0.21 | % | 0.21 | % | 0.23 | % | ||||||||||||||||||||||
| Loans and leases plus foreclosed property | 0.37 | 0.38 | 0.38 | 0.39 | 0.40 | |||||||||||||||||||||||||||
| Net charge-offs as a percentage of average loans and leases | 0.27 | 0.22 | 0.25 | 0.25 | 0.19 | |||||||||||||||||||||||||||
| Allowance for loan and lease losses as a percentage of LHFI | 1.34 | 1.38 | 1.44 | 1.53 | 1.65 | |||||||||||||||||||||||||||
| Ratio of allowance for loan and lease losses to nonperforming LHFI | 3.80x | 3.84x | 3.99x | 4.07x | 4.35x | |||||||||||||||||||||||||||
| Average Balances | ||||||||||||||||||||||||||||||||
| Assets | $ | 545,606 | $ | 540,568 | $ | 535,981 | $ | 534,911 | $ | 526,685 | ||||||||||||||||||||||
| Securities (3) | 145,396 | 148,681 | 152,687 | 153,405 | 146,272 | |||||||||||||||||||||||||||
| Loans and leases | 311,876 | 299,861 | 292,484 | 291,074 | 290,338 | |||||||||||||||||||||||||||
| Deposits | 420,096 | 423,750 | 415,238 | 410,966 | 402,728 | |||||||||||||||||||||||||||
| Common shareholders’ equity | 56,813 | 56,803 | 60,117 | 61,807 | 62,680 | |||||||||||||||||||||||||||
| Total shareholders’ equity | 63,510 | 63,500 | 66,798 | 68,480 | 69,353 | |||||||||||||||||||||||||||
| Period-End Balances | ||||||||||||||||||||||||||||||||
| Assets | $ | 548,438 | $ | 545,123 | $ | 543,979 | $ | 541,241 | $ | 529,884 | ||||||||||||||||||||||
| Securities (3) | 131,732 | 139,359 | 146,415 | 154,617 | 151,038 | |||||||||||||||||||||||||||
| Loans and leases | 316,639 | 307,300 | 294,248 | 294,325 | 290,655 | |||||||||||||||||||||||||||
| Deposits | 415,992 | 424,759 | 428,328 | 416,488 | 405,857 | |||||||||||||||||||||||||||
| Common shareholders’ equity | 54,115 | 56,302 | 58,348 | 62,598 | 62,227 | |||||||||||||||||||||||||||
| Total shareholders’ equity | 60,811 | 62,999 | 65,044 | 69,271 | 68,900 | |||||||||||||||||||||||||||
| Capital Ratios (current quarter is preliminary) | ||||||||||||||||||||||||||||||||
| Common equity Tier 1 | 9.1 | % | 9.2 | % | 9.4 | % | 9.6 | % | 10.1 | % | ||||||||||||||||||||||
| Tier 1 | 10.7 | 10.8 | 11.0 | 11.3 | 11.9 | |||||||||||||||||||||||||||
| Total | 12.6 | 12.6 | 13.0 | 13.2 | 13.9 | |||||||||||||||||||||||||||
| Leverage | 8.5 | 8.6 | 8.6 | 8.7 | 9.0 | |||||||||||||||||||||||||||
| Supplementary leverage | 7.3 | 7.3 | 7.3 | 7.4 | 7.8 | |||||||||||||||||||||||||||
| Applicable ratios are annualized. | ||||||||||||||||||||||||||||||||
| (1) Interest income includes certain fees, deferred costs, fair value mark accretion, and dividends. | ||||||||||||||||||||||||||||||||
| (2) Represents a non-GAAP measure. See the calculations and management’s reasons for using these measures in the Non-GAAP Reconciliations and Preliminary Capital Information - Five Quarter Trend sections of this supplement. | ||||||||||||||||||||||||||||||||
| (3) Includes AFS and HTM securities. Average balances reflect both AFS and HTM securities at amortized cost. Period-end balances reflect AFS securities at fair value and HTM securities at amortized cost. | ||||||||||||||||||||||||||||||||
2 Truist Financial Corporation
| Consolidated Statements of Income | |||||||||||||||||||||||||||||||||||||||||||||||
| Quarter Ended | Year-to-Date | ||||||||||||||||||||||||||||||||||||||||||||||
| Sept. 30 | Change | Sept. 30 | Change | ||||||||||||||||||||||||||||||||||||||||||||
| (Dollars in millions, except per share data, shares in thousands) | 2022 | 2021 | $ | % | 2022 | 2021 | $ | % | |||||||||||||||||||||||||||||||||||||||
| Interest Income | |||||||||||||||||||||||||||||||||||||||||||||||
| Interest and fees on loans and leases | $ | 3,490 | $ | 2,825 | $ | 665 | 23.5 | % | $ | 9,032 | $ | 8,728 | $ | 304 | 3.5 | % | |||||||||||||||||||||||||||||||
| Interest on securities | 709 | 548 | 161 | 29.4 | 2,024 | 1,488 | 536 | 36.0 | |||||||||||||||||||||||||||||||||||||||
| Interest on other earning assets | 170 | 53 | 117 | NM | 343 | 147 | 196 | 133.3 | |||||||||||||||||||||||||||||||||||||||
| Total interest income | 4,369 | 3,426 | 943 | 27.5 | 11,399 | 10,363 | 1,036 | 10.0 | |||||||||||||||||||||||||||||||||||||||
| Interest Expense | |||||||||||||||||||||||||||||||||||||||||||||||
| Interest on deposits | 331 | 33 | 298 | NM | 462 | 116 | 346 | NM | |||||||||||||||||||||||||||||||||||||||
| Interest on long-term debt | 190 | 151 | 39 | 25.8 | 459 | 446 | 13 | 2.9 | |||||||||||||||||||||||||||||||||||||||
| Interest on other borrowings | 103 | 9 | 94 | NM | 143 | 38 | 105 | NM | |||||||||||||||||||||||||||||||||||||||
| Total interest expense | 624 | 193 | 431 | NM | 1,064 | 600 | 464 | 77.3 | |||||||||||||||||||||||||||||||||||||||
| Net Interest Income | 3,745 | 3,233 | 512 | 15.8 | 10,335 | 9,763 | 572 | 5.9 | |||||||||||||||||||||||||||||||||||||||
| Provision for credit losses | 234 | (324) | 558 | (172.2) | 310 | (710) | 1,020 | (143.7) | |||||||||||||||||||||||||||||||||||||||
| Net Interest Income After Provision for Credit Losses | 3,511 | 3,557 | (46) | (1.3) | 10,025 | 10,473 | (448) | (4.3) | |||||||||||||||||||||||||||||||||||||||
| Noninterest Income | |||||||||||||||||||||||||||||||||||||||||||||||
| Insurance income | 725 | 645 | 80 | 12.4 | 2,277 | 1,961 | 316 | 16.1 | |||||||||||||||||||||||||||||||||||||||
| Investment banking and trading income | 222 | 316 | (94) | (29.7) | 738 | 1,064 | (326) | (30.6) | |||||||||||||||||||||||||||||||||||||||
| Wealth management income | 334 | 356 | (22) | (6.2) | 1,014 | 1,042 | (28) | (2.7) | |||||||||||||||||||||||||||||||||||||||
| Service charges on deposits | 263 | 276 | (13) | (4.7) | 769 | 787 | (18) | (2.3) | |||||||||||||||||||||||||||||||||||||||
| Card and payment related fees | 241 | 225 | 16 | 7.1 | 699 | 650 | 49 | 7.5 | |||||||||||||||||||||||||||||||||||||||
| Residential mortgage income | 72 | 179 | (107) | (59.8) | 235 | 396 | (161) | (40.7) | |||||||||||||||||||||||||||||||||||||||
| Lending related fees | 80 | 74 | 6 | 8.1 | 265 | 268 | (3) | (1.1) | |||||||||||||||||||||||||||||||||||||||
| Operating lease income | 66 | 57 | 9 | 15.8 | 190 | 191 | (1) | (0.5) | |||||||||||||||||||||||||||||||||||||||
| Commercial mortgage income | 50 | 54 | (4) | (7.4) | 108 | 134 | (26) | (19.4) | |||||||||||||||||||||||||||||||||||||||
| Income from bank-owned life insurance | 49 | 43 | 6 | 14.0 | 150 | 139 | 11 | 7.9 | |||||||||||||||||||||||||||||||||||||||
| Securities gains (losses) | (1) | — | (1) | NM | (71) | — | (71) | NM | |||||||||||||||||||||||||||||||||||||||
| Other income | 1 | 140 | (139) | (99.3) | 118 | 335 | (217) | (64.8) | |||||||||||||||||||||||||||||||||||||||
| Total noninterest income | 2,102 | 2,365 | (263) | (11.1) | 6,492 | 6,967 | (475) | (6.8) | |||||||||||||||||||||||||||||||||||||||
| Noninterest Expense | |||||||||||||||||||||||||||||||||||||||||||||||
| Personnel expense | 2,116 | 2,187 | (71) | (3.2) | 6,269 | 6,536 | (267) | (4.1) | |||||||||||||||||||||||||||||||||||||||
| Professional fees and outside processing | 352 | 372 | (20) | (5.4) | 1,064 | 1,063 | 1 | 0.1 | |||||||||||||||||||||||||||||||||||||||
| Software expense | 225 | 251 | (26) | (10.4) | 691 | 707 | (16) | (2.3) | |||||||||||||||||||||||||||||||||||||||
| Net occupancy expense | 176 | 187 | (11) | (5.9) | 565 | 578 | (13) | (2.2) | |||||||||||||||||||||||||||||||||||||||
| Amortization of intangibles | 140 | 145 | (5) | (3.4) | 420 | 431 | (11) | (2.6) | |||||||||||||||||||||||||||||||||||||||
| Equipment expense | 122 | 154 | (32) | (20.8) | 354 | 389 | (35) | (9.0) | |||||||||||||||||||||||||||||||||||||||
| Marketing and customer development | 105 | 94 | 11 | 11.7 | 282 | 226 | 56 | 24.8 | |||||||||||||||||||||||||||||||||||||||
| Operating lease depreciation | 45 | 47 | (2) | (4.3) | 140 | 144 | (4) | (2.8) | |||||||||||||||||||||||||||||||||||||||
| Loan-related expense | 46 | 52 | (6) | (11.5) | 137 | 161 | (24) | (14.9) | |||||||||||||||||||||||||||||||||||||||
| Regulatory costs | 52 | 43 | 9 | 20.9 | 131 | 99 | 32 | 32.3 | |||||||||||||||||||||||||||||||||||||||
| Merger-related and restructuring charges | 62 | 172 | (110) | (64.0) | 399 | 610 | (211) | (34.6) | |||||||||||||||||||||||||||||||||||||||
| Loss (gain) on early extinguishment of debt | — | — | — | — | (39) | (3) | (36) | NM | |||||||||||||||||||||||||||||||||||||||
| Other expense | 172 | 91 | 81 | 89.0 | 454 | 475 | (21) | (4.4) | |||||||||||||||||||||||||||||||||||||||
| Total noninterest expense | 3,613 | 3,795 | (182) | (4.8) | 10,867 | 11,416 | (549) | (4.8) | |||||||||||||||||||||||||||||||||||||||
| Earnings | |||||||||||||||||||||||||||||||||||||||||||||||
| Income before income taxes | 2,000 | 2,127 | (127) | (6.0) | 5,650 | 6,024 | (374) | (6.2) | |||||||||||||||||||||||||||||||||||||||
| Provision for income taxes | 363 | 423 | (60) | (14.2) | 1,065 | 1,189 | (124) | (10.4) | |||||||||||||||||||||||||||||||||||||||
| Net income | 1,637 | 1,704 | (67) | (3.9) | 4,585 | 4,835 | (250) | (5.2) | |||||||||||||||||||||||||||||||||||||||
| Noncontrolling interests | 4 | — | 4 | NM | 6 | (3) | 9 | NM | |||||||||||||||||||||||||||||||||||||||
| Net income available to the bank holding company | 1,633 | 1,704 | (71) | (4.2) | 4,579 | 4,838 | (259) | (5.4) | |||||||||||||||||||||||||||||||||||||||
| Preferred stock dividends and other | 97 | 88 | 9 | 10.2 | 262 | 329 | (67) | (20.4) | |||||||||||||||||||||||||||||||||||||||
| Net income available to common shareholders | $ | 1,536 | $ | 1,616 | $ | (80) | (5.0) | % | $ | 4,317 | $ | 4,509 | $ | (192) | (4.3) | % | |||||||||||||||||||||||||||||||
| Earnings Per Common Share | |||||||||||||||||||||||||||||||||||||||||||||||
| Basic | $ | 1.16 | $ | 1.21 | $ | (0.05) | (4.1) | % | $ | 3.25 | $ | 3.37 | $ | (0.12) | (3.6) | % | |||||||||||||||||||||||||||||||
| Diluted | 1.15 | 1.20 | (0.05) | (4.2) | 3.22 | 3.34 | (0.12) | (3.6) | |||||||||||||||||||||||||||||||||||||||
| Weighted Average Shares Outstanding | |||||||||||||||||||||||||||||||||||||||||||||||
| Basic | 1,326,539 | 1,334,825 | (8,286) | (0.6) | 1,328,569 | 1,339,558 | (10,989) | (0.8) | |||||||||||||||||||||||||||||||||||||||
| Diluted | 1,336,659 | 1,346,854 | (10,195) | (0.8) | 1,339,071 | 1,351,712 | (12,641) | (0.9) | |||||||||||||||||||||||||||||||||||||||
| NM - not meaningful | |||||||||||||||||||||||||||||||||||||||||||||||
Truist Financial Corporation 3
| Consolidated Statements of Income - Five Quarter Trend | ||||||||||||||||||||||||||||||||
| Quarter Ended | ||||||||||||||||||||||||||||||||
| Sept. 30 | June 30 | March 31 | Dec. 31 | Sept. 30 | ||||||||||||||||||||||||||||
| (Dollars in millions, except per share data, shares in thousands) | 2022 | 2022 | 2022 | 2021 | 2021 | |||||||||||||||||||||||||||
| Interest Income | ||||||||||||||||||||||||||||||||
| Interest and fees on loans and leases | $ | 3,490 | $ | 2,898 | $ | 2,644 | $ | 2,753 | $ | 2,825 | ||||||||||||||||||||||
| Interest on securities | 709 | 675 | 640 | 602 | 548 | |||||||||||||||||||||||||||
| Interest on other earning assets | 170 | 100 | 73 | 56 | 53 | |||||||||||||||||||||||||||
| Total interest income | 4,369 | 3,673 | 3,357 | 3,411 | 3,426 | |||||||||||||||||||||||||||
| Interest Expense | ||||||||||||||||||||||||||||||||
| Interest on deposits | 331 | 99 | 32 | 32 | 33 | |||||||||||||||||||||||||||
| Interest on long-term debt | 190 | 137 | 132 | 127 | 151 | |||||||||||||||||||||||||||
| Interest on other borrowings | 103 | 30 | 10 | 9 | 9 | |||||||||||||||||||||||||||
| Total interest expense | 624 | 266 | 174 | 168 | 193 | |||||||||||||||||||||||||||
| Net Interest Income | 3,745 | 3,407 | 3,183 | 3,243 | 3,233 | |||||||||||||||||||||||||||
| Provision for credit losses | 234 | 171 | (95) | (103) | (324) | |||||||||||||||||||||||||||
| Net Interest Income After Provision for Credit Losses | 3,511 | 3,236 | 3,278 | 3,346 | 3,557 | |||||||||||||||||||||||||||
| Noninterest Income | ||||||||||||||||||||||||||||||||
| Insurance income | 725 | 825 | 727 | 666 | 645 | |||||||||||||||||||||||||||
| Investment banking and trading income | 222 | 255 | 261 | 377 | 316 | |||||||||||||||||||||||||||
| Wealth management income | 334 | 337 | 343 | 350 | 356 | |||||||||||||||||||||||||||
| Service charges on deposits | 263 | 254 | 252 | 273 | 276 | |||||||||||||||||||||||||||
| Card and payment related fees | 241 | 246 | 212 | 224 | 225 | |||||||||||||||||||||||||||
| Residential mortgage income | 72 | 74 | 89 | 159 | 179 | |||||||||||||||||||||||||||
| Lending related fees | 80 | 100 | 85 | 81 | 74 | |||||||||||||||||||||||||||
| Operating lease income | 66 | 66 | 58 | 71 | 57 | |||||||||||||||||||||||||||
| Commercial mortgage income | 50 | 26 | 32 | 45 | 54 | |||||||||||||||||||||||||||
| Income from bank-owned life insurance | 49 | 50 | 51 | 44 | 43 | |||||||||||||||||||||||||||
| Securities gains (losses) | (1) | (1) | (69) | — | — | |||||||||||||||||||||||||||
| Other income | 1 | 16 | 101 | 33 | 140 | |||||||||||||||||||||||||||
| Total noninterest income | 2,102 | 2,248 | 2,142 | 2,323 | 2,365 | |||||||||||||||||||||||||||
| Noninterest Expense | ||||||||||||||||||||||||||||||||
| Personnel expense | 2,116 | 2,102 | 2,051 | 2,096 | 2,187 | |||||||||||||||||||||||||||
| Professional fees and outside processing | 352 | 349 | 363 | 379 | 372 | |||||||||||||||||||||||||||
| Software expense | 225 | 234 | 232 | 238 | 251 | |||||||||||||||||||||||||||
| Net occupancy expense | 176 | 181 | 208 | 186 | 187 | |||||||||||||||||||||||||||
| Amortization of intangibles | 140 | 143 | 137 | 143 | 145 | |||||||||||||||||||||||||||
| Equipment expense | 122 | 114 | 118 | 124 | 154 | |||||||||||||||||||||||||||
| Marketing and customer development | 105 | 93 | 84 | 68 | 94 | |||||||||||||||||||||||||||
| Operating lease depreciation | 45 | 47 | 48 | 46 | 47 | |||||||||||||||||||||||||||
| Loan-related expense | 46 | 47 | 44 | 51 | 52 | |||||||||||||||||||||||||||
| Regulatory costs | 52 | 44 | 35 | 38 | 43 | |||||||||||||||||||||||||||
| Merger-related and restructuring charges | 62 | 121 | 216 | 212 | 172 | |||||||||||||||||||||||||||
| Loss (gain) on early extinguishment of debt | — | (39) | — | (1) | — | |||||||||||||||||||||||||||
| Other expense | 172 | 144 | 138 | 120 | 91 | |||||||||||||||||||||||||||
| Total noninterest expense | 3,613 | 3,580 | 3,674 | 3,700 | 3,795 | |||||||||||||||||||||||||||
| Earnings | ||||||||||||||||||||||||||||||||
| Income before income taxes | 2,000 | 1,904 | 1,746 | 1,969 | 2,127 | |||||||||||||||||||||||||||
| Provision for income taxes | 363 | 372 | 330 | 367 | 423 | |||||||||||||||||||||||||||
| Net income | 1,637 | 1,532 | 1,416 | 1,602 | 1,704 | |||||||||||||||||||||||||||
| Noncontrolling interests | 4 | 1 | 1 | — | — | |||||||||||||||||||||||||||
| Net income available to the bank holding company | 1,633 | 1,531 | 1,415 | 1,602 | 1,704 | |||||||||||||||||||||||||||
| Preferred stock dividends and other | 97 | 77 | 88 | 78 | 88 | |||||||||||||||||||||||||||
| Net income available to common shareholders | $ | 1,536 | $ | 1,454 | $ | 1,327 | $ | 1,524 | $ | 1,616 | ||||||||||||||||||||||
| Earnings Per Common Share | ||||||||||||||||||||||||||||||||
| Basic | $ | 1.16 | $ | 1.09 | $ | 1.00 | $ | 1.15 | $ | 1.21 | ||||||||||||||||||||||
| Diluted | 1.15 | 1.09 | 0.99 | 1.13 | 1.20 | |||||||||||||||||||||||||||
| Weighted Average Shares Outstanding | ||||||||||||||||||||||||||||||||
| Basic | 1,326,539 | 1,330,160 | 1,329,037 | 1,329,979 | 1,334,825 | |||||||||||||||||||||||||||
| Diluted | 1,336,659 | 1,338,864 | 1,341,563 | 1,343,029 | 1,346,854 | |||||||||||||||||||||||||||
4 Truist Financial Corporation
| Consolidated Ending Balance Sheets - Five Quarter Trend | ||||||||||||||||||||||||||||||||
| Sept. 30 | June 30 | March 31 | Dec. 31 | Sept. 30 | ||||||||||||||||||||||||||||
| (Dollars in millions) | 2022 | 2022 | 2022 | 2021 | 2021 | |||||||||||||||||||||||||||
| Assets | ||||||||||||||||||||||||||||||||
| Cash and due from banks | $ | 5,031 | $ | 5,511 | $ | 5,516 | $ | 5,085 | $ | 4,656 | ||||||||||||||||||||||
| Interest-bearing deposits with banks | 17,194 | 17,602 | 23,606 | 15,210 | 15,171 | |||||||||||||||||||||||||||
| Securities borrowed or purchased under resale agreements | 2,568 | 2,650 | 2,322 | 4,028 | 1,919 | |||||||||||||||||||||||||||
| Trading assets at fair value | 5,864 | 5,230 | 5,920 | 4,423 | 6,972 | |||||||||||||||||||||||||||
| Securities available for sale at fair value | 72,978 | 79,278 | 84,753 | 153,123 | 151,038 | |||||||||||||||||||||||||||
| Securities held to maturity at amortized cost | 58,754 | 60,081 | 61,662 | 1,494 | — | |||||||||||||||||||||||||||
| Loans and leases: | ||||||||||||||||||||||||||||||||
| Commercial: | ||||||||||||||||||||||||||||||||
| Commercial and industrial | 153,615 | 149,840 | 141,060 | 138,762 | 133,791 | |||||||||||||||||||||||||||
| CRE | 22,493 | 22,149 | 22,774 | 23,951 | 24,309 | |||||||||||||||||||||||||||
| Commercial construction | 5,568 | 5,157 | 5,220 | 4,971 | 5,689 | |||||||||||||||||||||||||||
| Consumer: | ||||||||||||||||||||||||||||||||
| Residential mortgage | 55,529 | 50,903 | 48,171 | 47,852 | 46,691 | |||||||||||||||||||||||||||
| Residential home equity and direct | 25,657 | 25,345 | 24,853 | 25,066 | 25,222 | |||||||||||||||||||||||||||
| Indirect auto | 28,239 | 27,419 | 25,756 | 26,441 | 26,923 | |||||||||||||||||||||||||||
| Indirect other | 12,683 | 11,961 | 11,043 | 10,883 | 11,155 | |||||||||||||||||||||||||||
| Student | 5,780 | 6,144 | 6,514 | 6,780 | 7,059 | |||||||||||||||||||||||||||
| Credit card | 4,771 | 4,744 | 4,690 | 4,807 | 4,683 | |||||||||||||||||||||||||||
| Total loans and leases held for investment | 314,335 | 303,662 | 290,081 | 289,513 | 285,522 | |||||||||||||||||||||||||||
| Loans held for sale | 2,304 | 3,638 | 4,167 | 4,812 | 5,133 | |||||||||||||||||||||||||||
| Total loans and leases | 316,639 | 307,300 | 294,248 | 294,325 | 290,655 | |||||||||||||||||||||||||||
| Allowance for loan and lease losses | (4,205) | (4,187) | (4,170) | (4,435) | (4,702) | |||||||||||||||||||||||||||
| Premises and equipment | 3,585 | 3,682 | 3,662 | 3,700 | 3,719 | |||||||||||||||||||||||||||
| Goodwill | 26,810 | 26,299 | 26,284 | 26,098 | 24,891 | |||||||||||||||||||||||||||
| Core deposit and other intangible assets | 3,726 | 3,535 | 3,693 | 3,408 | 2,930 | |||||||||||||||||||||||||||
| Loan servicing rights at fair value | 3,797 | 3,466 | 3,013 | 2,633 | 2,584 | |||||||||||||||||||||||||||
| Other assets | 35,697 | 34,676 | 33,470 | 32,149 | 30,051 | |||||||||||||||||||||||||||
| Total assets | $ | 548,438 | $ | 545,123 | $ | 543,979 | $ | 541,241 | $ | 529,884 | ||||||||||||||||||||||
| Liabilities | ||||||||||||||||||||||||||||||||
| Deposits: | ||||||||||||||||||||||||||||||||
| Noninterest-bearing deposits | $ | 144,826 | $ | 147,752 | $ | 150,446 | $ | 145,892 | $ | 143,595 | ||||||||||||||||||||||
| Interest checking | 110,397 | 114,143 | 119,572 | 115,754 | 108,954 | |||||||||||||||||||||||||||
| Money market and savings | 146,315 | 149,302 | 143,834 | 138,956 | 136,633 | |||||||||||||||||||||||||||
| Time deposits | 14,454 | 13,562 | 14,476 | 15,886 | 16,675 | |||||||||||||||||||||||||||
| Total deposits | 415,992 | 424,759 | 428,328 | 416,488 | 405,857 | |||||||||||||||||||||||||||
| Short-term borrowings | 25,687 | 13,736 | 5,147 | 5,292 | 5,226 | |||||||||||||||||||||||||||
| Long-term debt | 31,172 | 30,319 | 33,773 | 35,913 | 37,837 | |||||||||||||||||||||||||||
| Other liabilities | 14,776 | 13,310 | 11,687 | 14,277 | 12,064 | |||||||||||||||||||||||||||
| Total liabilities | 487,627 | 482,124 | 478,935 | 471,970 | 460,984 | |||||||||||||||||||||||||||
| Shareholders’ Equity: | ||||||||||||||||||||||||||||||||
| Preferred stock | 6,673 | 6,673 | 6,673 | 6,673 | 6,673 | |||||||||||||||||||||||||||
| Common stock | 6,634 | 6,632 | 6,657 | 6,639 | 6,674 | |||||||||||||||||||||||||||
| Additional paid-in capital | 34,487 | 34,410 | 34,539 | 34,565 | 34,977 | |||||||||||||||||||||||||||
| Retained earnings | 25,344 | 24,500 | 23,687 | 22,998 | 22,114 | |||||||||||||||||||||||||||
| Accumulated other comprehensive loss | (12,350) | (9,240) | (6,535) | (1,604) | (1,538) | |||||||||||||||||||||||||||
| Noncontrolling interests | 23 | 24 | 23 | — | — | |||||||||||||||||||||||||||
| Total shareholders’ equity | 60,811 | 62,999 | 65,044 | 69,271 | 68,900 | |||||||||||||||||||||||||||
| Total liabilities and shareholders’ equity | $ | 548,438 | $ | 545,123 | $ | 543,979 | $ | 541,241 | $ | 529,884 | ||||||||||||||||||||||
Truist Financial Corporation 5
| Average Balance Sheets | |||||||||||||||||||||||||||||||||||||||||||||||
| Quarter Ended | Year-to-Date | ||||||||||||||||||||||||||||||||||||||||||||||
| September 30 | Change | September 30 | Change | ||||||||||||||||||||||||||||||||||||||||||||
| (Dollars in millions) | 2022 | 2021 | $ | % | 2022 | 2021 | $ | % | |||||||||||||||||||||||||||||||||||||||
| Assets | |||||||||||||||||||||||||||||||||||||||||||||||
| Securities at amortized cost (1): | |||||||||||||||||||||||||||||||||||||||||||||||
| U.S. Treasury | $ | 10,925 | $ | 9,699 | $ | 1,226 | 12.6% | $ | 10,457 | $ | 6,872 | $ | 3,585 | 52.2% | |||||||||||||||||||||||||||||||||
| U.S. government-sponsored entities (GSE) | 305 | 1,830 | (1,525) | (83.3) | 557 | 1,837 | (1,280) | (69.7) | |||||||||||||||||||||||||||||||||||||||
| Mortgage-backed securities issued by GSE | 129,703 | 132,890 | (3,187) | (2.4) | 133,338 | 125,157 | 8,181 | 6.5 | |||||||||||||||||||||||||||||||||||||||
| States and political subdivisions | 395 | 425 | (30) | (7.1) | 380 | 435 | (55) | (12.6) | |||||||||||||||||||||||||||||||||||||||
| Non-agency mortgage-backed | 4,016 | 1,398 | 2,618 | 187.3 | 4,112 | 477 | 3,635 | NM | |||||||||||||||||||||||||||||||||||||||
| Other | 52 | 30 | 22 | 73.3 | 51 | 32 | 19 | 59.4 | |||||||||||||||||||||||||||||||||||||||
| Total securities | 145,396 | 146,272 | (876) | (0.6) | 148,895 | 134,810 | 14,085 | 10.4 | |||||||||||||||||||||||||||||||||||||||
| Loans and leases: | |||||||||||||||||||||||||||||||||||||||||||||||
| Commercial: | |||||||||||||||||||||||||||||||||||||||||||||||
| Commercial and industrial | 152,123 | 134,942 | 17,181 | 12.7 | 145,566 | 138,146 | 7,420 | 5.4 | |||||||||||||||||||||||||||||||||||||||
| CRE | 22,245 | 24,849 | (2,604) | (10.5) | 22,765 | 25,563 | (2,798) | (10.9) | |||||||||||||||||||||||||||||||||||||||
| Commercial construction | 5,284 | 5,969 | (685) | (11.5) | 5,196 | 6,293 | (1,097) | (17.4) | |||||||||||||||||||||||||||||||||||||||
| Consumer: | |||||||||||||||||||||||||||||||||||||||||||||||
| Residential mortgage | 53,271 | 45,369 | 7,902 | 17.4 | 50,180 | 44,931 | 5,249 | 11.7 | |||||||||||||||||||||||||||||||||||||||
| Residential home equity and direct | 25,394 | 25,242 | 152 | 0.6 | 25,136 | 25,378 | (242) | (1.0) | |||||||||||||||||||||||||||||||||||||||
| Indirect auto | 28,057 | 26,830 | 1,227 | 4.6 | 26,888 | 26,547 | 341 | 1.3 | |||||||||||||||||||||||||||||||||||||||
| Indirect other | 12,300 | 11,112 | 1,188 | 10.7 | 11,549 | 10,920 | 629 | 5.8 | |||||||||||||||||||||||||||||||||||||||
| Student | 5,958 | 7,214 | (1,256) | (17.4) | 6,310 | 7,375 | (1,065) | (14.4) | |||||||||||||||||||||||||||||||||||||||
| Credit card | 4,755 | 4,632 | 123 | 2.7 | 4,721 | 4,610 | 111 | 2.4 | |||||||||||||||||||||||||||||||||||||||
| Total loans and leases held for investment | 309,387 | 286,159 | 23,228 | 8.1 | 298,311 | 289,763 | 8,548 | 2.9 | |||||||||||||||||||||||||||||||||||||||
| Loans held for sale | 2,489 | 4,179 | (1,690) | (40.4) | 3,167 | 4,485 | (1,318) | (29.4) | |||||||||||||||||||||||||||||||||||||||
| Total loans and leases | 311,876 | 290,338 | 21,538 | 7.4 | 301,478 | 294,248 | 7,230 | 2.5 | |||||||||||||||||||||||||||||||||||||||
| Interest earning trading assets | 5,446 | 5,809 | (363) | (6.2) | 5,784 | 5,208 | 576 | 11.1 | |||||||||||||||||||||||||||||||||||||||
| Other earning assets | 19,631 | 19,331 | 300 | 1.6 | 19,924 | 19,453 | 471 | 2.4 | |||||||||||||||||||||||||||||||||||||||
| Total earning assets | 482,349 | 461,750 | 20,599 | 4.5 | 476,081 | 453,719 | 22,362 | 4.9 | |||||||||||||||||||||||||||||||||||||||
| Nonearning assets | 63,257 | 64,935 | (1,678) | (2.6) | 64,673 | 64,444 | 229 | 0.4 | |||||||||||||||||||||||||||||||||||||||
| Total assets | $ | 545,606 | $ | 526,685 | $ | 18,921 | 3.6 | % | $ | 540,754 | $ | 518,163 | $ | 22,591 | 4.4 | % | |||||||||||||||||||||||||||||||
| Liabilities and Shareholders’ Equity | |||||||||||||||||||||||||||||||||||||||||||||||
| Deposits: | |||||||||||||||||||||||||||||||||||||||||||||||
| Noninterest-bearing deposits | $ | 146,041 | $ | 141,738 | $ | 4,303 | 3.0 | % | $ | 146,862 | $ | 136,118 | $ | 10,744 | 7.9 | % | |||||||||||||||||||||||||||||||
| Interest checking | 111,645 | 107,802 | 3,843 | 3.6 | 112,058 | 106,234 | 5,824 | 5.5 | |||||||||||||||||||||||||||||||||||||||
| Money market and savings | 147,659 | 136,094 | 11,565 | 8.5 | 145,953 | 133,167 | 12,786 | 9.6 | |||||||||||||||||||||||||||||||||||||||
| Time deposits | 14,751 | 17,094 | (2,343) | (13.7) | 14,840 | 18,609 | (3,769) | (20.3) | |||||||||||||||||||||||||||||||||||||||
| Total deposits | 420,096 | 402,728 | 17,368 | 4.3 | 419,713 | 394,128 | 25,585 | 6.5 | |||||||||||||||||||||||||||||||||||||||
| Short-term borrowings | 17,392 | 5,360 | 12,032 | NM | 11,356 | 6,081 | 5,275 | 86.7 | |||||||||||||||||||||||||||||||||||||||
| Long-term debt | 31,381 | 37,329 | (5,948) | (15.9) | 32,646 | 37,339 | (4,693) | (12.6) | |||||||||||||||||||||||||||||||||||||||
| Other liabilities | 13,227 | 11,915 | 1,312 | 11.0 | 12,448 | 11,262 | 1,186 | 10.5 | |||||||||||||||||||||||||||||||||||||||
| Total liabilities | 482,096 | 457,332 | 24,764 | 5.4 | 476,163 | 448,810 | 27,353 | 6.1 | |||||||||||||||||||||||||||||||||||||||
| Shareholders’ equity | 63,510 | 69,353 | (5,843) | (8.4) | 64,591 | 69,353 | (4,762) | (6.9) | |||||||||||||||||||||||||||||||||||||||
| Total liabilities and shareholders’ equity | $ | 545,606 | $ | 526,685 | $ | 18,921 | 3.6 | % | $ | 540,754 | $ | 518,163 | $ | 22,591 | 4.4 | % | |||||||||||||||||||||||||||||||
| Average balances exclude basis adjustments for fair value hedges. | |||||||||||||||||||||||||||||||||||||||||||||||
| (1) Includes AFS and HTM securities. | |||||||||||||||||||||||||||||||||||||||||||||||
| NM - not meaningful | |||||||||||||||||||||||||||||||||||||||||||||||
6 Truist Financial Corporation
| Average Balance Sheets - Five Quarter Trend | ||||||||||||||||||||||||||||||||
| Quarter Ended | ||||||||||||||||||||||||||||||||
| Sept. 30 | June 30 | March 31 | Dec. 31 | Sept. 30 | ||||||||||||||||||||||||||||
| (Dollars in millions) | 2022 | 2022 | 2022 | 2021 | 2021 | |||||||||||||||||||||||||||
| Assets | ||||||||||||||||||||||||||||||||
| Securities at amortized cost (1): | ||||||||||||||||||||||||||||||||
| U.S. Treasury | $ | 10,925 | $ | 10,544 | $ | 9,890 | $ | 9,891 | $ | 9,699 | ||||||||||||||||||||||
| U.S. government-sponsored entities (GSE) | 305 | 255 | 1,120 | 1,686 | 1,830 | |||||||||||||||||||||||||||
| Mortgage-backed securities issued by GSE | 129,703 | 133,339 | 137,052 | 137,651 | 132,890 | |||||||||||||||||||||||||||
| States and political subdivisions | 395 | 371 | 374 | 410 | 425 | |||||||||||||||||||||||||||
| Non-agency mortgage-backed | 4,016 | 4,097 | 4,224 | 3,738 | 1,398 | |||||||||||||||||||||||||||
| Other | 52 | 75 | 27 | 29 | 30 | |||||||||||||||||||||||||||
| Total securities | 145,396 | 148,681 | 152,687 | 153,405 | 146,272 | |||||||||||||||||||||||||||
| Loans and leases: | ||||||||||||||||||||||||||||||||
| Commercial: | ||||||||||||||||||||||||||||||||
| Commercial and industrial | 152,123 | 145,558 | 138,872 | 134,804 | 134,942 | |||||||||||||||||||||||||||
| CRE | 22,245 | 22,508 | 23,555 | 24,396 | 24,849 | |||||||||||||||||||||||||||
| Commercial construction | 5,284 | 5,256 | 5,046 | 5,341 | 5,969 | |||||||||||||||||||||||||||
| Consumer: | ||||||||||||||||||||||||||||||||
| Residential mortgage | 53,271 | 49,237 | 47,976 | 47,185 | 45,369 | |||||||||||||||||||||||||||
| Residential home equity and direct | 25,394 | 25,124 | 24,883 | 25,146 | 25,242 | |||||||||||||||||||||||||||
| Indirect auto | 28,057 | 26,496 | 26,088 | 26,841 | 26,830 | |||||||||||||||||||||||||||
| Indirect other | 12,300 | 11,471 | 10,860 | 10,978 | 11,112 | |||||||||||||||||||||||||||
| Student | 5,958 | 6,331 | 6,648 | 6,884 | 7,214 | |||||||||||||||||||||||||||
| Credit card | 4,755 | 4,728 | 4,682 | 4,769 | 4,632 | |||||||||||||||||||||||||||
| Total loans and leases held for investment | 309,387 | 296,709 | 288,610 | 286,344 | 286,159 | |||||||||||||||||||||||||||
| Loans held for sale | 2,489 | 3,152 | 3,874 | 4,730 | 4,179 | |||||||||||||||||||||||||||
| Total loans and leases | 311,876 | 299,861 | 292,484 | 291,074 | 290,338 | |||||||||||||||||||||||||||
| Interest earning trading assets | 5,446 | 6,073 | 5,837 | 6,772 | 5,809 | |||||||||||||||||||||||||||
| Other earning assets | 19,631 | 21,203 | 18,932 | 19,634 | 19,331 | |||||||||||||||||||||||||||
| Total earning assets | 482,349 | 475,818 | 469,940 | 470,885 | 461,750 | |||||||||||||||||||||||||||
| Nonearning assets | 63,257 | 64,750 | 66,041 | 64,026 | 64,935 | |||||||||||||||||||||||||||
| Total assets | $ | 545,606 | $ | 540,568 | $ | 535,981 | $ | 534,911 | $ | 526,685 | ||||||||||||||||||||||
| Liabilities and Shareholders’ Equity | ||||||||||||||||||||||||||||||||
| Deposits: | ||||||||||||||||||||||||||||||||
| Noninterest-bearing deposits | $ | 146,041 | $ | 148,610 | $ | 145,933 | $ | 146,492 | $ | 141,738 | ||||||||||||||||||||||
| Interest checking | 111,645 | 112,375 | 112,159 | 110,506 | 107,802 | |||||||||||||||||||||||||||
| Money market and savings | 147,659 | 148,632 | 141,500 | 137,676 | 136,094 | |||||||||||||||||||||||||||
| Time deposits | 14,751 | 14,133 | 15,646 | 16,292 | 17,094 | |||||||||||||||||||||||||||
| Total deposits | 420,096 | 423,750 | 415,238 | 410,966 | 402,728 | |||||||||||||||||||||||||||
| Short-term borrowings | 17,392 | 9,618 | 6,944 | 6,433 | 5,360 | |||||||||||||||||||||||||||
| Long-term debt | 31,381 | 31,263 | 35,337 | 37,623 | 37,329 | |||||||||||||||||||||||||||
| Other liabilities | 13,227 | 12,437 | 11,664 | 11,409 | 11,915 | |||||||||||||||||||||||||||
| Total liabilities | 482,096 | 477,068 | 469,183 | 466,431 | 457,332 | |||||||||||||||||||||||||||
| Shareholders’ equity | 63,510 | 63,500 | 66,798 | 68,480 | 69,353 | |||||||||||||||||||||||||||
| Total liabilities and shareholders’ equity | $ | 545,606 | $ | 540,568 | $ | 535,981 | $ | 534,911 | $ | 526,685 | ||||||||||||||||||||||
| Average balances exclude basis adjustments for fair value hedges. | ||||||||||||||||||||||||||||||||
| (1) Includes AFS and HTM securities. | ||||||||||||||||||||||||||||||||
Truist Financial Corporation 7
| Average Balances and Rates - Quarters | ||||||||||||||||||||||||||||||||||||||
| Quarter Ended | ||||||||||||||||||||||||||||||||||||||
| September 30, 2022 | June 30, 2022 | |||||||||||||||||||||||||||||||||||||
| (1) | (2) Interest | (2) | (1) | (2) Interest | (2) | |||||||||||||||||||||||||||||||||
| Average | Income/ | Yields/ | Average | Income/ | Yields/ | |||||||||||||||||||||||||||||||||
| (Dollars in millions) | Balances | Expense | Rates | Balances | Expense | Rates | ||||||||||||||||||||||||||||||||
| Assets | ||||||||||||||||||||||||||||||||||||||
| Securities at amortized cost (3): | ||||||||||||||||||||||||||||||||||||||
| U.S. Treasury | $ | 10,925 | $ | 26 | 0.93 | % | $ | 10,544 | $ | 22 | 0.86 | % | ||||||||||||||||||||||||||
| U.S. government-sponsored entities (GSE) | 305 | 1 | 2.56 | 255 | 1 | 1.96 | ||||||||||||||||||||||||||||||||
| Mortgage-backed securities issued by GSE | 129,703 | 655 | 2.02 | 133,339 | 625 | 1.88 | ||||||||||||||||||||||||||||||||
| States and political subdivisions | 395 | 4 | 3.92 | 371 | 4 | 3.83 | ||||||||||||||||||||||||||||||||
| Non-agency mortgage-backed | 4,016 | 24 | 2.32 | 4,097 | 23 | 2.30 | ||||||||||||||||||||||||||||||||
| Other | 52 | — | 3.94 | 75 | 1 | 3.66 | ||||||||||||||||||||||||||||||||
| Total securities | 145,396 | 710 | 1.95 | 148,681 | 676 | 1.82 | ||||||||||||||||||||||||||||||||
| Loans and leases: | ||||||||||||||||||||||||||||||||||||||
| Commercial: | ||||||||||||||||||||||||||||||||||||||
| Commercial and industrial | 152,123 | 1,564 | 4.08 | 145,558 | 1,174 | 3.24 | ||||||||||||||||||||||||||||||||
| CRE | 22,245 | 245 | 4.32 | 22,508 | 193 | 3.41 | ||||||||||||||||||||||||||||||||
| Commercial construction | 5,284 | 62 | 4.83 | 5,256 | 43 | 3.46 | ||||||||||||||||||||||||||||||||
| Consumer: | ||||||||||||||||||||||||||||||||||||||
| Residential mortgage | 53,271 | 478 | 3.59 | 49,237 | 440 | 3.58 | ||||||||||||||||||||||||||||||||
| Residential home equity and direct | 25,394 | 361 | 5.64 | 25,124 | 329 | 5.25 | ||||||||||||||||||||||||||||||||
| Indirect auto | 28,057 | 382 | 5.40 | 26,496 | 362 | 5.47 | ||||||||||||||||||||||||||||||||
| Indirect other | 12,300 | 200 | 6.46 | 11,471 | 180 | 6.27 | ||||||||||||||||||||||||||||||||
| Student | 5,958 | 85 | 5.64 | 6,331 | 66 | 4.20 | ||||||||||||||||||||||||||||||||
| Credit card | 4,755 | 119 | 9.97 | 4,728 | 105 | 8.91 | ||||||||||||||||||||||||||||||||
| Total loans and leases held for investment | 309,387 | 3,496 | 4.49 | 296,709 | 2,892 | 3.91 | ||||||||||||||||||||||||||||||||
| Loans held for sale | 2,489 | 30 | 4.81 | 3,152 | 33 | 4.20 | ||||||||||||||||||||||||||||||||
| Total loans and leases | 311,876 | 3,526 | 4.49 | 299,861 | 2,925 | 3.91 | ||||||||||||||||||||||||||||||||
| Interest earning trading assets | 5,446 | 62 | 4.49 | 6,073 | 55 | 3.55 | ||||||||||||||||||||||||||||||||
| Other earning assets | 19,631 | 109 | 2.24 | 21,203 | 45 | 0.85 | ||||||||||||||||||||||||||||||||
| Total earning assets | 482,349 | 4,407 | 3.63 | 475,818 | 3,701 | 3.12 | ||||||||||||||||||||||||||||||||
| Nonearning assets | 63,257 | 64,750 | ||||||||||||||||||||||||||||||||||||
| Total assets | $ | 545,606 | $ | 540,568 | ||||||||||||||||||||||||||||||||||
| Liabilities and Shareholders’ Equity | ||||||||||||||||||||||||||||||||||||||
| Interest-bearing deposits: | ||||||||||||||||||||||||||||||||||||||
| Interest checking | $ | 111,645 | 158 | 0.56 | $ | 112,375 | 43 | 0.15 | ||||||||||||||||||||||||||||||
| Money market and savings | 147,659 | 159 | 0.43 | 148,632 | 50 | 0.13 | ||||||||||||||||||||||||||||||||
| Time deposits | 14,751 | 14 | 0.40 | 14,133 | 6 | 0.17 | ||||||||||||||||||||||||||||||||
| Total interest-bearing deposits (4) | 274,055 | 331 | 0.48 | 275,140 | 99 | 0.14 | ||||||||||||||||||||||||||||||||
| Short-term borrowings | 17,392 | 103 | 2.34 | 9,618 | 30 | 1.26 | ||||||||||||||||||||||||||||||||
| Long-term debt | 31,381 | 190 | 2.43 | 31,263 | 137 | 1.75 | ||||||||||||||||||||||||||||||||
| Total interest-bearing liabilities | 322,828 | 624 | 0.77 | 316,021 | 266 | 0.34 | ||||||||||||||||||||||||||||||||
| Noninterest-bearing deposits (4) | 146,041 | 148,610 | ||||||||||||||||||||||||||||||||||||
| Other liabilities | 13,227 | 12,437 | ||||||||||||||||||||||||||||||||||||
| Shareholders’ equity | 63,510 | 63,500 | ||||||||||||||||||||||||||||||||||||
| Total liabilities and shareholders’ equity | $ | 545,606 | $ | 540,568 | ||||||||||||||||||||||||||||||||||
| Average interest-rate spread | 2.86 | 2.78 | ||||||||||||||||||||||||||||||||||||
| Net interest income/ net interest margin - taxable equivalent | $ | 3,783 | 3.12 | % | $ | 3,435 | 2.89 | % | ||||||||||||||||||||||||||||||
| Taxable-equivalent adjustment | $ | 38 | $ | 28 | ||||||||||||||||||||||||||||||||||
| Applicable ratios are annualized. | ||||||||||||||||||||||||||||||||||||||
| (1) Excludes basis adjustments for fair value hedges. | ||||||||||||||||||||||||||||||||||||||
| (2) Amounts are on a taxable-equivalent basis utilizing the federal income tax rate of 21% for the periods presented. Interest income includes certain fees, deferred costs, and dividends. | ||||||||||||||||||||||||||||||||||||||
| (3) Includes AFS and HTM securities. | ||||||||||||||||||||||||||||||||||||||
| (4) Total deposit costs were 0.31% and 0.09% for the three months ended September 30, 2022 and June 30, 2022, respectively. | ||||||||||||||||||||||||||||||||||||||
8 Truist Financial Corporation
| Average Balances and Rates - Quarters | ||||||||||||||||||||||||||||||||||||||||||||||||||||||||
| Quarter Ended | ||||||||||||||||||||||||||||||||||||||||||||||||||||||||
| March 31, 2022 | December 31, 2021 | September 30, 2021 | ||||||||||||||||||||||||||||||||||||||||||||||||||||||
| (1) | (2) Interest | (2) | (1) | (2) Interest | (2) | (1) | (2) Interest | (2) | ||||||||||||||||||||||||||||||||||||||||||||||||
| Average | Income/ | Yields/ | Average | Income/ | Yields/ | Average | Income/ | Yields/ | ||||||||||||||||||||||||||||||||||||||||||||||||
| (Dollars in millions) | Balances | Expense | Rates | Balances | Expense | Rates | Balances | Expense | Rates | |||||||||||||||||||||||||||||||||||||||||||||||
| Assets | ||||||||||||||||||||||||||||||||||||||||||||||||||||||||
| Securities at amortized cost (3): | ||||||||||||||||||||||||||||||||||||||||||||||||||||||||
| U.S. Treasury | $ | 9,890 | $ | 18 | 0.72 | % | $ | 9,891 | $ | 18 | 0.72 | % | $ | 9,699 | $ | 18 | 0.72 | % | ||||||||||||||||||||||||||||||||||||||
| U.S. government-sponsored entities (GSE) | 1,120 | 6 | 2.13 | 1,686 | 9 | 2.20 | 1,830 | 10 | 2.31 | |||||||||||||||||||||||||||||||||||||||||||||||
| Mortgage-backed securities issued by GSE | 137,052 | 590 | 1.72 | 137,651 | 552 | 1.60 | 132,890 | 509 | 1.53 | |||||||||||||||||||||||||||||||||||||||||||||||
| States and political subdivisions | 374 | 3 | 3.72 | 410 | 3 | 3.60 | 425 | 4 | 3.52 | |||||||||||||||||||||||||||||||||||||||||||||||
| Non-agency mortgage-backed | 4,224 | 24 | 2.25 | 3,738 | 20 | 2.23 | 1,398 | 8 | 2.20 | |||||||||||||||||||||||||||||||||||||||||||||||
| Other | 27 | — | 2.04 | 29 | 1 | 1.90 | 30 | — | 1.90 | |||||||||||||||||||||||||||||||||||||||||||||||
| Total securities | 152,687 | 641 | 1.68 | 153,405 | 603 | 1.57 | 146,272 | 549 | 1.50 | |||||||||||||||||||||||||||||||||||||||||||||||
| Loans and leases: | ||||||||||||||||||||||||||||||||||||||||||||||||||||||||
| Commercial: | ||||||||||||||||||||||||||||||||||||||||||||||||||||||||
| Commercial and industrial | 138,872 | 987 | 2.88 | 134,804 | 986 | 2.90 | 134,942 | 1,023 | 3.01 | |||||||||||||||||||||||||||||||||||||||||||||||
| CRE | 23,555 | 168 | 2.84 | 24,396 | 175 | 2.81 | 24,849 | 181 | 2.86 | |||||||||||||||||||||||||||||||||||||||||||||||
| Commercial construction | 5,046 | 35 | 3.05 | 5,341 | 38 | 2.96 | 5,969 | 42 | 2.96 | |||||||||||||||||||||||||||||||||||||||||||||||
| Consumer: | ||||||||||||||||||||||||||||||||||||||||||||||||||||||||
| Residential mortgage | 47,976 | 428 | 3.57 | 47,185 | 453 | 3.84 | 45,369 | 450 | 3.96 | |||||||||||||||||||||||||||||||||||||||||||||||
| Residential home equity and direct | 24,883 | 330 | 5.38 | 25,146 | 352 | 5.55 | 25,242 | 360 | 5.67 | |||||||||||||||||||||||||||||||||||||||||||||||
| Indirect auto | 26,088 | 357 | 5.56 | 26,841 | 389 | 5.75 | 26,830 | 405 | 5.99 | |||||||||||||||||||||||||||||||||||||||||||||||
| Indirect other | 10,860 | 169 | 6.32 | 10,978 | 176 | 6.42 | 11,112 | 183 | 6.54 | |||||||||||||||||||||||||||||||||||||||||||||||
| Student | 6,648 | 63 | 3.86 | 6,884 | 70 | 4.07 | 7,214 | 74 | 4.02 | |||||||||||||||||||||||||||||||||||||||||||||||
| Credit card | 4,682 | 104 | 8.97 | 4,769 | 105 | 8.69 | 4,632 | 105 | 9.01 | |||||||||||||||||||||||||||||||||||||||||||||||
| Total loans and leases held for investment | 288,610 | 2,641 | 3.70 | 286,344 | 2,744 | 3.81 | 286,159 | 2,823 | 3.92 | |||||||||||||||||||||||||||||||||||||||||||||||
| Loans held for sale | 3,874 | 28 | 2.87 | 4,730 | 32 | 2.66 | 4,179 | 28 | 2.69 | |||||||||||||||||||||||||||||||||||||||||||||||
| Total loans and leases | 292,484 | 2,669 | 3.69 | 291,074 | 2,776 | 3.79 | 290,338 | 2,851 | 3.90 | |||||||||||||||||||||||||||||||||||||||||||||||
| Interest earning trading assets | 5,837 | 43 | 3.04 | 6,772 | 46 | 2.72 | 5,809 | 41 | 2.81 | |||||||||||||||||||||||||||||||||||||||||||||||
| Other earning assets | 18,932 | 30 | 0.63 | 19,634 | 10 | 0.20 | 19,331 | 13 | 0.25 | |||||||||||||||||||||||||||||||||||||||||||||||
| Total earning assets | 469,940 | 3,383 | 2.90 | 470,885 | 3,435 | 2.90 | 461,750 | 3,454 | 2.98 | |||||||||||||||||||||||||||||||||||||||||||||||
| Nonearning assets | 66,041 | 64,026 | 64,935 | |||||||||||||||||||||||||||||||||||||||||||||||||||||
| Total assets | $ | 535,981 | $ | 534,911 | $ | 526,685 | ||||||||||||||||||||||||||||||||||||||||||||||||||
| Liabilities and Shareholders’ Equity | ||||||||||||||||||||||||||||||||||||||||||||||||||||||||
| Interest-bearing deposits: | ||||||||||||||||||||||||||||||||||||||||||||||||||||||||
| Interest checking | $ | 112,159 | 14 | 0.05 | $ | 110,506 | 15 | 0.05 | $ | 107,802 | 14 | 0.05 | ||||||||||||||||||||||||||||||||||||||||||||
| Money market and savings | 141,500 | 11 | 0.03 | 137,676 | 8 | 0.03 | 136,094 | 9 | 0.03 | |||||||||||||||||||||||||||||||||||||||||||||||
| Time deposits | 15,646 | 7 | 0.18 | 16,292 | 9 | 0.21 | 17,094 | 10 | 0.23 | |||||||||||||||||||||||||||||||||||||||||||||||
| Total interest-bearing deposits (4) | 269,305 | 32 | 0.05 | 264,474 | 32 | 0.05 | 260,990 | 33 | 0.05 | |||||||||||||||||||||||||||||||||||||||||||||||
| Short-term borrowings | 6,944 | 10 | 0.60 | 6,433 | 9 | 0.55 | 5,360 | 9 | 0.68 | |||||||||||||||||||||||||||||||||||||||||||||||
| Long-term debt | 35,337 | 132 | 1.50 | 37,623 | 127 | 1.35 | 37,329 | 151 | 1.61 | |||||||||||||||||||||||||||||||||||||||||||||||
| Total interest-bearing liabilities | 311,586 | 174 | 0.22 | 308,530 | 168 | 0.22 | 303,679 | 193 | 0.25 | |||||||||||||||||||||||||||||||||||||||||||||||
| Noninterest-bearing deposits (4) | 145,933 | 146,492 | 141,738 | |||||||||||||||||||||||||||||||||||||||||||||||||||||
| Other liabilities | 11,664 | 11,409 | 11,915 | |||||||||||||||||||||||||||||||||||||||||||||||||||||
| Shareholders’ equity | 66,798 | 68,480 | 69,353 | |||||||||||||||||||||||||||||||||||||||||||||||||||||
| Total liabilities and shareholders’ equity | $ | 535,981 | $ | 534,911 | $ | 526,685 | ||||||||||||||||||||||||||||||||||||||||||||||||||
| Average interest-rate spread | 2.68 | 2.68 | 2.73 | |||||||||||||||||||||||||||||||||||||||||||||||||||||
| Net interest income/ net interest margin - taxable equivalent | $ | 3,209 | 2.76 | % | $ | 3,267 | 2.76 | % | $ | 3,261 | 2.81 | % | ||||||||||||||||||||||||||||||||||||||||||||
| Taxable-equivalent adjustment | $ | 26 | $ | 24 | $ | 28 | ||||||||||||||||||||||||||||||||||||||||||||||||||
| Applicable ratios are annualized. | ||||||||||||||||||||||||||||||||||||||||||||||||||||||||
| (1) Excludes basis adjustments for fair value hedges. | ||||||||||||||||||||||||||||||||||||||||||||||||||||||||
| (2) Amounts are on a taxable-equivalent basis utilizing the federal income tax rate of 21% for the periods presented. Interest income includes certain fees, deferred costs, and dividends. | ||||||||||||||||||||||||||||||||||||||||||||||||||||||||
| (3) Includes AFS and HTM securities. | ||||||||||||||||||||||||||||||||||||||||||||||||||||||||
| (4) Total deposit costs were 0.03%, 0.03%, and 0.03% for the three months ended March 31, 2022, December 31, 2021, and September 30, 2021, respectively. | ||||||||||||||||||||||||||||||||||||||||||||||||||||||||
Truist Financial Corporation 9
| Average Balances and Rates - Year-To-Date | ||||||||||||||||||||||||||||||||||||||
| Year-to-Date | ||||||||||||||||||||||||||||||||||||||
| September 30, 2022 | September 30, 2021 | |||||||||||||||||||||||||||||||||||||
| (1) | (2) Interest | (2) | (1) | (2) Interest | (2) | |||||||||||||||||||||||||||||||||
| Average | Income/ | Yields/ | Average | Income/ | Yields/ | |||||||||||||||||||||||||||||||||
| (Dollars in millions) | Balances | Expense | Rates | Balances | Expense | Rates | ||||||||||||||||||||||||||||||||
| Assets | ||||||||||||||||||||||||||||||||||||||
| Securities at amortized cost (3): | ||||||||||||||||||||||||||||||||||||||
| U.S. Treasury | $ | 10,457 | $ | 66 | 0.84 | % | $ | 6,872 | $ | 38 | 0.74 | % | ||||||||||||||||||||||||||
| U.S. government-sponsored entities (GSE) | 557 | 8 | 2.19 | 1,837 | 32 | 2.32 | ||||||||||||||||||||||||||||||||
| Mortgage-backed securities issued by GSE | 133,338 | 1,870 | 1.87 | 125,157 | 1,401 | 1.49 | ||||||||||||||||||||||||||||||||
| States and political subdivisions | 380 | 11 | 3.82 | 435 | 12 | 3.53 | ||||||||||||||||||||||||||||||||
| Non-agency mortgage-backed | 4,112 | 71 | 2.29 | 477 | 8 | 2.18 | ||||||||||||||||||||||||||||||||
| Other | 51 | 1 | 3.46 | 32 | — | 1.90 | ||||||||||||||||||||||||||||||||
| Total securities | 148,895 | 2,027 | 1.82 | 134,810 | 1,491 | 1.48 | ||||||||||||||||||||||||||||||||
| Loans and leases: | ||||||||||||||||||||||||||||||||||||||
| Commercial: | ||||||||||||||||||||||||||||||||||||||
| Commercial and industrial | 145,566 | 3,725 | 3.42 | 138,146 | 3,188 | 3.08 | ||||||||||||||||||||||||||||||||
| CRE | 22,765 | 606 | 3.52 | 25,563 | 553 | 2.86 | ||||||||||||||||||||||||||||||||
| Commercial construction | 5,196 | 140 | 3.80 | 6,293 | 135 | 2.98 | ||||||||||||||||||||||||||||||||
| Consumer: | ||||||||||||||||||||||||||||||||||||||
| Residential mortgage | 50,180 | 1,346 | 3.58 | 44,931 | 1,431 | 4.25 | ||||||||||||||||||||||||||||||||
| Residential home equity and direct | 25,136 | 1,020 | 5.43 | 25,378 | 1,089 | 5.74 | ||||||||||||||||||||||||||||||||
| Indirect auto | 26,888 | 1,101 | 5.47 | 26,547 | 1,240 | 6.25 | ||||||||||||||||||||||||||||||||
| Indirect other | 11,549 | 549 | 6.36 | 10,920 | 555 | 6.79 | ||||||||||||||||||||||||||||||||
| Student | 6,310 | 214 | 4.54 | 7,375 | 219 | 3.96 | ||||||||||||||||||||||||||||||||
| Credit card | 4,721 | 328 | 9.29 | 4,610 | 310 | 8.99 | ||||||||||||||||||||||||||||||||
| Total loans and leases held for investment | 298,311 | 9,029 | 4.04 | 289,763 | 8,720 | 4.02 | ||||||||||||||||||||||||||||||||
| Loans held for sale | 3,167 | 91 | 3.82 | 4,485 | 88 | 2.61 | ||||||||||||||||||||||||||||||||
| Total loans and leases | 301,478 | 9,120 | 4.04 | 294,248 | 8,808 | 4.00 | ||||||||||||||||||||||||||||||||
| Interest earning trading assets | 5,784 | 160 | 3.67 | 5,208 | 110 | 2.80 | ||||||||||||||||||||||||||||||||
| Other earning assets | 19,924 | 184 | 1.24 | 19,453 | 38 | 0.26 | ||||||||||||||||||||||||||||||||
| Total earning assets | 476,081 | 11,491 | 3.22 | 453,719 | 10,447 | 3.08 | ||||||||||||||||||||||||||||||||
| Nonearning assets | 64,673 | 64,444 | ||||||||||||||||||||||||||||||||||||
| Total assets | $ | 540,754 | $ | 518,163 | ||||||||||||||||||||||||||||||||||
| Liabilities and Shareholders’ Equity | ||||||||||||||||||||||||||||||||||||||
| Interest-bearing deposits: | ||||||||||||||||||||||||||||||||||||||
| Interest checking | $ | 112,058 | 215 | 0.26 | $ | 106,234 | 44 | 0.06 | ||||||||||||||||||||||||||||||
| Money market and savings | 145,953 | 220 | 0.20 | 133,167 | 27 | 0.03 | ||||||||||||||||||||||||||||||||
| Time deposits | 14,840 | 27 | 0.25 | 18,609 | 45 | 0.32 | ||||||||||||||||||||||||||||||||
| Total interest-bearing deposits (4) | 272,851 | 462 | 0.23 | 258,010 | 116 | 0.06 | ||||||||||||||||||||||||||||||||
| Short-term borrowings | 11,356 | 143 | 1.68 | 6,081 | 38 | 0.84 | ||||||||||||||||||||||||||||||||
| Long-term debt | 32,646 | 459 | 1.88 | 37,339 | 446 | 1.59 | ||||||||||||||||||||||||||||||||
| Total interest-bearing liabilities | 316,853 | 1,064 | 0.45 | 301,430 | 600 | 0.27 | ||||||||||||||||||||||||||||||||
| Noninterest-bearing deposits (4) | 146,862 | 136,118 | ||||||||||||||||||||||||||||||||||||
| Other liabilities | 12,448 | 11,262 | ||||||||||||||||||||||||||||||||||||
| Shareholders’ equity | 64,591 | 69,353 | ||||||||||||||||||||||||||||||||||||
| Total liabilities and shareholders’ equity | $ | 540,754 | $ | 518,163 | ||||||||||||||||||||||||||||||||||
| Average interest-rate spread | 2.77 | 2.81 | ||||||||||||||||||||||||||||||||||||
| Net interest income/ net interest margin - taxable equivalent | $ | 10,427 | 2.93 | % | $ | 9,847 | 2.90 | % | ||||||||||||||||||||||||||||||
| Taxable-equivalent adjustment | $ | 92 | $ | 84 | ||||||||||||||||||||||||||||||||||
| Applicable ratios are annualized. | ||||||||||||||||||||||||||||||||||||||
| (1) Excludes basis adjustments for fair value hedges. | ||||||||||||||||||||||||||||||||||||||
| (2) Amounts are on a taxable-equivalent basis utilizing the federal income tax rate of 21% for the periods presented. Interest income includes certain fees, deferred costs, and dividends. | ||||||||||||||||||||||||||||||||||||||
| (3) Includes AFS and HTM securities. | ||||||||||||||||||||||||||||||||||||||
| (4) Total deposit costs were 0.15% and 0.04% for the year ended September 30, 2022 and 2021, respectively. | ||||||||||||||||||||||||||||||||||||||
10 Truist Financial Corporation
| Credit Quality | ||||||||||||||||||||||||||||||||
| Sept. 30 | June 30 | March 31 | Dec. 31 | Sept. 30 | ||||||||||||||||||||||||||||
| (Dollars in millions) | 2022 | 2022 | 2022 | 2021 | 2021 | |||||||||||||||||||||||||||
| Nonperforming Assets | ||||||||||||||||||||||||||||||||
| Nonaccrual loans and leases: | ||||||||||||||||||||||||||||||||
| Commercial: | ||||||||||||||||||||||||||||||||
| Commercial and industrial | $ | 443 | $ | 393 | $ | 330 | $ | 394 | $ | 423 | ||||||||||||||||||||||
| CRE | 5 | 19 | 27 | 29 | 20 | |||||||||||||||||||||||||||
| Commercial construction | — | — | — | 7 | 7 | |||||||||||||||||||||||||||
| Consumer: | ||||||||||||||||||||||||||||||||
| Residential mortgage | 227 | 269 | 315 | 296 | 306 | |||||||||||||||||||||||||||
| Residential home equity and direct | 166 | 159 | 141 | 141 | 146 | |||||||||||||||||||||||||||
| Indirect auto | 260 | 244 | 227 | 218 | 172 | |||||||||||||||||||||||||||
| Indirect other | 5 | 6 | 4 | 5 | 6 | |||||||||||||||||||||||||||
| Total nonaccrual loans and leases held for investment | 1,106 | 1,090 | 1,044 | 1,090 | 1,080 | |||||||||||||||||||||||||||
| Loans held for sale | 72 | 33 | 39 | 22 | 76 | |||||||||||||||||||||||||||
| Total nonaccrual loans and leases | 1,178 | 1,123 | 1,083 | 1,112 | 1,156 | |||||||||||||||||||||||||||
| Foreclosed real estate | 4 | 3 | 3 | 8 | 9 | |||||||||||||||||||||||||||
| Other foreclosed property | 58 | 47 | 49 | 43 | 39 | |||||||||||||||||||||||||||
| Total nonperforming assets | $ | 1,240 | $ | 1,173 | $ | 1,135 | $ | 1,163 | $ | 1,204 | ||||||||||||||||||||||
| Troubled Debt Restructurings (TDRs) | ||||||||||||||||||||||||||||||||
| Performing TDRs: | ||||||||||||||||||||||||||||||||
| Commercial: | ||||||||||||||||||||||||||||||||
| Commercial and industrial | $ | 165 | $ | 105 | $ | 104 | $ | 147 | $ | 200 | ||||||||||||||||||||||
| CRE | 5 | 5 | 5 | 5 | 8 | |||||||||||||||||||||||||||
| Commercial construction | 1 | 1 | 1 | — | — | |||||||||||||||||||||||||||
| Consumer: | ||||||||||||||||||||||||||||||||
| Residential mortgage - government guaranteed | 839 | 761 | 622 | 480 | 507 | |||||||||||||||||||||||||||
| Residential mortgage - nonguaranteed | 305 | 281 | 244 | 212 | 205 | |||||||||||||||||||||||||||
| Residential home equity and direct | 78 | 84 | 91 | 98 | 105 | |||||||||||||||||||||||||||
| Indirect auto | 425 | 401 | 392 | 389 | 390 | |||||||||||||||||||||||||||
| Indirect other | 7 | 6 | 6 | 7 | 7 | |||||||||||||||||||||||||||
| Student - nonguaranteed | 29 | 27 | 25 | 25 | 23 | |||||||||||||||||||||||||||
| Credit card | 19 | 22 | 25 | 27 | 30 | |||||||||||||||||||||||||||
| Total performing TDRs | 1,873 | 1,693 | 1,515 | 1,390 | 1,475 | |||||||||||||||||||||||||||
| Nonperforming TDRs | 187 | 204 | 189 | 152 | 159 | |||||||||||||||||||||||||||
| Total TDRs | $ | 2,060 | $ | 1,897 | $ | 1,704 | $ | 1,542 | $ | 1,634 | ||||||||||||||||||||||
| Loans 90 Days or More Past Due and Still Accruing | ||||||||||||||||||||||||||||||||
| Commercial: | ||||||||||||||||||||||||||||||||
| Commercial and industrial | $ | 44 | $ | 27 | $ | 22 | $ | 13 | $ | 18 | ||||||||||||||||||||||
| CRE | 1 | 3 | — | — | — | |||||||||||||||||||||||||||
| Commercial construction | — | 3 | — | — | — | |||||||||||||||||||||||||||
| Consumer: | ||||||||||||||||||||||||||||||||
| Residential mortgage - government guaranteed | 808 | 884 | 996 | 978 | 823 | |||||||||||||||||||||||||||
| Residential mortgage - nonguaranteed | 26 | 27 | 31 | 31 | 29 | |||||||||||||||||||||||||||
| Residential home equity and direct | 12 | 10 | 12 | 9 | 7 | |||||||||||||||||||||||||||
| Indirect auto | 1 | 1 | 1 | 1 | 2 | |||||||||||||||||||||||||||
| Indirect other | 6 | 3 | 2 | 3 | 2 | |||||||||||||||||||||||||||
| Student - government guaranteed | 770 | 796 | 818 | 864 | 965 | |||||||||||||||||||||||||||
| Student - nonguaranteed | 5 | 5 | 4 | 4 | 3 | |||||||||||||||||||||||||||
| Credit card | 36 | 28 | 28 | 27 | 23 | |||||||||||||||||||||||||||
| Total loans 90 days past due and still accruing | $ | 1,709 | $ | 1,787 | $ | 1,914 | $ | 1,930 | $ | 1,872 | ||||||||||||||||||||||
| Loans 30-89 Days Past Due | ||||||||||||||||||||||||||||||||
| Commercial: | ||||||||||||||||||||||||||||||||
| Commercial and industrial | $ | 162 | $ | 223 | $ | 280 | $ | 130 | $ | 135 | ||||||||||||||||||||||
| CRE | 15 | 10 | 13 | 20 | 4 | |||||||||||||||||||||||||||
| Commercial construction | 3 | 4 | 1 | 2 | 2 | |||||||||||||||||||||||||||
| Consumer: | ||||||||||||||||||||||||||||||||
| Residential mortgage - government guaranteed | 234 | 233 | 216 | 256 | 264 | |||||||||||||||||||||||||||
| Residential mortgage - nonguaranteed | 300 | 302 | 326 | 258 | 231 | |||||||||||||||||||||||||||
| Residential home equity and direct | 122 | 156 | 142 | 107 | 81 | |||||||||||||||||||||||||||
| Indirect auto | 591 | 584 | 529 | 607 | 560 | |||||||||||||||||||||||||||
| Indirect other | 97 | 78 | 65 | 64 | 53 | |||||||||||||||||||||||||||
| Student - government guaranteed | 375 | 447 | 476 | 549 | 451 | |||||||||||||||||||||||||||
| Student - nonguaranteed | 6 | 6 | 6 | 6 | 5 | |||||||||||||||||||||||||||
| Credit card | 52 | 48 | 47 | 45 | 37 | |||||||||||||||||||||||||||
| Total loans 30-89 days past due | $ | 1,957 | $ | 2,091 | $ | 2,101 | $ | 2,044 | $ | 1,823 | ||||||||||||||||||||||
Truist Financial Corporation 11
| As of/For the Quarter Ended | ||||||||||||||||||||||||||||||||
| Sept. 30 | June 30 | March 31 | Dec. 31 | Sept. 30 | ||||||||||||||||||||||||||||
| (Dollars in millions) | 2022 | 2022 | 2022 | 2021 | 2021 | |||||||||||||||||||||||||||
| Allowance for Credit Losses | ||||||||||||||||||||||||||||||||
| Beginning balance | $ | 4,434 | $ | 4,423 | $ | 4,695 | $ | 4,978 | $ | 5,436 | ||||||||||||||||||||||
| Provision for credit losses | 234 | 171 | (95) | (103) | (324) | |||||||||||||||||||||||||||
| Charge-offs: | ||||||||||||||||||||||||||||||||
| Commercial: | ||||||||||||||||||||||||||||||||
| Commercial and industrial | (51) | (17) | (31) | (54) | (57) | |||||||||||||||||||||||||||
| CRE | — | (1) | (1) | (5) | (1) | |||||||||||||||||||||||||||
| Commercial construction | — | — | (1) | — | — | |||||||||||||||||||||||||||
| Consumer: | ||||||||||||||||||||||||||||||||
| Residential mortgage | (4) | (2) | (2) | (1) | (7) | |||||||||||||||||||||||||||
| Residential home equity and direct | (86) | (85) | (58) | (51) | (51) | |||||||||||||||||||||||||||
| Indirect auto | (103) | (77) | (102) | (89) | (73) | |||||||||||||||||||||||||||
| Indirect other | (26) | (18) | (19) | (16) | (13) | |||||||||||||||||||||||||||
| Student | (7) | (4) | (6) | (12) | (6) | |||||||||||||||||||||||||||
| Credit card | (42) | (40) | (41) | (37) | (31) | |||||||||||||||||||||||||||
| Total charge-offs | (319) | (244) | (261) | (265) | (239) | |||||||||||||||||||||||||||
| Recoveries: | ||||||||||||||||||||||||||||||||
| Commercial: | ||||||||||||||||||||||||||||||||
| Commercial and industrial | 43 | 13 | 17 | 23 | 42 | |||||||||||||||||||||||||||
| CRE | — | 6 | 1 | — | 1 | |||||||||||||||||||||||||||
| Commercial construction | 2 | 1 | 1 | 1 | 1 | |||||||||||||||||||||||||||
| Consumer: | ||||||||||||||||||||||||||||||||
| Residential mortgage | 3 | 4 | 6 | 2 | 3 | |||||||||||||||||||||||||||
| Residential home equity and direct | 23 | 20 | 20 | 21 | 20 | |||||||||||||||||||||||||||
| Indirect auto | 21 | 26 | 23 | 21 | 22 | |||||||||||||||||||||||||||
| Indirect other | 6 | 6 | 6 | 6 | 5 | |||||||||||||||||||||||||||
| Student | — | — | — | — | 1 | |||||||||||||||||||||||||||
| Credit card | 8 | 9 | 9 | 9 | 9 | |||||||||||||||||||||||||||
| Total recoveries | 106 | 85 | 83 | 83 | 104 | |||||||||||||||||||||||||||
| Net charge-offs | (213) | (159) | (178) | (182) | (135) | |||||||||||||||||||||||||||
| Other | — | (1) | 1 | 2 | 1 | |||||||||||||||||||||||||||
| Ending balance | $ | 4,455 | $ | 4,434 | $ | 4,423 | $ | 4,695 | $ | 4,978 | ||||||||||||||||||||||
| Allowance for Credit Losses: | ||||||||||||||||||||||||||||||||
| Allowance for loan and lease losses | $ | 4,205 | $ | 4,187 | $ | 4,170 | $ | 4,435 | $ | 4,702 | ||||||||||||||||||||||
| Reserve for unfunded lending commitments (RUFC) | 250 | 247 | 253 | 260 | 276 | |||||||||||||||||||||||||||
| Allowance for credit losses | $ | 4,455 | $ | 4,434 | $ | 4,423 | $ | 4,695 | $ | 4,978 | ||||||||||||||||||||||
12 Truist Financial Corporation
| As of/For the Year-to-Date | ||||||||||||||||||||||||||||||||
| Period Ended Sept. 30 | ||||||||||||||||||||||||||||||||
| (Dollars in millions) | 2022 | 2021 | ||||||||||||||||||||||||||||||
| Allowance for Credit Losses | ||||||||||||||||||||||||||||||||
| Beginning balance | $ | 4,695 | $ | 6,199 | ||||||||||||||||||||||||||||
| Provision for credit losses | 310 | (710) | ||||||||||||||||||||||||||||||
| Charge-offs: | ||||||||||||||||||||||||||||||||
| Commercial: | ||||||||||||||||||||||||||||||||
| Commercial and industrial | (99) | (189) | ||||||||||||||||||||||||||||||
| CRE | (2) | (5) | ||||||||||||||||||||||||||||||
| Commercial construction | (1) | (2) | ||||||||||||||||||||||||||||||
| Consumer: | ||||||||||||||||||||||||||||||||
| Residential mortgage | (8) | (22) | ||||||||||||||||||||||||||||||
| Residential home equity and direct | (229) | (163) | ||||||||||||||||||||||||||||||
| Indirect auto | (282) | (247) | ||||||||||||||||||||||||||||||
| Indirect other | (63) | (41) | ||||||||||||||||||||||||||||||
| Student | (17) | (12) | ||||||||||||||||||||||||||||||
| Credit card | (123) | (113) | ||||||||||||||||||||||||||||||
| Total charge-offs | (824) | (794) | ||||||||||||||||||||||||||||||
| Recoveries: | ||||||||||||||||||||||||||||||||
| Commercial: | ||||||||||||||||||||||||||||||||
| Commercial and industrial | 73 | 84 | ||||||||||||||||||||||||||||||
| CRE | 7 | 6 | ||||||||||||||||||||||||||||||
| Commercial construction | 4 | 3 | ||||||||||||||||||||||||||||||
| Consumer: | ||||||||||||||||||||||||||||||||
| Residential mortgage | 13 | 10 | ||||||||||||||||||||||||||||||
| Residential home equity and direct | 63 | 58 | ||||||||||||||||||||||||||||||
| Indirect auto | 70 | 71 | ||||||||||||||||||||||||||||||
| Indirect other | 18 | 18 | ||||||||||||||||||||||||||||||
| Student | — | 1 | ||||||||||||||||||||||||||||||
| Credit card | 26 | 28 | ||||||||||||||||||||||||||||||
| Total recoveries | 274 | 279 | ||||||||||||||||||||||||||||||
| Net charge-offs | (550) | (515) | ||||||||||||||||||||||||||||||
| Other | — | 4 | ||||||||||||||||||||||||||||||
| Ending balance | $ | 4,455 | $ | 4,978 | ||||||||||||||||||||||||||||
| As of/For the Quarter Ended | ||||||||||||||||||||||||||||||||
| Sept. 30 | June 30 | March 31 | Dec. 31 | Sept. 30 | ||||||||||||||||||||||||||||
| 2022 | 2022 | 2022 | 2021 | 2021 | ||||||||||||||||||||||||||||
| Asset Quality Ratios | ||||||||||||||||||||||||||||||||
| Loans 30-89 days past due and still accruing as a percentage of loans and leases | 0.62 | % | 0.69 | % | 0.72 | % | 0.71 | % | 0.64 | % | ||||||||||||||||||||||
| Loans 90 days or more past due and still accruing as a percentage of loans and leases | 0.54 | 0.59 | 0.66 | 0.67 | 0.66 | |||||||||||||||||||||||||||
| Nonperforming loans and leases as a percentage of loans and leases held for investment | 0.35 | 0.36 | 0.36 | 0.38 | 0.38 | |||||||||||||||||||||||||||
| Nonperforming loans and leases as a percentage of loans and leases (1) | 0.37 | 0.37 | 0.37 | 0.38 | 0.40 | |||||||||||||||||||||||||||
| Nonperforming assets as a percentage of: | ||||||||||||||||||||||||||||||||
| Total assets (1) | 0.23 | 0.22 | 0.21 | 0.21 | 0.23 | |||||||||||||||||||||||||||
| Loans and leases plus foreclosed property | 0.37 | 0.38 | 0.38 | 0.39 | 0.40 | |||||||||||||||||||||||||||
| Net charge-offs as a percentage of average loans and leases | 0.27 | 0.22 | 0.25 | 0.25 | 0.19 | |||||||||||||||||||||||||||
| Allowance for loan and lease losses as a percentage of loans and leases | 1.34 | 1.38 | 1.44 | 1.53 | 1.65 | |||||||||||||||||||||||||||
| Ratio of allowance for loan and lease losses to: | ||||||||||||||||||||||||||||||||
| Net charge-offs | 4.98X | 6.54X | 5.78X | 6.14X | 8.79X | |||||||||||||||||||||||||||
| Nonperforming loans and leases | 3.80X | 3.84X | 3.99X | 4.07X | 4.35X | |||||||||||||||||||||||||||
| Asset Quality Ratios (Excluding PPP and other Government Guaranteed) | ||||||||||||||||||||||||||||||||
| Loans 90 days or more past due and still accruing as a percentage of loans and leases | 0.04 | % | 0.04 | % | 0.04 | % | 0.03 | % | 0.03 | % | ||||||||||||||||||||||
| Applicable ratios are annualized. | ||||||||||||||||||||||||||||||||
(1)Includes loans held for sale. | ||||||||||||||||||||||||||||||||
| As of/For the Year-to-Date | ||||||||||||||||||||||||||||||||
| Period Ended Sept. 30 | ||||||||||||||||||||||||||||||||
| 2022 | 2021 | |||||||||||||||||||||||||||||||
| Asset Quality Ratios | ||||||||||||||||||||||||||||||||
| Net charge-offs as a percentage of average loans and leases | 0.25 | % | 0.24 | % | ||||||||||||||||||||||||||||
| Ratio of allowance for loan and lease losses to net charge-offs | 5.72X | 6.83X | ||||||||||||||||||||||||||||||
| Applicable ratios are annualized. | ||||||||||||||||||||||||||||||||
Truist Financial Corporation 13
| September 30, 2022 | ||||||||||||||||||||||||||||||||||||||||||||
| Past Due 30-89 | Past Due 90+ | |||||||||||||||||||||||||||||||||||||||||||
| (Dollars in millions) | Current Status | Days | Days | Total | ||||||||||||||||||||||||||||||||||||||||
| Troubled Debt Restructurings | ||||||||||||||||||||||||||||||||||||||||||||
| Performing TDRs: (1) | ||||||||||||||||||||||||||||||||||||||||||||
| Commercial: | ||||||||||||||||||||||||||||||||||||||||||||
| Commercial and industrial | $ | 163 | 98.8 | % | $ | 1 | 0.6 | % | $ | 1 | 0.6 | % | $ | 165 | ||||||||||||||||||||||||||||||
| CRE | 5 | 100.0 | — | — | — | — | 5 | |||||||||||||||||||||||||||||||||||||
| Commercial construction | 1 | 100.0 | — | — | — | — | 1 | |||||||||||||||||||||||||||||||||||||
| Consumer: | ||||||||||||||||||||||||||||||||||||||||||||
| Residential mortgage - government guaranteed | 439 | 52.4 | 90 | 10.7 | 310 | 36.9 | 839 | |||||||||||||||||||||||||||||||||||||
| Residential mortgage - nonguaranteed | 268 | 87.8 | 28 | 9.2 | 9 | 3.0 | 305 | |||||||||||||||||||||||||||||||||||||
| Residential home equity and direct | 76 | 97.4 | 2 | 2.6 | — | — | 78 | |||||||||||||||||||||||||||||||||||||
| Indirect auto | 355 | 83.5 | 70 | 16.5 | — | — | 425 | |||||||||||||||||||||||||||||||||||||
| Indirect other | 6 | 85.7 | 1 | 14.3 | — | — | 7 | |||||||||||||||||||||||||||||||||||||
| Student - nonguaranteed | 26 | 89.7 | 2 | 6.9 | 1 | 3.4 | 29 | |||||||||||||||||||||||||||||||||||||
| Credit card | 16 | 84.2 | 2 | 10.5 | 1 | 5.3 | 19 | |||||||||||||||||||||||||||||||||||||
| Total performing TDRs (1) | 1,355 | 72.3 | 196 | 10.5 | 322 | 17.2 | 1,873 | |||||||||||||||||||||||||||||||||||||
| Nonperforming TDRs (2) | 78 | 41.7 | 29 | 15.5 | 80 | 42.8 | 187 | |||||||||||||||||||||||||||||||||||||
| Total TDRs (1)(2) | $ | 1,433 | 69.6 | % | $ | 225 | 10.9 | % | $ | 402 | 19.5 | % | $ | 2,060 | ||||||||||||||||||||||||||||||
(1)Past due performing TDRs are included in past due disclosures. | ||||||||||||||||||||||||||||||||||||||||||||
(2)Nonperforming TDRs are included in nonaccrual loan disclosures. | ||||||||||||||||||||||||||||||||||||||||||||
| Quarter Ended | ||||||||||||||||||||||||||||||||||||||||||||
| Sept. 30 | June 30 | March 31 | Dec. 31 | Sept. 30 | ||||||||||||||||||||||||||||||||||||||||
| 2022 | 2022 | 2022 | 2021 | 2021 | ||||||||||||||||||||||||||||||||||||||||
| Net Charge-offs as a Percentage of Average Loans and Leases: | ||||||||||||||||||||||||||||||||||||||||||||
| Commercial: | ||||||||||||||||||||||||||||||||||||||||||||
| Commercial and industrial | 0.02 | % | 0.01 | % | 0.04 | % | 0.09 | % | 0.04 | % | ||||||||||||||||||||||||||||||||||
| CRE | (0.01) | (0.10) | 0.01 | 0.07 | — | |||||||||||||||||||||||||||||||||||||||
| Commercial construction | (0.10) | (0.08) | (0.02) | (0.10) | (0.06) | |||||||||||||||||||||||||||||||||||||||
| Consumer: | ||||||||||||||||||||||||||||||||||||||||||||
| Residential mortgage | 0.01 | (0.02) | (0.03) | (0.02) | 0.04 | |||||||||||||||||||||||||||||||||||||||
| Residential home equity and direct | 1.01 | 1.04 | 0.61 | 0.49 | 0.49 | |||||||||||||||||||||||||||||||||||||||
| Indirect auto | 1.15 | 0.77 | 1.23 | 1.01 | 0.75 | |||||||||||||||||||||||||||||||||||||||
| Indirect other | 0.66 | 0.43 | 0.48 | 0.39 | 0.26 | |||||||||||||||||||||||||||||||||||||||
| Student | 0.40 | 0.30 | 0.33 | 0.65 | 0.31 | |||||||||||||||||||||||||||||||||||||||
| Credit card | 2.80 | 2.63 | 2.77 | 2.31 | 1.90 | |||||||||||||||||||||||||||||||||||||||
| Total loans and leases | 0.27 | 0.22 | 0.25 | 0.25 | 0.19 | |||||||||||||||||||||||||||||||||||||||
| Applicable ratios are annualized. | ||||||||||||||||||||||||||||||||||||||||||||
| Credit Quality - Allowance with Fair Value Marks | |||||||||||||||||||||||||||||
| As of/For the Quarter Ended | |||||||||||||||||||||||||||||
| Sept. 30 | June 30 | March 31 | Dec. 31 | Sept. 30 | |||||||||||||||||||||||||
| (Dollars in millions) | 2022 | 2022 | 2022 | 2021 | 2021 | ||||||||||||||||||||||||
| ALLL | $ | 4,205 | $ | 4,187 | $ | 4,170 | $ | 4,435 | $ | 4,702 | |||||||||||||||||||
| Unamortized fair value mark (1) | 826 | 924 | 1,119 | 1,323 | 1,540 | ||||||||||||||||||||||||
| Allowance plus unamortized fair value mark | $ | 5,031 | $ | 5,111 | $ | 5,289 | $ | 5,758 | $ | 6,242 | |||||||||||||||||||
| Loans and leases held for investment | $ | 314,335 | $ | 303,662 | $ | 290,081 | $ | 289,513 | $ | 285,522 | |||||||||||||||||||
| Unamortized fair value mark (1) | 826 | 924 | 1,119 | 1,323 | 1,540 | ||||||||||||||||||||||||
| Gross loans and leases | $ | 315,161 | $ | 304,586 | $ | 291,200 | $ | 290,836 | $ | 287,062 | |||||||||||||||||||
| Allowance for loan and lease losses as a percentage of loans and leases - GAAP | 1.34 | % | 1.38 | % | 1.44 | % | 1.53 | % | 1.65 | % | |||||||||||||||||||
| Allowance for loan and lease losses and unamortized fair value mark as a percentage of gross loans and leases - Adjusted (1) (2) | 1.60 | 1.68 | 1.82 | 1.98 | 2.17 | ||||||||||||||||||||||||
(1)Unamortized fair value mark includes credit, interest rate, and liquidity components.
(2)Allowance for loan and lease losses and unamortized fair value mark as a percentage of gross loans and leases is a non-GAAP measurement of credit reserves that is calculated by adjusting the ALLL and loans and leases held for investment by the unamortized fair value mark. Truist’s management uses these measures to assess loss absorption capacity.
14 Truist Financial Corporation
| Rollforward of Intangible Assets and Selected Fair Value Marks (1) | |||||||||||||||||||||||||||||
| As of/For the Quarter Ended | |||||||||||||||||||||||||||||
| Sept. 30 | June 30 | March 31 | Dec. 31 | Sept. 30 | |||||||||||||||||||||||||
| (Dollars in millions) | 2022 | 2022 | 2022 | 2021 | 2021 | ||||||||||||||||||||||||
| Loans and Leases (2) | |||||||||||||||||||||||||||||
| Beginning balance unamortized fair value mark | $ | (924) | $ | (1,119) | $ | (1,323) | $ | (1,540) | $ | (1,777) | |||||||||||||||||||
| Accretion | 96 | 189 | 191 | 217 | 233 | ||||||||||||||||||||||||
| Purchase accounting adjustments and other activity | 2 | 6 | 13 | — | 4 | ||||||||||||||||||||||||
| Ending balance | $ | (826) | $ | (924) | $ | (1,119) | $ | (1,323) | $ | (1,540) | |||||||||||||||||||
| Core deposit and other intangible assets | |||||||||||||||||||||||||||||
| Beginning balance | $ | 3,535 | $ | 3,693 | $ | 3,408 | $ | 2,930 | $ | 2,665 | |||||||||||||||||||
| Additions - acquisitions | 336 | — | 430 | 647 | 418 | ||||||||||||||||||||||||
| Amortization of intangibles | (140) | (143) | (137) | (143) | (145) | ||||||||||||||||||||||||
| Amortization in net occupancy expense | (5) | (5) | (8) | (3) | (4) | ||||||||||||||||||||||||
| Purchase accounting adjustments and other activity | — | (10) | — | (23) | (4) | ||||||||||||||||||||||||
| Ending balance | $ | 3,726 | $ | 3,535 | $ | 3,693 | $ | 3,408 | $ | 2,930 | |||||||||||||||||||
| Deposits (3) | |||||||||||||||||||||||||||||
| Beginning balance unamortized fair value mark | $ | (3) | $ | (5) | $ | (7) | $ | (9) | $ | (12) | |||||||||||||||||||
| Amortization | 2 | 2 | 2 | 2 | 3 | ||||||||||||||||||||||||
| Ending balance | $ | (1) | $ | (3) | $ | (5) | $ | (7) | $ | (9) | |||||||||||||||||||
| Long-Term Debt (3) | |||||||||||||||||||||||||||||
| Beginning balance unamortized fair value mark | $ | (109) | $ | (122) | $ | (139) | $ | (157) | $ | (176) | |||||||||||||||||||
| Amortization | 15 | 13 | 17 | 18 | 19 | ||||||||||||||||||||||||
| Ending balance | $ | (94) | $ | (109) | $ | (122) | $ | (139) | $ | (157) | |||||||||||||||||||
(1)Includes only selected information and does not represent all purchase accounting adjustments.
(2)Purchase accounting marks on loans and leases includes credit, interest and liquidity components, and are generally recognized using the level-yield or straight-line method over the remaining life of the individual loans or recognized in full in the event of prepayment.
(3)Purchase accounting marks on liabilities represents interest rate marks on time deposits and long-term debt and are recognized using the level-yield method over the term of the liability.
Truist Financial Corporation 15
| Segment Financial Performance - Preliminary | ||||||||||||||||||||||||||||||||
| Quarter Ended | ||||||||||||||||||||||||||||||||
| Sept. 30 | June 30 | March 31 | Dec. 31 | Sept. 30 | ||||||||||||||||||||||||||||
| (Dollars in millions) | 2022 | 2022 | 2022 | 2021 | 2021 | |||||||||||||||||||||||||||
| Consumer Banking and Wealth | ||||||||||||||||||||||||||||||||
| Net interest income (expense) | $ | 1,685 | $ | 1,567 | $ | 1,528 | $ | 1,629 | $ | 1,665 | ||||||||||||||||||||||
| Net intersegment interest income (expense) | 960 | 710 | 655 | 597 | 485 | |||||||||||||||||||||||||||
| Segment net interest income | 2,645 | 2,277 | 2,183 | 2,226 | 2,150 | |||||||||||||||||||||||||||
| Allocated provision for credit losses | 283 | 199 | 74 | 59 | (5) | |||||||||||||||||||||||||||
| Noninterest income | 882 | 891 | 950 | 992 | 1,028 | |||||||||||||||||||||||||||
| Noninterest expense | 1,952 | 1,952 | 1,908 | 1,971 | 1,985 | |||||||||||||||||||||||||||
| Income (loss) before income taxes | 1,292 | 1,017 | 1,151 | 1,188 | 1,198 | |||||||||||||||||||||||||||
| Provision (benefit) for income taxes | 306 | 241 | 278 | 244 | 265 | |||||||||||||||||||||||||||
| Segment net income (loss) | $ | 986 | $ | 776 | $ | 873 | $ | 944 | $ | 933 | ||||||||||||||||||||||
| Corporate and Commercial Banking | ||||||||||||||||||||||||||||||||
| Net interest income (expense) | $ | 1,601 | $ | 1,277 | $ | 1,094 | $ | 1,106 | $ | 1,126 | ||||||||||||||||||||||
| Net intersegment interest income (expense) | 22 | 68 | 173 | 194 | 158 | |||||||||||||||||||||||||||
| Segment net interest income | 1,623 | 1,345 | 1,267 | 1,300 | 1,284 | |||||||||||||||||||||||||||
| Allocated provision for credit losses | (50) | (28) | (150) | (183) | (264) | |||||||||||||||||||||||||||
| Noninterest income | 604 | 636 | 619 | 790 | 752 | |||||||||||||||||||||||||||
| Noninterest expense | 795 | 781 | 757 | 798 | 804 | |||||||||||||||||||||||||||
| Income (loss) before income taxes | 1,482 | 1,228 | 1,279 | 1,475 | 1,496 | |||||||||||||||||||||||||||
| Provision (benefit) for income taxes | 318 | 266 | 279 | 297 | 315 | |||||||||||||||||||||||||||
| Segment net income (loss) | $ | 1,164 | $ | 962 | $ | 1,000 | $ | 1,178 | $ | 1,181 | ||||||||||||||||||||||
| Insurance Holdings | ||||||||||||||||||||||||||||||||
| Net interest income (expense) | $ | 40 | $ | 30 | $ | 24 | $ | 23 | $ | 27 | ||||||||||||||||||||||
| Net intersegment interest income (expense) | (7) | (2) | — | — | 1 | |||||||||||||||||||||||||||
| Segment net interest income | 33 | 28 | 24 | 23 | 28 | |||||||||||||||||||||||||||
| Allocated provision for credit losses | 1 | 1 | — | (1) | 1 | |||||||||||||||||||||||||||
| Noninterest income | 734 | 833 | 737 | 681 | 652 | |||||||||||||||||||||||||||
| Noninterest expense | 640 | 623 | 560 | 546 | 537 | |||||||||||||||||||||||||||
| Income (loss) before income taxes | 126 | 237 | 201 | 159 | 142 | |||||||||||||||||||||||||||
| Provision (benefit) for income taxes | 31 | 58 | 50 | 32 | 31 | |||||||||||||||||||||||||||
| Segment net income (loss) | $ | 95 | $ | 179 | $ | 151 | $ | 127 | $ | 111 | ||||||||||||||||||||||
| Other, Treasury & Corporate (1) | ||||||||||||||||||||||||||||||||
| Net interest income (expense) | $ | 419 | $ | 533 | $ | 537 | $ | 485 | $ | 415 | ||||||||||||||||||||||
| Net intersegment interest income (expense) | (975) | (776) | (828) | (791) | (644) | |||||||||||||||||||||||||||
| Segment net interest income | (556) | (243) | (291) | (306) | (229) | |||||||||||||||||||||||||||
| Allocated provision for credit losses | — | (1) | (19) | 22 | (56) | |||||||||||||||||||||||||||
| Noninterest income | (118) | (112) | (164) | (140) | (67) | |||||||||||||||||||||||||||
| Noninterest expense | 226 | 224 | 449 | 385 | 469 | |||||||||||||||||||||||||||
| Income (loss) before income taxes | (900) | (578) | (885) | (853) | (709) | |||||||||||||||||||||||||||
| Provision (benefit) for income taxes | (292) | (193) | (277) | (206) | (188) | |||||||||||||||||||||||||||
| Segment net income (loss) | $ | (608) | $ | (385) | $ | (608) | $ | (647) | $ | (521) | ||||||||||||||||||||||
| Total Truist Financial Corporation | ||||||||||||||||||||||||||||||||
| Net interest income (expense) | $ | 3,745 | $ | 3,407 | $ | 3,183 | $ | 3,243 | $ | 3,233 | ||||||||||||||||||||||
| Net intersegment interest income (expense) | — | — | — | — | — | |||||||||||||||||||||||||||
| Segment net interest income | 3,745 | 3,407 | 3,183 | 3,243 | 3,233 | |||||||||||||||||||||||||||
| Allocated provision for credit losses | 234 | 171 | (95) | (103) | (324) | |||||||||||||||||||||||||||
| Noninterest income | 2,102 | 2,248 | 2,142 | 2,323 | 2,365 | |||||||||||||||||||||||||||
| Noninterest expense | 3,613 | 3,580 | 3,674 | 3,700 | 3,795 | |||||||||||||||||||||||||||
| Income (loss) before income taxes | 2,000 | 1,904 | 1,746 | 1,969 | 2,127 | |||||||||||||||||||||||||||
| Provision (benefit) for income taxes | 363 | 372 | 330 | 367 | 423 | |||||||||||||||||||||||||||
| Net income | $ | 1,637 | $ | 1,532 | $ | 1,416 | $ | 1,602 | $ | 1,704 | ||||||||||||||||||||||
(1) Includes financial data from subsidiaries below the quantitative and qualitative thresholds requiring disclosure. | ||||||||||||||||||||||||||||||||
16 Truist Financial Corporation
| Capital Information - Five Quarter Trend | ||||||||||||||||||||||||||||||||
| As of/For the Quarter Ended | ||||||||||||||||||||||||||||||||
| Sept. 30 | June 30 | March 31 | Dec. 31 | Sept. 30 | ||||||||||||||||||||||||||||
| (Dollars in millions, except per share data, shares in thousands) | 2022 | 2022 | 2022 | 2021 | 2021 | |||||||||||||||||||||||||||
| Selected Capital Information | (preliminary) | |||||||||||||||||||||||||||||||
| Risk-based capital: | ||||||||||||||||||||||||||||||||
| Common equity tier 1 | $ | 38,276 | $ | 38,016 | $ | 37,225 | $ | 37,524 | $ | 38,859 | ||||||||||||||||||||||
| Tier 1 | 44,947 | 44,686 | 43,895 | 44,194 | 45,529 | |||||||||||||||||||||||||||
| Total | 53,223 | 52,186 | 51,599 | 51,518 | 53,228 | |||||||||||||||||||||||||||
| Risk-weighted assets | 421,873 | 413,384 | 397,855 | 390,886 | 383,871 | |||||||||||||||||||||||||||
| Average quarterly assets for leverage ratio | 526,453 | 521,113 | 512,694 | 510,404 | 503,223 | |||||||||||||||||||||||||||
| Average quarterly assets for supplementary leverage ratio | 617,146 | 608,770 | 599,415 | 595,075 | 585,420 | |||||||||||||||||||||||||||
| Risk-based capital ratios: | ||||||||||||||||||||||||||||||||
| Common equity tier 1 | 9.1 | % | 9.2 | % | 9.4 | % | 9.6 | % | 10.1 | % | ||||||||||||||||||||||
| Tier 1 | 10.7 | 10.8 | 11.0 | 11.3 | 11.9 | |||||||||||||||||||||||||||
| Total | 12.6 | 12.6 | 13.0 | 13.2 | 13.9 | |||||||||||||||||||||||||||
| Leverage capital ratio | 8.5 | 8.6 | 8.6 | 8.7 | 9.0 | |||||||||||||||||||||||||||
| Supplementary leverage | 7.3 | 7.3 | 7.3 | 7.4 | 7.8 | |||||||||||||||||||||||||||
| Equity as a percentage of total assets | 11.1 | 11.6 | 12.0 | 12.8 | 13.0 | |||||||||||||||||||||||||||
| Common equity per common share | $ | 40.79 | $ | 42.45 | $ | 43.82 | $ | 47.14 | $ | 46.62 | ||||||||||||||||||||||
| Sept. 30 | June 30 | March 31 | Dec. 31 | Sept. 30 | ||||||||||||||||||||||||||||
| (Dollars in millions, except per share data, shares in thousands) | 2022 | 2022 | 2022 | 2021 | 2021 | |||||||||||||||||||||||||||
Calculations of Tangible Common Equity and Related Measures: (1) | ||||||||||||||||||||||||||||||||
| Total shareholders’ equity | $ | 60,811 | $ | 62,999 | $ | 65,044 | $ | 69,271 | $ | 68,900 | ||||||||||||||||||||||
| Less: | ||||||||||||||||||||||||||||||||
| Preferred stock | 6,673 | 6,673 | 6,673 | 6,673 | 6,673 | |||||||||||||||||||||||||||
| Noncontrolling interests | 23 | 24 | 23 | — | — | |||||||||||||||||||||||||||
| Intangible assets, net of deferred taxes | 29,752 | 29,095 | 29,229 | 28,772 | 27,066 | |||||||||||||||||||||||||||
| Tangible common equity | $ | 24,363 | $ | 27,207 | $ | 29,119 | $ | 33,826 | $ | 35,161 | ||||||||||||||||||||||
| Outstanding shares at end of period (in thousands) | 1,326,766 | 1,326,393 | 1,331,414 | 1,327,818 | 1,334,892 | |||||||||||||||||||||||||||
| Tangible Common Equity Per Common Share | $ | 18.36 | $ | 20.51 | $ | 21.87 | $ | 25.47 | $ | 26.34 | ||||||||||||||||||||||
(1)Tangible common equity and related measures are non-GAAP measures that exclude the impact of intangible assets, net of deferred taxes, and their related amortization. These measures are useful for evaluating the performance of a business consistently, whether acquired or developed internally. Truist’s management uses these measures to assess the quality of capital and returns relative to balance sheet risk. These measures are not necessarily comparable to similar measures that may be presented by other companies.
Truist Financial Corporation 17
| Selected Mortgage Banking Information & Additional Information | ||||||||||||||||||||||||||||||||
| As of/For the Quarter Ended | ||||||||||||||||||||||||||||||||
| Sept. 30 | June 30 | March 31 | Dec. 31 | Sept. 30 | ||||||||||||||||||||||||||||
| (Dollars in millions, except per share data) | 2022 | 2022 | 2022 | 2021 | 2021 | |||||||||||||||||||||||||||
| Residential Mortgage Income | ||||||||||||||||||||||||||||||||
| Residential mortgage production revenue | $ | 1 | $ | 36 | $ | 52 | $ | 115 | $ | 139 | ||||||||||||||||||||||
| Residential mortgage servicing income: | ||||||||||||||||||||||||||||||||
| Residential mortgage servicing revenue | 165 | 152 | 145 | 155 | 157 | |||||||||||||||||||||||||||
| Realization of expected residential MSR cash flows | (85) | (103) | (109) | (143) | (146) | |||||||||||||||||||||||||||
| Income statement impact of mortgage servicing rights valuation: | ||||||||||||||||||||||||||||||||
| MSRs fair value increase (decrease) | 166 | 254 | 350 | (25) | 77 | |||||||||||||||||||||||||||
| MSRs hedge gains (losses) | (175) | (265) | (349) | 57 | (48) | |||||||||||||||||||||||||||
| Net MSRs valuation | (9) | (11) | 1 | 32 | 29 | |||||||||||||||||||||||||||
| Total residential mortgage servicing income | $ | 71 | $ | 38 | $ | 37 | $ | 44 | $ | 40 | ||||||||||||||||||||||
| Total residential mortgage income | $ | 72 | $ | 74 | $ | 89 | $ | 159 | $ | 179 | ||||||||||||||||||||||
| Commercial Mortgage Income | ||||||||||||||||||||||||||||||||
| Commercial mortgage production revenue | $ | 30 | $ | 21 | $ | 32 | $ | 40 | $ | 48 | ||||||||||||||||||||||
| Commercial mortgage servicing income: | ||||||||||||||||||||||||||||||||
| Commercial mortgage servicing revenue | 17 | 17 | 17 | 18 | 17 | |||||||||||||||||||||||||||
| Realization of expected commercial MSR cash flows | (12) | (15) | (17) | (12) | (11) | |||||||||||||||||||||||||||
| Income statement impact of mortgage servicing rights valuation: | ||||||||||||||||||||||||||||||||
| MSRs fair value increase (decrease) | 24 | 8 | 9 | (1) | 1 | |||||||||||||||||||||||||||
| MSRs hedge gains (losses) | (9) | (5) | (9) | — | (1) | |||||||||||||||||||||||||||
| Net MSRs valuation | 15 | 3 | — | (1) | — | |||||||||||||||||||||||||||
| Total commercial mortgage servicing income | $ | 20 | $ | 5 | $ | — | $ | 5 | $ | 6 | ||||||||||||||||||||||
| Commercial mortgage income | $ | 50 | $ | 26 | $ | 32 | $ | 45 | $ | 54 | ||||||||||||||||||||||
Other Mortgage Banking Information | ||||||||||||||||||||||||||||||||
| Residential mortgage loan originations | $ | 11,746 | $ | 11,330 | $ | 11,408 | $ | 14,458 | $ | 15,852 | ||||||||||||||||||||||
| Residential mortgage servicing portfolio (1): | ||||||||||||||||||||||||||||||||
| Loans serviced for others | 218,740 | 209,504 | 195,737 | 196,011 | 198,119 | |||||||||||||||||||||||||||
| Bank-owned loans serviced | 56,786 | 53,341 | 50,927 | 50,716 | 50,427 | |||||||||||||||||||||||||||
| Total servicing portfolio | 275,526 | 262,845 | 246,664 | 246,727 | 248,546 | |||||||||||||||||||||||||||
| Weighted-average coupon rate on mortgage loans serviced for others | 3.45 | % | 3.42 | % | 3.41 | % | 3.44 | % | 3.49 | % | ||||||||||||||||||||||
| Weighted-average servicing fee on mortgage loans serviced for others | 0.30 | 0.30 | 0.31 | 0.31 | 0.31 | |||||||||||||||||||||||||||
| Additional Information | ||||||||||||||||||||||||||||||||
| Brokered deposits (2) | $ | 20,239 | $ | 22,926 | $ | 19,092 | $ | 9,627 | $ | 10,980 | ||||||||||||||||||||||
| NQDCP income (expense): | ||||||||||||||||||||||||||||||||
| Interest income | $ | 2 | $ | 2 | $ | 19 | $ | 1 | $ | 2 | ||||||||||||||||||||||
| Other income | (28) | (30) | (44) | (7) | 30 | |||||||||||||||||||||||||||
| Personnel expense | 26 | 28 | 25 | 6 | (32) | |||||||||||||||||||||||||||
| Total NQDCP income (expense) | $ | — | $ | — | $ | — | $ | — | $ | — | ||||||||||||||||||||||
| Fair value of derivatives, net | $ | (2,267) | $ | (528) | $ | 631 | $ | 1,784 | $ | 2,375 | ||||||||||||||||||||||
| CVA/DVA income (expense) included in investment banking and trading income | 20 | 12 | 24 | 12 | 16 | |||||||||||||||||||||||||||
| Common stock prices: | ||||||||||||||||||||||||||||||||
| High | 52.22 | 57.50 | 68.95 | 65.42 | 60.74 | |||||||||||||||||||||||||||
| Low | 42.56 | 44.75 | 56.19 | 54.73 | 51.87 | |||||||||||||||||||||||||||
| End of period | 43.54 | 47.43 | 56.70 | 58.55 | 58.65 | |||||||||||||||||||||||||||
| Banking offices | 2,119 | 2,117 | 2,112 | 2,517 | 2,518 | |||||||||||||||||||||||||||
| ATMs | 3,185 | 3,194 | 3,214 | 3,670 | 3,684 | |||||||||||||||||||||||||||
| FTEs (3) | 52,648 | 51,349 | 51,169 | 51,348 | 52,675 | |||||||||||||||||||||||||||
(1)Amounts reported are unpaid principal balance.
(2)Amounts primarily represent interest checking and money market and savings deposits.
(3)FTEs represents an average for the quarter.
18 Truist Financial Corporation
| Selected Items (1) | |||||||||||
| Favorable (Unfavorable) | |||||||||||
| (Dollars in millions) | After-Tax at | ||||||||||
| Description | Pre-Tax | Marginal Rate | |||||||||
| Selected Items | |||||||||||
| Third Quarter 2022 | |||||||||||
| Incremental operating expenses related to the merger ($72 million professional fees and outside processing and $18 million other line items) | $ | (90) | $ | (69) | |||||||
| Second Quarter 2022 | |||||||||||
| Incremental operating expenses related to the merger ($103 million professional fees and outside processing, $11 million personnel expense, and $3 million other line items) | $ | (117) | $ | (89) | |||||||
| First Quarter 2022 | |||||||||||
| Incremental operating expenses related to the merger ($133 million professional fees and outside processing, $24 million personnel expense, $20 million net occupancy expense, and $25 million other line items) | $ | (202) | $ | (155) | |||||||
Gain on redemption of noncontrolling equity interest related to the acquisition of certain merchant services relationships (other income) | 74 | 57 | |||||||||
| Fourth Quarter 2021 | |||||||||||
| Incremental operating expenses related to the merger ($144 million professional fees and outside processing, $59 million personnel expense, and $12 million other line items) | $ | (215) | $ | (165) | |||||||
| Third Quarter 2021 | |||||||||||
| Incremental operating expenses related to the merger ($132 million professional fees and outside processing, $41 million personnel expense, and $18 million other line items) | $ | (191) | $ | (147) | |||||||
| Professional fee accrual (professional fees and outside processing) | (30) | (23) | |||||||||
| Second Quarter 2021 | |||||||||||
| Charitable contribution (other expense) | $ | (200) | $ | (153) | |||||||
| Incremental operating expenses related to the merger ($137 million professional fees and outside processing, $42 million personnel expense, and $11 million other line items) | (190) | (146) | |||||||||
| First Quarter 2021 | |||||||||||
| Incremental operating expenses related to the merger ($120 million professional fees and outside processing, $42 million personnel expense, and $13 million other line items) | $ | (175) | $ | (134) | |||||||
| Acceleration for cash flow hedge unwind (other expense) | (36) | (28) | |||||||||
(1)Includes selected items representing a part of line items within the consolidated statements of income. Excludes line items adjusted in their entirety, such as securities gains and losses, gains and losses on the early extinguishment of debt, and costs classified as merger-related and restructuring charges.
| Non-GAAP Reconciliations | ||||||||||||||||||||||||||||||||||||||||||||
| Quarter Ended | Year-to-Date | |||||||||||||||||||||||||||||||||||||||||||
| Sept. 30 | June 30 | March 31 | Dec. 31 | Sept. 30 | Sept. 30 | Sept. 30 | ||||||||||||||||||||||||||||||||||||||
| (Dollars in millions) | 2022 | 2022 | 2022 | 2021 | 2021 | 2022 | 2021 | |||||||||||||||||||||||||||||||||||||
Efficiency Ratio (1) | ||||||||||||||||||||||||||||||||||||||||||||
Efficiency Ratio Numerator - Noninterest Expense - GAAP | $ | 3,613 | $ | 3,580 | $ | 3,674 | $ | 3,700 | $ | 3,795 | $ | 10,867 | $ | 11,416 | ||||||||||||||||||||||||||||||
| Merger-related and restructuring charges, net | (62) | (121) | (216) | (212) | (172) | (399) | (610) | |||||||||||||||||||||||||||||||||||||
| Gain (loss) on early extinguishment of debt | — | 39 | — | 1 | — | 39 | 3 | |||||||||||||||||||||||||||||||||||||
| Incremental operating expense related to the merger | (90) | (117) | (202) | (215) | (191) | (409) | (556) | |||||||||||||||||||||||||||||||||||||
| Amortization of intangibles | (140) | (143) | (137) | (143) | (145) | (420) | (431) | |||||||||||||||||||||||||||||||||||||
| Charitable contribution | — | — | — | — | — | — | (200) | |||||||||||||||||||||||||||||||||||||
| Professional fee accrual | — | — | — | — | (30) | — | (30) | |||||||||||||||||||||||||||||||||||||
| Acceleration for cash flow hedge unwind | — | — | — | — | — | — | (36) | |||||||||||||||||||||||||||||||||||||
| Efficiency Ratio Numerator - Adjusted | $ | 3,321 | $ | 3,238 | $ | 3,119 | $ | 3,131 | $ | 3,257 | $ | 9,678 | $ | 9,556 | ||||||||||||||||||||||||||||||
Efficiency Ratio Denominator - Revenue (2) - GAAP | $ | 5,847 | $ | 5,655 | $ | 5,325 | $ | 5,566 | $ | 5,598 | $ | 16,827 | $ | 16,730 | ||||||||||||||||||||||||||||||
| Taxable equivalent adjustment | 38 | 28 | 26 | 24 | 28 | 92 | 84 | |||||||||||||||||||||||||||||||||||||
| Securities (gains) losses | 1 | 1 | 69 | — | — | 71 | — | |||||||||||||||||||||||||||||||||||||
| Gain on redemption of noncontrolling equity interest | — | — | (74) | — | — | (74) | — | |||||||||||||||||||||||||||||||||||||
| Gains on divestiture of certain businesses | — | — | — | — | — | — | (37) | |||||||||||||||||||||||||||||||||||||
| Efficiency Ratio Denominator - Adjusted | $ | 5,886 | $ | 5,684 | $ | 5,346 | $ | 5,590 | $ | 5,626 | $ | 16,916 | $ | 16,777 | ||||||||||||||||||||||||||||||
| Efficiency Ratio - GAAP | 61.8 | % | 63.3 | % | 69.0 | % | 66.5 | % | 67.8 | % | 64.6 | % | 68.2 | % | ||||||||||||||||||||||||||||||
| Efficiency Ratio - Adjusted | 56.4 | 57.0 | 58.3 | 56.0 | 57.9 | 57.2 | 57.0 | |||||||||||||||||||||||||||||||||||||
(1)The adjusted efficiency ratio is non-GAAP in that it excludes securities gains (losses), amortization of intangible assets, merger-related and restructuring charges, and other selected items. Truist’s management uses this measure in their analysis of the Corporation’s performance. Truist’s management believes this measure provides a greater understanding of ongoing operations and enhances comparability of results with prior periods, as well as demonstrates the effects of significant gains and charges. These measures are not necessarily comparable to similar measures that may be presented by other companies.
(2)Revenue is defined as net interest income plus noninterest income.
Truist Financial Corporation 19
| Quarter Ended | Year-to-Date | |||||||||||||||||||||||||||||||||||||||||||
| Sept. 30 | June 30 | March 31 | Dec. 31 | Sept. 30 | Sept. 30 | Sept. 30 | ||||||||||||||||||||||||||||||||||||||
| (Dollars in millions) | 2022 | 2022 | 2022 | 2021 | 2021 | 2022 | 2021 | |||||||||||||||||||||||||||||||||||||
| Return on Average Tangible Common Shareholders’ Equity (1) | ||||||||||||||||||||||||||||||||||||||||||||
| Net income available to common shareholders | $ | 1,536 | $ | 1,454 | $ | 1,327 | $ | 1,524 | $ | 1,616 | $ | 4,317 | $ | 4,509 | ||||||||||||||||||||||||||||||
| Plus: Amortization of intangibles, net of tax | 107 | 109 | 105 | 110 | 113 | 321 | 331 | |||||||||||||||||||||||||||||||||||||
| Tangible net income available to common shareholders | $ | 1,643 | $ | 1,563 | $ | 1,432 | $ | 1,634 | $ | 1,729 | $ | 4,638 | $ | 4,840 | ||||||||||||||||||||||||||||||
| Average common shareholders’ equity | $ | 56,813 | $ | 56,803 | $ | 60,117 | $ | 61,807 | $ | 62,680 | $ | 57,899 | $ | 62,215 | ||||||||||||||||||||||||||||||
| Less: Average intangible assets, net of deferred taxes | 29,035 | 29,173 | 28,905 | 27,523 | 27,149 | 29,038 | 26,686 | |||||||||||||||||||||||||||||||||||||
| Average tangible common shareholders’ equity | $ | 27,778 | $ | 27,630 | $ | 31,212 | $ | 34,284 | $ | 35,531 | $ | 28,861 | $ | 35,529 | ||||||||||||||||||||||||||||||
| Return on average common shareholders’ equity | 10.7 | % | 10.3 | % | 9.0 | % | 9.8 | % | 10.2 | % | 10.0 | % | 9.7 | % | ||||||||||||||||||||||||||||||
| Return on average tangible common shareholders’ equity | 23.5 | 22.7 | 18.6 | 18.9 | 19.3 | 21.5 | 18.2 | |||||||||||||||||||||||||||||||||||||
(1)Tangible common equity and related measures are non-GAAP measures that exclude the impact of intangible assets, net of deferred taxes, and their related amortization. These measures are useful for evaluating the performance of a business consistently, whether acquired or developed internally. Truist’s management uses these measures to assess the quality of capital and returns relative to balance sheet risk. These measures are not necessarily comparable to similar measures that may be presented by other companies.
| Quarter Ended | Year-to-Date | ||||||||||||||||||||||||||||||||||||||||
| Sept. 30 | June 30 | March 31 | Dec. 31 | Sept. 30 | Sept. 30 | Sept. 30 | |||||||||||||||||||||||||||||||||||
| (Dollars in millions, except per share data) | 2022 | 2022 | 2022 | 2021 | 2021 | 2022 | 2021 | ||||||||||||||||||||||||||||||||||
Diluted EPS (1) | |||||||||||||||||||||||||||||||||||||||||
Net income available to common shareholders - GAAP | $ | 1,536 | $ | 1,454 | $ | 1,327 | $ | 1,524 | $ | 1,616 | $ | 4,317 | $ | 4,509 | |||||||||||||||||||||||||||
| Merger-related and restructuring charges | 48 | 92 | 166 | 163 | 132 | 306 | 468 | ||||||||||||||||||||||||||||||||||
| Securities (gains) losses | 1 | — | 53 | — | — | 54 | — | ||||||||||||||||||||||||||||||||||
| Loss (gain) on early extinguishment of debt | — | (30) | — | — | — | (30) | (3) | ||||||||||||||||||||||||||||||||||
| Incremental operating expenses related to the merger | 69 | 89 | 155 | 165 | 147 | 313 | 427 | ||||||||||||||||||||||||||||||||||
| Charitable contribution | — | — | — | — | — | — | 153 | ||||||||||||||||||||||||||||||||||
| Professional fee accrual | — | — | — | — | 23 | — | 23 | ||||||||||||||||||||||||||||||||||
| Acceleration for cash flow hedge unwind | — | — | — | — | — | — | 28 | ||||||||||||||||||||||||||||||||||
| Gain on redemption of noncontrolling equity interest | — | — | (57) | — | — | (57) | — | ||||||||||||||||||||||||||||||||||
| Net income available to common shareholders - adjusted | $ | 1,654 | $ | 1,605 | $ | 1,644 | $ | 1,852 | $ | 1,918 | $ | 4,903 | $ | 5,605 | |||||||||||||||||||||||||||
Weighted average shares outstanding - diluted | 1,336,659 | 1,338,864 | 1,341,563 | 1,343,029 | 1,346,854 | 1,339,071 | 1,351,712 | ||||||||||||||||||||||||||||||||||
| Diluted EPS - GAAP | $ | 1.15 | $ | 1.09 | $ | 0.99 | $ | 1.13 | $ | 1.20 | $ | 3.22 | $ | 3.34 | |||||||||||||||||||||||||||
| Diluted EPS - adjusted | 1.24 | 1.20 | 1.23 | 1.38 | 1.42 | 3.66 | 4.15 | ||||||||||||||||||||||||||||||||||
(1)The adjusted diluted earnings per share is non-GAAP in that it excludes merger-related and restructuring charges and other selected items, net of tax. Truist’s management uses this measure in their analysis of the Corporation’s performance. Truist’s management believes this measure provides a greater understanding of ongoing operations and enhances comparability of results with prior periods, as well as demonstrates the effects of significant gains and charges.
20 Truist Financial Corporation

Third Quarter 2022 Earnings Conference Call Bill Rogers – Chairman & CEO Mike Maguire – CFO October 18, 2022
2 This presentation contains “forward-looking statements” within the meaning of the Private Securities Litigation Reform Act of 1995, regarding the financial condition, results of operations, business plans and the future performance of Truist. Words such as “anticipates,” “believes,” “estimates,” “expects,” “forecasts,” “intends,” “plans,” “projects,” “may,” “will,” “should,” “would,” “could” and other similar expressions are intended to identify these forward-looking statements. In particular, forward looking statements include, but are not limited to, statements we make about: (i) Truist’s ability to generate positive operating leverage in 2022, (ii) the benefits of Truist’s shift from integrating to operating, (iii) the benefits and expenses related to Truist’s investment in its teammates, including through an increase in its minimum wage, (iv) the benefits associated with investments in digital capabilities offered by Truist and the timing for making new capabilities available to clients, (v) future levels of adjusted and core revenue, fee income, adjusted noninterest expense, net charge-off ratio, adjusted PPNR, and net interest margin, (vi) Truist’s capital position and financial performance through a range of economic scenarios, (vii) projected amounts of merger-related and restructuring charges and incremental operating expenses related to the merger and the timing for elimination of such charges and expenses, (viii) the benefits and capabilities of the Arena software platform, (ix) the ability of investments in technology to mitigate operational losses, (x) Truist’s effective tax rate in future periods, (xi) the benefits and financial impact of the BenefitMall and BankDirect Capital Finance acquisitions, and (xii) Truist’s prospects for loan growth in the near-term and medium-term, in particular with respect to prime auto and residential mortgage lending. Forward-looking statements are not based on historical facts but instead represent management’s expectations and assumptions regarding Truist’s business, the economy and other future conditions. Such statements involve inherent uncertainties, risks and changes in circumstances that are difficult to predict. As such, Truist’s actual results may differ materially from those contemplated by forward-looking statements. While there can be no assurance that any list of risks and uncertainties or risk factors is complete, important factors that could cause actual results to differ materially from those contemplated by forward-looking statements include the following, without limitation, as well as the risks and uncertainties more fully discussed under Part I, Item 1A-Risk Factors in our Annual Report on Form 10-K for the year ended December 31, 2021 and in Truist’s subsequent filings with the Securities and Exchange Commission: • residual risks and uncertainties relating to the Merger of heritage BB&T and heritage SunTrust, including the ability to realize the anticipated benefits of the Merger; • expenses relating to the Merger and application and data center decommissioning; • deposit attrition, client loss or revenue loss following completed mergers or acquisitions may be greater than anticipated; • the COVID-19 pandemic disrupted the global economy and adversely impacted Truist’s financial condition and results of operations, including through increased expenses, reduced fee income and net interest margin, decreased demand for certain types of loans, and increases in the allowance for credit losses; a resurgence of the pandemic, whether due to new variants of the coronavirus or other factors, could reintroduce or prolong these negative impacts and also adversely affect Truist’s capital and liquidity position or cost of capital, impair the ability of borrowers to repay outstanding loans, cause an outflow of deposits, and impair goodwill or other assets; • Truist is subject to credit risk by lending or committing to lend money, and may have more credit risk and higher credit losses to the extent that loans are concentrated by loan type, industry segment, borrower type or location of the borrower or collateral; • changes in the interest rate environment, including the replacement of LIBOR as an interest rate benchmark, which could adversely affect Truist’s revenue and expenses, the value of assets and obligations, and the availability and cost of capital, cash flows, and liquidity; • inability to access short-term funding or liquidity, loss of client deposits or changes in Truist’s credit ratings, which could increase the cost of funding or limit access to capital markets; • risk management oversight functions may not identify or address risks adequately, and management may not be able to effectively manage credit risk; • risks resulting from the extensive use of models in Truist’s business, which may impact decisions made by management and regulators; • failure to execute on strategic or operational plans, including the ability to successfully complete or integrate mergers and acquisitions; • increased competition, including from (i) new or existing competitors that could have greater financial resources or be subject to different regulatory standards, and (ii) products and services offered by non-bank financial technology companies, may reduce Truist’s client base, cause Truist to lower prices for its products and services in order to maintain market share or otherwise adversely impact Truist’s businesses or results of operations; • failure to maintain or enhance Truist’s competitive position with respect to new products, services and technology, whether it fails to anticipate client expectations or because its technological developments fail to perform as desired or do not achieve market acceptance or regulatory approval or for other reasons, may cause Truist to lose market share or incur additional expense; • negative public opinion, which could damage Truist’s reputation; • increased scrutiny regarding Truist’s consumer sales practices, training practices, incentive compensation design, and governance; • regulatory matters, litigation or other legal actions, which may result in, among other things, costs, fines, penalties, restrictions on Truist’s business activities, reputational harm, negative publicity, or other adverse consequences; • evolving legislative, accounting and regulatory standards, including with respect to climate, capital, and liquidity requirements, and results of regulatory examinations may adversely affect Truist’s financial condition and results of operations; • the monetary and fiscal policies of the federal government and its agencies, including in response to rising inflation, could have a material adverse effect on the economy and Truist’s profitability; • accounting policies and processes require management to make estimates about matters that are uncertain, including the potential write down to goodwill if there is an elongated period of decline in market value for Truist’s stock and adverse economic conditions are sustained over a period of time; • general economic or business conditions, either globally, nationally or regionally, may be less favorable than expected, including as a result of supply chain disruptions, inflationary pressures and labor shortages, and instability in global geopolitical matters or volatility in financial markets could result in, among other things, slower deposit or asset growth, a deterioration in credit quality, or a reduced demand for credit, insurance, or other services; • risks related to originating and selling mortgages, including repurchase and indemnity demands from purchasers related to representations and warranties on loans sold, which could result in an increase in the amount of losses for loan repurchases; • risks relating to Truist’s role as a loan servicer, including an increase in the scope or costs of the services Truist is required to perform, without any corresponding increase in servicing fees or a breach of Truist’s obligations as servicer; • Truist’s success depends on hiring and retaining key teammates, and if these individuals leave or change roles without effective replacements, Truist’s operations and integration activities could be adversely impacted, which could be exacerbated in the increased work-from-home environment caused by the COVID-19 pandemic as job markets may be less constrained by physical geography; • fraud or misconduct by internal or external parties, which Truist may not be able to prevent, detect, or mitigate; • security risks, including denial of service attacks, hacking, social engineering attacks targeting Truist’s teammates and clients, malware intrusion, data corruption attempts, system breaches, cyber-attacks, which have increased in frequency with current geopolitical tensions, identity theft, ransomware attacks, and physical security risks, such as natural disasters, environmental conditions, and intentional acts of destruction, could result in the disclosure of confidential information, adversely affect Truist’s business or reputation or create significant legal or financial exposure; and • widespread outages of operational, communication, or other systems, whether internal or provided by third parties, natural or other disasters (including acts of terrorism and pandemics), and the effects of climate change, including physical risks, such as more frequent and intense weather events, and risks related to the transition to a lower carbon economy, such as regulatory or technological changes or shifts in market dynamics or consumer preferences, could have an adverse effect on Truist’s financial condition and results of operations, lead to material disruption of Truist’s operations or the ability or willingness of clients to access Truist’s products and services. Readers are cautioned not to place undue reliance on these forward-looking statements, which speak only as of the date they are made. Except to the extent required by applicable law or regulation, Truist undertakes no obligation to revise or update any forward-looking statements. Forward-Looking Statements
3 Non-GAAP Information This presentation contains financial information and performance measures determined by methods other than in accordance with accounting principles generally accepted in the United States of America ("GAAP"). Truist’s management uses these "non-GAAP" measures in their analysis of the Corporation's performance and the efficiency of its operations. Management believes these non-GAAP measures provide a greater understanding of ongoing operations, enhance comparability of results with prior periods and demonstrate the effects of significant items in the current period. The Company believes a meaningful analysis of its financial performance requires an understanding of the factors underlying that performance. Truist’s management believes investors may find these non-GAAP financial measures useful. These disclosures should not be viewed as a substitute for financial measures determined in accordance with GAAP, nor are they necessarily comparable to non- GAAP performance measures that may be presented by other companies. Below is a listing of the types of non-GAAP measures used in this presentation: Adjusted Efficiency Ratio - The adjusted efficiency ratio is non-GAAP in that it excludes securities gains (losses), amortization of intangible assets, merger-related and restructuring charges, and other selected items. Truist’s management uses this measure in their analysis of the Corporation’s performance. Truist’s management believes this measure provides a greater understanding of ongoing operations and enhances comparability of results with prior periods, as well as demonstrates the effects of significant gains and charges. Adjusted Operating Leverage - The adjusted operating leverage ratio is non-GAAP in that it excludes securities gains (losses), amortization of intangible assets, merger-related and restructuring charges, and other selected items. Truist’s management uses this measure in their analysis of the Corporation’s performance. Truist’s management believes this measure provides a greater understanding of ongoing operations and enhances comparability of results with prior periods, as well as demonstrates the effects of significant gains and charges. Pre-Provision Net Revenue (PPNR) - Pre-provision net revenue is a non-GAAP measure that adjusts net income determined in accordance with GAAP to exclude the impact of the provision for credit losses and provision for income taxes. Adjusted pre-provision net revenue is a non-GAAP measure that additionally excludes securities gains (losses), merger-related and restructuring charges, amortization of intangible assets, and other selected items. Truist’s management believes these measures provide a greater understanding of ongoing operations and enhances comparability of results with prior periods. Tangible Common Equity and Related Measures - Tangible common equity and related measures are non-GAAP measures that exclude the impact of intangible assets, net of deferred taxes, and their related amortization. These measures are useful for evaluating the performance of a business consistently, whether acquired or developed internally. Truist’s management uses these measures to assess the quality of capital and returns relative to balance sheet risk. Core NIM - Core net interest margin is a non-GAAP measure that adjusts net interest margin to exclude the impact of purchase accounting. The purchase accounting marks and related amortization for loans, deposits, and long-term debt from SunTrust and other acquisitions are excluded to approximate the yields paid by clients. Truist’s management believes the adjustments to the calculation of net interest margin for certain assets and liabilities acquired provide investors with useful information related to the performance of Truist’s earning assets. Adjusted Diluted EPS - The adjusted diluted earnings per share is non-GAAP in that it excludes merger-related and restructuring charges and other selected items, net of tax. Truist’s management uses this measure in their analysis of the Corporation’s performance. Truist’s management believes this measure provides a greater understanding of ongoing operations and enhances comparability of results with prior periods, as well as demonstrates the effects of significant gains and charges. Performance Ratios - The adjusted performance ratios, including adjusted return on average assets, adjusted return on average common shareholders’ equity, and adjusted return on average tangible common shareholders’ equity, are non-GAAP in that they exclude merger-related and restructuring charges, selected items, and, in the case of return on average tangible common shareholders’ equity, amortization of intangible assets. Truist’s management uses these measures in their analysis of the Corporation’s performance. Truist’s management believes these measures provide a greater understanding of ongoing operations and enhance comparability of results with prior periods, as well as demonstrate the effects of significant gains and charges. Insurance Holdings Adjusted EBITDA - EBITDA is a non-GAAP measurement of operating profitability that is calculated by adding back interest, taxes, depreciation, and amortization to net income. Truist’s management also adds back merger- related and restructuring charges, incremental operating expenses related to the merger, and other selected items. Truist’s management uses this measure in its analysis of the Corporation’s Insurance Holdings segment. Truist’s management believes this measure provides a greater understanding of ongoing operations and enhances comparability of results with prior periods, as well as demonstrates the effects of significant gains and charges. Selected items affecting results are included on slide 7.
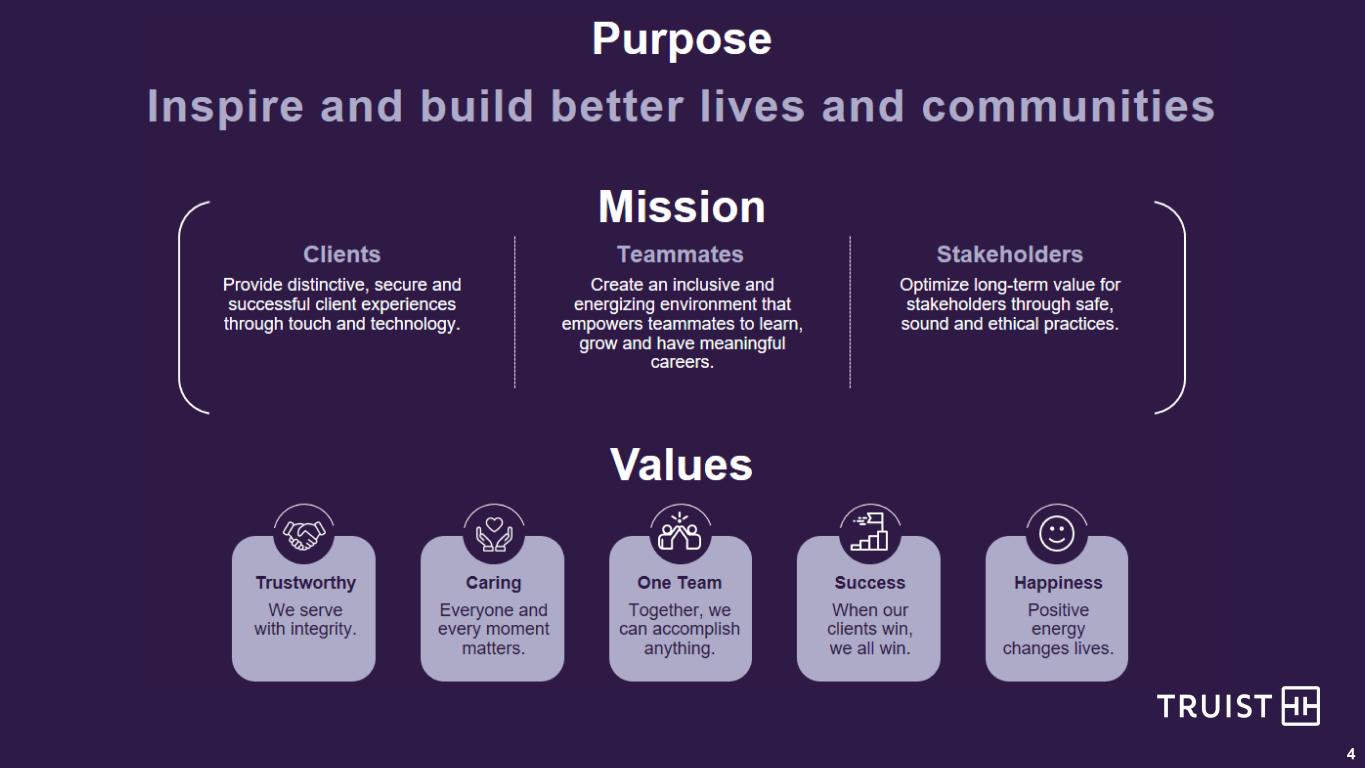
4
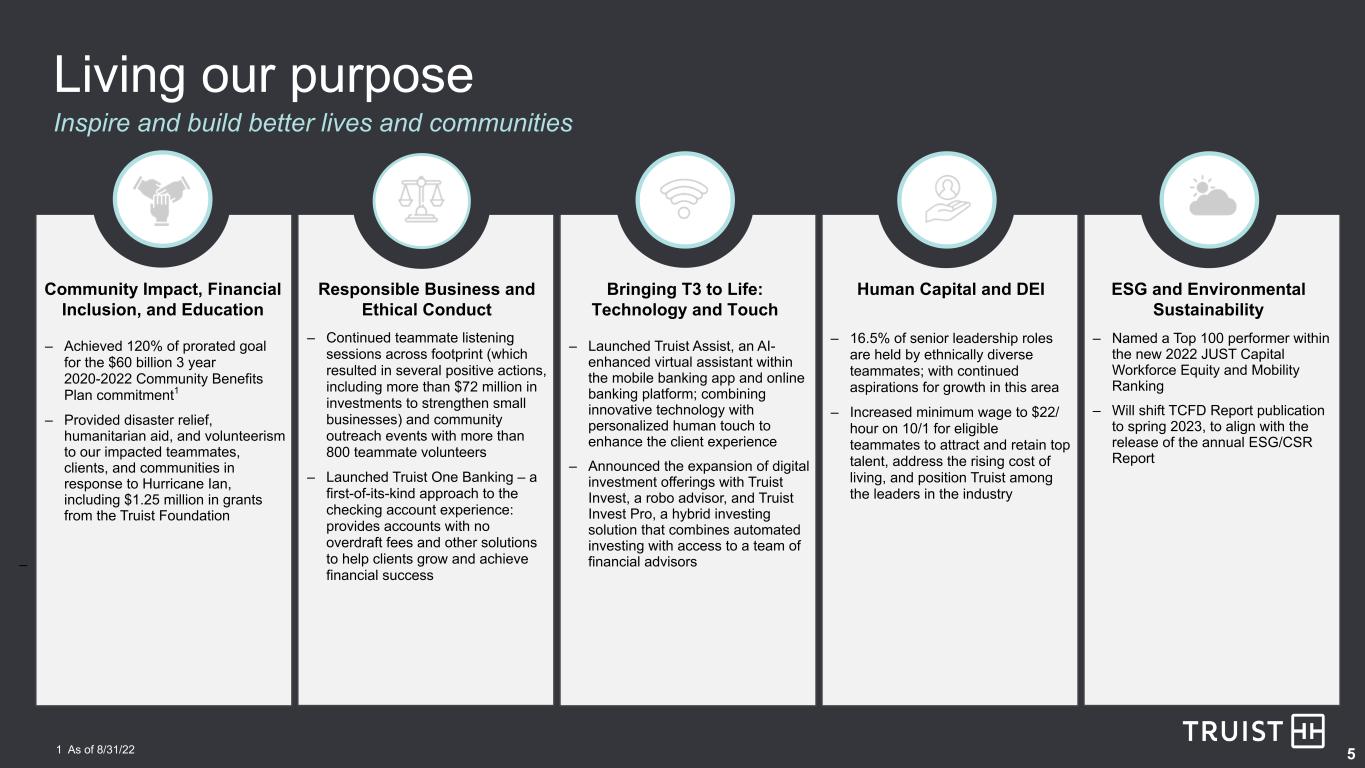
5 Living our purpose Inspire and build better lives and communities Community Impact, Financial Inclusion, and Education Responsible Business and Ethical Conduct Bringing T3 to Life: Technology and Touch Human Capital and DEI ESG and Environmental Sustainability – Achieved 120% of prorated goal for the $60 billion 3 year 2020-2022 Community Benefits Plan commitment1 – Provided disaster relief, humanitarian aid, and volunteerism to our impacted teammates, clients, and communities in response to Hurricane Ian, including $1.25 million in grants from the Truist Foundation – – Continued teammate listening sessions across footprint (which resulted in several positive actions, including more than $72 million in investments to strengthen small businesses) and community outreach events with more than 800 teammate volunteers – Launched Truist One Banking – a first-of-its-kind approach to the checking account experience: provides accounts with no overdraft fees and other solutions to help clients grow and achieve financial success – Launched Truist Assist, an AI- enhanced virtual assistant within the mobile banking app and online banking platform; combining innovative technology with personalized human touch to enhance the client experience – Announced the expansion of digital investment offerings with Truist Invest, a robo advisor, and Truist Invest Pro, a hybrid investing solution that combines automated investing with access to a team of financial advisors – 16.5% of senior leadership roles are held by ethnically diverse teammates; with continued aspirations for growth in this area – Increased minimum wage to $22/ hour on 10/1 for eligible teammates to attract and retain top talent, address the rising cost of living, and position Truist among the leaders in the industry – Named a Top 100 performer within the new 2022 JUST Capital Workforce Equity and Mobility Ranking – Will shift TCFD Report publication to spring 2023, to align with the release of the annual ESG/CSR Report 1 As of 8/31/22

Financial Results
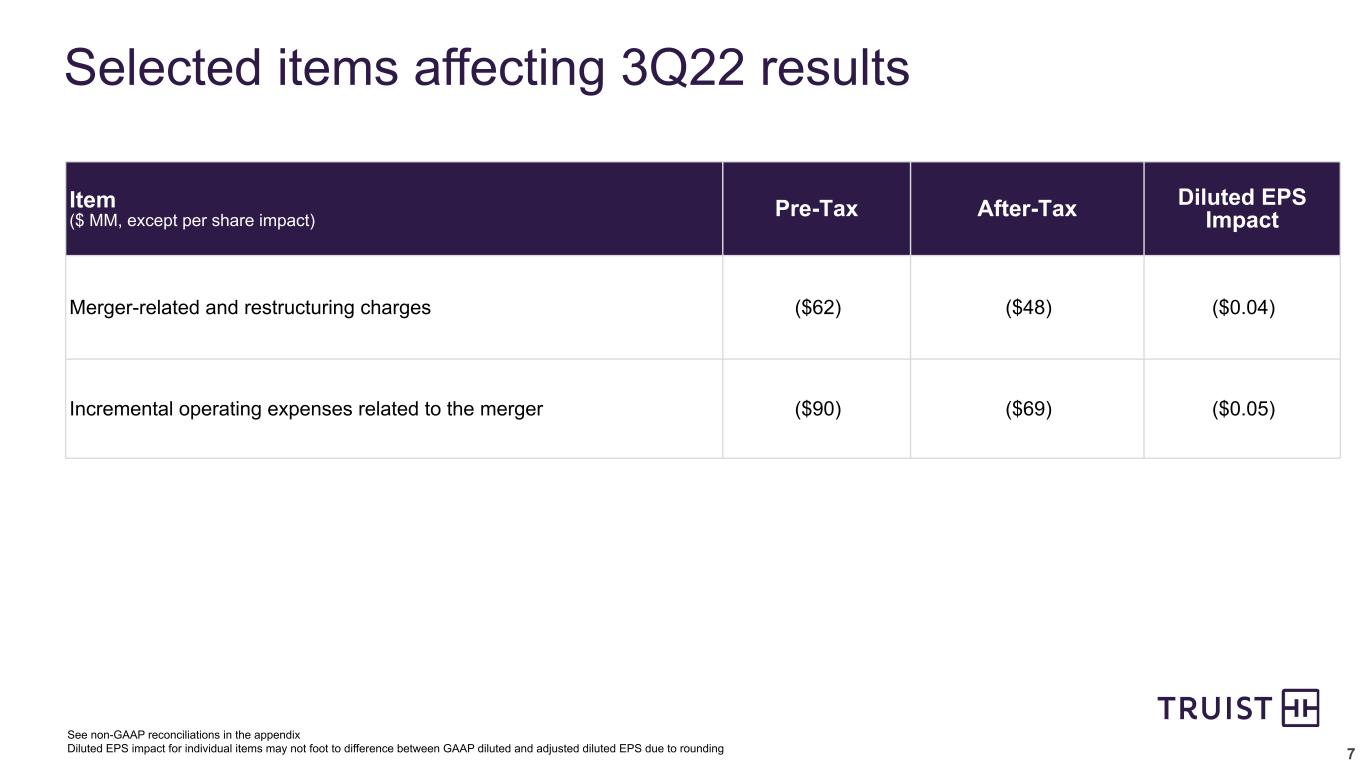
7 Selected items affecting 3Q22 results Item ($ MM, except per share impact) Pre-Tax After-Tax Diluted EPS Impact Merger-related and restructuring charges ($62) ($48) ($0.04) Incremental operating expenses related to the merger ($90) ($69) ($0.05) See non-GAAP reconciliations in the appendix Diluted EPS impact for individual items may not foot to difference between GAAP diluted and adjusted diluted EPS due to rounding
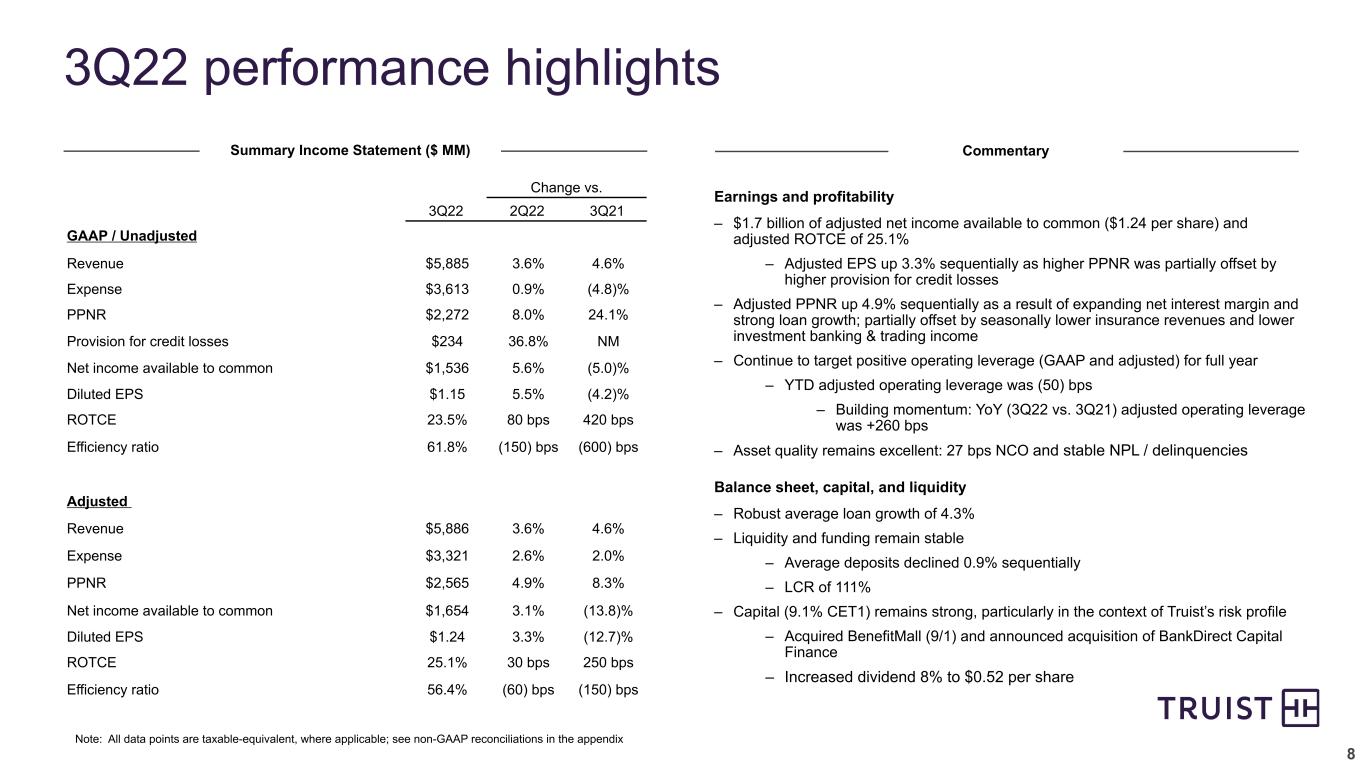
8 3Q22 performance highlights Earnings and profitability – $1.7 billion of adjusted net income available to common ($1.24 per share) and adjusted ROTCE of 25.1% – Adjusted EPS up 3.3% sequentially as higher PPNR was partially offset by higher provision for credit losses – Adjusted PPNR up 4.9% sequentially as a result of expanding net interest margin and strong loan growth; partially offset by seasonally lower insurance revenues and lower investment banking & trading income – Continue to target positive operating leverage (GAAP and adjusted) for full year – YTD adjusted operating leverage was (50) bps – Building momentum: YoY (3Q22 vs. 3Q21) adjusted operating leverage was +260 bps – Asset quality remains excellent: 27 bps NCO and stable NPL / delinquencies Balance sheet, capital, and liquidity – Robust average loan growth of 4.3% – Liquidity and funding remain stable – Average deposits declined 0.9% sequentially – LCR of 111% – Capital (9.1% CET1) remains strong, particularly in the context of Truist’s risk profile – Acquired BenefitMall (9/1) and announced acquisition of BankDirect Capital Finance – Increased dividend 8% to $0.52 per share Change vs. 3Q22 2Q22 3Q21 GAAP / Unadjusted Revenue $5,885 3.6% 4.6% Expense $3,613 0.9% (4.8)% PPNR $2,272 8.0% 24.1% Provision for credit losses $234 36.8% NM Net income available to common $1,536 5.6% (5.0)% Diluted EPS $1.15 5.5% (4.2)% ROTCE 23.5% 80 bps 420 bps Efficiency ratio 61.8% (150) bps (600) bps Adjusted Revenue $5,886 3.6% 4.6% Expense $3,321 2.6% 2.0% PPNR $2,565 4.9% 8.3% Net income available to common $1,654 3.1% (13.8)% Diluted EPS $1.24 3.3% (12.7)% ROTCE 25.1% 30 bps 250 bps Efficiency ratio 56.4% (60) bps (150) bps Note: All data points are taxable-equivalent, where applicable; see non-GAAP reconciliations in the appendix Summary Income Statement ($ MM) Commentary
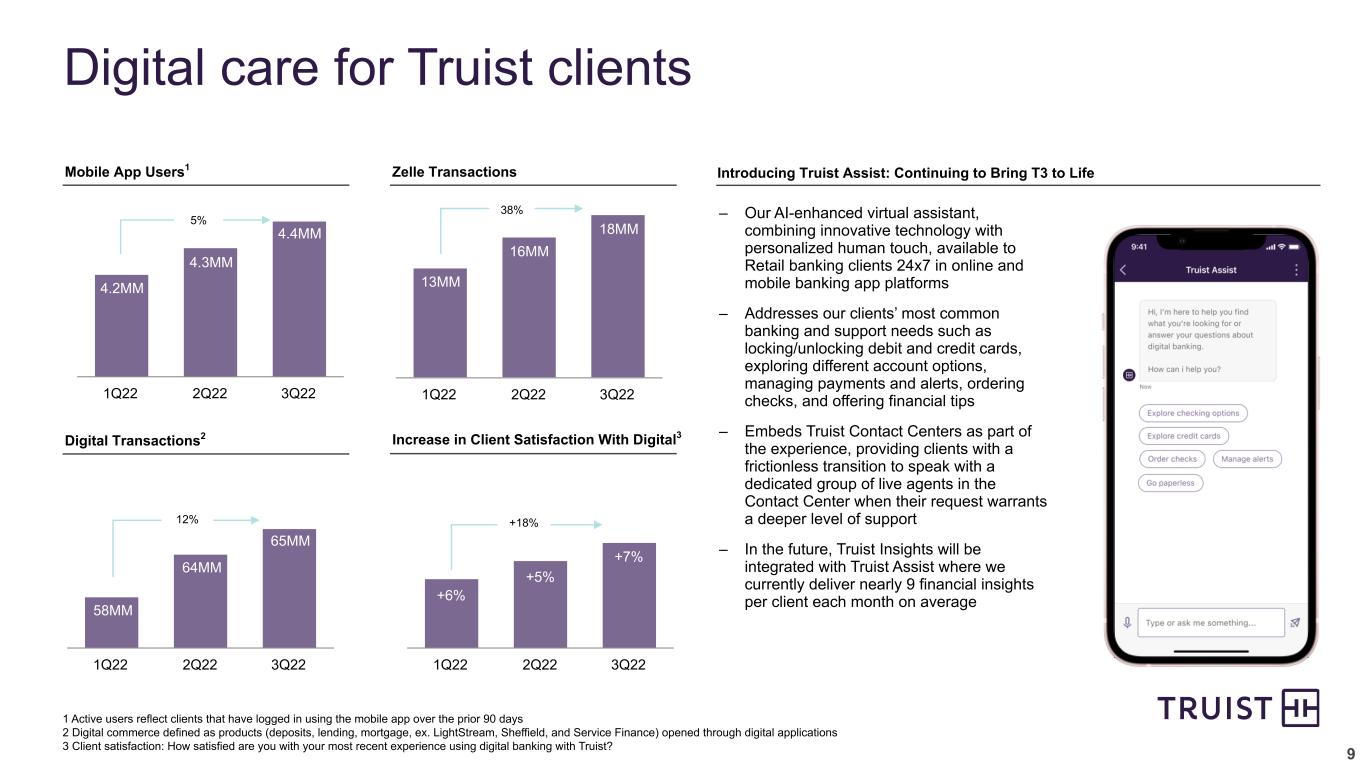
9 1Q22 2Q22 3Q22 Digital care for Truist clients 1Q22 2Q22 3Q22 1 Active users reflect clients that have logged in using the mobile app over the prior 90 days 2 Digital commerce defined as products (deposits, lending, mortgage, ex. LightStream, Sheffield, and Service Finance) opened through digital applications 3 Client satisfaction: How satisfied are you with your most recent experience using digital banking with Truist? 4.2MM 4.3MM Mobile App Users1 Zelle Transactions Digital Transactions2 Increase in Client Satisfaction With Digital3 Introducing Truist Assist: Continuing to Bring T3 to Life 1Q22 2Q22 3Q22 58MM 64MM 1Q22 2Q22 3Q22 13MM 16MM – Our AI-enhanced virtual assistant, combining innovative technology with personalized human touch, available to Retail banking clients 24x7 in online and mobile banking app platforms – Addresses our clients’ most common banking and support needs such as locking/unlocking debit and credit cards, exploring different account options, managing payments and alerts, ordering checks, and offering financial tips – Embeds Truist Contact Centers as part of the experience, providing clients with a frictionless transition to speak with a dedicated group of live agents in the Contact Center when their request warrants a deeper level of support – In the future, Truist Insights will be integrated with Truist Assist where we currently deliver nearly 9 financial insights per client each month on average 4.4MM 65MM 18MM 5% 12% 38% +6% +5% +7% +18%
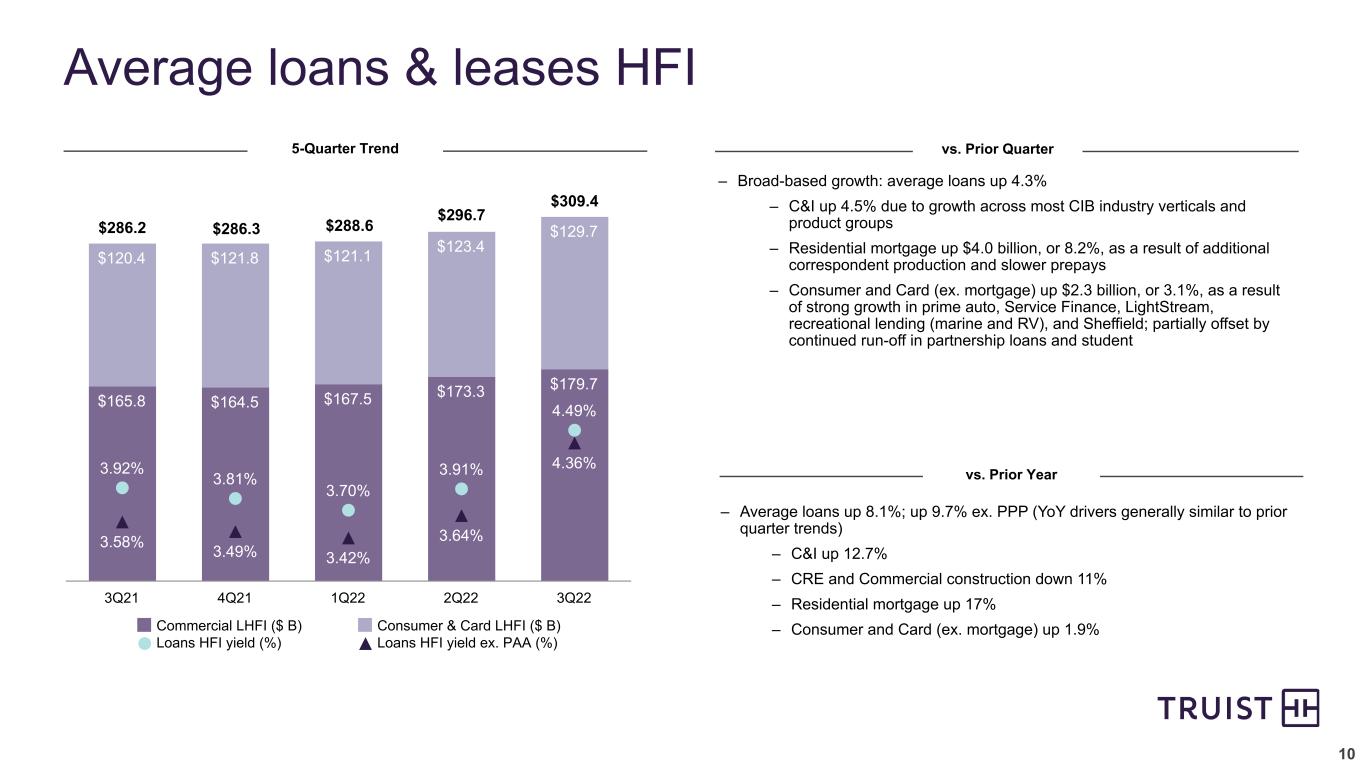
10 $165.8 $164.5 $167.5 $173.3 $179.7 $120.4 $121.8 $121.1 $123.4 $129.7 3.92% 3.81% 3.70% 3.91% 4.49% 3.58% 3.49% 3.42% 3.64% 4.36% Commercial LHFI ($ B) Consumer & Card LHFI ($ B) Loans HFI yield (%) Loans HFI yield ex. PAA (%) 3Q21 4Q21 1Q22 2Q22 3Q22 – Average loans up 8.1%; up 9.7% ex. PPP (YoY drivers generally similar to prior quarter trends) – C&I up 12.7% – CRE and Commercial construction down 11% – Residential mortgage up 17% – Consumer and Card (ex. mortgage) up 1.9% – Broad-based growth: average loans up 4.3% – C&I up 4.5% due to growth across most CIB industry verticals and product groups – Residential mortgage up $4.0 billion, or 8.2%, as a result of additional correspondent production and slower prepays – Consumer and Card (ex. mortgage) up $2.3 billion, or 3.1%, as a result of strong growth in prime auto, Service Finance, LightStream, recreational lending (marine and RV), and Sheffield; partially offset by continued run-off in partnership loans and student Average loans & leases HFI 5-Quarter Trend vs. Prior Quarter vs. Prior Year $286.2 $286.3 $288.6 $296.7 $309.4
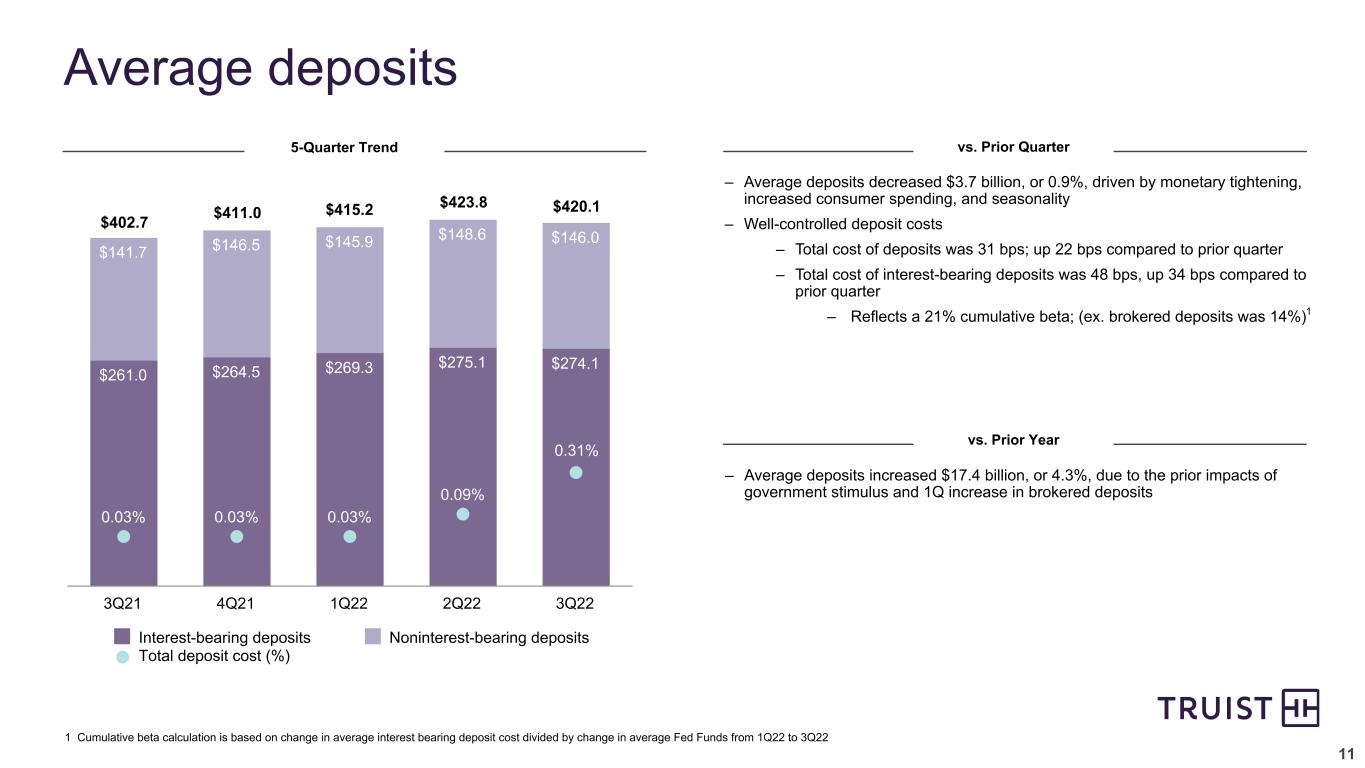
11 – Average deposits decreased $3.7 billion, or 0.9%, driven by monetary tightening, increased consumer spending, and seasonality – Well-controlled deposit costs – Total cost of deposits was 31 bps; up 22 bps compared to prior quarter – Total cost of interest-bearing deposits was 48 bps, up 34 bps compared to prior quarter – Reflects a 21% cumulative beta; (ex. brokered deposits was 14%)1 Average deposits $261.0 $264.5 $269.3 $275.1 $274.1 $141.7 $146.5 $145.9 $148.6 $146.0 0.03% 0.03% 0.03% 0.09% Interest-bearing deposits Noninterest-bearing deposits Total deposit cost (%) 3Q21 4Q21 1Q22 2Q22 3Q22 5-Quarter Trend vs. Prior Quarter vs. Prior Year – Average deposits increased $17.4 billion, or 4.3%, due to the prior impacts of government stimulus and 1Q increase in brokered deposits 1 Cumulative beta calculation is based on change in average interest bearing deposit cost divided by change in average Fed Funds from 1Q22 to 3Q22 $402.7 $411.0 $415.2 $423.8 $420.1 0.31%
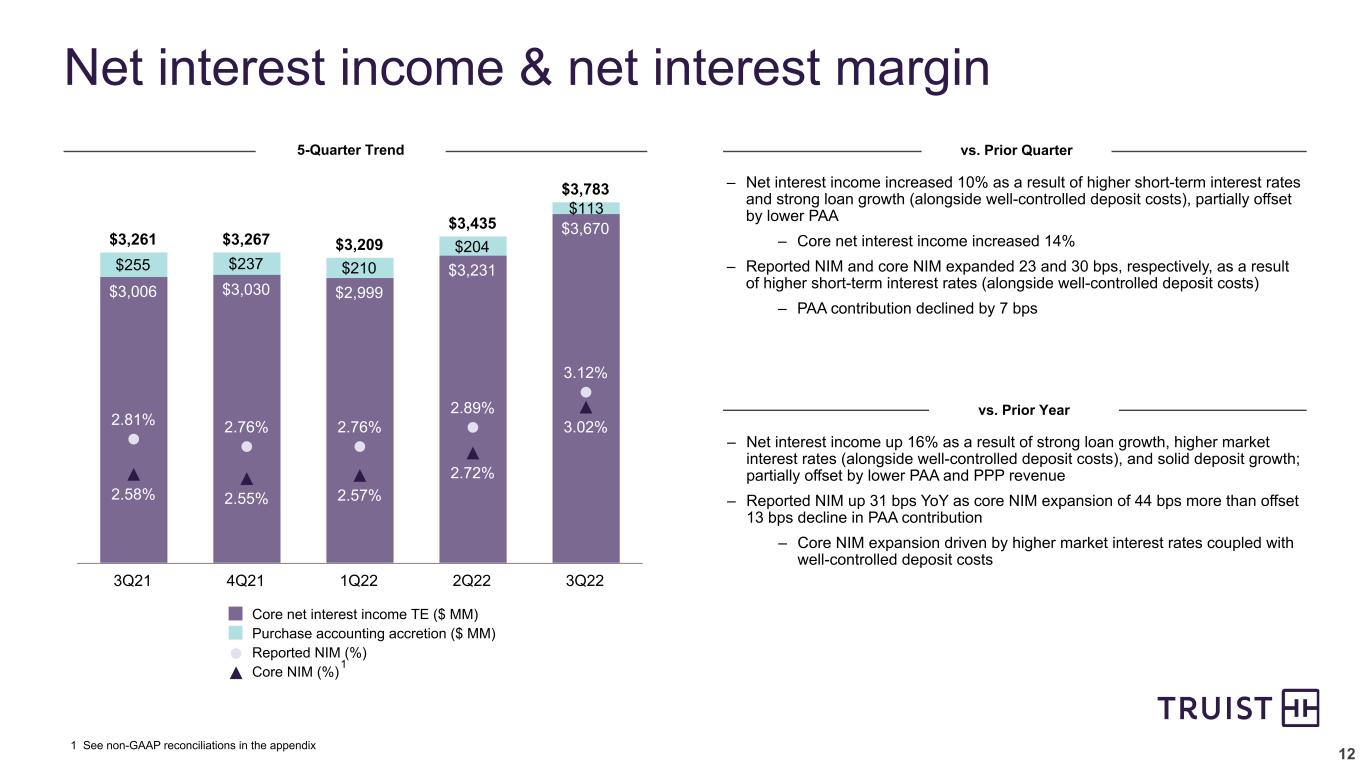
12 – Net interest income increased 10% as a result of higher short-term interest rates and strong loan growth (alongside well-controlled deposit costs), partially offset by lower PAA – Core net interest income increased 14% – Reported NIM and core NIM expanded 23 and 30 bps, respectively, as a result of higher short-term interest rates (alongside well-controlled deposit costs) – PAA contribution declined by 7 bps $3,261 $3,267 $3,209 $3,435 $3,783 $3,006 $3,030 $2,999 $3,231 $3,670 $255 $237 $210 $204 $113 2.81% 2.76% 2.76% 2.89% 3.12% 2.58% 2.55% 2.57% 2.72% 3.02% Core net interest income TE ($ MM) Purchase accounting accretion ($ MM) Reported NIM (%) Core NIM (%) 3Q21 4Q21 1Q22 2Q22 3Q22 Net interest income & net interest margin 5-Quarter Trend vs. Prior Quarter vs. Prior Year – Net interest income up 16% as a result of strong loan growth, higher market interest rates (alongside well-controlled deposit costs), and solid deposit growth; partially offset by lower PAA and PPP revenue – Reported NIM up 31 bps YoY as core NIM expansion of 44 bps more than offset 13 bps decline in PAA contribution – Core NIM expansion driven by higher market interest rates coupled with well-controlled deposit costs 1 See non-GAAP reconciliations in the appendix 1
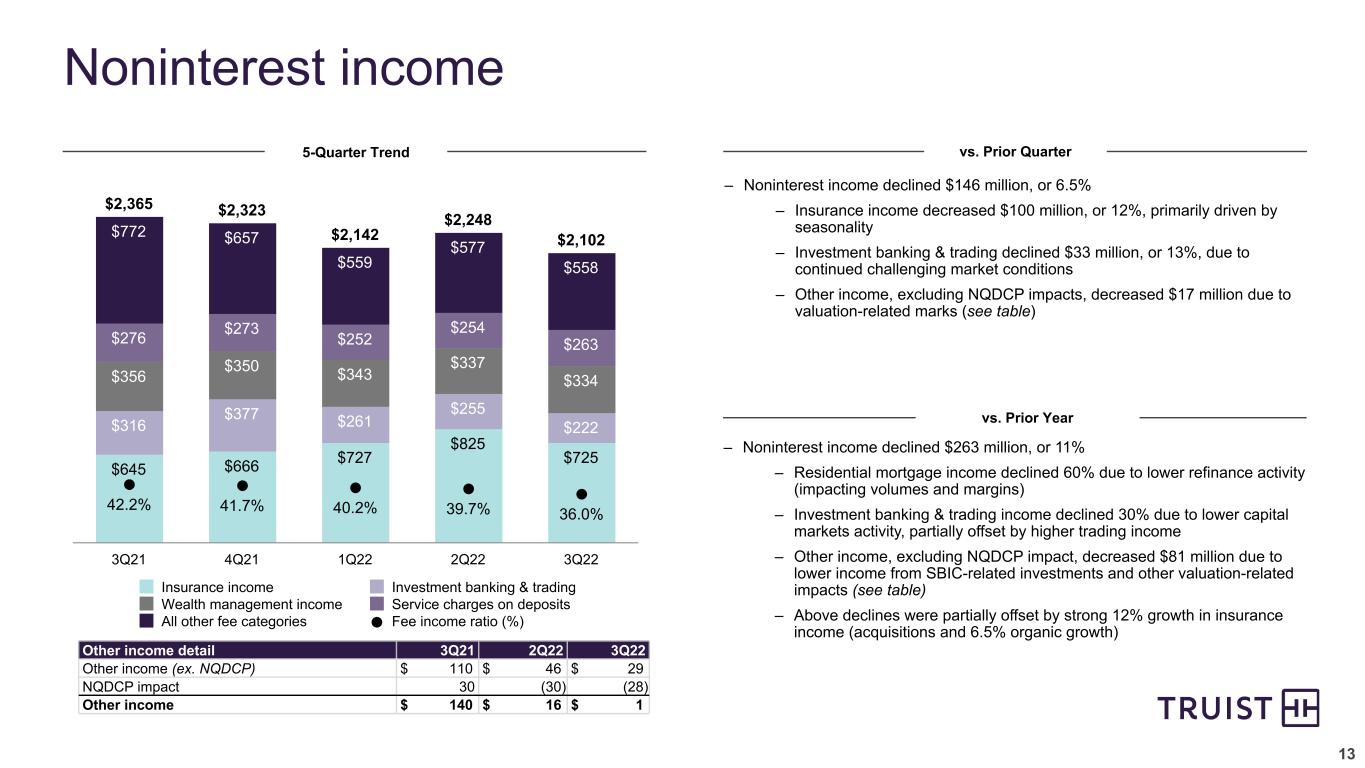
13 – Noninterest income declined $146 million, or 6.5% – Insurance income decreased $100 million, or 12%, primarily driven by seasonality – Investment banking & trading declined $33 million, or 13%, due to continued challenging market conditions – Other income, excluding NQDCP impacts, decreased $17 million due to valuation-related marks (see table) $2,365 $2,323 $2,142 $2,248 $2,102 $645 $666 $727 $825 $725 $316 $377 $261 $255 $222 $356 $350 $343 $337 $334 $276 $273 $252 $254 $263 $772 $657 $559 $577 $558 42.2% 41.7% 40.2% 39.7% 36.0% Insurance income Investment banking & trading Wealth management income Service charges on deposits All other fee categories Fee income ratio (%) 3Q21 4Q21 1Q22 2Q22 3Q22 Noninterest income 5-Quarter Trend vs. Prior Quarter vs. Prior Year – Noninterest income declined $263 million, or 11% – Residential mortgage income declined 60% due to lower refinance activity (impacting volumes and margins) – Investment banking & trading income declined 30% due to lower capital markets activity, partially offset by higher trading income – Other income, excluding NQDCP impact, decreased $81 million due to lower income from SBIC-related investments and other valuation-related impacts (see table) – Above declines were partially offset by strong 12% growth in insurance income (acquisitions and 6.5% organic growth) Other income detail 3Q21 2Q22 3Q22 Other income (ex. NQDCP) $ 110 $ 46 $ 29 NQDCP impact 30 (30) (28) Other income $ 140 $ 16 $ 1
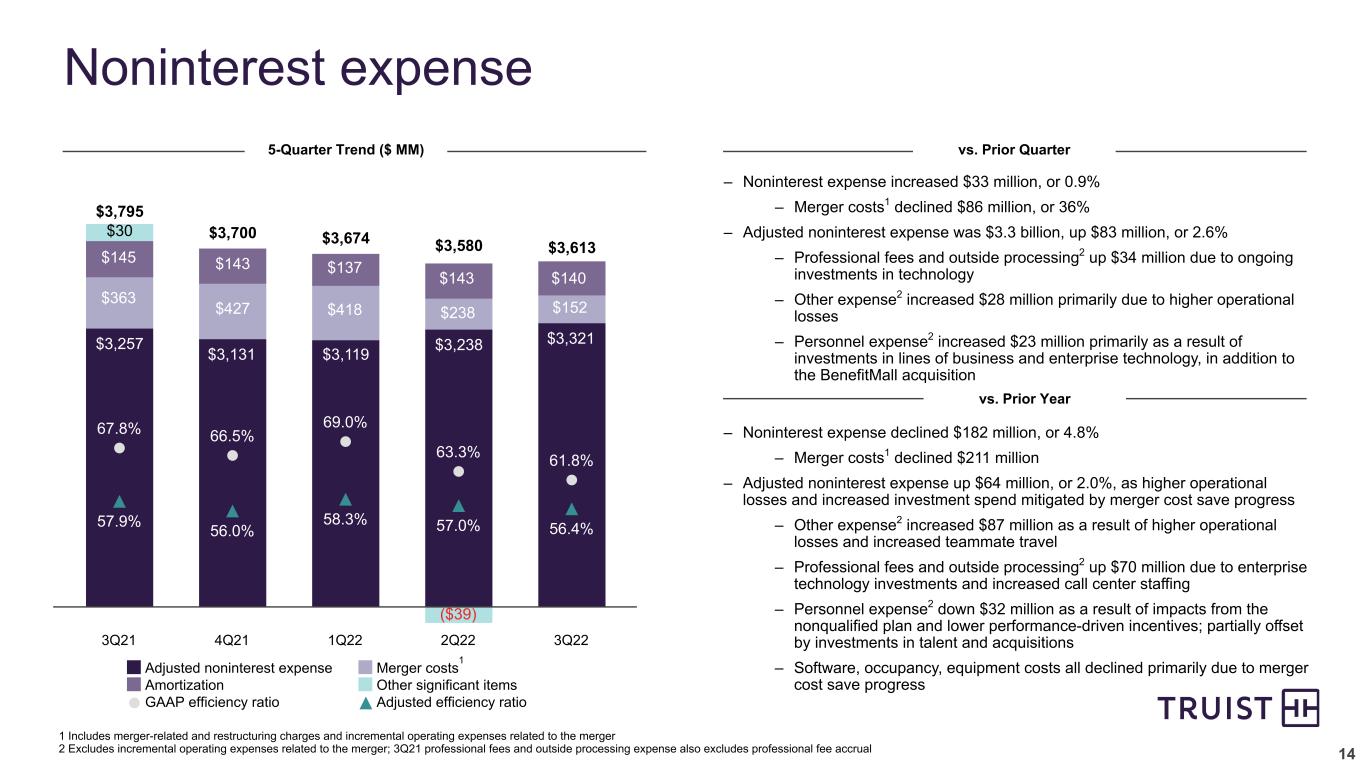
14 – Noninterest expense increased $33 million, or 0.9% – Merger costs1 declined $86 million, or 36% – Adjusted noninterest expense was $3.3 billion, up $83 million, or 2.6% – Professional fees and outside processing2 up $34 million due to ongoing investments in technology – Other expense2 increased $28 million primarily due to higher operational losses – Personnel expense2 increased $23 million primarily as a result of investments in lines of business and enterprise technology, in addition to the BenefitMall acquisition 67.8% 66.5% 69.0% 63.3% 61.8% 57.9% 56.0% 58.3% 57.0% 56.4% Adjusted noninterest expense Merger costs Amortization Other significant items GAAP efficiency ratio Adjusted efficiency ratio 3Q21 4Q21 1Q22 2Q22 3Q22 – Noninterest expense declined $182 million, or 4.8% – Merger costs1 declined $211 million – Adjusted noninterest expense up $64 million, or 2.0%, as higher operational losses and increased investment spend mitigated by merger cost save progress – Other expense2 increased $87 million as a result of higher operational losses and increased teammate travel – Professional fees and outside processing2 up $70 million due to enterprise technology investments and increased call center staffing – Personnel expense2 down $32 million as a result of impacts from the nonqualified plan and lower performance-driven incentives; partially offset by investments in talent and acquisitions – Software, occupancy, equipment costs all declined primarily due to merger cost save progress 5-Quarter Trend ($ MM) vs. Prior Year 1 Includes merger-related and restructuring charges and incremental operating expenses related to the merger 2 Excludes incremental operating expenses related to the merger; 3Q21 professional fees and outside processing expense also excludes professional fee accrual Noninterest expense vs. Prior Quarter $30 $145 $363 $3,257 $3,795 $143 $427 $3,131 $3,700 $137 $418 $3,119 $3,674 $143 $238 $3,238 $3,580 $140 $152 $3,321 ($39) 1 $3,613
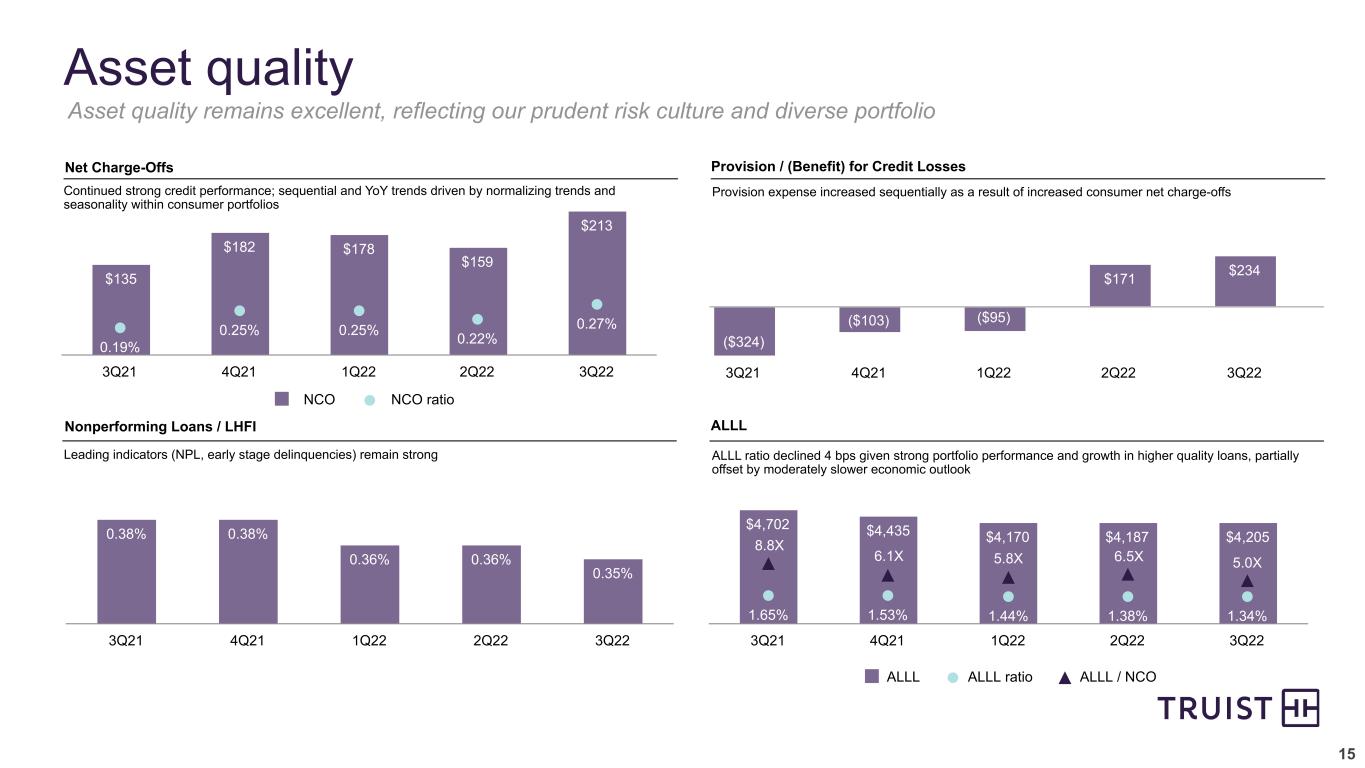
15 Asset quality 4.5x 9.0x 8.8x $421Net Charge-Offs Provision / (Benefit) for Credit Losses Nonperforming Loans / LHFI ALLL $135 $182 $178 $159 $213 0.19% 0.25% 0.25% 0.22% 0.27% NCO NCO ratio 3Q21 4Q21 1Q22 2Q22 3Q22 ($324) ($103) ($95) $171 $234 3Q21 4Q21 1Q22 2Q22 3Q22 0.38% 0.38% 0.36% 0.36% 0.35% 3Q21 4Q21 1Q22 2Q22 3Q22 $4,702 $4,435 $4,170 $4,187 $4,205 1.65% 1.53% 1.44% 1.38% 1.34% ALLL ALLL ratio ALLL / NCO 3Q21 4Q21 1Q22 2Q22 3Q22 Continued strong credit performance; sequential and YoY trends driven by normalizing trends and seasonality within consumer portfolios Provision expense increased sequentially as a result of increased consumer net charge-offs ALLL ratio declined 4 bps given strong portfolio performance and growth in higher quality loans, partially offset by moderately slower economic outlook Asset quality remains excellent, reflecting our prudent risk culture and diverse portfolio Leading indicators (NPL, early stage delinquencies) remain strong $48 8.8X 6.1X 5.8X 6.5X 5.0X
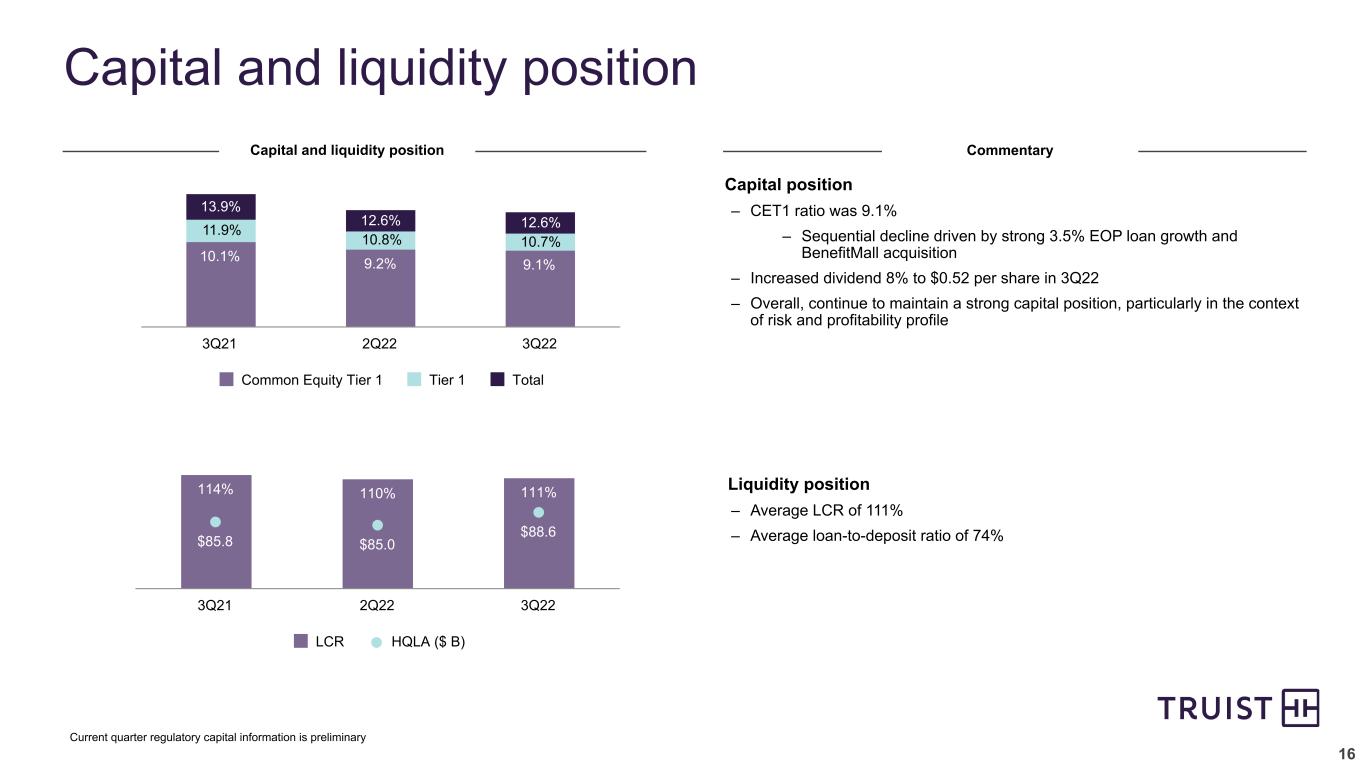
16 Capital and liquidity position 10.1% 9.2% 9.1% Common Equity Tier 1 Tier 1 Total 3Q21 2Q22 3Q22 Current quarter regulatory capital information is preliminary 114% 110% 111% $85.8 $85.0 $88.6 LCR HQLA ($ B) 3Q21 2Q22 3Q22 13.9% Capital position – CET1 ratio was 9.1% – Sequential decline driven by strong 3.5% EOP loan growth and BenefitMall acquisition – Increased dividend 8% to $0.52 per share in 3Q22 – Overall, continue to maintain a strong capital position, particularly in the context of risk and profitability profile Liquidity position – Average LCR of 111% – Average loan-to-deposit ratio of 74% 11.9% 13.9% Capital and liquidity position Commentary 10.8% 12.6% 12.6% 10.7%
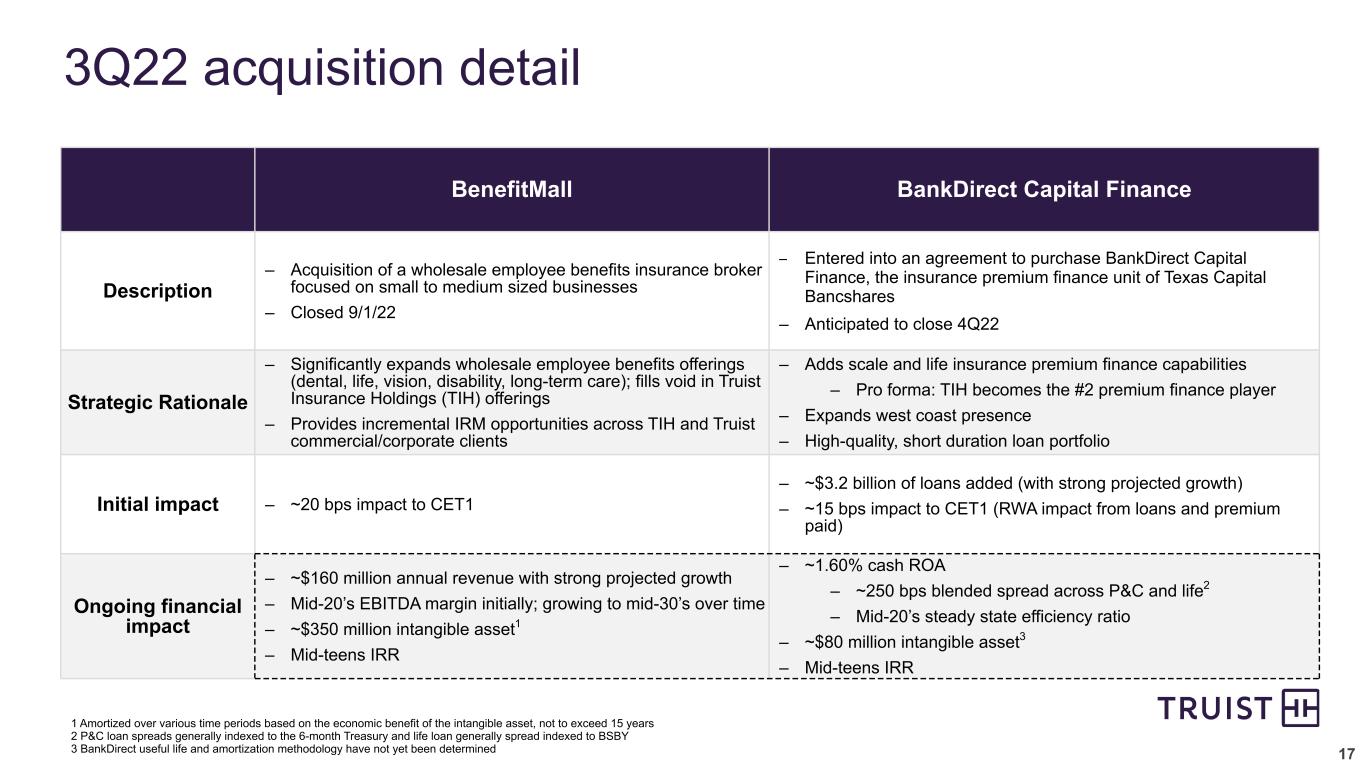
17 13.9% BenefitMall BankDirect Capital Finance Description – Acquisition of a wholesale employee benefits insurance broker focused on small to medium sized businesses – Closed 9/1/22 – Entered into an agreement to purchase BankDirect Capital Finance, the insurance premium finance unit of Texas Capital Bancshares – Anticipated to close 4Q22 Strategic Rationale – Significantly expands wholesale employee benefits offerings (dental, life, vision, disability, long-term care); fills void in Truist Insurance Holdings (TIH) offerings – Provides incremental IRM opportunities across TIH and Truist commercial/corporate clients – Adds scale and life insurance premium finance capabilities – Pro forma: TIH becomes the #2 premium finance player – Expands west coast presence – High-quality, short duration loan portfolio Initial impact – ~20 bps impact to CET1 – ~$3.2 billion of loans added (with strong projected growth) – ~15 bps impact to CET1 (RWA impact from loans and premium paid) Ongoing financial impact – ~$160 million annual revenue with strong projected growth – Mid-20’s EBITDA margin initially; growing to mid-30’s over time – ~$350 million intangible asset1 – Mid-teens IRR – ~1.60% cash ROA – ~250 bps blended spread across P&C and life2 – Mid-20’s steady state efficiency ratio – ~$80 million intangible asset3 – Mid-teens IRR 3Q22 acquisition detail 1 Amortized over various time periods based on the economic benefit of the intangible asset, not to exceed 15 years 2 P&C loan spreads generally indexed to the 6-month Treasury and life loan generally spread indexed to BSBY 3 BankDirect useful life and amortization methodology have not yet been determined
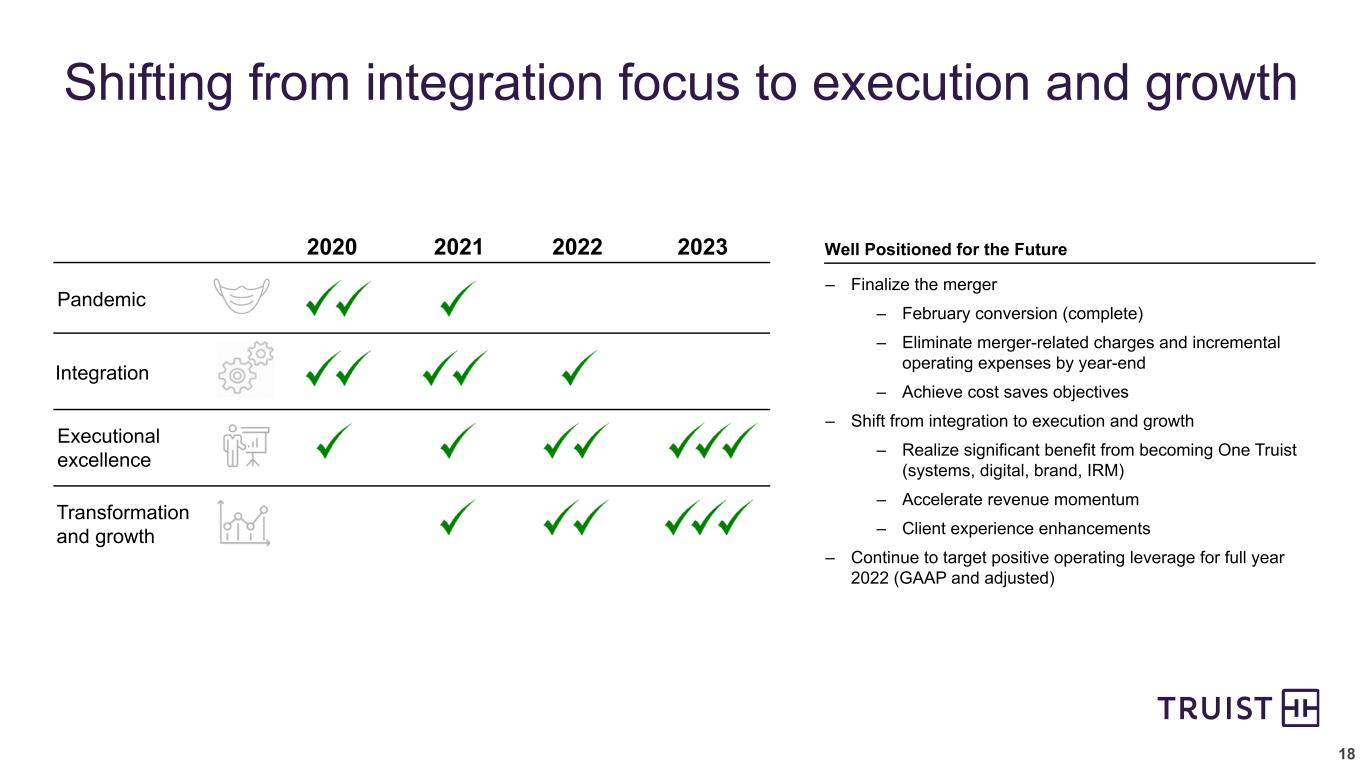
18 2020 2021 2022 2023 Pandemic Executional excellence Transformation and growth Integration Well Positioned for the Future – Finalize the merger – February conversion (complete) – Eliminate merger-related charges and incremental operating expenses by year-end – Achieve cost saves objectives – Shift from integration to execution and growth – Realize significant benefit from becoming One Truist (systems, digital, brand, IRM) – Accelerate revenue momentum – Client experience enhancements – Continue to target positive operating leverage for full year 2022 (GAAP and adjusted) Shifting from integration focus to execution and growth
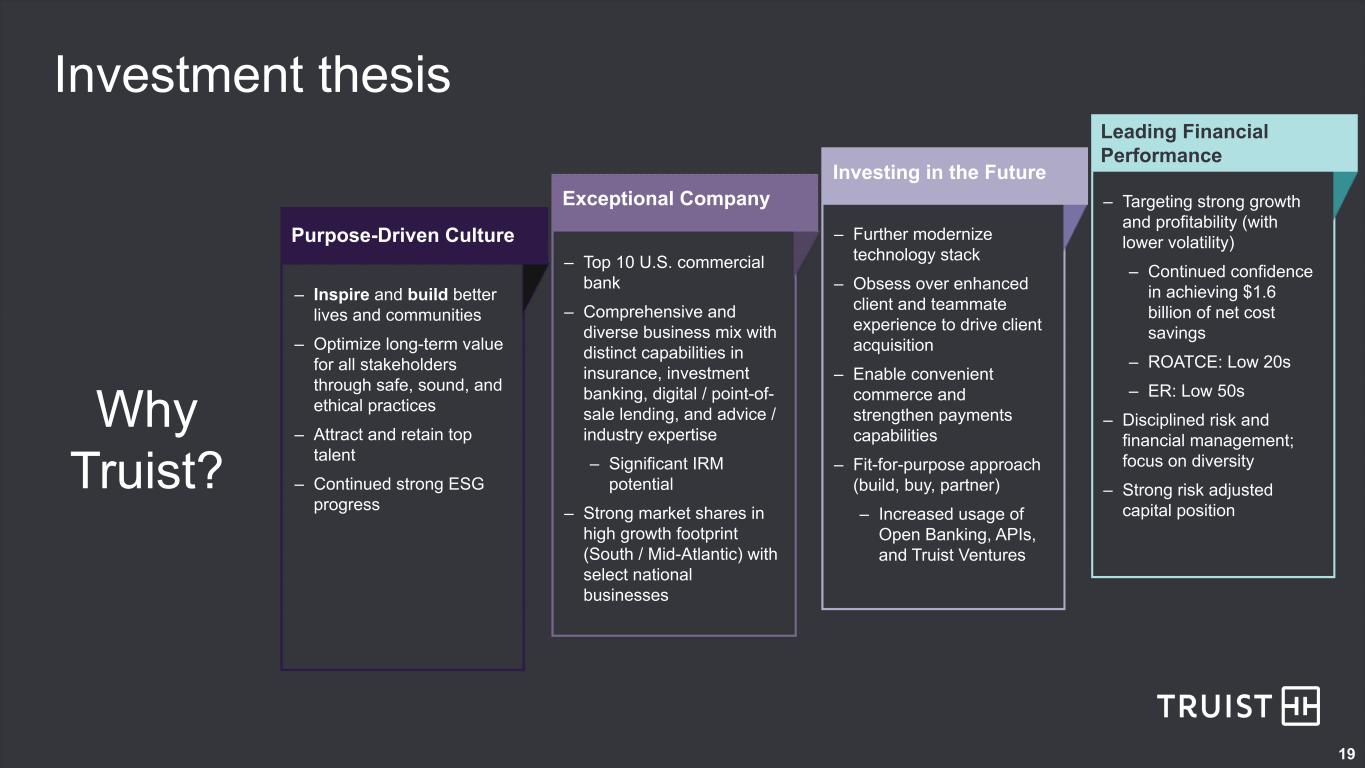
19 Investment thesis Why Truist? Purpose-Driven Culture Exceptional Company Investing in the Future Leading Financial Performance – Inspire and build better lives and communities – Optimize long-term value for all stakeholders through safe, sound, and ethical practices – Attract and retain top talent – Continued strong ESG progress – Top 10 U.S. commercial bank – Comprehensive and diverse business mix with distinct capabilities in insurance, investment banking, digital / point-of- sale lending, and advice / industry expertise – Significant IRM potential – Strong market shares in high growth footprint (South / Mid-Atlantic) with select national businesses – Further modernize technology stack – Obsess over enhanced client and teammate experience to drive client acquisition – Enable convenient commerce and strengthen payments capabilities – Fit-for-purpose approach (build, buy, partner) – Increased usage of Open Banking, APIs, and Truist Ventures – Targeting strong growth and profitability (with lower volatility) – Continued confidence in achieving $1.6 billion of net cost savings – ROATCE: Low 20s – ER: Low 50s – Disciplined risk and financial management; focus on diversity – Strong risk adjusted capital position

Appendix
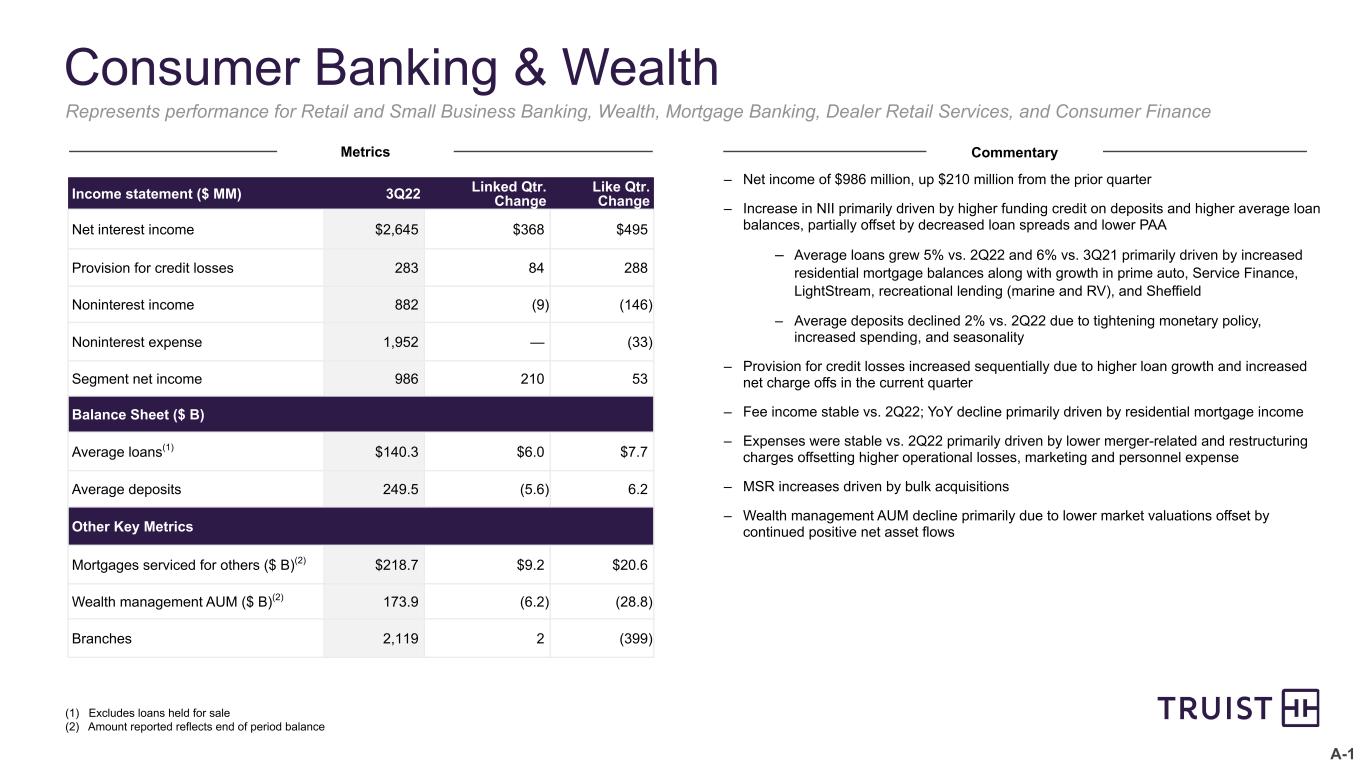
A-1 Consumer Banking & Wealth Income statement ($ MM) 3Q22 Linked Qtr. Change Like Qtr. Change Net interest income $2,645 $368 $495 Provision for credit losses 283 84 288 Noninterest income 882 (9) (146) Noninterest expense 1,952 — (33) Segment net income 986 210 53 Balance Sheet ($ B) Average loans(1) $140.3 $6.0 $7.7 Average deposits 249.5 (5.6) 6.2 Other Key Metrics Mortgages serviced for others ($ B)(2) $218.7 $9.2 $20.6 Wealth management AUM ($ B)(2) 173.9 (6.2) (28.8) Branches 2,119 2 (399) (1) Excludes loans held for sale (2) Amount reported reflects end of period balance Represents performance for Retail and Small Business Banking, Wealth, Mortgage Banking, Dealer Retail Services, and Consumer Finance – Net income of $986 million, up $210 million from the prior quarter – Increase in NII primarily driven by higher funding credit on deposits and higher average loan balances, partially offset by decreased loan spreads and lower PAA – Average loans grew 5% vs. 2Q22 and 6% vs. 3Q21 primarily driven by increased residential mortgage balances along with growth in prime auto, Service Finance, LightStream, recreational lending (marine and RV), and Sheffield – Average deposits declined 2% vs. 2Q22 due to tightening monetary policy, increased spending, and seasonality – Provision for credit losses increased sequentially due to higher loan growth and increased net charge offs in the current quarter – Fee income stable vs. 2Q22; YoY decline primarily driven by residential mortgage income – Expenses were stable vs. 2Q22 primarily driven by lower merger-related and restructuring charges offsetting higher operational losses, marketing and personnel expense – MSR increases driven by bulk acquisitions – Wealth management AUM decline primarily due to lower market valuations offset by continued positive net asset flows Metrics Commentary
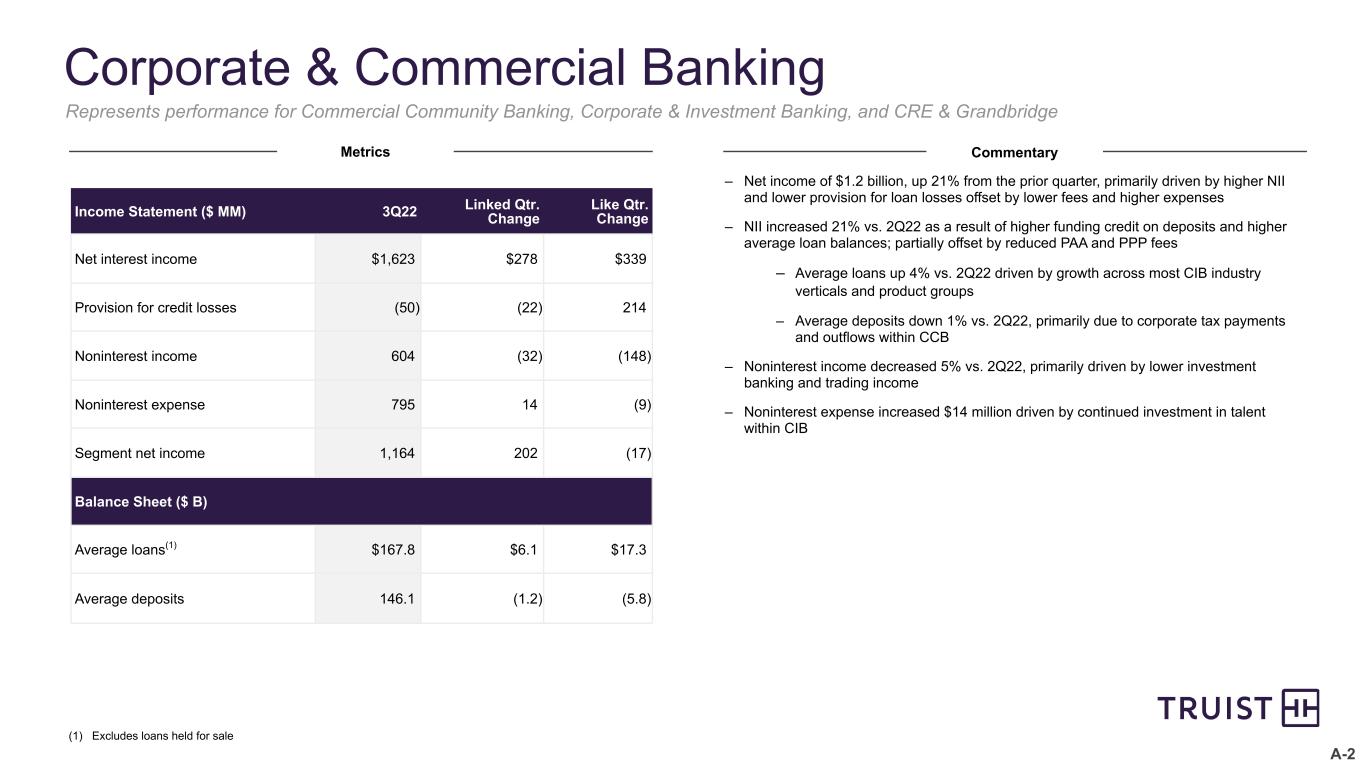
A-2 Corporate & Commercial Banking Income Statement ($ MM) 3Q22 Linked Qtr. Change Like Qtr. Change Net interest income $1,623 $278 $339 Provision for credit losses (50) (22) 214 Noninterest income 604 (32) (148) Noninterest expense 795 14 (9) Segment net income 1,164 202 (17) Balance Sheet ($ B) Average loans(1) $167.8 $6.1 $17.3 Average deposits 146.1 (1.2) (5.8) – Net income of $1.2 billion, up 21% from the prior quarter, primarily driven by higher NII and lower provision for loan losses offset by lower fees and higher expenses – NII increased 21% vs. 2Q22 as a result of higher funding credit on deposits and higher average loan balances; partially offset by reduced PAA and PPP fees – Average loans up 4% vs. 2Q22 driven by growth across most CIB industry verticals and product groups – Average deposits down 1% vs. 2Q22, primarily due to corporate tax payments and outflows within CCB – Noninterest income decreased 5% vs. 2Q22, primarily driven by lower investment banking and trading income – Noninterest expense increased $14 million driven by continued investment in talent within CIB (1) Excludes loans held for sale Represents performance for Commercial Community Banking, Corporate & Investment Banking, and CRE & Grandbridge Metrics Commentary
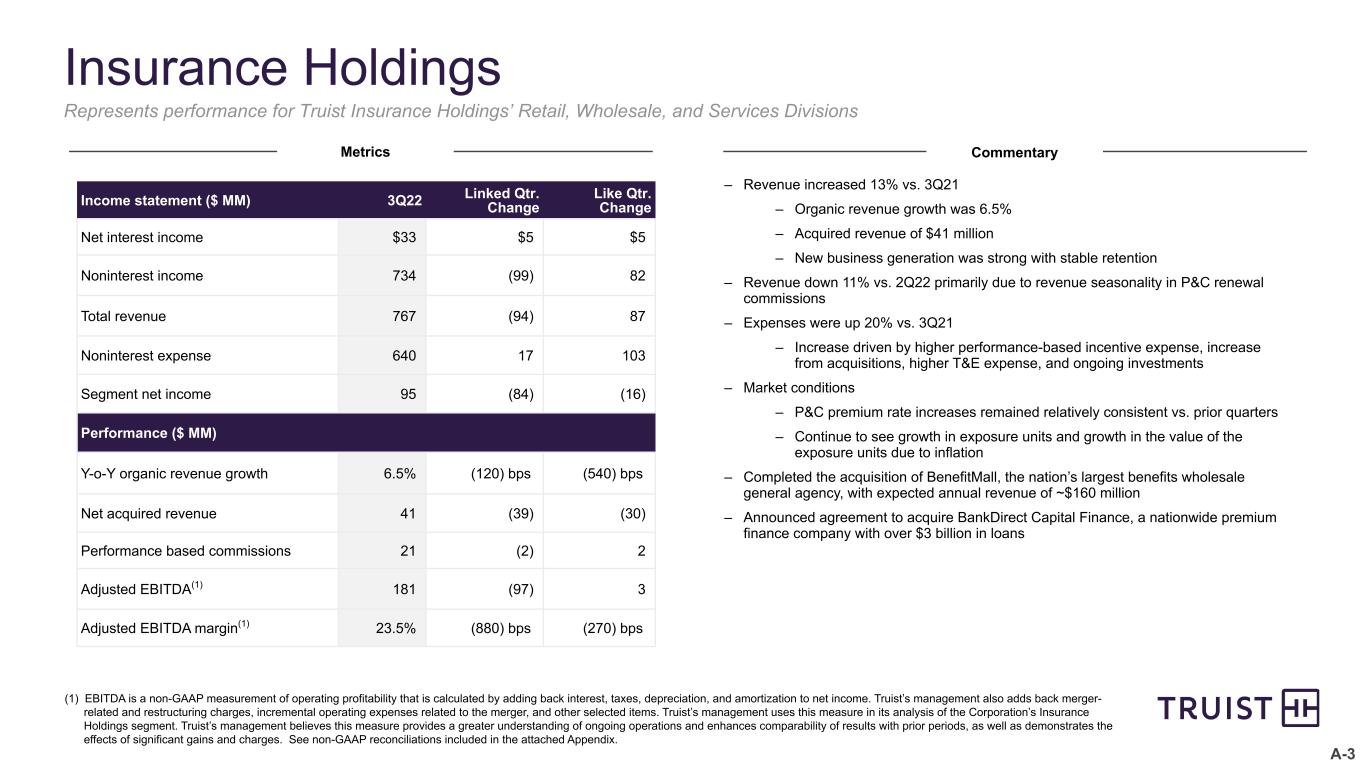
A-3 Insurance Holdings Income statement ($ MM) 3Q22 Linked Qtr. Change Like Qtr. Change Net interest income $33 $5 $5 Noninterest income 734 (99) 82 Total revenue 767 (94) 87 Noninterest expense 640 17 103 Segment net income 95 (84) (16) Performance ($ MM) Y-o-Y organic revenue growth 6.5% (120) bps (540) bps Net acquired revenue 41 (39) (30) Performance based commissions 21 (2) 2 Adjusted EBITDA(1) 181 (97) 3 Adjusted EBITDA margin(1) 23.5% (880) bps (270) bps – Revenue increased 13% vs. 3Q21 – Organic revenue growth was 6.5% – Acquired revenue of $41 million – New business generation was strong with stable retention – Revenue down 11% vs. 2Q22 primarily due to revenue seasonality in P&C renewal commissions – Expenses were up 20% vs. 3Q21 – Increase driven by higher performance-based incentive expense, increase from acquisitions, higher T&E expense, and ongoing investments – Market conditions – P&C premium rate increases remained relatively consistent vs. prior quarters – Continue to see growth in exposure units and growth in the value of the exposure units due to inflation – Completed the acquisition of BenefitMall, the nation’s largest benefits wholesale general agency, with expected annual revenue of ~$160 million – Announced agreement to acquire BankDirect Capital Finance, a nationwide premium finance company with over $3 billion in loans (1) EBITDA is a non-GAAP measurement of operating profitability that is calculated by adding back interest, taxes, depreciation, and amortization to net income. Truist’s management also adds back merger- related and restructuring charges, incremental operating expenses related to the merger, and other selected items. Truist’s management uses this measure in its analysis of the Corporation’s Insurance Holdings segment. Truist’s management believes this measure provides a greater understanding of ongoing operations and enhances comparability of results with prior periods, as well as demonstrates the effects of significant gains and charges. See non-GAAP reconciliations included in the attached Appendix. Represents performance for Truist Insurance Holdings’ Retail, Wholesale, and Services Divisions Metrics Commentary
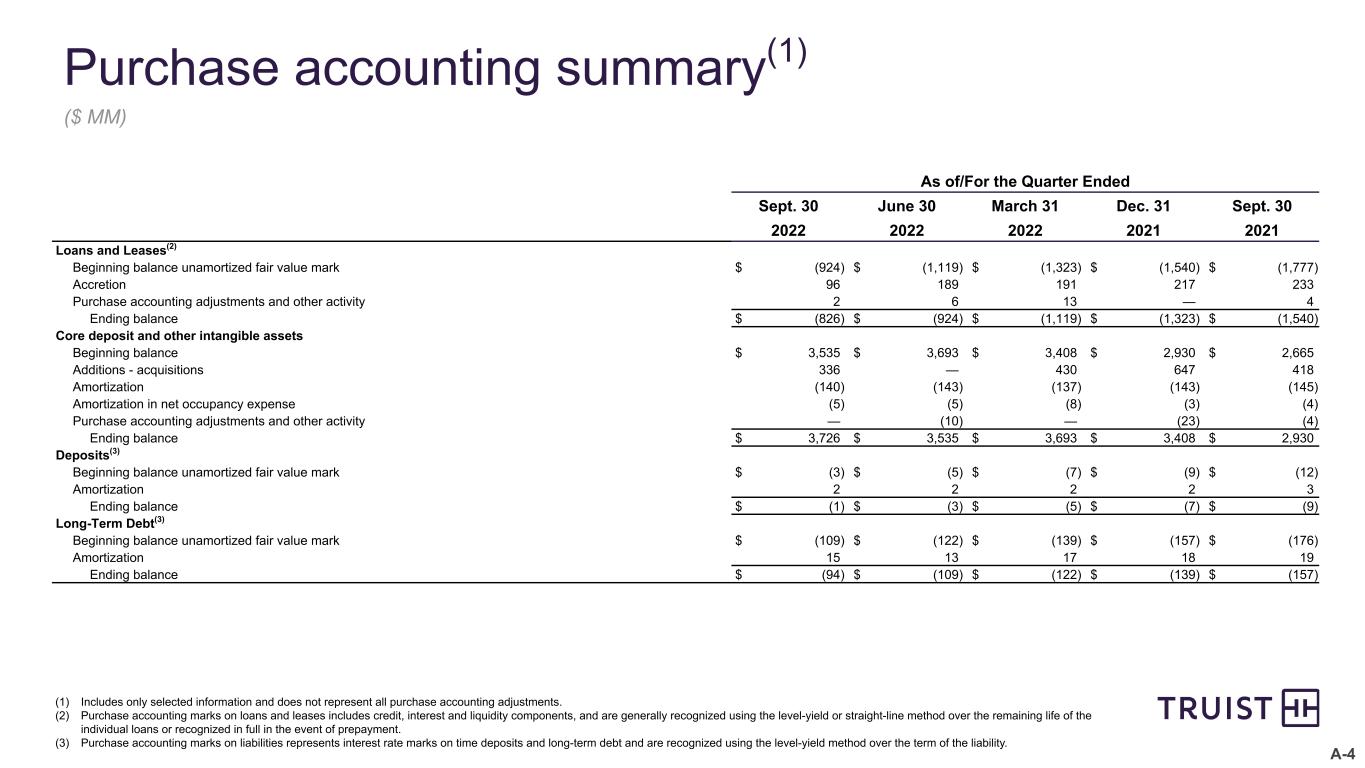
A-4 Purchase accounting summary(1) ($ MM) As of/For the Quarter Ended Sept. 30 June 30 March 31 Dec. 31 Sept. 30 2022 2022 2022 2021 2021 Loans and Leases(2) Beginning balance unamortized fair value mark $ (924) $ (1,119) $ (1,323) $ (1,540) $ (1,777) Accretion 96 189 191 217 233 Purchase accounting adjustments and other activity 2 6 13 — 4 Ending balance $ (826) $ (924) $ (1,119) $ (1,323) $ (1,540) Core deposit and other intangible assets Beginning balance $ 3,535 $ 3,693 $ 3,408 $ 2,930 $ 2,665 Additions - acquisitions 336 — 430 647 418 Amortization (140) (143) (137) (143) (145) Amortization in net occupancy expense (5) (5) (8) (3) (4) Purchase accounting adjustments and other activity — (10) — (23) (4) Ending balance $ 3,726 $ 3,535 $ 3,693 $ 3,408 $ 2,930 Deposits(3) Beginning balance unamortized fair value mark $ (3) $ (5) $ (7) $ (9) $ (12) Amortization 2 2 2 2 3 Ending balance $ (1) $ (3) $ (5) $ (7) $ (9) Long-Term Debt(3) Beginning balance unamortized fair value mark $ (109) $ (122) $ (139) $ (157) $ (176) Amortization 15 13 17 18 19 Ending balance $ (94) $ (109) $ (122) $ (139) $ (157) (1) Includes only selected information and does not represent all purchase accounting adjustments. (2) Purchase accounting marks on loans and leases includes credit, interest and liquidity components, and are generally recognized using the level-yield or straight-line method over the remaining life of the individual loans or recognized in full in the event of prepayment. (3) Purchase accounting marks on liabilities represents interest rate marks on time deposits and long-term debt and are recognized using the level-yield method over the term of the liability.
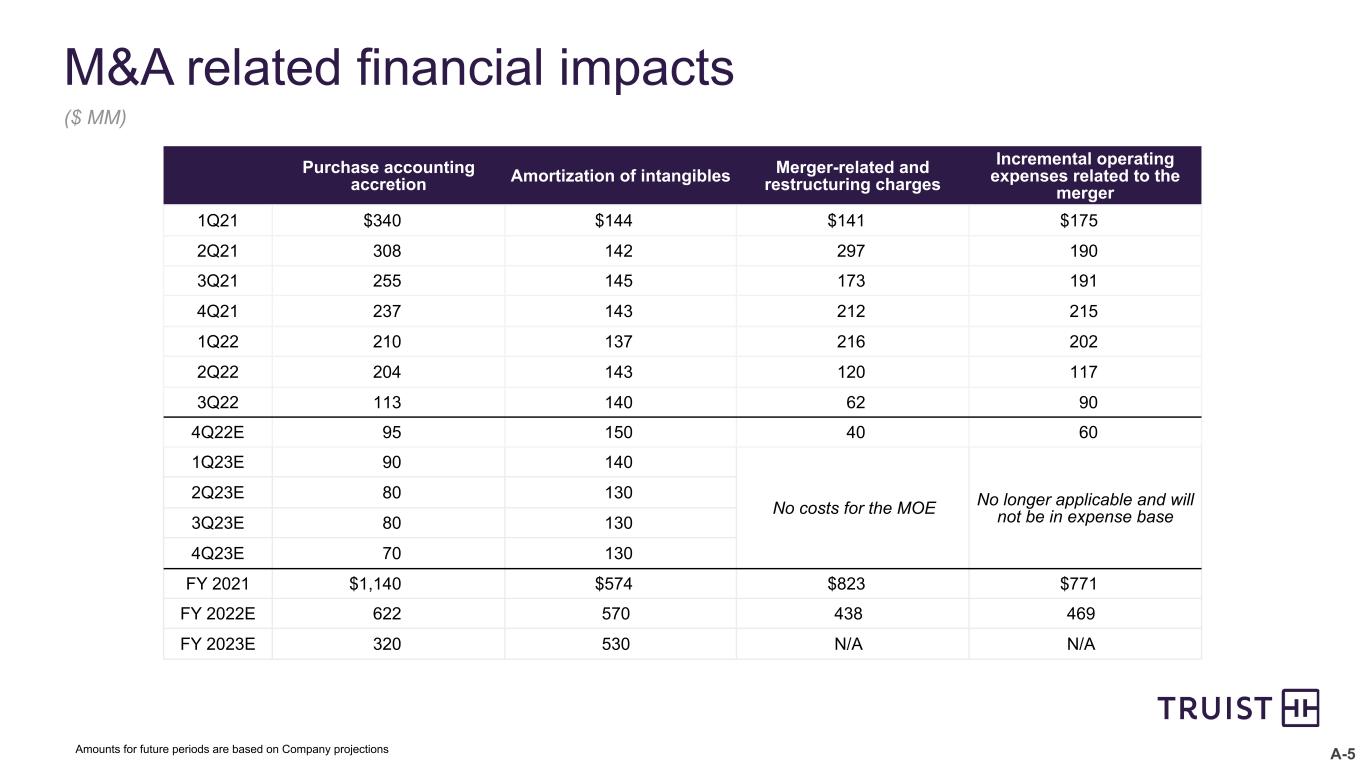
A-5 M&A related financial impacts Purchase accounting accretion Amortization of intangibles Merger-related and restructuring charges Incremental operating expenses related to the merger 1Q21 $340 $144 $141 $175 2Q21 308 142 297 190 3Q21 255 145 173 191 4Q21 237 143 212 215 1Q22 210 137 216 202 2Q22 204 143 120 117 3Q22 113 140 62 90 4Q22E 95 150 40 60 1Q23E 90 140 No costs for the MOE No longer applicable and will not be in expense base 2Q23E 80 130 3Q23E 80 130 4Q23E 70 130 FY 2021 $1,140 $574 $823 $771 FY 2022E 622 570 438 469 FY 2023E 320 530 N/A N/A ($ MM) Amounts for future periods are based on Company projections
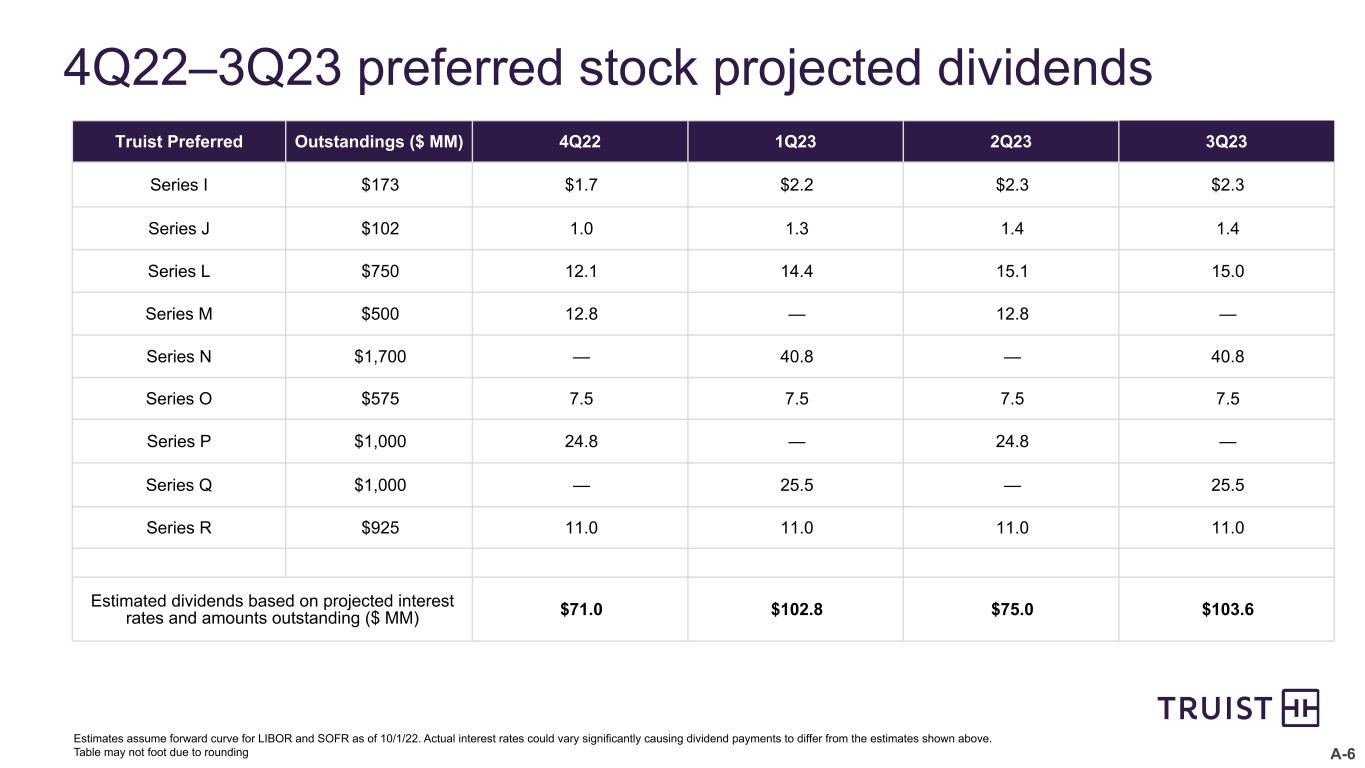
A-6 4Q22–3Q23 preferred stock projected dividends Estimates assume forward curve for LIBOR and SOFR as of 10/1/22. Actual interest rates could vary significantly causing dividend payments to differ from the estimates shown above. Table may not foot due to rounding Truist Preferred Outstandings ($ MM) 4Q22 1Q23 2Q23 3Q23 Series I $173 $1.7 $2.2 $2.3 $2.3 Series J $102 1.0 1.3 1.4 1.4 Series L $750 12.1 14.4 15.1 15.0 Series M $500 12.8 — 12.8 — Series N $1,700 — 40.8 — 40.8 Series O $575 7.5 7.5 7.5 7.5 Series P $1,000 24.8 — 24.8 — Series Q $1,000 — 25.5 — 25.5 Series R $925 11.0 11.0 11.0 11.0 Estimated dividends based on projected interest rates and amounts outstanding ($ MM) $71.0 $102.8 $75.0 $103.6

Non-GAAP Reconciliations
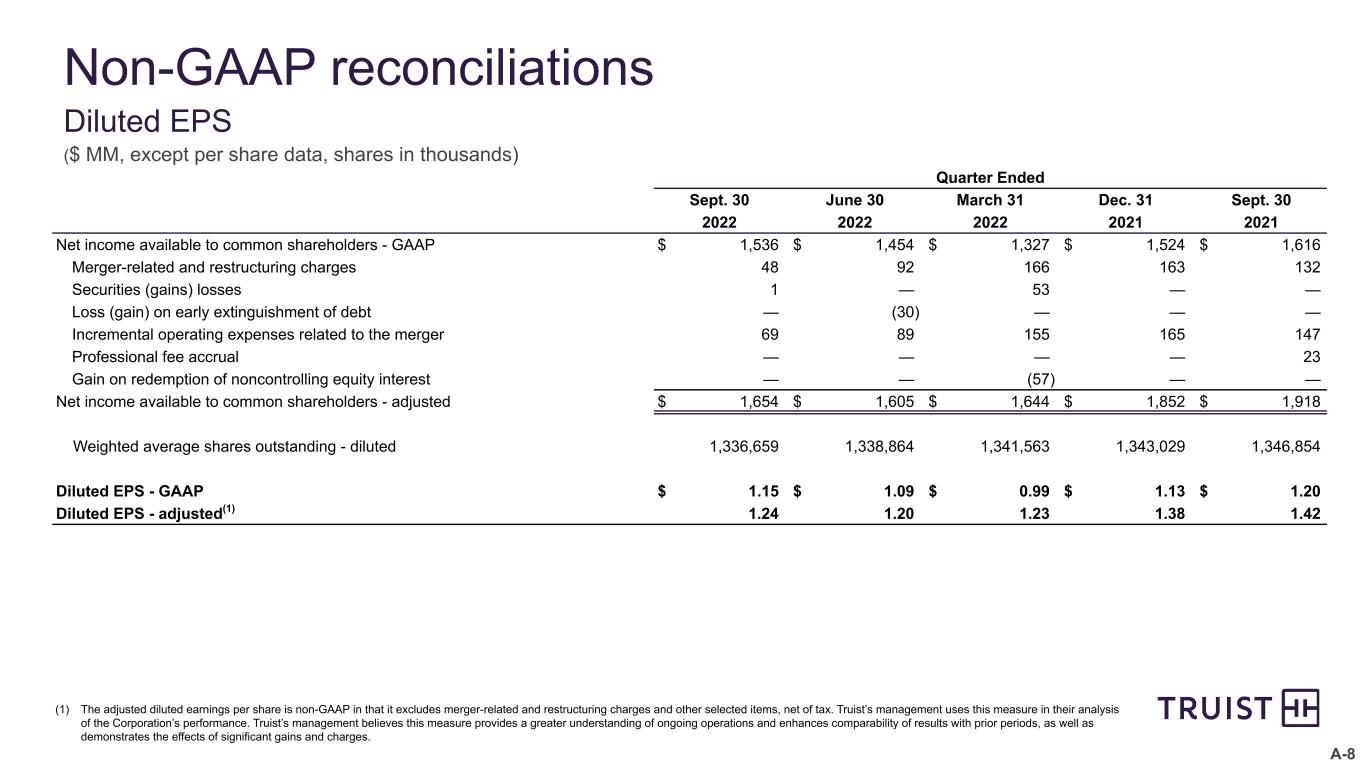
A-8 Quarter Ended Sept. 30 June 30 March 31 Dec. 31 Sept. 30 2022 2022 2022 2021 2021 Net income available to common shareholders - GAAP $ 1,536 $ 1,454 $ 1,327 $ 1,524 $ 1,616 Merger-related and restructuring charges 48 92 166 163 132 Securities (gains) losses 1 — 53 — — Loss (gain) on early extinguishment of debt — (30) — — — Incremental operating expenses related to the merger 69 89 155 165 147 Professional fee accrual — — — — 23 Gain on redemption of noncontrolling equity interest — — (57) — — Net income available to common shareholders - adjusted $ 1,654 $ 1,605 $ 1,644 $ 1,852 $ 1,918 Weighted average shares outstanding - diluted 1,336,659 1,338,864 1,341,563 1,343,029 1,346,854 Diluted EPS - GAAP $ 1.15 $ 1.09 $ 0.99 $ 1.13 $ 1.20 Diluted EPS - adjusted(1) 1.24 1.20 1.23 1.38 1.42 Non-GAAP reconciliations Diluted EPS ($ MM, except per share data, shares in thousands) (1) The adjusted diluted earnings per share is non-GAAP in that it excludes merger-related and restructuring charges and other selected items, net of tax. Truist’s management uses this measure in their analysis of the Corporation’s performance. Truist’s management believes this measure provides a greater understanding of ongoing operations and enhances comparability of results with prior periods, as well as demonstrates the effects of significant gains and charges.
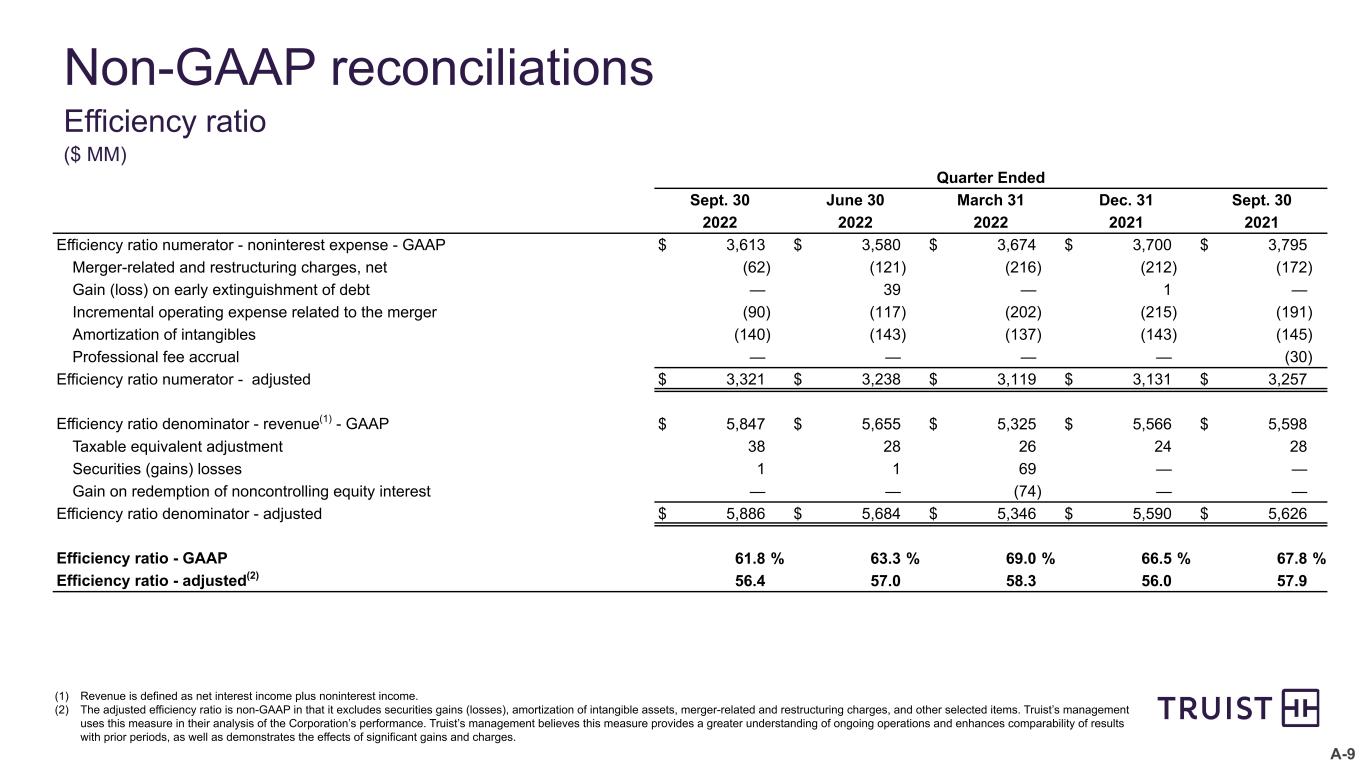
A-9 Non-GAAP reconciliations Efficiency ratio ($ MM) (1) Revenue is defined as net interest income plus noninterest income. (2) The adjusted efficiency ratio is non-GAAP in that it excludes securities gains (losses), amortization of intangible assets, merger-related and restructuring charges, and other selected items. Truist’s management uses this measure in their analysis of the Corporation’s performance. Truist’s management believes this measure provides a greater understanding of ongoing operations and enhances comparability of results with prior periods, as well as demonstrates the effects of significant gains and charges. Quarter Ended Sept. 30 June 30 March 31 Dec. 31 Sept. 30 2022 2022 2022 2021 2021 Efficiency ratio numerator - noninterest expense - GAAP $ 3,613 $ 3,580 $ 3,674 $ 3,700 $ 3,795 Merger-related and restructuring charges, net (62) (121) (216) (212) (172) Gain (loss) on early extinguishment of debt — 39 — 1 — Incremental operating expense related to the merger (90) (117) (202) (215) (191) Amortization of intangibles (140) (143) (137) (143) (145) Professional fee accrual — — — — (30) Efficiency ratio numerator - adjusted $ 3,321 $ 3,238 $ 3,119 $ 3,131 $ 3,257 Efficiency ratio denominator - revenue(1) - GAAP $ 5,847 $ 5,655 $ 5,325 $ 5,566 $ 5,598 Taxable equivalent adjustment 38 28 26 24 28 Securities (gains) losses 1 1 69 — — Gain on redemption of noncontrolling equity interest — — (74) — — Efficiency ratio denominator - adjusted $ 5,886 $ 5,684 $ 5,346 $ 5,590 $ 5,626 Efficiency ratio - GAAP 61.8 % 63.3 % 69.0 % 66.5 % 67.8 % Efficiency ratio - adjusted(2) 56.4 57.0 58.3 56.0 57.9
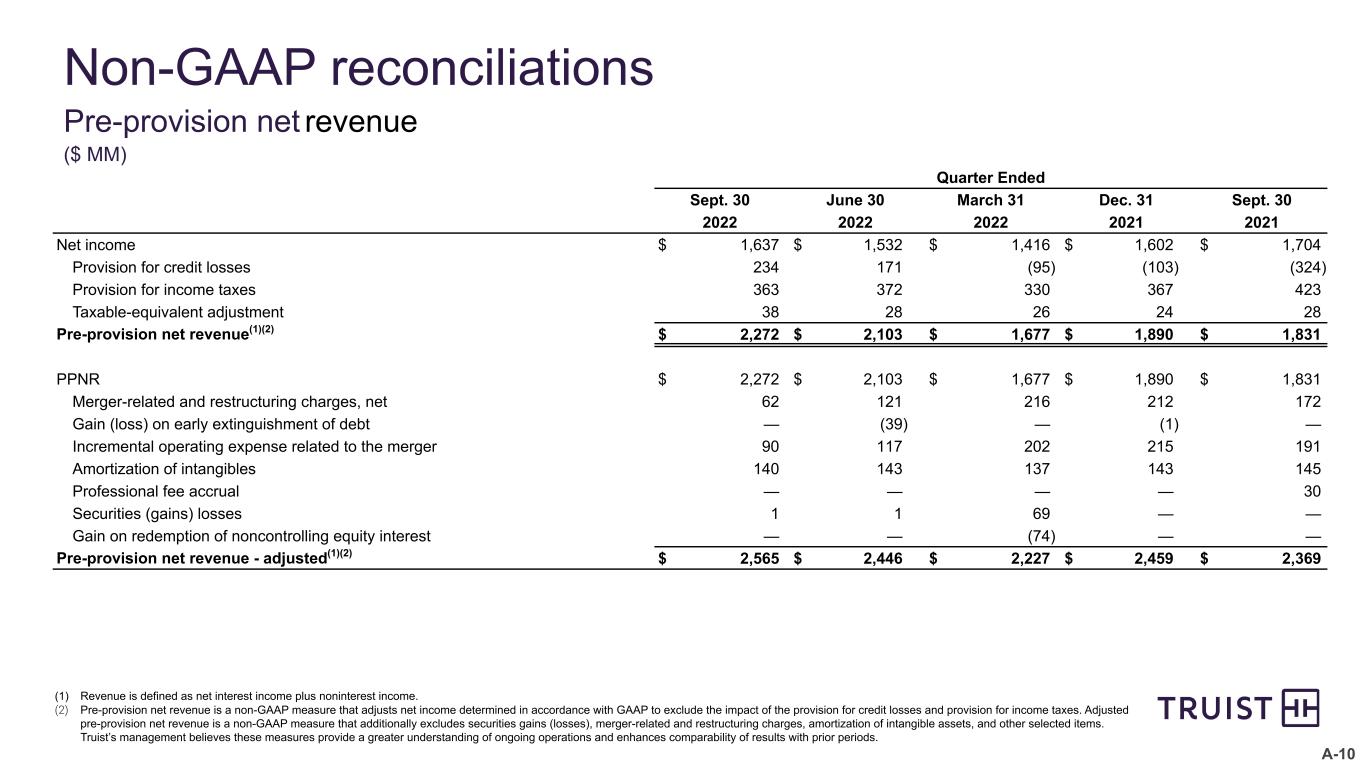
A-10 Non-GAAP reconciliations Pre-provision net revenue ($ MM) (1) Revenue is defined as net interest income plus noninterest income. (2) Pre-provision net revenue is a non-GAAP measure that adjusts net income determined in accordance with GAAP to exclude the impact of the provision for credit losses and provision for income taxes. Adjusted pre-provision net revenue is a non-GAAP measure that additionally excludes securities gains (losses), merger-related and restructuring charges, amortization of intangible assets, and other selected items. Truist’s management believes these measures provide a greater understanding of ongoing operations and enhances comparability of results with prior periods. Quarter Ended Sept. 30 June 30 March 31 Dec. 31 Sept. 30 2022 2022 2022 2021 2021 Net income $ 1,637 $ 1,532 $ 1,416 $ 1,602 $ 1,704 Provision for credit losses 234 171 (95) (103) (324) Provision for income taxes 363 372 330 367 423 Taxable-equivalent adjustment 38 28 26 24 28 Pre-provision net revenue(1)(2) $ 2,272 $ 2,103 $ 1,677 $ 1,890 $ 1,831 PPNR $ 2,272 $ 2,103 $ 1,677 $ 1,890 $ 1,831 Merger-related and restructuring charges, net 62 121 216 212 172 Gain (loss) on early extinguishment of debt — (39) — (1) — Incremental operating expense related to the merger 90 117 202 215 191 Amortization of intangibles 140 143 137 143 145 Professional fee accrual — — — — 30 Securities (gains) losses 1 1 69 — — Gain on redemption of noncontrolling equity interest — — (74) — — Pre-provision net revenue - adjusted(1)(2) $ 2,565 $ 2,446 $ 2,227 $ 2,459 $ 2,369
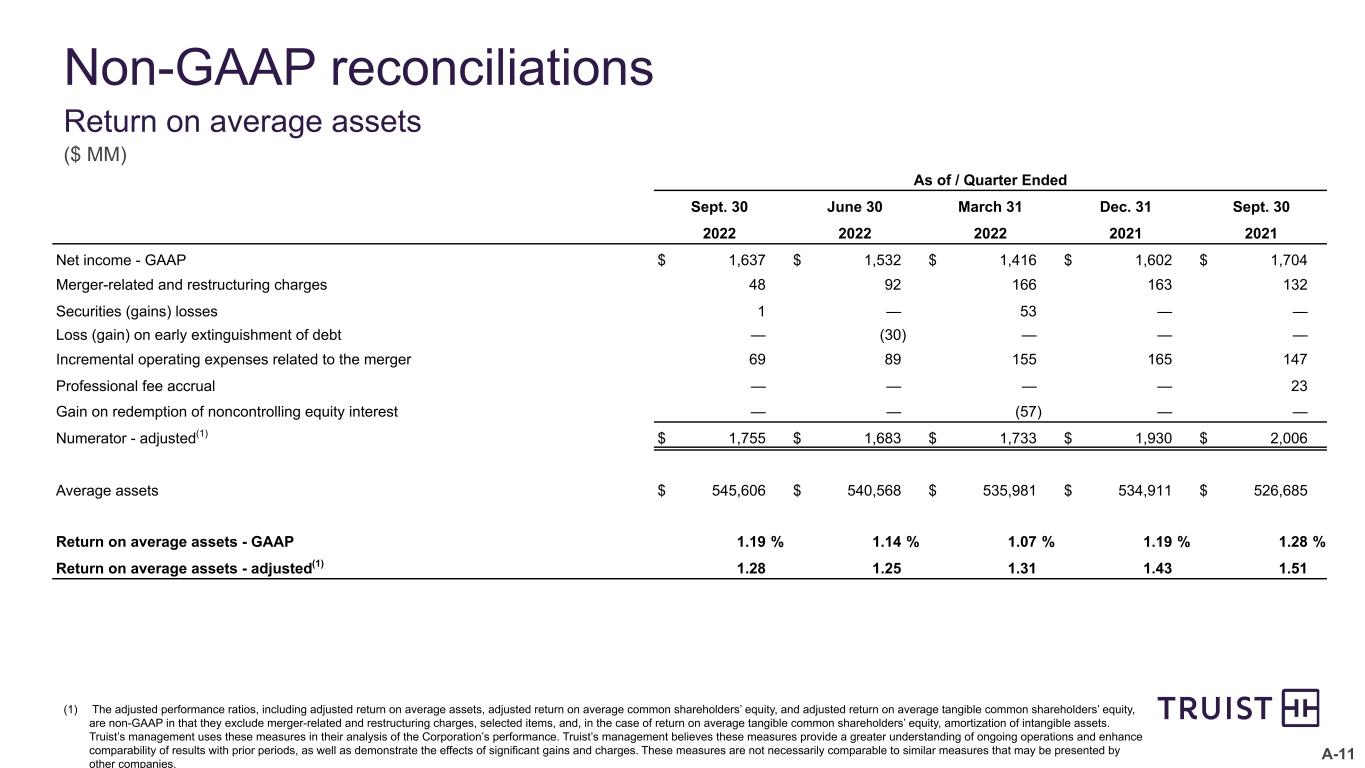
A-11 Non-GAAP reconciliations Return on average assets ($ MM) (1) The adjusted performance ratios, including adjusted return on average assets, adjusted return on average common shareholders’ equity, and adjusted return on average tangible common shareholders’ equity, are non-GAAP in that they exclude merger-related and restructuring charges, selected items, and, in the case of return on average tangible common shareholders’ equity, amortization of intangible assets. Truist’s management uses these measures in their analysis of the Corporation’s performance. Truist’s management believes these measures provide a greater understanding of ongoing operations and enhance comparability of results with prior periods, as well as demonstrate the effects of significant gains and charges. These measures are not necessarily comparable to similar measures that may be presented by other companies. As of / Quarter Ended Sept. 30 June 30 March 31 Dec. 31 Sept. 30 2022 2022 2022 2021 2021 Net income - GAAP $ 1,637 $ 1,532 $ 1,416 $ 1,602 $ 1,704 Merger-related and restructuring charges 48 92 166 163 132 Securities (gains) losses 1 — 53 — — Loss (gain) on early extinguishment of debt — (30) — — — Incremental operating expenses related to the merger 69 89 155 165 147 Professional fee accrual — — — — 23 Gain on redemption of noncontrolling equity interest — — (57) — — Numerator - adjusted(1) $ 1,755 $ 1,683 $ 1,733 $ 1,930 $ 2,006 Average assets $ 545,606 $ 540,568 $ 535,981 $ 534,911 $ 526,685 Return on average assets - GAAP 1.19 % 1.14 % 1.07 % 1.19 % 1.28 % Return on average assets - adjusted(1) 1.28 1.25 1.31 1.43 1.51
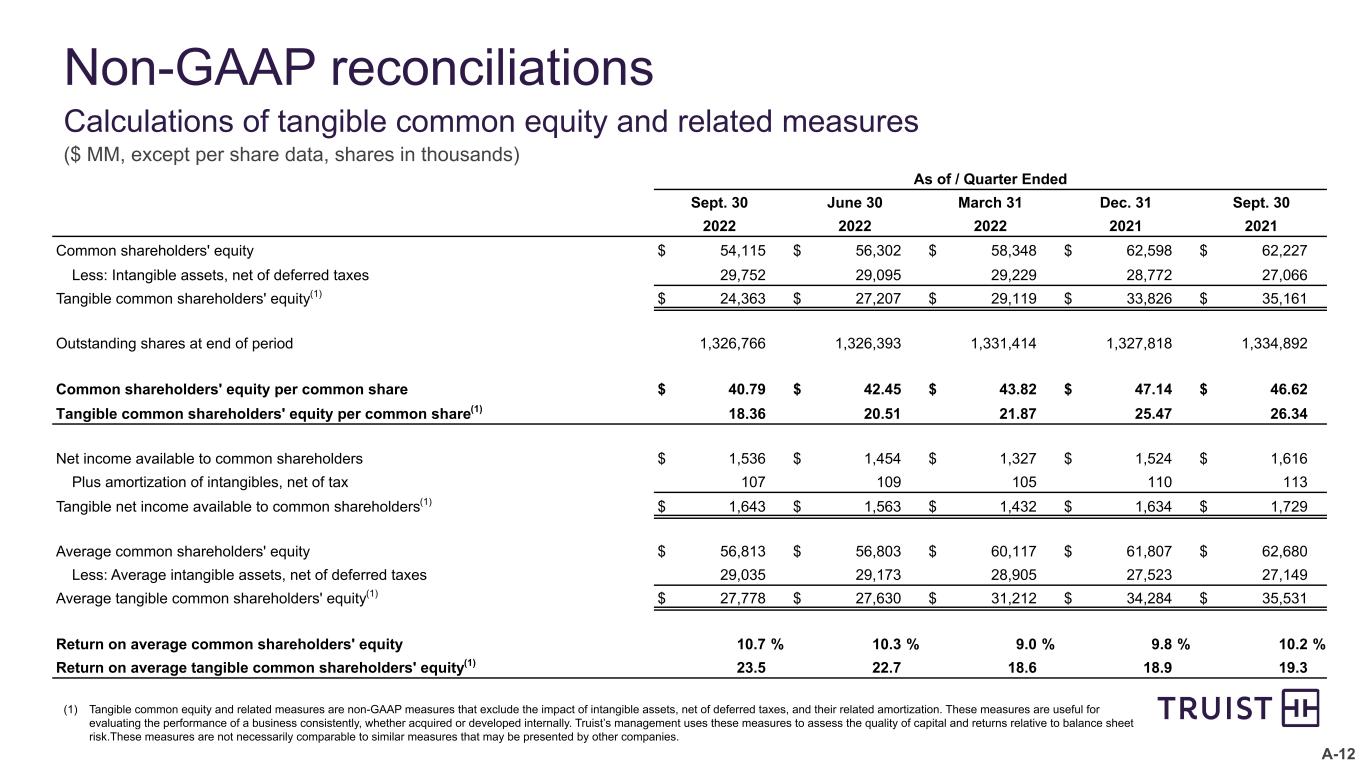
A-12 Non-GAAP reconciliations Calculations of tangible common equity and related measures ($ MM, except per share data, shares in thousands) (1) Tangible common equity and related measures are non-GAAP measures that exclude the impact of intangible assets, net of deferred taxes, and their related amortization. These measures are useful for evaluating the performance of a business consistently, whether acquired or developed internally. Truist’s management uses these measures to assess the quality of capital and returns relative to balance sheet risk.These measures are not necessarily comparable to similar measures that may be presented by other companies. As of / Quarter Ended Sept. 30 June 30 March 31 Dec. 31 Sept. 30 2022 2022 2022 2021 2021 Common shareholders' equity $ 54,115 $ 56,302 $ 58,348 $ 62,598 $ 62,227 Less: Intangible assets, net of deferred taxes 29,752 29,095 29,229 28,772 27,066 Tangible common shareholders' equity(1) $ 24,363 $ 27,207 $ 29,119 $ 33,826 $ 35,161 Outstanding shares at end of period 1,326,766 1,326,393 1,331,414 1,327,818 1,334,892 Common shareholders' equity per common share $ 40.79 $ 42.45 $ 43.82 $ 47.14 $ 46.62 Tangible common shareholders' equity per common share(1) 18.36 20.51 21.87 25.47 26.34 Net income available to common shareholders $ 1,536 $ 1,454 $ 1,327 $ 1,524 $ 1,616 Plus amortization of intangibles, net of tax 107 109 105 110 113 Tangible net income available to common shareholders(1) $ 1,643 $ 1,563 $ 1,432 $ 1,634 $ 1,729 Average common shareholders' equity $ 56,813 $ 56,803 $ 60,117 $ 61,807 $ 62,680 Less: Average intangible assets, net of deferred taxes 29,035 29,173 28,905 27,523 27,149 Average tangible common shareholders' equity(1) $ 27,778 $ 27,630 $ 31,212 $ 34,284 $ 35,531 Return on average common shareholders' equity 10.7 % 10.3 % 9.0 % 9.8 % 10.2 % Return on average tangible common shareholders' equity(1) 23.5 22.7 18.6 18.9 19.3
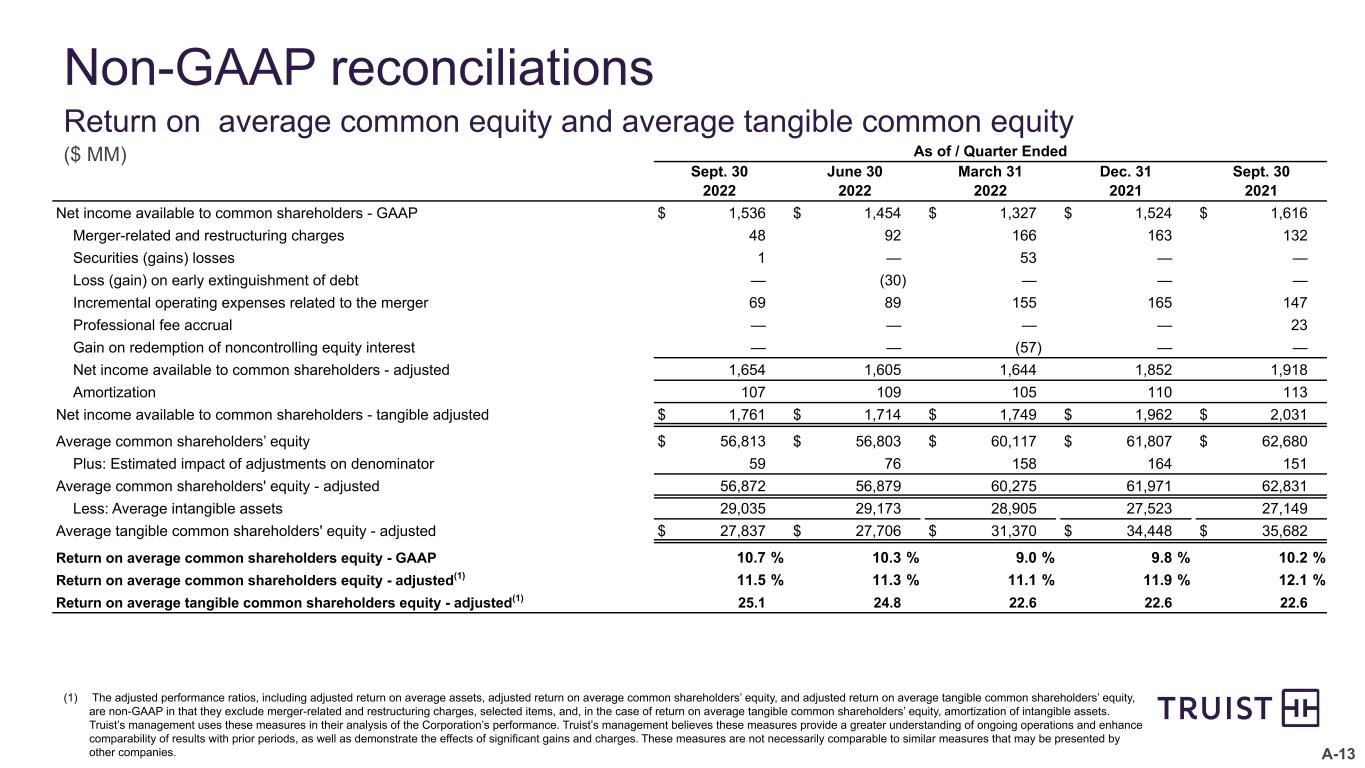
A-13 Non-GAAP reconciliations Return on average common equity and average tangible common equity ($ MM) As of / Quarter Ended Sept. 30 June 30 March 31 Dec. 31 Sept. 30 2022 2022 2022 2021 2021 Net income available to common shareholders - GAAP $ 1,536 $ 1,454 $ 1,327 $ 1,524 $ 1,616 Merger-related and restructuring charges 48 92 166 163 132 Securities (gains) losses 1 — 53 — — Loss (gain) on early extinguishment of debt — (30) — — — Incremental operating expenses related to the merger 69 89 155 165 147 Professional fee accrual — — — — 23 Gain on redemption of noncontrolling equity interest — — (57) — — Net income available to common shareholders - adjusted 1,654 1,605 1,644 1,852 1,918 Amortization 107 109 105 110 113 Net income available to common shareholders - tangible adjusted $ 1,761 $ 1,714 $ 1,749 $ 1,962 $ 2,031 Average common shareholders’ equity $ 56,813 $ 56,803 $ 60,117 $ 61,807 $ 62,680 Plus: Estimated impact of adjustments on denominator 59 76 158 164 151 Average common shareholders' equity - adjusted 56,872 56,879 60,275 61,971 62,831 Less: Average intangible assets 29,035 29,173 28,905 27,523 27,149 Average tangible common shareholders' equity - adjusted $ 27,837 $ 27,706 $ 31,370 $ 34,448 $ 35,682 Return on average common shareholders equity - GAAP 10.7 % 10.3 % 9.0 % 9.8 % 10.2 % Return on average common shareholders equity - adjusted(1) 11.5 % 11.3 % 11.1 % 11.9 % 12.1 % Return on average tangible common shareholders equity - adjusted(1) 25.1 24.8 22.6 22.6 22.6 (1) The adjusted performance ratios, including adjusted return on average assets, adjusted return on average common shareholders’ equity, and adjusted return on average tangible common shareholders’ equity, are non-GAAP in that they exclude merger-related and restructuring charges, selected items, and, in the case of return on average tangible common shareholders’ equity, amortization of intangible assets. Truist’s management uses these measures in their analysis of the Corporation’s performance. Truist’s management believes these measures provide a greater understanding of ongoing operations and enhance comparability of results with prior periods, as well as demonstrate the effects of significant gains and charges. These measures are not necessarily comparable to similar measures that may be presented by other companies.
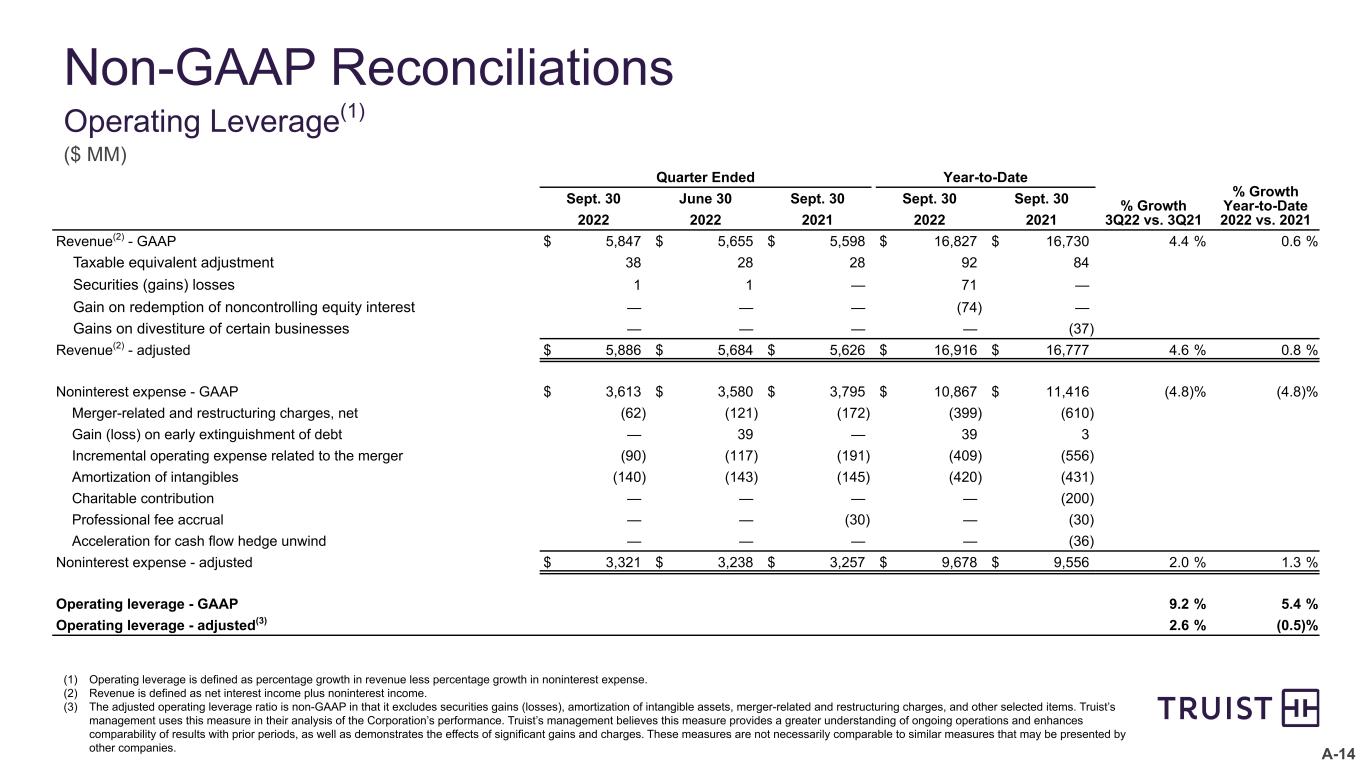
A-14 Non-GAAP Reconciliations Operating Leverage(1) ($ MM) Quarter Ended Year-to-Date % Growth 3Q22 vs. 3Q21 % Growth Year-to-Date 2022 vs. 2021 Sept. 30 June 30 Sept. 30 Sept. 30 Sept. 30 2022 2022 2021 2022 2021 Revenue(2) - GAAP $ 5,847 $ 5,655 $ 5,598 $ 16,827 $ 16,730 4.4 % 0.6 % Taxable equivalent adjustment 38 28 28 92 84 Securities (gains) losses 1 1 — 71 — Gain on redemption of noncontrolling equity interest — — — (74) — Gains on divestiture of certain businesses — — — — (37) Revenue(2) - adjusted $ 5,886 $ 5,684 $ 5,626 $ 16,916 $ 16,777 4.6 % 0.8 % Noninterest expense - GAAP $ 3,613 $ 3,580 $ 3,795 $ 10,867 $ 11,416 (4.8) % (4.8) % Merger-related and restructuring charges, net (62) (121) (172) (399) (610) Gain (loss) on early extinguishment of debt — 39 — 39 3 Incremental operating expense related to the merger (90) (117) (191) (409) (556) Amortization of intangibles (140) (143) (145) (420) (431) Charitable contribution — — — — (200) Professional fee accrual — — (30) — (30) Acceleration for cash flow hedge unwind — — — — (36) Noninterest expense - adjusted $ 3,321 $ 3,238 $ 3,257 $ 9,678 $ 9,556 2.0 % 1.3 % Operating leverage - GAAP 9.2 % 5.4 % Operating leverage - adjusted(3) 2.6 % (0.5) % (1) Operating leverage is defined as percentage growth in revenue less percentage growth in noninterest expense. (2) Revenue is defined as net interest income plus noninterest income. (3) The adjusted operating leverage ratio is non-GAAP in that it excludes securities gains (losses), amortization of intangible assets, merger-related and restructuring charges, and other selected items. Truist’s management uses this measure in their analysis of the Corporation’s performance. Truist’s management believes this measure provides a greater understanding of ongoing operations and enhances comparability of results with prior periods, as well as demonstrates the effects of significant gains and charges. These measures are not necessarily comparable to similar measures that may be presented by other companies.
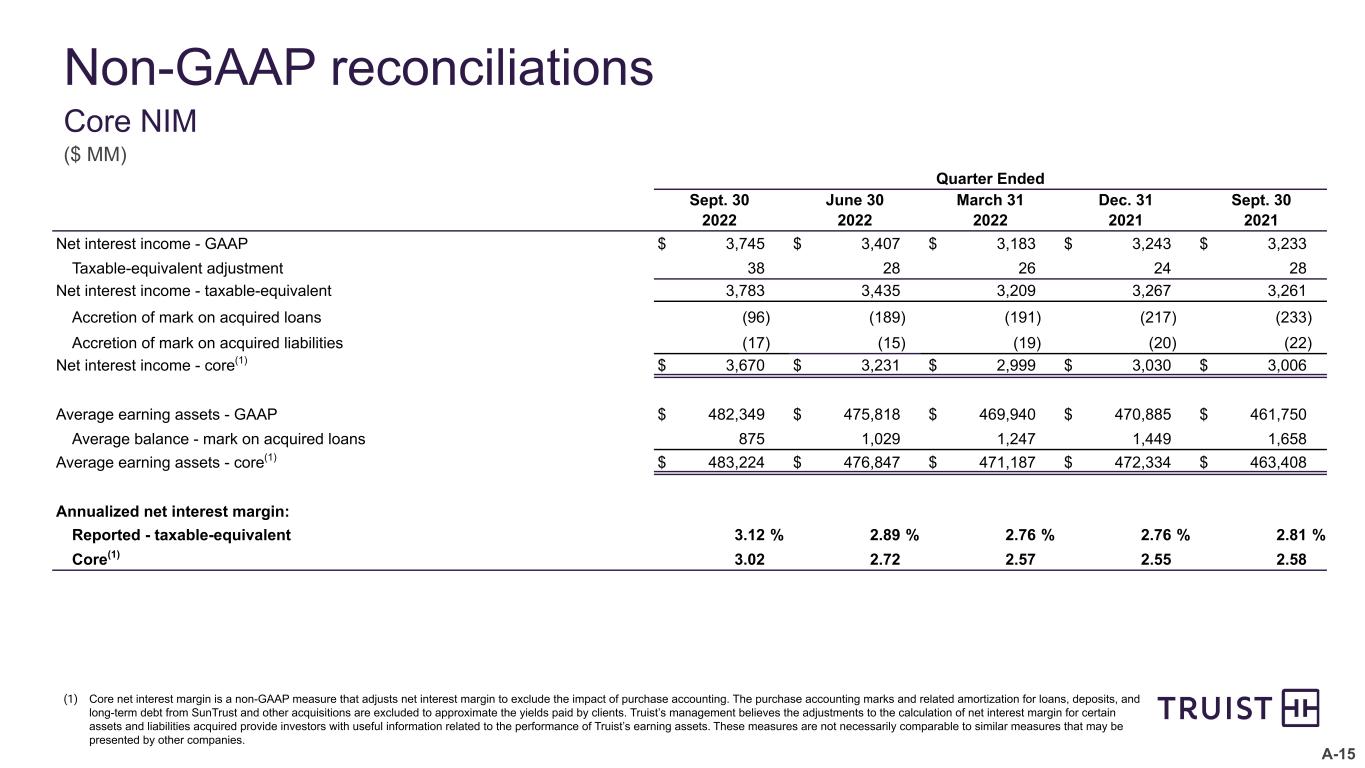
A-15 Quarter Ended Sept. 30 June 30 March 31 Dec. 31 Sept. 30 2022 2022 2022 2021 2021 Net interest income - GAAP $ 3,745 $ 3,407 $ 3,183 $ 3,243 $ 3,233 Taxable-equivalent adjustment 38 28 26 24 28 Net interest income - taxable-equivalent 3,783 3,435 3,209 3,267 3,261 Accretion of mark on acquired loans (96) (189) (191) (217) (233) Accretion of mark on acquired liabilities (17) (15) (19) (20) (22) Net interest income - core(1) $ 3,670 $ 3,231 $ 2,999 $ 3,030 $ 3,006 Average earning assets - GAAP $ 482,349 $ 475,818 $ 469,940 $ 470,885 $ 461,750 Average balance - mark on acquired loans 875 1,029 1,247 1,449 1,658 Average earning assets - core(1) $ 483,224 $ 476,847 $ 471,187 $ 472,334 $ 463,408 Annualized net interest margin: Reported - taxable-equivalent 3.12 % 2.89 % 2.76 % 2.76 % 2.81 % Core(1) 3.02 2.72 2.57 2.55 2.58 Non-GAAP reconciliations Core NIM ($ MM) (1) Core net interest margin is a non-GAAP measure that adjusts net interest margin to exclude the impact of purchase accounting. The purchase accounting marks and related amortization for loans, deposits, and long-term debt from SunTrust and other acquisitions are excluded to approximate the yields paid by clients. Truist’s management believes the adjustments to the calculation of net interest margin for certain assets and liabilities acquired provide investors with useful information related to the performance of Truist’s earning assets. These measures are not necessarily comparable to similar measures that may be presented by other companies.
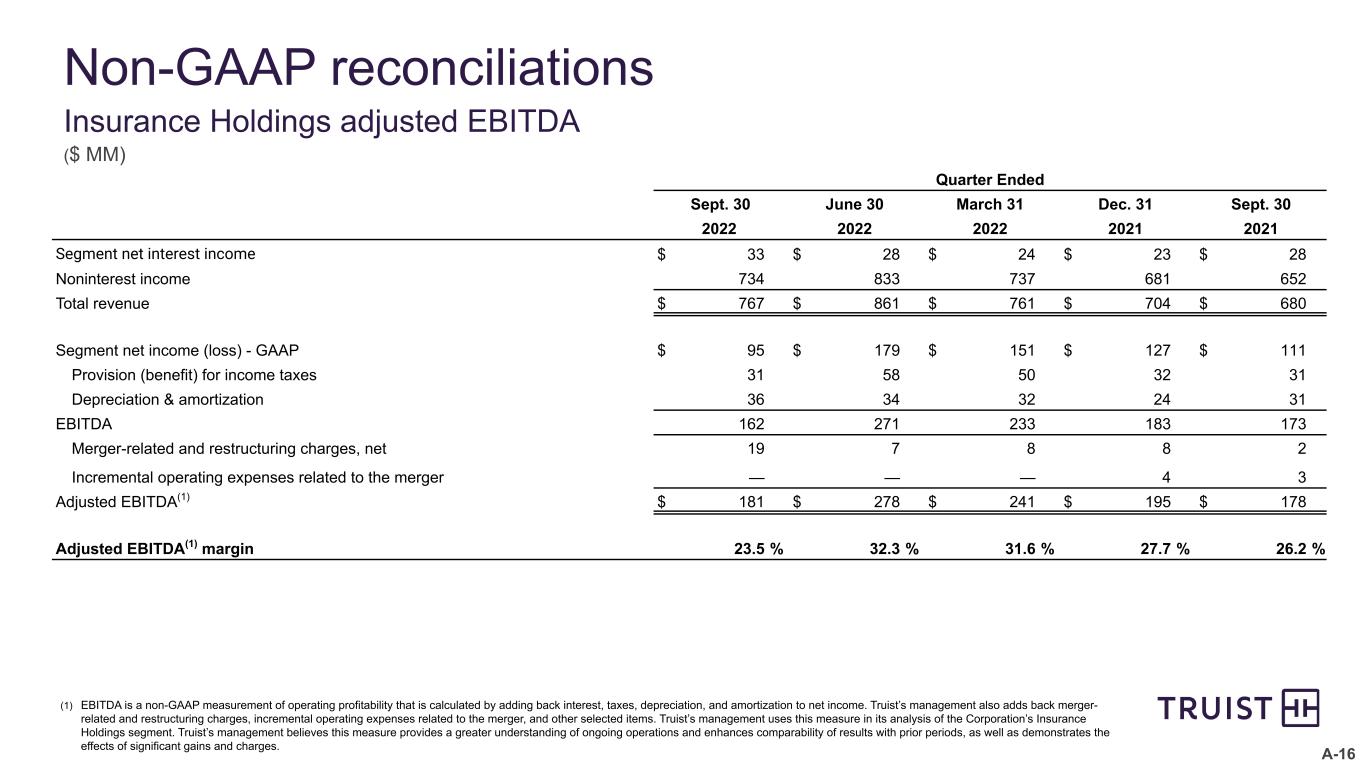
A-16 Non-GAAP reconciliations Insurance Holdings adjusted EBITDA ($ MM) (1) EBITDA is a non-GAAP measurement of operating profitability that is calculated by adding back interest, taxes, depreciation, and amortization to net income. Truist’s management also adds back merger- related and restructuring charges, incremental operating expenses related to the merger, and other selected items. Truist’s management uses this measure in its analysis of the Corporation’s Insurance Holdings segment. Truist’s management believes this measure provides a greater understanding of ongoing operations and enhances comparability of results with prior periods, as well as demonstrates the effects of significant gains and charges. Quarter Ended Sept. 30 June 30 March 31 Dec. 31 Sept. 30 2022 2022 2022 2021 2021 Segment net interest income $ 33 $ 28 $ 24 $ 23 $ 28 Noninterest income 734 833 737 681 652 Total revenue $ 767 $ 861 $ 761 $ 704 $ 680 Segment net income (loss) - GAAP $ 95 $ 179 $ 151 $ 127 $ 111 Provision (benefit) for income taxes 31 58 50 32 31 Depreciation & amortization 36 34 32 24 31 EBITDA 162 271 233 183 173 Merger-related and restructuring charges, net 19 7 8 8 2 Incremental operating expenses related to the merger — — — 4 3 Adjusted EBITDA(1) $ 181 $ 278 $ 241 $ 195 $ 178 Adjusted EBITDA(1) margin 23.5 % 32.3 % 31.6 % 27.7 % 26.2 %

To inspire and build better lives and communities