Operator
And good day, and welcome to CTO Realty Growth, Inc.'s Fourth Quarter and Full Year 2024 Earnings Call. At this time, all participants are in a listen-only mode. After the speakers' presentation, there will be a question and answer session. Instructions will be given at that time. As a reminder, this call may be recorded. I would now like to turn the call over to Phil Mays, CFO. Please go ahead.
Speaker 1
Thank you. I would like to remind everyone that many of our comments today are considered forward-looking statements under federal securities laws. The company's actual future results may differ significantly from the matters discussed in these forward-looking statements, and we undertake no duty to update these statements. Factors and risks that could cause actual results to differ materially from expectations are disclosed from time to time in greater detail in the company's Form 10-K, Form 10-Q, and other SEC filings. Today's call will include certain non-GAAP financial measures. For reconciliation of these non-GAAP measures, you should also refer to our earnings release and SEC filings. You can find our SEC filings, supplemental, and most recent investor presentation on our website at ctoreit.com. With that, I will turn the call over to John.
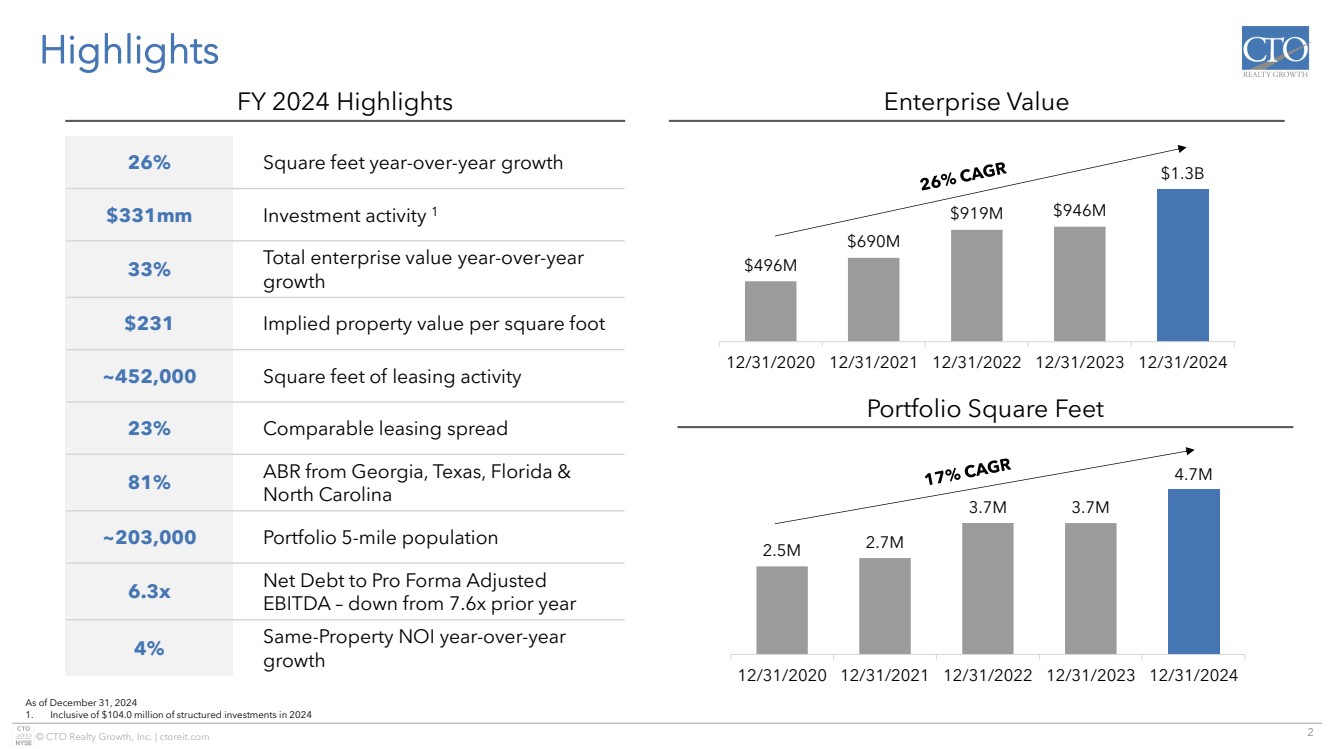
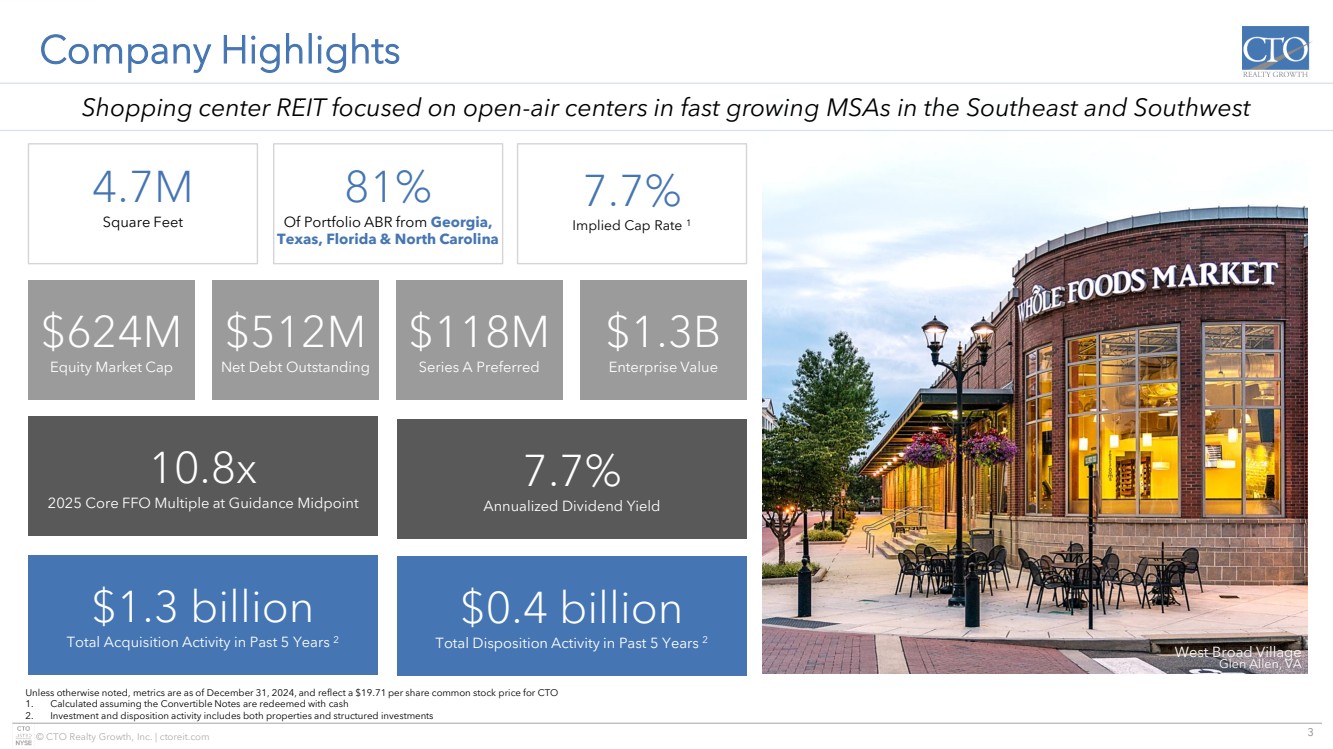
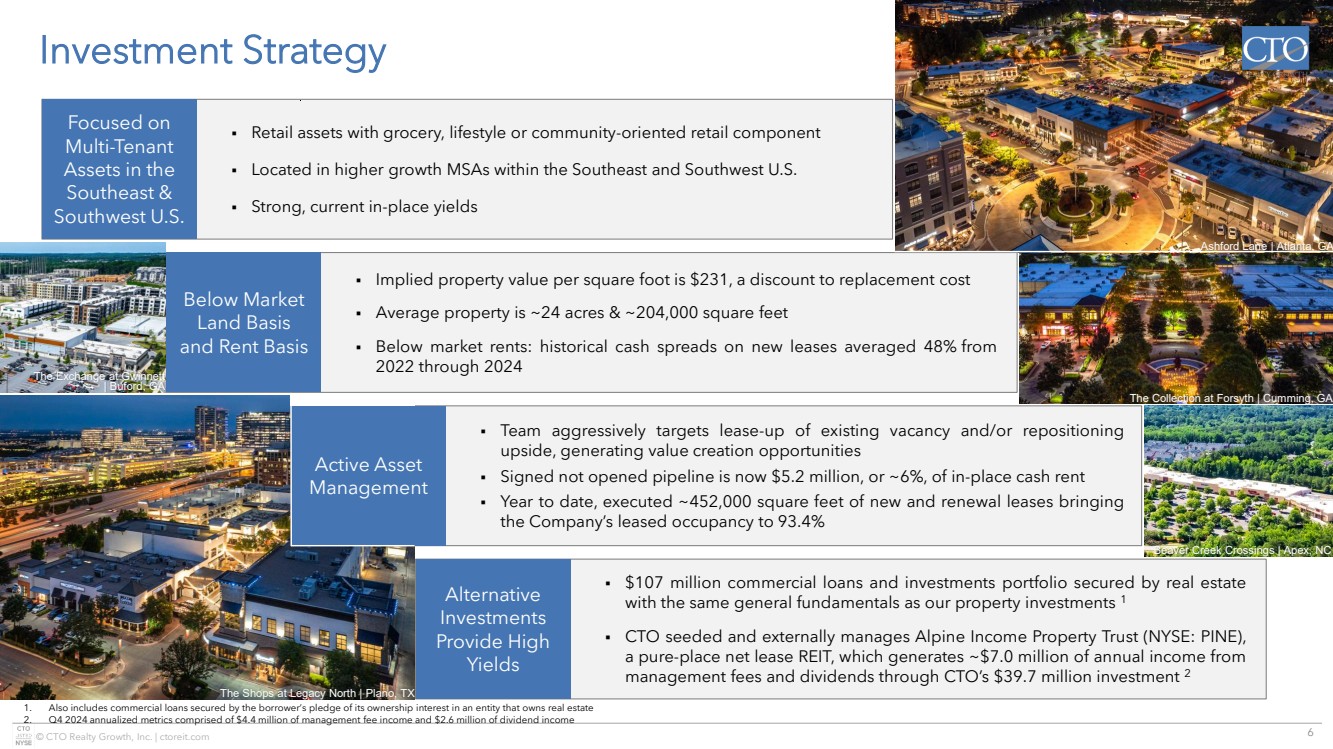
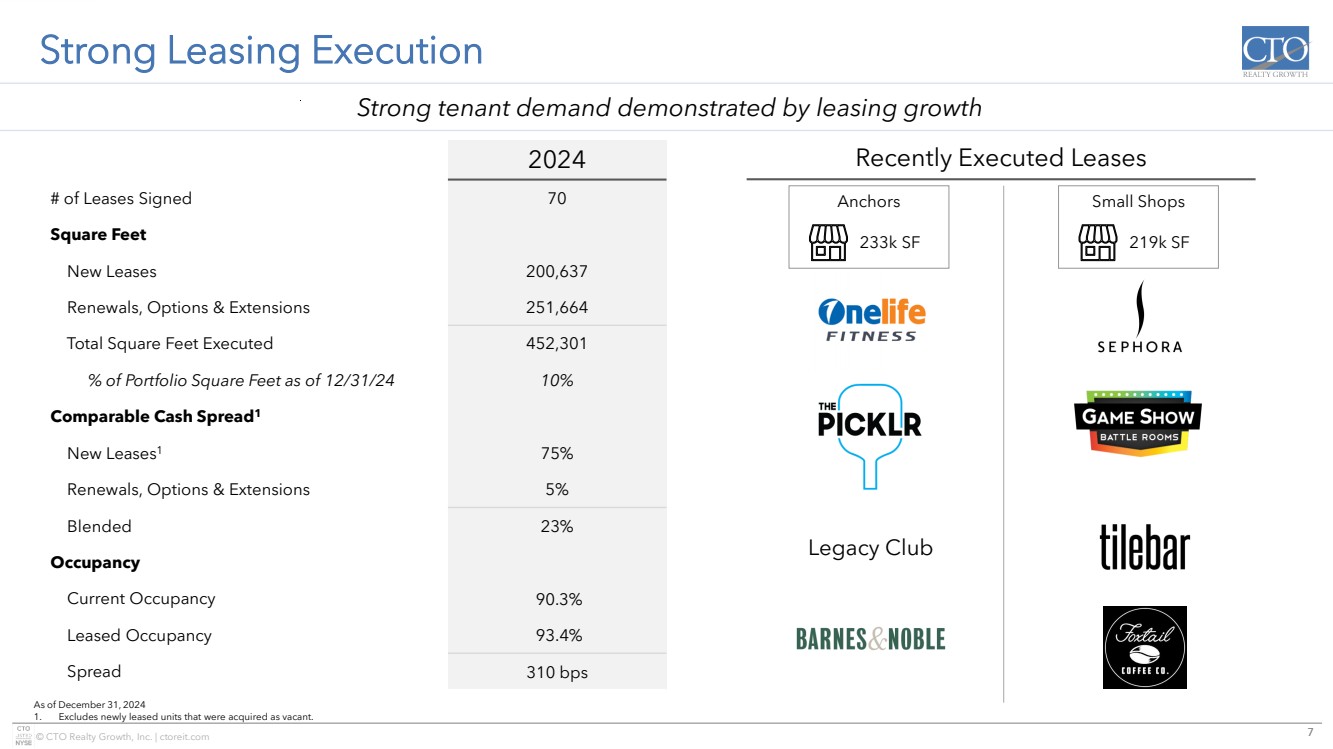
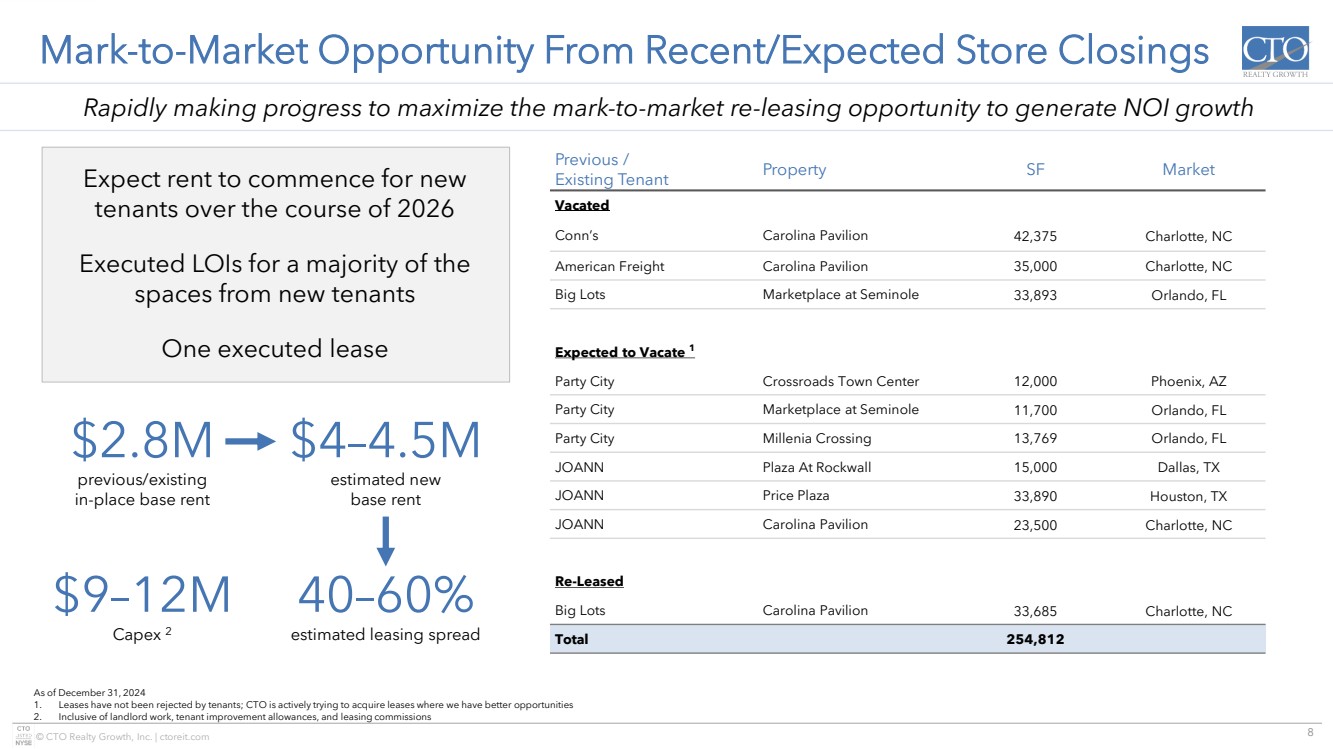
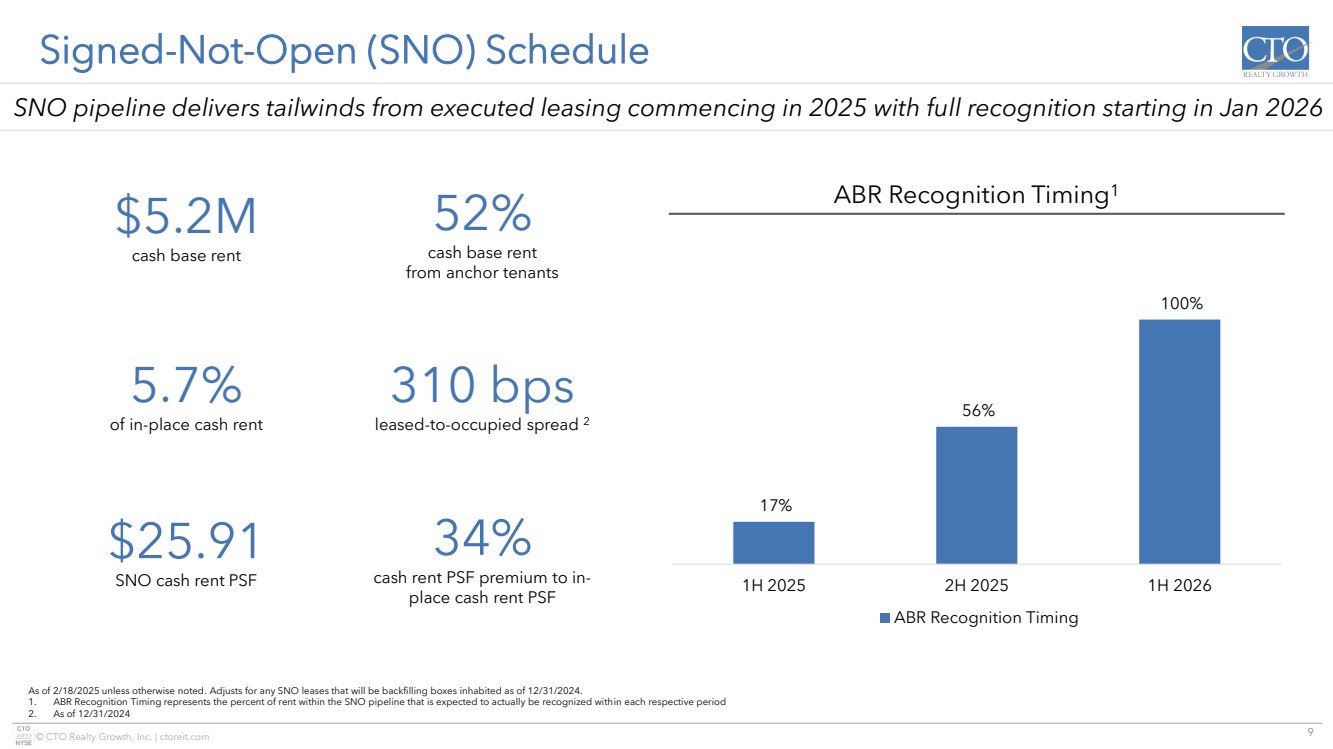
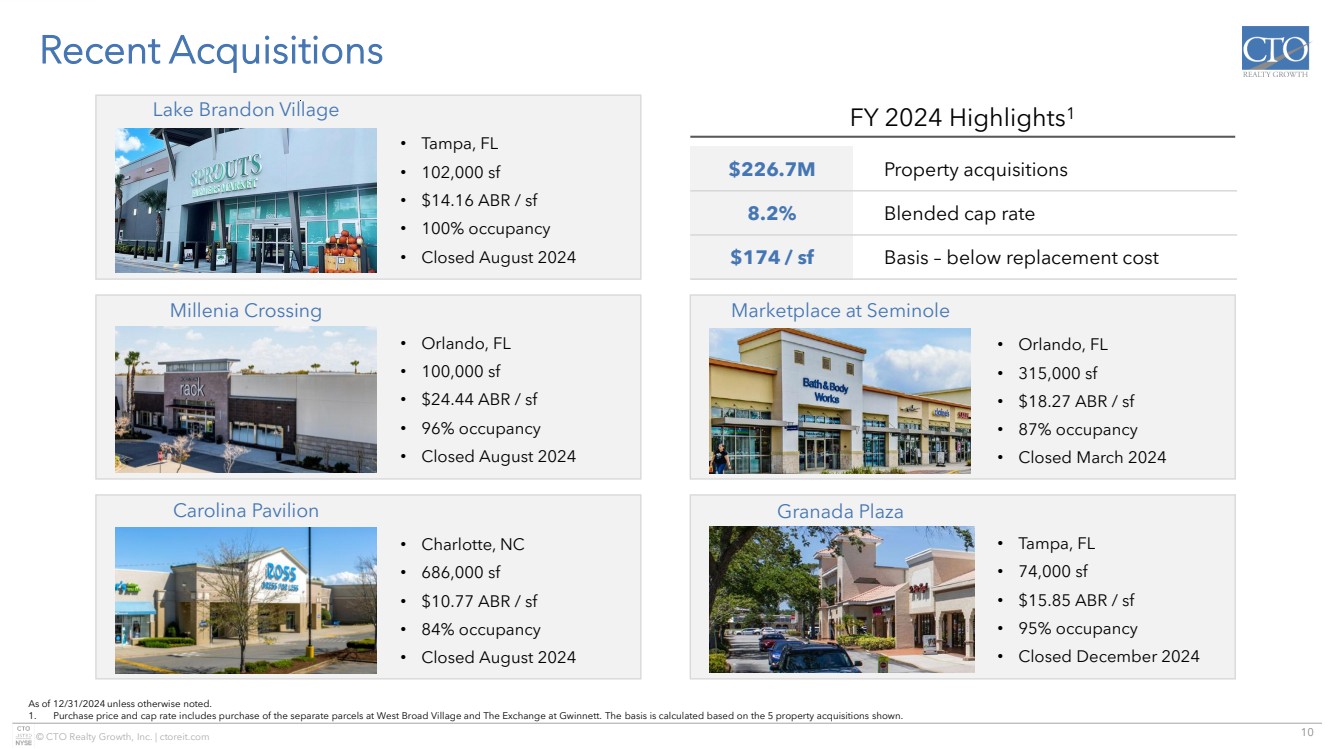
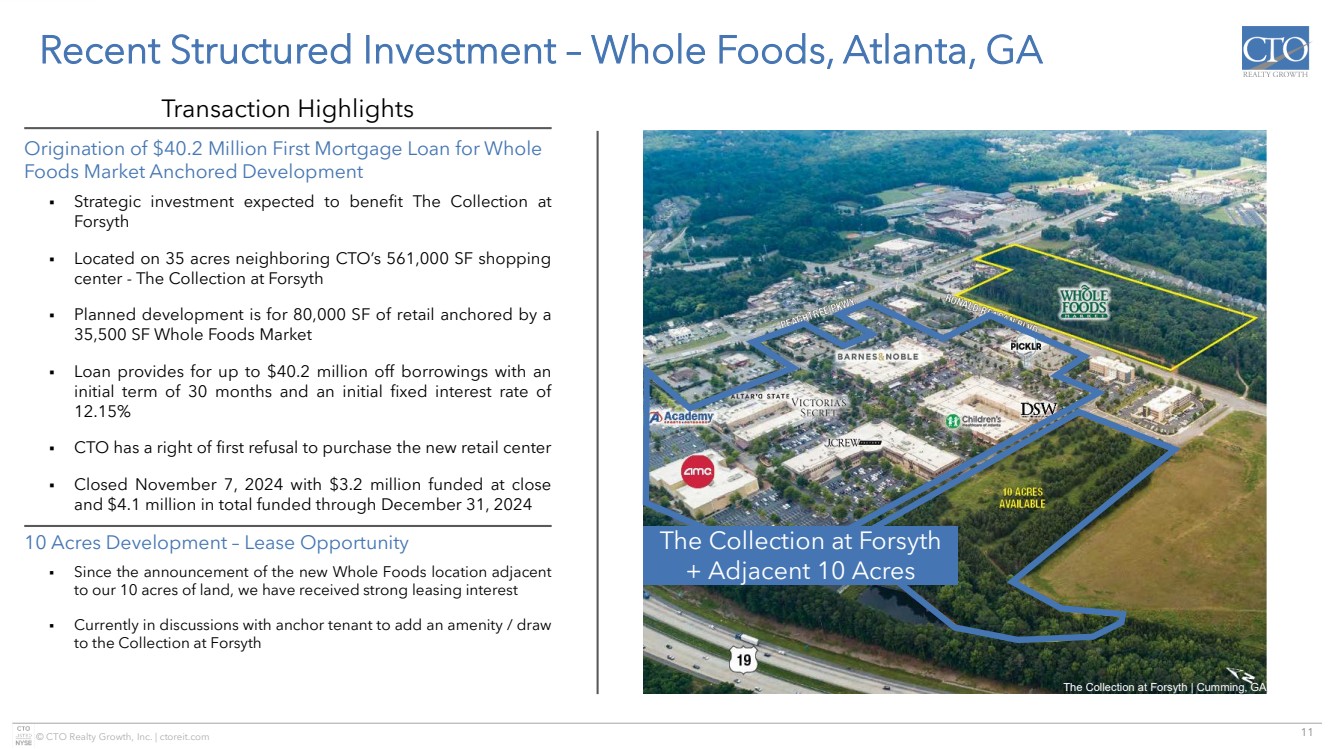
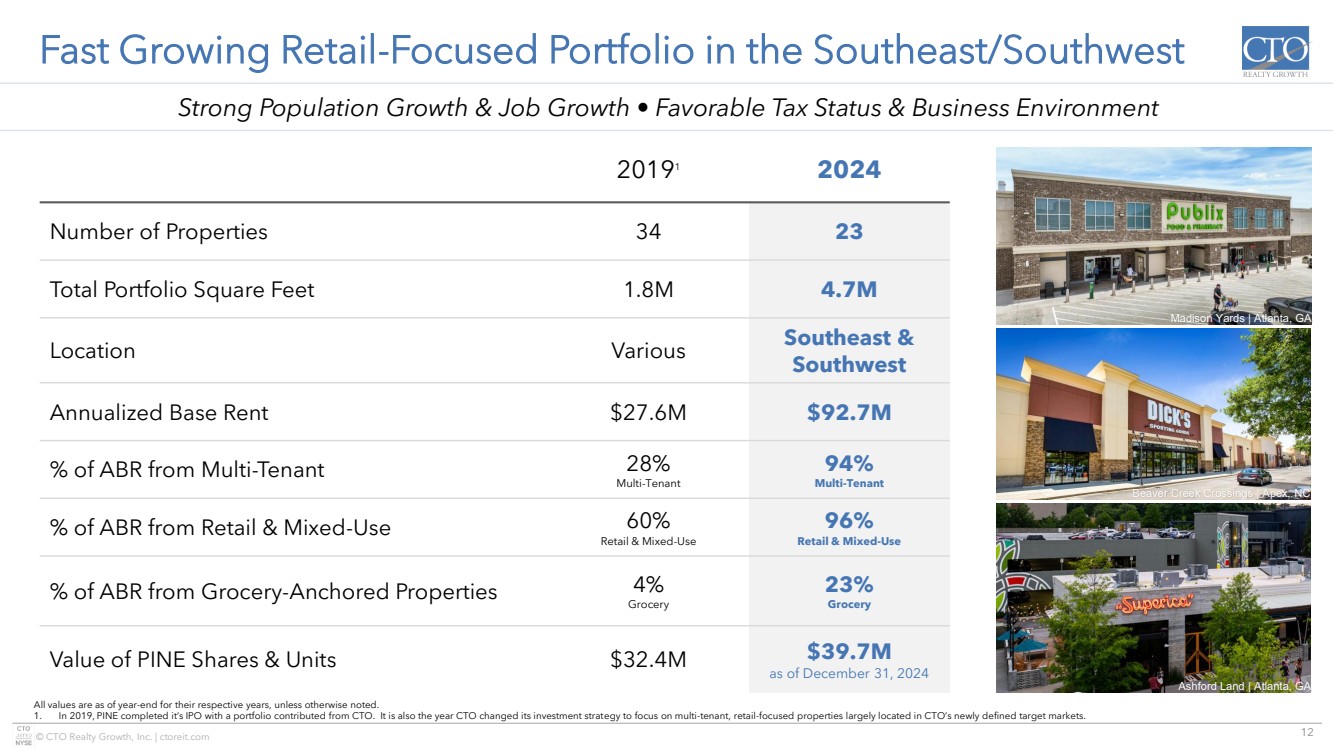
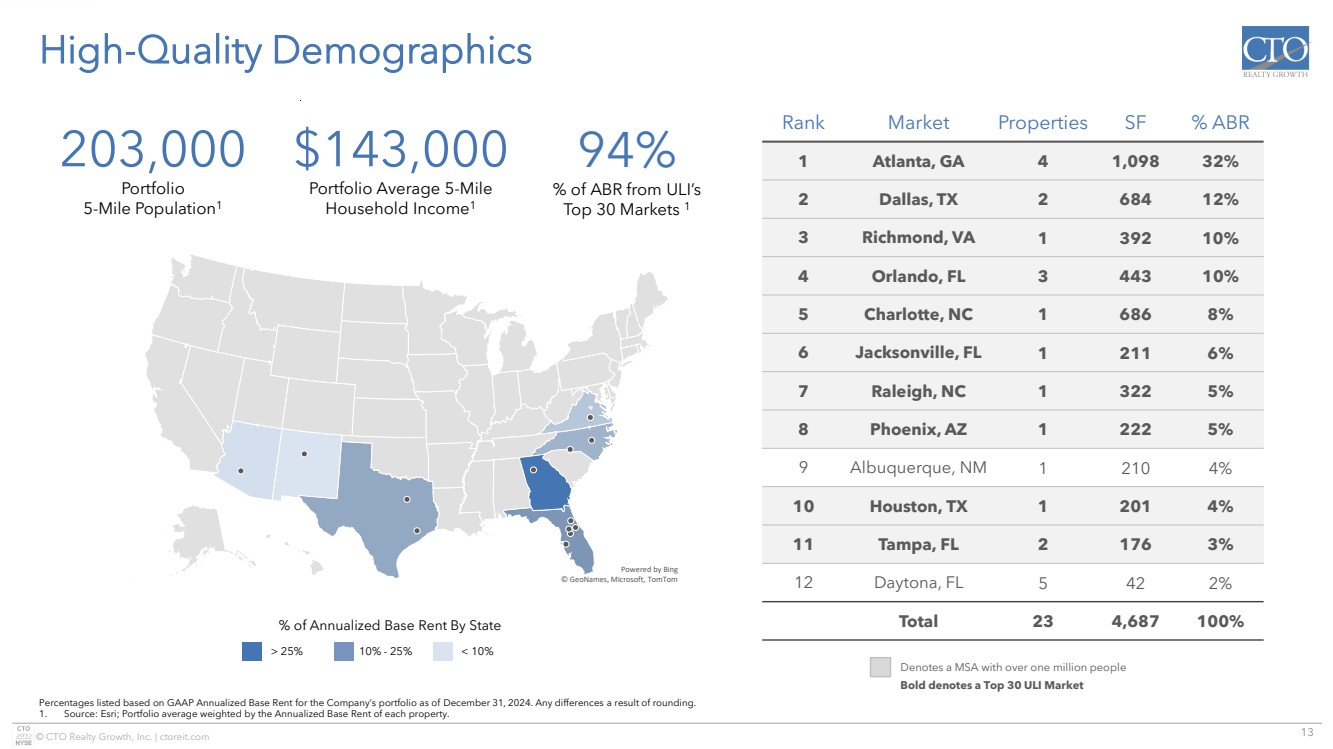
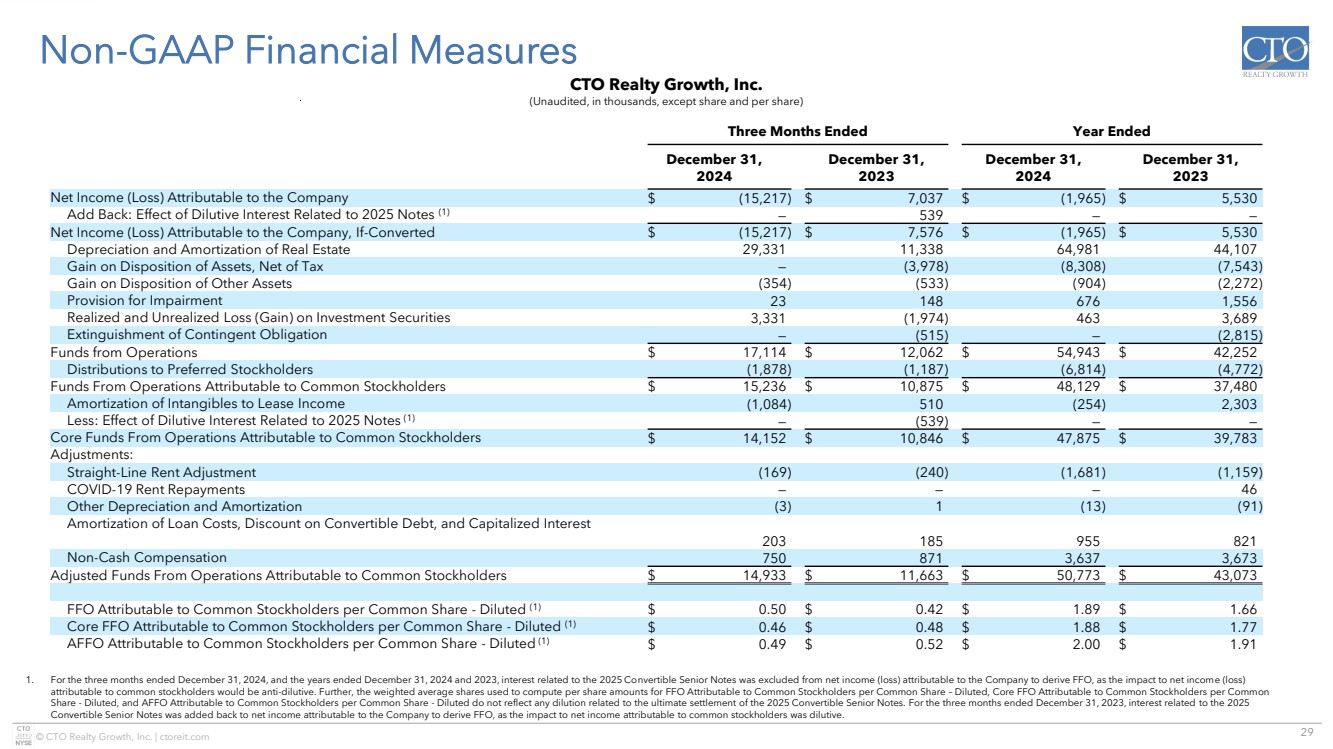
Thanks, Phil. 2024 was a year of significant accomplishments towards the execution of our strategic business plan. Our robust performance was driven by investment volume; raising, we reported core FFO of $1.88 per share for the year. A record high per CTO and growth of 6% from 2023. Beginning with investment activity, in 2024, we achieved a weighted average yield of 9.3% consisting of $227 million of retail property acquisitions located in our target markets of the Southeast and Southwest and $104 million of structured investment. These amounts include two investments closed in the fourth quarter. In November, we originated a $40 million first mortgage loan for the development of an 80,000 square foot retail center anchored by Whole Foods Market, located in Atlanta. The loan has an initial term of 30 months with an initial fixed interest rate of 12.15%. Additionally, this development neighbors our shopping center known as the Collection at Forsyth, and we have the right of first refusal to purchase it. In December, we acquired Granada Plaza for $17 million, expanding our presence in the Tampa market. Granada Plaza is a 74,000 square foot shopping center anchored by a high-performing Publix and is in a densely populated and growing retail market in the Tampa metro area. Our investment activity over the full year of 2024 increased our portfolio by one million square feet or 26% to 4.7 million square feet. Significantly, we were able to complete our first investment in the Charlotte, North Carolina market while further expanding our presence in both Orlando and Tampa. With our growth in 2024, I want to note that our total enterprise value rose by 33% to approximately $1.3 billion, and we ended the year with significantly reduced leverage and over $200 million of liquidity. Now transitioning to leasing. During the fourth quarter, we signed 68,000 square feet of new leases, renewals, and extensions, bringing full-year leasing activity to more than 450,000 square feet at an average rent of $24.07 per square foot. On a comparable lease basis, we signed 152,000 square feet for the full year 2024 at a positive cash lease spread of 23% and an average rent of $23.36 per square foot. We believe that our strong comparable leasing spreads are a further indication of the strong tenant demand for our high-quality properties within our strategic markets. Significantly, our signed not open leasing pipeline represents almost 6% of in-place cash rents. The rent commencement associated with this pipeline will be weighted toward the second half of 2025. Accordingly, we expect to recognize just over 50% of it in 2025, and for 2026, we will receive the full benefit of it. Moving to recently announced retailer bankruptcies, given that all of our impacted leases were for spaces with meaningfully below-market rents and embedded value, we have been proactive in working to quickly regain them. Late in the fourth quarter, we successfully worked through the court process and regained four spaces that were occupied by two Big Lots, one Conn's, and an American Freight. Furthermore, we are now working on agreements to get possession of our three Party City spaces and three Jo-Ann spaces early in 2025. Notably, we already have LOIs or are negotiating leases with tenants for the majority of these spaces. We believe this is a testament to our favorable markets and locations which drive tenant demand. Based on current lease negotiations, we currently estimate that potential releasing spreads for these spaces could be between 40% and 60%. We are making rapid progress on leases with new tenants. It simply takes time for tenants to obtain permits, complete their build-out, and open. Accordingly, we expect rent from new tenants to commence during 2026. We are also in negotiation with several anchor tenants for our ten acres of undeveloped land adjacent to our shopping center in the Collection at Forsyth. We are targeting to have this property contribute to earnings by late 2026. The leasing opportunity for this property, combined with the re-leasing opportunities related to the recent retailer bankruptcies and our signed not open pipeline, should provide strong tailwinds for 2026 earnings growth. As we look ahead, our acquisition pipeline is robust, and we currently anticipate closing one or two acquisitions in the near term. We are excited about these opportunities and our ability to continue our portfolio growth with high-quality investments and attractive yields in 2025. We look forward to providing more information to you soon. And with that, I will now hand the call back over to Phil.
Speaker 1
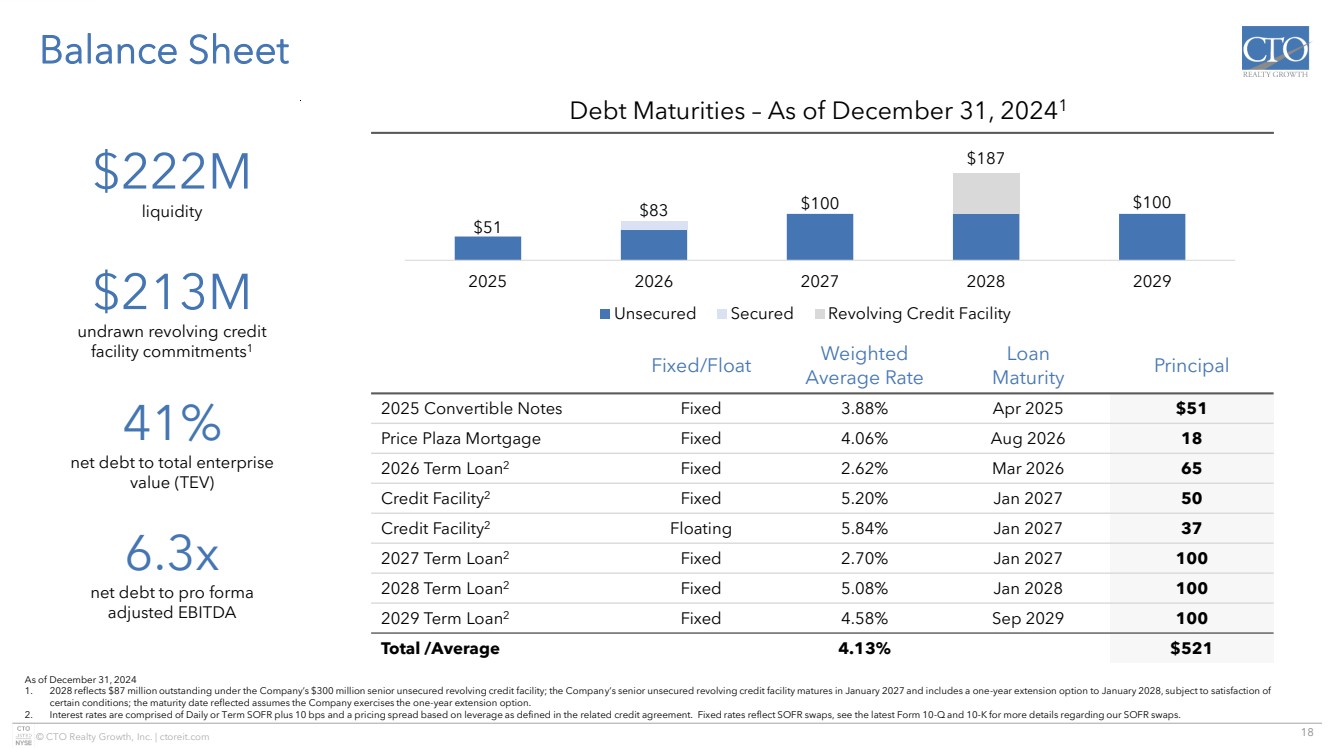
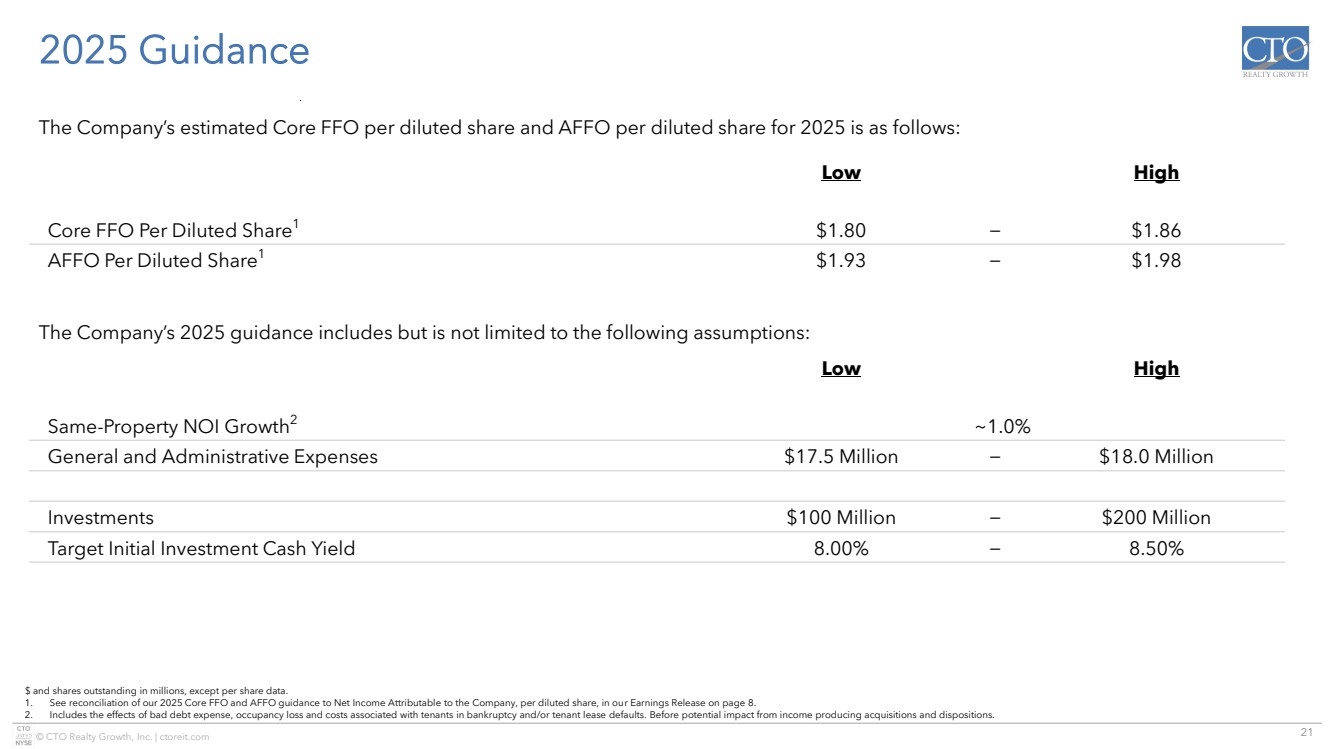
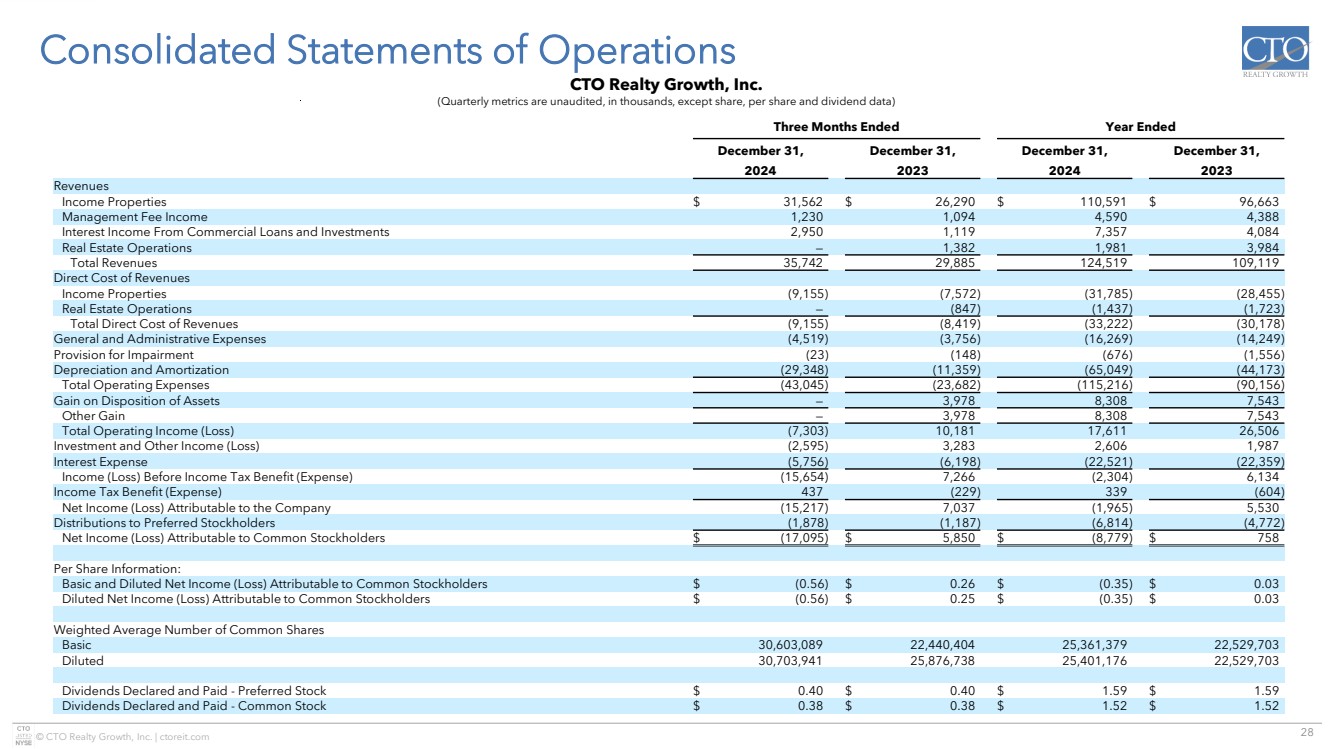
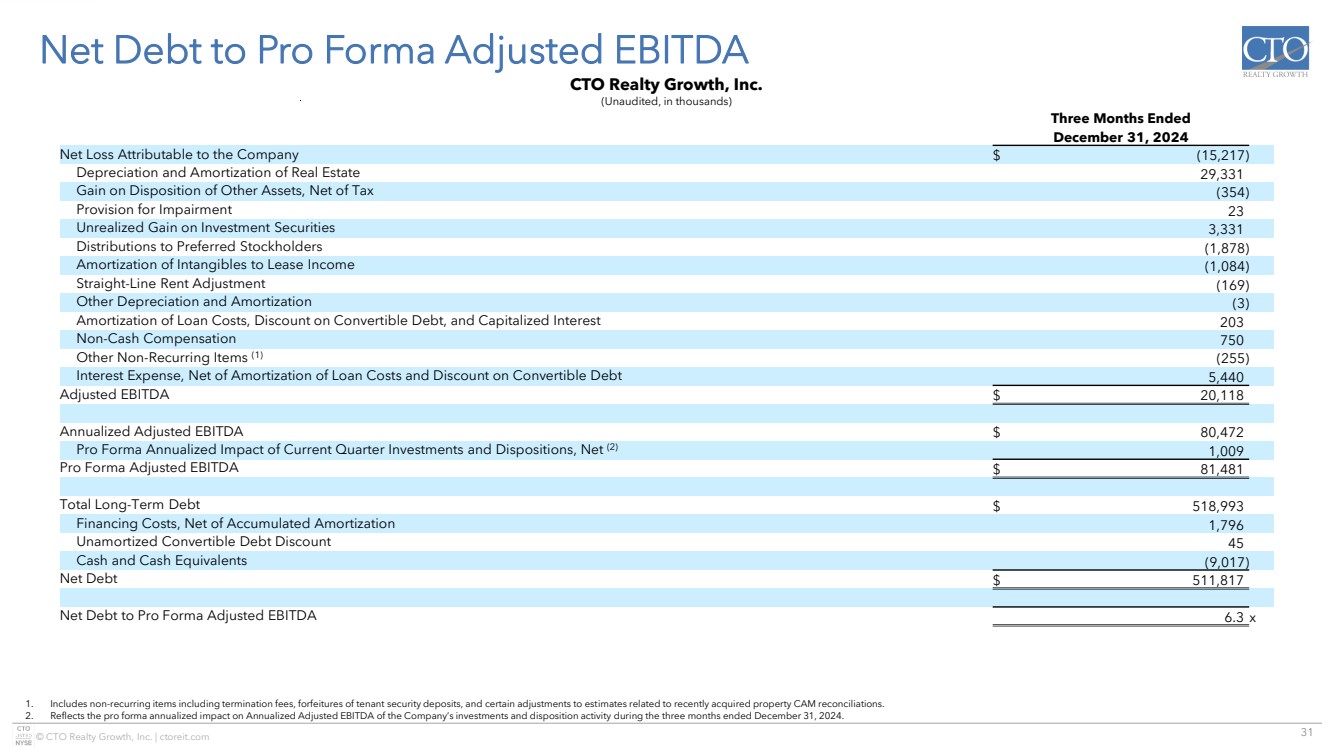
Thanks, John. As John discussed, we had an excellent fourth quarter concluding a strong 2024. Starting with the balance sheet. During the fourth quarter, we raised net proceeds of $33 million at a weighted average price of $19.77 per share, which brought our total net proceeds raised under our ATM program to $165 million for the full year at a weighted average price of $18.79 per share. To place this in context, the capital we raised represents over 40% of our common equity market capitalization at the beginning of 2024. This capital helped us to improve net debt to EBITDA by over a full turn, ending the year at 6.3 times. Further, our 2024 ATM activity, along with closing a $100 million term loan in September of 2024, provides us with capital to significantly grow the company and importantly ended the year with $222 million of liquidity and a balance sheet to support continued growth. In 2025, we do have one debt maturity. Our convertible notes with an outstanding face amount of $51 million and a stated interest rate of 3.875% mature on April 15th. We have recently sent notices to the holders of the convertible notes of our election to settle these notes in cash. Accordingly, with the terms of the notes, the cash settlement price is not fully fixed until maturity and will change primarily based on our common share price. However, for reference purposes, a $20 common share price is equivalent to approximately a $75 million settlement of all the outstanding notes at maturity. Moving to operating results. FFO was $14.2 million for the fourth quarter, a $3.3 million increase compared to the $10.8 million reported in the fourth quarter of 2023. On a per-share basis, core FFO was $0.46 in the fourth quarter of 2024 compared to $0.48 in the fourth quarter of 2023. This change of $0.02 per share is primarily a result of a significant reduction in leverage that I discussed earlier. For the full year of 2024, core FFO was $1.88 per share compared to $1.77 per share in 2023, representing 6% growth. Now on to guidance. For 2025, we are establishing a core FFO range of $1.80 to $1.86 per share and an AFFO range of $1.93 to $1.98 per share. The assumptions that support our guidance are detailed in our earnings press release, but I would like to provide additional context regarding two matters. First, settling our convertible notes for cash will cost approximately $0.05 per share in 2025 due to the settlement price being at a premium to the face amount and rolling the relatively low coupon rate of the convertible notes to our revolving credit facility rate. Second, page eight of our updated investor presentation posted last night includes a summary of the ten spaces John discussed earlier on the call. Our guidance includes a $0.10 per share impact related to these spaces, based on the assumptions that we have regained possession of all of them around the end of the first quarter of 2025. And with that, operator, please open the line for questions.
Operator
Thank you. If you would like to ask a question, please press star one one. Our first question comes from Gaurav Mehta with Alliance Global Partners. Your line is open.
Speaker 3
Thank you. Good morning. I wanted to follow up on your comments around convertible notes and just clarify. So that settlement, you guys are expecting that with cash and there is no expectation of share issuance with that conversion, right?
Speaker 1
Yeah. Hey. This is Phil. We have given notice that our intention is to settle in cash, so, contractually, that is the only right we have. If we wanted to settle some in shares, generally, the note holders would still be open to that, and we could do an exchange with them. But at this point, we anticipate settling it in cash.
Speaker 3
Okay. And so the cash, the source would be the line of credit?
Speaker 1
Yes. So initially, it will go on the line, and then, you know, it would be termed out later.
Speaker 3
Okay. Second question on the guidance. I was hoping if you could provide some more color on your 2025 outlook between acquisitions and structured investments. What kind of mix are you expecting?
Yeah. So, you know, right now, presently, we are seeing just core acquisition opportunities. We do not have any structured investment opportunities kind of in front of us right now, but we expect to see some later in the year. But right now, it is primarily core acquisitions.
Speaker 3
Okay. And then lastly, on the same property NOI guidance, can you provide some color on how you expect that to trend from quarter to quarter?
Speaker 1
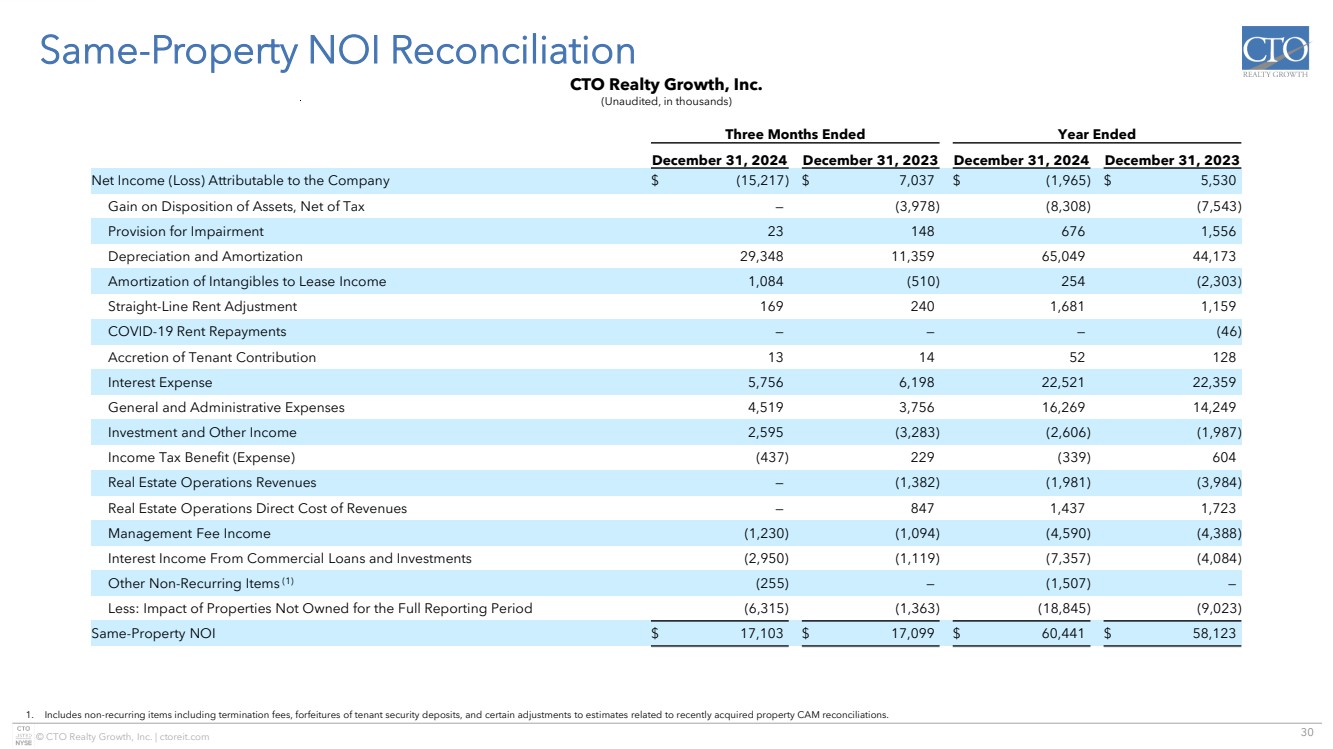
Yeah. I mean, first, I would just say I would always kind of focus on the annual number there because, like, $150,000, it is a small pool. $150,000 in one quarter is like 1%. But, generally, pretty even. It is going to bump up and down a little, but it will be generally pretty even. And then, hopefully, in the fourth quarter, it will start to pick up a little more.
Speaker 3
Okay. Thank you. That is all I had.
Speaker 1
Thank you. Our next question comes from Rob Stevenson with Janney Montgomery Scott. Your line is open.
Speaker 4
Good morning, guys. That slide eight in the deck was very helpful, but a question for you, John. Did I understand you say that half of the releasing would impact 2025? It should get the full impact of the $4 million to $4.5 million of new rent in 2026? Just trying to jive that with the $0.10 a share in the guidance.
Speaker 1
Yeah. Hey. It is Phil, and I will let John add in. But he was talking about 50% in 2025. He was talking about our signed not open pipeline, which is separate from page eight. Page eight is just these recent retailer bankruptcies and vacancies. And that is separate from that. On page eight, all of that we are anticipating to come online in 2026. And then separately, the signed not open pipeline, we are anticipating picking up about half of that in 2025, and then the full impact of that in 2026. To add to the pickup of these vacancies.
Speaker 4
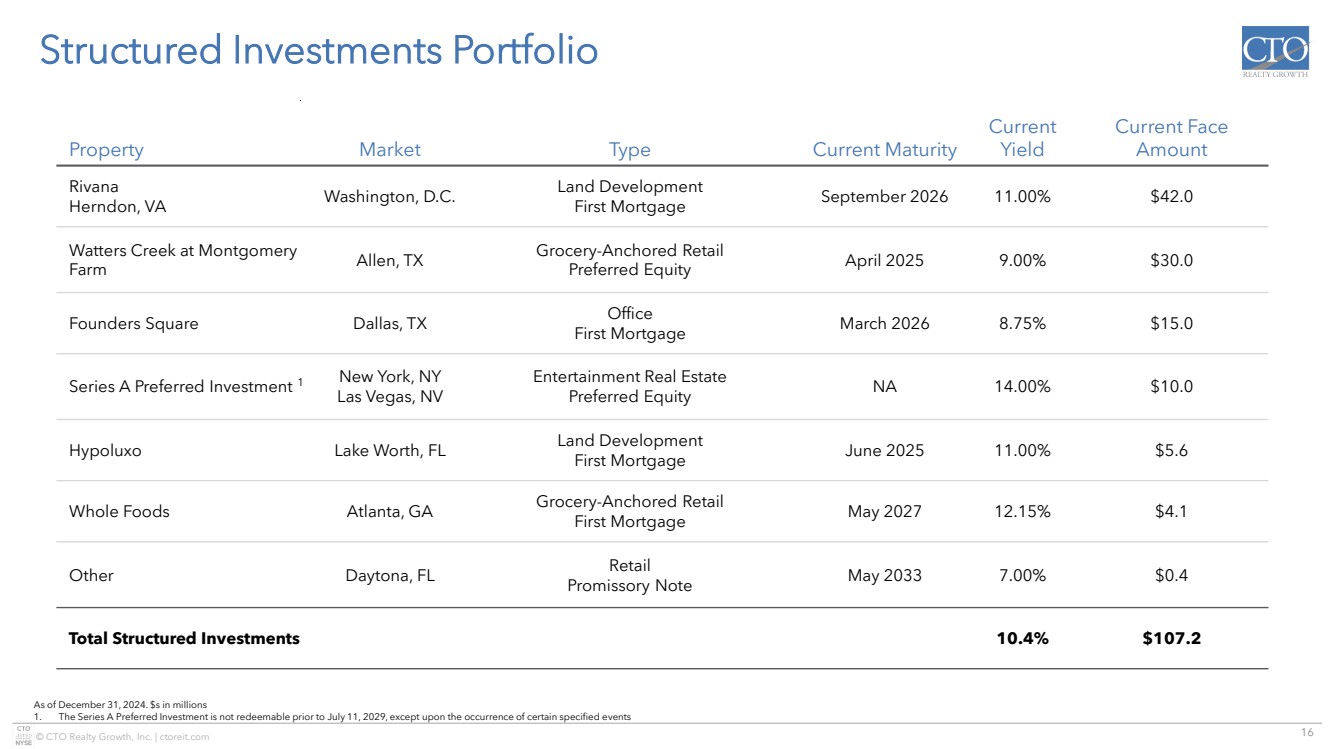
Okay. That is helpful. And then you have one of your structured investments, the Waters Creek, maturing in April. What is that looking like in terms of recent conversations with that borrower? Is that a repay? Is that an extend? How is that likely to be resolved, and if you are getting the money back, expected to get the money back, then, you know, how is that market these days to replace? Are you going to wind up bringing the structured investment portfolio down a little bit in size?
Yeah. I think, you know, I was with the borrower a week ago, and, you know, they are doing great on that property, and we are hoping that, yeah, we stay in there. We expect that we will have probably a short-term extension. So, you know, when I mean short-term, maybe a year or something like that, but we will see. But, you know, having said that, given it is a high-quality, you know, grocery-anchored center, you know, our pricing there, if we were to get it back, we anticipate that we would be able to reinvest that at a higher yield.
Speaker 4
And I guess, you know, how if that is staying, if that is likely to stay in the portfolio and nothing else comes out in the interim, how aggressive should we expect you guys to be in expanding the $107 million portfolio today? Is that likely to end 2025 at $150 million, you know, pushing $200 million? You know, is this the current sort of upper end?
Yeah. I would say, you know, maybe add, you know, $40 million to the balance. Is something to expect. You know, something that we got, we got to imagine we can kind of grow that by, you know, upper bounds of $50 million this year. It is sort of the thought process.
Speaker 4
Okay. That is helpful. And then last one for me. Can you talk about how your AMCs are performing these days? Is it you are starting to get back to some more robust releases, you know, with the Captain America movie and stuff like that? How are they performing versus where they were in the past, and, you know, how much of a concern are they for you at this point in the cycle?
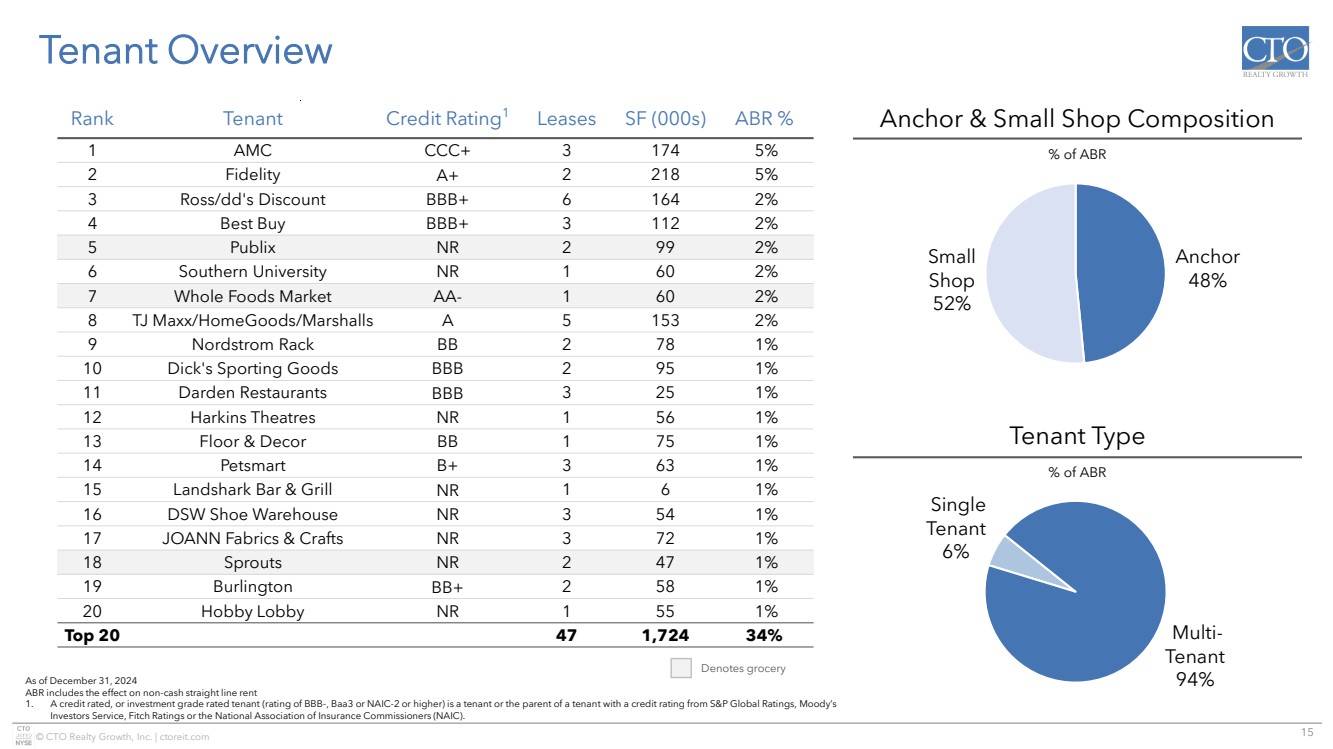
Yeah. I mean, they are definitely a lot less concerned because they had a good year last year. And as you mentioned, the Captain America has been doing very well. And especially in these locations, so these AMCs that we have are top performers in their market. And so, you know, we are actually in Charlotte, the last acquisition. You know, the AMC is not, you know, something that you would find to be an exciting experience when you drive up to it. We are actually going to paint and add lighting and everything, even though it does not look great, it does terrific. I was with someone that lives in the Charlotte area, and they mentioned that they go to this theater even though it is out of the way because it is the most kind of convenient for them to get in and out of. And so long story short, all of them are performing very well, and, yeah, the box office, just as a macro backdrop, has been very good for them.
Speaker 4
Okay. Thanks, guys. Appreciate the time. Have a great weekend.
Operator
Thank you. Our next question comes from Matthew Erdner with Jones Trading. Your line is open.
Speaker 5
Hey. Good morning, guys. Thanks for taking the question. John, I believe you mentioned something about those ten additional acres, you know, next to Forsyth or up in that area. Could you remind me again what the plan was with that?
Yeah. So originally, when we bought it, we had a tenant right off the bat who started paying us sort of a licensing fee. It is really a sort of fee. They dropped it as they were having trouble with their other operations and other locations, so they wanted to scale back their expansions. And so we obviously took it back, and we now work to that would be very, you know, very complementary to the collection as far as, you know, a great draw and bringing a lot of visitors to the location. So we are in those negotiations right now. So we hopefully and expect something in, let us just say, in the next three months. And then this is something that would probably come online whether it is late 2026 or 2027. But, yeah, it is something that, you know, we wanted to highlight because we are starting to kind of get closer to a deal there.
Speaker 5
Yeah. That is helpful. And then I am guessing that would kind of include those the first right of refusal similar to others. And then as a follow-up to that, you know, it is probably a little ways away, but, you know, do you ever anticipate kind of closing on some of those right to refusals and taking those properties in?
Yeah. So on that one, just to be clear on the ten acres, you know, we own that property, so we would, you know, we could build it and have the lease ourselves and not have a first right of refusal. It is not an outside developer. You know, it could be an outside developer, but right now, we are talking to tenants on a primary basis. And then with regards to your question on other deals where we have done loans, where we have a first right of refusal, yeah, I think the Whole Foods would be that that is across the street there at the collection would be high likely that we would buy that in because it is such a complement to the collection.
Speaker 5
Got it. That is helpful. Thank you.
Operator
Thank you. Our next question comes from RJ Milligan with Raymond James. Your line is open.
Speaker 6
Hey. Good morning, guys. Appreciate the detail on slide eight. It is helpful. But I am curious, Phil, for the guidance, what is baked into additional potential bad debt sort of you obviously highlight the known or expected vacancies, but I am curious what you are baking in into guidance for unknown.
Speaker 1
Yeah. So we have, you know, taken out all the known, you know, largely that is on slide eight, and that is just excluded from 2025. Then after that, as far as the tenants that are in place, it is pretty much our general 1%. Nothing different from, you know, historical run rate on that. To answer your question.
Speaker 6
It does. And then for the know you had mentioned four of those ten boxes. Do you expect the rent to commence in 2026? Can you just give me an idea of the expected timing of that rent in that commencement in 2026?
Speaker 1
Yeah. I mean, we are hoping to have most of them online in the first half of 2026. The majority of them, there might be, you know, two or three, depending on timing, that could be the latter half. But assuming we can, I mean, we are working really hard, RJ, to get them back as soon as possible and get them released. If we can get them back sooner, then we would hope to have them all, you know, early in the first half or in the first half. But there could be a few boxes that might take a little longer to get a hold of, and then those could be delayed to getting them online in the second half. But we would hope to have a majority of them up and paying rent in the first half.
And a little bit of it, RJ, is, you know, we do have opportunities to do tenants that could come in faster, but would not be as accretive to the whole center and not as good kind of credit. And so we are willing to kind of take a longer, you know, lease delivery, rent commencement, or higher quality tenant that just takes a lot longer because they are, you know, investment grade and that sort of thing.
Speaker 6
And that is helpful. That sort of leads into my last question, John, which is, you know, who are the tenants that you are talking to that are interested in those spaces? And then just curious how you think about the overall value as you get those new tenants into the space.
Yeah. I mean, the value creation is definitely low-hanging fruit for I mean, think about, you know, Sanford and or Orlando that we bought, you know, a year ago, we had, you know, roughly an 8 CAP. And you know, you have a big lot coming back at, you know, roughly $12 a square foot, and you know, we are talking to a tenant that is investment grade at, you know, basically double that. So I mean, just the not only the income accretion, but then the cap rate compression of having that credit versus when we bought it, it was big lots. So it is that is across the board on these parties that are easier, like, the backfills are, you know, enterprising tenants that are growing that you know, are kind of darlings of Wall Street sort of thing. So we are very excited about the mix that we will be able to backfill here.
Speaker 6
That is helpful. Thank you, guys.
Operator
Thank you. Our next question comes from John Massocca with B. Riley Securities. Your line is open.
Speaker 7
Good morning. It is kind of going back to slide eight, the $9 million to $12 million of CapEx. I mean, how does that kind of impact the CapEx outlook for 2025 versus, say, with kind of more run rate or what you were doing in 2024.
Speaker 1
Yeah. I mean, so that is, you know, incremental to what we are kind of our regular run rate there. So it would be on top of that, John. And the way to think about that CapEx too is if we are on the lower end of that, we will be on the lower end of the spread there, like 40%. And if we are on the higher end, you know, $12 million, we will be on the higher ends of spread there with, you know, a much larger mark to market, but that is, you know, kind of a one-time incremental to get these box up and running again.
Speaker 7
Okay. And how is that in mind? I mean, what lease durations are you kind of talking about today with potential replacement tenants just, you know, given there is a decent amount of CapEx going into these boxes?
Yeah. Roughly ten to fifteen years, you know, so good lease duration and good credit behind them.
Speaker 7
I appreciate that. And then, you know, on the kind of Yeah. The releasing side of things. I mean, is the timing you are seeing typical of what you would see for vacant maybe kind of smaller vacancies you see in the portfolio historically? I know you talked a bit of a variance on, you know, IG versus maybe two smaller tenants can come in faster. But I mean, is it indicative of anything in the kind of macro environment or specific to these assets, or is that timing just kind of typical if you were to see other vacancies going forward?
Yeah. I mean, it is definitely typical of the macro environment, you know, with these, you know, highly desired boxes, these national tenants that we are talking to, just have, you know, their normal pipeline of what they are delivering the year, next year, year. So it is just, you know, if you want the higher quality tenant, you are just kind of getting into their pipeline, and they just have a process. So it just takes more time. Now if you want to go the local route with a smaller operator, certainly, it is a lot faster, but, you know, certainly, we are looking at the total value creation of having, you know, higher credits in these centers.
Speaker 7
Okay. And then last one for me, maybe broad strokes if you do not have the exact number in front of you, but what we kind of stand for ROI growth expectations have been for 2025 if you were not dealing with these vacant, please.
Speaker 1
Yeah. Two to three. So we are putting guidance out at one. But would have been more in the two to three range.
Speaker 7
Perfect. That is very helpful. And that is information. Thanks.
Operator
Thank you. Our next question comes from Craig Kucera with Lucid Capital Markets. Your line is open.
Speaker 8
Yeah. Hey. Good morning, guys. Got a lot of activity planned in 2025 without any disposition. And I know you are comfortable running the company at higher leverage. But is the plan to be leveraged neutral, or did you maybe front load some equity in 2024 and you are willing to lever up?
Yeah. I mean, look, we are, you know, we want to, you know, have a trajectory on the leverage to go down, you know, clearly. The converts are kind of a, you know, unique situation this year. But, you know, given that, you know, what we have kind of in front of us, we feel like, you know, the acquisitions that we are seeing right now are accretive even at these lower stock price levels. So, you know, just depending on how things go. Remember when we, you know, settle these converts, you know, they are basically hedged against our stock. So, you know, they will be, you know, covering on the stock. So there should be a good backdrop. And then, hopefully, given the size of the company and the growth of what we did last year, we are getting closer to, you know, REIT index inclusion. So, you know, if you look at the investor base that came in in December, we are starting to get more of that index buying as you can see, you know, BlackRock bought a lot in the quarter. Had some, you know, a new rededicated come in. So we are starting to get that traction that we always wanted. So I think the backdrop is really good for this year. And so looking forward to kind of executing on acquisitions that are going to be complementary and accretive and see what we have in front of us.
Speaker 8
Okay. Great. Changing gears. You know, at the time of the Carolina Pavilion acquisition, I think it was 93% occupied. I guess as part of your underwriting process, were you aware you would lose a number of tenants in the fourth quarter or want to kick them out? And was that mark to market opportunity partly attracted to the purchase?
Yeah. So I think I might have mentioned that in the last earnings call that when we put under contract Carolina Pavilion and by the time we closed, we had three tenants basically go bankrupt and close their stores. Which is highly unusual and most people would, you know, maybe say, oh, that would be, you know, detrimental and you drop the contract, but actually, it was in our underwriting that it came sooner, of course, on the closings. But the mark to market opportunity to have happened faster, which is so extraordinary for us that, you know, the excitement level for what that property can do is pretty exciting. So we have great activity as we mentioned on these boxes and in the process of, you know, getting the tenants to backfill. So, you know, the economics of this property are going to be totally different here in, you know, twelve, twenty-four months.
Speaker 8
Right. And just one more for me. Given the changes in the current administration and some job losses in DC, have the folks at Revana communicated any changes to you regarding their development schedule or any of that sort?
No. They are seeing great activity on the multifamily front on that project. And, you know, they are, you know, they have an incredible amount of activity and demand for that land. That Northern Virginia area, as you know, Loudoun County, the data center market has just been extraordinary. And a lot of the contractors are out in the market to your point, but there is still such housing demand that, you know, there are no bumps at all along the road.
Speaker 8
Okay. That is it for me. Thanks, guys.
Operator
Our next question comes from Michael Gorman with BTIG. Your line is open.
Speaker 9
Yeah. Thanks. John, maybe just sticking with some of the discussions around acquisition and some of your underwriting, I am curious if maybe not yet, but if you think there will be some additional opportunities in the acquisition market shaken loose by some of these recent retailer bankruptcies where maybe smaller landlords do not want to have to go through a retenanting or do not want to have to go through another CapEx cycle. Are you seeing or starting to see any opportunities because of these new vacancies in the marketplace for acquisitions?
No. We are not seeing that. I think we are seeing almost the opposite. To creep into this market. And we expect, you know, it is a little it is kind of gotten out there in the market a little bit. There is going to be probably a large trade that is going to be very complementary to one of our assets that is in the market. So you are going to see some sort of dramatic acquisitions as you are seeing large, you know, pension sovereign capital migrate into the shopping center space. I mean, obviously, you saw the Blackstone ROIC acquisition closed, and that was, you know, a little and I think we are all kind of like you with the horrible Palisades fire and everything going on in California, you know, whether there, you know, be a situation there, but that closed, you know, like clockwork. I mean, so you are starting to see, you know, really that sort of wave of capital come in for the long term and as I mentioned, the Party Cities and the Big Lots and all the Conn's kind of that is just that is really opportunity versus headwinds because those tenants are at such low rents and did really nothing for shopping centers and actually probably was a deterrent to some of the shopping centers. So this is more of an opportunity than a headwind.
Speaker 9
Got it. Great. And then I think I could probably tell just based on the CapEx expectations, but for any of the LOIs you are discussing, would any of that add a grocer to an existing center, or are these all non-grocer tenants?
These are all non-grocery. We had a grocer opportunity, but the grocer was just going to deliver it longer than we wanted to really sit around and wait or they had a lot of other things in their pipeline to kind of get done first. And even though having a grocer in one of our shops there would have been great, you know, just we felt like, you know, we are not buying green bananas. Perfect. Thanks so much.
Operator
Thank you. Our next question is a follow-up from John Massocca with B. Riley Securities. Your line is open.
Speaker 7
Hi. Just a quick one for me given some of the conversations on mark to market with rents. What is the outlook for the 2025 lease expirations, I mean, just kind of noting it is above your average cash rent per square foot, but, you know, everything is kind of a scope in a portfolio like this.
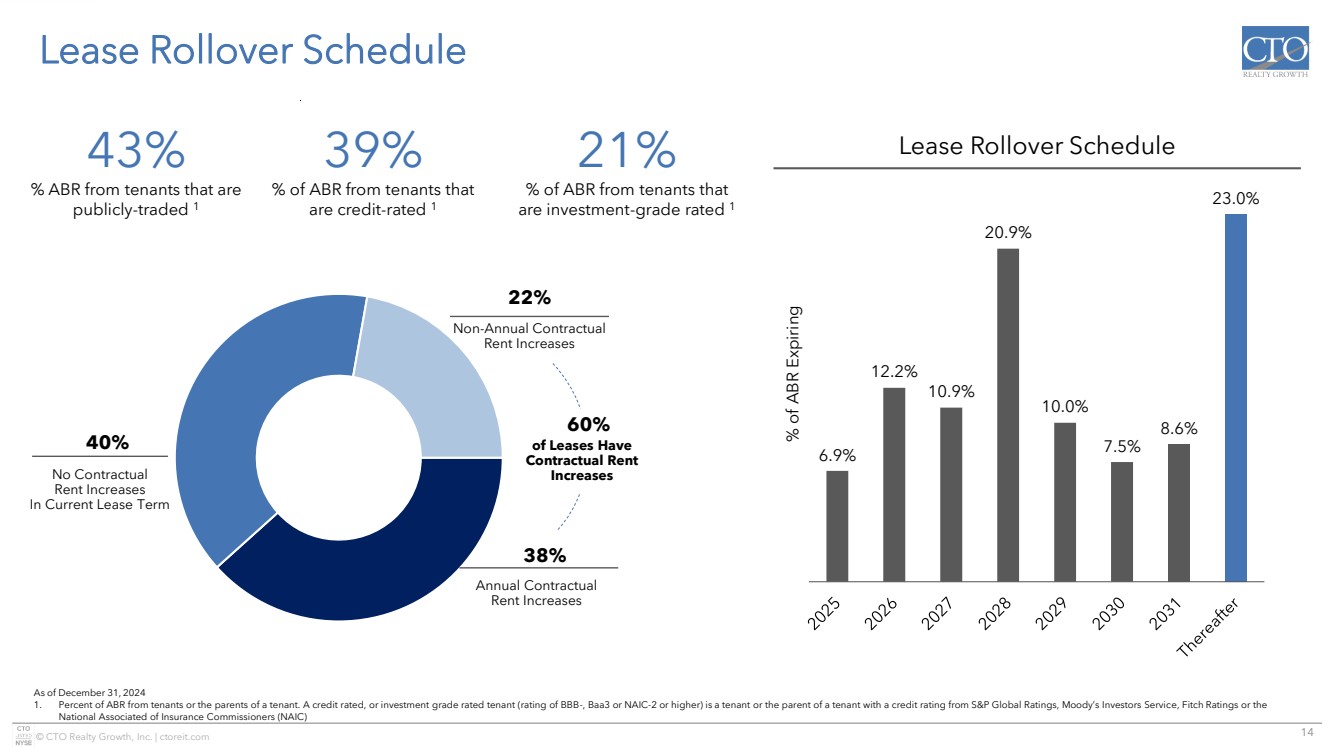
You know, there is no nothing there is nothing where there is a roll-down situation. Everything is a positive. It is definitely not, you know, kind of the mark to market we are seeing in our in the page eight of our presentation. But the trajectory is definitely up, but there is no no kind of drawdown as far as having higher rents rolling.
Speaker 7
Okay. Any, like, any kind of broad stroke ranges you are kind of looking at for you know, just this year's?
You know, I would say kind of the 10% range is kind of a good range to say plus or minus where those ten tenants are rolling to, you know, if they are coming out, the market rents are at least 10% higher.
Speaker 7
Okay. Helpful. That is it for me. Thanks.
Operator
Thank you. There are no further questions at this time. This does conclude the program. Thank you for your participation, and you may now disconnect. Everyone, have a great day.