Operator
...2026 conference call and webcast. At this time, operatives pin-sorting listen-only mode. A question and answer session will follow the formal presentation. You may be placed into question queue at any time by pressing star 1 on your telephone keypad. As a reminder, this conference is being recorded. If anyone should require operator assistance, please press star 0. It's not my pleasure to turn the call over to Lauren Sloan Investor Relations. Lauren, please go ahead.
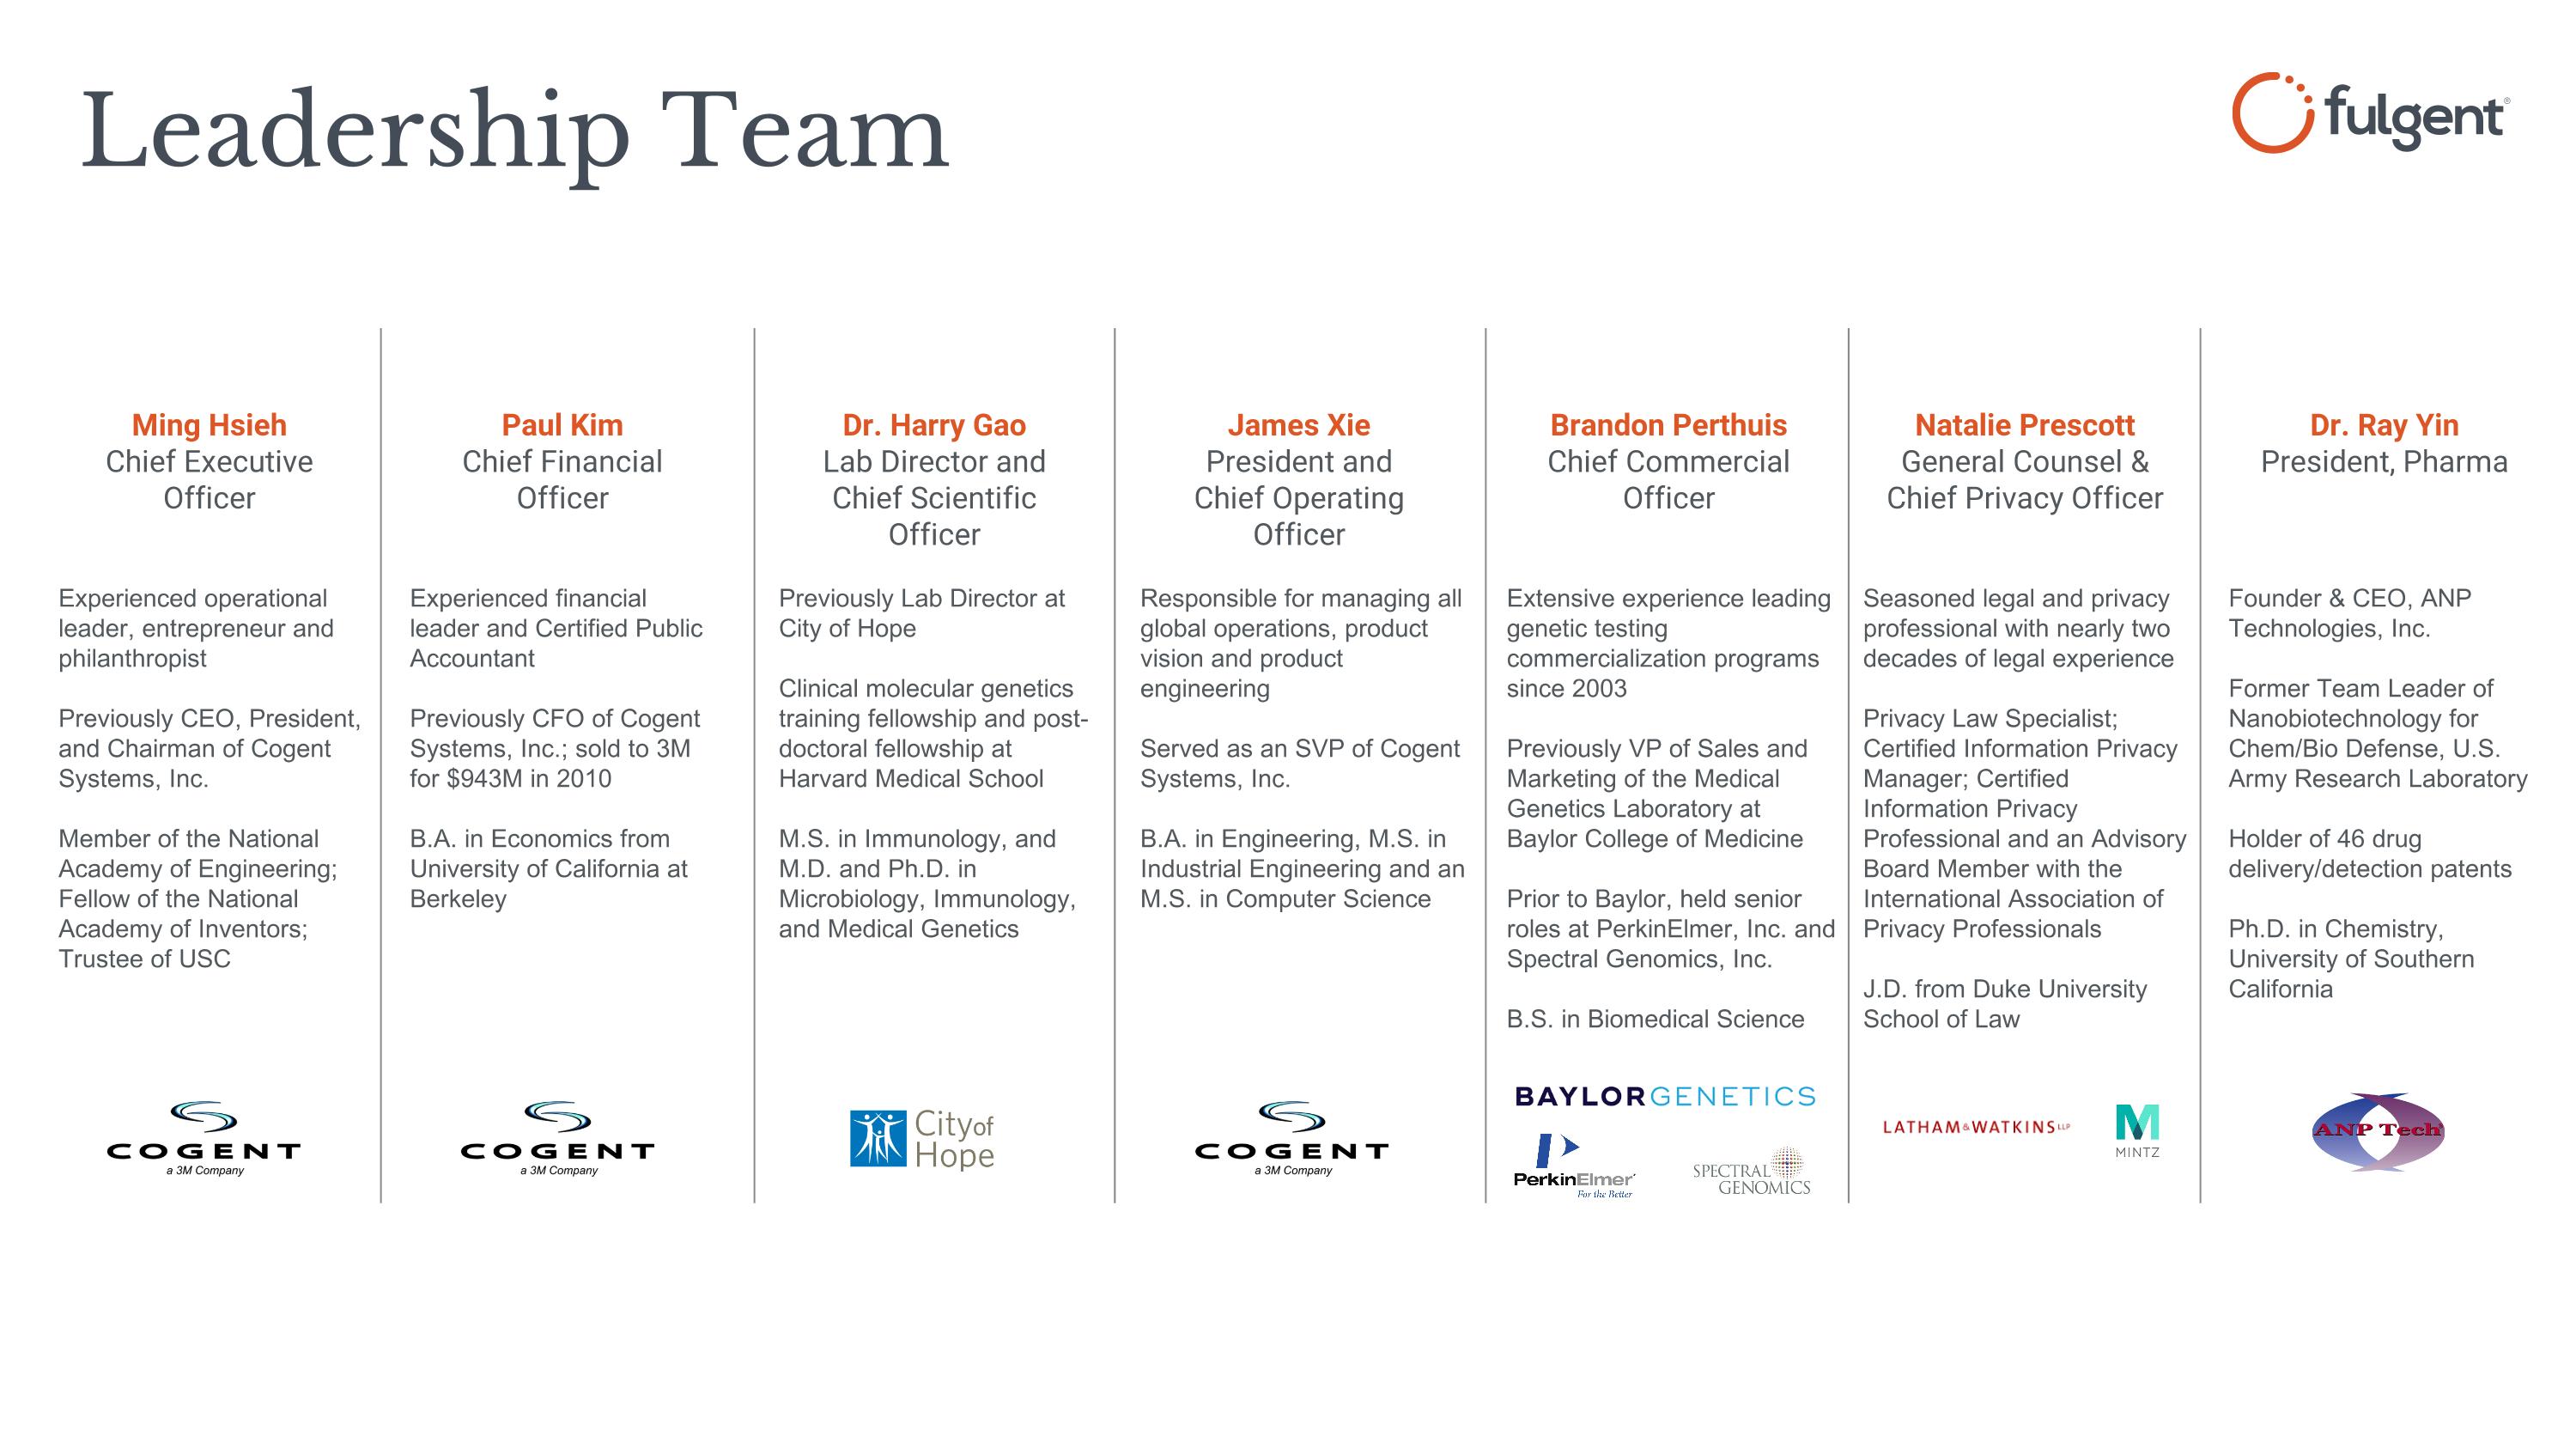
Good afternoon, and welcome to Folgen's second quarter 2026 Financial Results Conference Call. On the call are Ming Shea, Chief Executive Officer, Paul Kim, Chief Financial Officer, and Brandon Perkees, Chief Commercial Officer. The company's press release discussing the financial results is available on the Investor Relations section of the company's website, ir.folgengenetics.com. A replay of this call will be available shortly after the call concludes on the investor relations section of the company's website. Management's prepared remarks and answers to your questions on today's call will contain forward-looking statements. These forward-looking statements represent management's estimates based on current views, expectations, and assumptions, which may prove to be incorrect. As a result, matters discussed in any forward-looking statements are subject to risks, uncertainties, and changes in circumstances that may cause actual results to differ from those described in the forward-looking statements. The company assumes no obligation to update any of the forward-looking statements it may make today to reflect actual results or changes in expectations. Listeners should not rely on any forward-looking statements as predictions of the future and and should listen to management's remarks today with the understanding that actual events, including the company's actual future results, may be material or different than what is described in or implied by these forward-looking statements. Please review the more detailed discussions related to these forward-looking statements, including the discussion of some of the risk factors that may cause results to differ from those described in the forward-looking statements contained in the company's filings with the Securities and Exchange Commission, including the previously filed 10K for the year-ended December 31, 2025, and subsequently filed reports, which are available on the company's investor relations website. Management's prepared remarks, including discussions of non-GAAP profit, loss, operating expense, margin, earnings, and earnings per share, and adjusted EBITDA, contain financial measures not prepared in accordance with accounting principles generally accepted in the United States, or GAAP. Management has presented these non-GAAP financial measures because it believes they may be useful to investors for various reasons, but these measures should not be viewed as a substitute for or superior to the company's financial results prepared in accordance with GAAP. Please see the company's press release discussing its financial results for the second quarter 2026 for more information, including the description of how the company calculates non-GAAP income and loss, non-GAAP earnings and loss per share, non-GAAP gross profit, non-GAAP gross margin, non-GAAP operating profit and loss, and margin and adjusted EBITDA, and the reconciliation of these financial measures to income and loss, earnings loss per share, and operating margin, the most directly comparable GAAP financial measures. The company does not provide reconciliations of forward-looking non-GAAP measures to the most directly comparable gap measures because the information necessary to calculate such reconciliations, including equity-based compensation, tax effects, acquisition-related items, and potential impairments, any of which may be material, is unavailable on a forward-looking basis without unreasonable effort, and the probable significance of those items cannot be predicted. With that, I'd now like to turn the call over to Maine. Please go ahead.
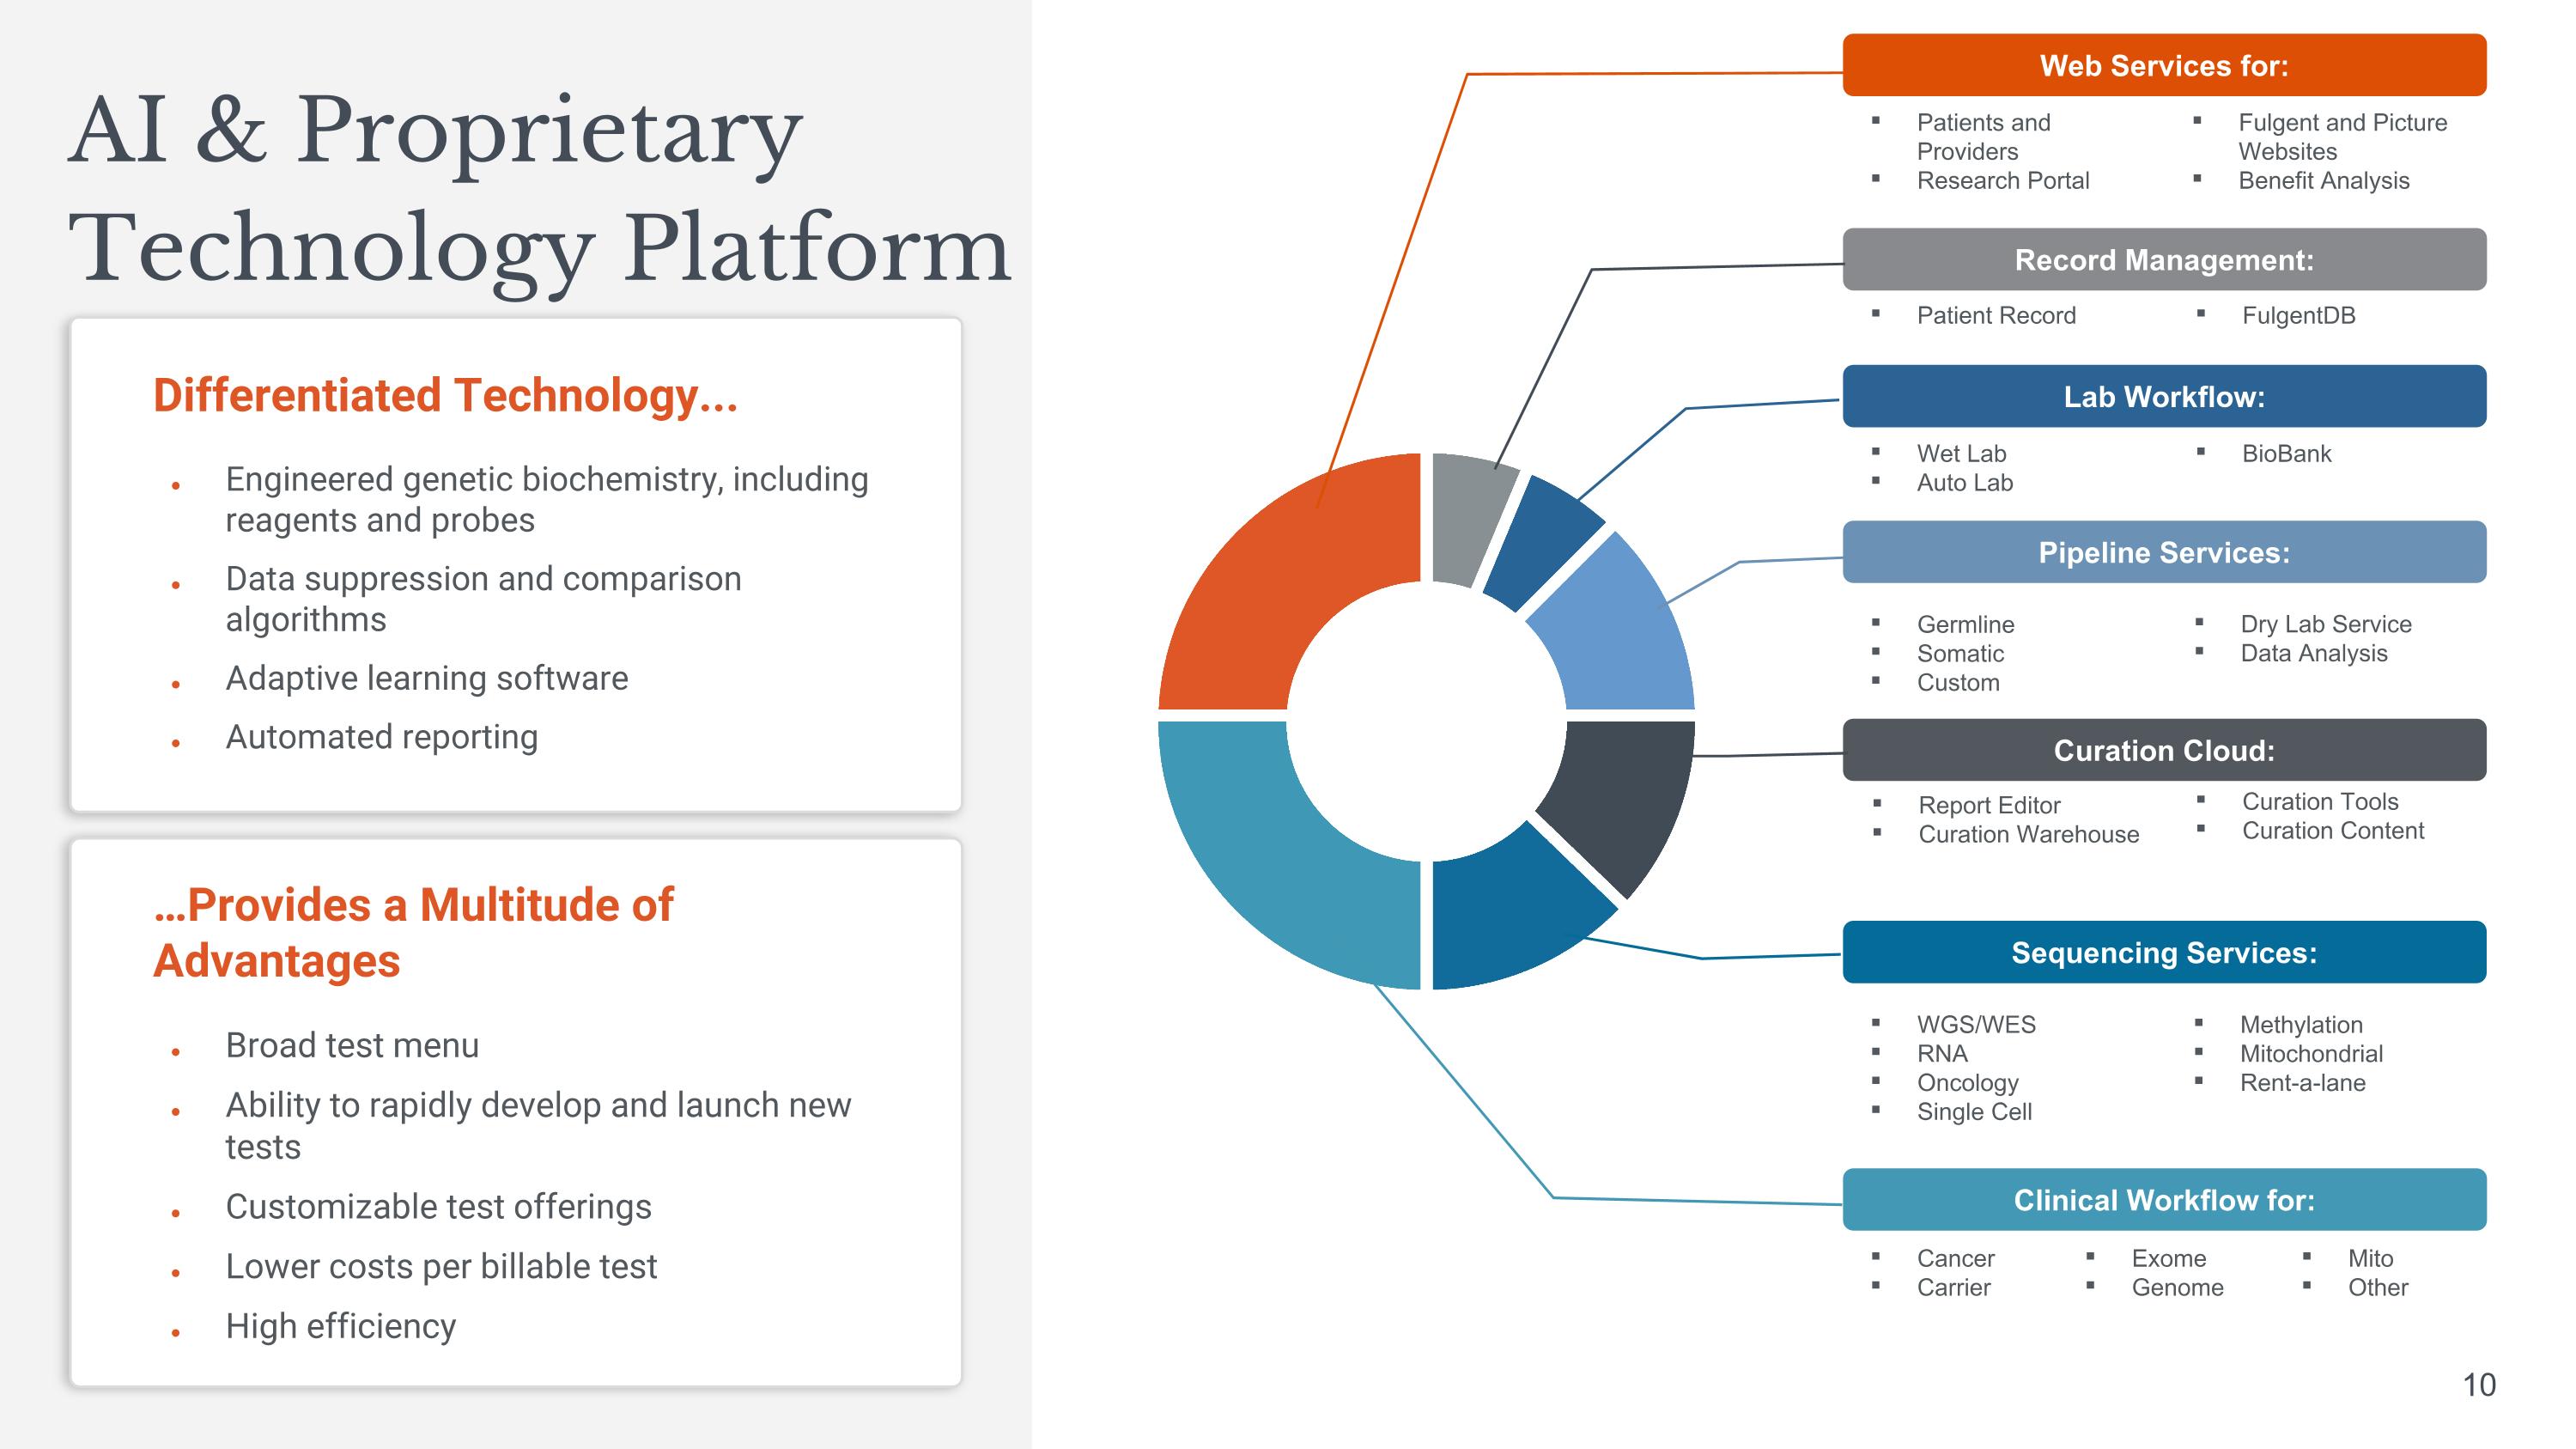
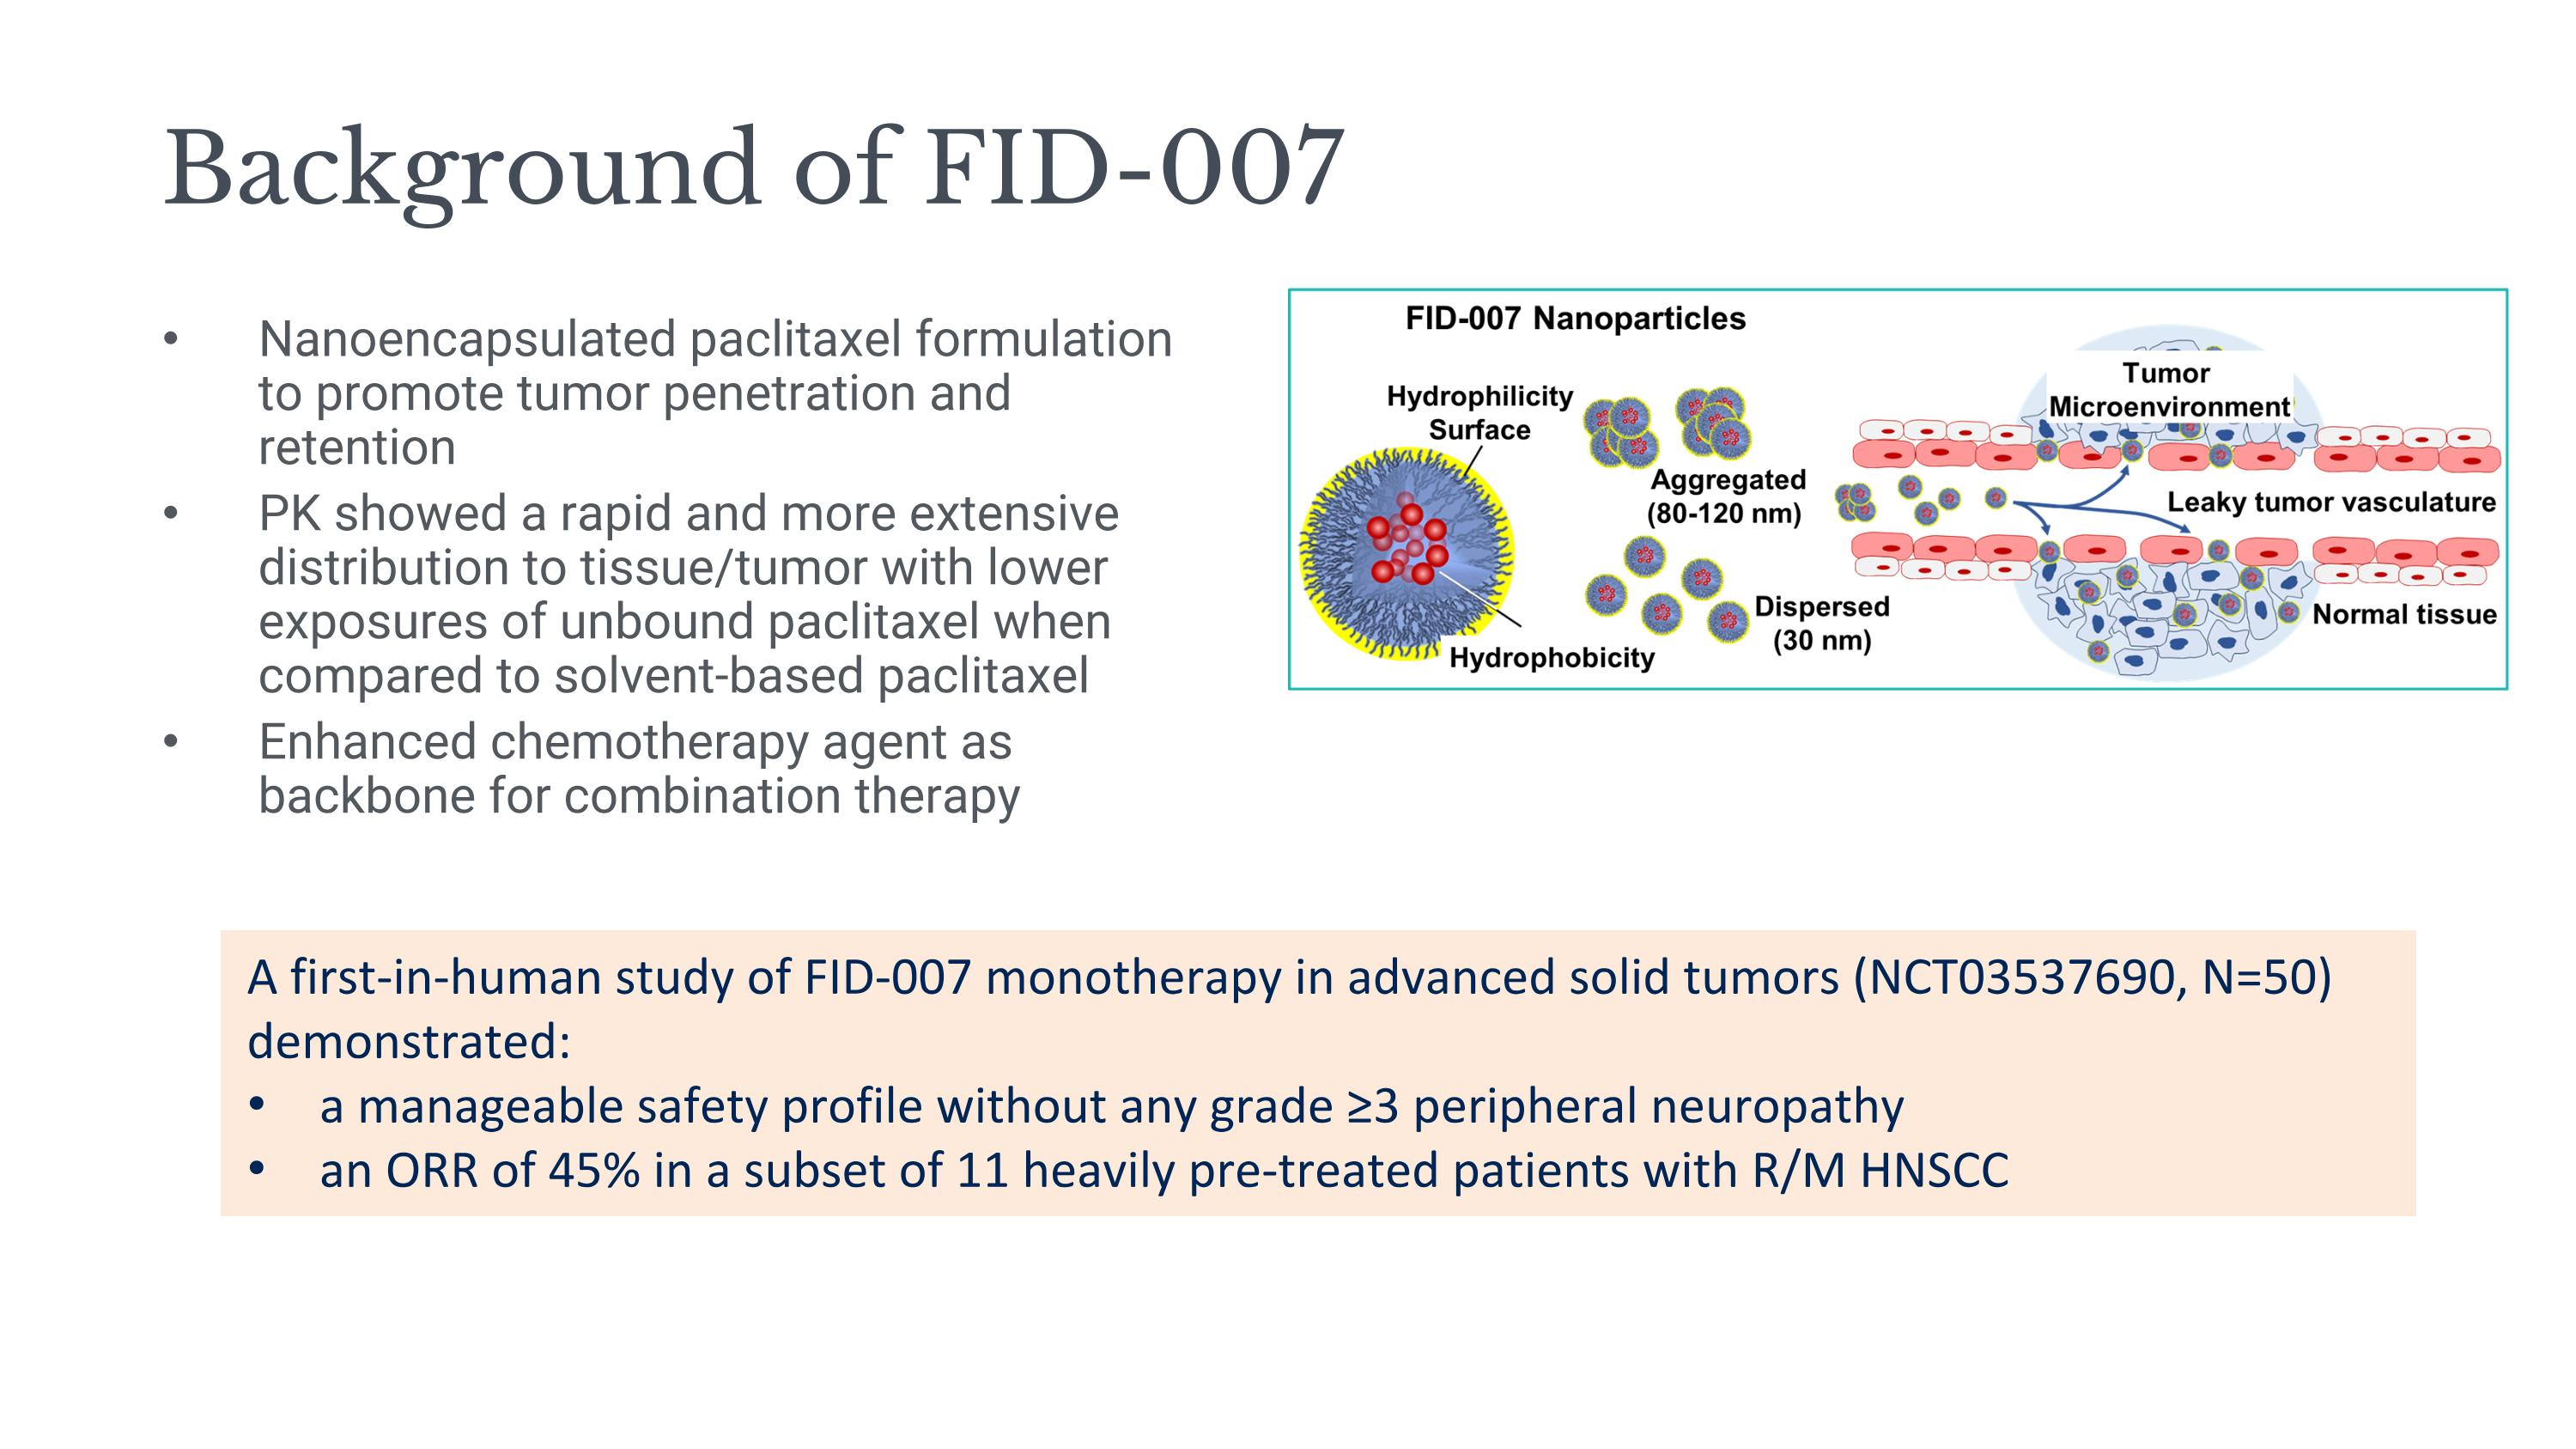
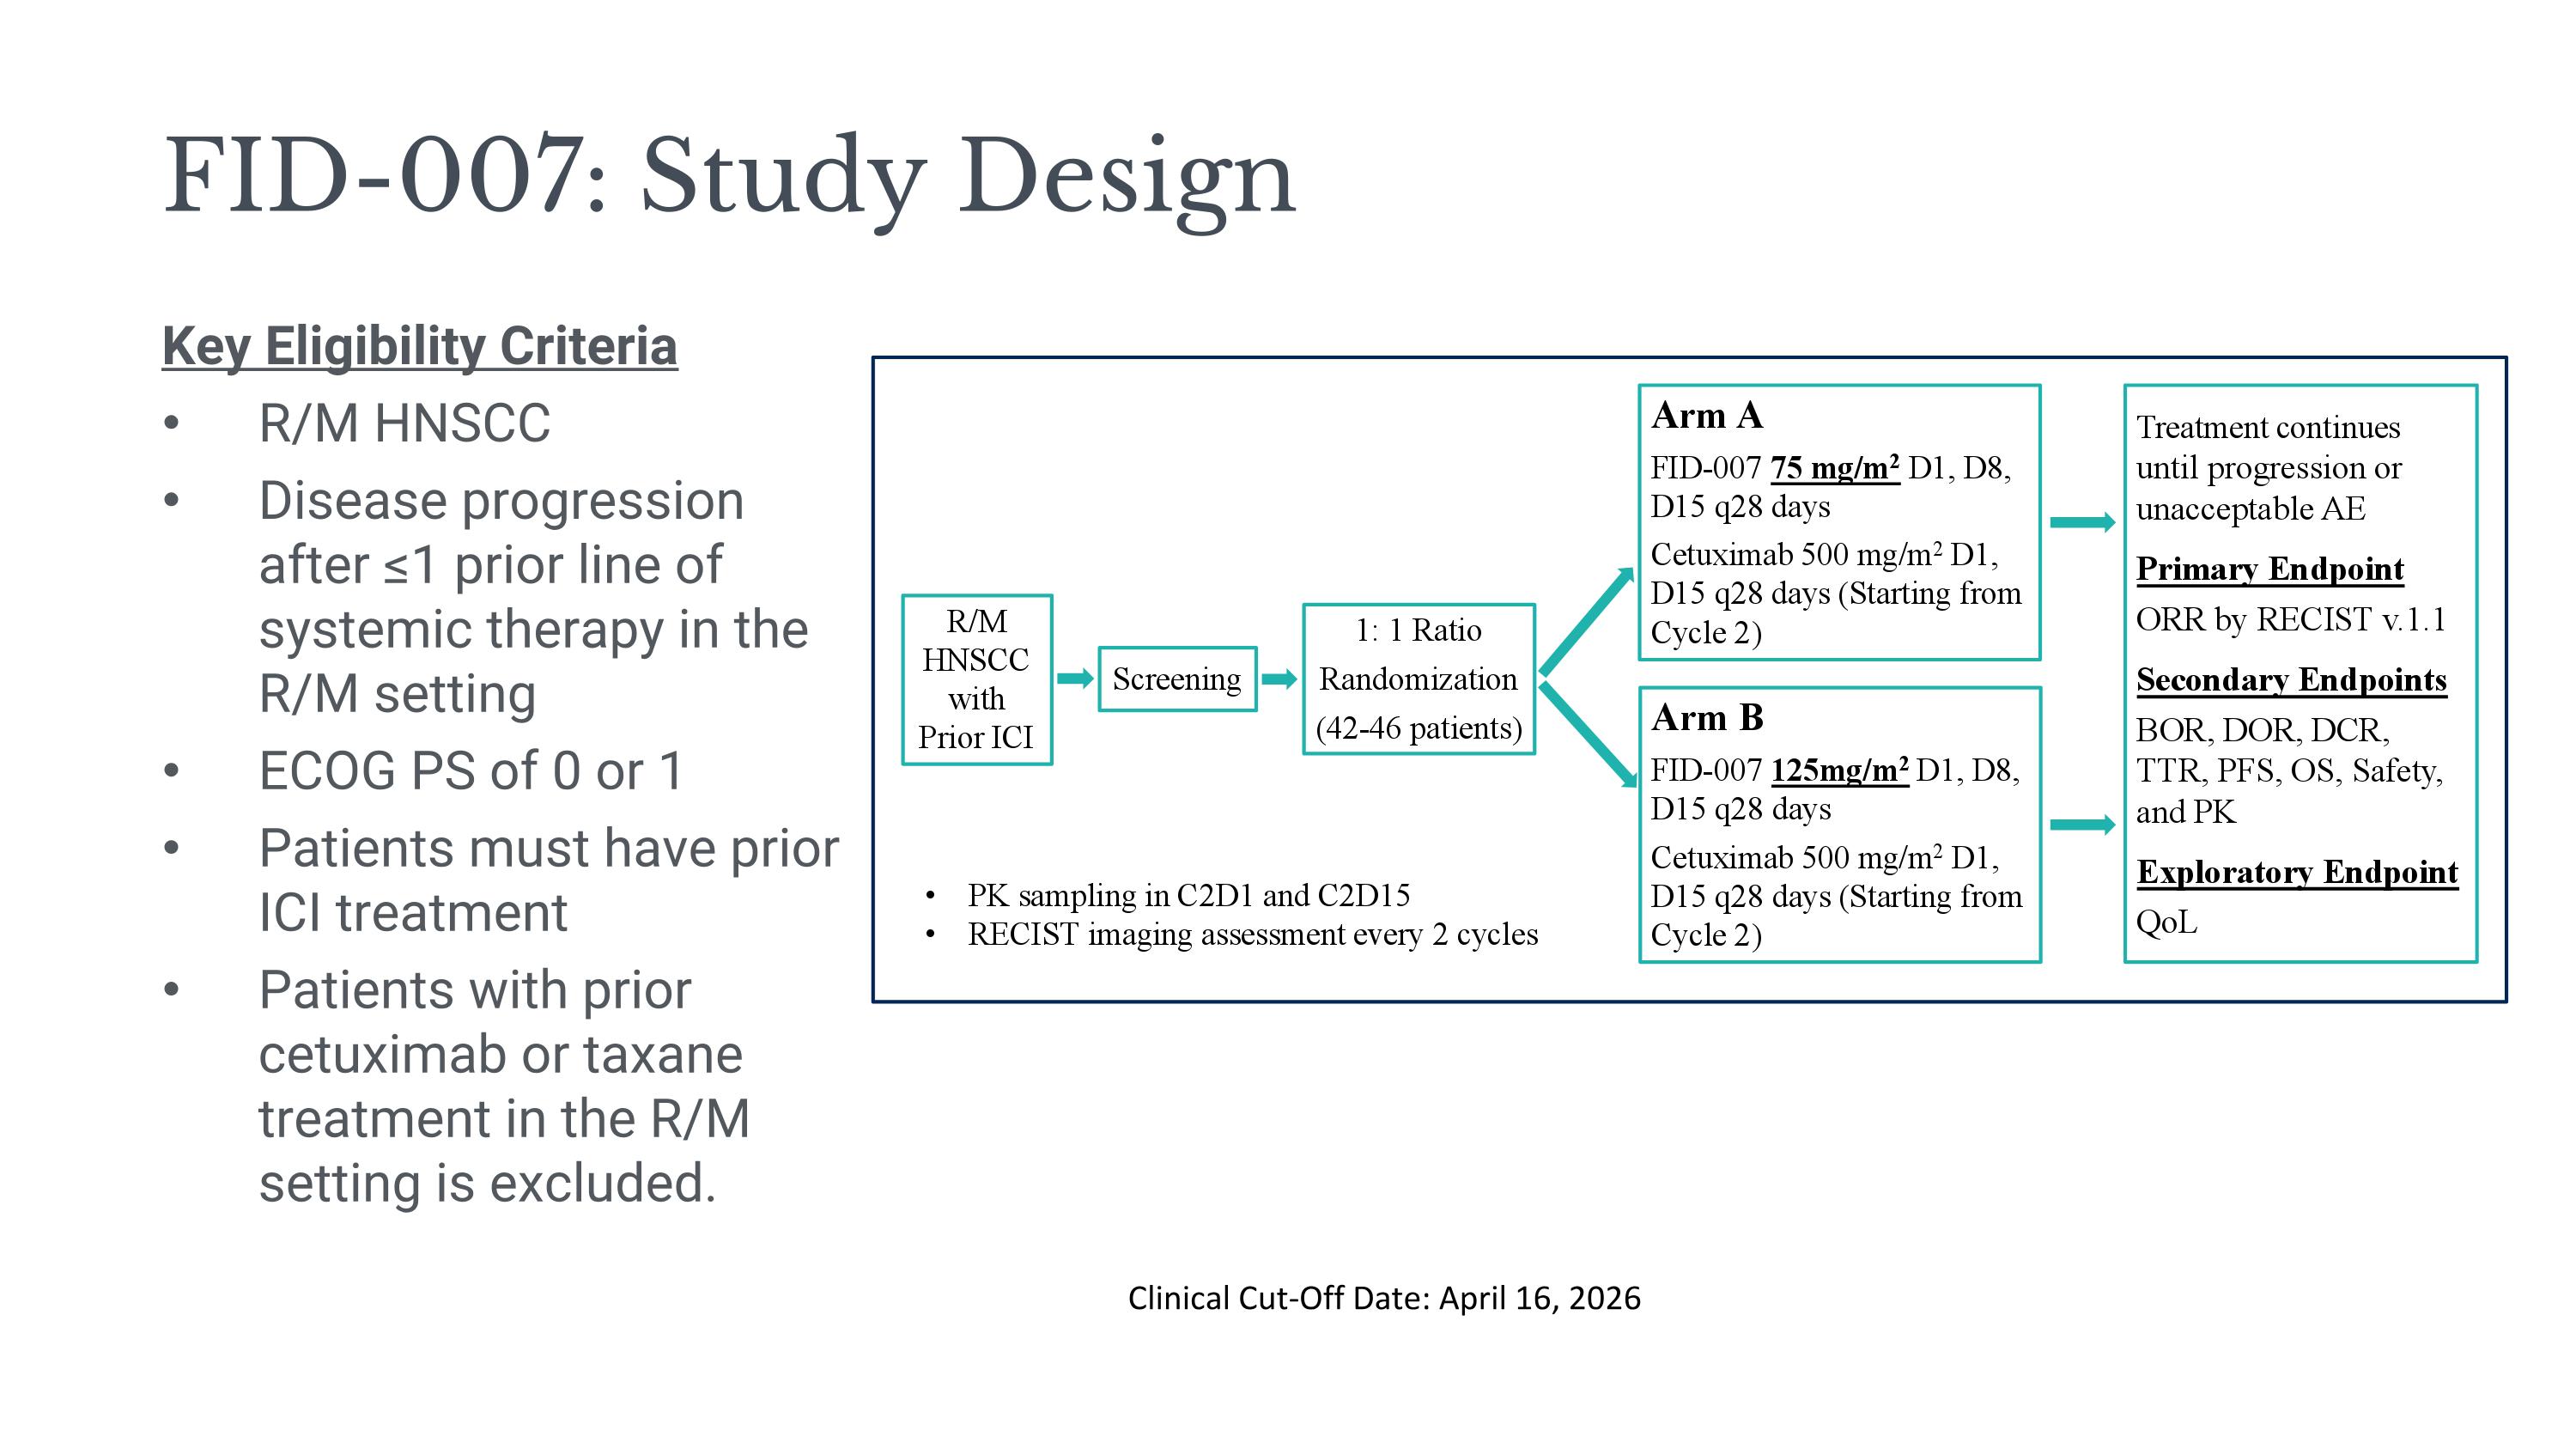
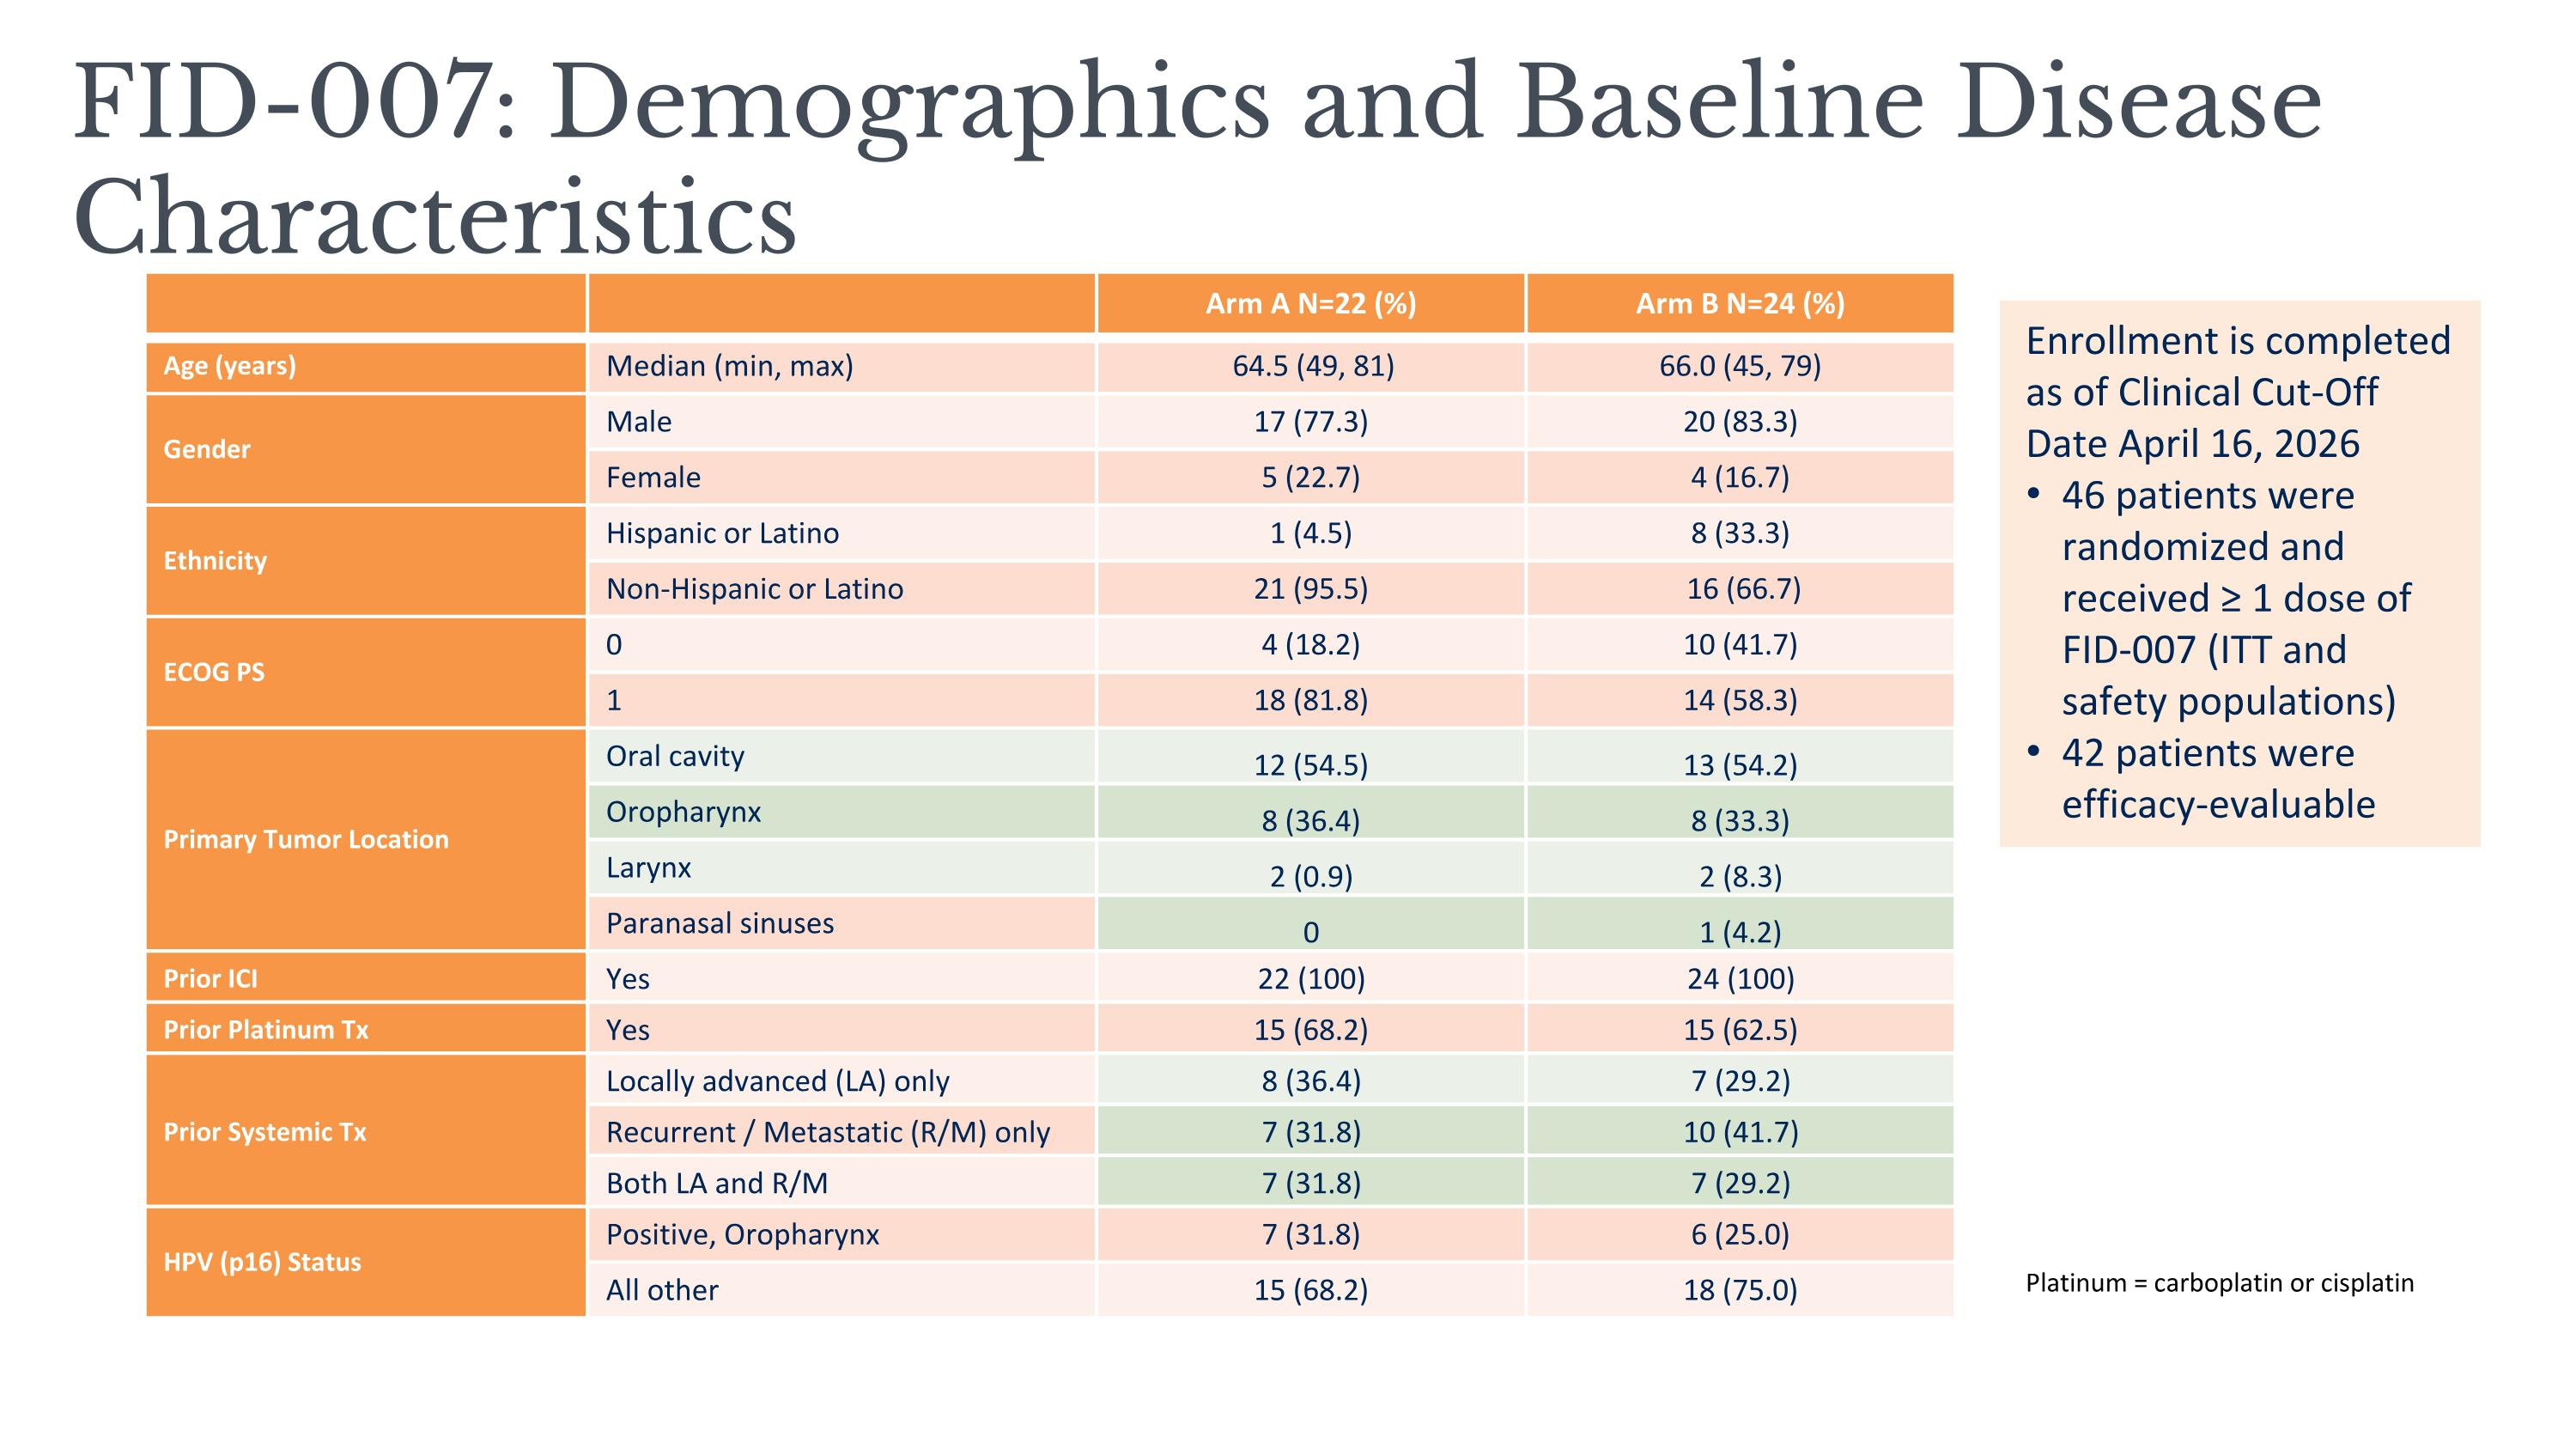
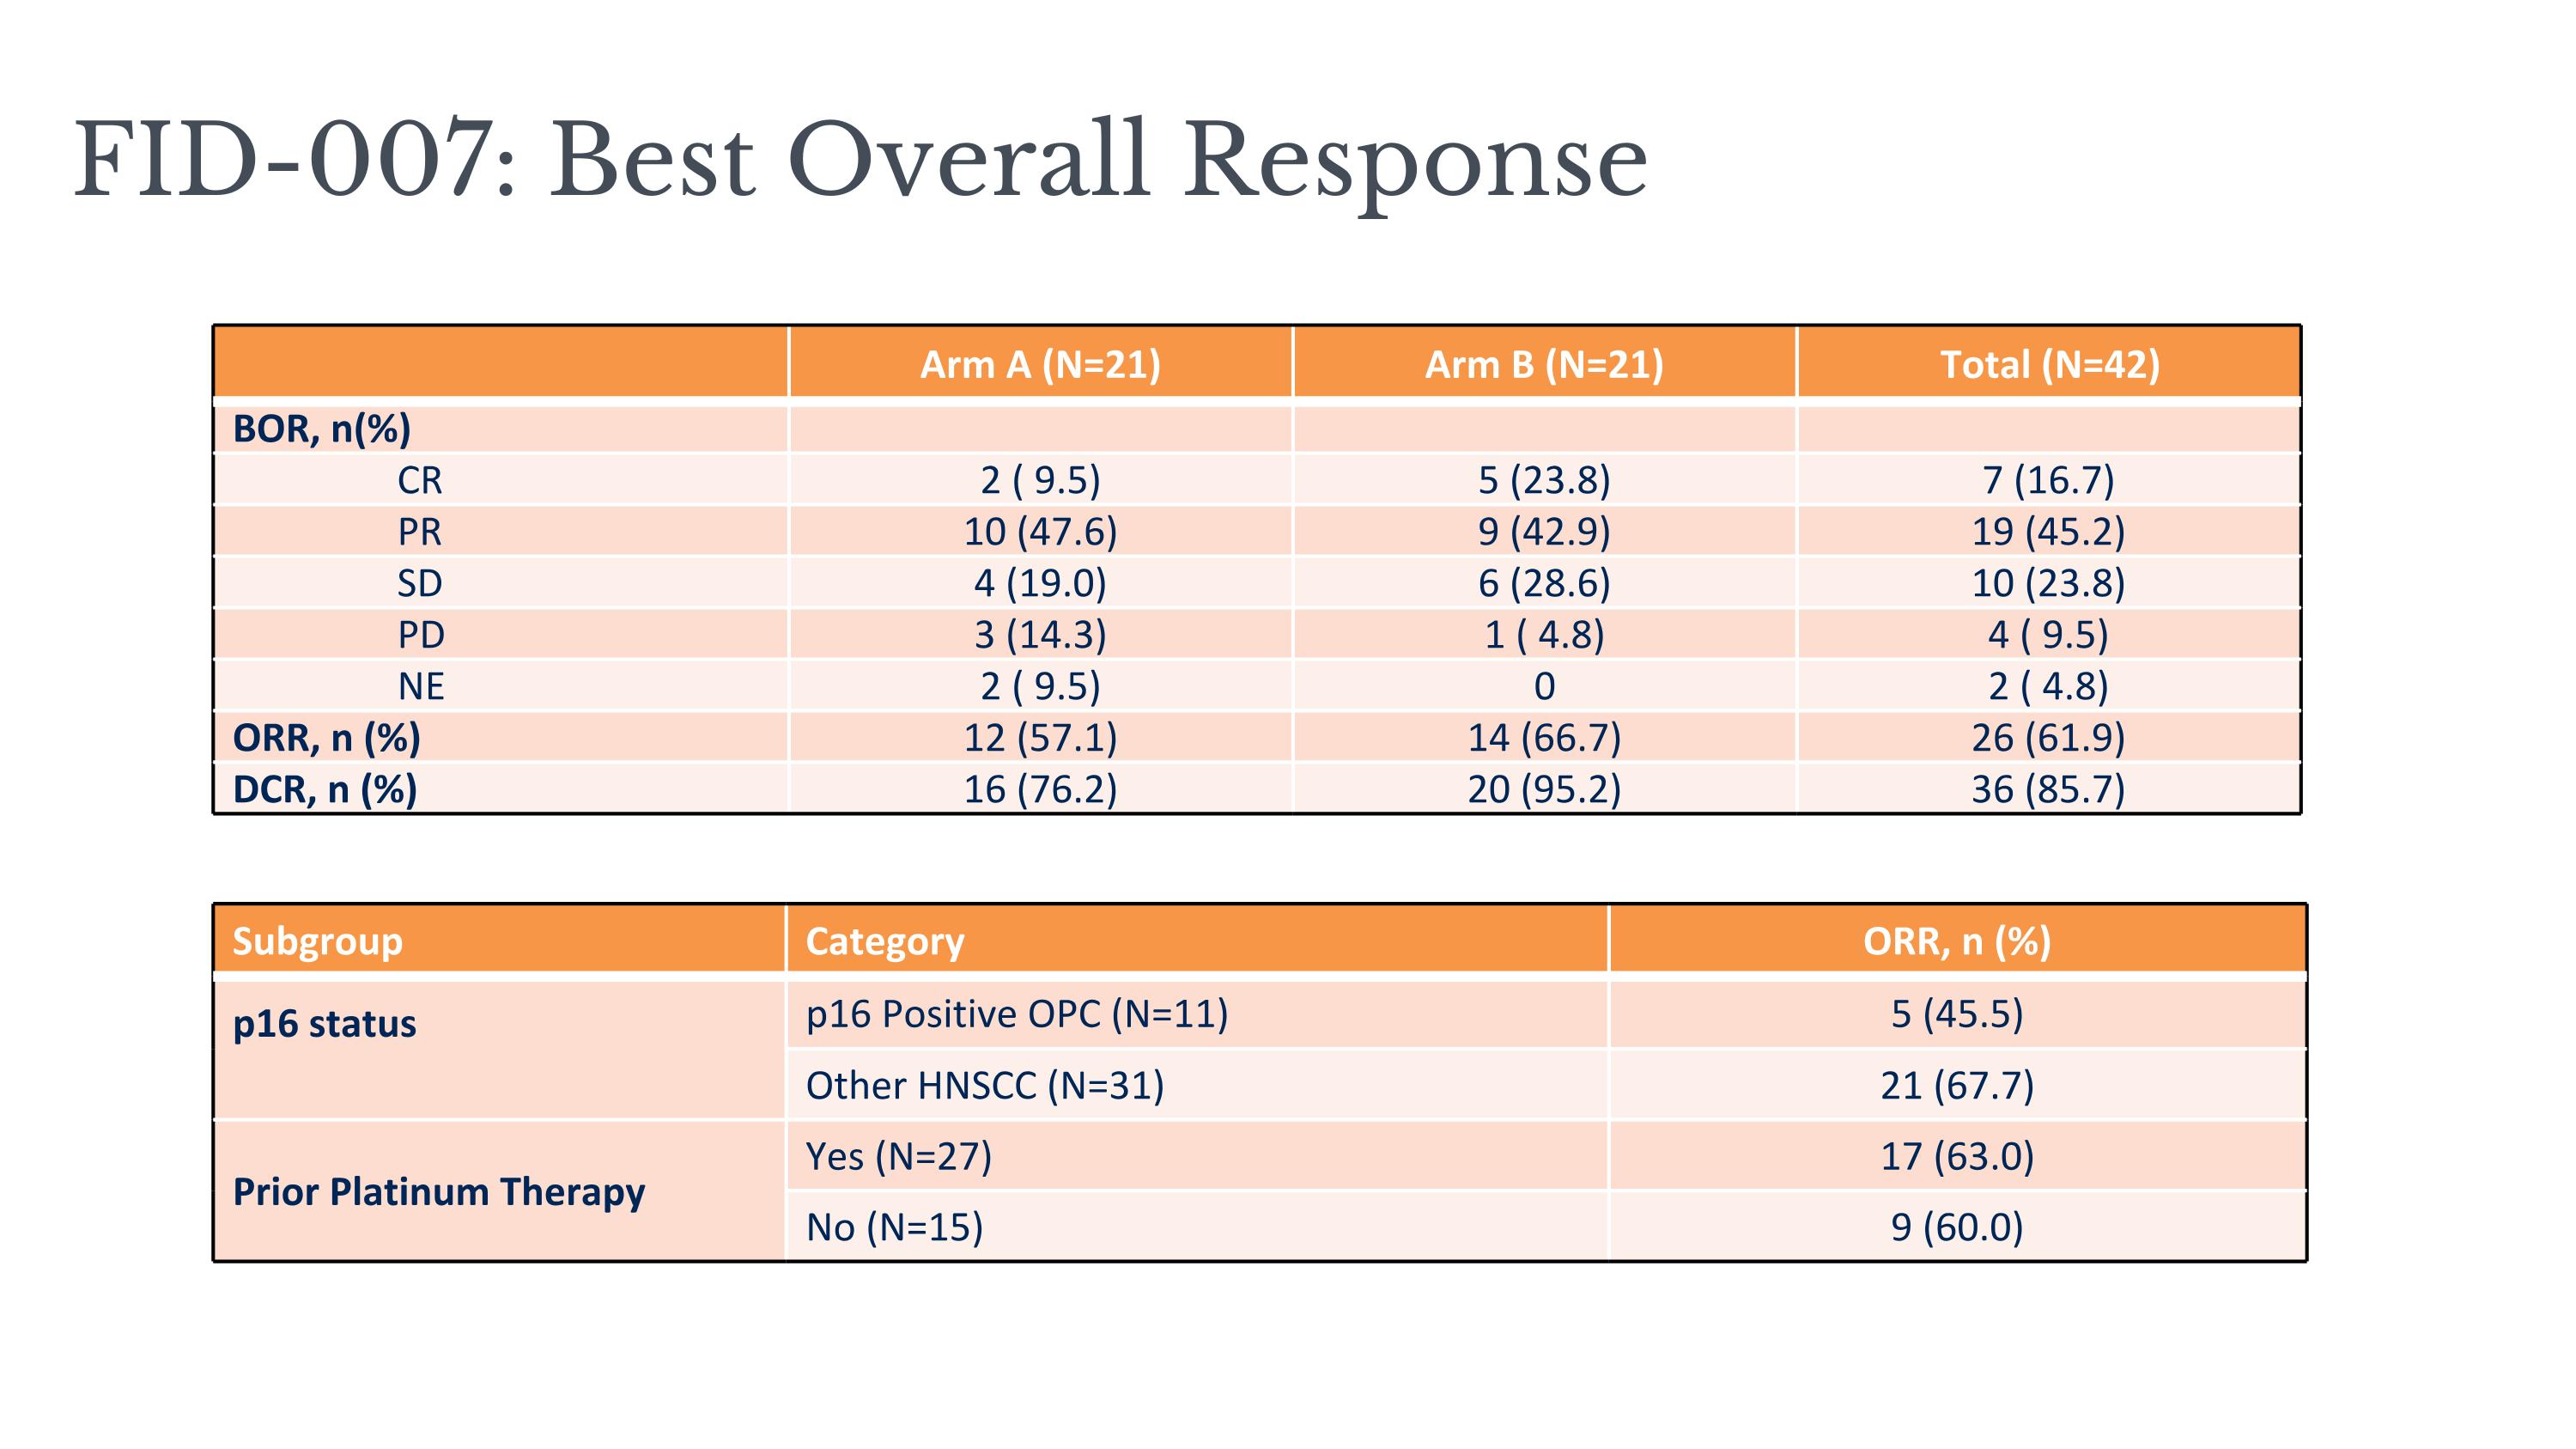
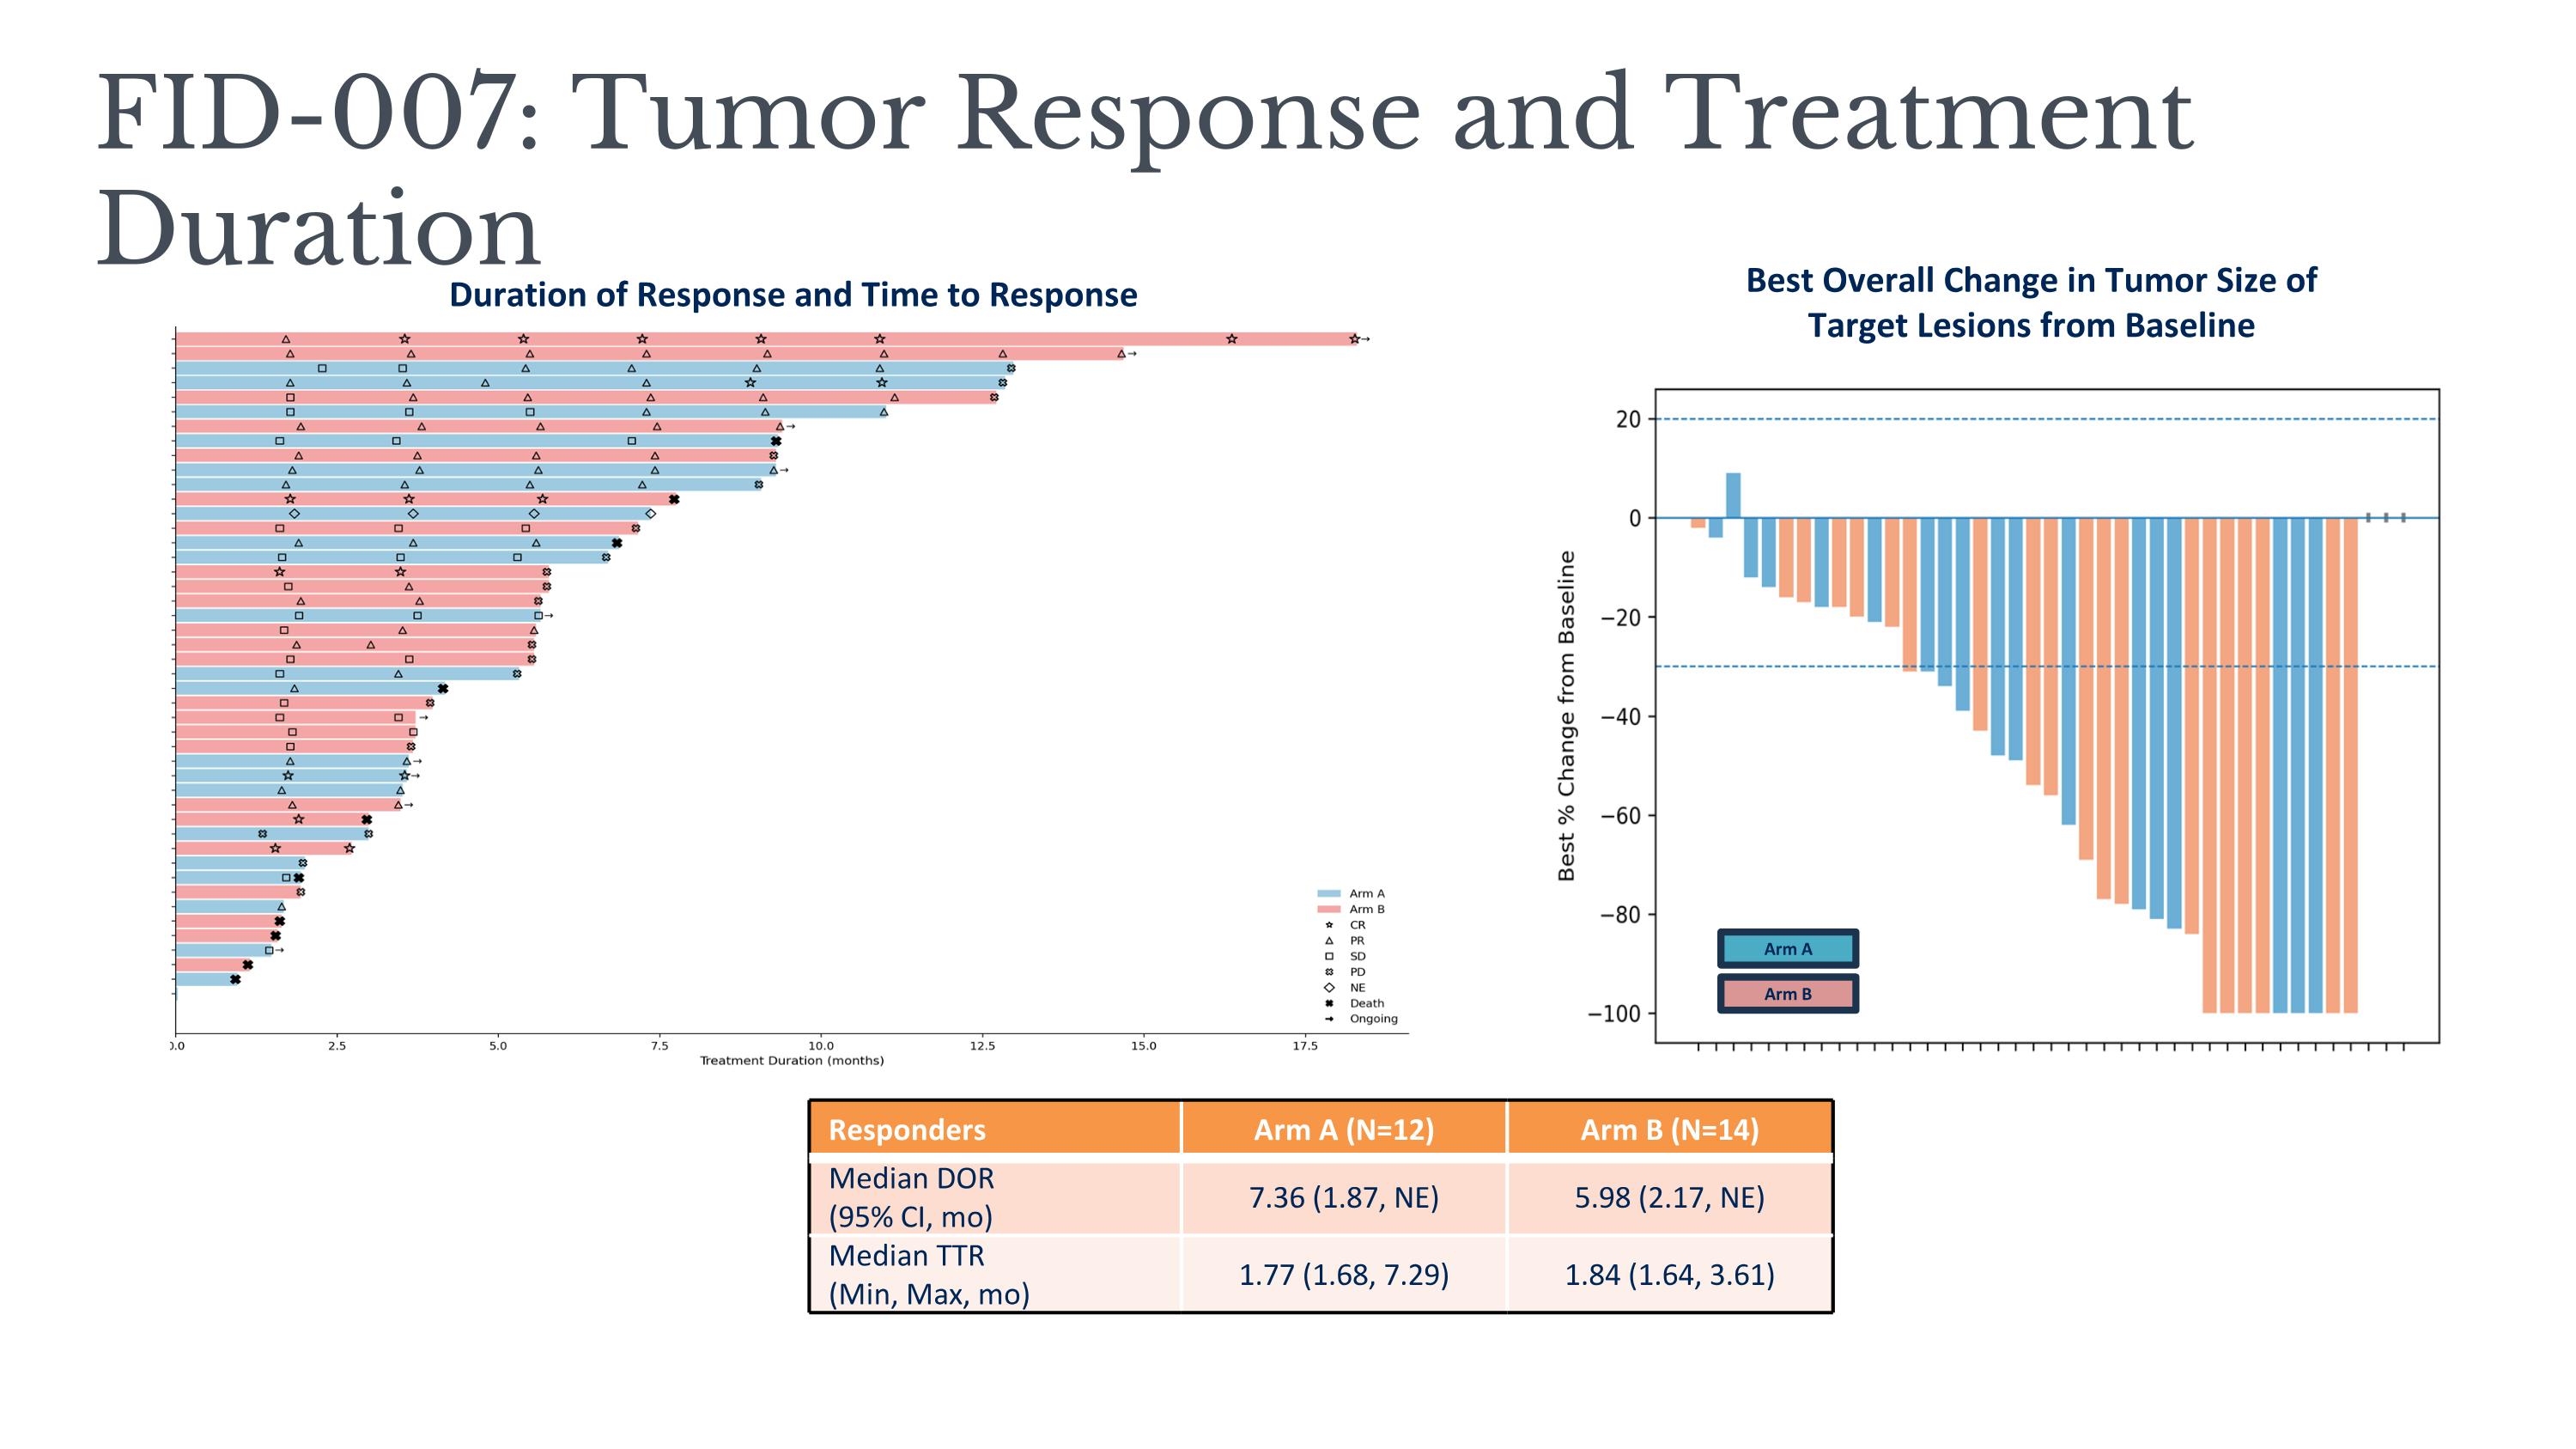
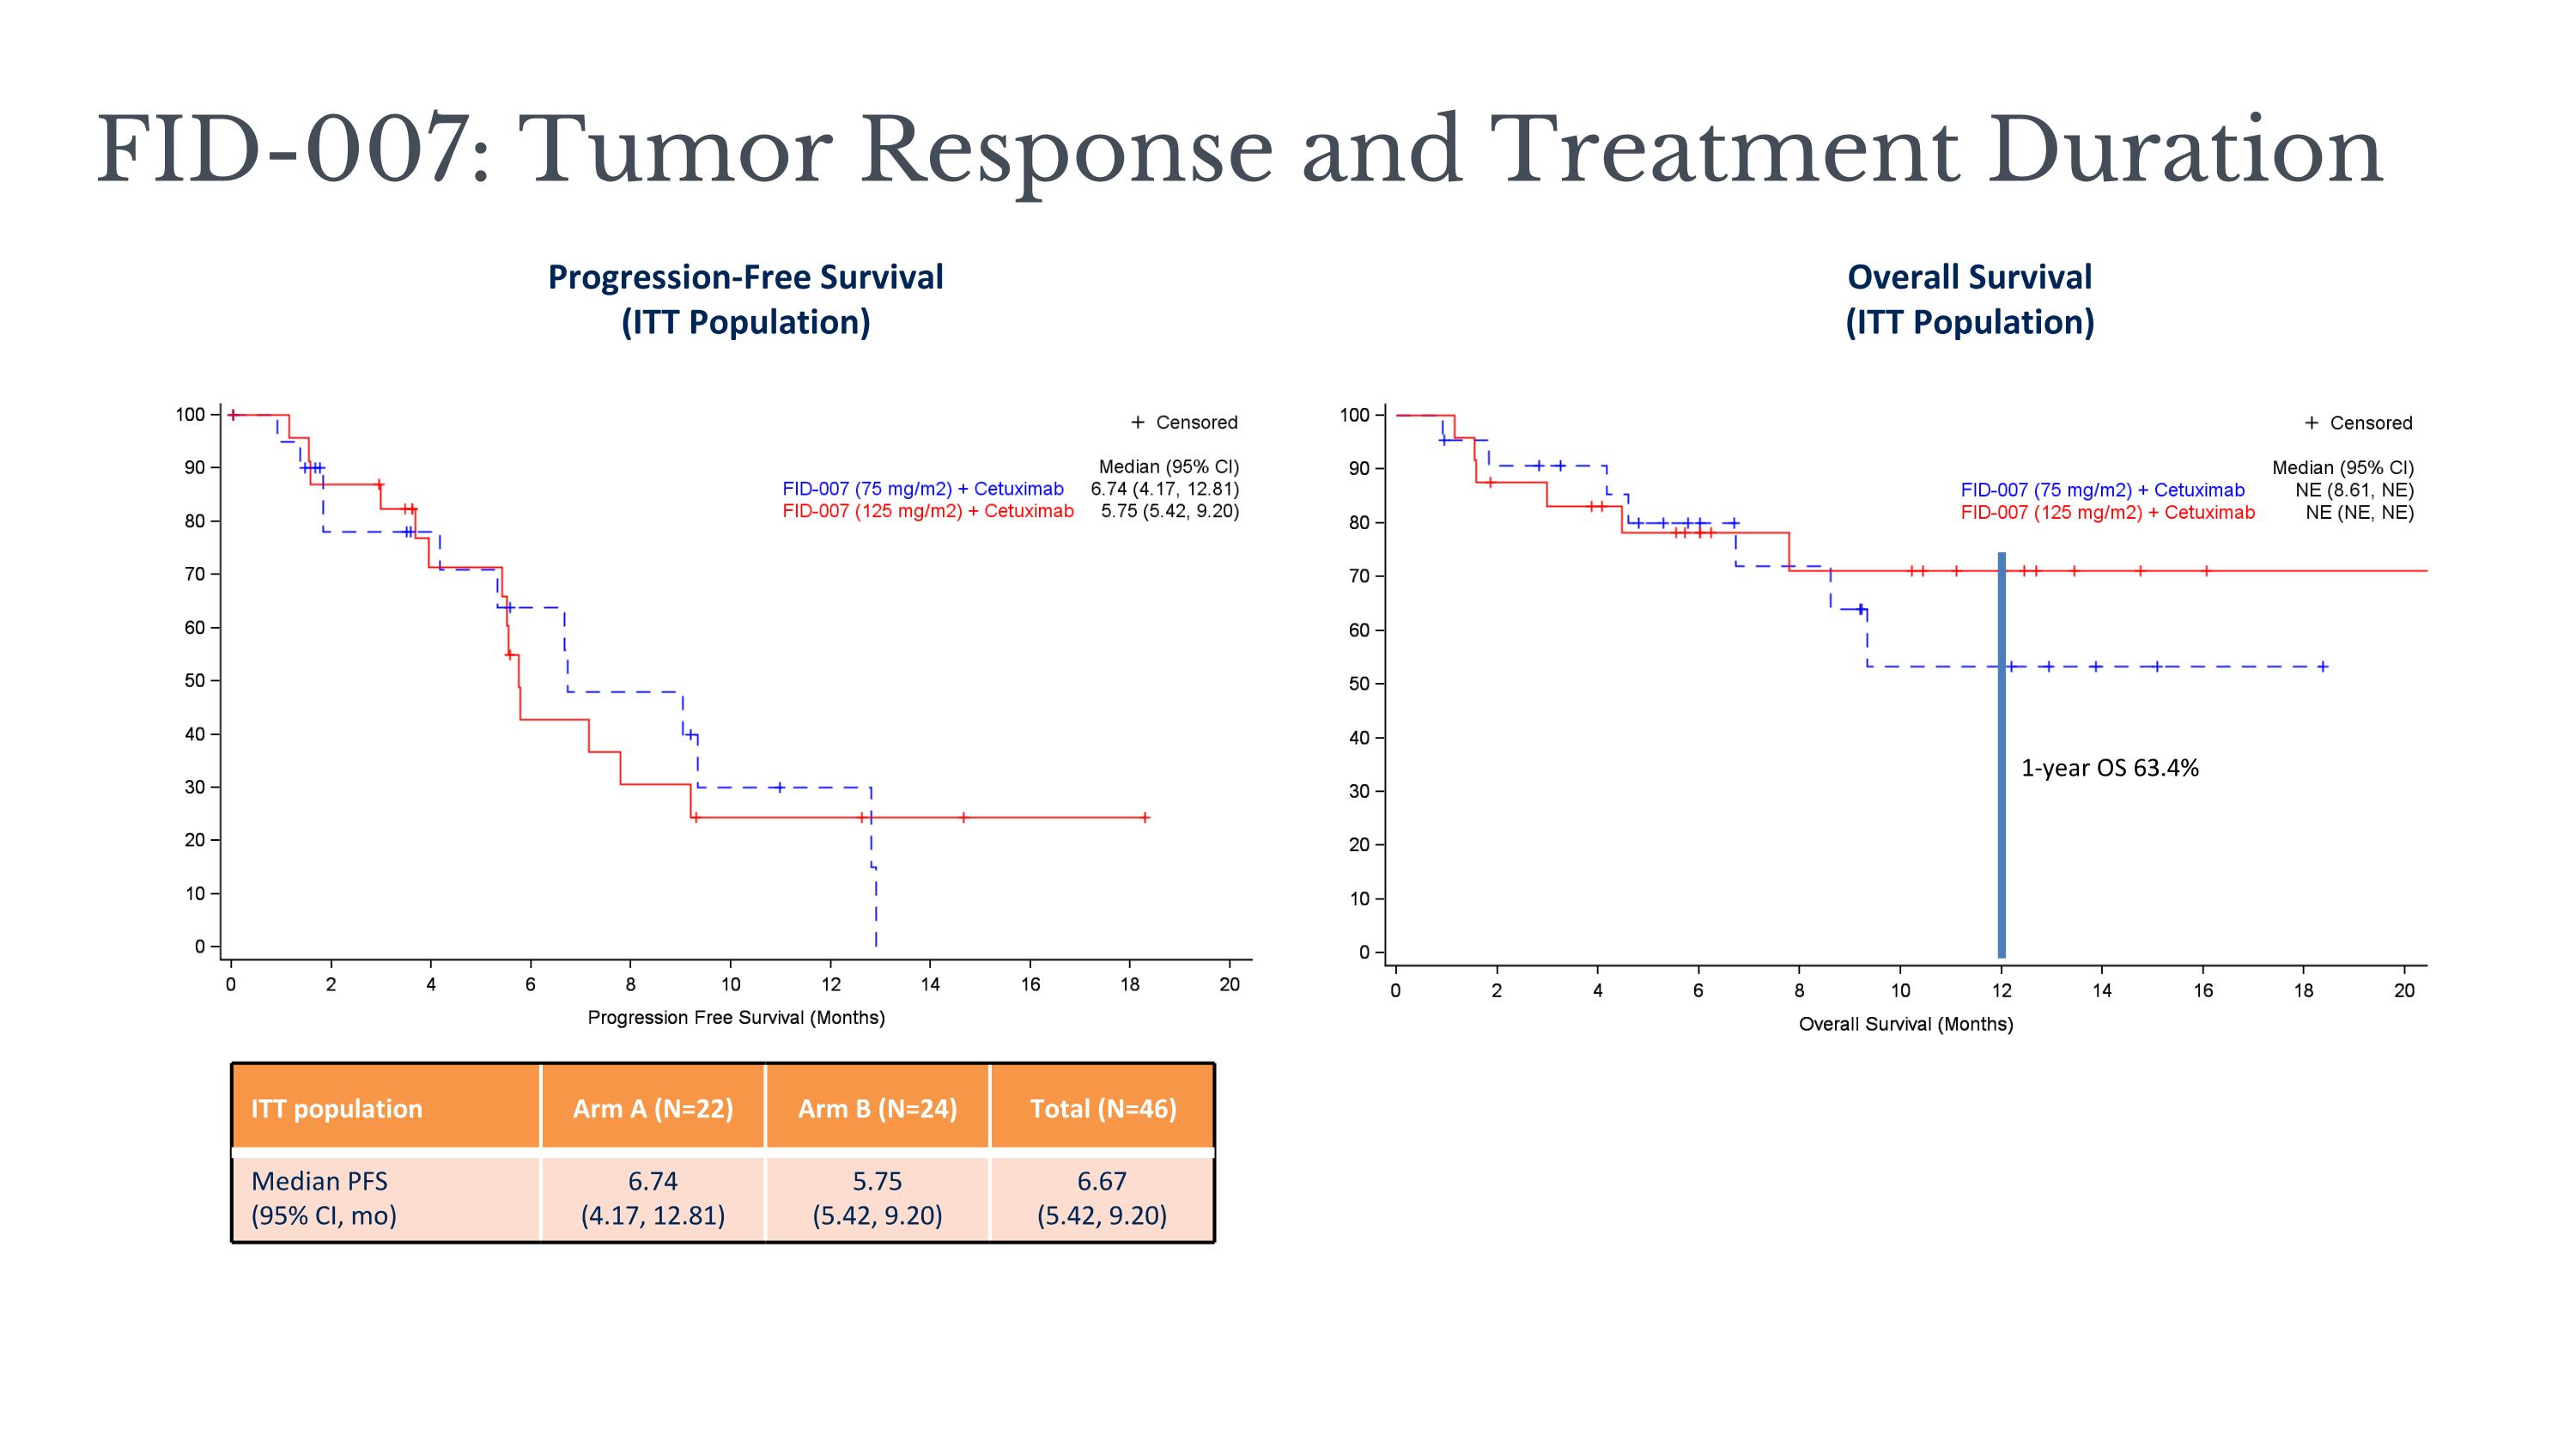
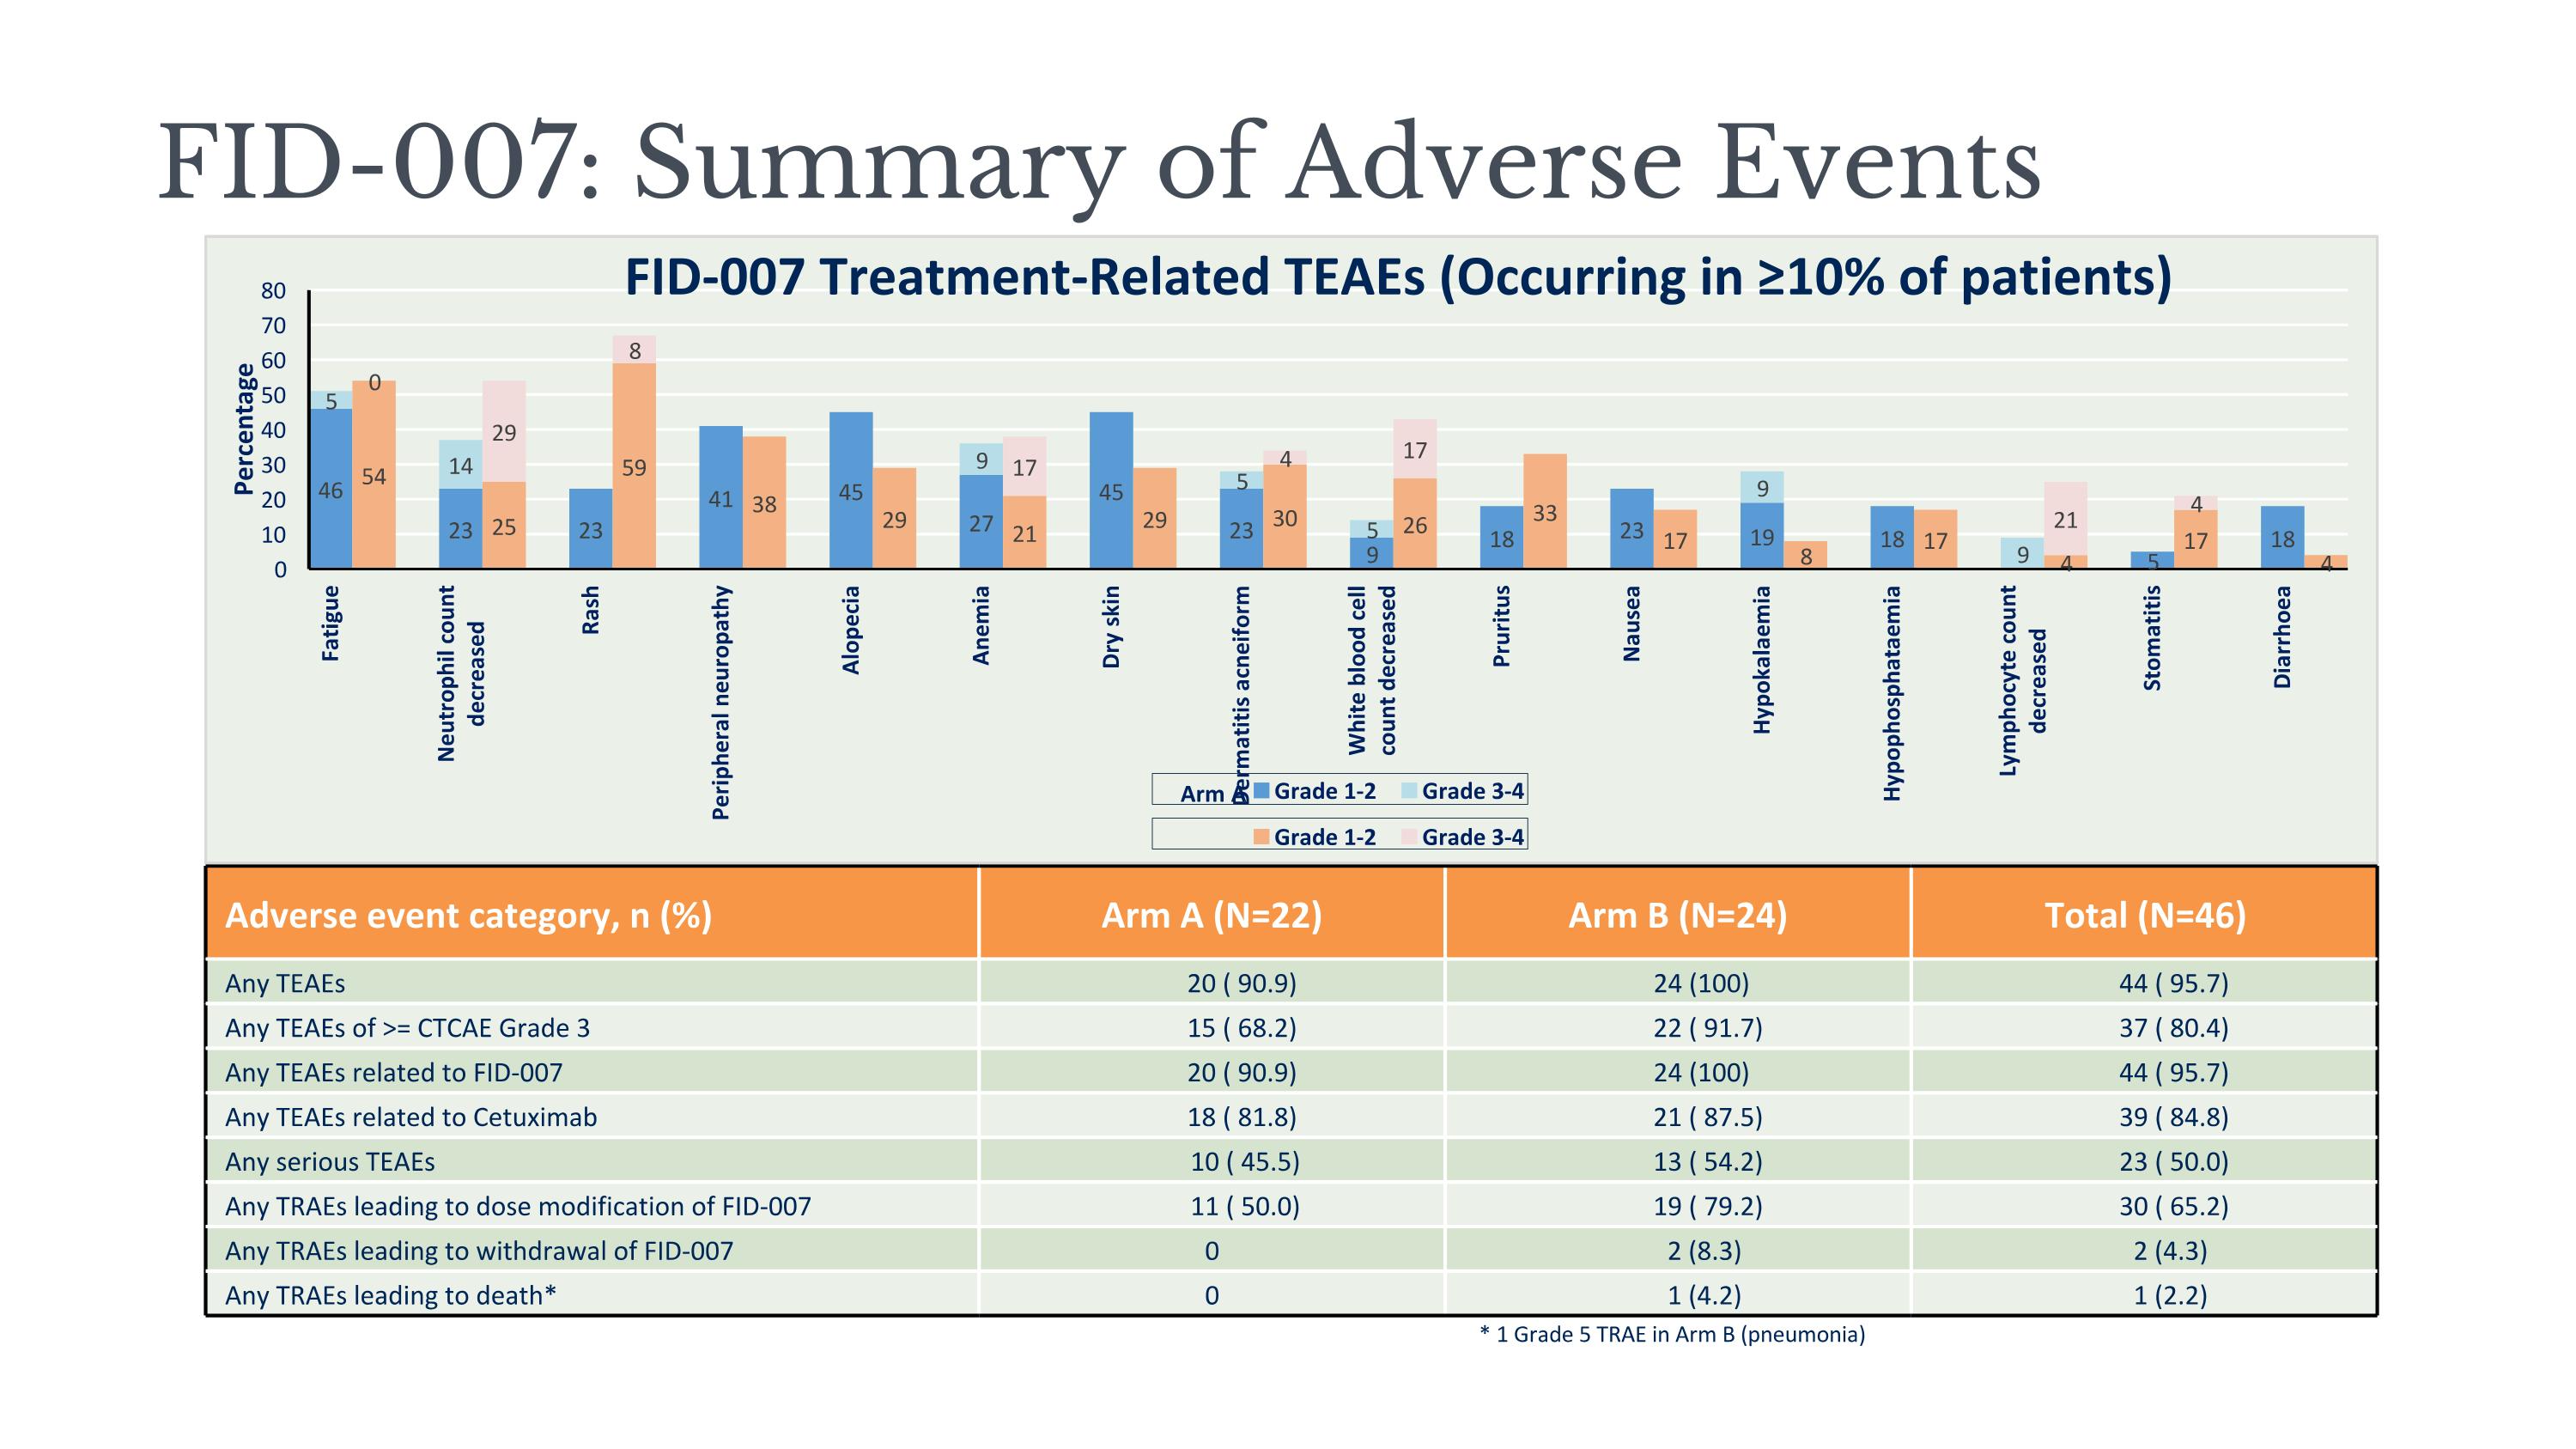
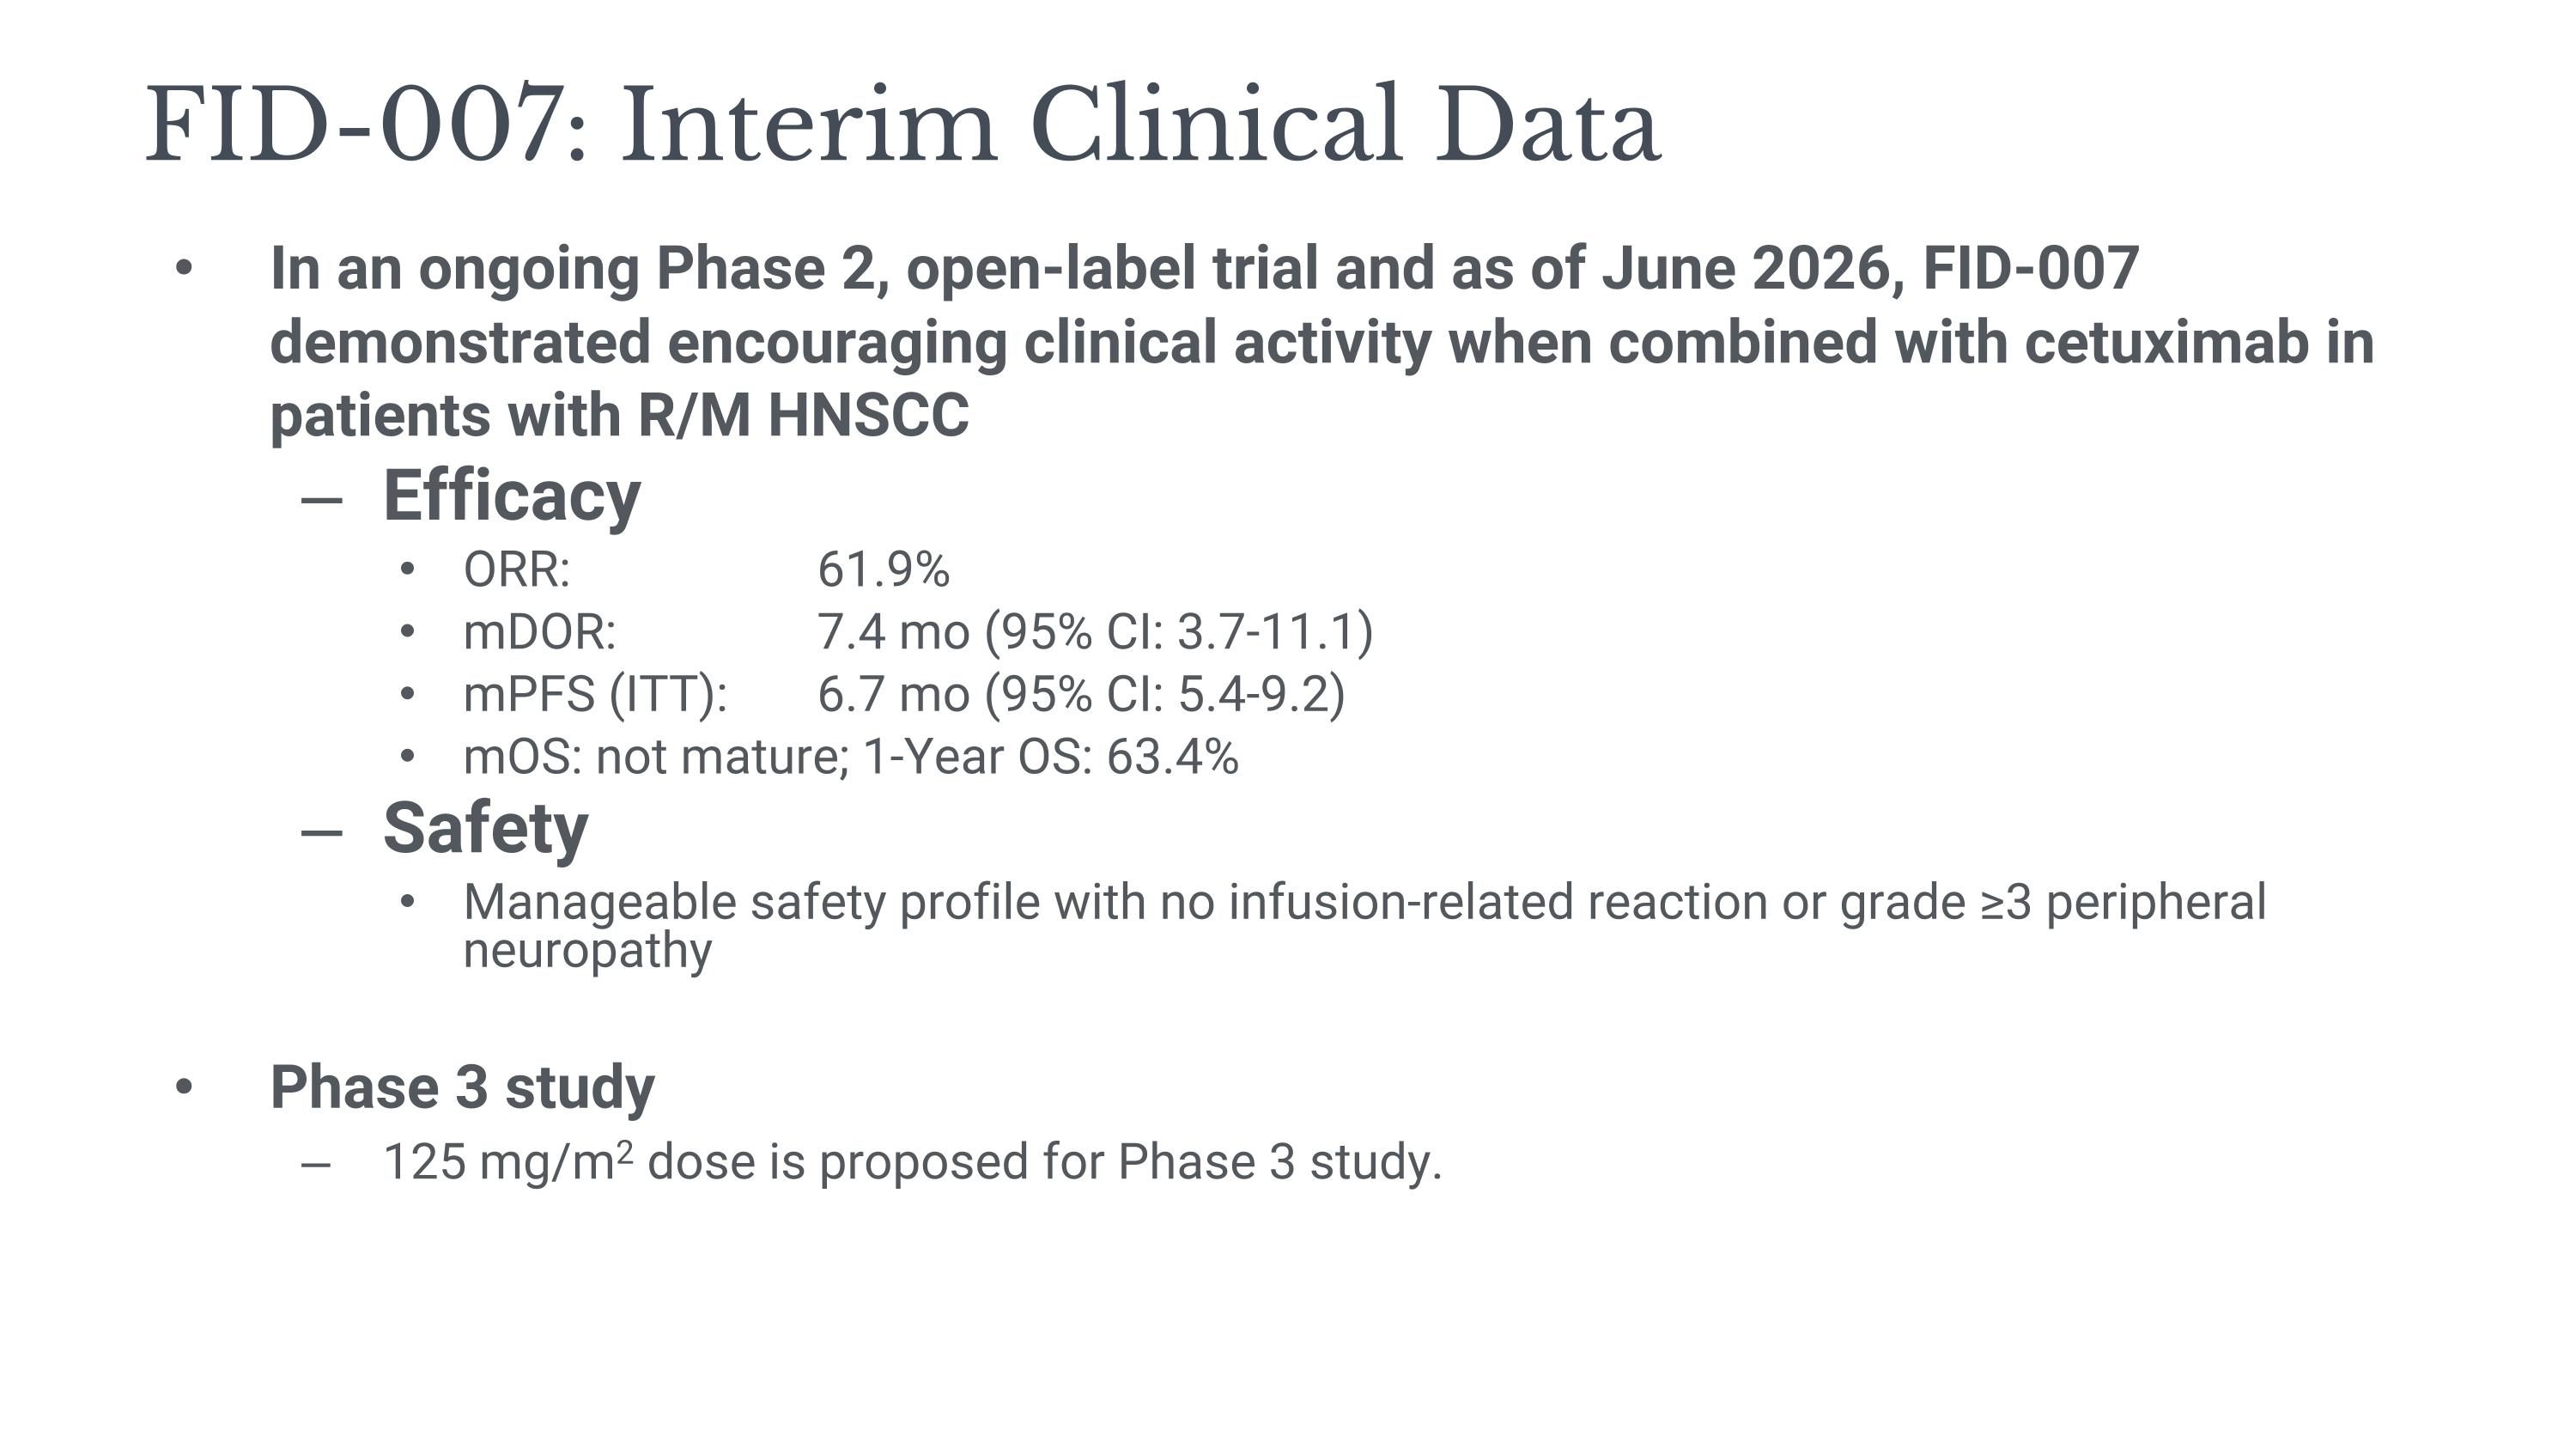
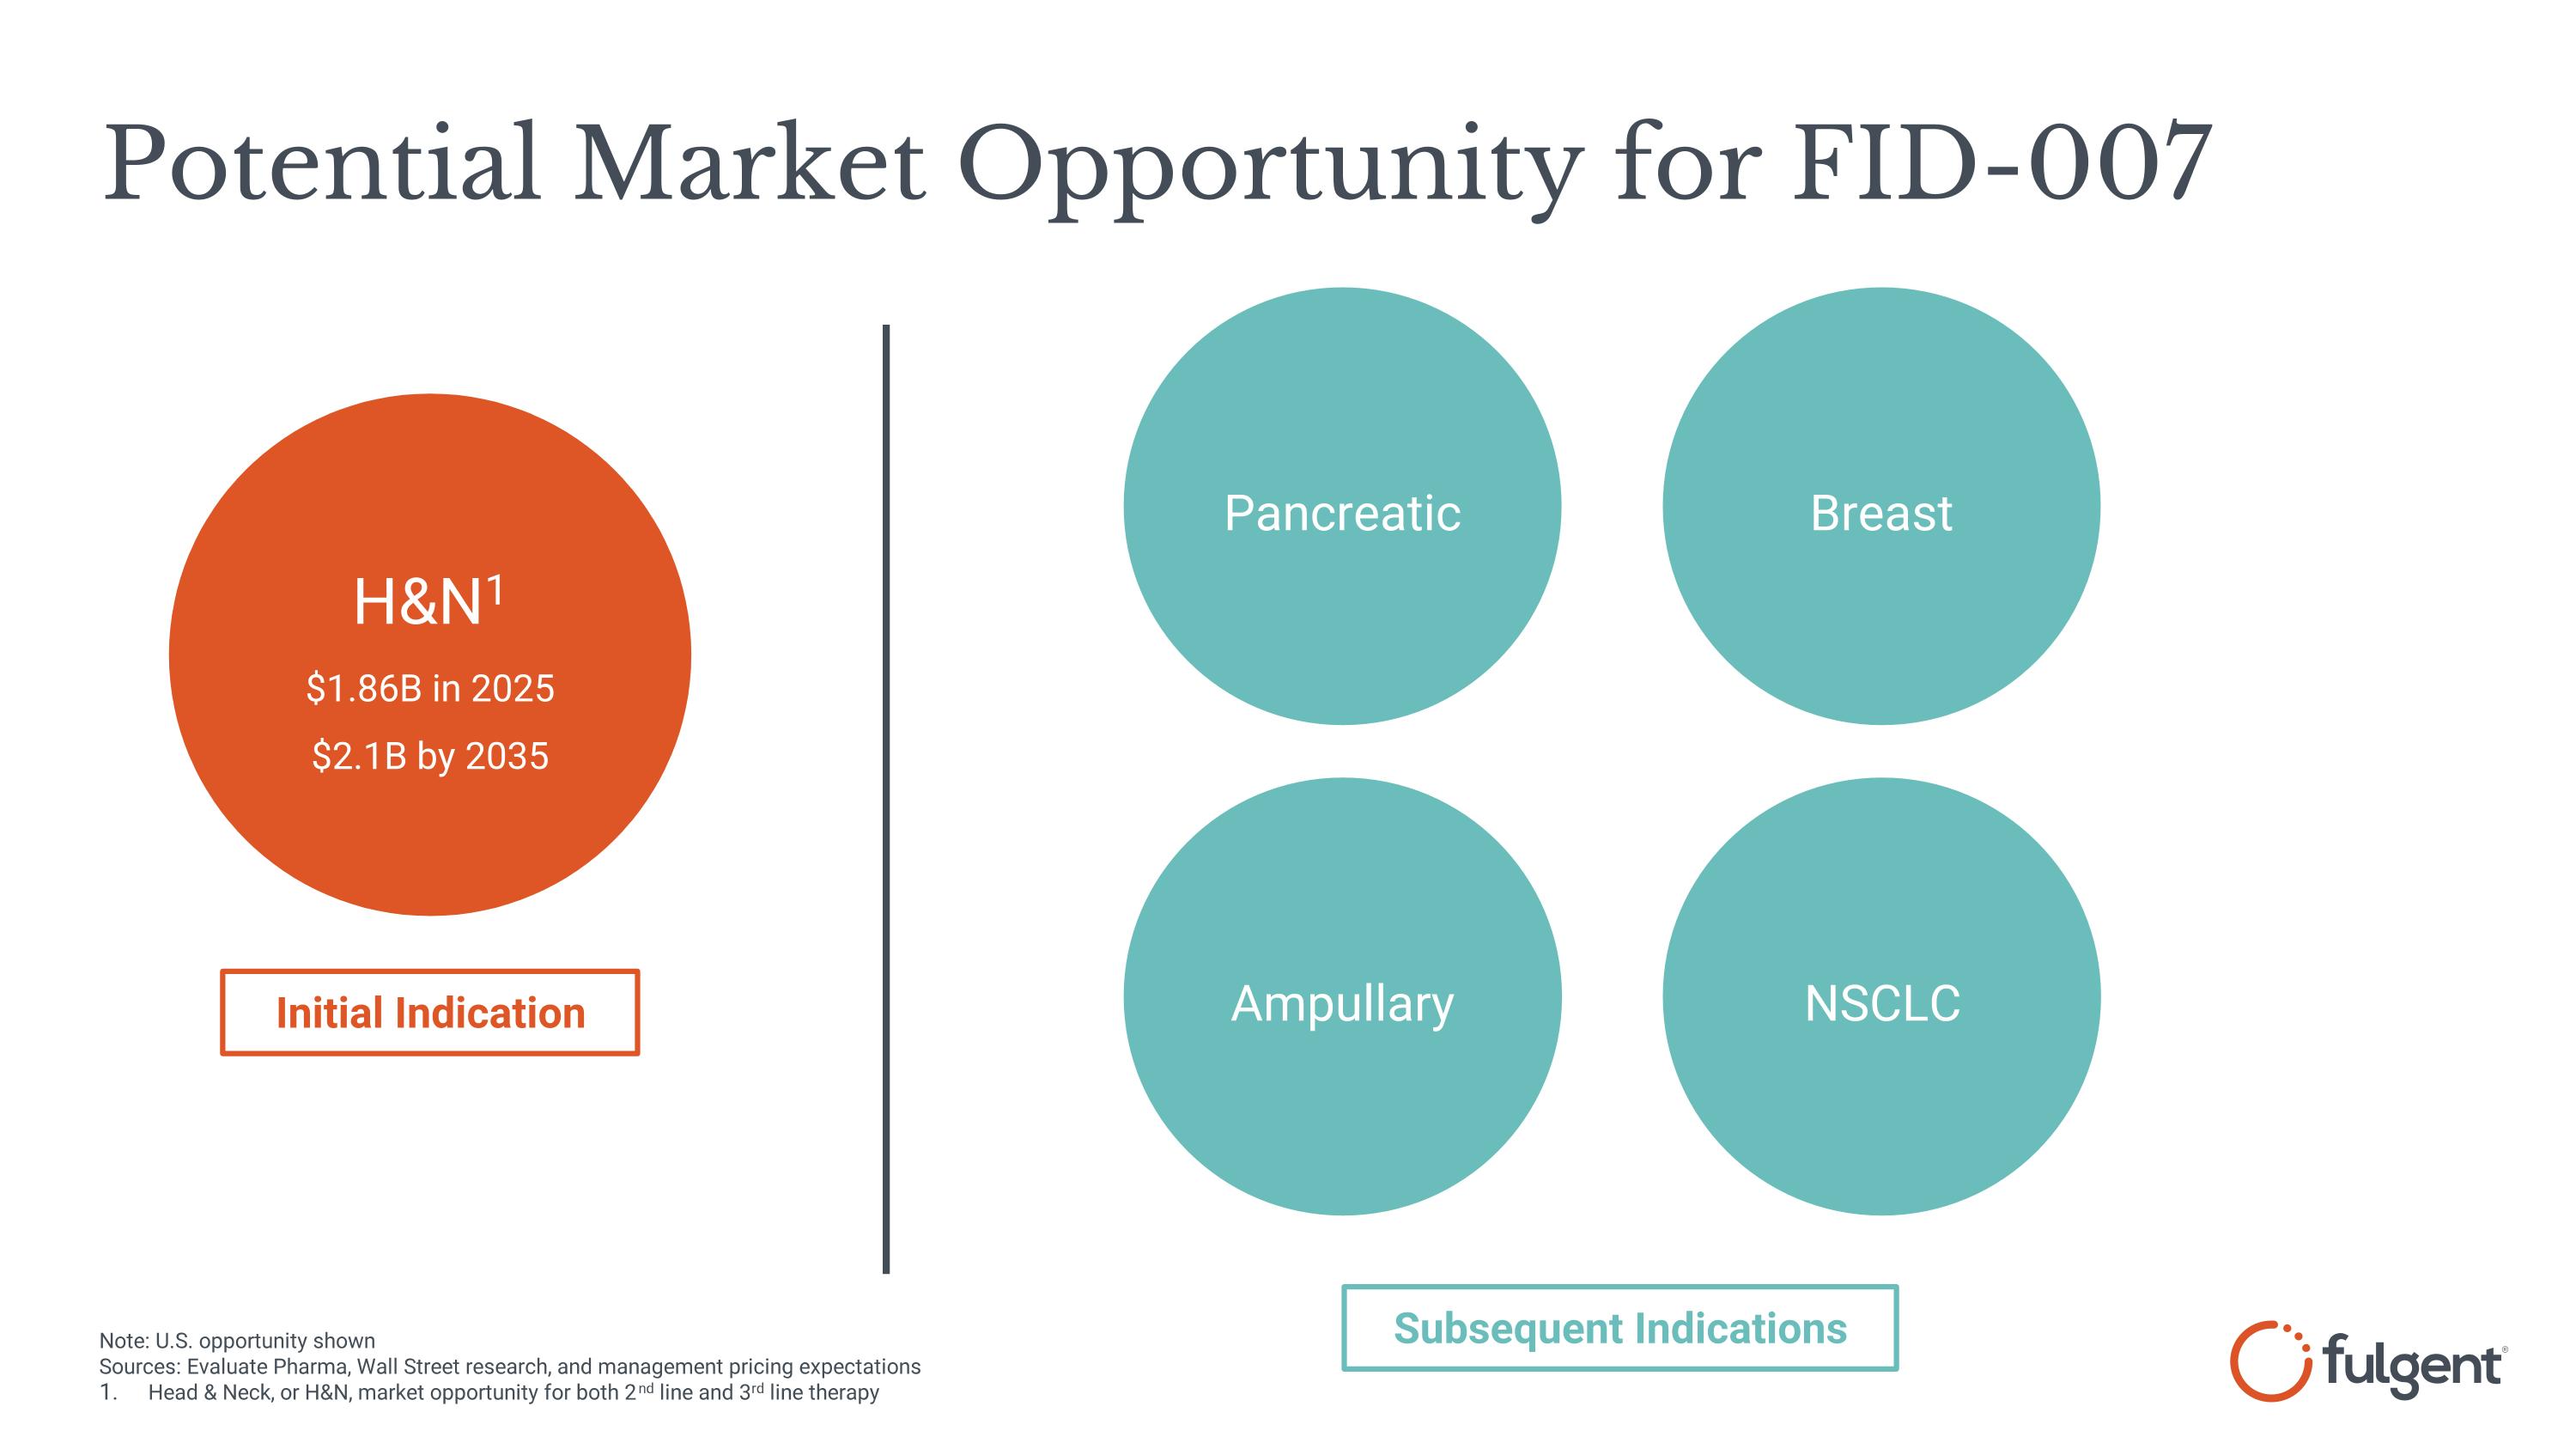
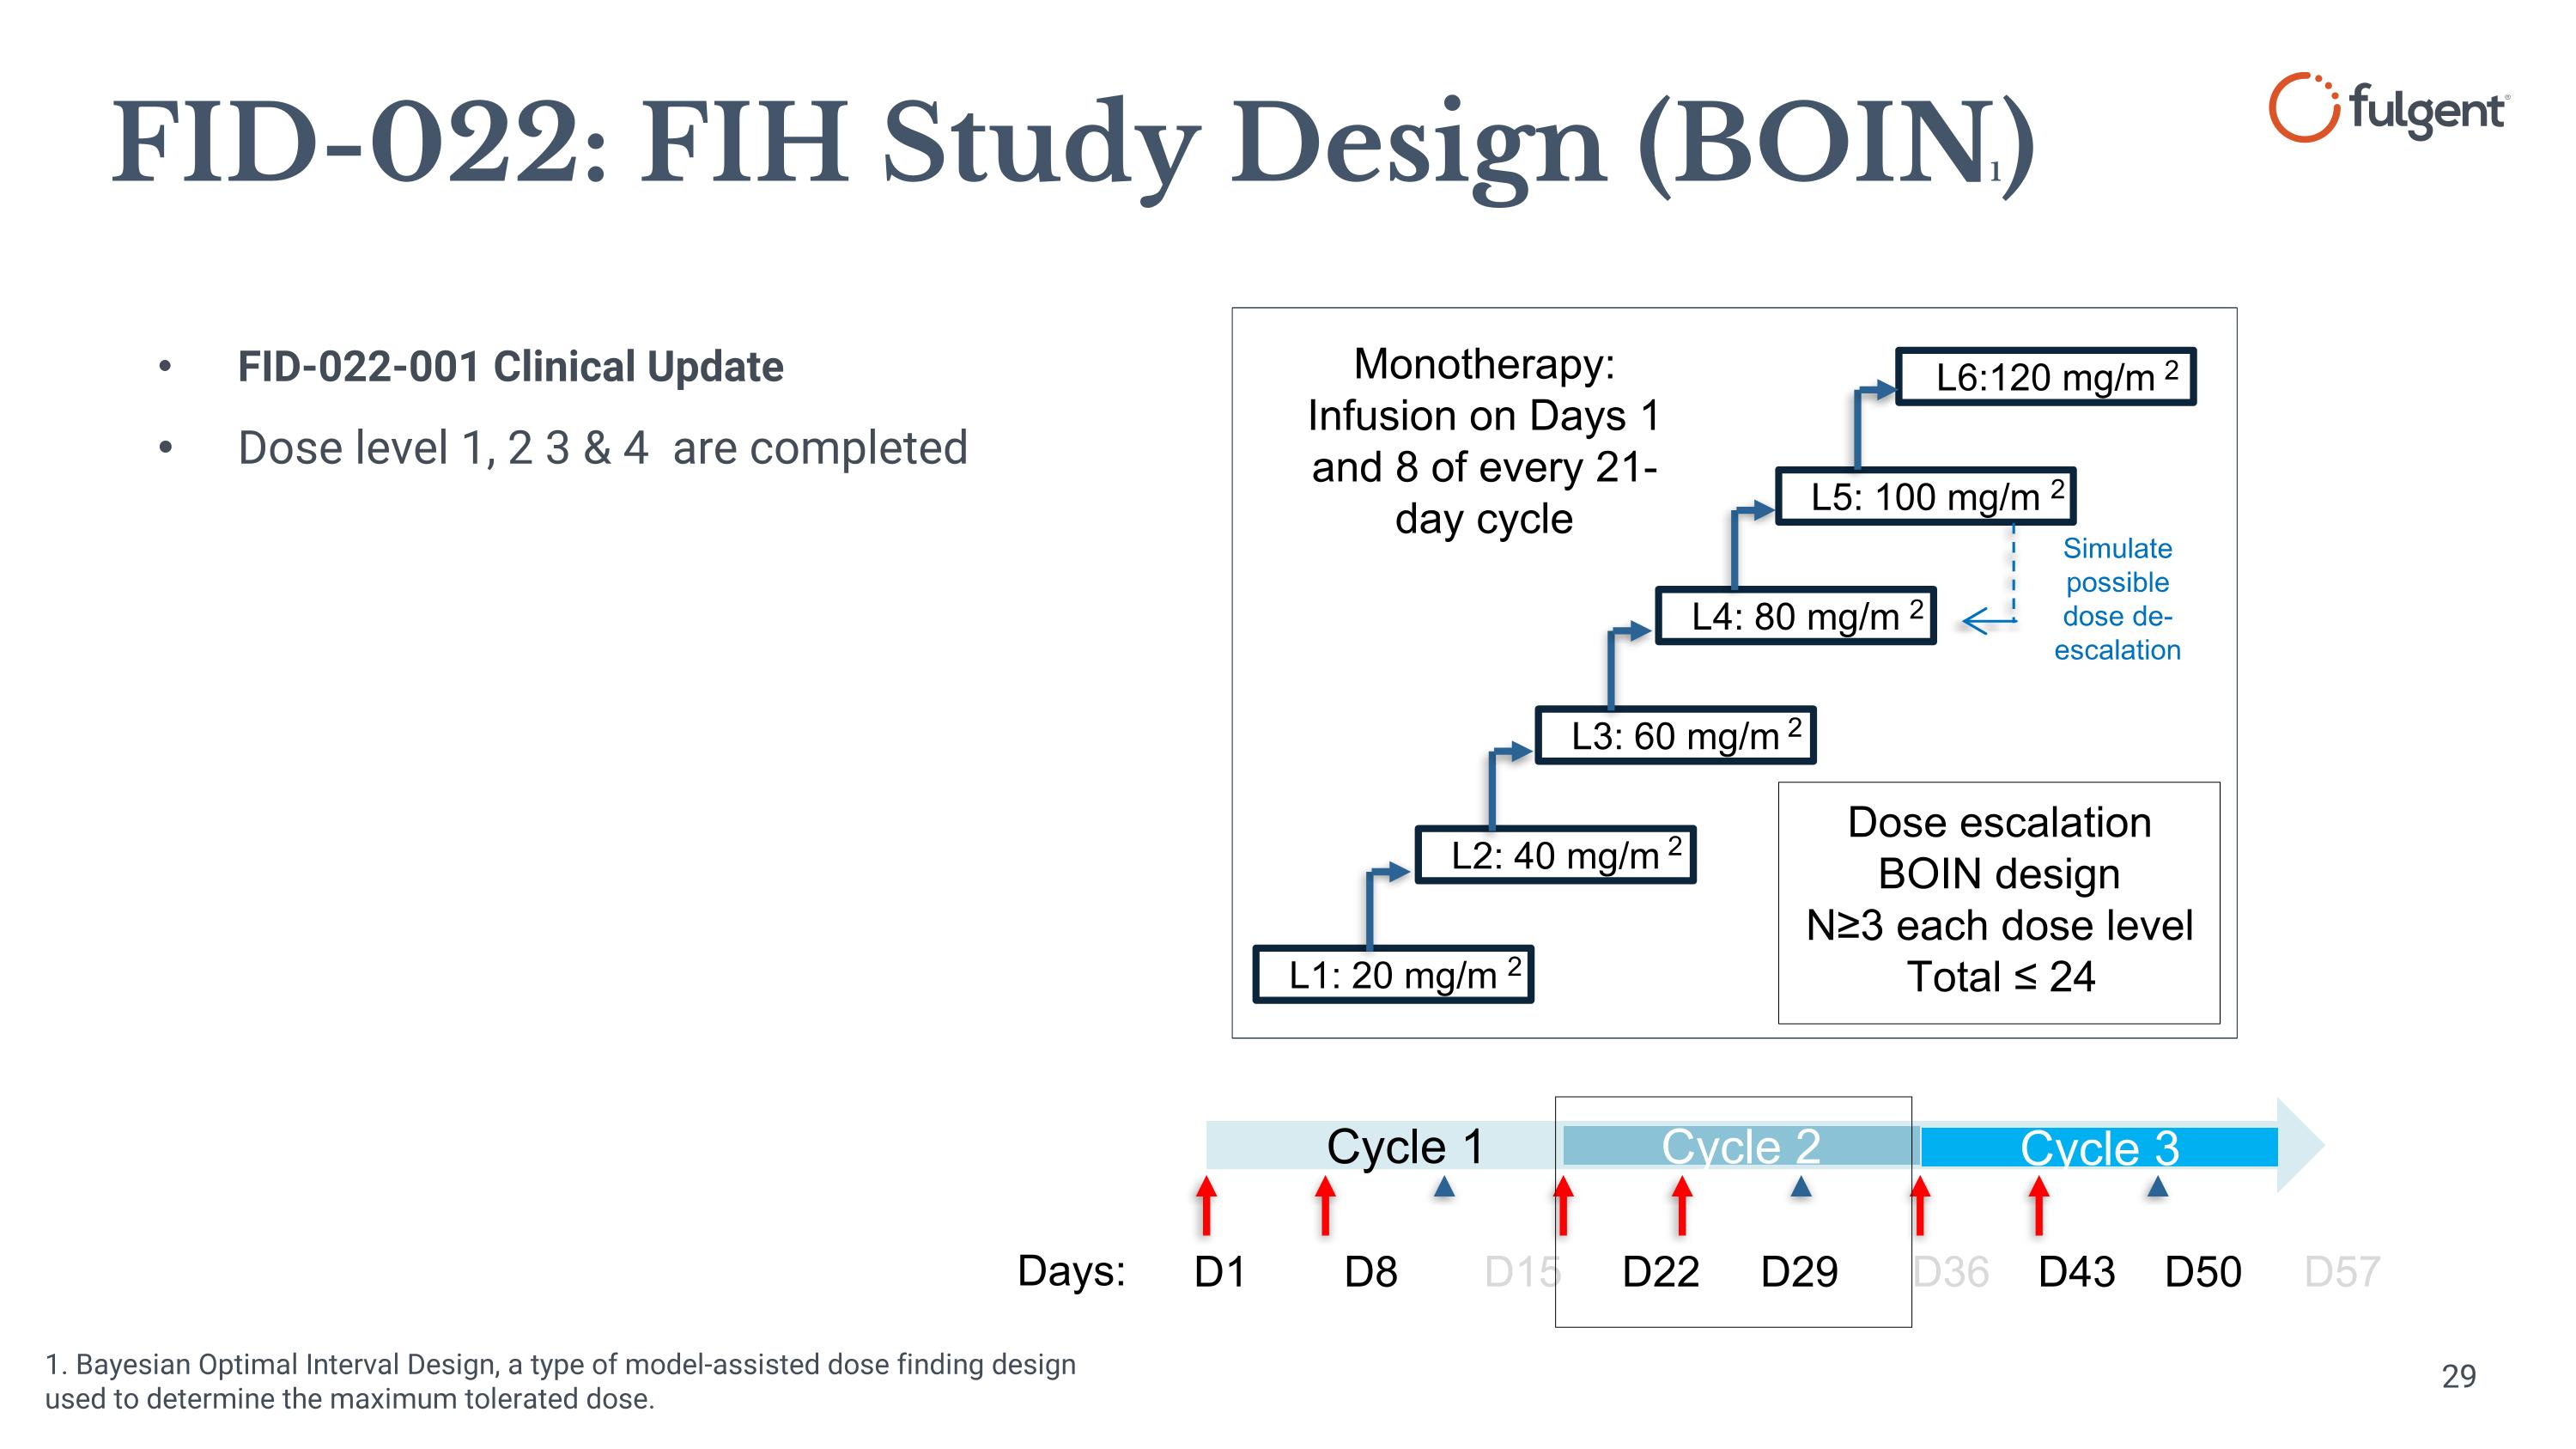
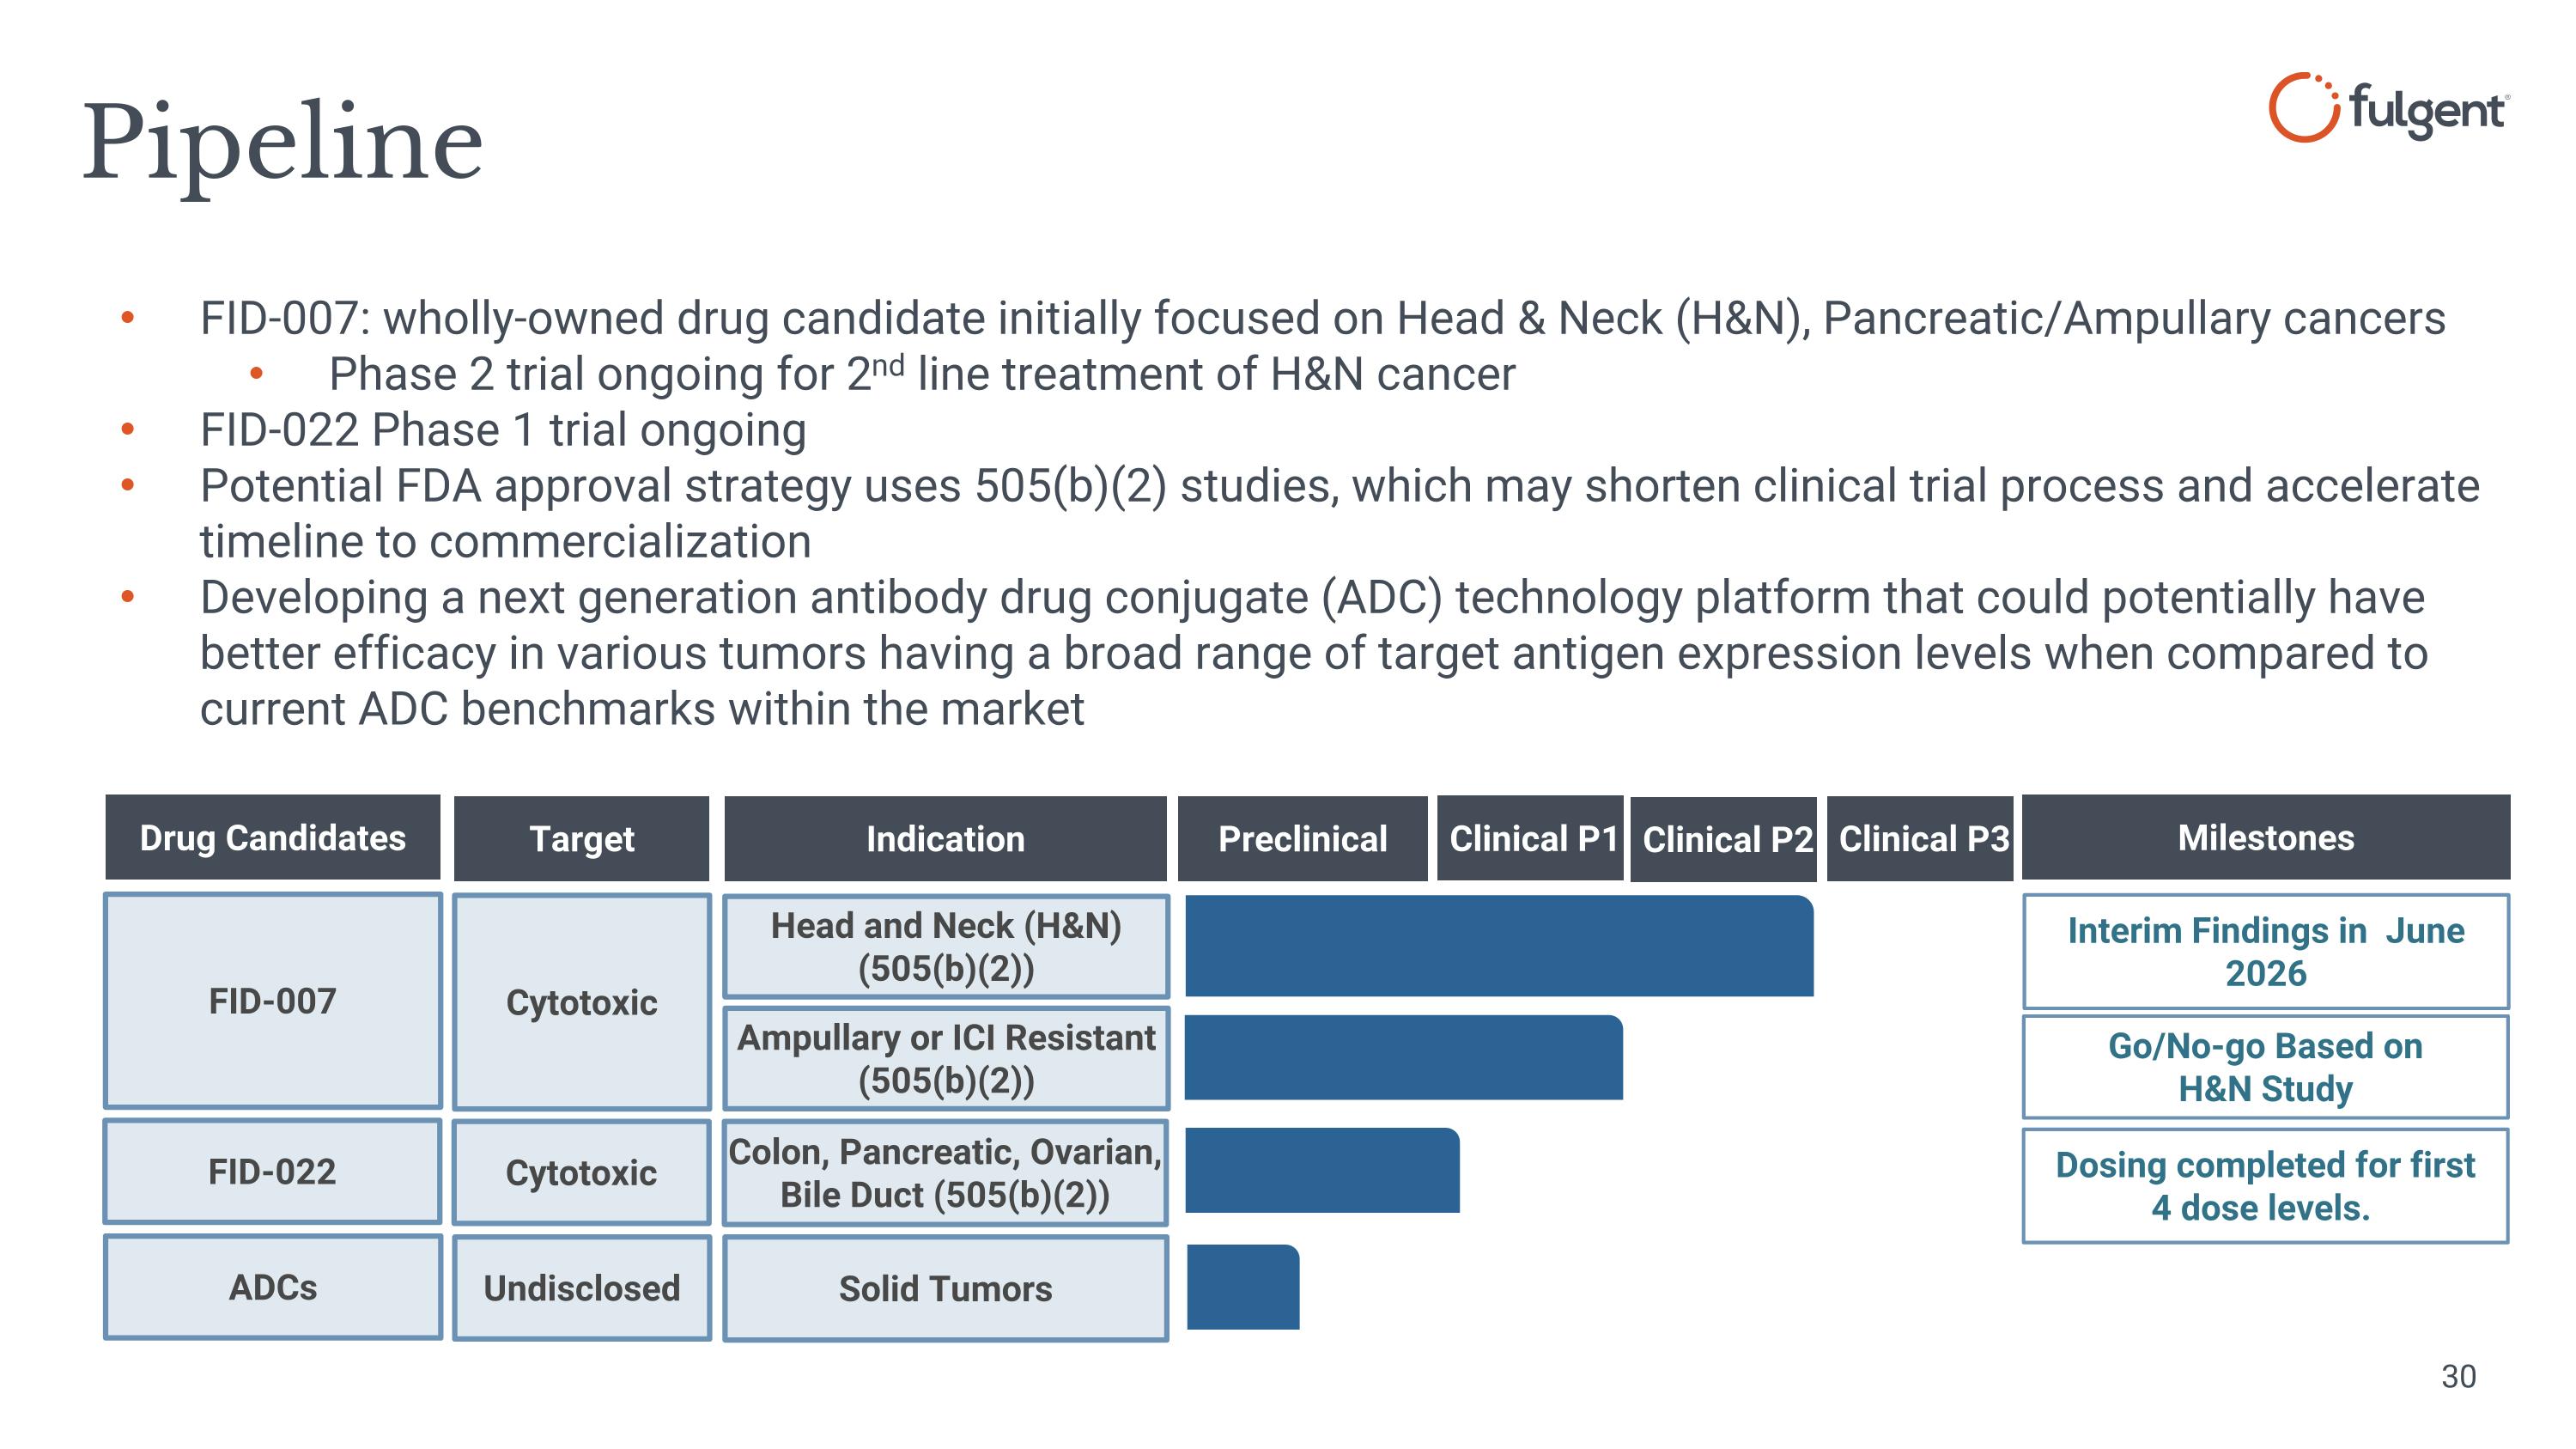
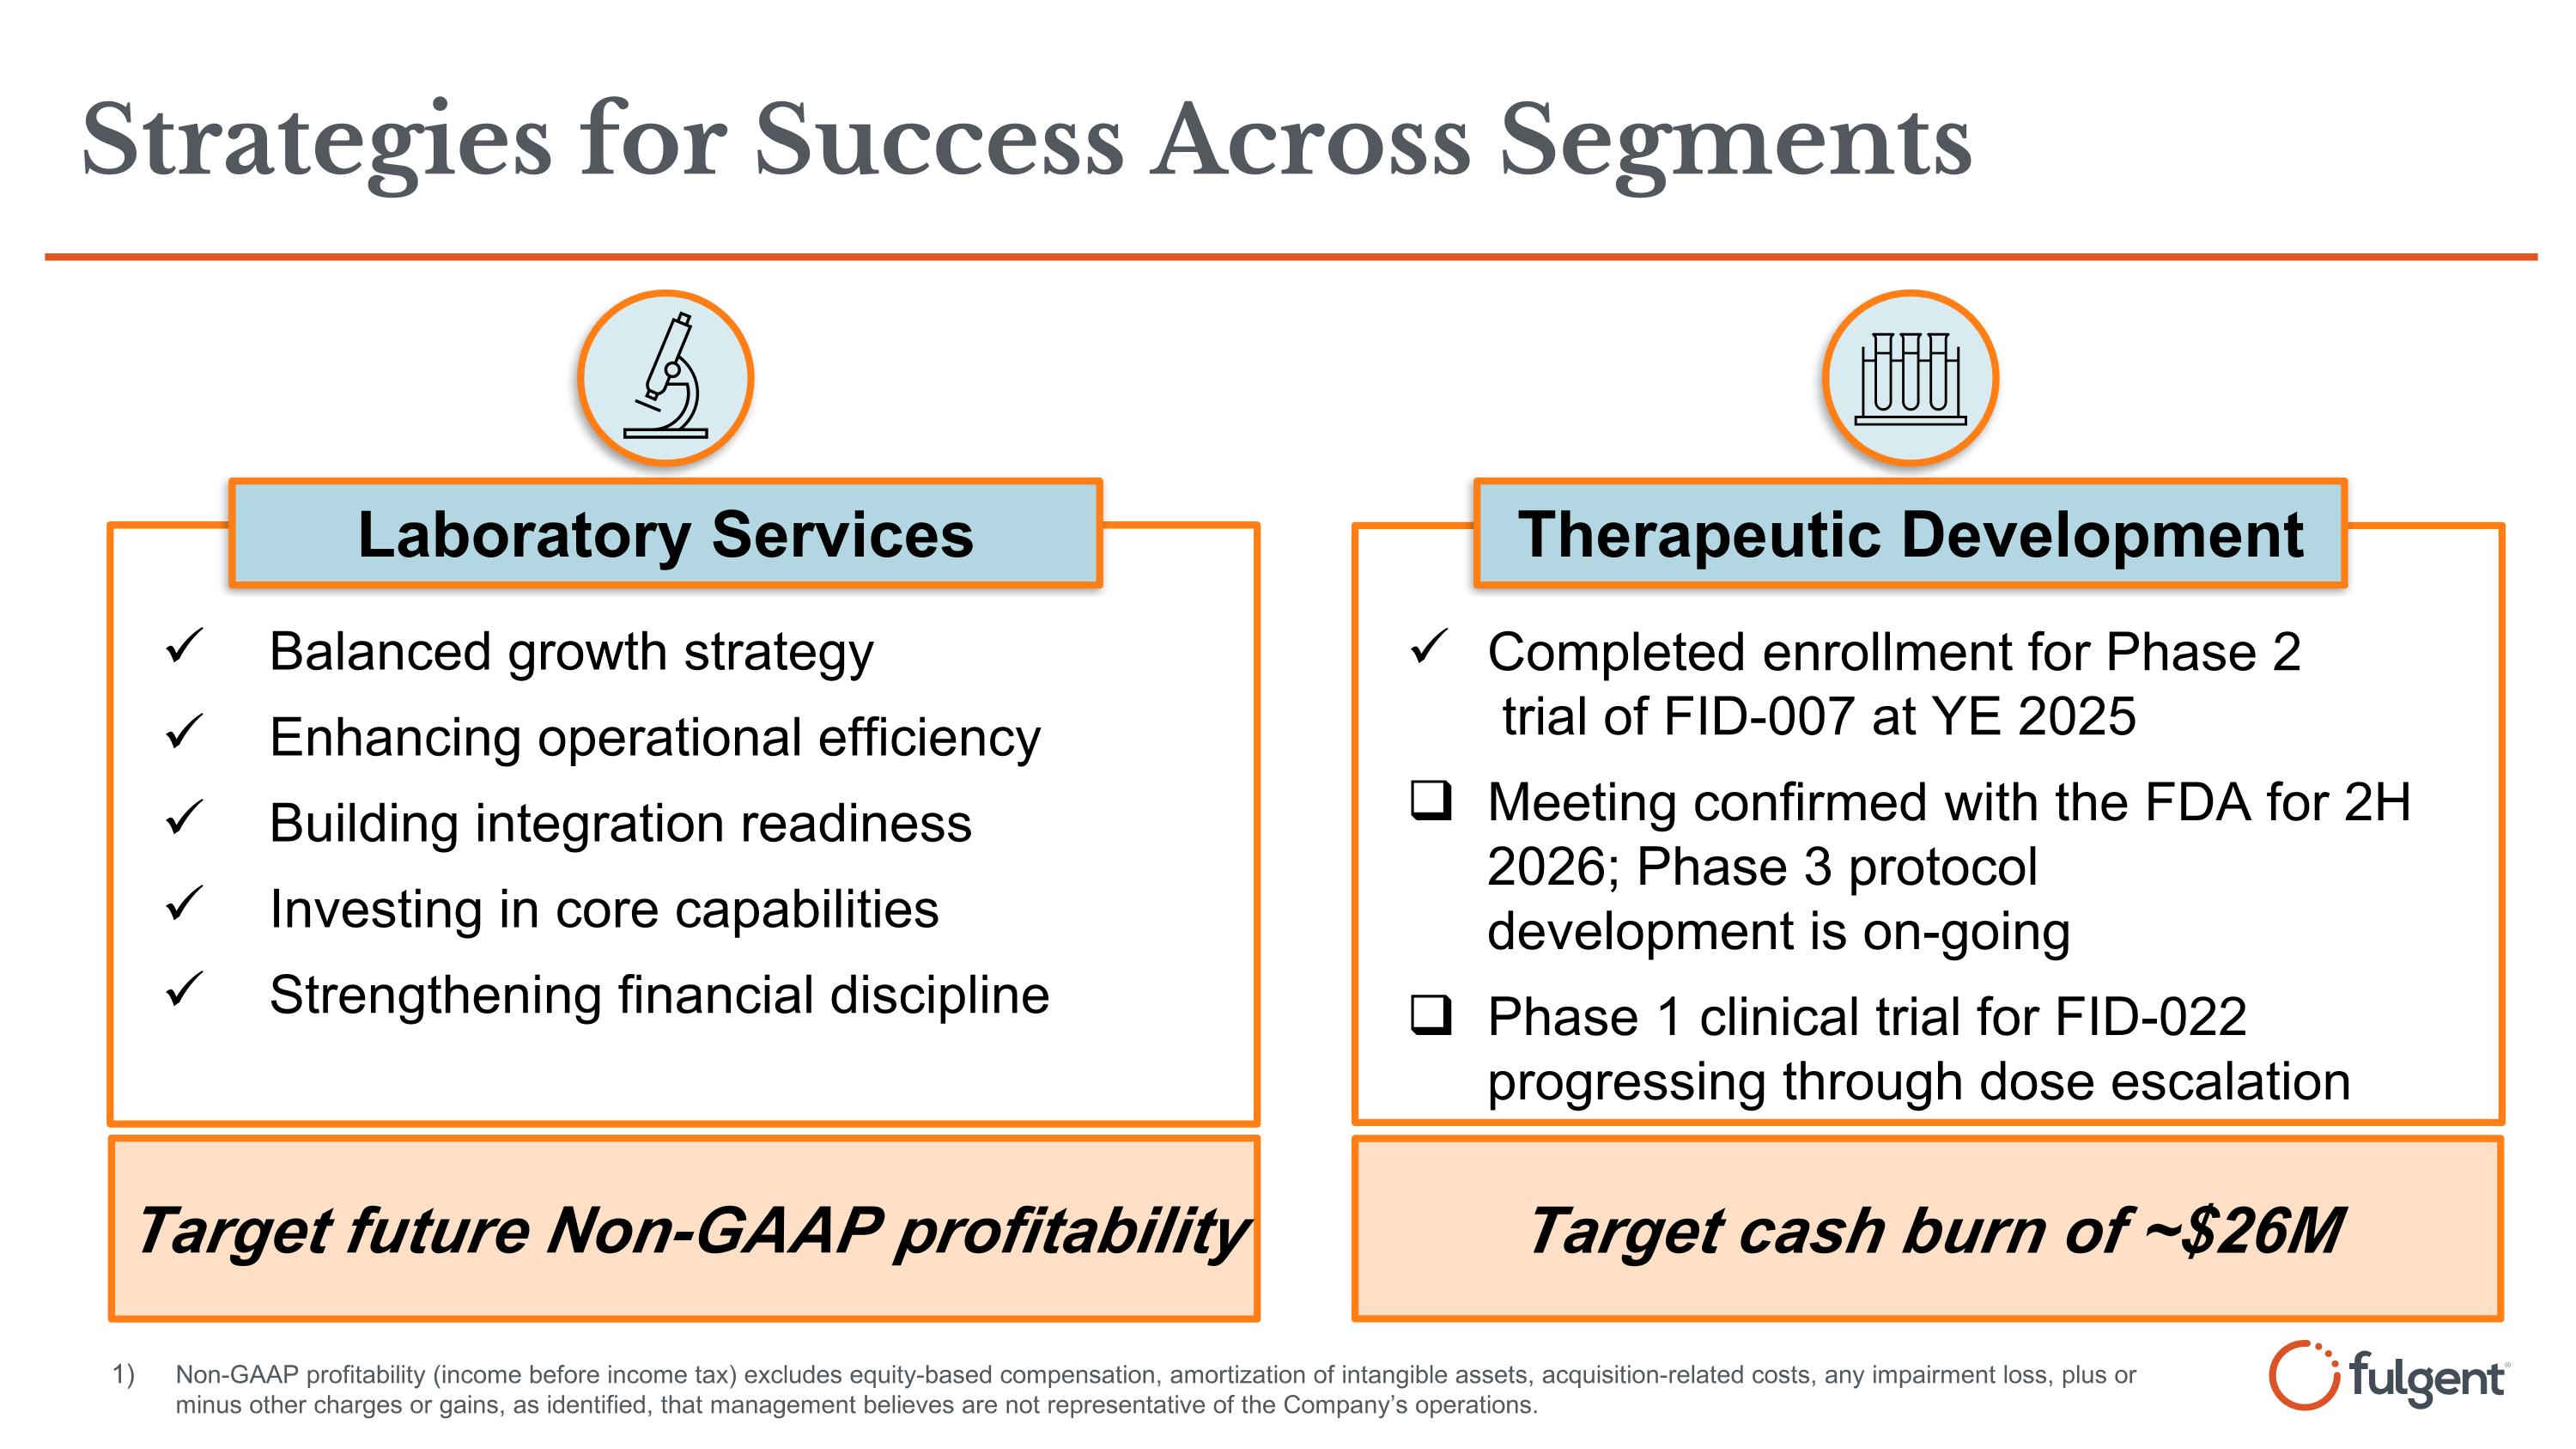
Thank you, Lauren. I will start with some comments on our two business lines, then Brandon will review our product and go to market update for our laboratory service business. And Paul will conclude with the financial and audit before we take your questions. I'm pleased with the momentum in our therapeutic development business as we progress on our clinical pipeline. In June, we presented the findings from the phase two trials of data for FID-007, which demonstrated encouraging activities in recurrent or metastatic head and neck sycroma cell carcinoma. Bojan has taken a differentiated approach with FID-007. It's a novel nano-encalculated peclatexel candidate developed with Fulgen's Clean Chemo Platform. The platform is designed to reduce toxicity typically associated with the conventional chemotherapy while maintaining or improving efficacy. A profile Folgen believe is preferable in combination oncology regimen. With phase two complete and the encouraging data now presented probably at ESCO, we are focused on the next next milestone. We have confirmed the end of phase two meeting with the FDA, which is scheduled later this We believe the phase two we have generally provided strong foundation going into the FDA's discussion. Our phase three study is in preparation and we hope to enter into phase three registration trial for the treatment of recurrent or metastatic head and neck sucoma cell carcinoma patients in the first half of 2027. We are encouraged by our clinical trial progress achieved so far, and I believe entering into the phase three registration trial will further increase the probability of success of the commercialization of FIDD-07 for treatment of recurrent metastatic head and neck suquemous cell carcinoma patients who currently have very few effective treatment options. We also want to reiterate our position on partnerships. We have financial strength to advance through the phase with our own, but we are open to collaboration discussions. We intend to push those conversations with a focus on partners who bring both resources and long-term strategic alignment. Our second clinical candidate, FID-022, is progressing to the phase one dose escalation with the fourth dose level successfully completed. We expect to determine the maximum tolerated dose level later this year. FID-022 is a nano-encapsulated SN38 for the treatment of solid tumors. including potentially colon, pancreatic, orion, and the bile duct cancers. Please note that both IVD-007 and O2-2 are derived from the same proprietary clean chemo delivery platform, patent, and fully owned by Fulgin. Similar to FID-07, FID-022 can also be used in ORIs on cost drug combinations. In the laboratory service business, we continue to see our AI and the digital pathology solution work at the accelerated pace and continue to expand our AI portfolio. As we drive the innovation across our business and seeing sustained demand and the consistent testing warning, we are also managing the transition of our billing and the revenue cycle management system. This transition has caused delays in billing and the process of claims and impact our ability to collect at our historical rates and reduce the amount of revenue we are able to recognize from the test we have performed. Addressing revenue cycle maintenance is our top operational priority and we are making progress. I would like to thank our employees, partners, and stakeholders for your hard work and loyalty. I will now return the call over to Brydon Perdue, our Chief Commercial Officer, to talk more about our laboratory service business. Brandon?
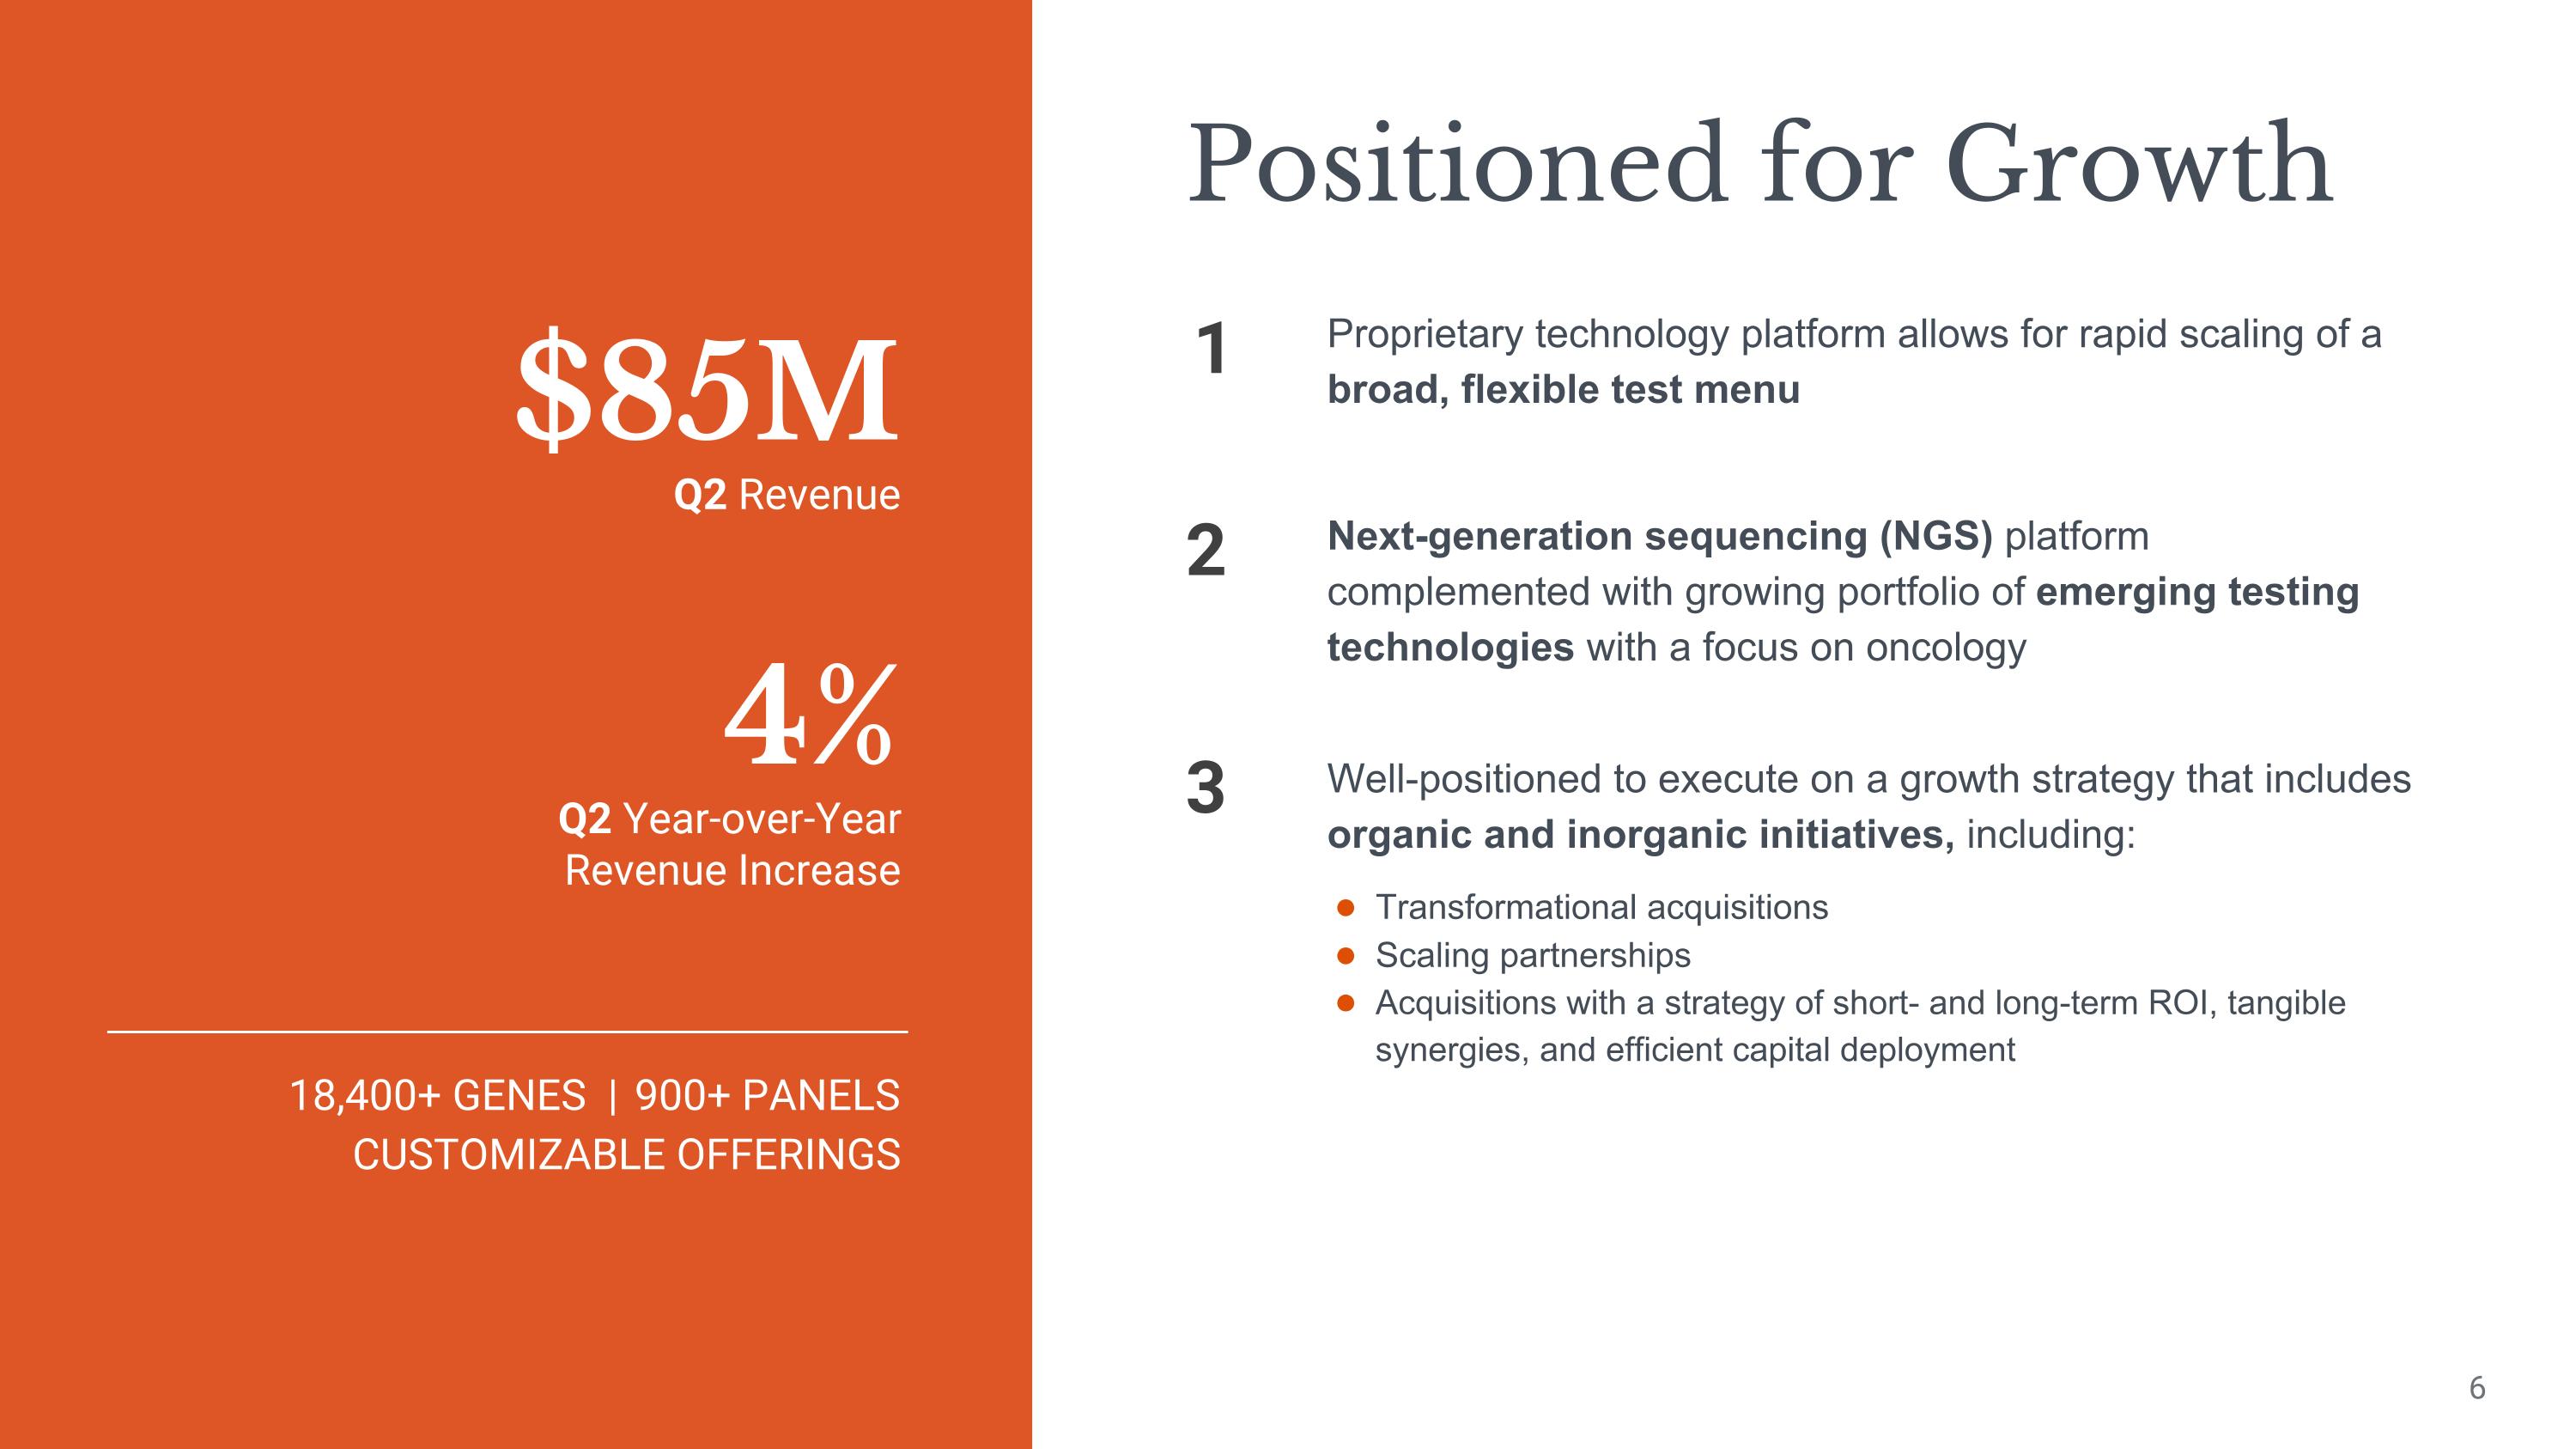
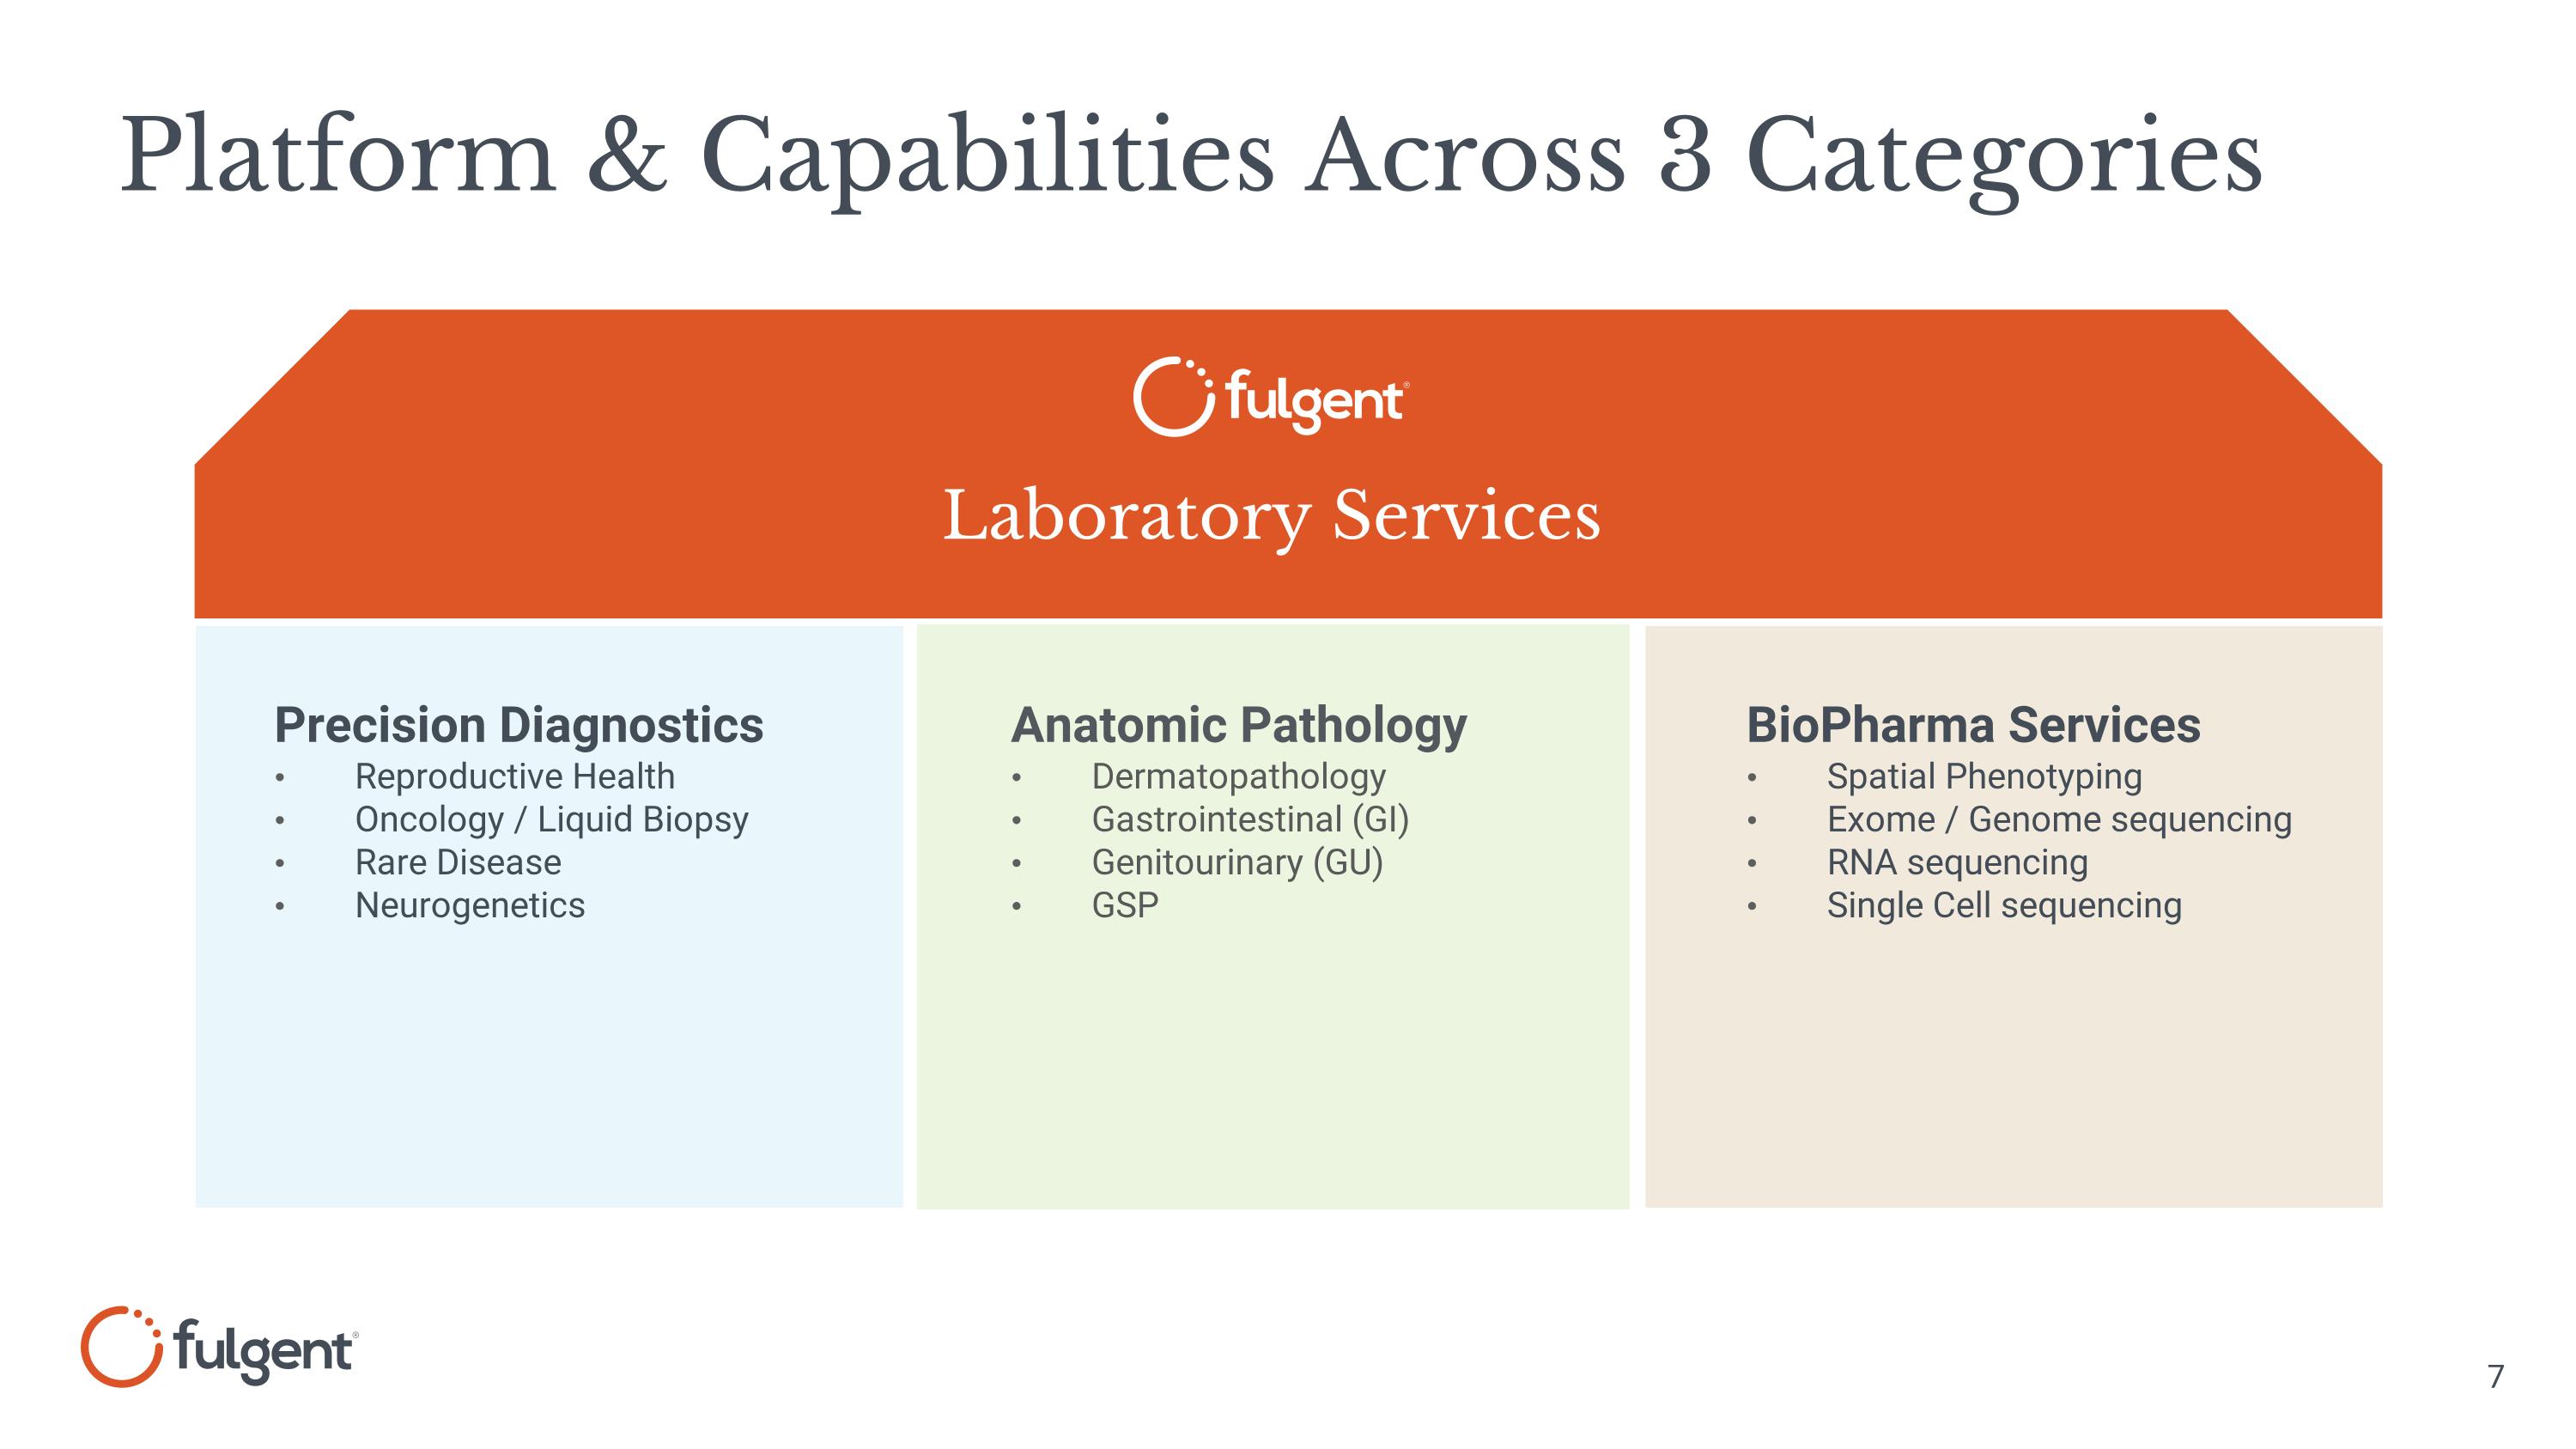
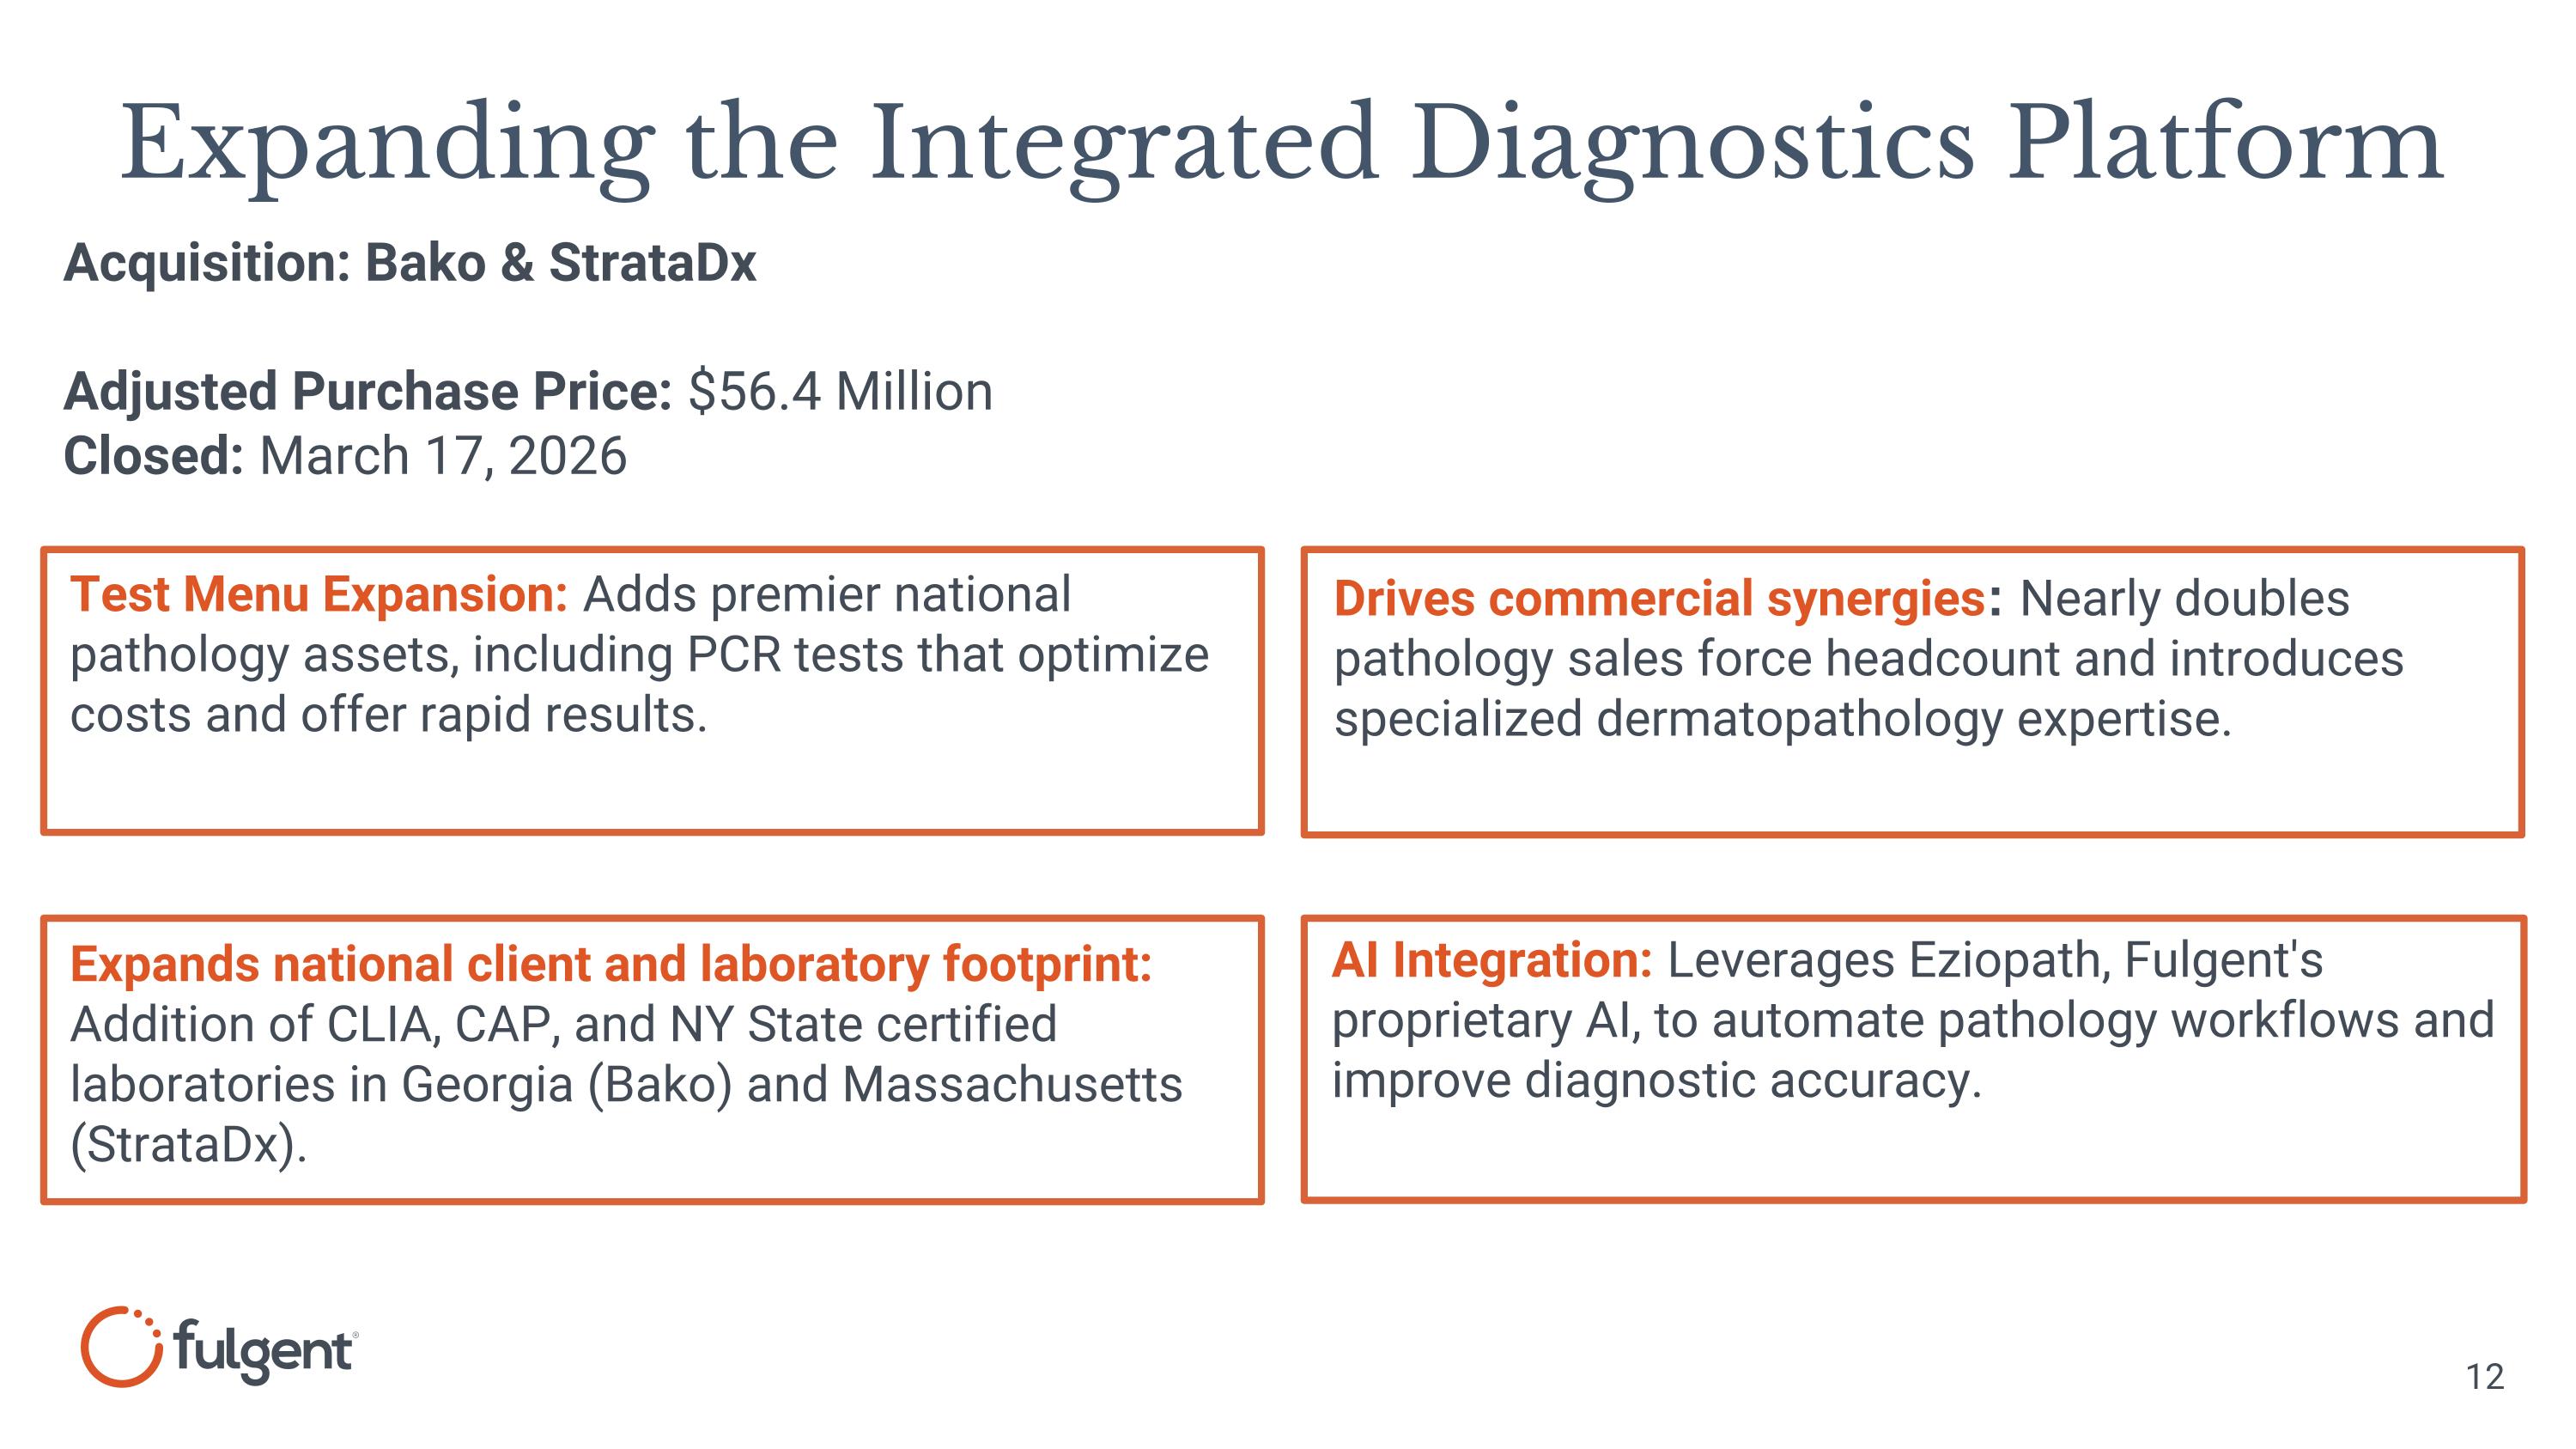
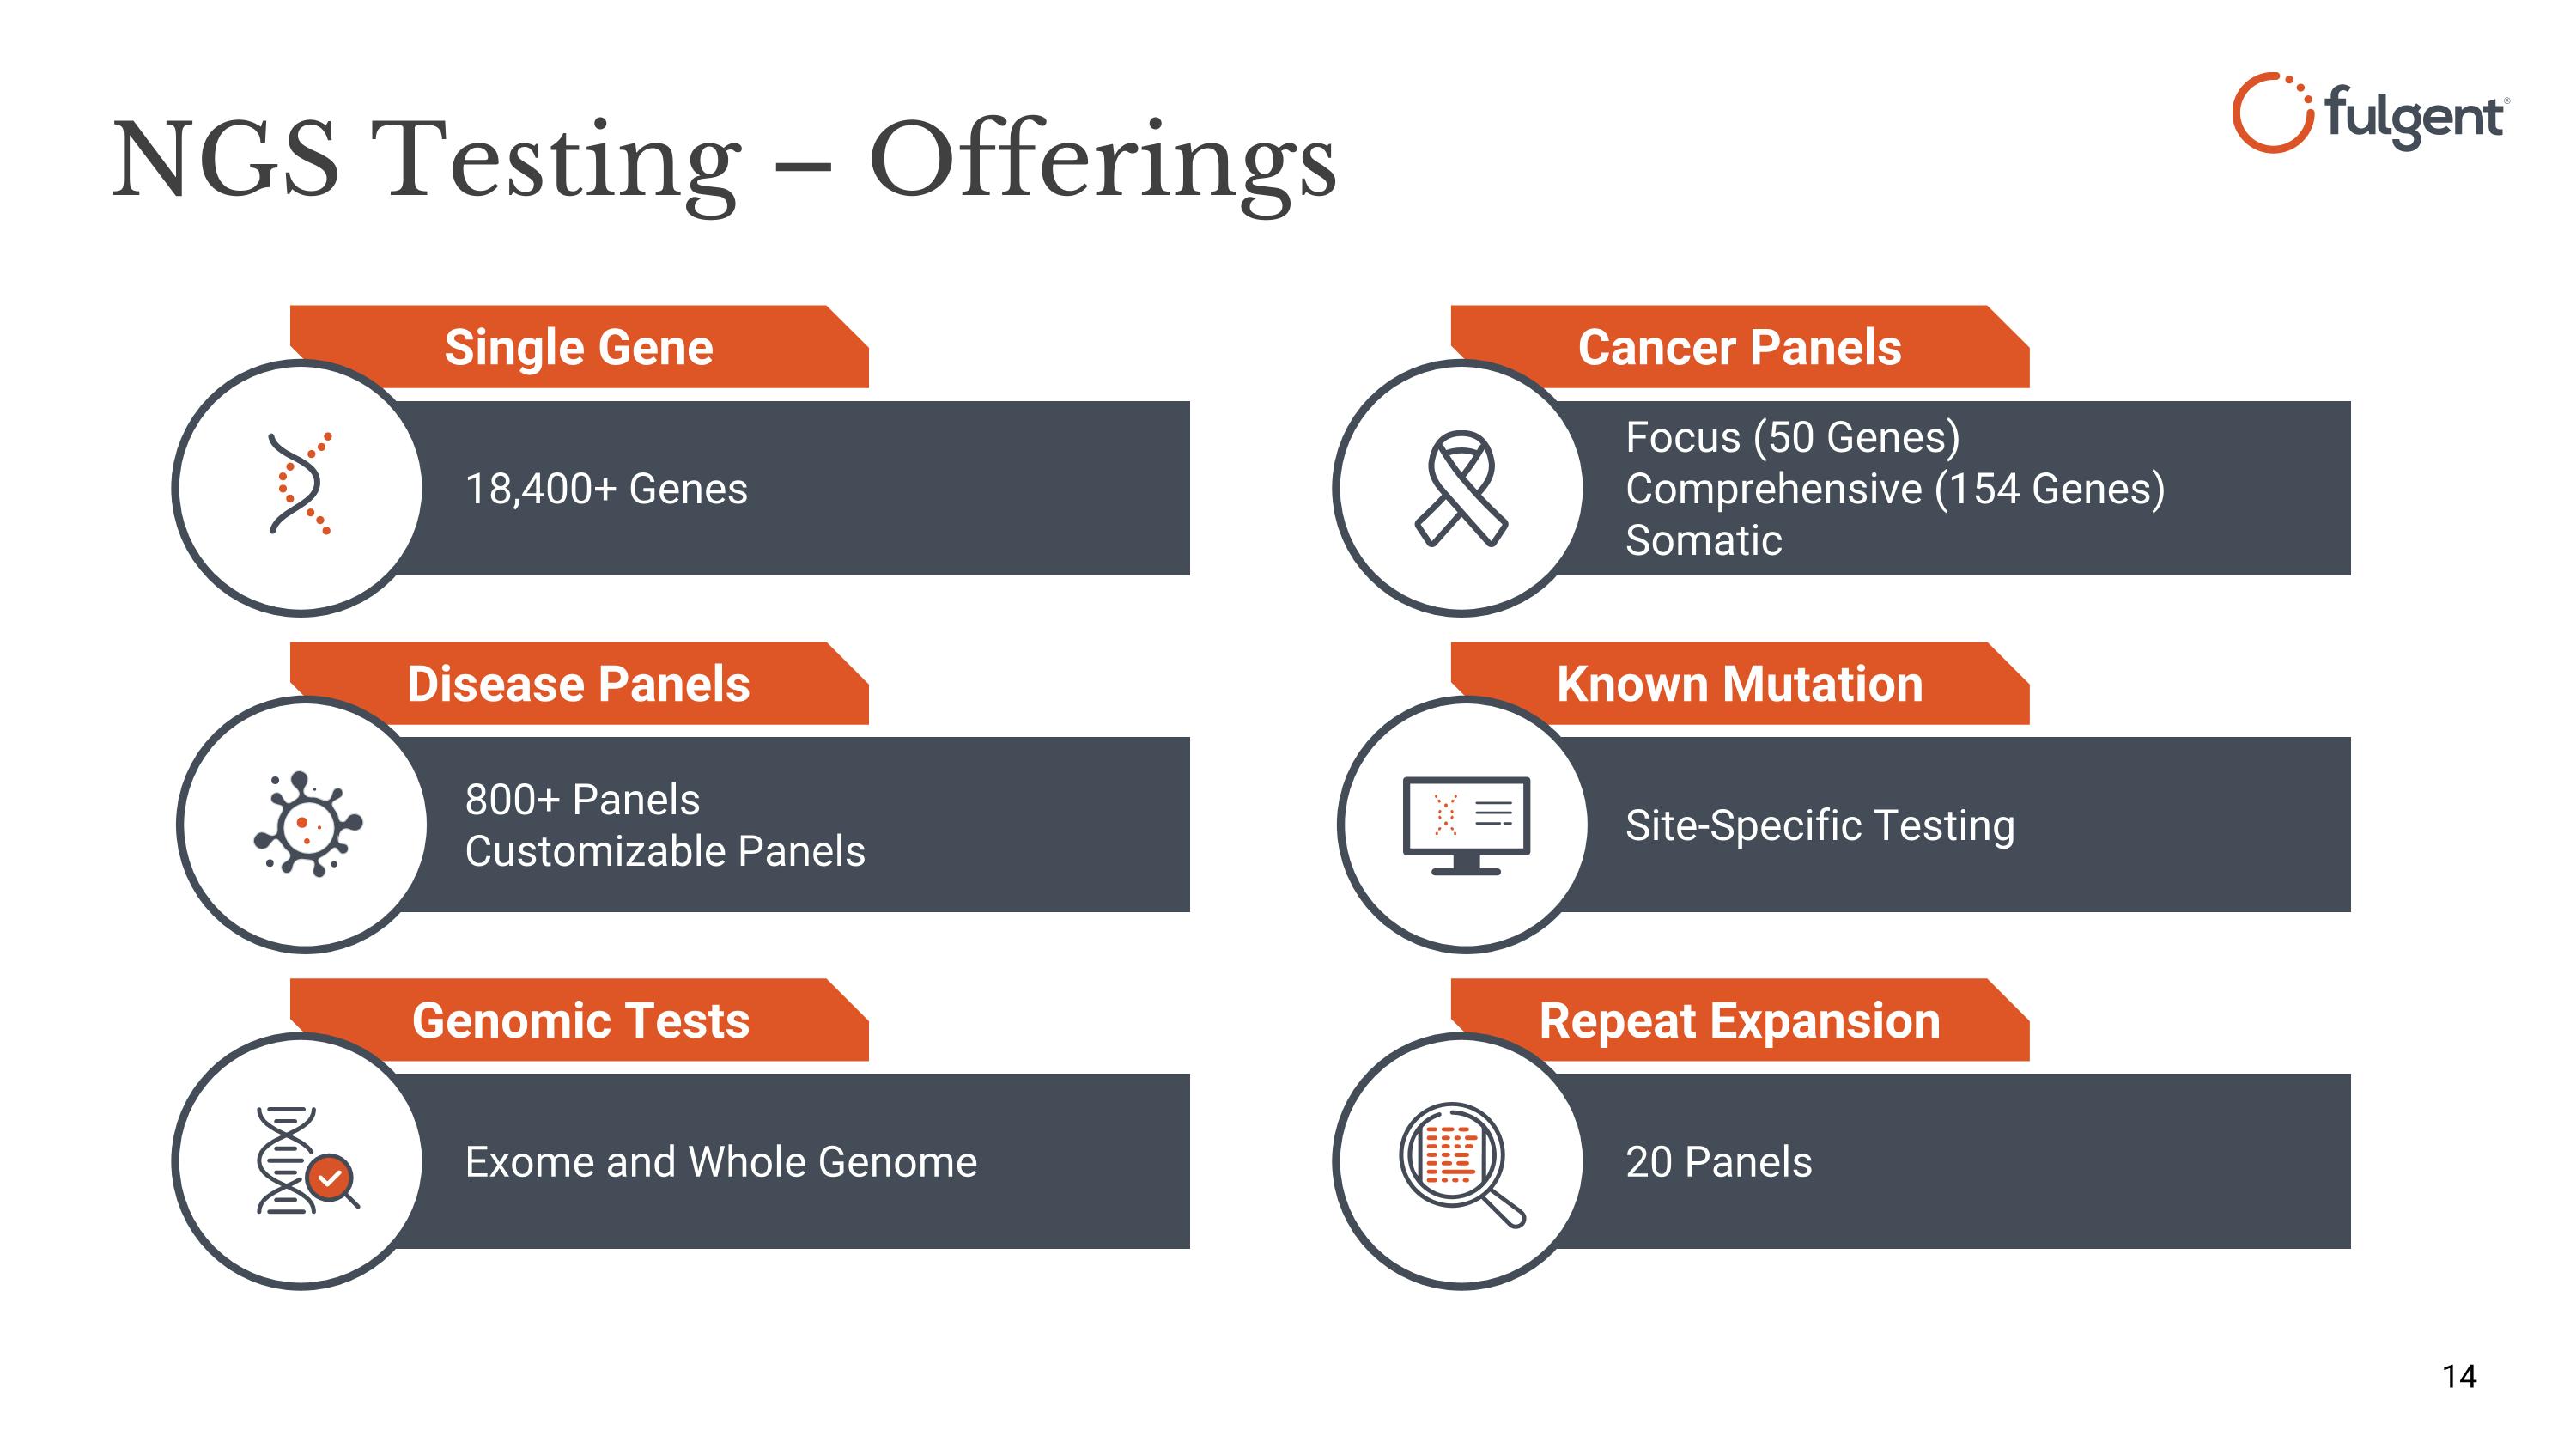
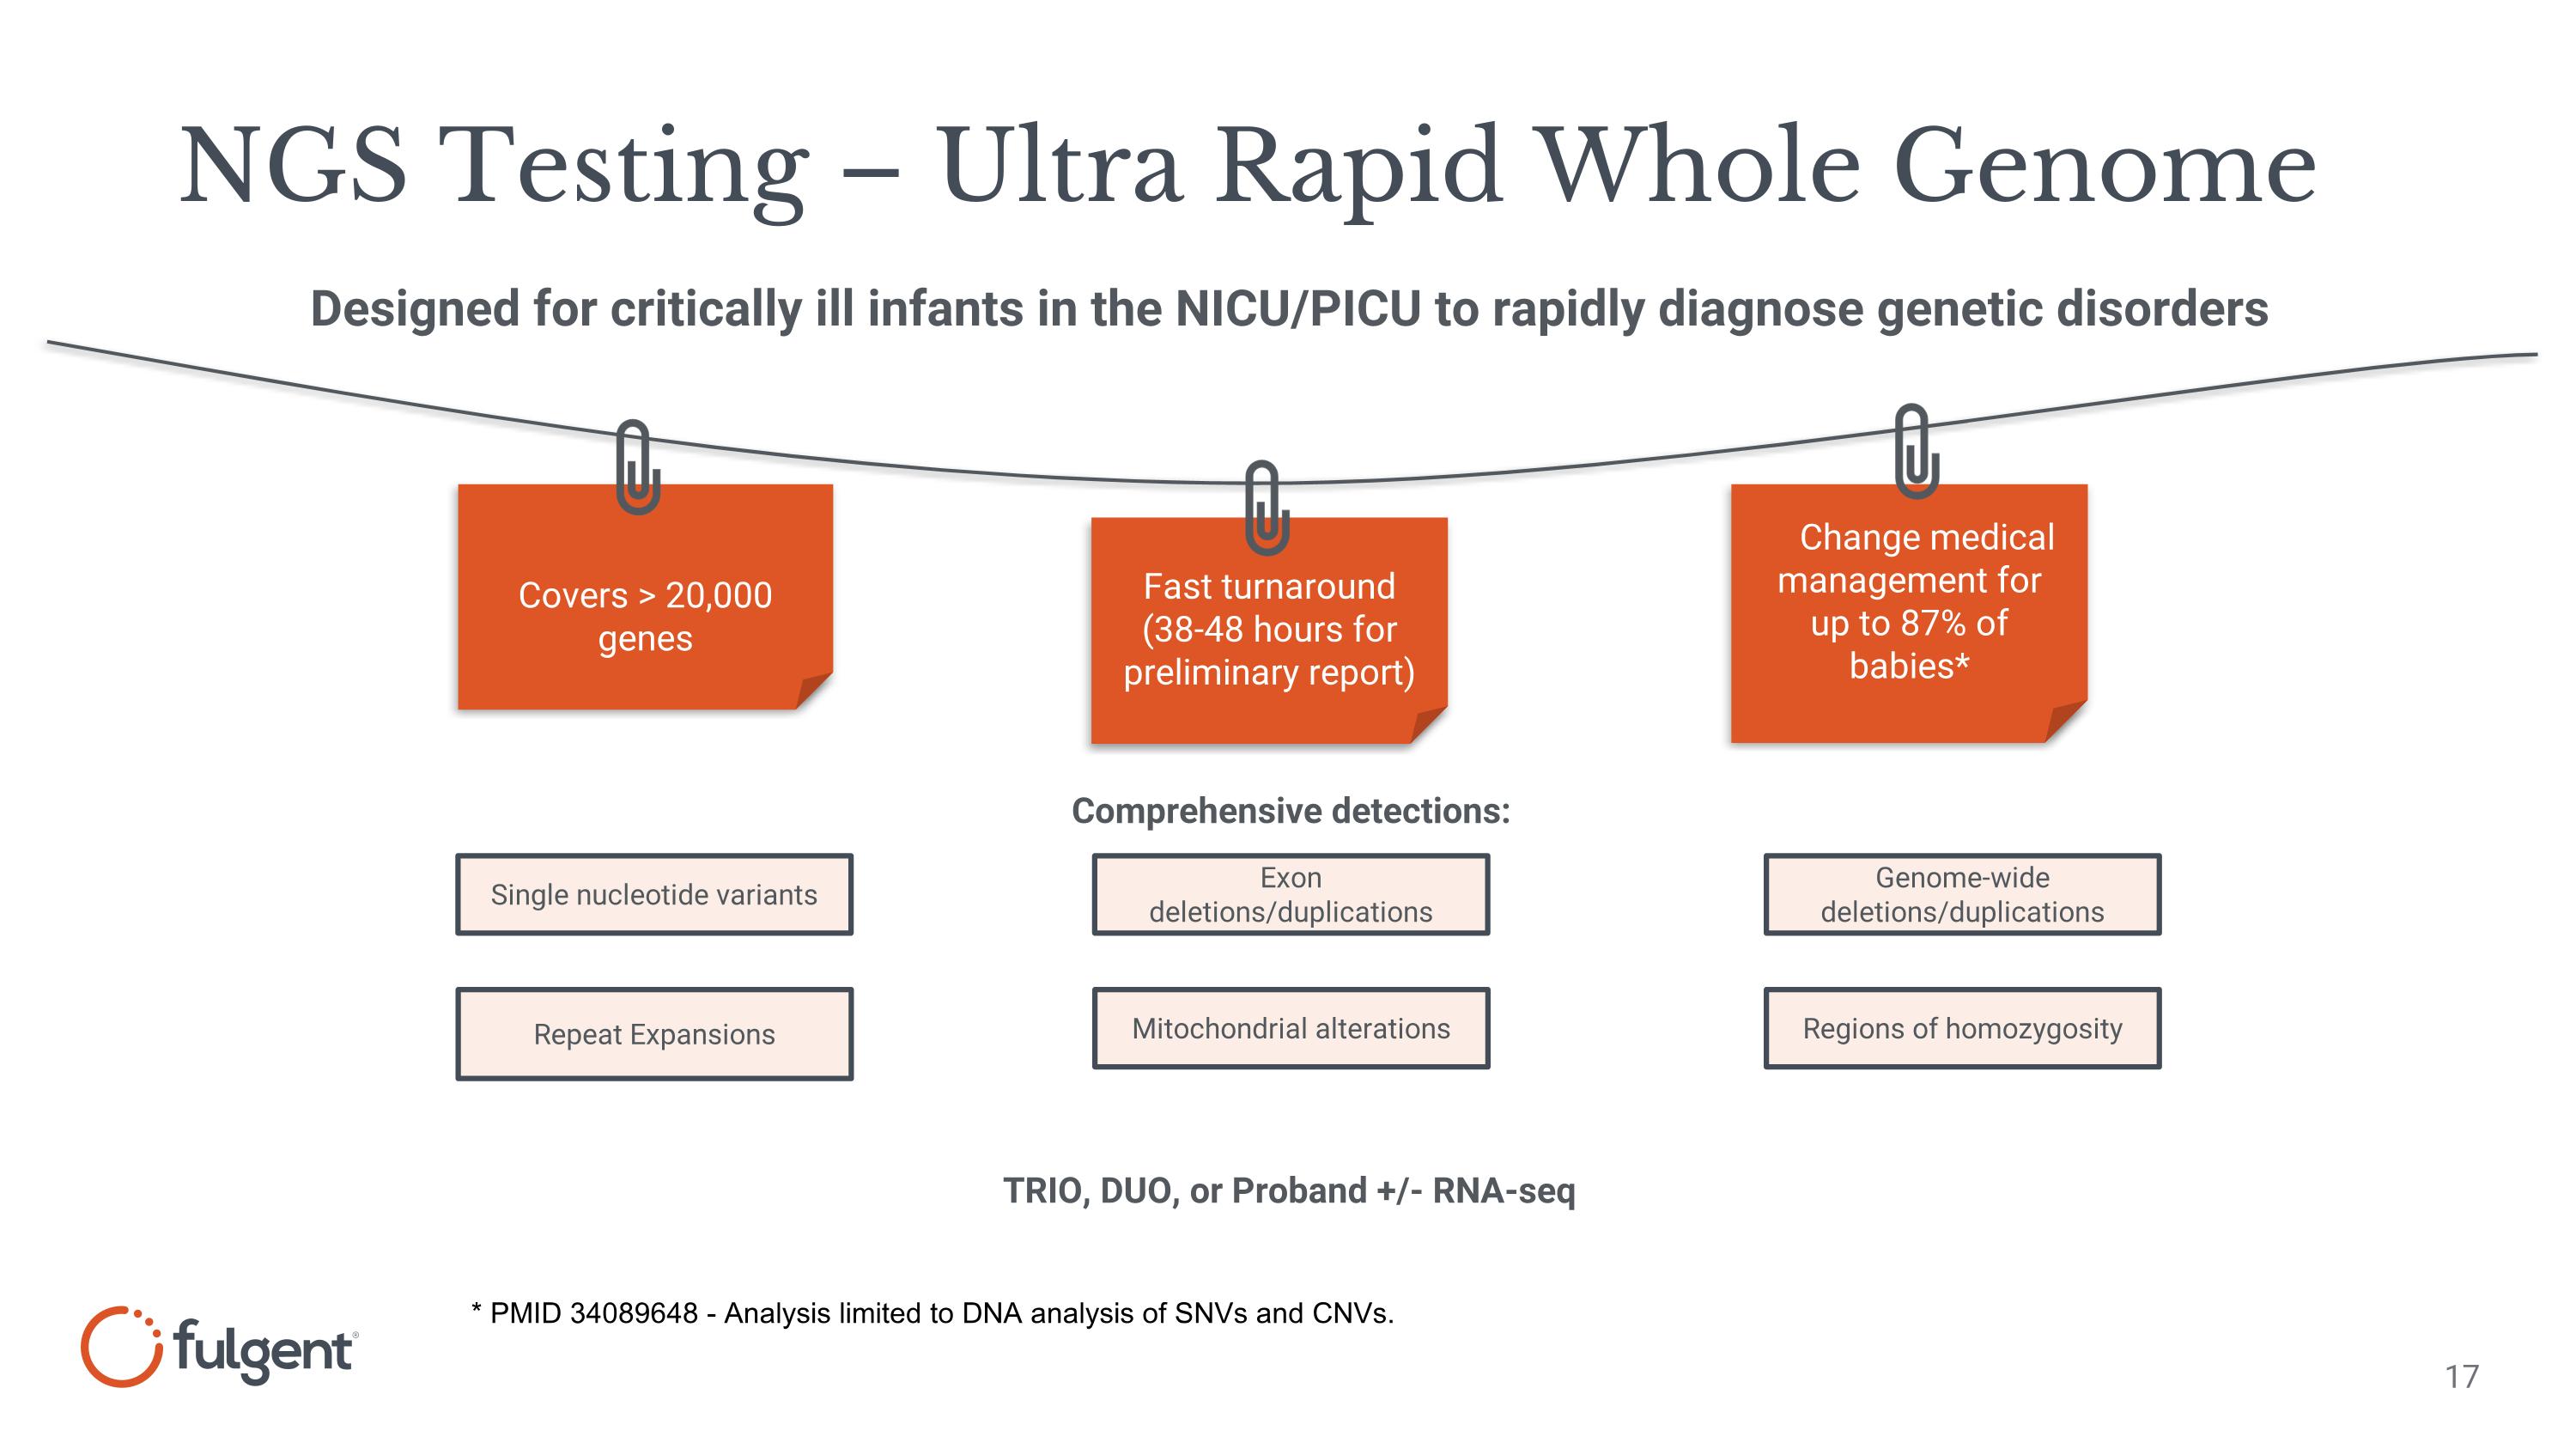
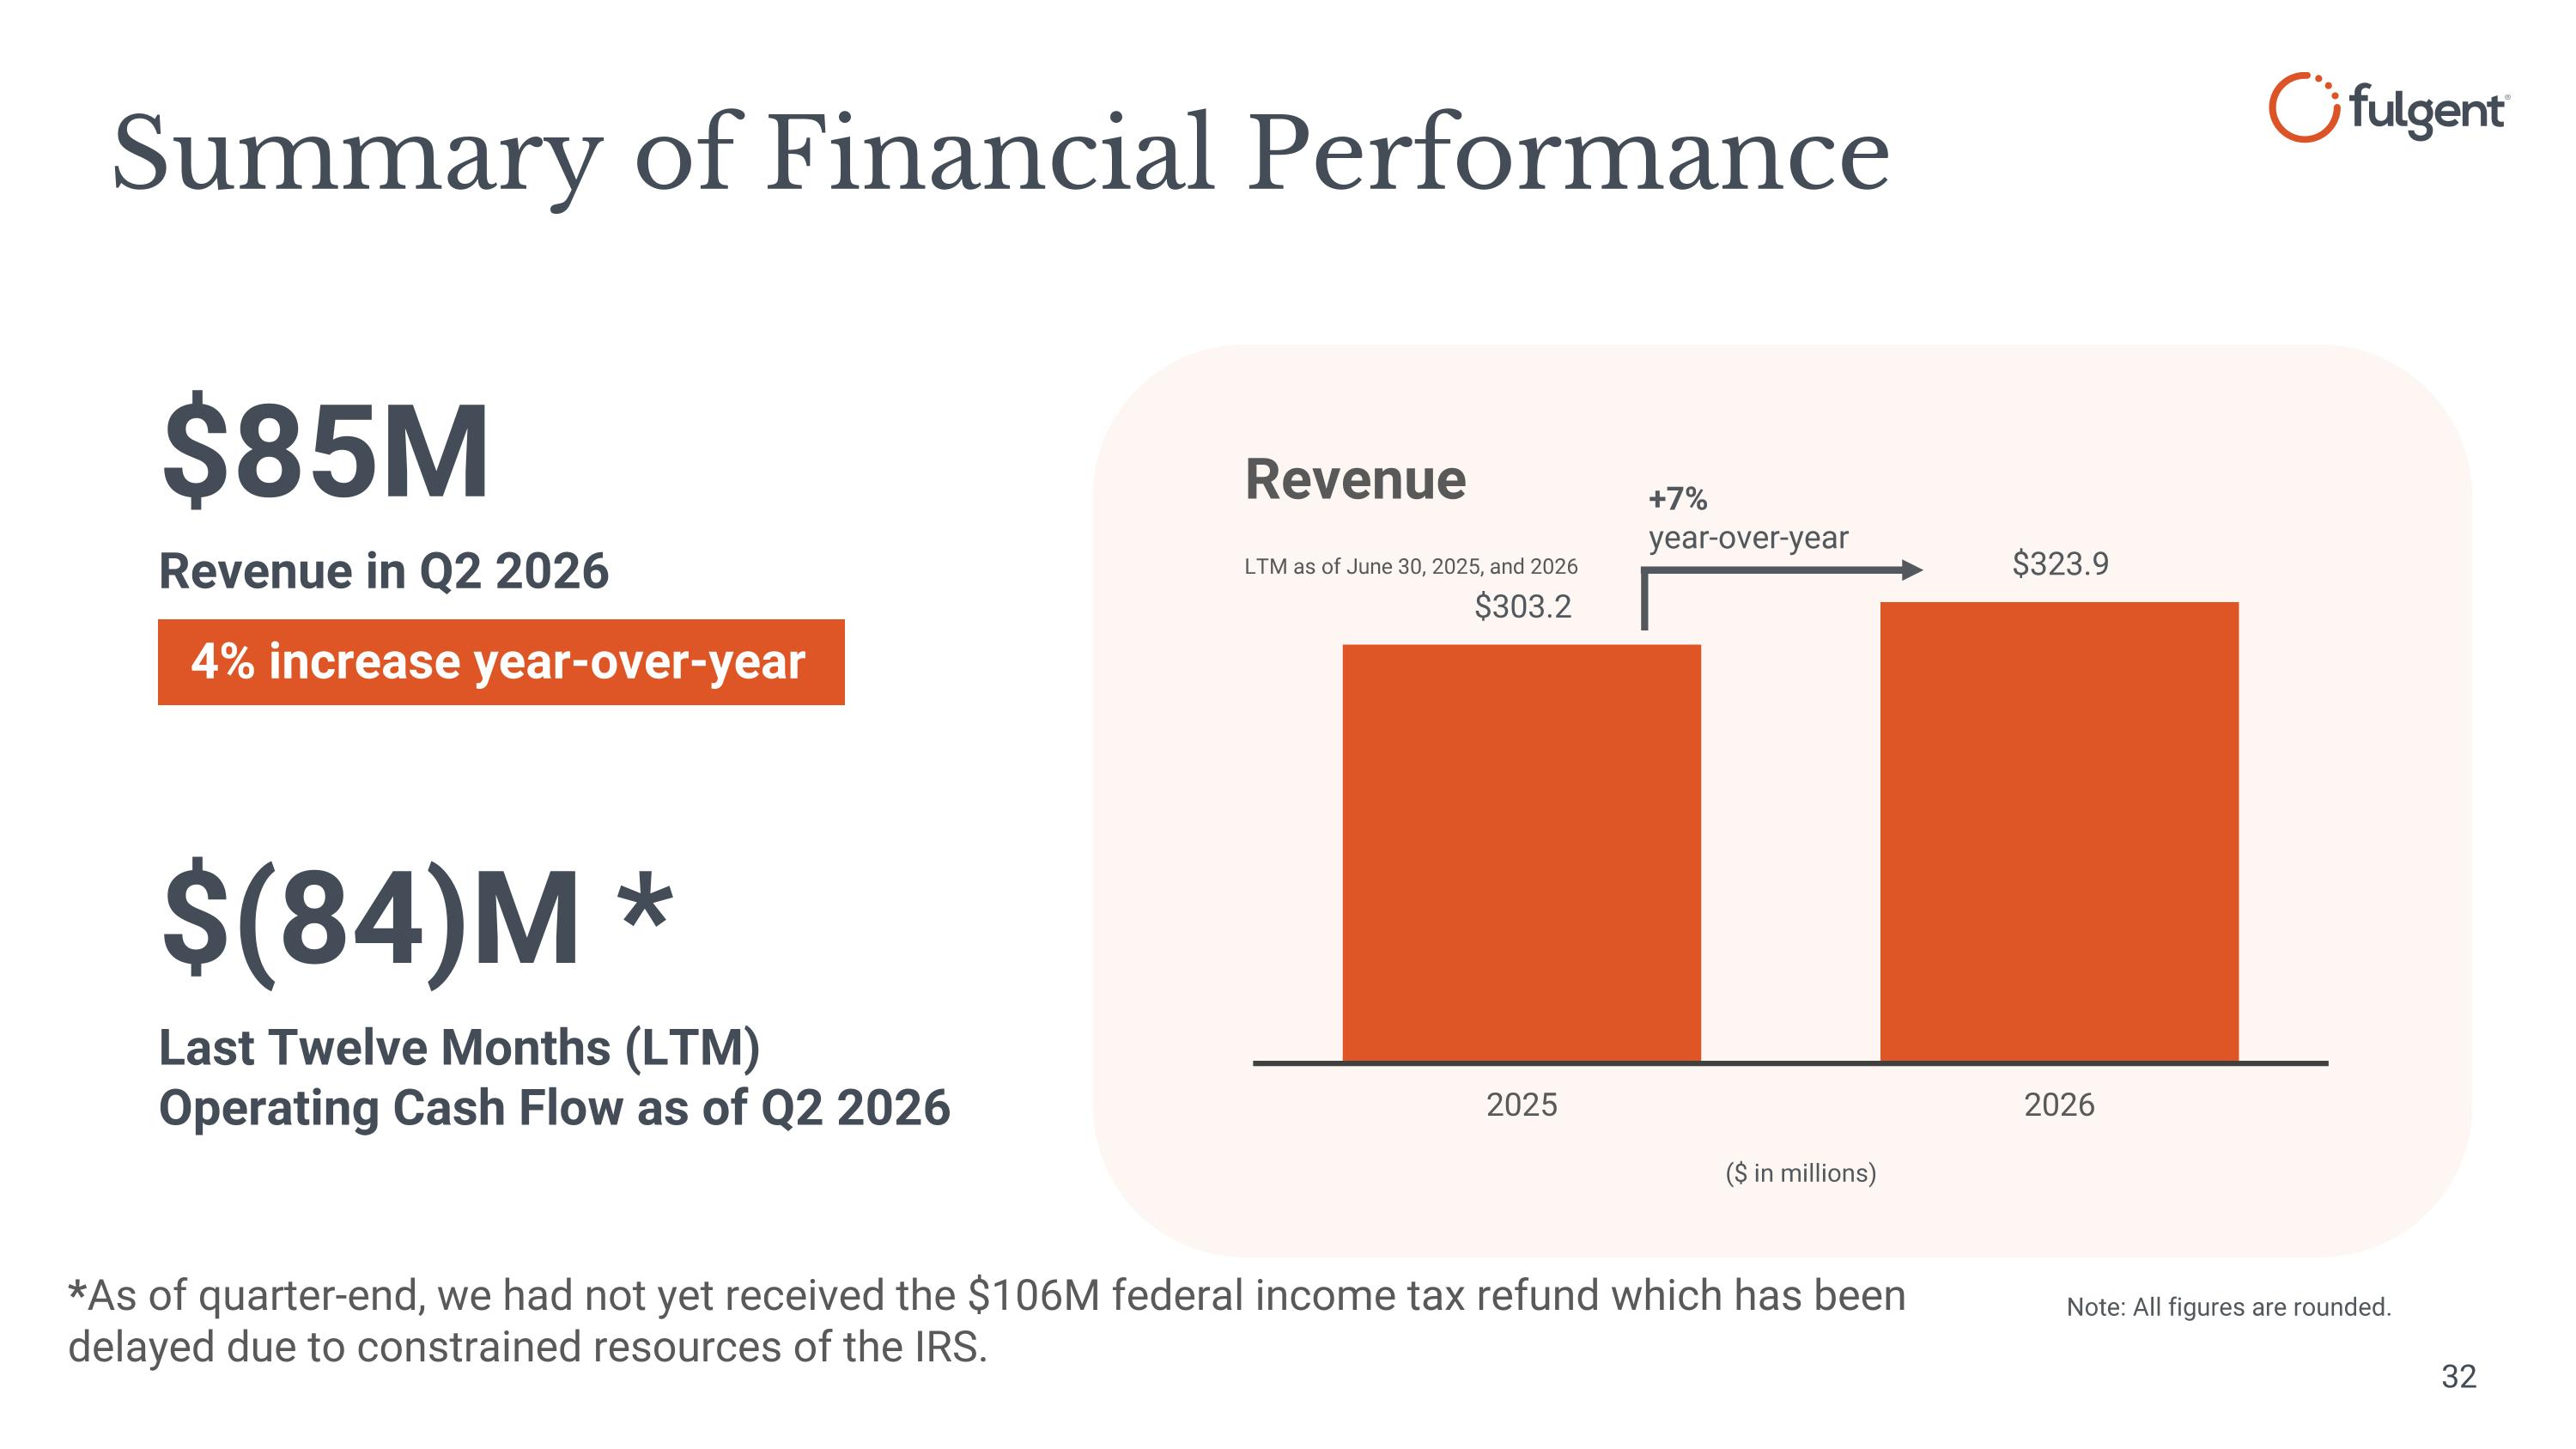
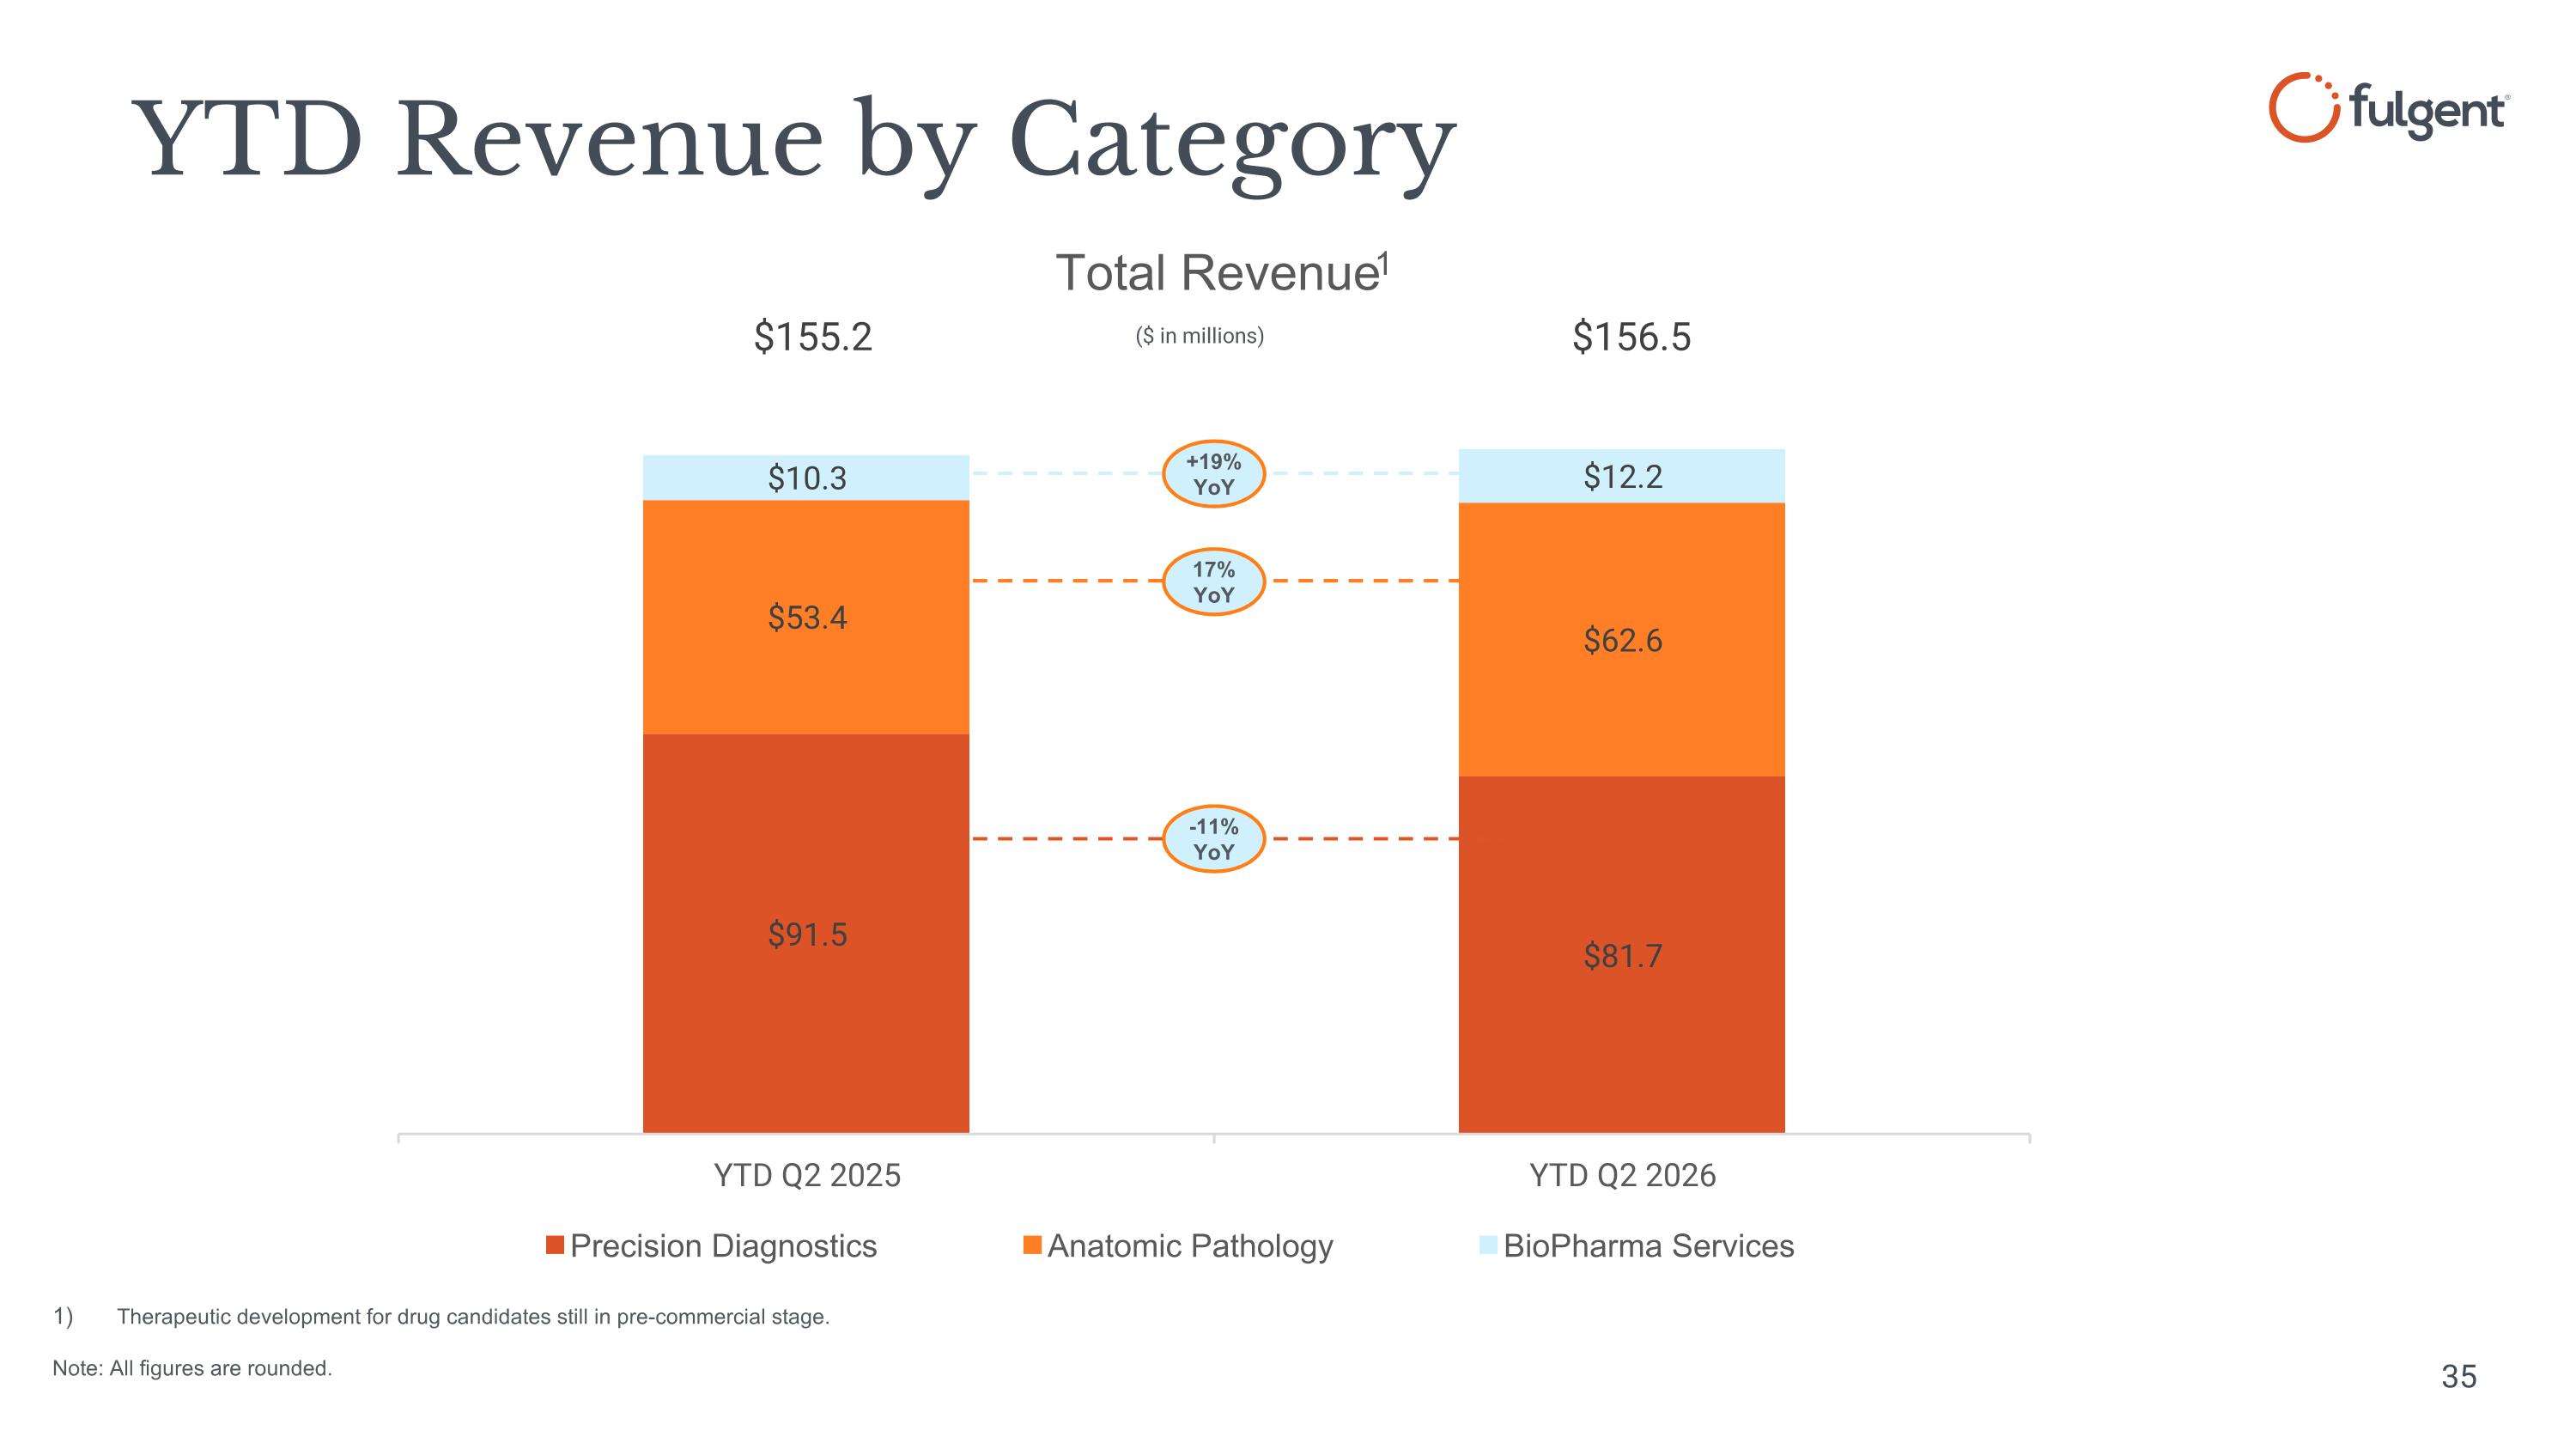
Thank you, Ming. We ended the quarter at $85.4 million, an increase of 4% year-over-year and 20 percent sequentially. The second quarter, we did have the new acquisitions of BACO and Strata DX integrated, which contributed to the overall performance. Breaking it down further, precision diagnostics ended at $41.5 million, a decrease of 13 percent year-over-year, but increased 3 percent sequentially. Anatomic pathology came in at $37.5 million, an increase of 33% year-over-year and 50% sequentially, and biopharma services ended the quarter at $6.4 million, an increase of 3% year-over-year and 11% sequentially. These numbers were affected by delays in billing and a decline in collection rates related to the ongoing transition of our revenue cycle management and billing system, which I will address in more details shortly paul will also discuss the related financial impact we continue to see a real impact on operations from the development and use of ai this quarter we expanded our ai portfolio with a novel stain aware algorithm designed to automate mass cell quantification and gastrointestinal biopsies an important biomarker in diseases such as systemic mastocytosis and mastocytic intercolitis. Traditional AI approaches have struggled to accurately quantify mast cells due to diffuse tryptate staining associated with cell degranulation, limiting the reliability of automated analysis. Our proprietary mass AI platform overcomes this challenge through a DAB-guided deep learning approach that accurately separates individual mast cells from surrounding extracellular staining. In validation study, the platform demonstrated strong performance across multiple staining methods, delivering highly accurate and reproducible quantification without requiring manual perimeter adjustments. This represents another example of our ability to solve complex pathology challenges using proprietary AI. Beyond improving workflow efficiency and diagnostic consistency, the technology establishes a foundation for advanced spatial biomarker analysis and quantitative pathology applications and eosinophilic esophagitis and other gastrointestinal inflammatory diseases. As we continue to expand our AI-enabled diagnostic portfolio, we believe capabilities further differentiate our end-to-end digital pathology platform and create additional opportunity to deliver value to clinicians, pharmaceutical partners, and healthcare systems. The second quarter was our first full quarter of having Botco and Strategy X integrated. From an operations perspective, things have gone incredibly well. There has been minimal disruption to turnaround time and client ordering patterns. The focus going forward is to move the operations to digital pathology so we can both use and develop new AI tools to improve efficiency and quality. I would like to congratulate the operation teams on both sides for doing such an excellent job. These represented our fourth and fifth acquisitions. We believe we have proven we can successfully acquire and integrate new assets. In terms of the sales team, the Baco and Strata DX teams have been fully cross-trained and are now selling our legacy anatomic pathology services in dermatology and GI, in addition to their previous services. So far, the initial progress has been encouraging, with the team building a robust pipeline of opportunities quickly. The new combined anatomic pathology team is at approximately 40, which is nearly double our size pre-acquisition. Previously, we mentioned we entered into an agreement with Epic to be added to their ARA platform. ARA is Epic's specialty diagnostics platform, offering genetic testing services within health systems electronic medical records to send orders and receive results. Both sides have been working diligently to complete the integration, and we are scheduled to go live with early adopters in the third quarter. Once live, it streamlines the process of interfacing with clients and improves access to genetic testing information within the EMR. We look forward to going live with Aura and using it as a conduit to make ordering easier for our clients and strengthening our client relationships. We continue to push the envelope related to what can be accomplished with whole genome sequencing. Our standard whole genome sequencing service is now on the Illumina TruePath system, which is a short-read-like technology that maintains high accuracy while providing long-range genomic insights not achievable with standard short-read sequencing. With this new approach, our mean sequencing coverage increased from 40x to 60x to 70x. In addition, we are now able to expand the number of repeat expansions we cover. Coverage grew from 21 to 64, broadening the diagnostic scope for patients presenting with a wide range of neurological, neuromuscular, and other expansion-associated conditions. This new whole-genome sequencing test can be ordered with our RNA-integrated sequencing evaluation, or RISE. RISE provides functional insights into genetic variants, enabling deeper characterization of pathogenicity. RISE also detects aberrant gene expression, monoallelic gene expression, and aberrant splicing of expressed target genes. These features combine to cast the widest net possible, enabling improved diagnostic yield for those patients and families seeking answers to complex phenotypes. As Ming touched on, we are managing the final phase of the transition of our billing and revenue cycle management system. We originally undertook this transition to achieve greater consistency across our operations and to drive long-term efficiency, and we successfully finished Phase 1 and Phase 2 of the implementation. However, the most significant impact has been in the final phase of this transition. The system is very complex, and we have encountered challenges mostly related to implementing the customizations needed in this new system to maximize reimbursement that were not fully built into the initial launch. That customization work remains ongoing today. We have made progress implementing a number of the required customizations and remain focused on completing the remaining work as quickly as possible. As the remaining customizations are completed and integrated across our revenue cycle, we expect our collection rates to improve, though we cannot predict the exact timing of that improvement. Thanks for your time today. We appreciate you joining our call. I'll now turn it over to Paul Kim, our Chief Financial Officer. Paul?
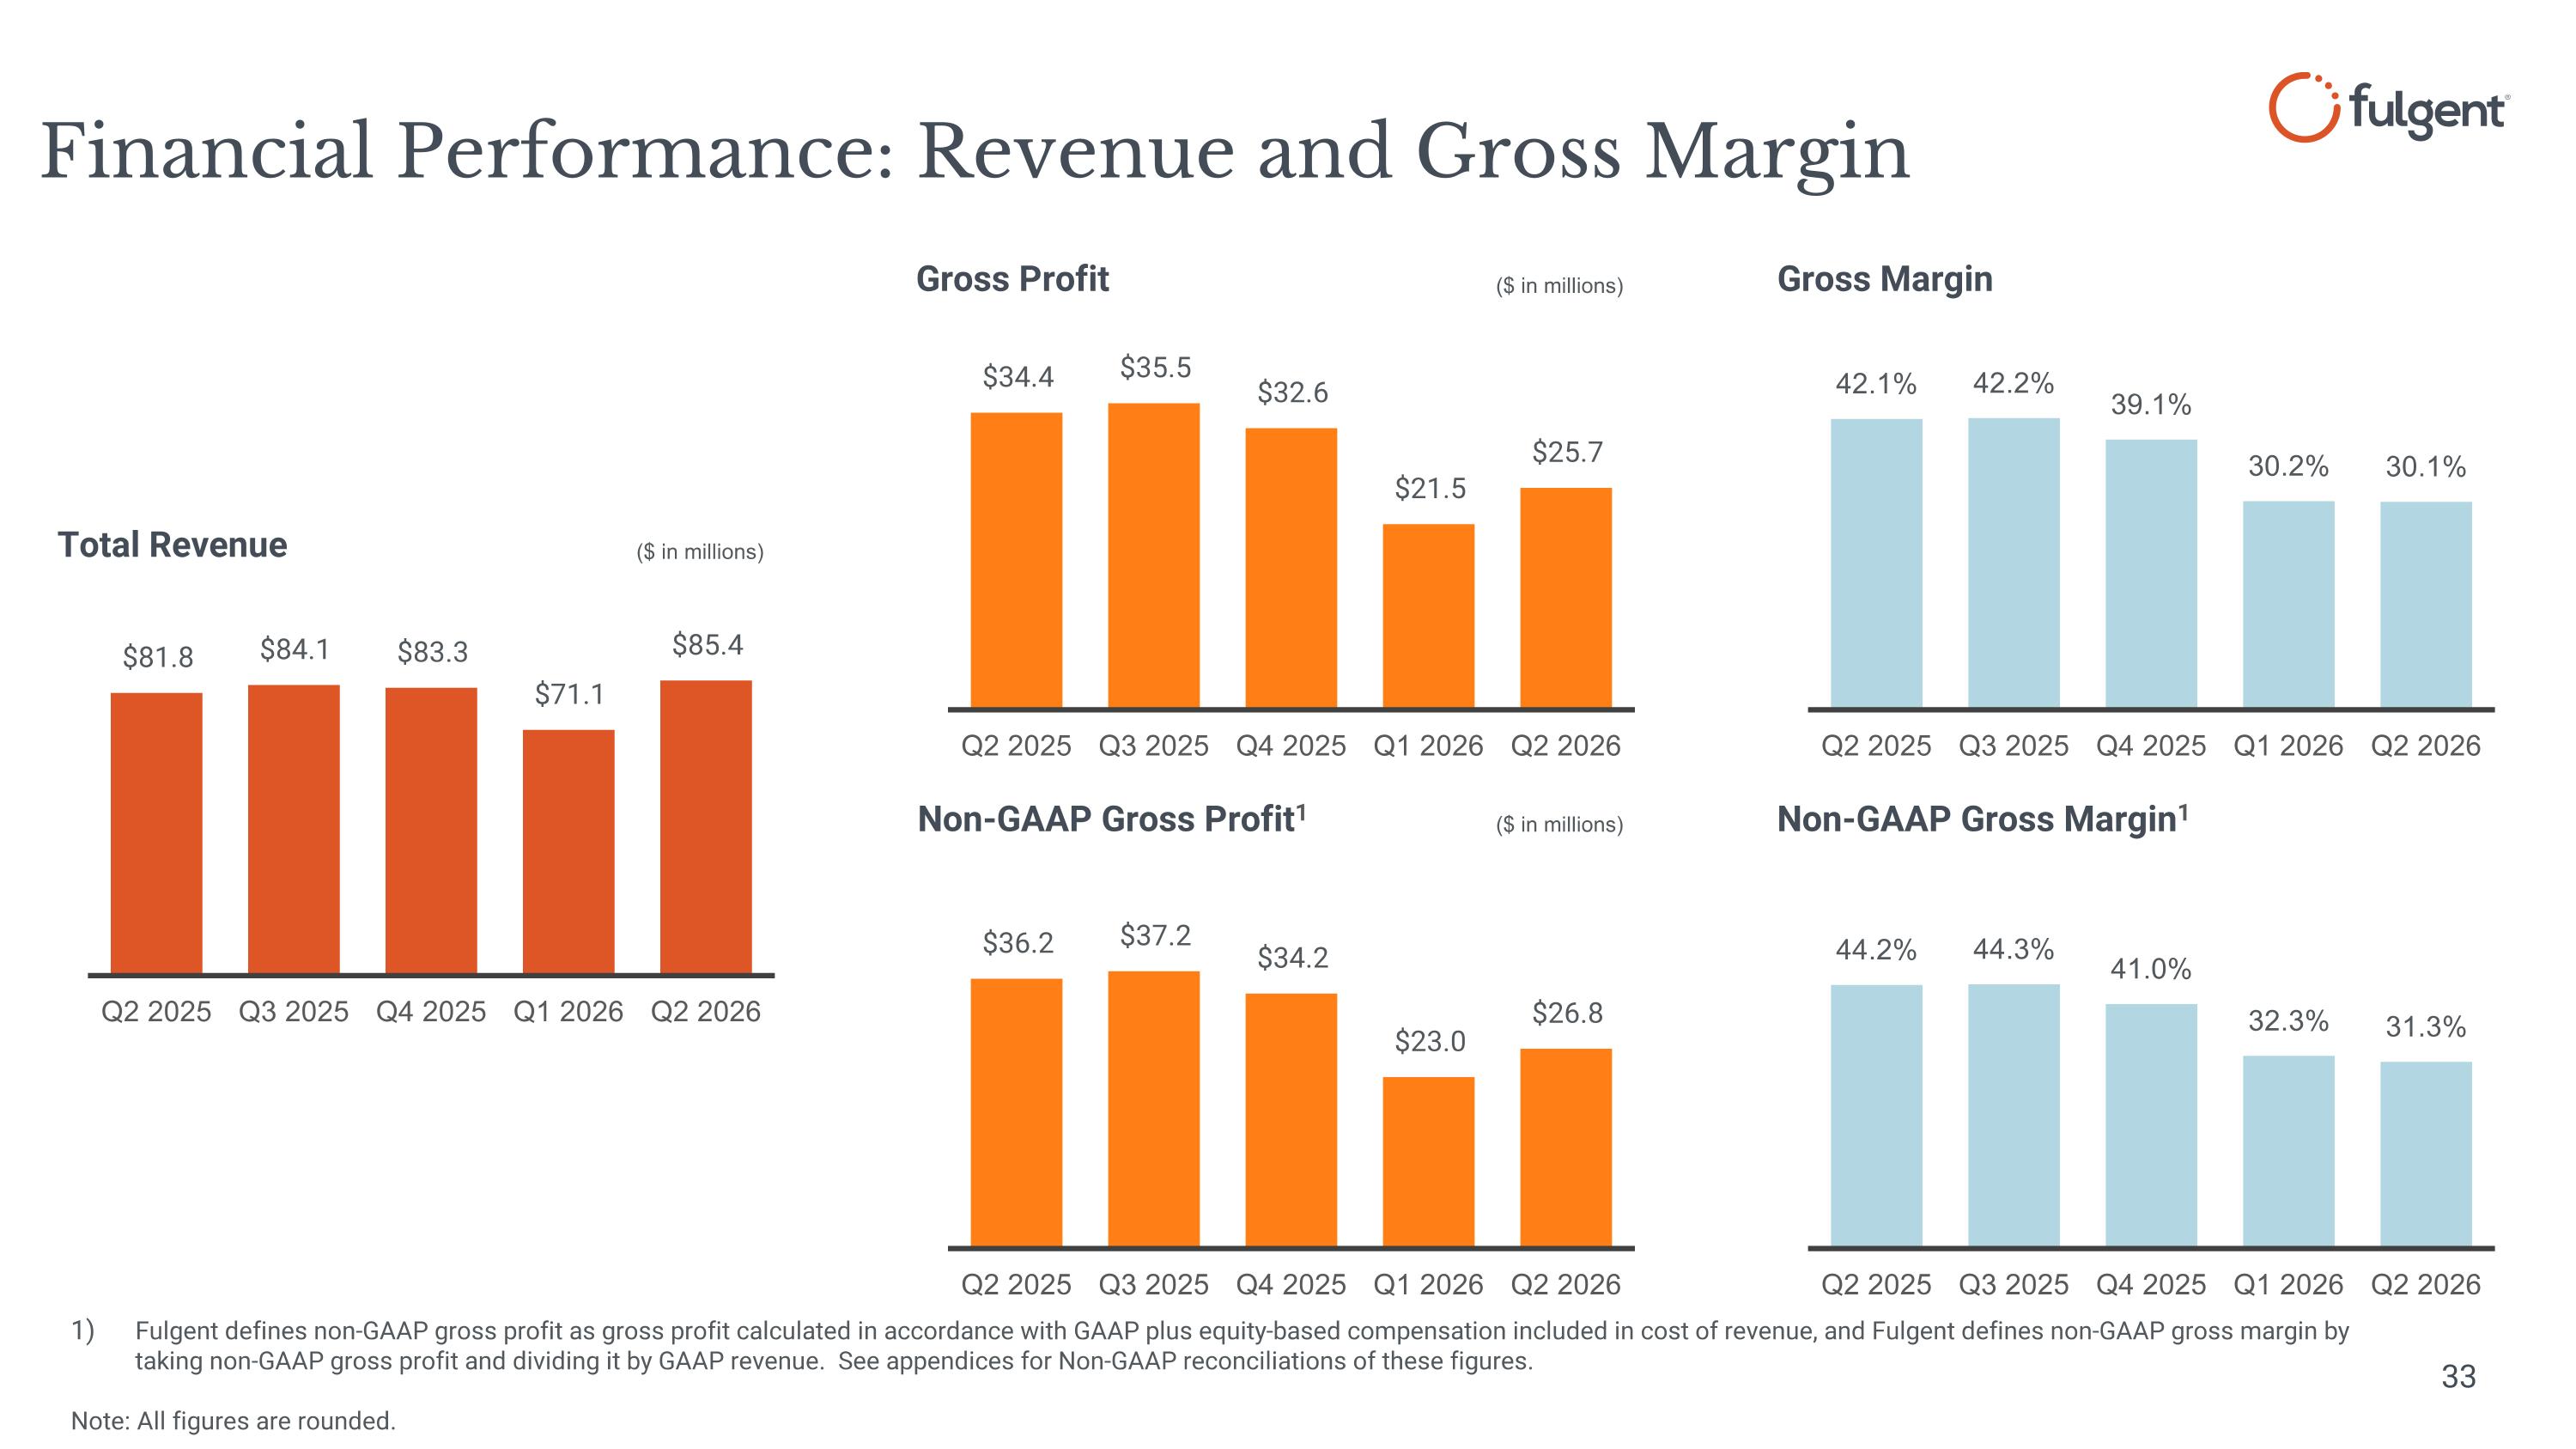
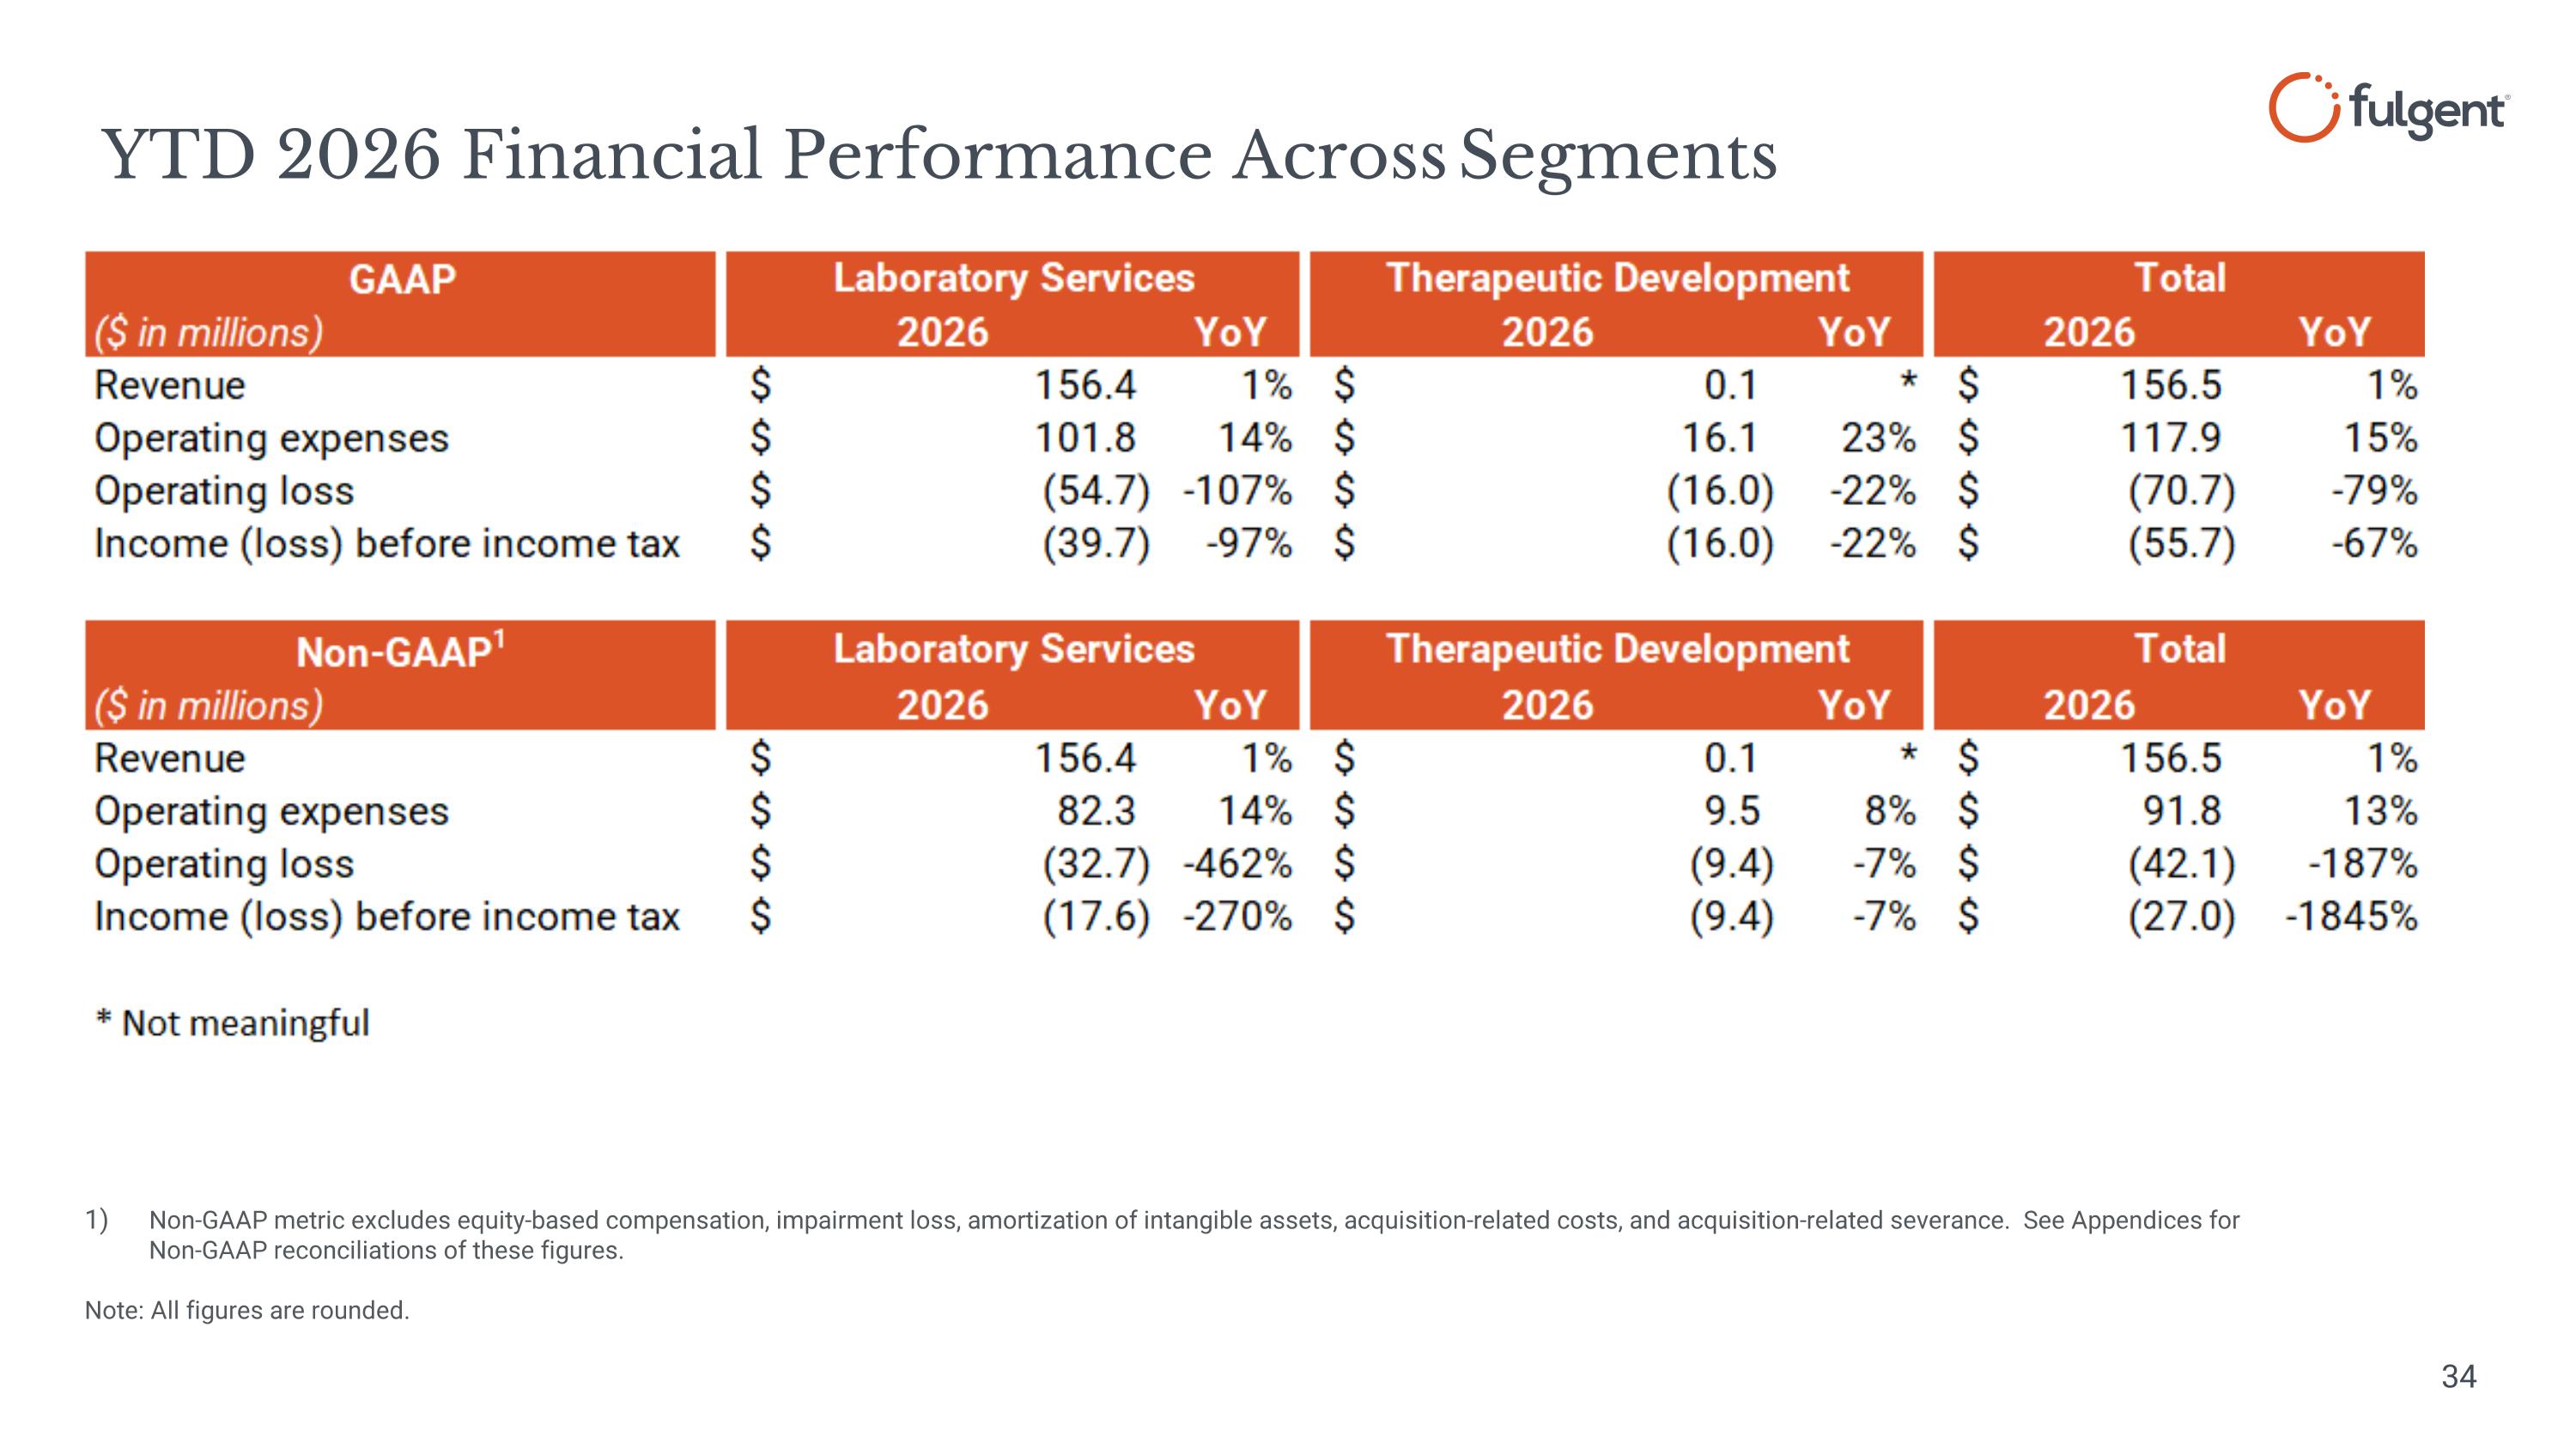
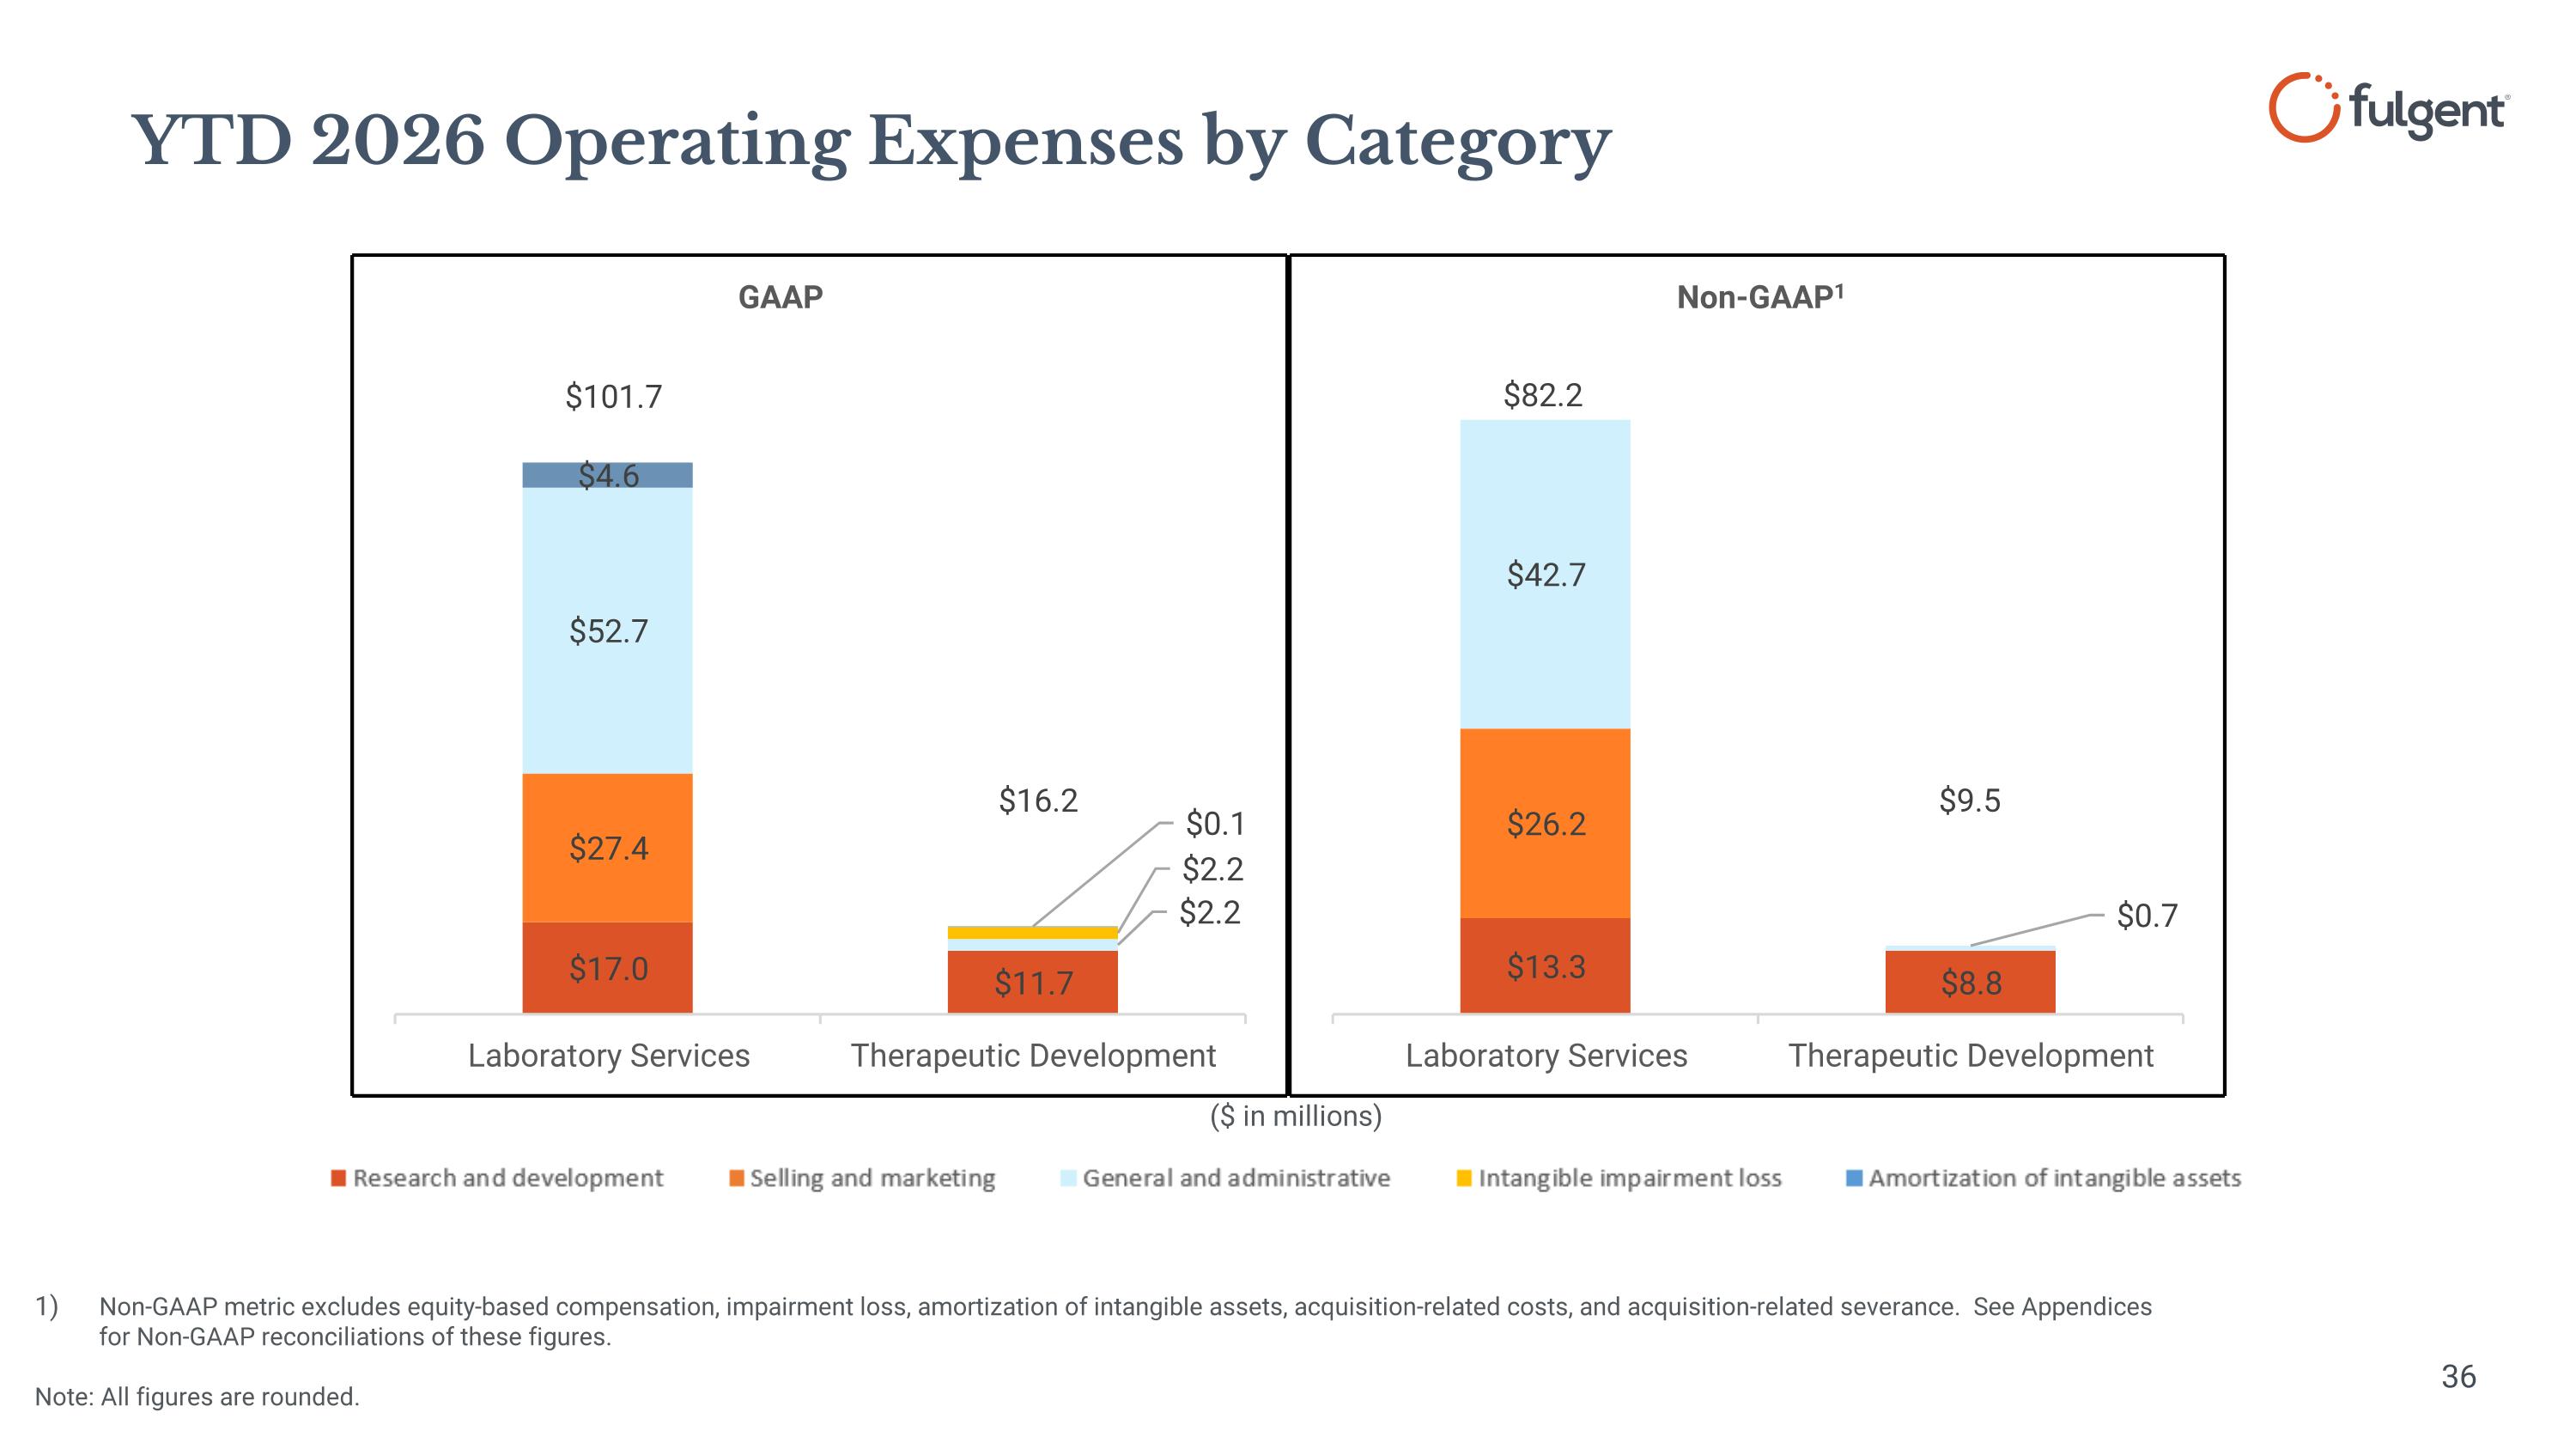
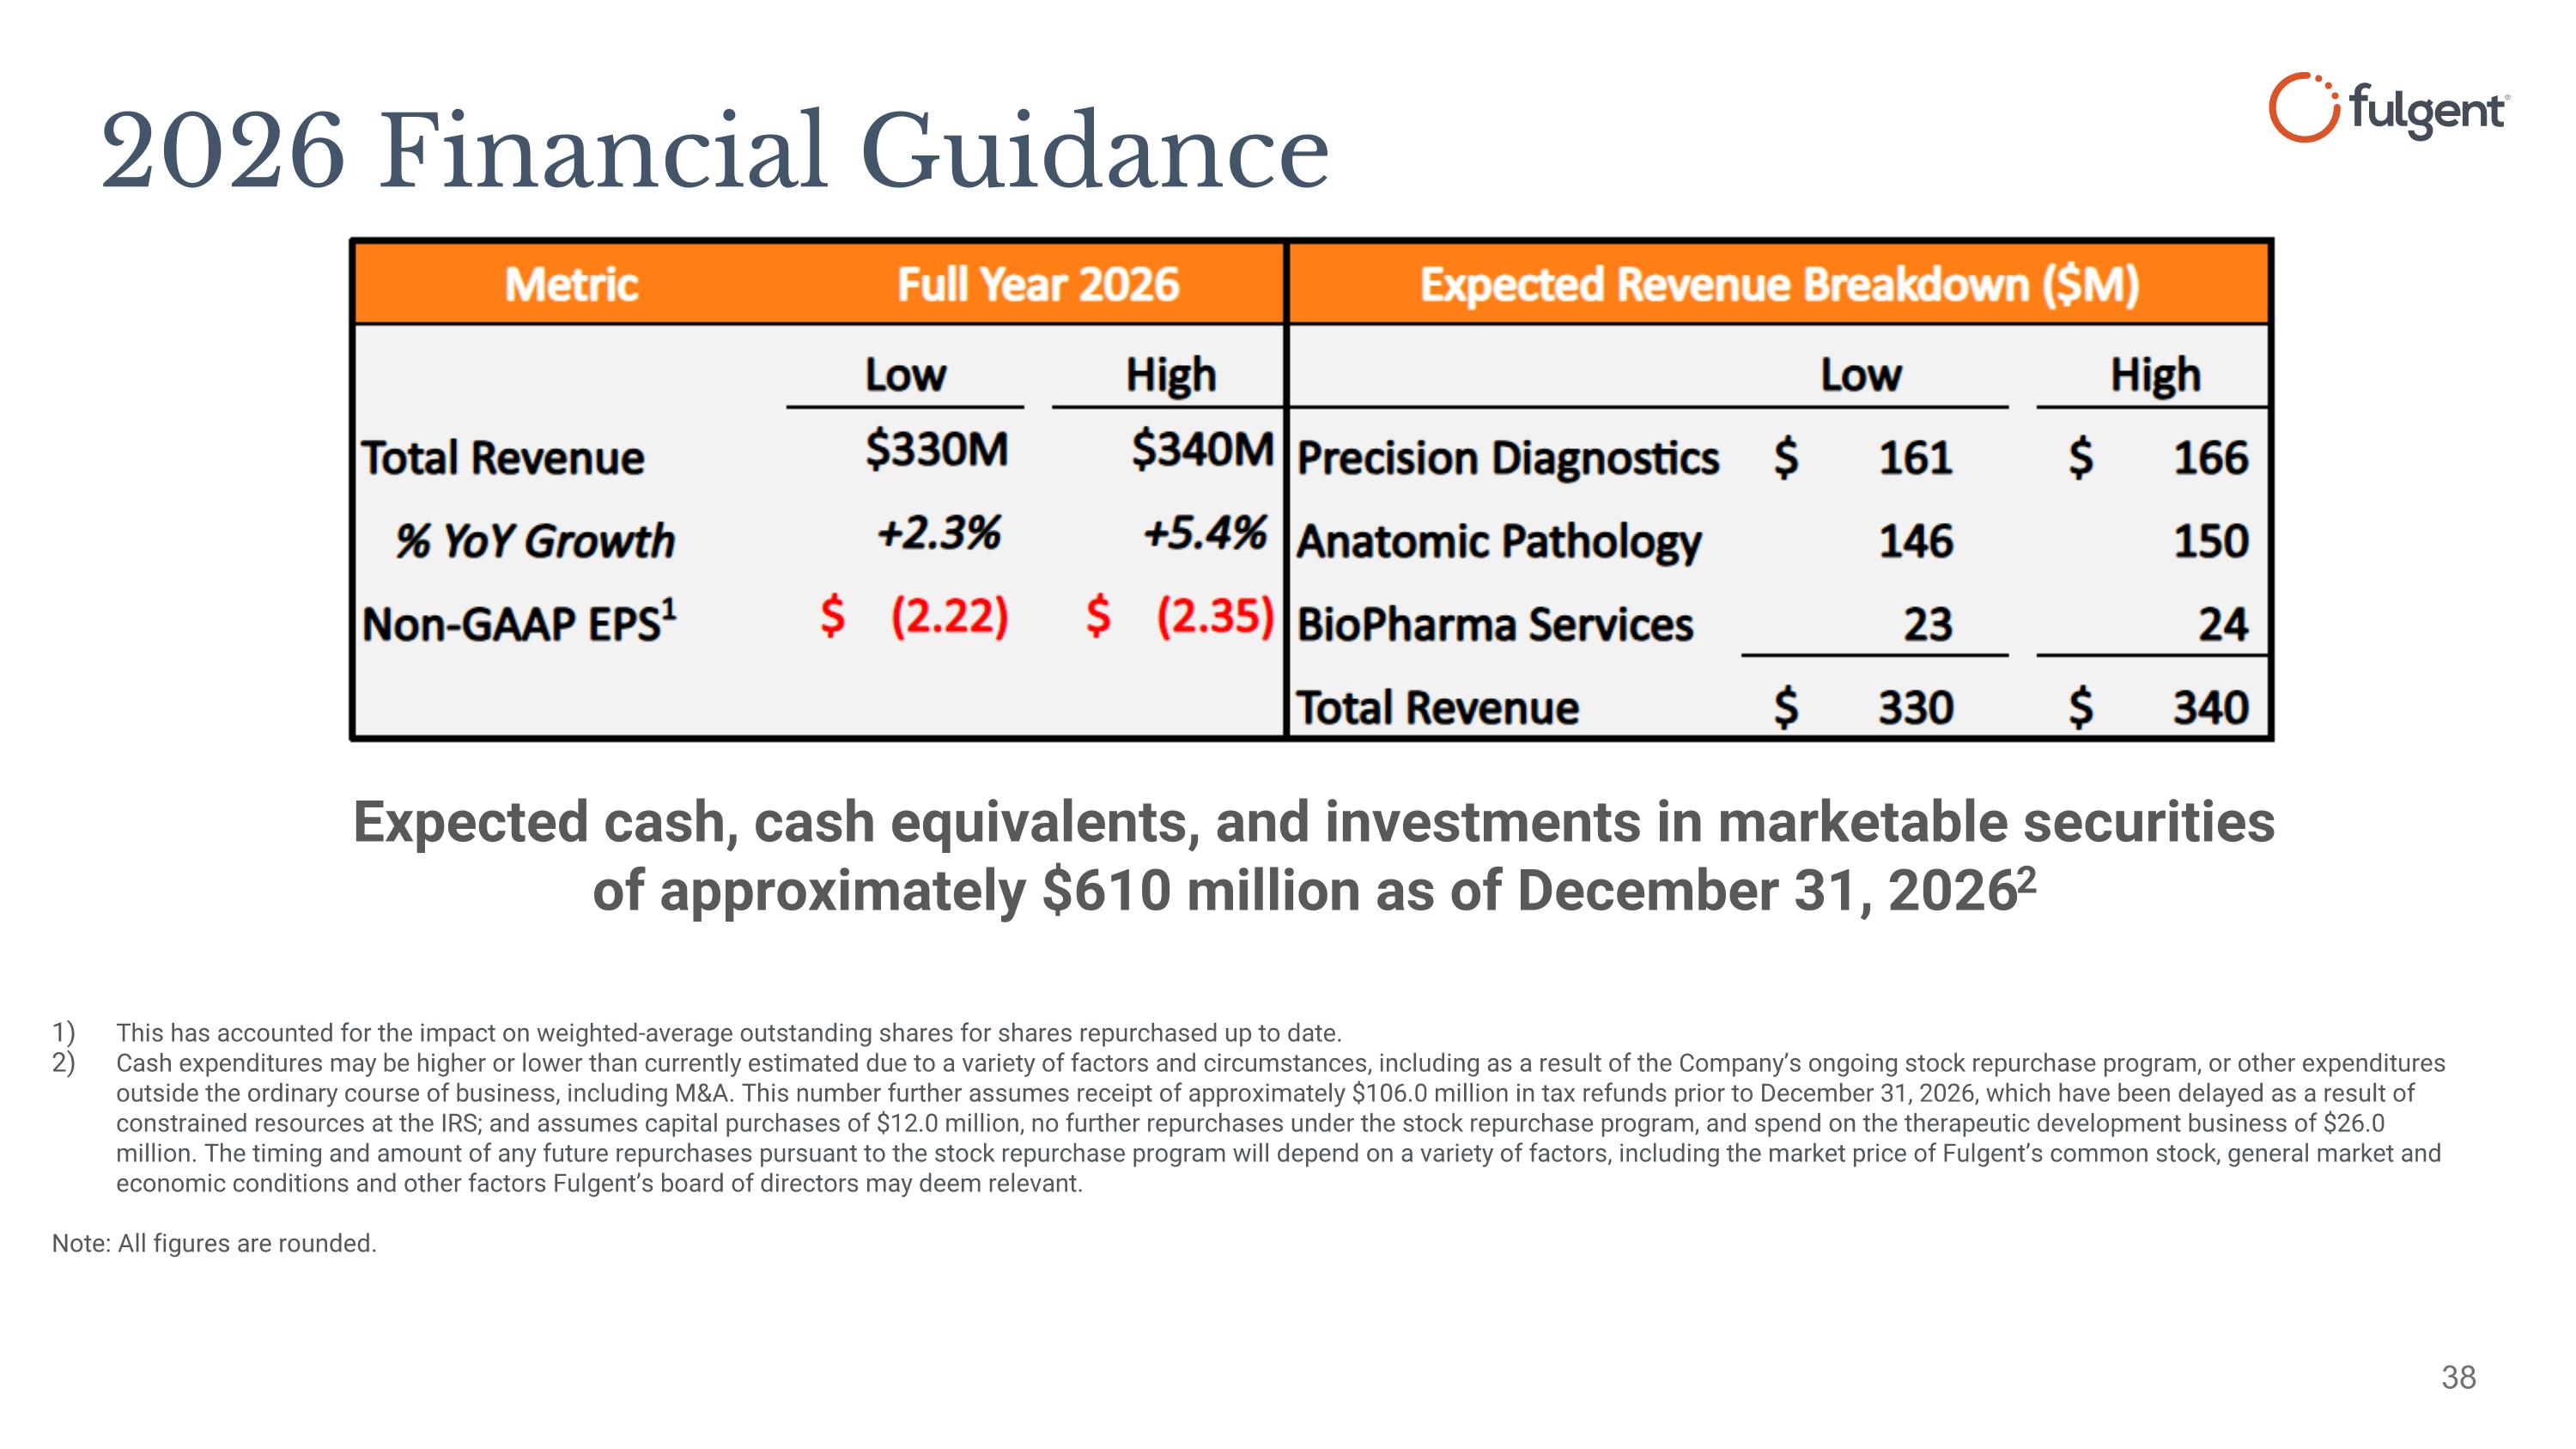
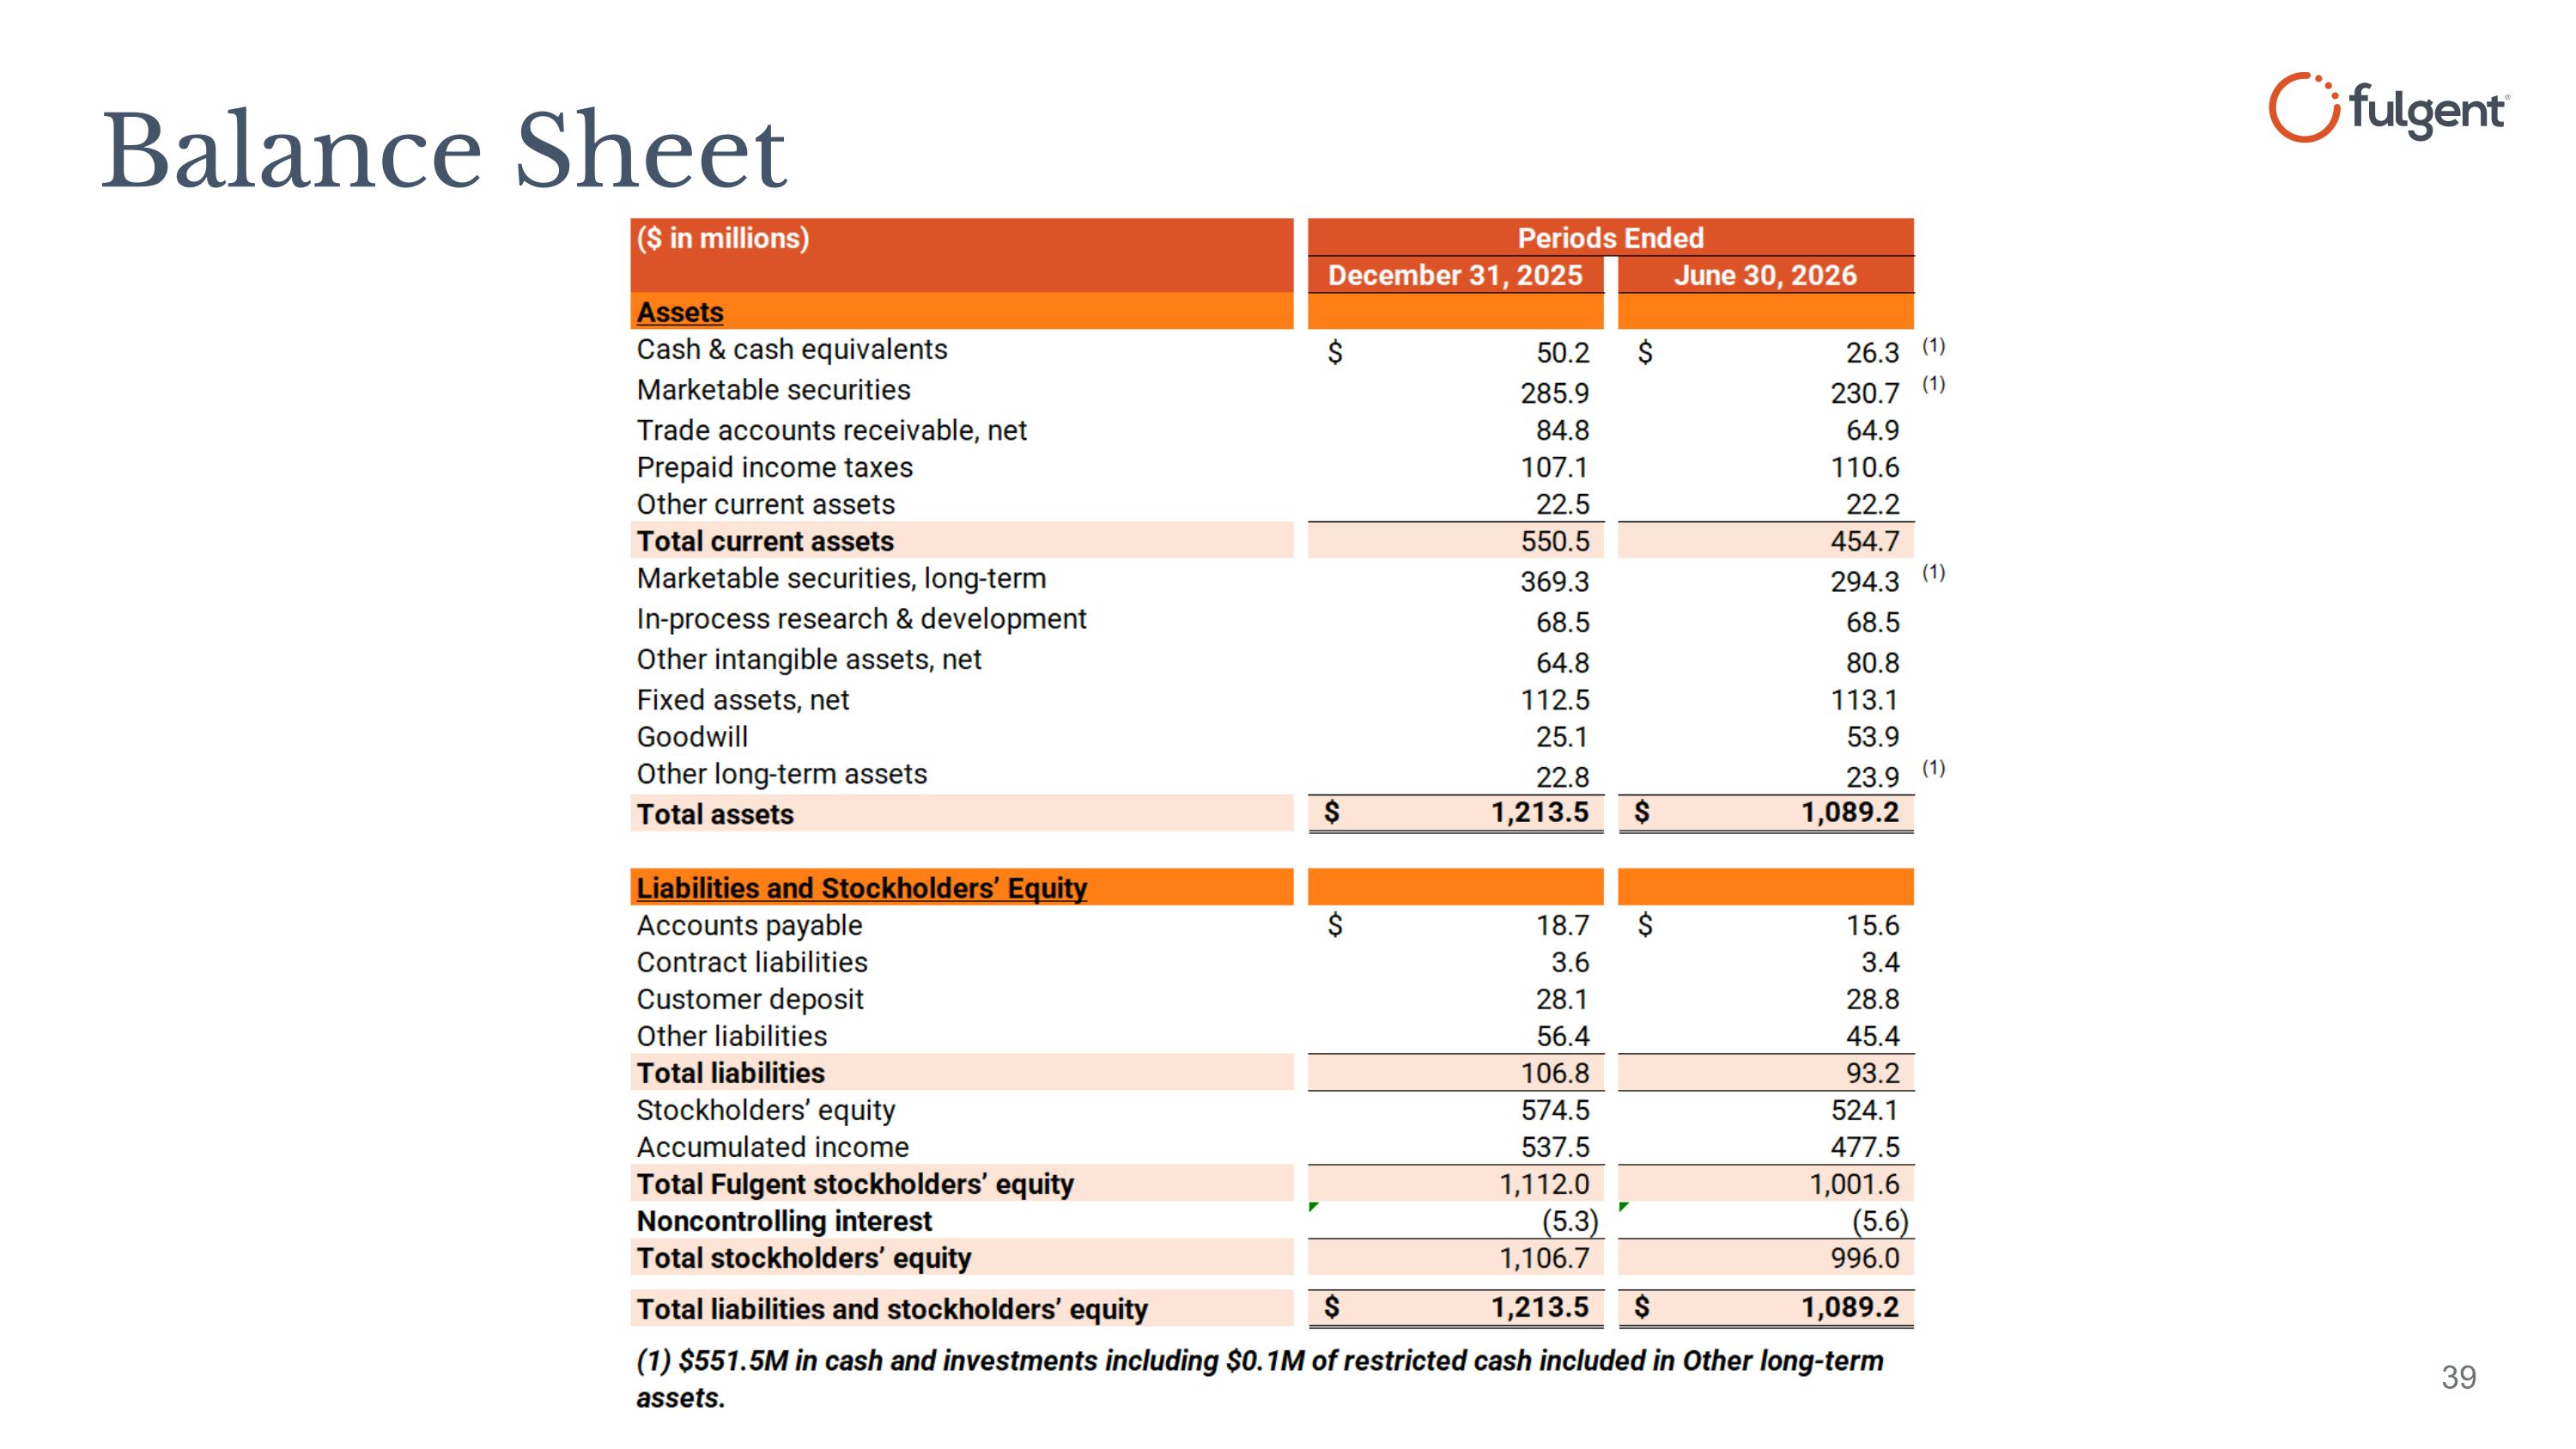
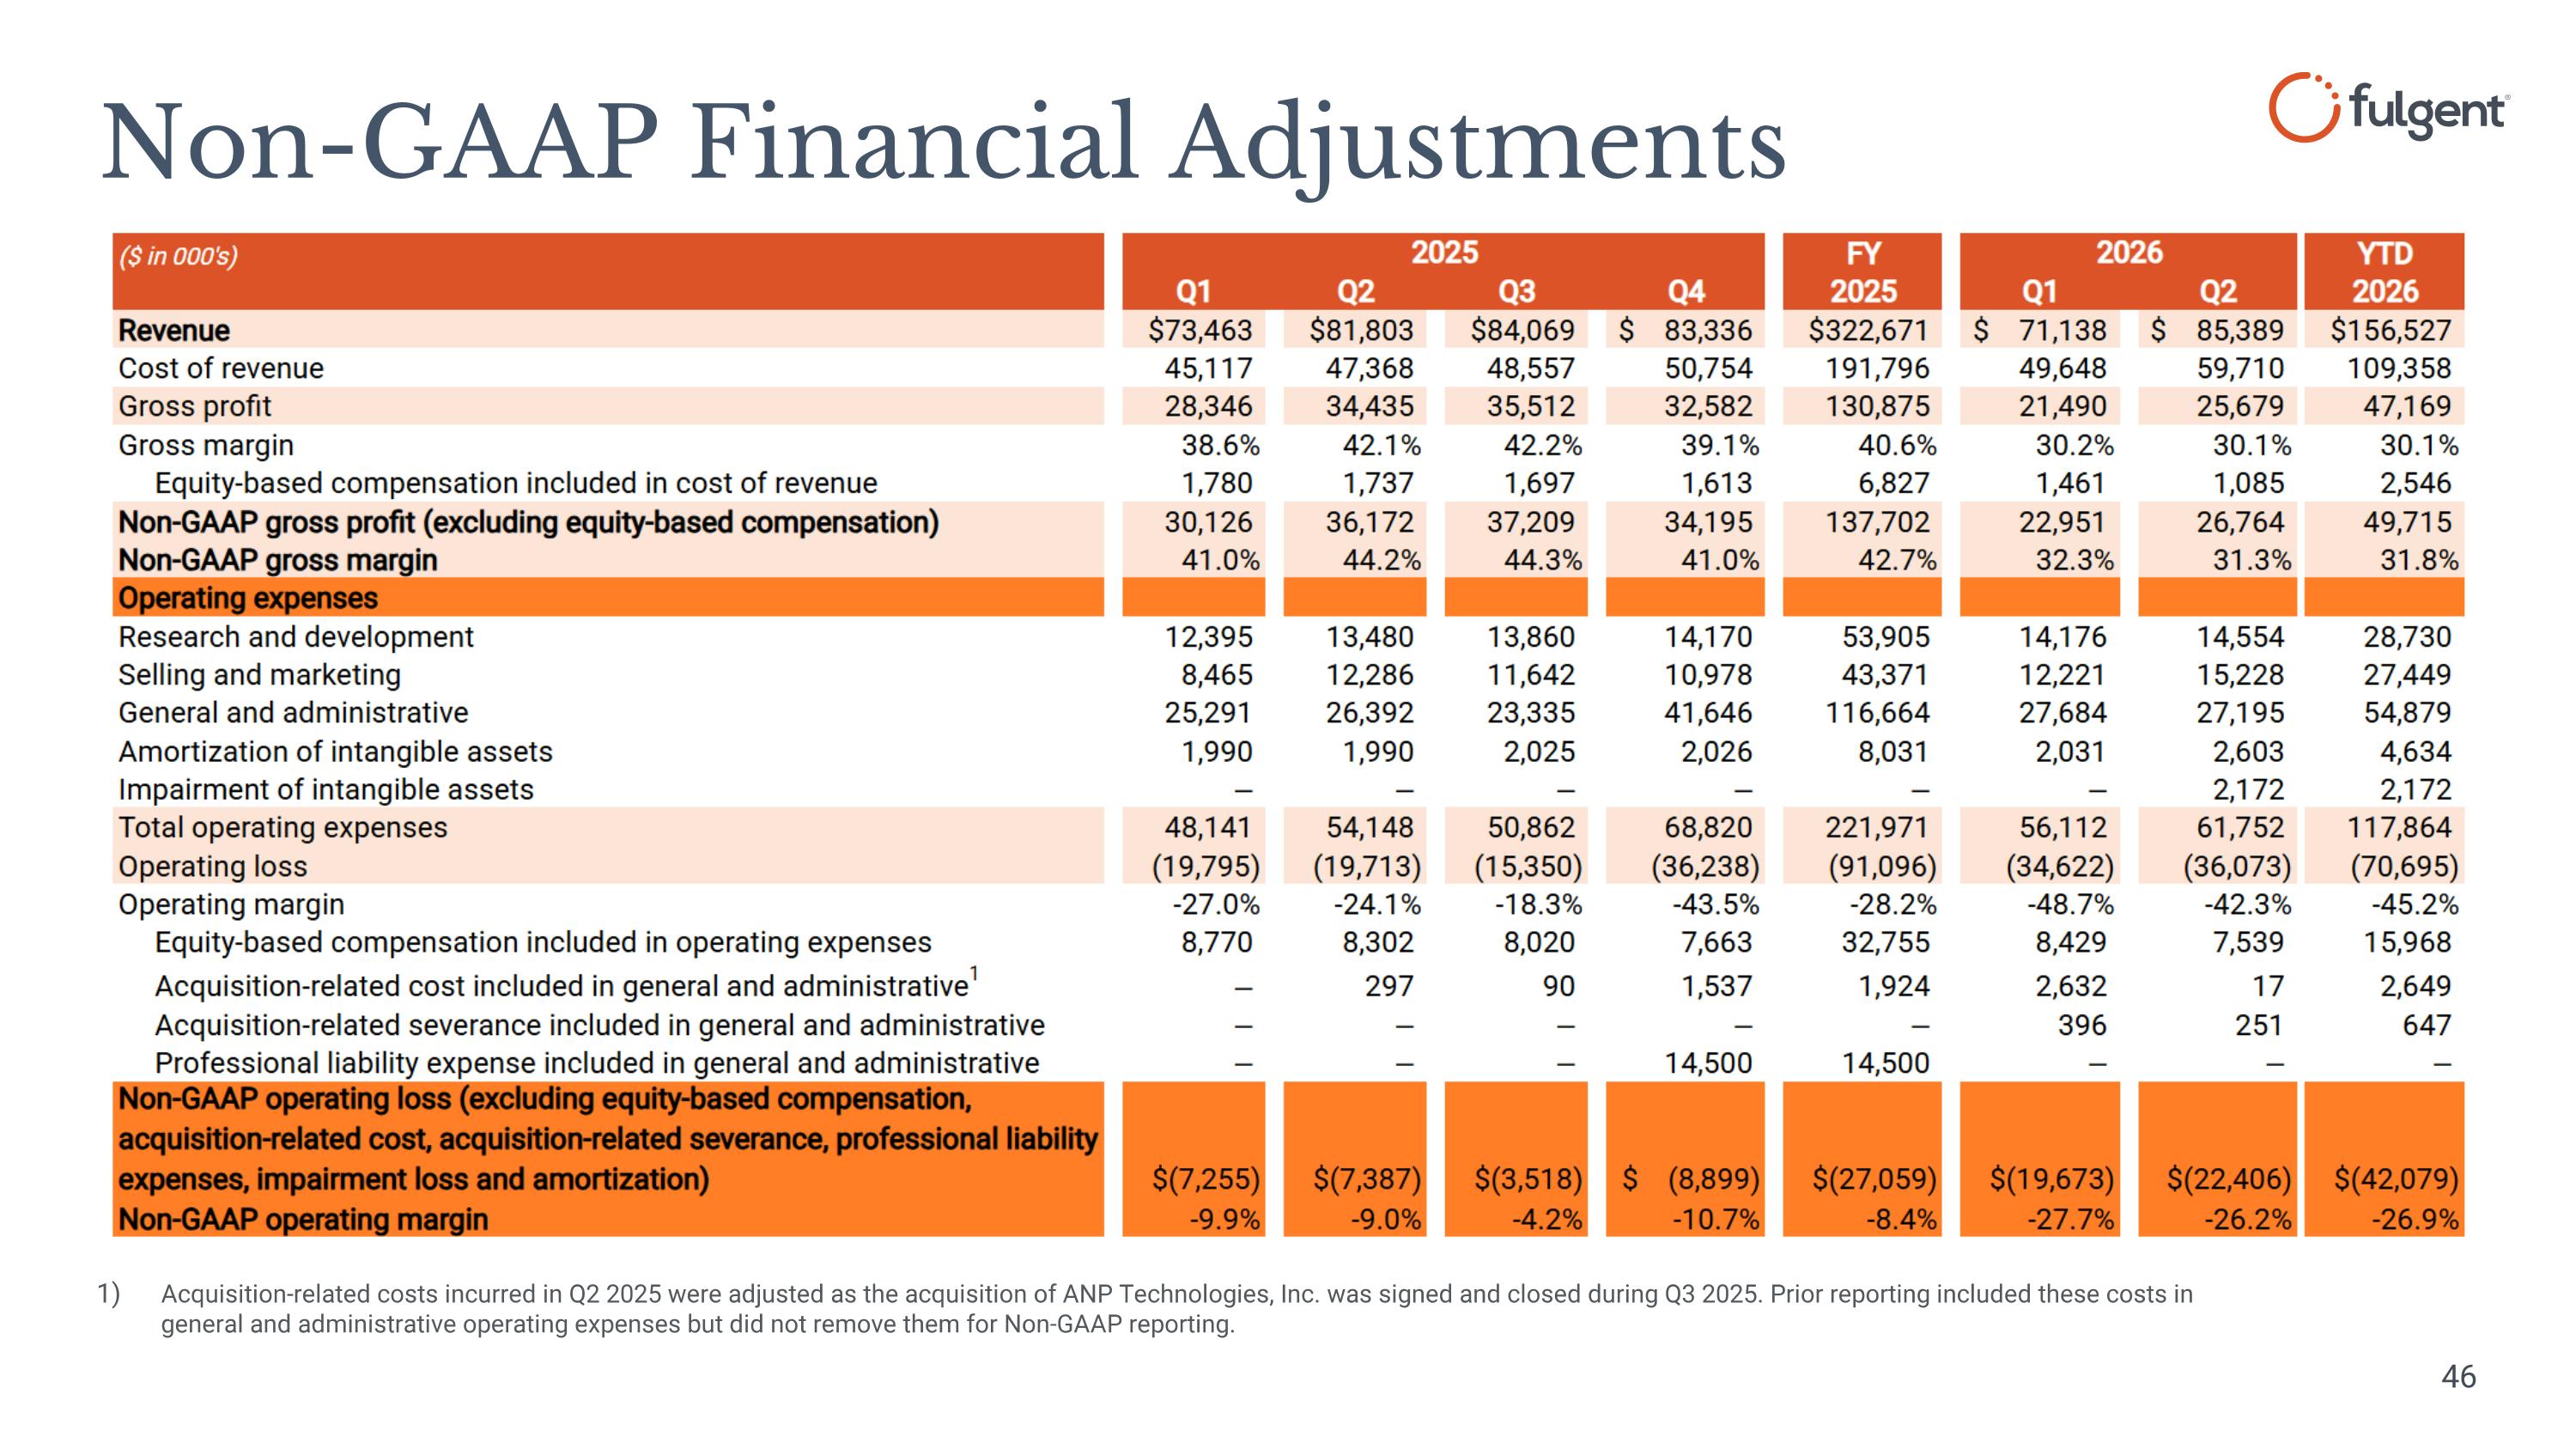
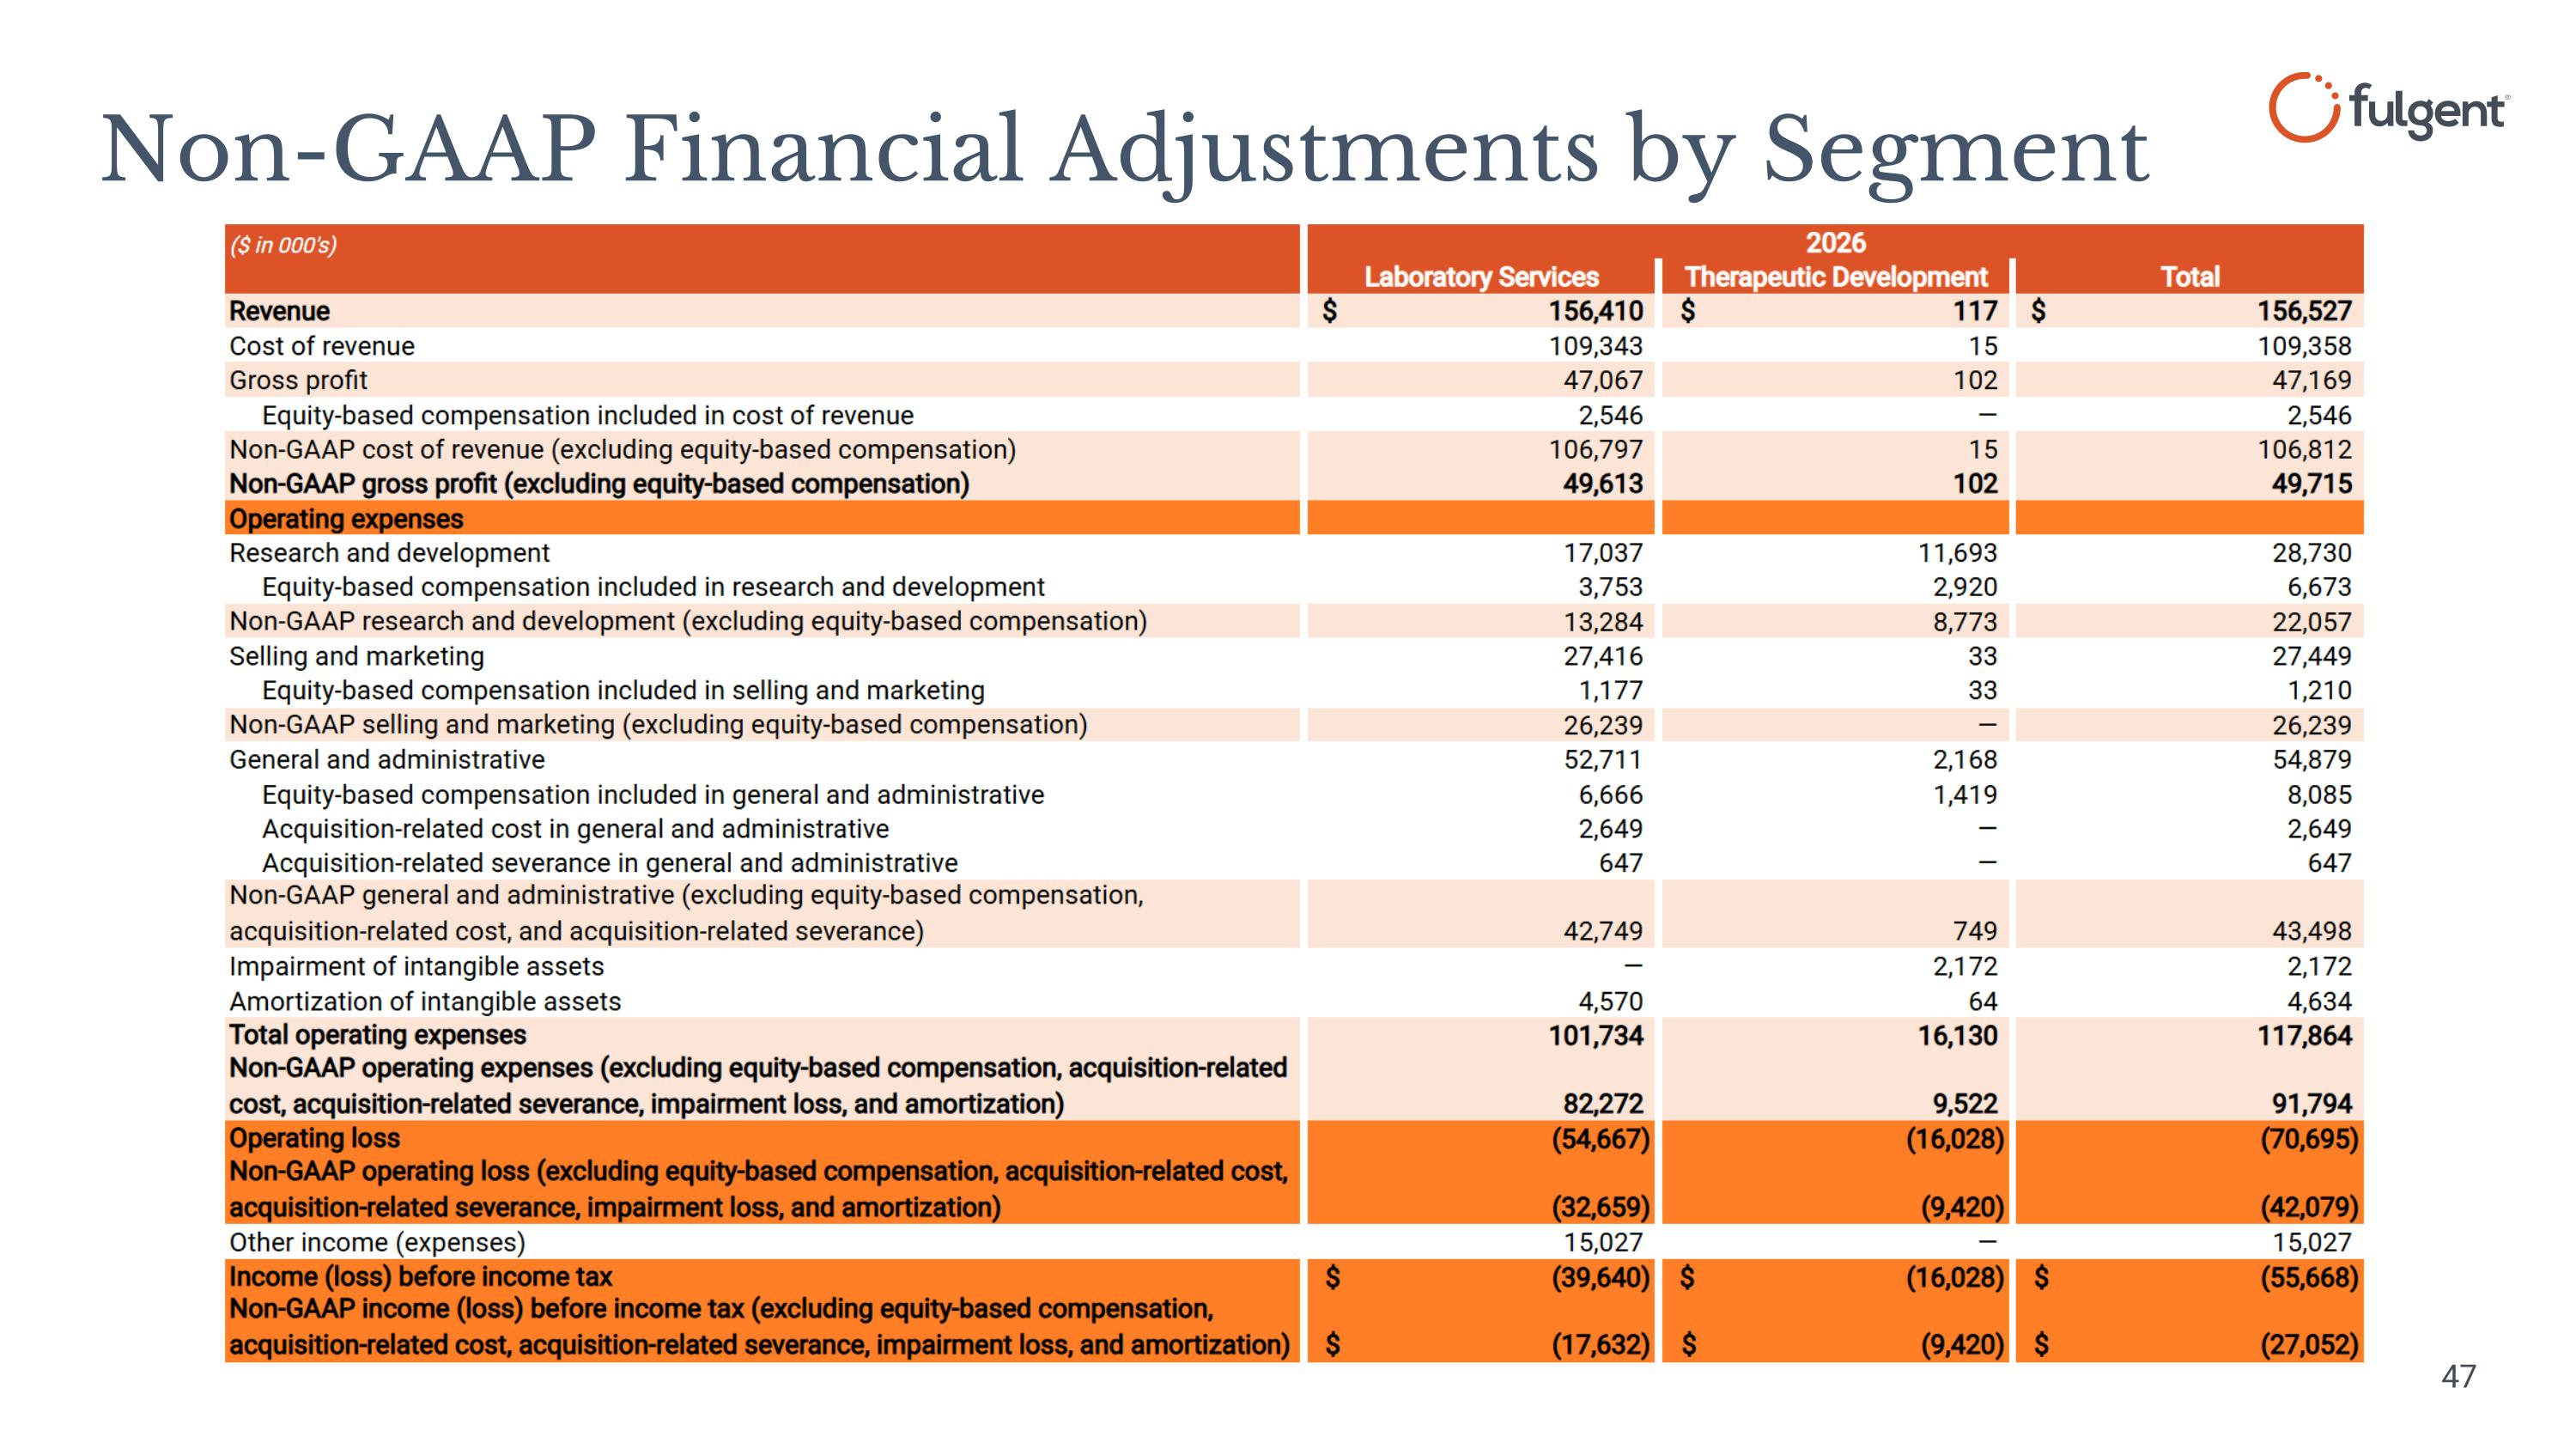
Thank you, Brandon. Revenue in the second quarter of 2026 totaled $85.4 million, including $16.9 million from BACO Diagnostics and Strata DX, compared to $71.1 million in the first quarter of 2026. The increase in our Q2 revenue was primarily due to the integration of BACO Diagnostics and Strata DX for the full quarter. Gap gross margin was 30.1%, and non-gap gross margin for the second quarter was 31.3%. The decline in gross margin reflects fixed costs spread over a lower revenue base, driven by the lower collection rate. We expect gross margins to normalize as our collection rate returns to historical norms and as revenue increases. Now turning to operating expenses. Total GAAP operating expenses were $61.8 million for the second quarter, which increased when compared to $56.1 million in the prior quarter. The increase in operating expenses was due to BACO Diagnostics and Strata DX being integrated for the full quarter. The GAAP operating expenses also include a one-time impairment charge on customer relationship and tangible asset of $2.2 million related to loss of a customer in the therapeutic development segment. Non-GAAP operating expenses also increased in Q2, totaling $49.2 million compared to $42.6 million in the previous quarter. Gap operating margin improved to a minus 42.3% in Q2 compared to a minus 48.7% in Q1. Non-gap operating margin improved sequentially to a minus 26.2% in Q2 compared to a minus 27.7% in Q1. Our gap loss in the current quarter was $29.5 million, an increase from prior quarter's gap loss of $24.8 million. and a gap loss of $1.05 per share based on $28 million weighted average diluted shares outstanding. On a non-gap basis and excluding equity-based compensation expense, intangible asset amortization, impairment loss, and acquisition-related costs and severance, loss for the quarter was approximately $16.2 million or $0.58 per share based on $28 million weighted average diluted shares outstanding. Adjusted EBITDA for the second quarter was a loss of approximately $17.1 million, compared to a loss of $15.2 million in the prior quarter. In the second quarter, we repurchased over 1.5 million shares of our stock repurchase program. Since the inception of the stock repurchase program in March 2022, a total of over 7.5 million shares of our common stock has been repurchased under the program, with approximately $75.8 million currently remaining available for future repurchases of our common stock. Turning to the balance sheet, we end the second quarter with approximately $551.5 million in cash, cash equivalent, restricted cash, and marketable security. The $53.2 million decrease in cash from the previous quarter is primarily driven by $23.8 million spent on our stock repurchase program, a one-time $13.5 million payment towards a legal sentiment, which was originally discussed and accrued in Q4 of 2025, and a $14.1 million cash used in operations in CapEx. As of quarter end, we have not yet received the $106.1 million federal income tax refund, which has been delayed due to a constrained resources at the IRS. Before providing our guidance for 2026, I'd like to provide an update on certain drivers shaping our expectations for the year and anticipated impact from our recent acquisition of BAPA Diagnostics and Strata DX. Our revised outlook for 2026 is based on lower than originally anticipated rate of collections. Core customer volume assumptions remain consistent with our original outlook, but we've also moderated our new business growth expectations. Additionally, we anticipated and mentioned on our call in February and April, we saw a decrease in revenue from our largest customer, which is moving its testing capabilities in-house. Revenue from this customer this quarter decreased $4.6 million from the prior quarter. We anticipate a continued decline in revenue from this customer through the second half of the year. We believe this decrease in revenue from our largest customer will be partially or fully offset by the estimated contribution of approximately $53 million from Baco and Strata DX, contributing to overall revenue growth in the second half of the year. Baco's revenue will primarily be categorized as anatomic pathology. We continue to forecast that for full year 2026, no single customer will account for more than 10% of our total revenue, reflecting an improvement in our customer concentration profile. We are revising our full year revenue guidance. We now expect total revenue to be in the range of $330 million to $340 million for 2026, down from our prior guidance of $350 million. This represents a year-over-year growth of 2.3% and 5.4%. We now estimate precision diagnostics revenues to be approximately $161 to $166 million, anatomic pathology to be approximately $146 to $150 million, and biopharma services to be approximately $23 to $24 million. On margins, we now expect full-year non-gap gross margins to be in the mid-30% range, reflecting product mix shifts tied to our change in customer composition and lower collection rates associated with the transition of our new revenue cycle management and billing system. We expect non-GAAP operating margins to be in the mid-minus 20% for the year. We continue to prioritize investment across two key areas, R&D, where we are advancing our laboratory testing capabilities and clinical study pipelines and sales and marketing, where we have grown the team. Our sales and marketing spend this year reflects the full year of our expansion that began last year, combined with the recent BACO and Strata DX acquisition, which more than doubled their sales team. The anticipated spend for the therapeutic development business remains at approximately $26 million in 2026 as we continue advancing clinical trials for FID 022 and FID 007. We remain committed to strategic investment in our business, including operational improvements and targeted upgrades to our laboratory infrastructure. These investments are designed to strengthen our competitive position and enhance throughout capacity over time. We believe our foundational technology platform is highly scalable, capable of driving meaningful operating leverage and margin expansion as volumes grow. The updates to our EPS and cash guidance are attributable to our revised revenue guidance and the decreased shares resulting from the stock repurchase program and the cash used for these repurchases. Our forecasted average fully diluted share account for 2026 has decreased from approximately 29 million shares to approximately 28 million shares due to additional shares purchased under our stock repurchase program since our last earnings call. Using the updated average share count of 28 million and revised revenue guidance, we now expect full year 2026 non-GAAP EPS guidance to be a loss of $2.22 to $2.35 per share. This excludes stock-based compensation, impairment loss, acquisition-related costs, amortization of intangible assets, and any further share repurchases, as well as any one-time charges. Finally, our cash possession remains strong. For fiscal year 2026, assuming capital purchases of $12 million, spend on our therapeutic development business of $26 million, and excluding any future stock repurchases or other expenditures outside of ordinary course, which could include additional M&A. We anticipate ending the year with approximately $610 million of cash, cash equivalents, restricted cash and investments, and marketable securities. The decrease from our prior forecast of $636 million is mainly attributable to the $15.2 million of stock repurchases made since our last earnings call and revised revenue guidance. We continue to have conviction in the strength of our business and our technology platform and are remedying the internal operations challenge. We're executing against our strategic initiatives to drive AI and digital solutions across our laboratory services business and are proud of the momentum on our pharmaceutical pipeline. We believe we're well positioned for longer-term growth as our strategic investments, innovations, and expanded offerings deliver value. Thank you for joining our call today. Operator, you may now open it up for questions.
Operator
Thank you. We'll now be conducting a question and answer session. If you'd like to be placed in the question queue, please press star one on your telephone keypad. A confirmation tone will indicate your line is in the question queue. You may press star two if you'd like to move your question from the queue. One moment, please, while we poll for questions. Our first question today is coming from David Westenberg from Paper Sandler. Your line is now live.
Hi, guys. This is Karan Patel on for David Westenberg. I guess I'll start with some of the RCM transition issues. Maybe if you could help us pinpoint what specifically in this final phase is causing these maybe delayed issues, and do you have maybe an estimated timeline for resolution here? And I have a few follow-ups.
Yeah, certainly. This is Brandon. Thank you for the questions. I think as we mentioned, we did make this change in our billing software. We completed phase one and phase two of that. As we moved into phase three, we really began to realize there was just certain key features or customization that was in the previous software that did not carry over to the new platform. I think we've identified those features. We're working on implementing those features. It will take some time to get some feedback from the payers, but in terms of timing, you know, I think we do expect to get back to our historical collection rates in the coming quarters.
That's helpful. Thank you. And I guess maybe if you can help us pinpoint maybe what percentage of QQ revenues were lowered because of this suppressed collection rate. And then I guess separately, are these delayed collections, are they maybe recoverable down the road and they show up as true ups in future quarters, or is it a fully loss of revenue?
Karan, this is Paul Kim. In terms of the shortfall for Q2, as well as for the rest of the year, without this issue that Brandon, he described, we would have reiterated our fiscal year guidance and Q2 would have been in line with our original expectations. If you kind of like take a step back and look at the overall business, our capabilities and our services, they haven't changed at all. actually, they've gotten better. And the volume and the volume projections, you know, for the business are intact, and it actually looks very promising. It's just the collection rate that we're using to record revenues, you know, it's been lower than our historical rates. And you also had a question on recoverability. Assuming, and, you know, we can't assume this because we experienced this before, we can get back to the historical rates. You know, our business, you know, would have been fine in terms of, you know, posting our Q2 results as well as for the year. And should we get additional, you know, synergies from, you know, better contracts and better effort that we have here at the company, you know, there could be, you know, potentially upside to our collection rate. I mean, that's getting a little too far ahead of ourselves. For right now, you know, what we want to do is to remedy this issue. We want to be able to, you know, get back to our historical collection rates and then go on from there.
That is helpful. Thank you for that color. And maybe one last one on the large carrier screening customer moving volumes in-house. I guess, can you help us maybe, is that transition kind of fully complete? I know you mentioned that earlier. And maybe, what is the residual run rate? Like, how can we think about that going forward?
Yeah, that transition is merely fully complete. And if I'm not mistaken, Paul, I think we don't have much revenue built into the model for them, the back half of the year.
We still are getting some. We still are getting some. But we don't have a whole lot built into our projections. guys.
Well, thank you so much and no more from me.
Operator
Thank you. Thank you. We reached end of our question and answer session. And ladies and gentlemen, that does conclude today's teleconferencing webcast. And we just connect your lines at this time and have a wonderful day. We thank you for your participation today.