
SEIC 8-K
Sei Investments Co (SEIC)
8-K
2026-04-22
For: 2026-04-22
View Original
Added on
April 22, 2026
UNITED STATES
SECURITIES AND EXCHANGE COMMISSION
Washington, D.C. 20549
________________________________________
FORM 8-K
________________________________________
CURRENT REPORT
PURSUANT TO SECTION 13 OR 15(D)
OF THE SECURITIES EXCHANGE ACT OF 1934
Date of report (Date of earliest event reported)
________________________________________
________________________________________
(Exact name of registrant as specified in charter)
________________________________________
(State or Other Jurisdiction of Incorporation) | (Commission File Number) | (I.R.S. Employer Identification No.) | ||||||||||||
(Address of Principal Executive Offices and Zip Code)
(610 ) 676-1000
(Registrants’ Telephone Number, Including Area Code)
________________________________________
Check the appropriate box below if the Form 8-K filing is intended to simultaneously satisfy the filing obligation of the registrant under any of the following provisions:
| Written communications pursuant to Rule 425 under the Securities Act (17 CFR 230.425) | |||||
| Soliciting material pursuant to Rule 14a-12 under the Exchange Act (17 CFR 240.14a-12) | |||||
| Pre-commencement communications pursuant to Rule 14d-2(b) under the Exchange Act (17 CFR 240.14d-2(b)) | |||||
| Pre-commencement communications pursuant to Rule 13e-4(c) under the Exchange Act (17 CFR 240.13e-4(c)) | |||||
Securities registered pursuant to Section 12(b) of the Act:
| Title of each class | Trading Symbol | Name of each exchange on which registered | ||||||||||||
Indicate by check mark whether the registrant is an emerging growth company as defined in Rule 405 of the Securities Act of 1933 (§230.405 of this chapter) or Rule 12b-2 of the Securities Exchange Act of 1934 (§240.12b-2 of this chapter).
Emerging growth company ☐
If an emerging growth company, indicate by check mark if the registrant has elected not to use the extended transition period for complying with any new or revised financial accounting standards provided pursuant to Section 13(a) of the Exchange Act. ☐
Item 2.02. Results of Operations and Financial Condition.
On Wednesday, April 22, 2026, SEI Investments Company (the "Company") issued a press release announcing its financial and operating results for the first quarter ended March 31, 2026. A copy of the press release is furnished as Exhibit 99.1 and incorporated in this Item 2.02 by reference. A recording of the earnings call referenced in the press release furnished as Exhibit 99.1 is available for replay on the Company’s website at ir.seic.com/events-presentations/events.
As provided in General Instruction B.2 to Form 8-K, the information furnished in this Item 2.02 and Exhibit 99.1 hereto shall not be deemed “filed” for purposes of Section 18 of the Securities and Exchange Act of 1934, as amended, nor shall it be deemed incorporated by reference in any filing with the Securities and Exchange Commission, except as shall be expressly provided by specific reference in such filing.
Item 7.01. Regulation FD Information.
A copy of an earnings presentation that is intended to be used by representatives of the Company is furnished as Exhibit 99.2 to this Current Report on Form 8-K and is incorporated herein by reference.
The information furnished pursuant to Item 7.01 and Exhibit 99.2 hereof shall not be deemed “filed” for purposes of Section 18 of the Securities Exchange Act of 1934, as amended, nor shall it be deemed incorporated by reference in any filing with the Securities and Exchange Commission, except as shall be expressly provided by specific reference in such filing.
Item 9.01. Financial Statements and Exhibits.
| Exhibit No. | Description | |||||||
| 99.1 | ||||||||
| 99.2 | ||||||||
| 104 | Cover Page Interactive Data File (embedded within the Inline XBRL document) | |||||||
SIGNATURES
Pursuant to the requirements of the Securities Exchange Act of 1934, the registrant has duly caused this report to be signed on its behalf by the undersigned hereunto duly authorized.
| SEI INVESTMENTS COMPANY | |||||||||||
| Date: | April 22, 2026 | By: | /s/ Sean J. Denham | ||||||||
| Sean J. Denham Chief Financial and Chief Operating Officer | |||||||||||

SEI Reports First-Quarter 2026 Financial Results
OAKS, Pa., Apr. 22, 2026 – SEI Investments Company (NASDAQ:SEIC) today announced financial results for the first quarter 2026. Relative to the first quarter 2025, EPS increased by 20%, and revenue and operating income grew by 13% and 21%, respectively, with operating margin increasing to 30%. On an adjusted basis, EPS and operating income grew 21% and 24%, respectively, with the adjusted operating margin increasing to 32%.
Consolidated Overview | ||||||||||||||||||||
(In thousands, except earnings per share) | For the Three Months Ended March 31, | |||||||||||||||||||
2026 | 2025 | % | ||||||||||||||||||
U.S. GAAP Basis | ||||||||||||||||||||
Revenues | $622,183 | $551,344 | 13% | |||||||||||||||||
Income from operations | 189,486 | 157,097 | 21% | |||||||||||||||||
Operating margin | 30 | % | 28 | % | 7% | |||||||||||||||
Net income attributable to SEI Investments | 174,487 | 151,517 | 15% | |||||||||||||||||
Diluted earnings per share | $1.40 | $1.17 | 20% | |||||||||||||||||
Non-GAAP Basis(1) | ||||||||||||||||||||
Adjusted income from operations | $198,683 | $160,546 | 24% | |||||||||||||||||
Adjusted diluted earnings per share | $1.44 | $1.19 | 21% | |||||||||||||||||
Adjusted operating margin | 32 | % | 29 | % | 10% | |||||||||||||||
(1) See Non-GAAP Information and Reconciliations on pgs 10-11
“We began 2026 with a defining quarter for SEI, validating our strategy, execution, and the scalability of our operating model. We delivered strong earnings growth, meaningful margin expansion, and incredible sales results, driven by broad-based momentum across our core growth engines," said CEO Ryan Hicke.
"Client demand for outsourcing, technology and administrative excellence, and professional services continues to accelerate. Additionally, evidence of progress in asset management is building, and our ongoing investment in AI and automation is strengthening the foundation of a more nimble, innovative, scalable, and resilient enterprise. We believe SEI is well positioned to deliver sustained value for our clients, employees, and shareholders.”
1
Summary of First-Quarter Results by Business Segment
(In thousands) | For the Three Months Ended March31, | |||||||||||||||||||
2026 | 2025 | % | ||||||||||||||||||
Investment Managers: | ||||||||||||||||||||
Revenues | $220,717 | $192,048 | 15% | |||||||||||||||||
Expenses | 133,839 | 117,211 | 14% | |||||||||||||||||
Operating Profit | 86,878 | 74,837 | 16% | |||||||||||||||||
Operating Margin | 39 | % | 39 | % | ||||||||||||||||
Private Banks: | ||||||||||||||||||||
Revenues | 152,262 | 137,714 | 11% | |||||||||||||||||
Expenses | 120,031 | 114,749 | 5% | |||||||||||||||||
Operating Profit | 32,231 | 22,965 | 40% | |||||||||||||||||
Operating Margin | 21 | % | 17 | % | ||||||||||||||||
Investment Advisors: | ||||||||||||||||||||
Revenues | 169,695 | 136,576 | 24% | |||||||||||||||||
Expenses | 96,357 | 72,455 | 33% | |||||||||||||||||
Non-controlling interests and other, net (A) | 1,337 | — | NM* | |||||||||||||||||
Operating Profit | 72,001 | 64,121 | 12% | |||||||||||||||||
Operating Margin | 42 | % | 47 | % | ||||||||||||||||
Institutional Investors: | ||||||||||||||||||||
Revenues | 71,516 | 68,506 | 4% | |||||||||||||||||
Expenses | 37,137 | 35,870 | 4% | |||||||||||||||||
Operating Profit | 34,379 | 32,636 | 5% | |||||||||||||||||
Operating Margin | 48 | % | 48 | % | ||||||||||||||||
Investments in New Businesses: | ||||||||||||||||||||
Revenues | 7,993 | 16,500 | (52)% | |||||||||||||||||
Expenses | 9,193 | 18,496 | (50)% | |||||||||||||||||
Operating Loss | (1,200) | (1,996) | (40)% | |||||||||||||||||
Totals: | ||||||||||||||||||||
Revenues | $622,183 | $551,344 | 13% | |||||||||||||||||
Expenses | 396,557 | 358,781 | 11% | |||||||||||||||||
Corporate Overhead Expenses | 36,140 | 35,466 | 2% | |||||||||||||||||
Income from operations (B) | $189,486 | $157,097 | 21% | |||||||||||||||||
Adjusted income from operations | $198,683 | $160,546 | 24% | |||||||||||||||||
(A) Primarily includes non-controlling interest and earnings from equity method investments.
(B) Excludes non-controlling interests and other, net
* Variances noted "NM" indicate the percent change is not meaningful.
2
First-Quarter Business Highlights:
•SEI started the year with strong quarterly performance, achieving diluted EPS of $1.40, up 20% from the prior year. On an adjusted basis, EPS increased by 21% relative to the prior year, driven by strong topline growth and margin expansion across SEI's businesses.
•First quarter net sales events totaled $67.2 million, with $57.1 million of that total being recurring; both the total sales events and recurring sales events represent record levels for SEI.
◦Private Banks net sales events totaled $6.5 million, reflecting continued demand across SEI’s full suite of capabilities, including enterprise‑wide professional services, implementation services, and the SEI Wealth PlatformSM. Of the $4.0 million of net sales events within Investments in New Businesses, $1.4 million were won in partnership with Private Banking.
◦Investment Managers led the quarter with $50.5 million of net sales events, driven by multiple enterprise-level mandates with first-time outsourcers. These larger wins were supplemented with contributions from both the IMS traditional and alternatives business, both in the US and globally.
◦Investment Advisors net sales events of $7.0 million demonstrate continued progress in SEI's asset management offering, with Q1 momentum driven by ETFs, SMAs, and custody-only solutions. Institutional Investors recorded negative $2.9 million of net sales events, driven by a large defined benefit client meeting their funding objectives and annuitizing their plan.
•Consolidated revenues and operating income increased by 13% and 21%, respectively, from Q1 2025. On an adjusted basis, operating income increased by 24% from Q1 2025, with SEI's adjusted operating margin increasing to 32%, up 281 bps. Across all business segments, both revenue and operating profit increased vs. Q1 2025.
◦Private Banking revenue increased 11% and operating margins increased 449 bps vs. Q1 2025, driving operating profit 40% higher. Strong growth reflects a growing contribution from professional services, including the record wins achieved in Q4 of last year, and continued execution against Private Banking's five-pillar margin enhancement strategy.
◦Investment Managers delivered double-digit revenue and operating profit growth vs. last year, as sales event momentum translates into financial performance. The slight margin decline vs. Q4 2025 was expected and primarily driven by the Q4 2025 revenue accrual true-up which did not recur in first quarter.
◦Investment Advisors posted 24% revenue and 12% operating profit growth versus the prior year, although comparisons are impacted by the first full quarter of Stratos results. During the quarter, Stratos contributed $19.0 million to revenue and $3.1 million to operating profit, which includes $6.0 million of expense associated with acquired intangible asset amortization, before considering non-controlling interest. SEI's integrated cash program contributed $20.4 million, consistent with Q3 2025 and Q4 2025.
◦Institutional Investors generated single-digit revenue and operating profit growth compared to the prior year driven by market appreciation and cost discipline.
•Ending assets under administration increased by 4%, and ending assets under management was flat from Q4 to Q1. AUA growth was driven primarily by strong client win momentum. Ending AUM as of Q1 was essentially flat with Q4, as healthy net inflows in Advisors offset market depreciation in March.
•SEI repurchased 2.6 million shares of common stock for $208.3 million during the first quarter 2026 at an average price of $81.55 per share.
3
Earnings Conference Call
A conference call and presentation to review earnings is scheduled for 5 p.m. Eastern time on
Apr. 22, 2026. Analysts and investors are invited to join the call by completing the registration form. The public is invited to review the presentation and listen to the call and replay at ir.seic.com/events-presentations/events.
Apr. 22, 2026. Analysts and investors are invited to join the call by completing the registration form. The public is invited to review the presentation and listen to the call and replay at ir.seic.com/events-presentations/events.
Link for registration form: https://register-conf.media-server.com/register/BI47d1ce35e5544d58aa8cc411a54ff9cf
About SEI®
SEI (NASDAQ:SEIC) is a leading global provider of financial technology, operations, and asset management services within the financial services industry. SEI tailors its solutions and services to help clients more effectively deploy their capital—whether that’s money, time, or talent—so they can better serve their clients and achieve their growth objectives. As of Mar. 31, 2026, SEI manages, advises, or administers approximately $1.9 trillion in assets. For more information, visit seic.com.
This release contains forward-looking statements within the meaning or the rules and regulations of the Securities and Exchange Commission. In some cases you can identify forward-looking statements by terminology, such as "may," '"will," "can," "expect," "believe," "remain," and "continue" or "appear." Our forward-looking statements include our current expectations as to:
•the demand for our products and solutions;
•the degree to which our investments are strengthening the foundation of a more nimble, innovative, scalable and resilient enterprise;
•whether we are positioned to deliver sustained value for our clients, employees and shareholders; and
•when and if we will generate net annualized recurring revenues from sales events that occurred during the quarter, as well as the amount of any such revenue.
You should not place undue reliance on our forward-looking statements, as they are based on the current beliefs and expectations of our management and subject to significant risks and uncertainties, many of which are beyond our control or are subject to change. Although we believe the assumptions upon which we base our forward-looking statements are reasonable, they could be inaccurate. We undertake no obligation to update our forward-looking statements. Some of the risks and important factors that could cause actual results to differ from those described in our forward-looking statements can be found in the “Risk Factors” section of our Annual Report on Form 10-K for the year ended Dec. 31, 2025, filed with the Securities and Exchange Commission.
Investor contact: Media contact:
Brad Burke Alicia Rudd
SEI SEI
+1 610-676-5350 +1 610-676-3887
4
SEI INVESTMENTS COMPANY
CONSOLIDATED STATEMENTS OF OPERATIONS
(In thousands, except per share data) (Unaudited)
For the Three Months Ended March 31, | ||||||||||||||
2026 | 2025 | |||||||||||||
Asset management, admin. and distribution fees | $497,984 | $432,143 | ||||||||||||
Information processing and software servicing fees | 124,199 | 119,201 | ||||||||||||
Total revenues | 622,183 | 551,344 | ||||||||||||
Subadvisory, distribution and other asset mgmt. costs | 56,746 | 47,532 | ||||||||||||
Software royalties and other information processing costs | 9,932 | 9,081 | ||||||||||||
Compensation, benefits and other personnel | 206,315 | 190,784 | ||||||||||||
Stock-based compensation | 14,496 | 14,138 | ||||||||||||
Consulting, outsourcing and professional fees | 54,403 | 56,001 | ||||||||||||
Data processing and computer related | 44,873 | 39,319 | ||||||||||||
Facilities, supplies and other costs | 20,322 | 18,755 | ||||||||||||
Amortization | 18,354 | 10,710 | ||||||||||||
Depreciation | 7,256 | 7,927 | ||||||||||||
Total expenses | 432,697 | 394,247 | ||||||||||||
Income from operations | 189,486 | 157,097 | ||||||||||||
Net (loss) gain from investments | (369) | 493 | ||||||||||||
Interest and dividend income | 7,162 | 10,221 | ||||||||||||
Interest expense | (473) | (185) | ||||||||||||
Other income | 450 | — | ||||||||||||
Equity in earnings of unconsolidated affiliates | 32,476 | 28,747 | ||||||||||||
Net gain from consolidated variable interest entities | 2,079 | — | ||||||||||||
Income before income taxes | 230,811 | 196,373 | ||||||||||||
Income taxes | 54,024 | 44,856 | ||||||||||||
Net income | $176,787 | $151,517 | ||||||||||||
Less: Net income attributable to non-controlling interests | 2,300 | — | ||||||||||||
Net income attributable to SEI Investments Company | $174,487 | $151,517 | ||||||||||||
Basic earnings per common share | $1.43 | $1.20 | ||||||||||||
Shares used to calculate basic earnings per share | 121,659 | 126,561 | ||||||||||||
Diluted earnings per common share | $1.40 | $1.17 | ||||||||||||
Shares used to calculate diluted earnings per share | 124,494 | 129,450 | ||||||||||||
5
SEI INVESTMENTS COMPANY
CONSOLIDATED CONDENSED BALANCE SHEETS
(In thousands) (Unaudited)
March 31, | December 31, | |||||||||||||
2026 | 2025 | |||||||||||||
Assets | ||||||||||||||
Current Assets: | ||||||||||||||
Cash and cash equivalents | $363,149 | $399,804 | ||||||||||||
Receivables from investment products | 55,126 | 63,317 | ||||||||||||
Receivables, net | 710,083 | 709,748 | ||||||||||||
Securities owned | 32,093 | 33,777 | ||||||||||||
Other current assets | 73,107 | 66,691 | ||||||||||||
Total Current Assets | 1,233,558 | 1,273,337 | ||||||||||||
Property and Equipment, net | 149,415 | 150,434 | ||||||||||||
Operating Lease Right-of-Use Assets | 34,669 | 26,447 | ||||||||||||
Capitalized Software, net | 230,746 | 234,272 | ||||||||||||
Investments | 331,371 | 428,004 | ||||||||||||
Assets of Consolidated Variable Interest Entities | 214,921 | 183,994 | ||||||||||||
Goodwill | 388,380 | 354,989 | ||||||||||||
Intangible assets, net | 479,517 | 368,272 | ||||||||||||
Other Assets, net | 212,677 | 240,095 | ||||||||||||
Total Assets | $3,275,254 | $3,259,844 | ||||||||||||
Liabilities, Redeemable Non-controlling Interests and Equity | ||||||||||||||
Current Liabilities: | ||||||||||||||
Accounts payable | $6,685 | $5,404 | ||||||||||||
Accrued liabilities | 237,722 | 359,823 | ||||||||||||
Current portion of long-term operating lease liabilities | 10,054 | 8,677 | ||||||||||||
Deferred revenue | 18,360 | 13,307 | ||||||||||||
Total Current Liabilities | 272,821 | 387,211 | ||||||||||||
Long-term Debt | 32,415 | — | ||||||||||||
Liabilities of Consolidated Variable Interest Entities | 136,542 | 108,504 | ||||||||||||
Other Long-term Liabilities | 76,791 | 60,353 | ||||||||||||
Total Liabilities | 518,569 | 556,068 | ||||||||||||
Redeemable Non-controlling Interests | 269,901 | 243,959 | ||||||||||||
Equity: | ||||||||||||||
Shareholders' Equity: | ||||||||||||||
Common stock, $0.01 par value, 750,000 shares authorized; 120,386 and 122,232 shares issued and outstanding | 1,204 | 1,222 | ||||||||||||
Capital in excess of par value | 1,696,702 | 1,678,787 | ||||||||||||
Retained earnings | 781,778 | 792,280 | ||||||||||||
Accumulated other comprehensive loss, net | (29,430) | (24,505) | ||||||||||||
Total SEI Shareholders' Equity | 2,450,254 | 2,447,784 | ||||||||||||
Non-controlling interests | 36,530 | 12,033 | ||||||||||||
Total Equity | $2,486,784 | $2,459,817 | ||||||||||||
Total Liabilities, Redeemable Non-controlling Interests and Equity | $3,275,254 | $3,259,844 | ||||||||||||
6
ENDING ASSET BALANCES
(In millions) (Unaudited)
Mar. 31 | Jun. 30 | Sep. 30 | Dec. 31 | Mar. 31 | ||||||||||||||||||||||||||||
2025 | 2025 | 2025 | 2025 | 2026 | ||||||||||||||||||||||||||||
Investment Managers: | ||||||||||||||||||||||||||||||||
Collective trust fund programs (A) | $209,491 | $225,690 | $237,964 | $243,244 | $243,900 | |||||||||||||||||||||||||||
Liquidity funds | 244 | 307 | 418 | 579 | 536 | |||||||||||||||||||||||||||
Total assets under management | $209,735 | $225,997 | $238,382 | $243,823 | $244,436 | |||||||||||||||||||||||||||
Client assets under administration | 1,061,067 | 1,128,325 | 1,204,843 | 1,239,606 | 1,284,781 | |||||||||||||||||||||||||||
Total assets | $1,270,802 | $1,354,322 | $1,443,225 | $1,483,429 | $1,529,217 | |||||||||||||||||||||||||||
Private Banks: | ||||||||||||||||||||||||||||||||
Equity and fixed-income programs | $25,590 | $27,839 | $28,408 | $29,832 | $29,753 | |||||||||||||||||||||||||||
Collective trust fund programs | 4 | 3 | 3 | 3 | 4 | |||||||||||||||||||||||||||
Liquidity funds | 3,670 | 2,796 | 2,802 | 2,099 | 2,178 | |||||||||||||||||||||||||||
Total assets under management | $29,264 | $30,638 | $31,213 | $31,934 | $31,935 | |||||||||||||||||||||||||||
Client assets under administration | 8,365 | 8,431 | 8,902 | 9,115 | 9,143 | |||||||||||||||||||||||||||
Total assets | $37,629 | $39,069 | $40,115 | $41,049 | $41,078 | |||||||||||||||||||||||||||
Investment Advisors: | ||||||||||||||||||||||||||||||||
Equity and fixed-income programs | $75,689 | $80,618 | $85,245 | $86,879 | $86,612 | |||||||||||||||||||||||||||
Liquidity funds | 3,153 | 3,457 | 3,391 | 3,561 | 3,485 | |||||||||||||||||||||||||||
Total Platform assets under management | $78,842 | $84,075 | $88,636 | $90,440 | $90,097 | |||||||||||||||||||||||||||
Platform-only assets | 25,591 | 29,848 | 32,152 | 33,582 | 34,070 | |||||||||||||||||||||||||||
Platform-only assets-deposit program | 2,216 | 2,155 | 2,165 | 2,461 | 2,294 | |||||||||||||||||||||||||||
Total Platform assets | $106,649 | $116,078 | $122,953 | $126,483 | $126,461 | |||||||||||||||||||||||||||
Institutional Investors: | ||||||||||||||||||||||||||||||||
Equity and fixed-income programs | $76,492 | $80,112 | $82,676 | $84,254 | $82,195 | |||||||||||||||||||||||||||
Liquidity funds | 1,580 | 1,768 | 1,580 | 1,604 | 1,503 | |||||||||||||||||||||||||||
Total assets under management | $78,072 | $81,880 | $84,256 | $85,858 | $83,698 | |||||||||||||||||||||||||||
Client assets under advisement | 5,573 | 6,090 | 6,564 | 3,598 | 3,549 | |||||||||||||||||||||||||||
Total assets | $83,645 | $87,970 | $90,820 | $89,456 | $87,247 | |||||||||||||||||||||||||||
Investments in New Businesses: | ||||||||||||||||||||||||||||||||
Equity and fixed-income programs | $2,661 | $2,867 | $2,999 | $3,044 | $3,087 | |||||||||||||||||||||||||||
Liquidity funds | 288 | 244 | 244 | 316 | 252 | |||||||||||||||||||||||||||
Total assets under management | $2,949 | $3,111 | $3,243 | $3,360 | $3,339 | |||||||||||||||||||||||||||
Client assets under administration (E) | 14,846 | — | — | — | — | |||||||||||||||||||||||||||
Client assets under advisement | 2,219 | 2,593 | 2,452 | 2,389 | 2,185 | |||||||||||||||||||||||||||
Total assets | $20,014 | $5,704 | $5,695 | $5,749 | $5,524 | |||||||||||||||||||||||||||
LSV Asset Management: | ||||||||||||||||||||||||||||||||
Equity and fixed-income programs (B) | $87,114 | $91,795 | $95,801 | $99,196 | $100,567 | |||||||||||||||||||||||||||
Stratos Wealth Holdings (F) | $— | $— | $— | $38,377 | $39,935 | |||||||||||||||||||||||||||
Total: | ||||||||||||||||||||||||||||||||
Equity and fixed-income programs (C) | $267,546 | $283,231 | $295,129 | $303,205 | $302,214 | |||||||||||||||||||||||||||
Collective trust fund programs | 209,495 | 225,693 | 237,967 | 243,247 | 243,904 | |||||||||||||||||||||||||||
Liquidity funds | 8,935 | 8,572 | 8,435 | 8,159 | 7,954 | |||||||||||||||||||||||||||
Total assets under management | $485,976 | $517,496 | $541,531 | $554,611 | $554,072 | |||||||||||||||||||||||||||
Client assets under advisement | 7,792 | 8,683 | 9,016 | 5,987 | 5,734 | |||||||||||||||||||||||||||
Client assets under administration (D) | 1,084,278 | 1,136,756 | 1,213,745 | 1,248,721 | 1,293,924 | |||||||||||||||||||||||||||
Platform-only assets | 27,807 | 32,003 | 34,317 | 36,043 | 36,364 | |||||||||||||||||||||||||||
Stratos Wealth Holdings | — | — | — | 38,377 | 39,935 | |||||||||||||||||||||||||||
Total assets | $1,605,853 | $1,694,938 | $1,798,609 | $1,883,739 | $1,930,029 | |||||||||||||||||||||||||||
(A)Collective trust fund program assets in the Investment Managers segment are included in assets under management since SEI is the trustee. Fees earned on this product are less than fees earned on customized asset management programs.
(B)Equity and fixed-income programs include $1.4 billion of assets managed by LSV in which fees are based solely on performance and are not calculated as an asset-based fee (as of March 31, 2026).
(C)Equity and fixed-income programs include $8.3 billion of assets in various asset allocation funds (as of March 31, 2026).
(D) In addition to the assets presented, SEI also administers an additional $13.3 billion in Funds of Funds assets on which SEI does not earn an administration fee (as of March 31, 2026).
(E) Client assets under administration related to the Family Office Services business divested on June 30, 2025.
(F) Stratos Wealth Holdings is a family of companies that provide financial services to $39.9 billion in client assets across business models and affiliation structures (as of February 28, 2026).
7
AVERAGE ASSET BALANCES
(In millions) (Unaudited)
1st Qtr. | 2nd Qtr. | 3rd Qtr. | 4th Qtr. | 1st Qtr. | ||||||||||||||||||||||||||||
2025 | 2025 | 2025 | 2025 | 2026 | ||||||||||||||||||||||||||||
Investment Managers: | ||||||||||||||||||||||||||||||||
Collective trust fund programs (A) | $208,720 | $215,085 | $231,088 | $240,285 | $248,851 | |||||||||||||||||||||||||||
Liquidity funds | 256 | 288 | 385 | 492 | 565 | |||||||||||||||||||||||||||
Total assets under management | $208,976 | $215,373 | $231,473 | $240,777 | $249,416 | |||||||||||||||||||||||||||
Client assets under administration | 1,061,282 | 1,098,925 | 1,174,961 | 1,225,392 | 1,280,581 | |||||||||||||||||||||||||||
Total assets | $1,270,258 | $1,314,298 | $1,406,434 | $1,466,169 | $1,529,997 | |||||||||||||||||||||||||||
Private Banks: | ||||||||||||||||||||||||||||||||
Equity and fixed-income programs | $25,894 | $26,533 | $28,051 | $29,087 | $30,696 | |||||||||||||||||||||||||||
Collective trust fund programs | 4 | 3 | 3 | 3 | 3 | |||||||||||||||||||||||||||
Liquidity funds | 2,961 | 2,771 | 2,834 | 2,371 | 2,150 | |||||||||||||||||||||||||||
Total assets under management | $28,859 | $29,307 | $30,888 | $31,461 | $32,849 | |||||||||||||||||||||||||||
Client assets under administration | 8,488 | 8,266 | 8,665 | 8,977 | 9,282 | |||||||||||||||||||||||||||
Total assets | $37,347 | $37,573 | $39,553 | $40,438 | $42,131 | |||||||||||||||||||||||||||
Investment Advisors: | ||||||||||||||||||||||||||||||||
Equity and fixed-income programs | $77,287 | $76,629 | $82,735 | $85,896 | $88,403 | |||||||||||||||||||||||||||
Liquidity funds | 3,119 | 3,464 | 3,378 | 3,418 | 3,518 | |||||||||||||||||||||||||||
Total Platform assets under management | $80,406 | $80,093 | $86,113 | $89,314 | $91,921 | |||||||||||||||||||||||||||
Platform-only assets | 25,939 | 27,288 | 30,874 | 33,022 | 34,485 | |||||||||||||||||||||||||||
Platform-only assets-deposit program | 2,187 | 2,152 | 2,136 | 2,135 | 2,309 | |||||||||||||||||||||||||||
Total Platform assets | $108,532 | $109,533 | $119,123 | $124,471 | $128,715 | |||||||||||||||||||||||||||
Institutional Investors: | ||||||||||||||||||||||||||||||||
Equity and fixed-income programs | $76,493 | $77,843 | $80,802 | $83,739 | $84,393 | |||||||||||||||||||||||||||
Liquidity funds | 1,655 | 1,853 | 1,810 | 1,947 | 1,941 | |||||||||||||||||||||||||||
Total assets under management | $78,148 | $79,696 | $82,612 | $85,686 | $86,334 | |||||||||||||||||||||||||||
Client assets under advisement | 5,741 | 5,841 | 6,274 | 5,413 | 3,657 | |||||||||||||||||||||||||||
Total assets | $83,889 | $85,537 | $88,886 | $91,099 | $89,991 | |||||||||||||||||||||||||||
Investments in New Businesses: | ||||||||||||||||||||||||||||||||
Equity and fixed-income programs | $2,801 | $2,732 | $2,934 | $3,021 | $3,106 | |||||||||||||||||||||||||||
Liquidity funds | 274 | 244 | 255 | 288 | 319 | |||||||||||||||||||||||||||
Total assets under management | $3,075 | $2,976 | $3,189 | $3,309 | $3,425 | |||||||||||||||||||||||||||
Client assets under administration (E) | 14,630 | 14,917 | — | — | — | |||||||||||||||||||||||||||
Client assets under advisement | 2,205 | 2,329 | 2,428 | 2,408 | 2,335 | |||||||||||||||||||||||||||
Total assets | $19,910 | $20,222 | $5,617 | $5,717 | $5,760 | |||||||||||||||||||||||||||
LSV Asset Management: | ||||||||||||||||||||||||||||||||
Equity and fixed-income programs (B) | $87,790 | $89,422 | $92,969 | $97,304 | $104,619 | |||||||||||||||||||||||||||
Stratos Wealth Holdings (F) | $— | $— | $— | $38,085 | $39,115 | |||||||||||||||||||||||||||
Total: | ||||||||||||||||||||||||||||||||
Equity and fixed-income programs (C) | $270,265 | $273,159 | $287,491 | $299,047 | $311,217 | |||||||||||||||||||||||||||
Collective trust fund programs | 208,724 | 215,088 | 231,091 | 240,288 | 248,854 | |||||||||||||||||||||||||||
Liquidity funds | 8,265 | 8,620 | 8,662 | 8,516 | 8,493 | |||||||||||||||||||||||||||
Total assets under management | $487,254 | $496,867 | $527,244 | $547,851 | $568,564 | |||||||||||||||||||||||||||
Client assets under advisement | 7,946 | 8,170 | 8,702 | 7,821 | 5,992 | |||||||||||||||||||||||||||
Client assets under administration (D) | 1,084,400 | 1,122,108 | 1,183,626 | 1,234,369 | 1,289,863 | |||||||||||||||||||||||||||
Platform-only assets | 28,126 | 29,440 | 33,010 | 35,157 | 36,794 | |||||||||||||||||||||||||||
Stratos Wealth Holdings | — | — | — | 38,085 | 39,115 | |||||||||||||||||||||||||||
Total assets | $1,607,726 | $1,656,585 | $1,752,582 | $1,863,283 | $1,940,328 | |||||||||||||||||||||||||||
(A) Collective trust fund program average assets in the Investment Managers segment are included in assets under management since SEI is the trustee. Fees earned on this product are less than fees earned on customized asset management programs.
(B) Equity and fixed-income programs during first-quarter 2026 include $1.5 billion of average assets managed by LSV in which fees are based solely on performance and are not calculated as an asset-based fee.
(C) Equity and fixed-income programs include $8.2 billion of average assets in various asset allocation funds during first-quarter 2026.
(D) In addition to the assets presented, SEI also administers an additional $13.2 billion of average assets in Funds of Funds assets during first-quarter 2026 on which SEI does not earn an administration fee.
(E) Client assets under administration related to the Family Office Services business divested on June 30, 2025.
(F) Stratos Wealth Holdings is a family of companies that provide financial services to $39.1 billion in client assets across business models and affiliation structures during first-quarter 2026 through February 28, 2026.
8
SALES EVENTS
(In thousands) (Unaudited)
Net Recurring Sales Events | ||||||||||||||||||||||||||||||||
1st Qtr. | 2nd Qtr. | 3rd Qtr. | 4th Qtr. | 1st Qtr. | ||||||||||||||||||||||||||||
2025 | 2025 | 2025 | 2025 | 2026 | ||||||||||||||||||||||||||||
Investment Processing-related Businesses: | ||||||||||||||||||||||||||||||||
Investment Managers | $25,296 | $21,928 | $27,460 | $19,150 | $46,848 | |||||||||||||||||||||||||||
Private Banks | 7,059 | 254 | (6,713) | 5,670 | 1,571 | |||||||||||||||||||||||||||
Total Investment Processing-related Businesses | $32,355 | $22,182 | $20,747 | $24,820 | $48,419 | |||||||||||||||||||||||||||
Asset Management-related Businesses: | ||||||||||||||||||||||||||||||||
Private Banks-AMD | ($58) | ($174) | ($1,674) | ($1,567) | $1,983 | |||||||||||||||||||||||||||
Investment Advisors | 888 | (1,654) | 1,230 | (728) | 7,044 | |||||||||||||||||||||||||||
Institutional Investors | 41 | 2,544 | (594) | (5,025) | (2,935) | |||||||||||||||||||||||||||
Total Asset Management-related Businesses | $871 | $716 | ($1,038) | ($7,320) | $6,092 | |||||||||||||||||||||||||||
Newer Initiatives: | ||||||||||||||||||||||||||||||||
Investments in New Businesses | $3,614 | $1,245 | $1,208 | $1,248 | $2,631 | |||||||||||||||||||||||||||
Total Net Recurring Sales Events | $36,840 | $24,143 | $20,917 | $18,748 | $57,142 | |||||||||||||||||||||||||||
Professional Services Sales Events | ||||||||||||||||||||||||||||||||
1st Qtr. | 2nd Qtr. | 3rd Qtr. | 4th Qtr. | 1st Qtr. | ||||||||||||||||||||||||||||
2025 | 2025 | 2025 | 2025 | 2026 | ||||||||||||||||||||||||||||
Investment Processing-related Businesses: | ||||||||||||||||||||||||||||||||
Investment Managers | $835 | $1,102 | $2,465 | $1,347 | $3,672 | |||||||||||||||||||||||||||
Private Banks | 7,060 | 2,373 | 7,087 | 23,409 | 4,950 | |||||||||||||||||||||||||||
Total Investment Processing-related Businesses | $7,895 | $3,475 | $9,552 | $24,756 | $8,622 | |||||||||||||||||||||||||||
Newer Initiatives: | ||||||||||||||||||||||||||||||||
Investments in New Businesses | $1,834 | $1,552 | $71 | $95 | $1,389 | |||||||||||||||||||||||||||
Total Professional Services Sales Events | $9,729 | $5,027 | $9,623 | $24,851 | $10,011 | |||||||||||||||||||||||||||
Total Sales Events | ||||||||||||||||||||||||||||||||
1st Qtr. | 2nd Qtr. | 3rd Qtr. | 4th Qtr. | 1st Qtr. | ||||||||||||||||||||||||||||
2025 | 2025 | 2025 | 2025 | 2026 | ||||||||||||||||||||||||||||
Investment Processing-related Businesses: | ||||||||||||||||||||||||||||||||
Investment Managers | $26,131 | $23,030 | $29,925 | $20,497 | $50,520 | |||||||||||||||||||||||||||
Private Banks | 14,119 | 2,627 | 374 | 29,079 | 6,521 | |||||||||||||||||||||||||||
Total Investment Processing-related Businesses | $40,250 | $25,657 | $30,299 | $49,576 | $57,041 | |||||||||||||||||||||||||||
Asset Management-related Businesses: | ||||||||||||||||||||||||||||||||
Private Banks-AMD | ($58) | ($174) | ($1,674) | ($1,567) | $1,983 | |||||||||||||||||||||||||||
Investment Advisors | 888 | (1,654) | 1,230 | (728) | 7,044 | |||||||||||||||||||||||||||
Institutional Investors | 41 | 2,544 | (594) | (5,025) | (2,935) | |||||||||||||||||||||||||||
Total Asset Management-related Businesses | $871 | $716 | ($1,038) | ($7,320) | $6,092 | |||||||||||||||||||||||||||
Newer Initiatives: | ||||||||||||||||||||||||||||||||
Investments in New Businesses | $5,448 | $2,797 | $1,279 | $1,343 | $4,020 | |||||||||||||||||||||||||||
Total Sales Events | $46,569 | $29,170 | $30,540 | $43,599 | $67,153 | |||||||||||||||||||||||||||
9
Non-GAAP Information & Reconciliations
(In thousands, except per share data) (Unaudited)
We present certain non‑GAAP financial measures to supplement the consolidated financial statements prepared in accordance with GAAP. Management believes these measures provide useful information to investors by enhancing the understanding of our core operating performance and facilitating comparisons across reporting periods. These non‑GAAP measures are also used by our management to evaluate operating results, allocate resources, and assess performance against strategic objectives.
These non-GAAP financial measures should be viewed in addition to, and not as a substitute for, reported results prepared in accordance with GAAP.
The following schedules reconcile U.S. GAAP financial measures to non-GAAP financial measures for each quarter in 2026 and 2025:
1st Qtr. | 2nd Qtr. | 3rd Qtr. | 4th Qtr. | 1st Qtr. | ||||||||||||||||||||||||||||||||||
2025 | 2025 | 2025 | 2025 | 2025 | 2026 | |||||||||||||||||||||||||||||||||
Net income attributable to SEI Investments Company (U.S. GAAP basis) | $151,517 | $227,083 | $164,204 | $172,501 | $715,305 | $174,487 | ||||||||||||||||||||||||||||||||
Non-GAAP adjustments: | ||||||||||||||||||||||||||||||||||||||
Acquisition-related: | ||||||||||||||||||||||||||||||||||||||
Third party costs (A) | — | 820 | 3,767 | 7,339 | 11,926 | — | ||||||||||||||||||||||||||||||||
Intangible assets amortization & impairments (B) | 3,449 | 3,157 | 3,168 | 4,216 | 13,990 | 6,634 | ||||||||||||||||||||||||||||||||
Total acquisition-related | 3,449 | 3,977 | 6,935 | 11,555 | 25,916 | 6,634 | ||||||||||||||||||||||||||||||||
Gain on sale of asset/business (C) | — | (94,412) | — | — | (94,412) | — | ||||||||||||||||||||||||||||||||
Litigation settlements and insurance proceeds (D) | — | (4,500) | (4,350) | — | (8,850) | — | ||||||||||||||||||||||||||||||||
Severance and related costs (E) | — | — | — | 13,600 | 13,600 | — | ||||||||||||||||||||||||||||||||
Income tax effect (F) | (788) | 21,142 | (567) | (5,300) | 14,487 | (1,553) | ||||||||||||||||||||||||||||||||
Adjusted net income attributable to SEI Investments Company (non-GAAP basis) | $154,178 | $153,290 | $166,222 | $192,356 | $666,046 | $179,568 | ||||||||||||||||||||||||||||||||
Diluted EPS (U.S. GAAP basis) | $1.17 | $1.78 | $1.30 | $1.38 | $5.63 | $1.40 | ||||||||||||||||||||||||||||||||
Adjusted diluted EPS (non-GAAP basis) | $1.19 | $1.20 | $1.32 | $1.54 | $5.25 | $1.44 | ||||||||||||||||||||||||||||||||
Diluted weighted average shares outstanding | 129,450 | 127,278 | 126,325 | 125,251 | 127,076 | 124,494 | ||||||||||||||||||||||||||||||||
Income from operations (U.S. GAAP Basis) | $157,097 | $148,635 | $159,961 | $161,618 | $627,311 | $189,486 | ||||||||||||||||||||||||||||||||
Operating margin (U.S. GAAP Basis) | 28 | % | 27 | % | 28 | % | 27 | % | 27 | % | 30 | % | ||||||||||||||||||||||||||
Non-GAAP adjustments: | ||||||||||||||||||||||||||||||||||||||
Acquisition-related: | ||||||||||||||||||||||||||||||||||||||
Third party costs (A) | — | 820 | 3,767 | 7,339 | 11,926 | — | ||||||||||||||||||||||||||||||||
Intangible assets amortization & impairments (B) | 3,449 | 3,157 | 3,168 | 5,002 | 14,776 | 9,197 | ||||||||||||||||||||||||||||||||
Total acquisition-related | 3,449 | 3,977 | 6,935 | 12,341 | 26,702 | 9,197 | ||||||||||||||||||||||||||||||||
Severance and related costs (E) | — | — | — | 13,600 | 13,600 | — | ||||||||||||||||||||||||||||||||
Adjusted income from operations (non-GAAP Basis) | $160,546 | $152,612 | $166,896 | $187,559 | $667,613 | $198,683 | ||||||||||||||||||||||||||||||||
Adjusted operating margin (non-GAAP basis) | 29 | % | 27 | % | 29 | % | 31 | % | 29 | % | 32 | % | ||||||||||||||||||||||||||
10
Non-GAAP Information & Reconciliations
(In thousands, except per share data) (Unaudited)
The following schedules reconcile U.S. GAAP financial measures to Non-GAAP financial measures for each quarter in 2024:
1st Qtr. | 2nd Qtr. | 3rd Qtr. | 4th Qtr. | ||||||||||||||||||||||||||||||||
2024 | 2024 | 2024 | 2024 | 2024 | |||||||||||||||||||||||||||||||
Net income attributable to SEI Investments Company (U.S. GAAP basis) | $131,400 | $139,120 | $154,900 | $155,771 | $581,191 | ||||||||||||||||||||||||||||||
Non-GAAP adjustments: | |||||||||||||||||||||||||||||||||||
Acquisition-related: | |||||||||||||||||||||||||||||||||||
Intangible assets amortization & impairments (B) | 3,397 | 3,387 | 3,276 | 3,382 | 13,442 | ||||||||||||||||||||||||||||||
Total acquisition-related | 3,397 | 3,387 | 3,276 | 3,382 | 13,442 | ||||||||||||||||||||||||||||||
Gain on sale of asset/business (C) | — | — | (8,151) | — | (8,151) | ||||||||||||||||||||||||||||||
Income tax effect (F) | (778) | (809) | 1,143 | (626) | (1,070) | ||||||||||||||||||||||||||||||
Adjusted net income attributable to SEI Investments Company (non-GAAP basis) | $134,019 | $141,698 | $151,168 | $158,527 | $585,412 | ||||||||||||||||||||||||||||||
Diluted EPS (U.S. GAAP basis) | $0.99 | $1.05 | $1.19 | $1.19 | $4.41 | ||||||||||||||||||||||||||||||
Adjusted diluted EPS (non-GAAP basis) | $1.01 | $1.07 | $1.16 | $1.21 | $4.45 | ||||||||||||||||||||||||||||||
Diluted weighted average shares outstanding | 132,745 | 132,073 | 130,671 | 131,421 | 131,727 | ||||||||||||||||||||||||||||||
Income from operations (U.S. GAAP Basis) | $125,851 | $136,514 | $143,832 | $145,544 | $551,741 | ||||||||||||||||||||||||||||||
Operating profit margin (U.S. GAAP Basis) | 25 | % | 26 | % | 27 | % | 26 | % | 26 | % | |||||||||||||||||||||||||
Non-GAAP adjustments: | |||||||||||||||||||||||||||||||||||
Acquisition-related: | |||||||||||||||||||||||||||||||||||
Intangible assets amortization & impairments (B) | 3,397 | 3,387 | 3,276 | 3,382 | 13,442 | ||||||||||||||||||||||||||||||
Total acquisition-related | 3,397 | 3,387 | 3,276 | 3,382 | 13,442 | ||||||||||||||||||||||||||||||
Adjusted income from operations (non-GAAP Basis) | $129,248 | $139,901 | $147,108 | $148,926 | $565,183 | ||||||||||||||||||||||||||||||
Adjusted operating margin (non-GAAP basis) | 25 | % | 27 | % | 27 | % | 27 | % | 27 | % | |||||||||||||||||||||||||
(A) This non-GAAP adjustment removes incremental and directly attributable costs incurred to execute acquisitions, such as third-party advisory, legal, accounting, valuation, and due diligence. For 2025, this non-GAAP adjustment consisted of the legal costs, advisory fees, and due diligence fees in relation to the Stratos acquisition. Management believes adjusting for these charges helps the reader's ability to understand our core operating results and increases comparability quarter to quarter.
(B) This non-GAAP adjustment removes the impact of amortization expense associated with acquired intangible assets (e.g., customer relationships, technology, trade names). This non-GAAP adjustment removes only amortization recorded in the current period related to acquired intangibles from prior acquisitions. The non-GAAP adjustments in Q4 2025 and Q1 2026 include the amortization of the acquired intangibles from the Stratos acquisition, which closed in December 2025. Management included the Stratos related amortization expense net of the 42.5% NCI adjustment for the adjusted EPS calculation. However, this adjustment is not inclusive of the NCI portion for adjusted operating margin. The associated revenues are not adjusted. Management believes adjusting for these charges helps the reader's ability to understand our core operating results and increases comparability quarter to quarter.
(C) This non-GAAP adjustment removes realized gains on the sale of assets owned or entities under our control, out of the normal course of business. In Q3 2024, this non-GAAP adjustment consisted of the realized gain on the sale of property in New York City, NY. In Q2 2025, the adjustment consisted of the realized gain from the sale of Family Office Services (FOS). Management believes adjusting for these gains helps the reader's ability to understand our core operating results and increases comparability quarter to quarter.
(D) This non-GAAP adjustment removes individually significant litigation settlements and insurance proceeds. In Q2 2025, this non-GAAP adjustment consisted of a $4.5M settlement related to a vendor matter and, in Q3 2025, this adjustment consisted of an insurance settlement. Management included both of these transactions as non-GAAP adjustments since they were both out of the normal course of business. Management believes adjusting for these items helps the reader's ability to understand our core operating results and increases comparability quarter to quarter.
(E) This non-GAAP adjustment includes severance, benefits, and other related personnel costs, net of the associated reversal in stock-based compensation costs. We only include the related costs when (i) part of a bona fide, company-wide cost-reduction initiative, and (ii) not expected to recur frequently. During Q4 2025, we reduced our workforce by 4% as part of a bona fide, company-wide cost reduction initiative which is not expected to recur frequently. Management believes this adjustment helps the reader's ability to understand our core operating results and increases comparability period to period.
(F) Income tax effects are presented as a separate reconciling item (not netted within each adjustment). For performance measures, the tax effect reflects current and deferred tax expense commensurate with the adjusted measure of profitability. The methodology used (e.g., statutory rate, effective rate, or discrete item approach) is consistently applied. All of the above items use a systematic approach.
11
SEI Investments Company (NASDAQ: SEIC) Q1 2026 Earnings Presentation
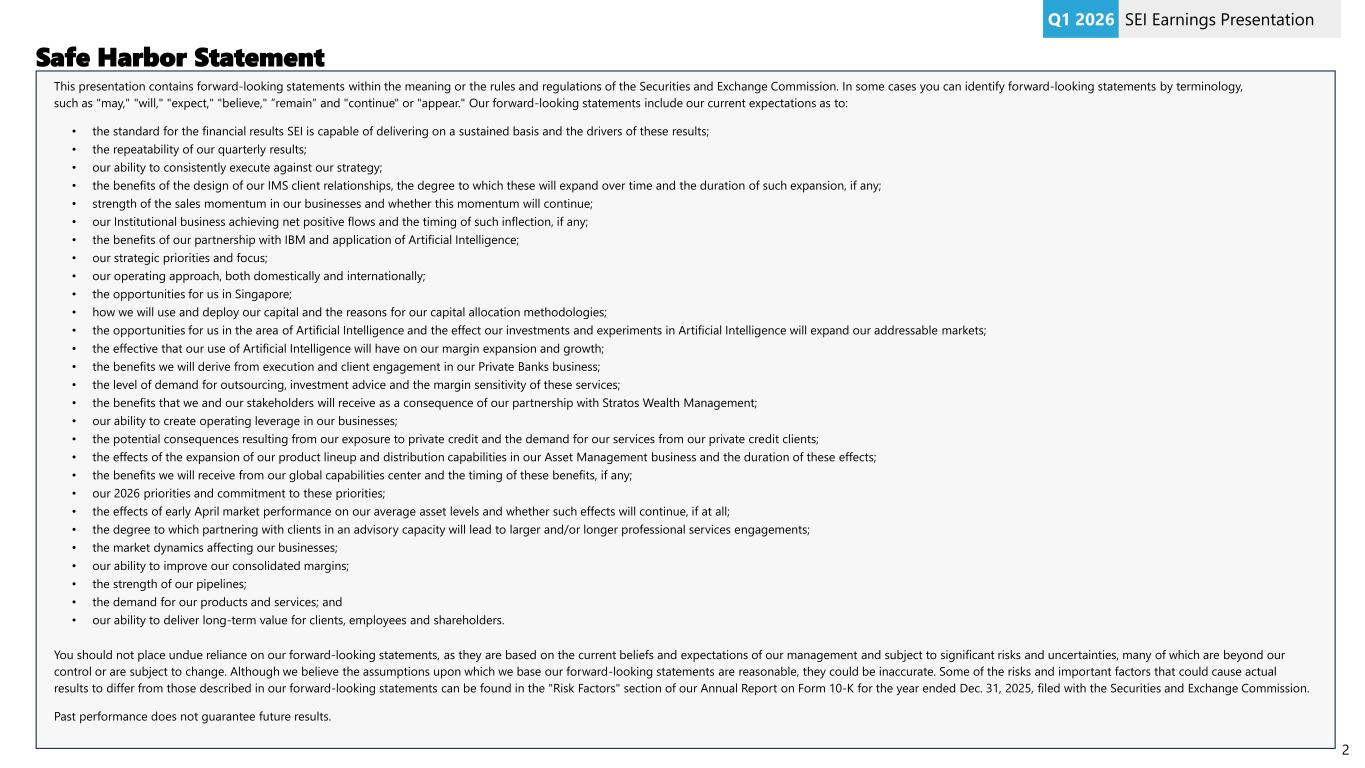
This presentation contains forward-looking statements within the meaning or the rules and regulations of the Securities and Exchange Commission. In some cases you can identify forward-looking statements by terminology, such as "may," "will," "expect," "believe," ”remain” and "continue" or "appear." Our forward-looking statements include our current expectations as to: • the standard for the financial results SEI is capable of delivering on a sustained basis and the drivers of these results; • the repeatability of our quarterly results; • our ability to consistently execute against our strategy; • the benefits of the design of our IMS client relationships, the degree to which these will expand over time and the duration of such expansion, if any; • strength of the sales momentum in our businesses and whether this momentum will continue; • our Institutional business achieving net positive flows and the timing of such inflection, if any; • the benefits of our partnership with IBM and application of Artificial Intelligence; • our strategic priorities and focus; • our operating approach, both domestically and internationally; • the opportunities for us in Singapore; • how we will use and deploy our capital and the reasons for our capital allocation methodologies; • the opportunities for us in the area of Artificial Intelligence and the effect our investments and experiments in Artificial Intelligence will expand our addressable markets; • the effective that our use of Artificial Intelligence will have on our margin expansion and growth; • the benefits we will derive from execution and client engagement in our Private Banks business; • the level of demand for outsourcing, investment advice and the margin sensitivity of these services; • the benefits that we and our stakeholders will receive as a consequence of our partnership with Stratos Wealth Management; • our ability to create operating leverage in our businesses; • the potential consequences resulting from our exposure to private credit and the demand for our services from our private credit clients; • the effects of the expansion of our product lineup and distribution capabilities in our Asset Management business and the duration of these effects; • the benefits we will receive from our global capabilities center and the timing of these benefits, if any; • our 2026 priorities and commitment to these priorities; • the effects of early April market performance on our average asset levels and whether such effects will continue, if at all; • the degree to which partnering with clients in an advisory capacity will lead to larger and/or longer professional services engagements; • the market dynamics affecting our businesses; • our ability to improve our consolidated margins; • the strength of our pipelines; • the demand for our products and services; and • our ability to deliver long-term value for clients, employees and shareholders. You should not place undue reliance on our forward-looking statements, as they are based on the current beliefs and expectations of our management and subject to significant risks and uncertainties, many of which are beyond our control or are subject to change. Although we believe the assumptions upon which we base our forward-looking statements are reasonable, they could be inaccurate. Some of the risks and important factors that could cause actual results to differ from those described in our forward-looking statements can be found in the "Risk Factors" section of our Annual Report on Form 10-K for the year ended Dec. 31, 2025, filed with the Securities and Exchange Commission. Past performance does not guarantee future results. Safe Harbor Statement 2 SEI Earnings PresentationQ1 2026
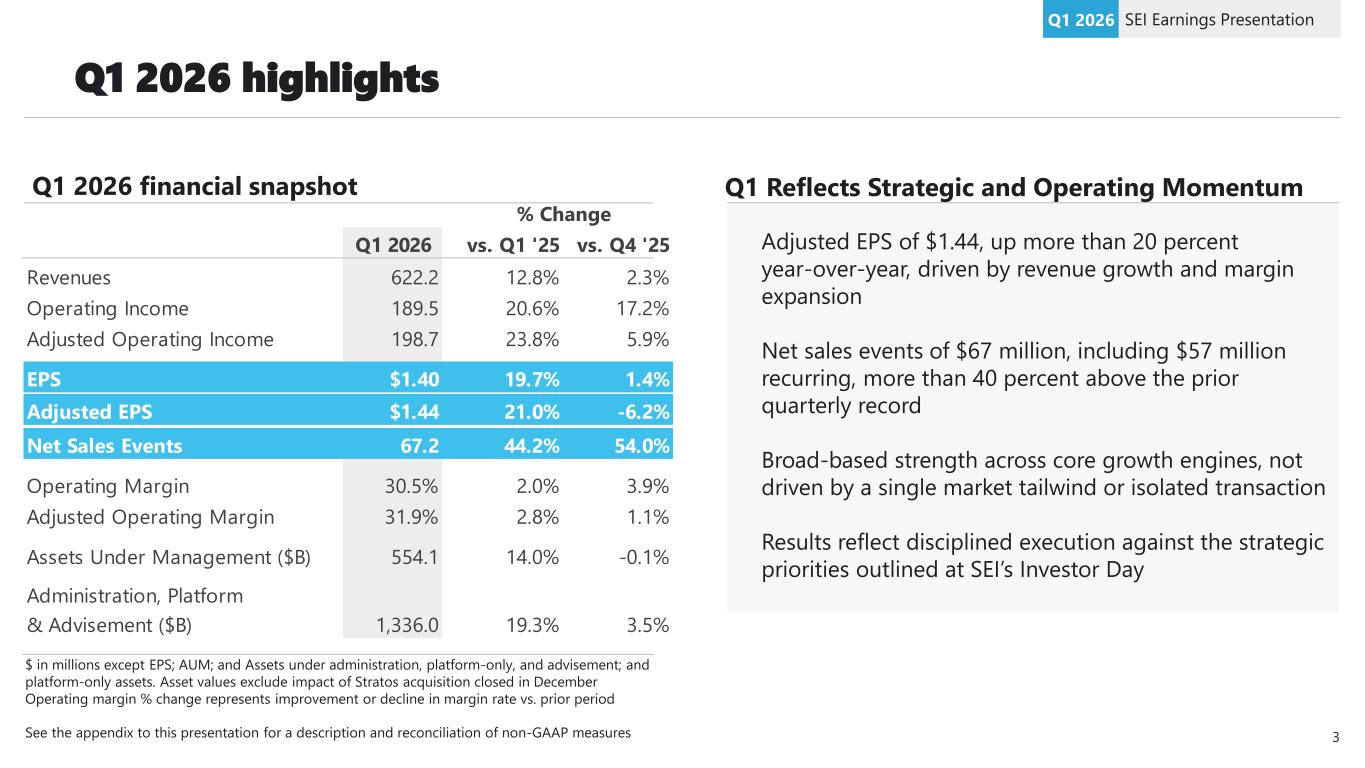
Q1 2026 vs. Q1 '25 vs. Q4 '25 Revenues 622.2 12.8% 2.3% Operating Income 189.5 20.6% 17.2% Adjusted Operating Income 198.7 23.8% 5.9% EPS $1.40 19.7% 1.4% Adjusted EPS $1.44 21.0% -6.2% Net Sales Events 67.2 44.2% 54.0% Operating Margin 30.5% 2.0% 3.9% Adjusted Operating Margin 31.9% 2.8% 1.1% Assets Under Management ($B) 554.1 14.0% -0.1% Administration, Platform & Advisement ($B) 1,336.0 19.3% 3.5% % Change Q1 2026 highlights SEI Earnings PresentationQ1 2026 Adjusted EPS of $1.44, up more than 20 percent year-over-year, driven by revenue growth and margin expansion Net sales events of $67 million, including $57 million recurring, more than 40 percent above the prior quarterly record Broad-based strength across core growth engines, not driven by a single market tailwind or isolated transaction Results reflect disciplined execution against the strategic priorities outlined at SEI’s Investor Day $ in millions except EPS; AUM; and Assets under administration, platform-only, and advisement; and platform-only assets. Asset values exclude impact of Stratos acquisition closed in December Operating margin % change represents improvement or decline in margin rate vs. prior period Q1 Reflects Strategic and Operating Momentum Q1 2026 financial snapshot 3See the appendix to this presentation for a description and reconciliation of non-GAAP measures
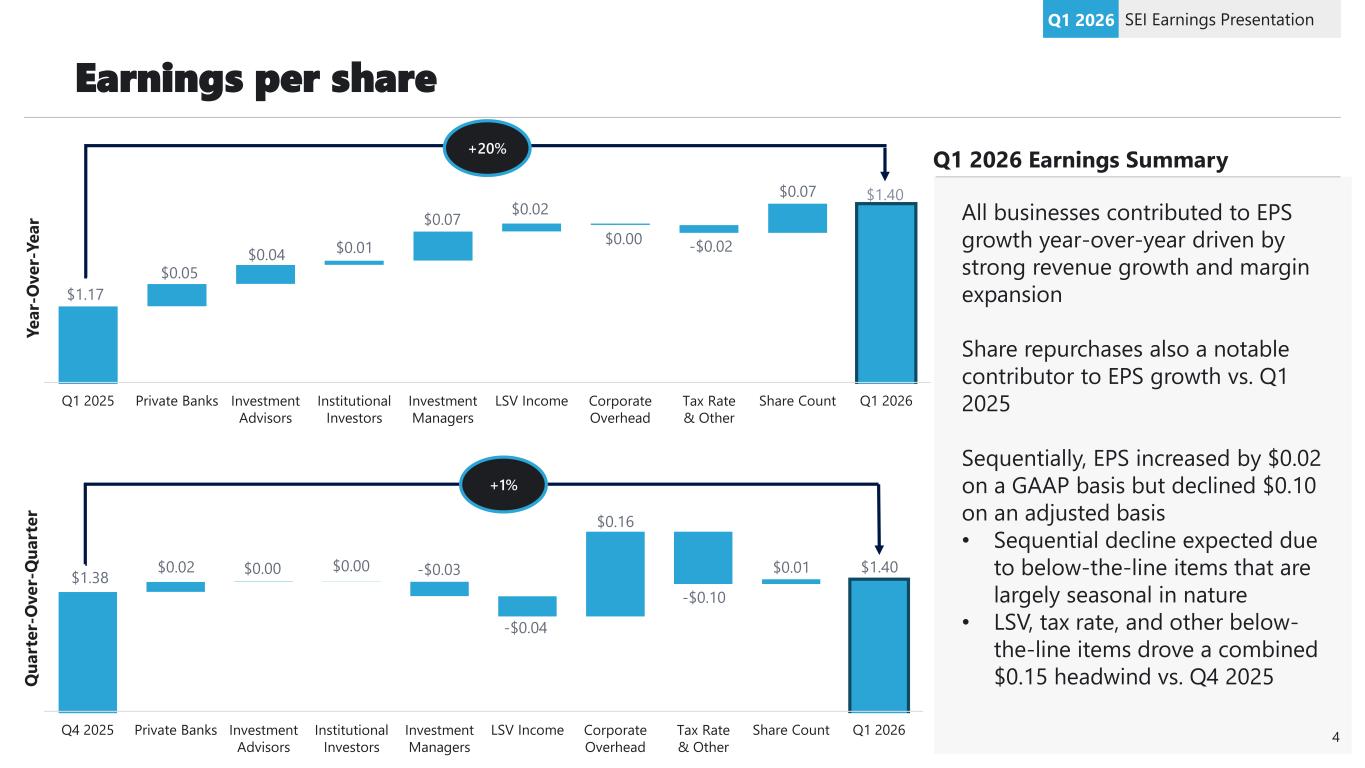
Earnings per share SEI Earnings PresentationQ1 2026 All businesses contributed to EPS growth year-over-year driven by strong revenue growth and margin expansion Share repurchases also a notable contributor to EPS growth vs. Q1 2025 Sequentially, EPS increased by $0.02 on a GAAP basis but declined $0.10 on an adjusted basis • Sequential decline expected due to below-the-line items that are largely seasonal in nature • LSV, tax rate, and other below- the-line items drove a combined $0.15 headwind vs. Q4 2025 Q1 2026 Earnings Summary Q1 2025 Private Banks Investment Advisors Institutional Investors Investment Managers LSV Income Corporate Overhead Tax Rate & Other Share Count Q1 2026 +20% Q4 2025 Private Banks Investment Advisors Institutional Investors Investment Managers LSV Income Corporate Overhead Tax Rate & Other Share Count Q1 2026 +1% Y e a r- O v e r- Y e a r Q u a rt e r- O v e r- Q u a rt e r 4 $1.17 $0.05 $0.04 $0.01 $0.07 $0.02 $0.00 -$0.02 $0.07 $1.40 $1.38 $0.02 $0.00 $0.00 -$0.03 -$0.04 $0.16 -$0.10 $0.01 $1.40
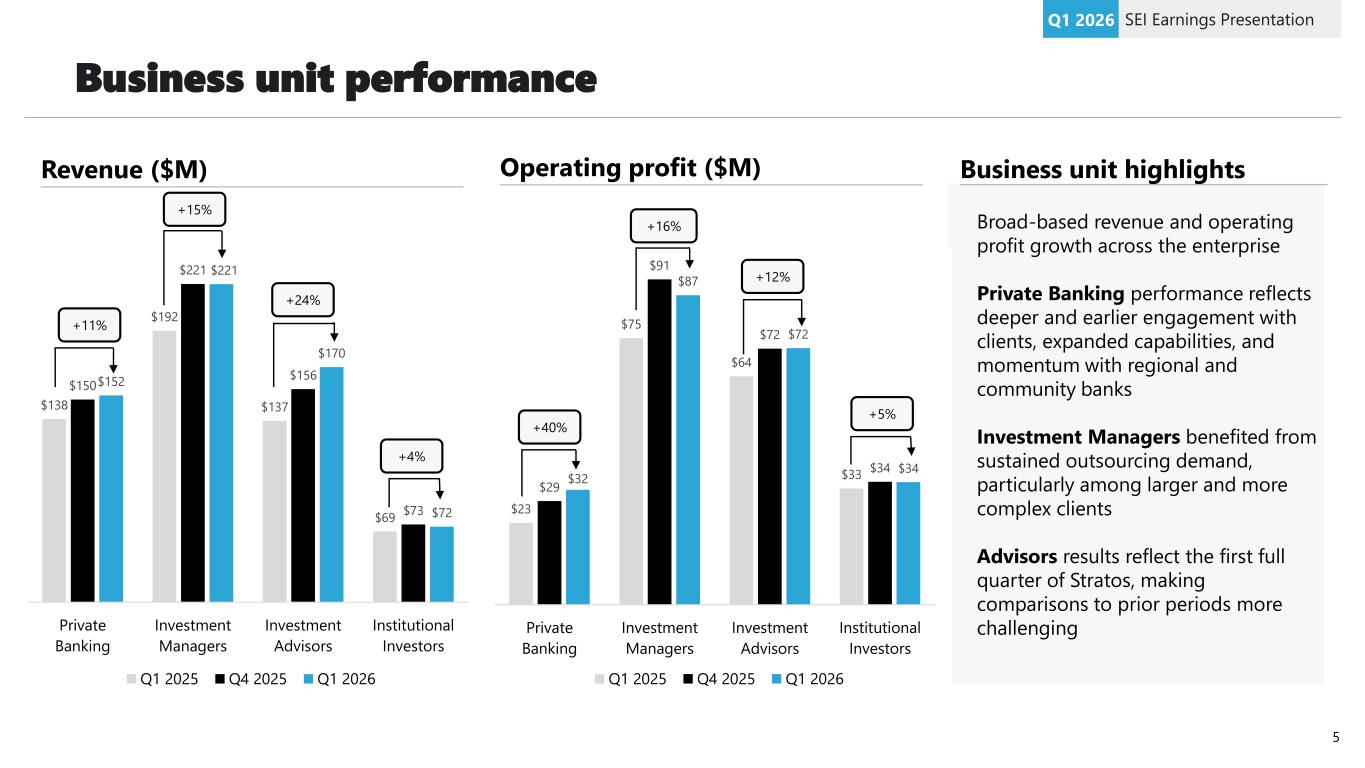
Business unit performance SEI Earnings PresentationQ1 2026 Revenue ($M) Broad-based revenue and operating profit growth across the enterprise Private Banking performance reflects deeper and earlier engagement with clients, expanded capabilities, and momentum with regional and community banks Investment Managers benefited from sustained outsourcing demand, particularly among larger and more complex clients Advisors results reflect the first full quarter of Stratos, making comparisons to prior periods more challenging Business unit highlightsOperating profit ($M) $138 $192 $137 $69 $150 $221 $156 $73 $152 $221 $170 $72 Private Banking Investment Managers Investment Advisors Institutional Investors Q1 2025 Q4 2025 Q1 2026 $23 $75 $64 $33 $29 $91 $72 $34 $32 $87 $72 $34 Private Banking Investment Managers Investment Advisors Institutional Investors Q1 2025 Q4 2025 Q1 2026 +11% +15% +24% +4% +40% +16% +12% +5% 5
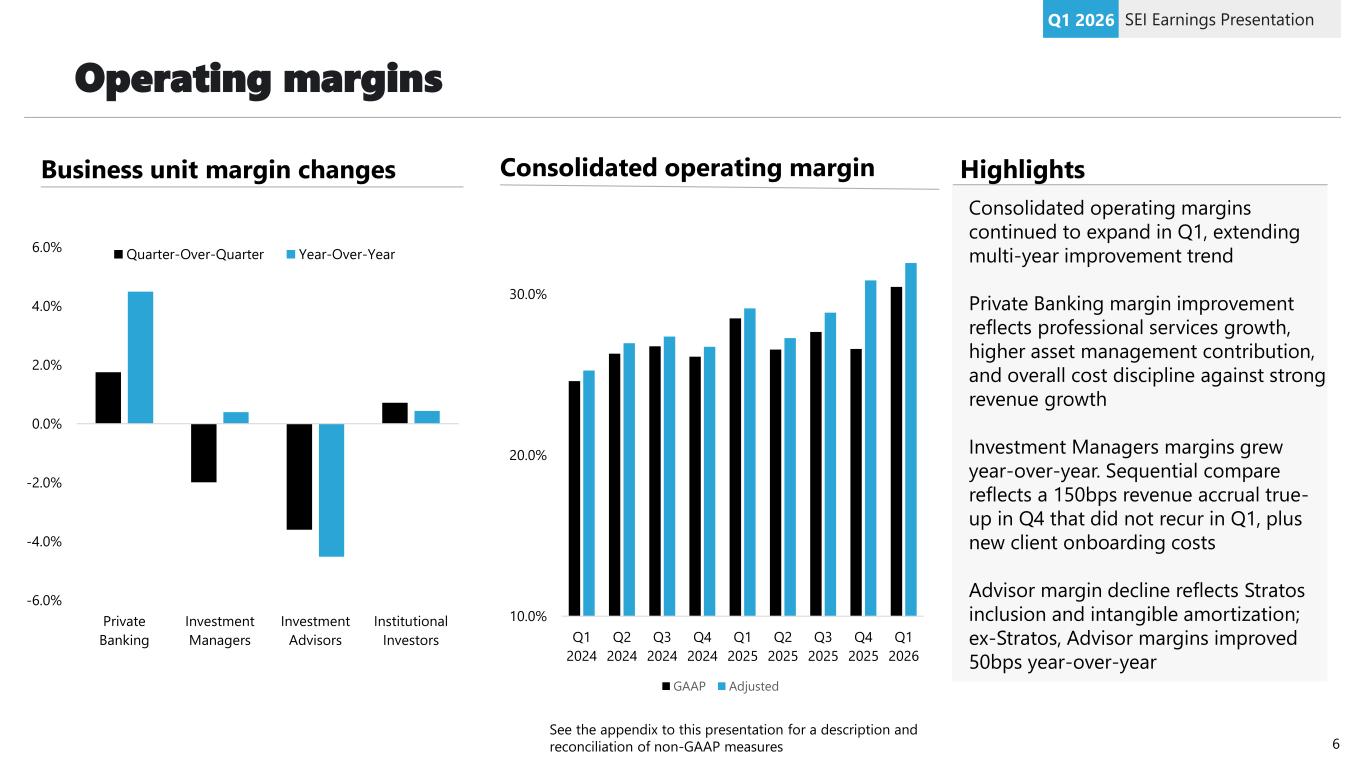
Operating margins SEI Earnings PresentationQ1 2026 -6.0% -4.0% -2.0% 0.0% 2.0% 4.0% 6.0% Private Banking Investment Managers Investment Advisors Institutional Investors Quarter-Over-Quarter Year-Over-Year Business unit margin changes HighlightsConsolidated operating margin 10.0% 20.0% 30.0% Q1 2024 Q2 2024 Q3 2024 Q4 2024 Q1 2025 Q2 2025 Q3 2025 Q4 2025 Q1 2026 GAAP Adjusted Consolidated operating margins continued to expand in Q1, extending multi-year improvement trend Private Banking margin improvement reflects professional services growth, higher asset management contribution, and overall cost discipline against strong revenue growth Investment Managers margins grew year-over-year. Sequential compare reflects a 150bps revenue accrual true- up in Q4 that did not recur in Q1, plus new client onboarding costs Advisor margin decline reflects Stratos inclusion and intangible amortization; ex-Stratos, Advisor margins improved 50bps year-over-year 6 See the appendix to this presentation for a description and reconciliation of non-GAAP measures
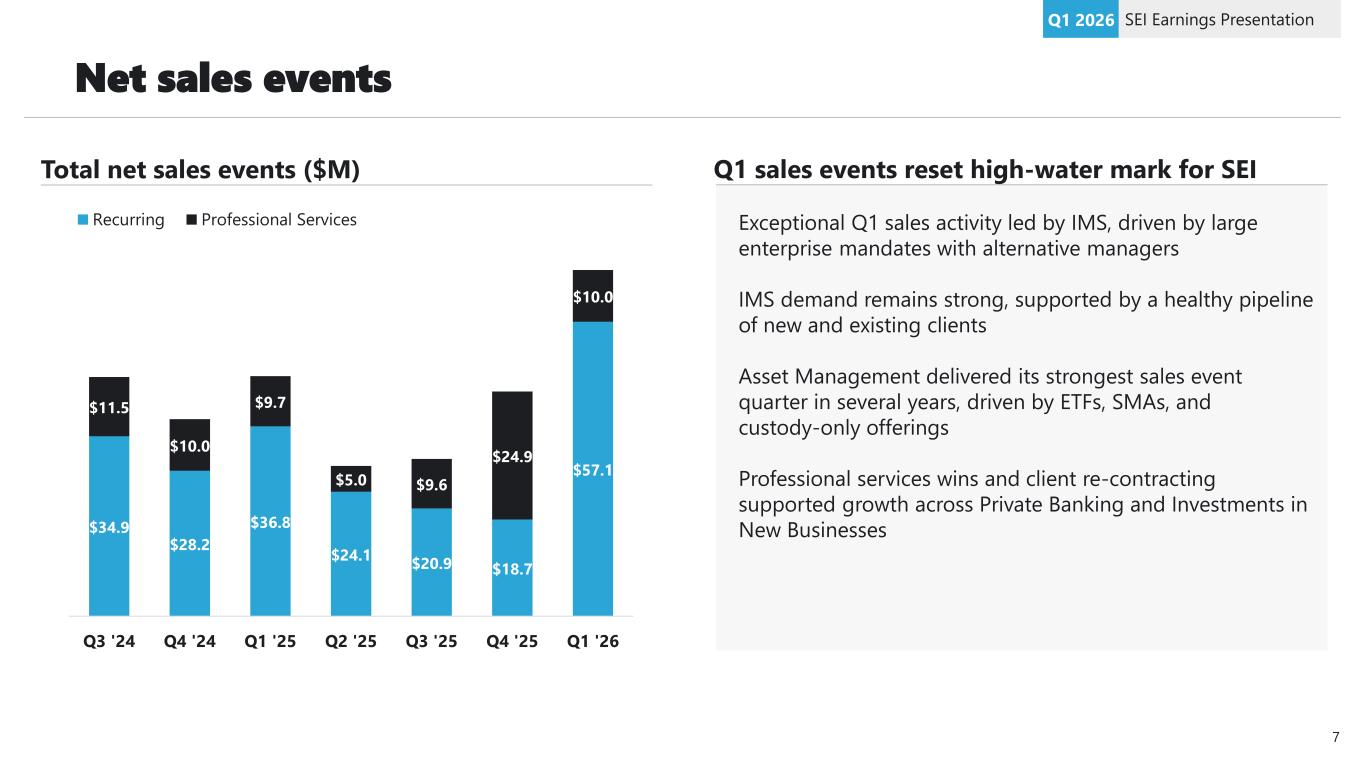
Net sales events SEI Earnings PresentationQ1 2026 $34.9 $28.2 $36.8 $24.1 $20.9 $18.7 $57.1 $11.5 $10.0 $9.7 $5.0 $9.6 $24.9 $10.0 Q3 '24 Q4 '24 Q1 '25 Q2 '25 Q3 '25 Q4 '25 Q1 '26 Recurring Professional Services Total net sales events ($M) Exceptional Q1 sales activity led by IMS, driven by large enterprise mandates with alternative managers IMS demand remains strong, supported by a healthy pipeline of new and existing clients Asset Management delivered its strongest sales event quarter in several years, driven by ETFs, SMAs, and custody-only offerings Professional services wins and client re-contracting supported growth across Private Banking and Investments in New Businesses Q1 sales events reset high-water mark for SEI 7
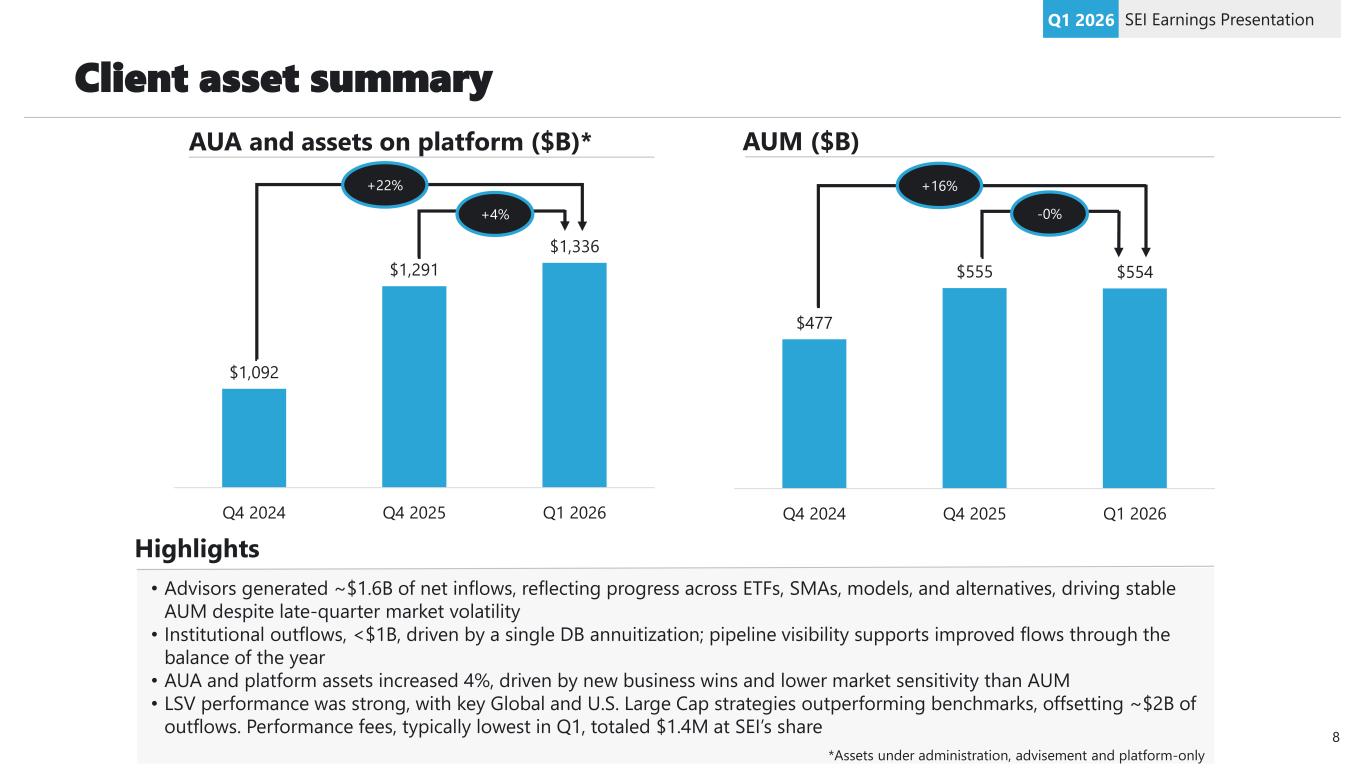
Client asset summary SEI Earnings PresentationQ1 2026 AUA and assets on platform ($B)* AUM ($B) $1,092 $1,291 $1,336 Q4 2024 Q4 2025 Q1 2026 +22% +4% $477 $555 $554 Q4 2024 Q4 2025 Q1 2026 +16% -0% Highlights • Advisors generated ~$1.6B of net inflows, reflecting progress across ETFs, SMAs, models, and alternatives, driving stable AUM despite late-quarter market volatility • Institutional outflows, <$1B, driven by a single DB annuitization; pipeline visibility supports improved flows through the balance of the year • AUA and platform assets increased 4%, driven by new business wins and lower market sensitivity than AUM • LSV performance was strong, with key Global and U.S. Large Cap strategies outperforming benchmarks, offsetting ~$2B of outflows. Performance fees, typically lowest in Q1, totaled $1.4M at SEI’s share *Assets under administration, advisement and platform-only 8
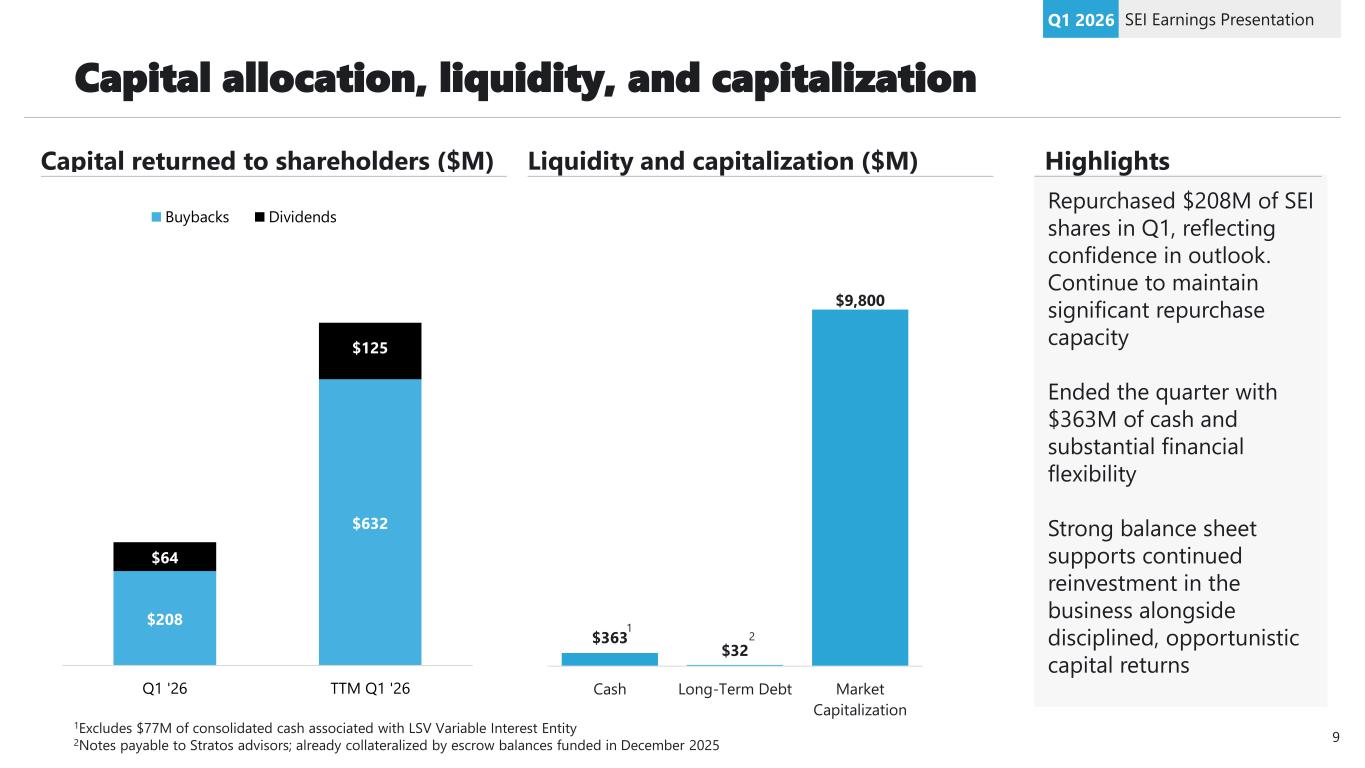
Capital allocation, liquidity, and capitalization SEI Earnings PresentationQ1 2026 Capital returned to shareholders ($M) Liquidity and capitalization ($M) $363 $32 $9,800 Cash Long-Term Debt Market Capitalization Repurchased $208M of SEI shares in Q1, reflecting confidence in outlook. Continue to maintain significant repurchase capacity Ended the quarter with $363M of cash and substantial financial flexibility Strong balance sheet supports continued reinvestment in the business alongside disciplined, opportunistic capital returns Highlights 9 $208 $632 $64 $125 Q1 '26 TTM Q1 '26 Buybacks Dividends 1Excludes $77M of consolidated cash associated with LSV Variable Interest Entity 2Notes payable to Stratos advisors; already collateralized by escrow balances funded in December 2025 1 2
For institutional investor and financial advisor use only. Not for distribution to general public. Thank you 10
For institutional investor and financial advisor use only. Not for distribution to general public. Appendix 11
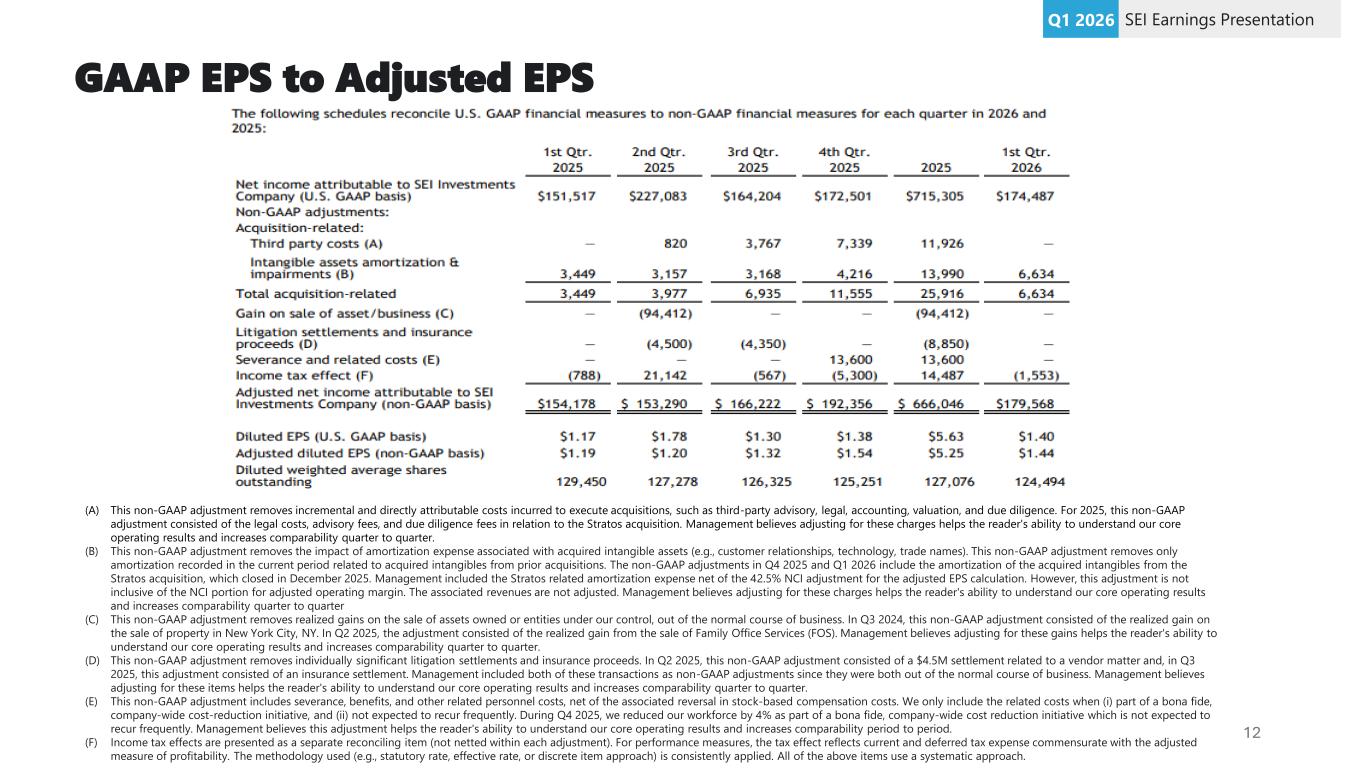
GAAP EPS to Adjusted EPS SEI Earnings PresentationQ1 2026 12 (A) This non-GAAP adjustment removes incremental and directly attributable costs incurred to execute acquisitions, such as third-party advisory, legal, accounting, valuation, and due diligence. For 2025, this non-GAAP adjustment consisted of the legal costs, advisory fees, and due diligence fees in relation to the Stratos acquisition. Management believes adjusting for these charges helps the reader's ability to understand our core operating results and increases comparability quarter to quarter. (B) This non-GAAP adjustment removes the impact of amortization expense associated with acquired intangible assets (e.g., customer relationships, technology, trade names). This non-GAAP adjustment removes only amortization recorded in the current period related to acquired intangibles from prior acquisitions. The non-GAAP adjustments in Q4 2025 and Q1 2026 include the amortization of the acquired intangibles from the Stratos acquisition, which closed in December 2025. Management included the Stratos related amortization expense net of the 42.5% NCI adjustment for the adjusted EPS calculation. However, this adjustment is not inclusive of the NCI portion for adjusted operating margin. The associated revenues are not adjusted. Management believes adjusting for these charges helps the reader's ability to understand our core operating results and increases comparability quarter to quarter (C) This non-GAAP adjustment removes realized gains on the sale of assets owned or entities under our control, out of the normal course of business. In Q3 2024, this non-GAAP adjustment consisted of the realized gain on the sale of property in New York City, NY. In Q2 2025, the adjustment consisted of the realized gain from the sale of Family Office Services (FOS). Management believes adjusting for these gains helps the reader's ability to understand our core operating results and increases comparability quarter to quarter. (D) This non-GAAP adjustment removes individually significant litigation settlements and insurance proceeds. In Q2 2025, this non-GAAP adjustment consisted of a $4.5M settlement related to a vendor matter and, in Q3 2025, this adjustment consisted of an insurance settlement. Management included both of these transactions as non-GAAP adjustments since they were both out of the normal course of business. Management believes adjusting for these items helps the reader's ability to understand our core operating results and increases comparability quarter to quarter. (E) This non-GAAP adjustment includes severance, benefits, and other related personnel costs, net of the associated reversal in stock-based compensation costs. We only include the related costs when (i) part of a bona fide, company-wide cost-reduction initiative, and (ii) not expected to recur frequently. During Q4 2025, we reduced our workforce by 4% as part of a bona fide, company-wide cost reduction initiative which is not expected to recur frequently. Management believes this adjustment helps the reader's ability to understand our core operating results and increases comparability period to period. (F) Income tax effects are presented as a separate reconciling item (not netted within each adjustment). For performance measures, the tax effect reflects current and deferred tax expense commensurate with the adjusted measure of profitability. The methodology used (e.g., statutory rate, effective rate, or discrete item approach) is consistently applied. All of the above items use a systematic approach.
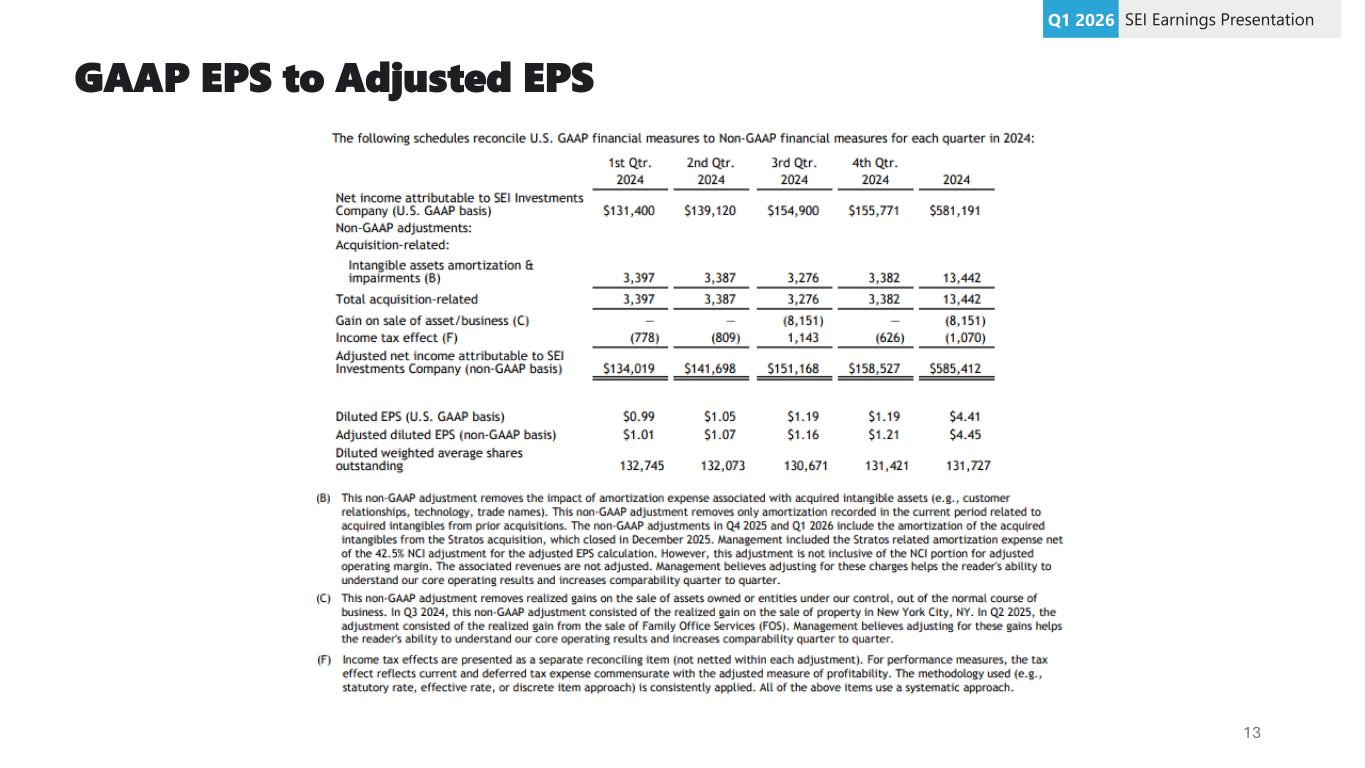
GAAP EPS to Adjusted EPS SEI Earnings PresentationQ1 2026 13
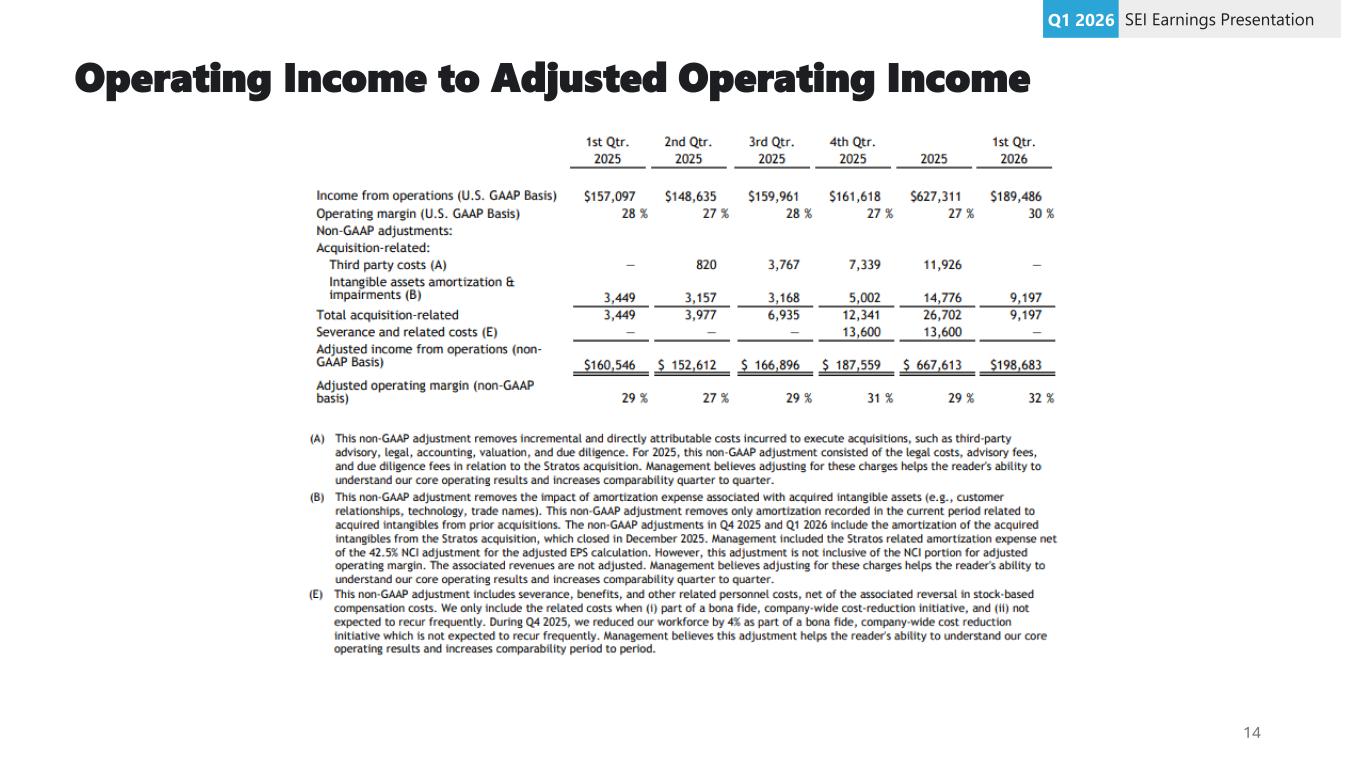
Operating Income to Adjusted Operating Income SEI Earnings PresentationQ1 2026 14
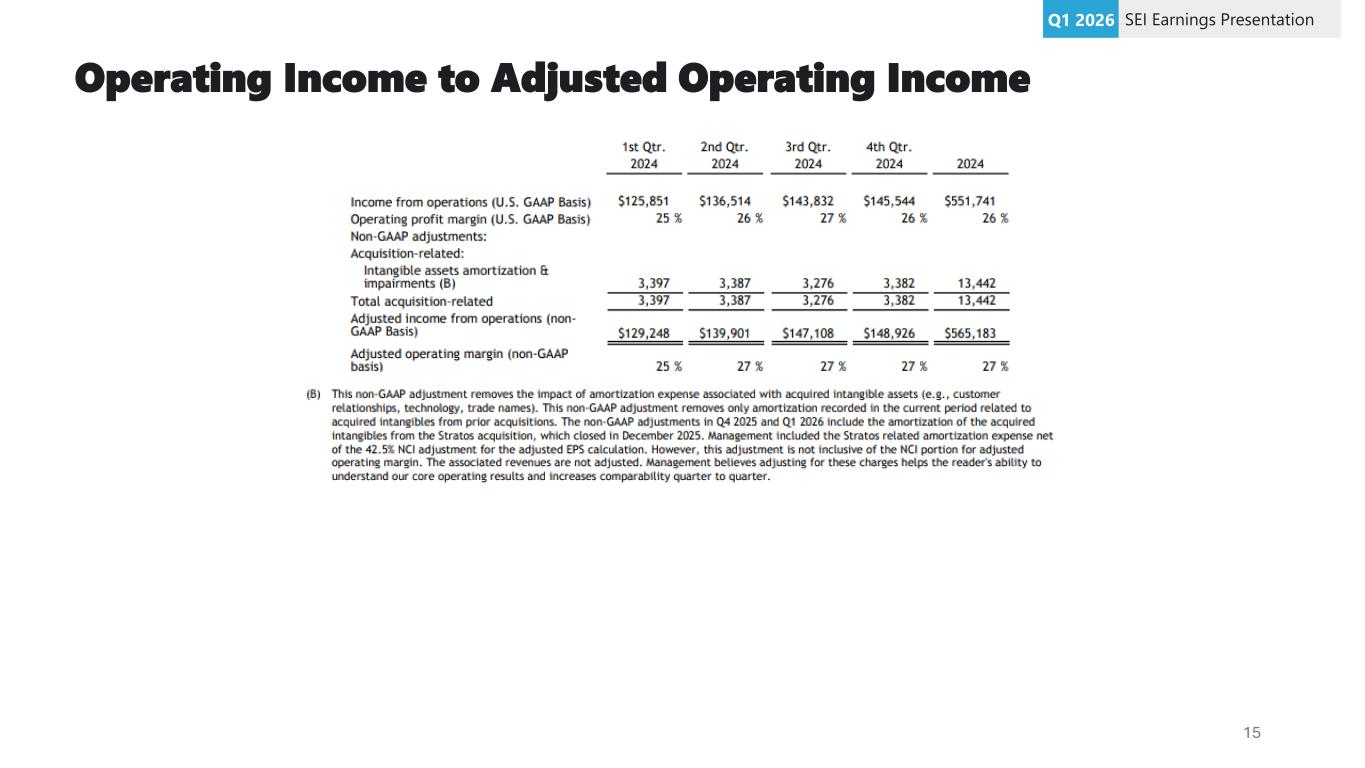
Operating Income to Adjusted Operating Income SEI Earnings PresentationQ1 2026 15