Hello, everybody, and welcome to the CoStar Earnings Call for Q1 2026. Thank you all for joining us. Before I turn the call over to Andy Florence, CoStar Group's CEO and founder, and Chris Lowne, our CFO, I'd like to review a few of our safe harbor statements. First of all, certain portions of the discussion today may contain forward-looking statements. The company's outlook and expectations are based on current beliefs and assumptions. Forward-looking statements involve many risks, uncertainties, assumptions, estimates, and other factors that can cause actual results to differ materially from such statements. Important factors that can cause actual results to differ include, but are not limited to, those stated in CoStar Group's press release issued today and in our filings with the SEC. All forward-looking statements are based on the information available at CoStar Group on the date of this call. CoStar Group assumes no obligation to update these statements, whether as a result of new information, future events, or otherwise. Reconciliation to the most directly comparable gap measure of any non-gap financial measure discussed on this call are shown in detail in our press release issued today, along with the definitions for those terms. The press release is available on our website, located on costargroup.com under Press Room. Please refer to today's press release on how to access the replay of this call. Remember, one question during the Q&A session, so make it a good one. And with that, I'd like to turn the call over to our founder and CEO, Andy Florence. Thank you, Rich.
Thank you for joining us today.
Operator
I want to start with three things.
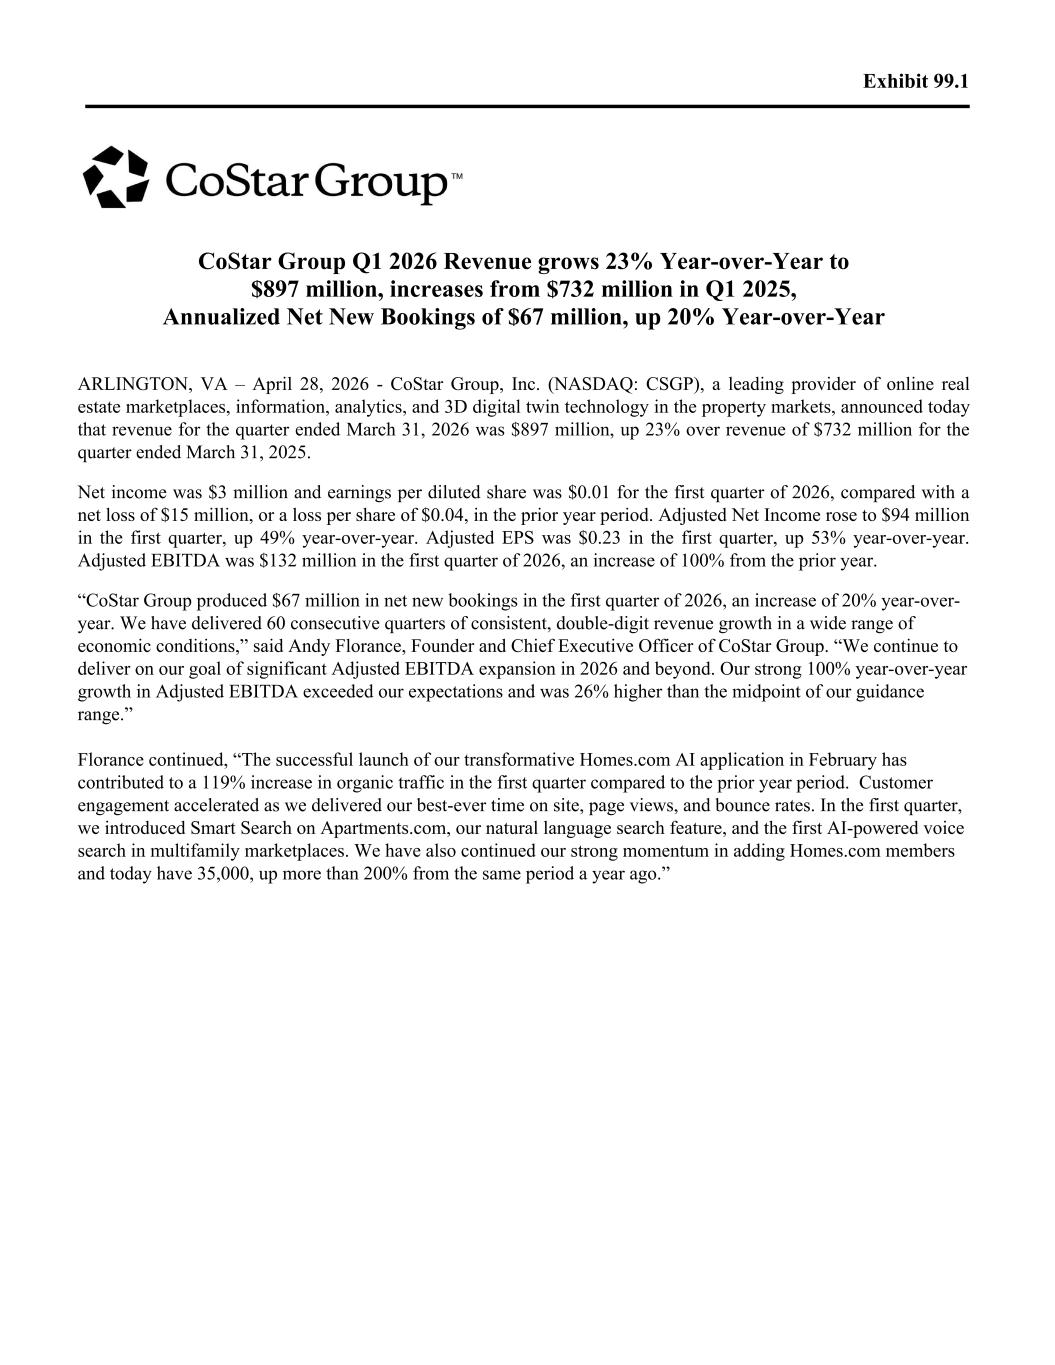
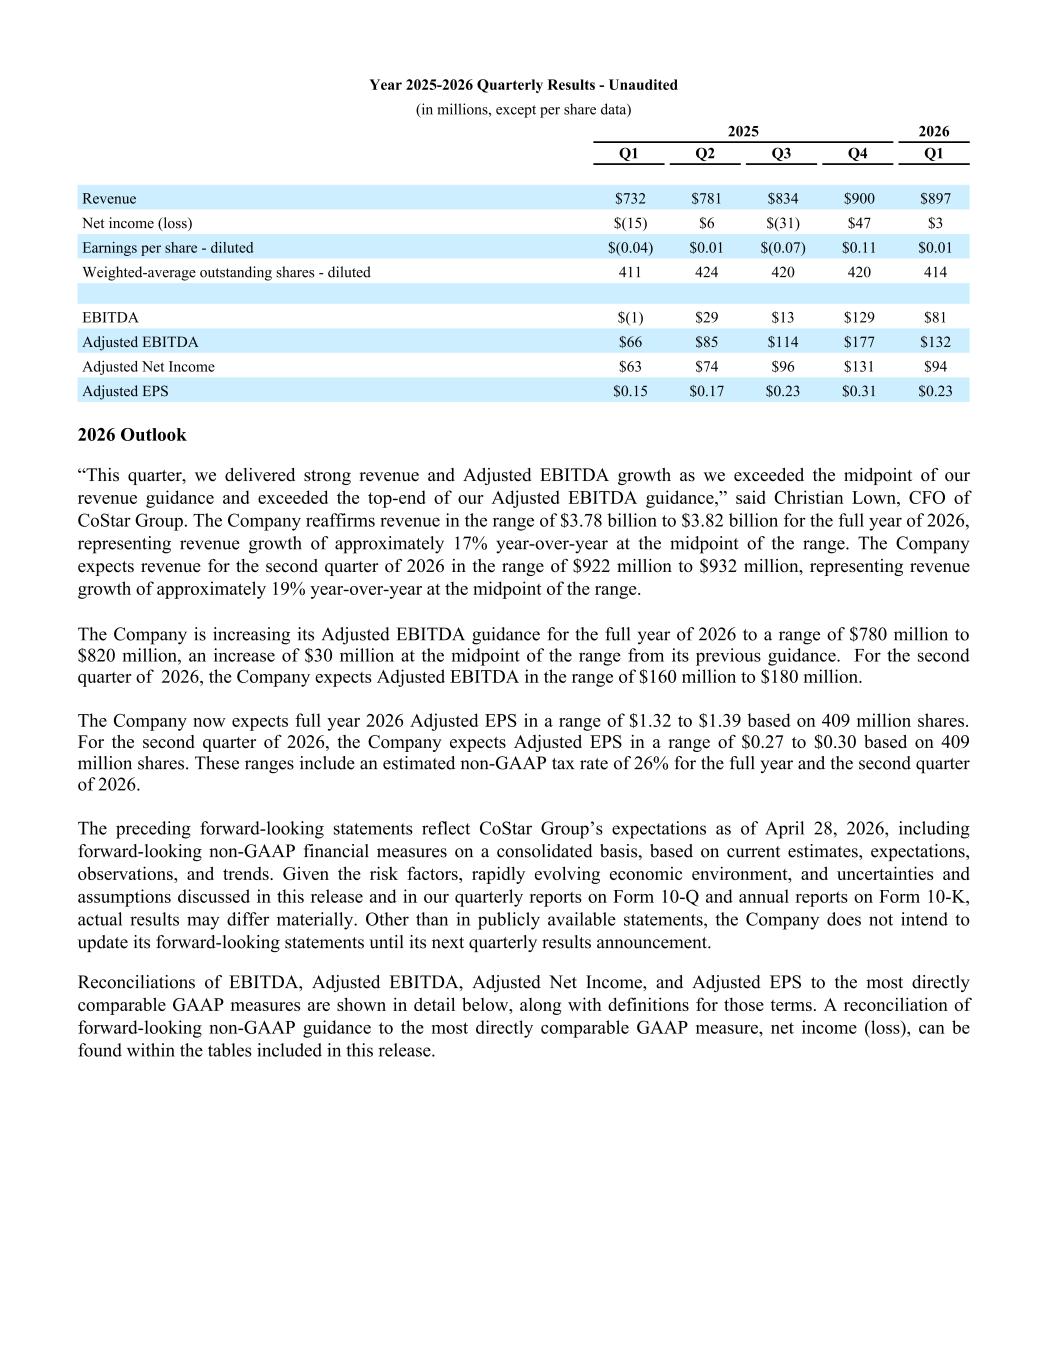
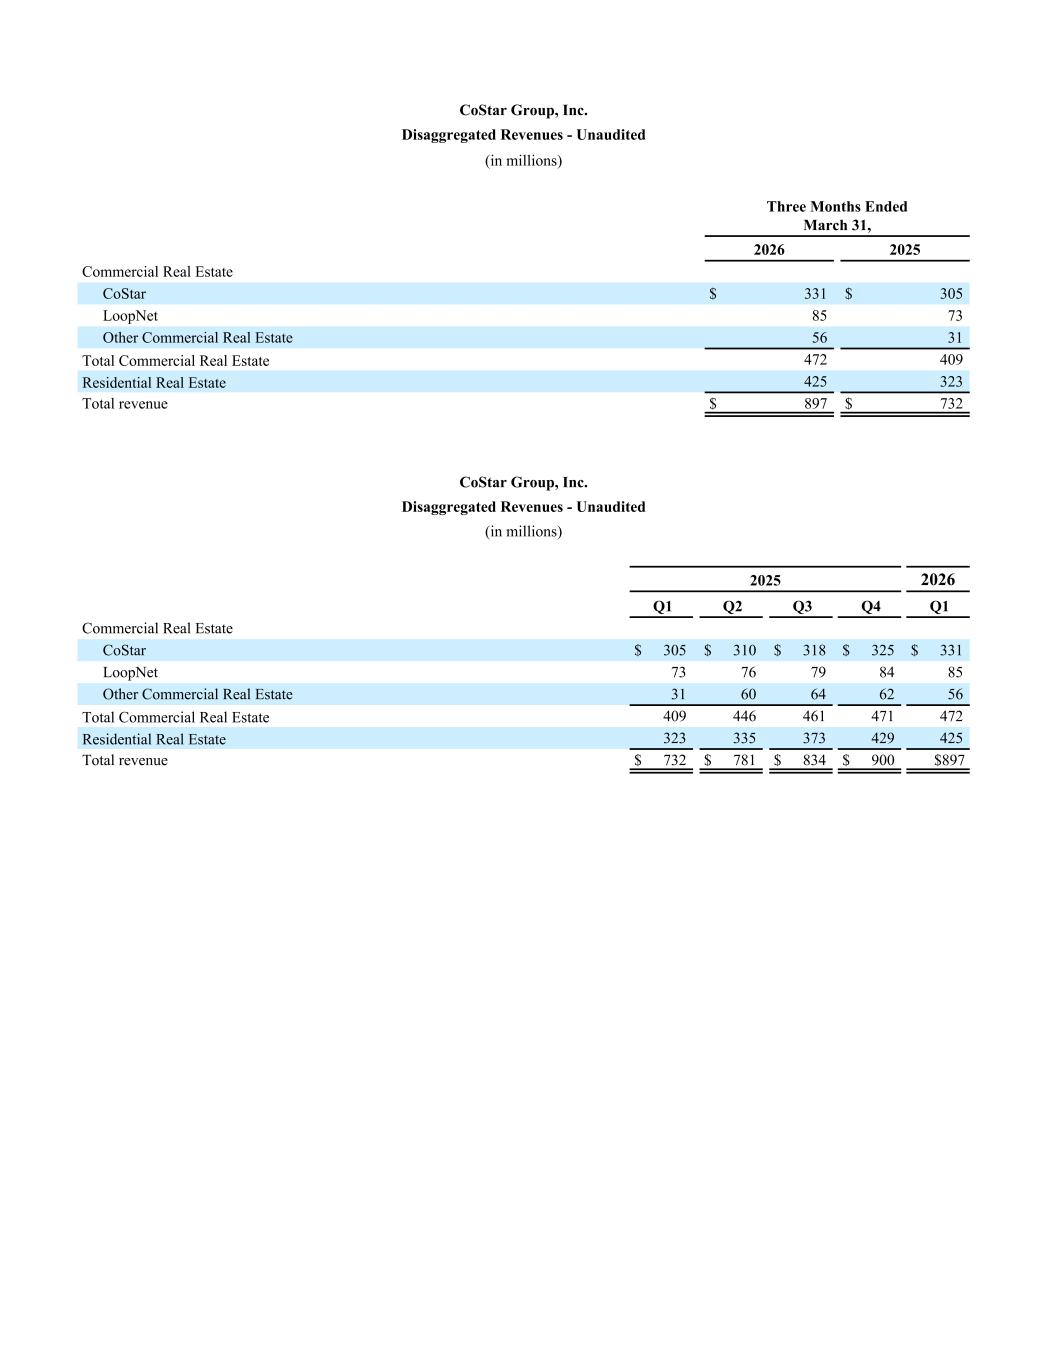
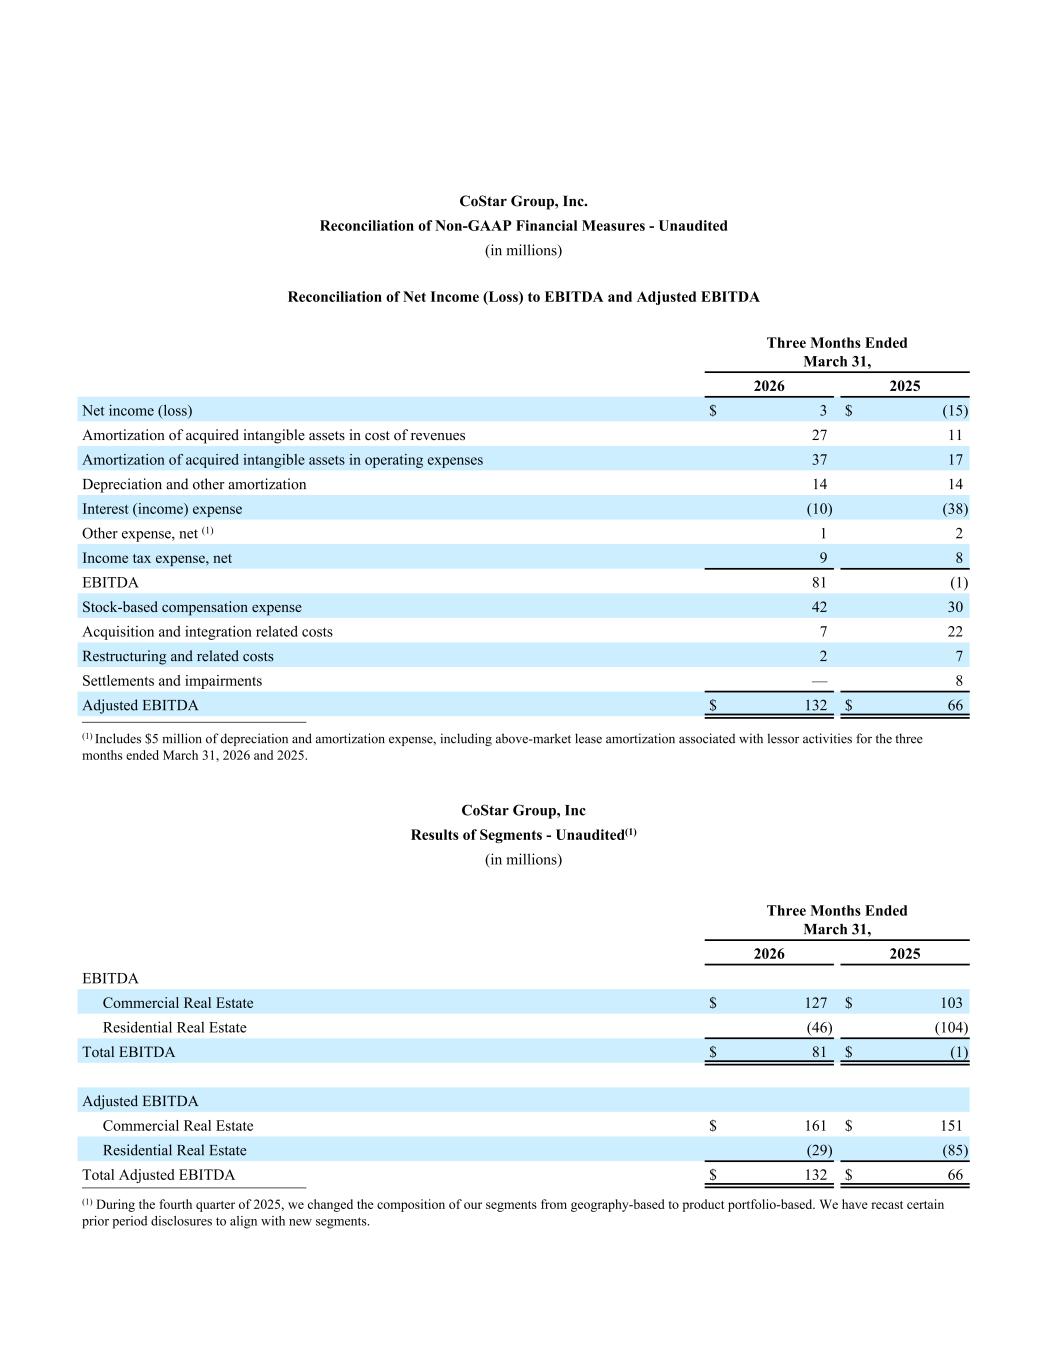
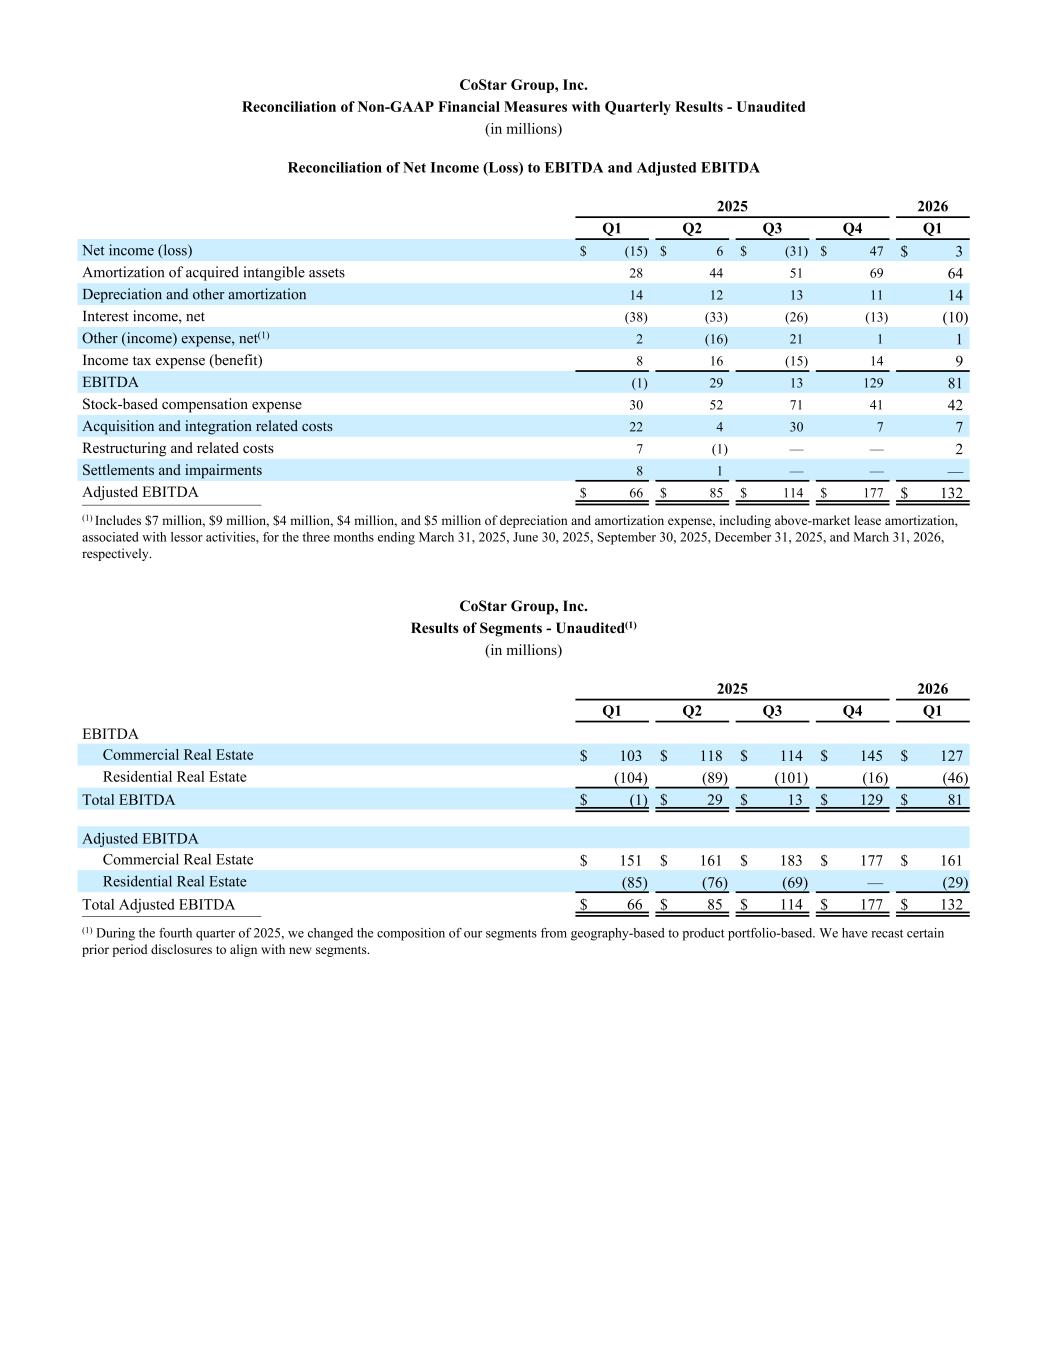
First, this was an exceptional quarter. We delivered our 60th consecutive quarter of double-digit revenue growth. Our adjusted EBITDA doubled, and we're on track for the highest full year adjusted EBITDA in CoStar Group's history. Second, the Homes.com investment is delivering exactly what we said it would. Member agents are generating extraordinary returns on their subscriptions. Consumer engagement on Homes.ai is multiples of conventional residential search. And Homes.com is the fastest growing residential portal in the United States. I'll walk you through the evidence later in the call. Third, the activist distraction is behind us. With the noise gone, we have more focused energy than ever to spend on what matters, growing EBITDA. Let me take you through the numbers. First quarter 2026 revenue grew 23% year-over-year. Q1 26 adjusted EBITDA of $132 million doubled year-over-year and came in 26% above the midpoint of our guidance. After a record 2025 for annualized net new bookings, we started 2026 stronger still. Q1 net bookings of $67 million were up 20% year-over-year. We expect productivity to build over the year, particularly from the sales reps we hired throughout 2025. Our commercial business generated $472 million of revenue in Q1, up 15% year-over-year, with adjusted EBITDA of $161 million. CoStar revenue was $331 million, let's get that extra million in there, in Q1, with annualized net new bookings from our core CoStar product up 16% year-over-year. CoStar users grew 22% year-over-year to $317,000. Sales to brokers and tenants were especially strong, with broker sales up 29% and tenant sales up 27% year-over-year. costar nps was 69 and our quarterly renewal rate was 92 percent costar rent benchmark launches this summer drawing on our proprietary lease database and public records it will be the industry's only net effective rent benchmark product giving landlords occupiers investors and brokers visibility into starting rents effective rents ti allowances free rents and escalations across U.S. markets. CoStar New Homes is in development with phase one plan for Q2. The module tracks new residential construction from planning through delivery and serves home builders, mortgage bankers, retailers, and retail center owners. It integrates builder feeds, drone imagery, and other data sources to deliver insight into housing supply, demand, and market trends. CoStar Debt Solutions, formerly CoStar Lender, had a strong quarter with net new bookings up 26% year-over-year as the business crossed $100 million in revenue. Debt Solutions now serves over 500 financial institutions across the full lender spectrum, including banks, private lenders, debt funds, and regulators. Debt Solutions is on track to launch CRE debt benchmarking in the second half of 26, with CRE loan origination workflow following in Q1 of 27. The final product will be a full workflow solution to originate and underwrite a loan. Our first release will focus on seamless delivery of property details, peer properties, and market information. We launched a client advisory committee with over a dozen institutions to shape the loan origination roadmap, deepen understanding of how AI is reshaping their workflows and strengthen product market fit. Across the platform, Debt Solutions is actively building these AI-enhanced workflows. CoStar UK's growth accelerated in Q1 with revenue up 25% and net new bookings up 44% year-over-year. This growth was supported by the release of new land registry lease modules that gave clients authoritative effective rent data sourced from government records and the re-collapse of one of our primary competitors there. CoStar Canada revenue grew 22% year-over-year. We released multi-family analytics coverage for Montreal in Q1. CoStar France launches in Q2. We will cross sell into the 32,000 French CRE professionals who already subscribe to news and information from our business IMO acquisition, accelerating adoption as we build the only pan-European CRE data and analytics platform. In CoStar Australia, we are rapidly building proprietary property data with our local research team now approaching 100 people. We expect to launch CoStar and LoopNet in Australia in Q3 and Q4. Real Estate Manager added AI lease abstraction capabilities to the Visual Lease platform this quarter and will extend these capabilities to CoStar Real Estate Manager later this year. Customers are eager to bring this best-in-class capability into the lease management and accounting workflows to save them a lot of time and hassle. We're also deploying multiple AI agents internally to accelerate customer onboarding, support enablement, and the automation of reputable professional services work. In Q1, SDR launched profitability benchmarking, supporting more than 150 detailed data points across a hotel's P&L. Customer interest was immediate, with 750 hotel subscribers submitting data to unlock the functionality building participation at scale is critical to future monetization and this early engagement reinforces the long-term value of the investment loopnet generated 85 million of revenue in q1 up 16 year-over-year paid listings rose 10 percent year-over-year in the U.S., 35 percent in Canada, and 63 percent in the U.K. Last month, after more than a year of successful testing, we rolled at asset-based pricing across all U.S. markets. LoopNet advertising is now priced to match the size of the asset and the value LoopNet delivers to listers. Early results have been really outstanding. At the high end, the volume of silver listings sold at $300 or above per month grew 650% from February to March. At the low end, listings sold below $40 grew over 1,100%, opening up an entirely new category of inventory and bringing in smaller advertisers who could not justify the higher price points for one-size-fits-all that we had before. We expect this to drive more listings, more traffic, and more revenue. LoopNet's European revenue grew 17% year-over-year. Following last year's launch in France and Spain, we're seeing the network effects of being the first and only global commercial real estate marketplace. Average monthly unique visitors on LoopNet Europe more than doubled to over 900,000, up 102% year-over-year. Crucially, these users are not just searching their home countries, they're searching globally. We will extend this network effect as LoopNet launches in Australia, Germany, and other markets. Our Australia CRE marketing platform, commercialrealestate.com.au, grew 10% year-over-year on a pro forma basis, driven by higher depth revenue, improving depth penetration, and higher average revenue per listing. That commercial unique visitor audience was up 129% year-over-year in Q1. Subscription revenue from Matterport was up 19% year-over-year. Enterprise momentum built through the quarter. New enterprise accounts in March were up 31% year-over-year. And direct sales were up 16%, supported by a healthy and expanding pipeline that continues to build into Q2. Matterport has become a critical point of differentiation across CoStar Group. It drives engagement, lists conversion, and generates valuable proprietary data. Integration is proceeding exceptionally well across Apartments.com, Homes.com, LoopNet, CoStar, Domain. Matterport is already a key component of Homes AI and will unlock huge future AI innovation all across CoStar Group. Matterport Exteriors with X-Ray, now an alpha, lets users virtually remove a roof or floor of a virtual building to see the building's interior in the context of the yard, the neighborhood. That's a real estate marketer's dream. We've also released a number of new innovations with strong use cases in architectural engineering, construction, facilities management, and manufacturing. Biz by sale revenue was $8.8 million in Q1. with broker subscriptions reporting 2 300 with broker subscribers i'm sorry reporting 2 345 completed sales transactions of businesses representing 2 billion enterprise value 59 of which involved commercial real estate we're rapidly turning biz by cell into a true end to end transaction platform with integrated financing 3d tours and document sharing now driving over 24,000 briar profiles and 15% broker adoption. Residential revenue is $421 million in Q1, up 32% year-over-year. Adjusted EBITDA improved by $56 million, and we expect the residential segment to reach profitability in Q2, 2026. Apartments.com generated $312 million of revenue in Q1 up 10% year-over-year, the 15th consecutive quarter of double-digit revenue growth. Apartments.com delivered 220 million highly engaged renter visits, 370,000 tours, and 300,000 applications submitted directly on our platform to apartment owners alongside 40 million Matterport tours. Our monthly renewal rate held at 99%. Apartments.com brand media impressions nearly tripled in Q1, up 189% year-over-year to $1.7 billion. The longer we invest in our brand on behalf of our clients, the more efficiently we deploy that investment. Clear example, our first ever co-branded Super Bowl commercial with Homes.com aired on February 8th, reaching 126 million viewers, the highest peak viewership in U.S. media history. Combined with our industry-leading SEO and SEM, these efforts continue to produce the most qualified audience of apartment seekers on the Internet. According to Google, overall rental search demand remains soft. Even so, Comscore data shows Apartments.com network unique visitors up 3% year-over-year in March. Zillow unique visitors were down 5% year-over-year, and Zillow's expanded rental network, Zillow Plus Realtor Plus Redfin, was down 3%. Zillow has now seen unique visitors decline year-over-year for 15 consecutive quarters. Let's make that 15 consecutive months, not 15 consecutive quarters. I was just sort of picking up the 15 consecutive quarters of double-digit growth we had. Our Salesforce conducted 185,000 quality meetings in Q1 for Apartments.com and achieved an outstanding NPS of 89. In Q1, Apartments.com introduced Smart Search, our natural language search feature, and the first AI-powered voice search in multifamily. Smart Search lets renters search the way they speak, packing every detail and even multiple locations into a single query. Results are faster, more detailed, and dramatically more efficient. The early metrics are really strong. Renters who use Smart Search spend 94% more time on site and view 63% more listings. Ahead of the June Apartmentalized Trade Show that NAA hosts, the big show of the year, we will launch Apartments to AI, our pioneering conversational search experience built on the same technology powering Homes AI. Apartments AI will more deeply engage renters and continuing delivering best-in-class advertiser ROI through the industry's highest quality leads. We will also highlight Homes.com's expanded rental capabilities and the value add to Apartments.com at that same Apartmentalize. apartments.com leads the industry on price transparency any property can now display complete all-in monthly price with all the extras reoccurring one-time required fees with a prominent badge alerting renters six states already require this sort of transparency and the ftc just concluded its public comment period on similar rules matterport continues to be a true differentiator for consumers on apartments.com. We now have approximately 250,000 3D tours on the platform, including over 1,500 Matterport 3D exteriors that give prospective renters an immersive 360-degree view of the entire community. In Q1, renters spent 46% more time on listings featuring a Matterport, and those listings generated 56 times more tour requests per listing than listings without one. It's an amazing stat. Homes.com revenue grew 58% year-over-year to $26 million in Q1. We're on pace to hit our state of 2026 net investment target of $550 million in homes. And what that investment is buying is becoming clear in the data. Membership growth and monetization are both accelerating. We added over 4,300 members in Q1, up 205% from Q1 of 25. We now have 35,175 agent subscribers, with 76% of them on annual contracts. Net new bookings were 11 million in Q1. March annual revenue run rate reached $106 million, up 92% year-over-year. Our trailing 12-month average ARPU is $287. We are now seeing clear, quantifiable evidence that Homes.com business model is working and that our subscribers are getting an extraordinary return on their investment. We analyzed the first 11,400 Homes.com members and compared their commission earnings in the 12 months before joining Homes.com to the earnings in the 12 months after they became a Homes.com subscriber. The findings are striking. On average, a Homes.com subscriber earned $36,400 more in commissions in their first year as a member. Against an average annual subscription cost of just $3,400. That's an 11 times return on their investment. In the same time period, our members saw commissions grow 16%, while the average non-member saw their commissions decline. The ROI is even stronger for the agents who need it most. Agents who have had earned $50,000 or less in the prior year earned 58,000 more after joining. Pre-membership earnings were 26,000 on average and that jumped to 82,000 on average. There are hundreds of thousands of agents in this earnings cohort. Agents in the 50 to 100,000 bracket earned 41 more thousand dollars in commissions after joining. Agents in the $100,000 to $150,000 bracket earned $38,000 more once they became Homes members. These numbers almost certainly understate the value. The benefit extends beyond our 12-month analysis window, and we exclude the significant rental marketing value members generate through Homes.com and our syndication to Apartments.com. Based on these results, we will raise subscription fees for new customers on May 1st and evaluate measured potential renewal increases. For CoStar Group as a whole, this is the fastest organic revenue build we've ever achieved for a new product, and we hit these revenue levels faster than our U.S. competitors did at their start. Our NPS is 41, an excellent score after just two years and still improving. Homes.com subscribers paid to promote 260,000 active listings in Q1, representing 8.7% of the nearly 3 million homes for sale in the U.S. In 2025, the Homes.com network drew nearly 2.1 billion views and 108 million average monthly unique visitors. We achieved a healthy balance across SEM, SEO, and direct traffic, allowing us to optimize SEM for quality leads, not just quantity. The result is better traffic and more engaged visitors. Organic traffic to homes.com was up more than 100% year-over-year in every month of the quarter, and March specifically up 119% year-over-year. Homes.com was featured across major cultural moments in 2026, including the Oscars, the Olympics, the Super Bowl, March Madness, and many other, driving over three billion impressions in Q1. Our new March ad showcased Homes AI in action, and I have received more positive feedback on this campaign than any of our prior Homes.com campaigns. In March, average annual session duration hit an all-time high of 26% year-over-year, and bounce rate hit an all-time low down 29%. Homes AI is the engine behind this engagement search. AI users run nearly four times as many searches, favorite seven times as many properties, and submit seven times as many leads. In April, time on site reached 18 minutes for AI users versus four minutes, 32 seconds for non-AI users. Put plainly, when consumers experience Holmes AI, they spend roughly four times longer than they do on conventional residential search. This is precisely the dynamic that precedes meaningful consumer share shift and is exactly the proof point we expected our AI investment to produce. In March 26, we significantly expand our relationship with eXp Realty, the largest residential firm by transaction size in 25. The new partnership lets eXp's A3000 agents prominently display pre-market coming soon listings on homes.com. You may recall we partnered earlier with eXp Commercial in December 24 when they became a major subscriber to CoStar's information and analytics. We've been integrating apartments.com with Homes.com since early 2025. Last year, Homes.com rentals drove over 10% of Apartments.com's traffic, making Homes.com Apartments.com's largest syndication partners. This combination produced nearly 650,000 paid single-family home rental listings in 2025. Paid single-family rental listings in Q1-2026 grew 33% year-over-year. According to Homes.com, Homes.com is now the fastest growing rental site in the U.S. For Google Analytics, homes.com rentals visits grew by 13 million versus Q1 of 2025, making homes.com our most powerful platform for reaching a single family rental market. Over 214,000 independent owners now use our rental tools and we expect that number to raise materially as we extend the full apartments.com feature set into homes.com. We're continuing to improve the experience for renters who search on homes.com. By the end of 2026, every tool available on apartments.com will be available on homes.com, letting independent owners rent their house, condo, or townhouse across both platforms. At the end of August 2025, we began selling marketing on homes.com to new home builders. In the first eight months, we generated $3.3 million in annualized net new bookings, with the run rate accelerating each quarter. Q1 alone delivered 1.5 million. We assigned data feed agreements with 663 home builders looking to reach the Homes.com audience. These feeds now cover roughly 75% of all production new home activity in the U.S. These feeds provide a better consumer experience to home searchers on Homes.com and are a foundational building block to power a valuable new homes information product within CoStar. So let me pause to speak briefly to Delph in the room. The activist campaign over the last year did weigh heavily on homes.com sales and potential partnerships. Real estate leaders were reading a steady drumbeat of negative coverage. Nonetheless, we made durable progress through it. With that distraction now behind us, we can now apply even more focused energy to accelerating Homes.com revenue and the revenue in every other business in the portfolio. Land.com revenue grew 8% year-over-year, and net new bookings hit a record, up 126% year-over-year, boosted by replacing a regionally targeted site-specific ad with a county-targeted network ad format. Inventory tripled, and ads sold quadrupled. Domain Australia delivered a strong Q1 with sustained elevated audience volume, strong uptake of premium products, and disciplined cost control. Recent investments in product technology research and photography are now producing tangible outcomes, and Q1 revenue was $68 million. The Australian market is highly cyclical, and Q1 is always seasonally soft, which is reflected in overall sequential down revenue. Year over year, however, core domain residential revenue did grow 11%. We delivered EBITDA growth despite all the significant investments we're making. In addition to expected normal seasonality, we did also discontinue revenue from spam ads on the domain portals because it was not materially profitable and significantly distracted from the value of home sellers, the value home sellers receive when marketing on those sites. costar group's technology capabilities are already benefiting australian customers domain site improvements are dramatically increasing traffic monthly unique audience averaged 8 million across the quarter with march hitting 8.4 million the second highest month on record total users reached a high of 21.9 million up 47 percent year-over-year and listings grew 28%. Domain launched Matterport in Australia this month, bundling immersive technology into premium listing packages and giving agents and vendors meaningful savings on traditional photography. The launch generated significant positive media coverage. Q1 was another strong quarter for on the market. We closed it with our 23rd consecutive month of positive net new bookings. Total time on site was up 16%, and page views up 24% year-over-year, driving a 23% year-over-year increase in leads. On the market now has 17,500 state agents and new home developer customers on site, the highest in its history. On the market has eclipsed Zoopla as the UK's number two portal by inventory, and now has more new home listings than Rightmove. The growth was accelerated by Cy and the Connells Group, the UK's largest estate agent, with over 80 brands and more than 1,200 branch locations. Our on-the-market sales team is delivering real value for customers. NPS came in at a solid 46 for the period. In Q2, we'll continue building AI search functionality as we progress towards integrating on-the-market into the homes.com software environment in 2027. In closing, I want to acknowledge our outstanding management team. The breadth and depth of expertise across this company is what makes everything you've heard today possible. There's a lot of it. I am very grateful for what they bring to this company. I also want to thank our board of directors, our leadership expertise, and counsel. We're outstanding through what was, at times, a noisy year. We are well positioned to deliver against every objective we've set and to unlock large digital real estate opportunities ahead of us. To our shareholders, thank you for your continued support. The day of this quarter, across CRE, across apartments, especially across homes.com, confirms one thing. The strategy is working. I've never been more confident in our plan to deliver double-digit revenue growth and significant earnings expansion through 2030 and beyond. At this point, I'll turn the call over to our CFO, Chris.
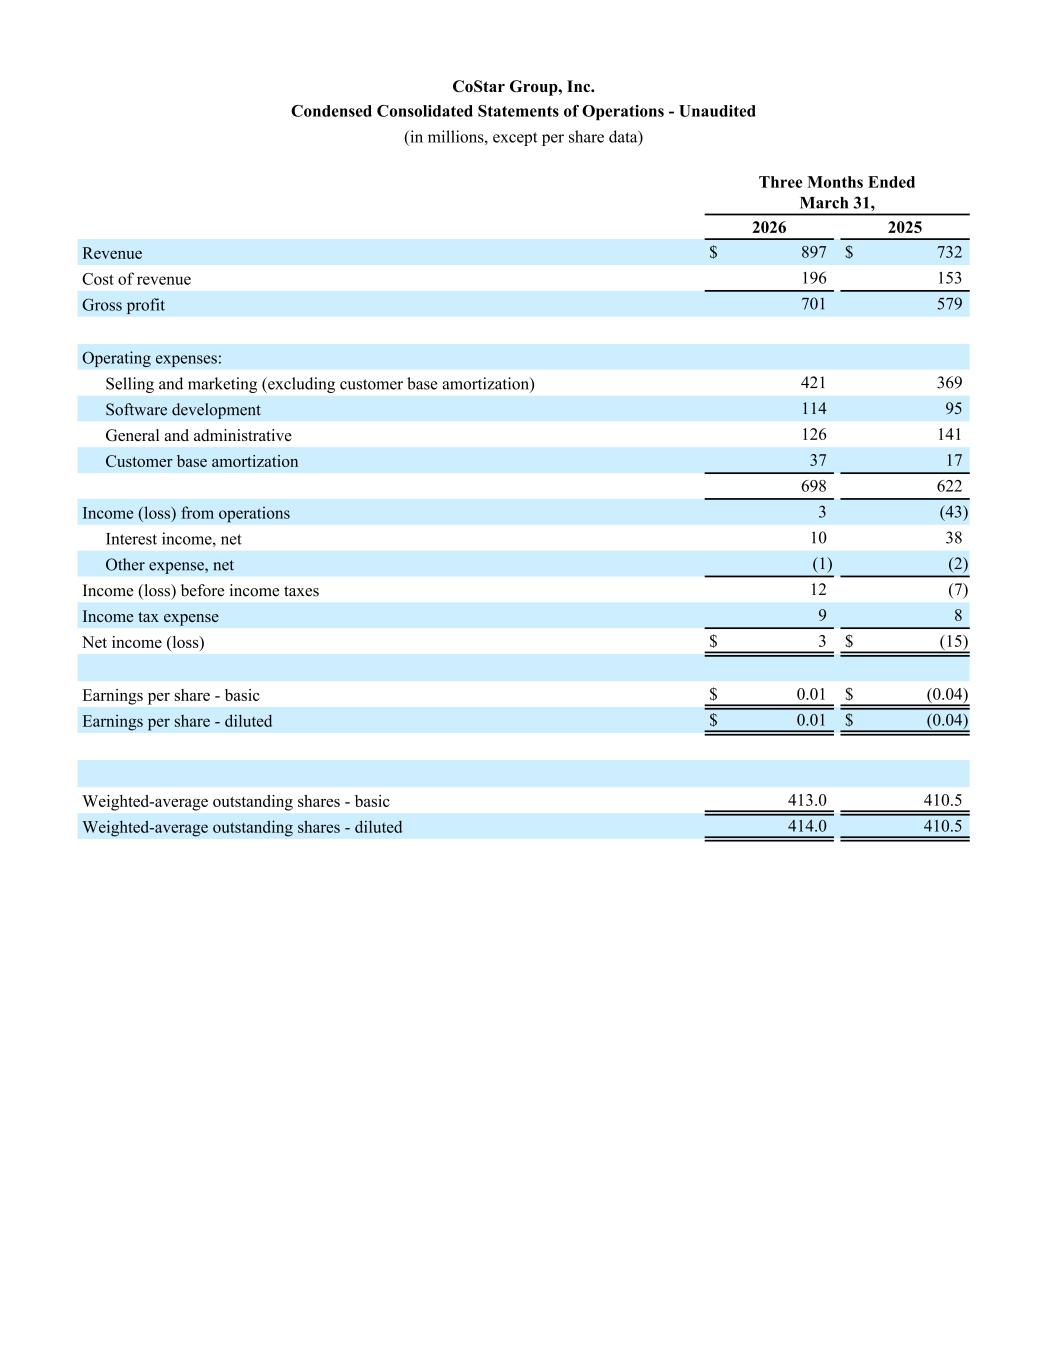
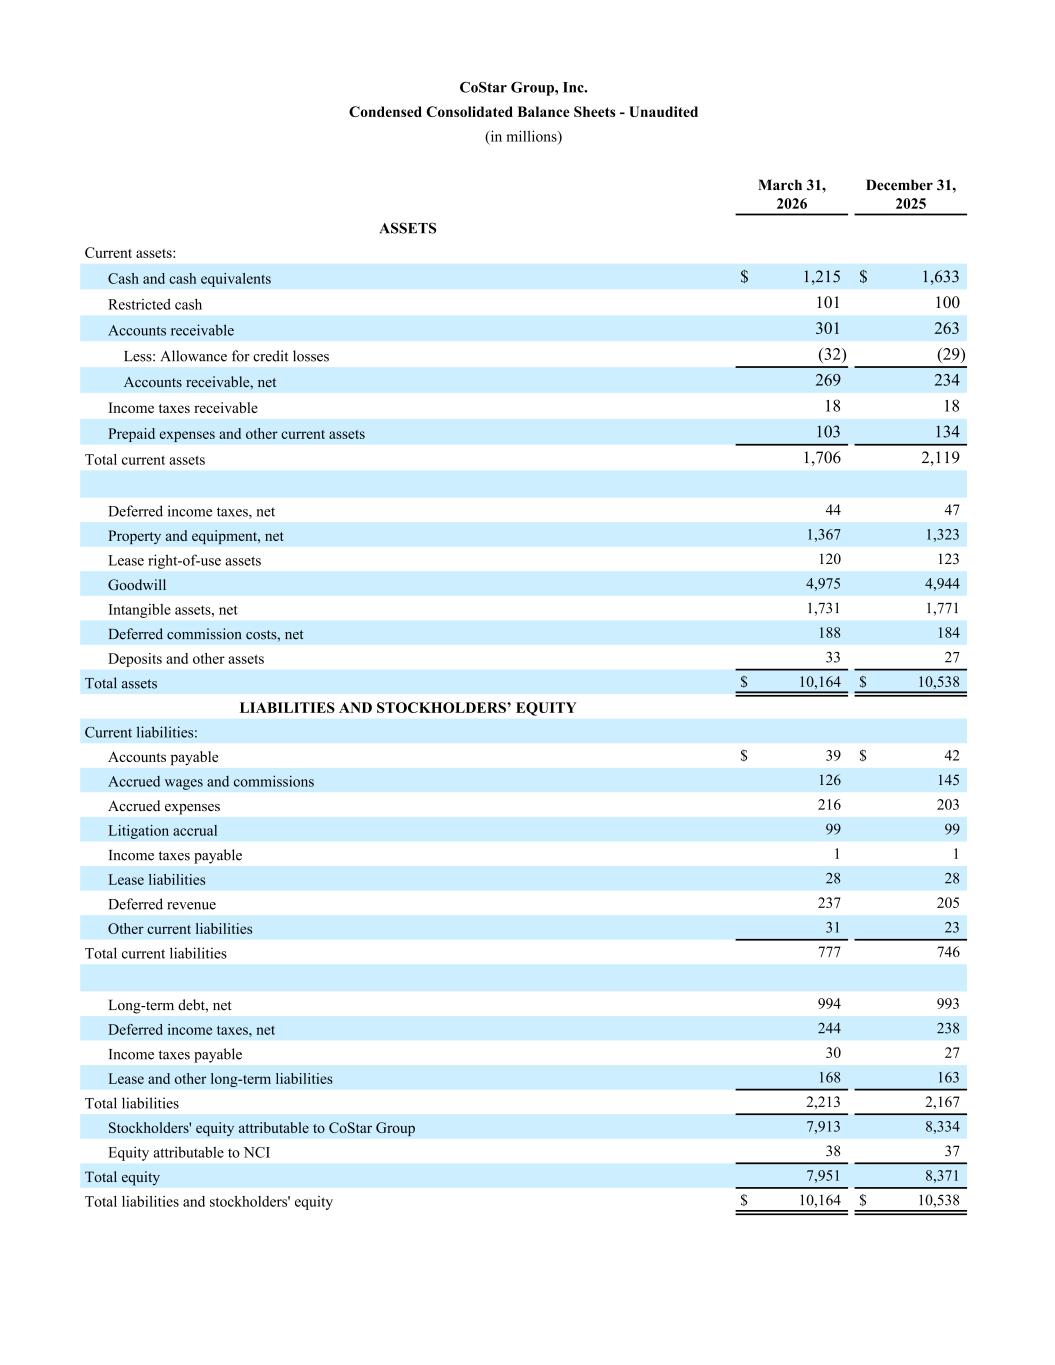
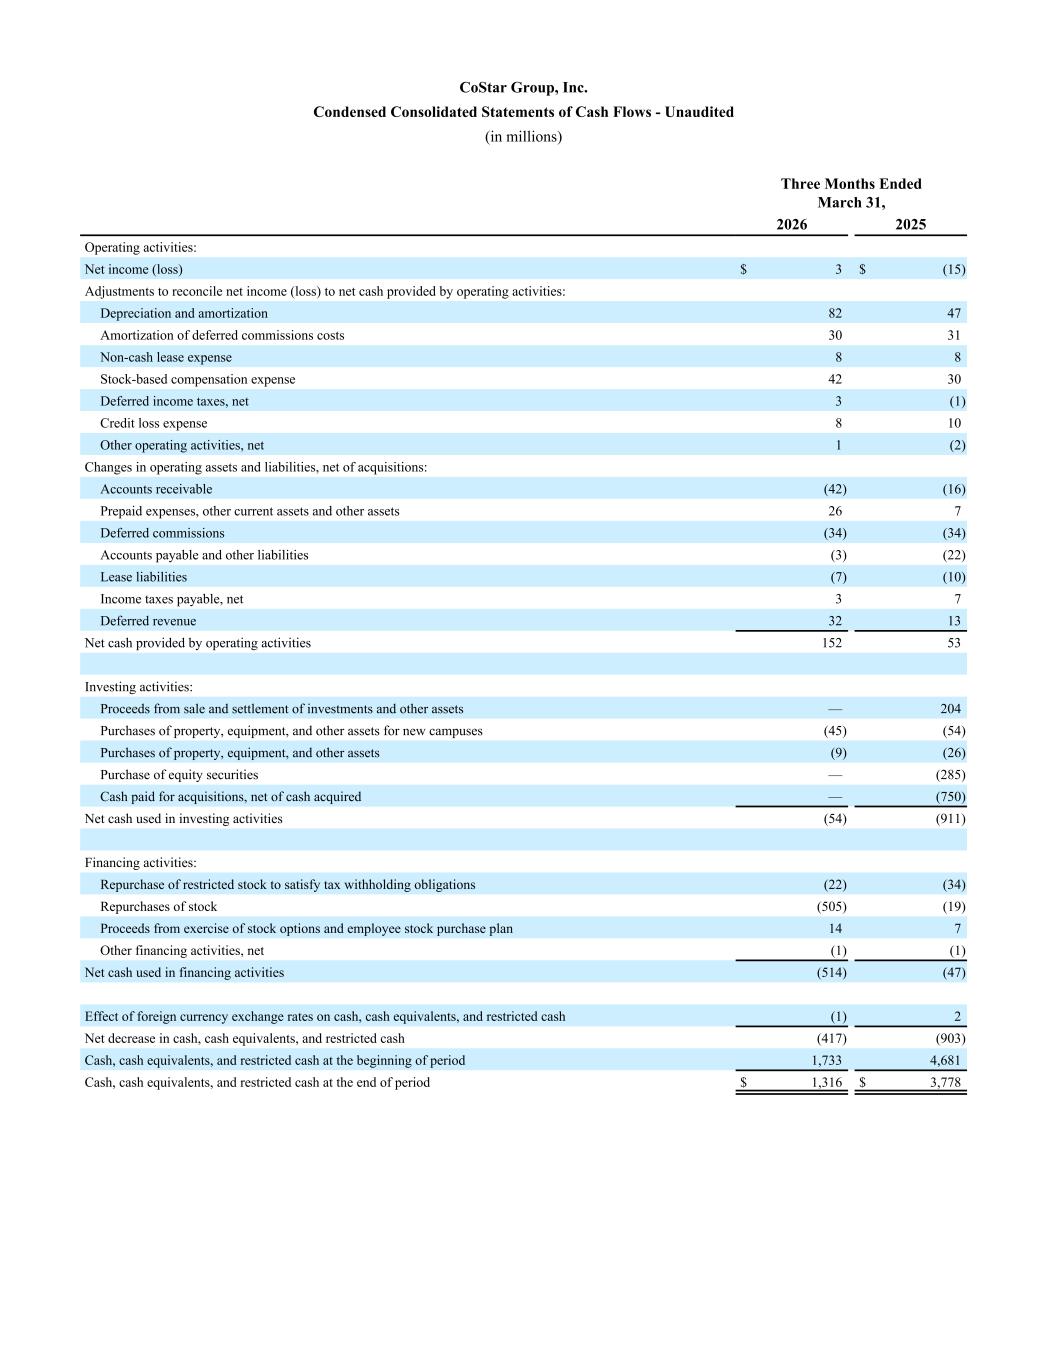
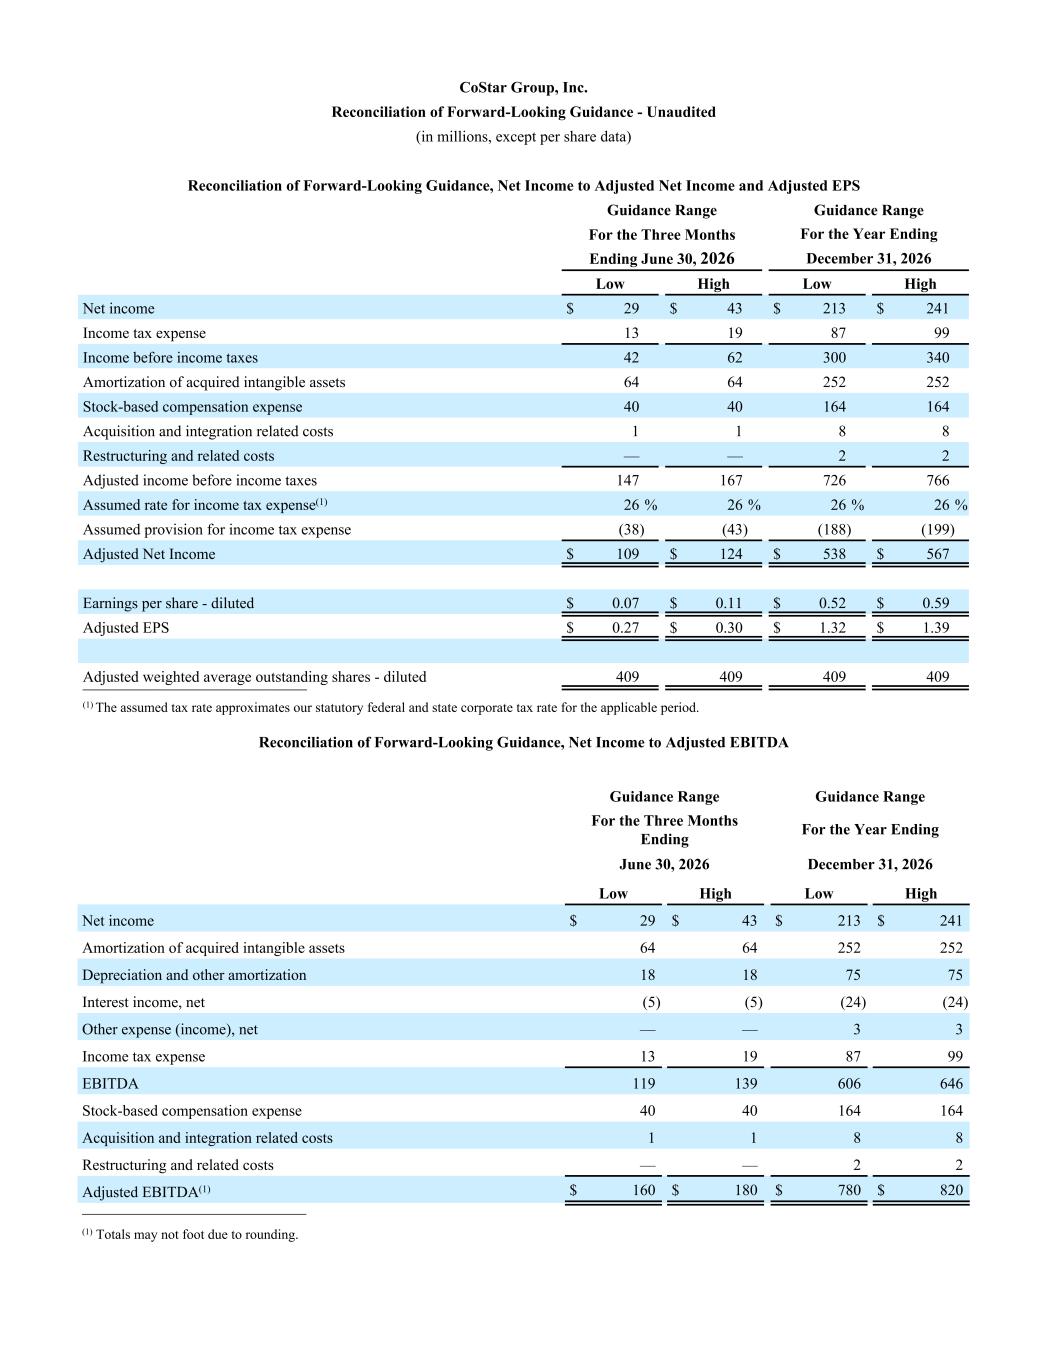
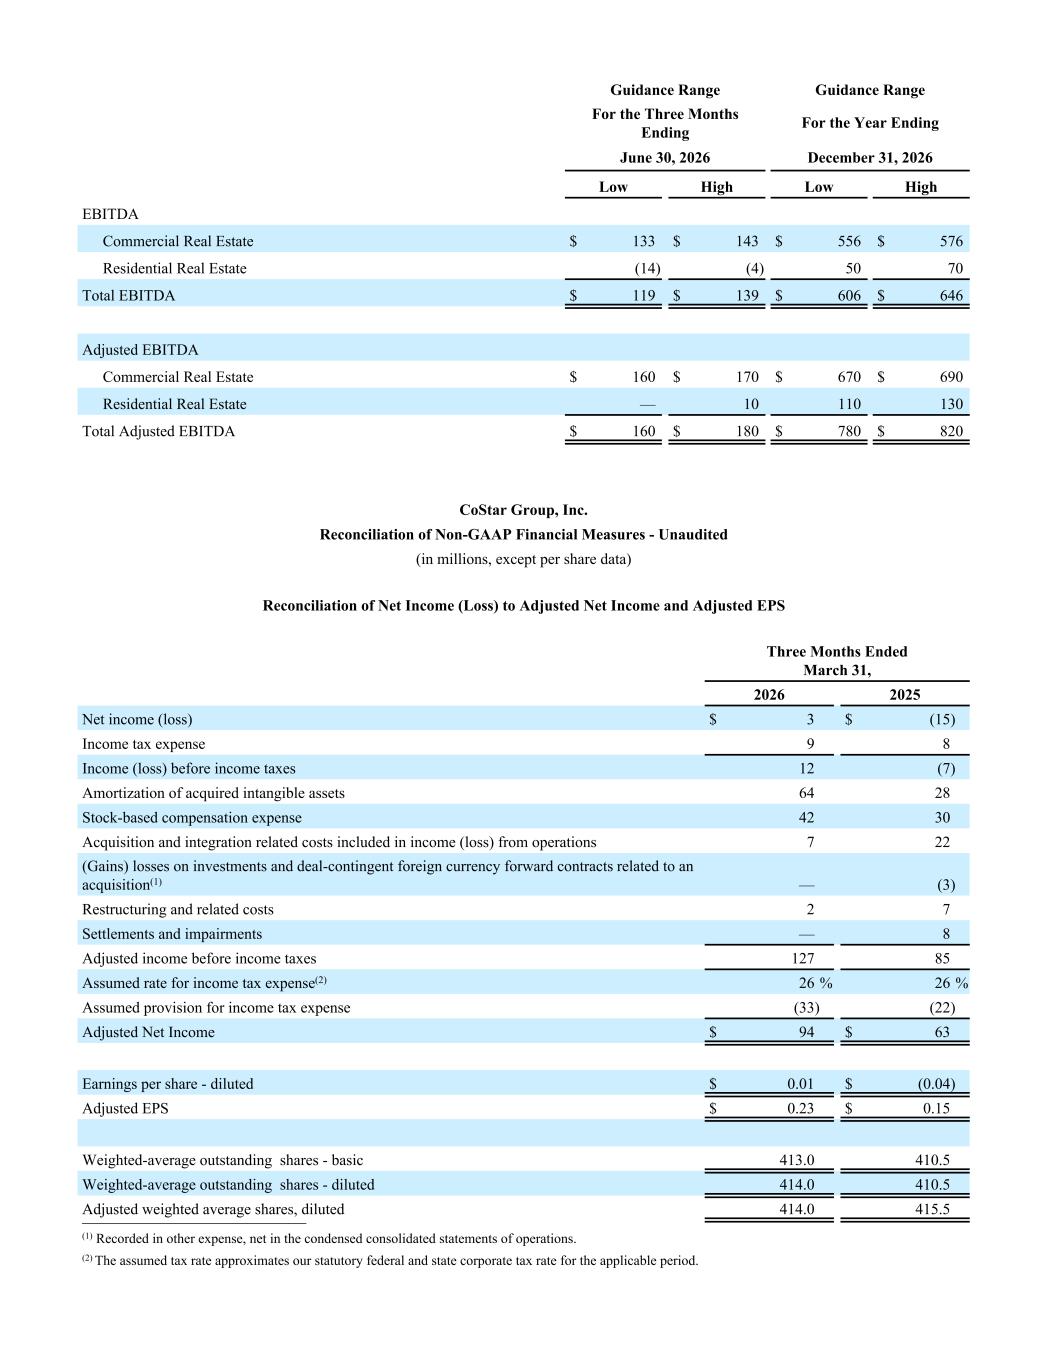
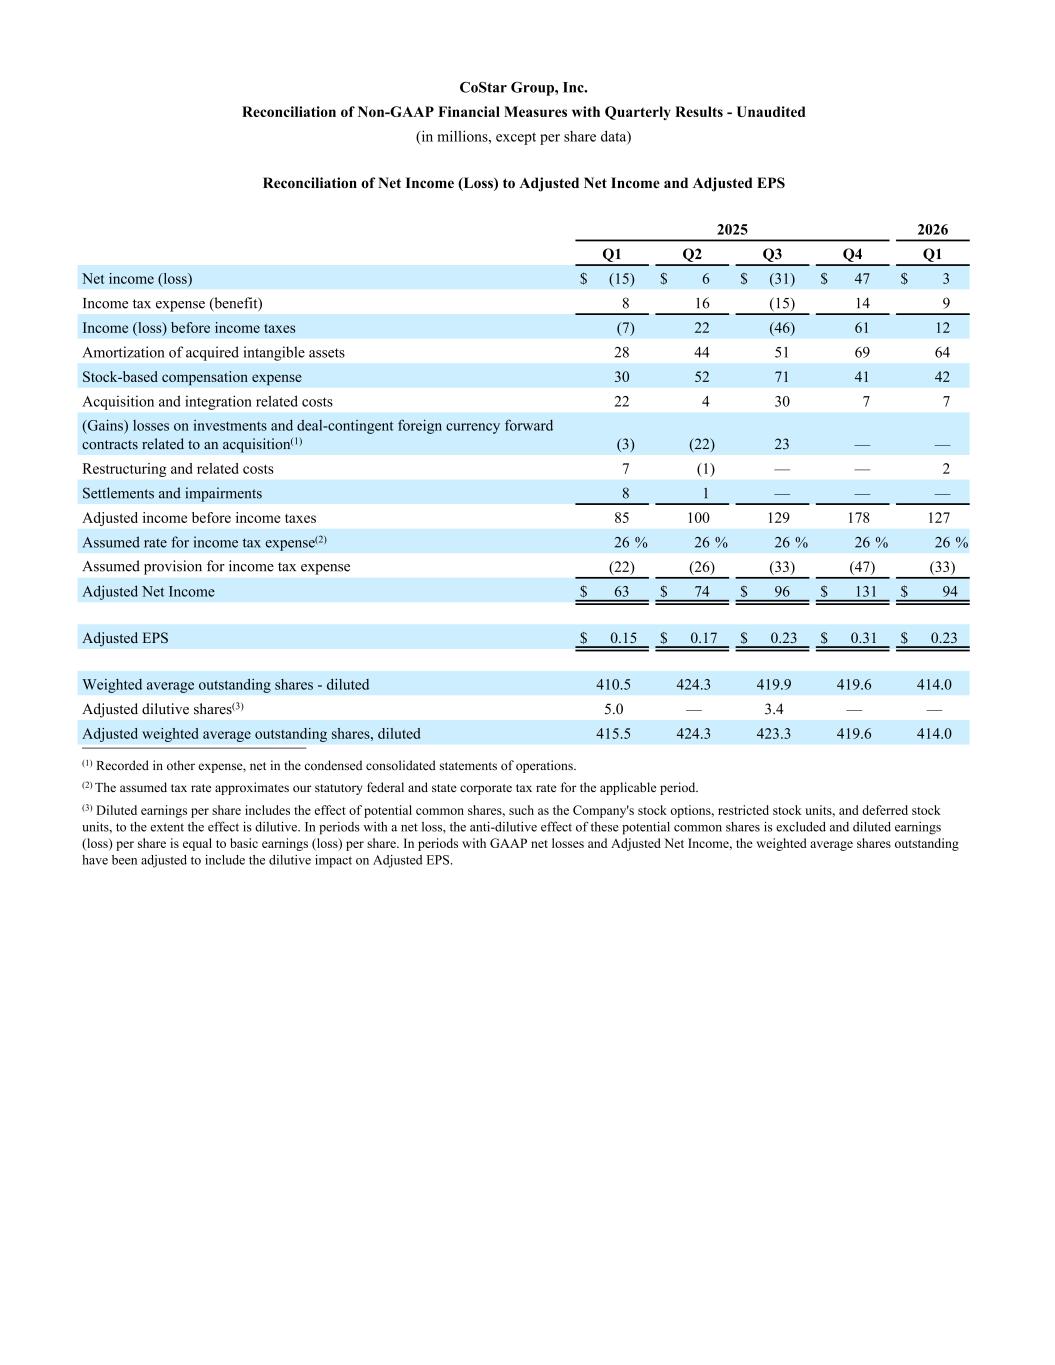
Thanks, Andy. In the first quarter of 2026, we delivered $132 million of adjusted EBITDA, doubling the adjusted EBITDA from the first quarter of 2025 and $17 million above the high end of our guidance range. The outperformance in adjusted EBITDA was primarily due to lower personnel costs from cost-saving efforts as we continue to find efficiencies from AI, personnel, and other expense initiatives. 1Q26 revenue was $897 million, which was 23% higher year-over-year and toward the high end of our guidance range. Organic revenue growth was 10% for the quarter. Commercial revenue in the first quarter was $472 million. dollars, an increase of 15% year-over-year and a 7% organic growth rate. Our commercial brands delivered revenue in line with the guidance we provided on our February earnings call. CoStar revenue grew 9% to $331 million, driven by strong double-digit international growth. The year-over-year increase was driven by both volume and price. Loop net revenue is $85 million in the first quarter, a 16% increase year-over-year, or an 11% organic growth rate. The year-over-year growth was attributable to an increase in paid listings from our continued focus on selling silver ads. Other commercial revenue was $56 million in the first quarter of 2026, up 81% compared to the first quarter of 2025. The year-over-year increase is primarily attributable to the inorganic contribution from Matterport, which has performed well since the acquisition, with subscription revenue growth of 19%. Residential revenue in 1Q2026 was $425 million, a 32% increase over last year's first quarter and at the high end of our guidance range. Organic growth for residential in the first quarter was 13%, with double-digit growth contributions from apartments, homes, and on the market. Increased volumes for the cattle for organic growth in the first quarter. Commercial adjusted EBITDA was $161 million in the first quarter of 2026, a 34% margin and above the high end of our guidance range. Similarly, residential adjusted EBITDA was also better than our guidance range, coming in at negative $29 million. CoStar posted positive net income and adjusted EPS of $0.23 per share for the first quarter of 2026, both considerably higher than our guidance. Our sales headcount at the end of March was 2,090. Homes.com reps make up our largest sales team, consisting of 570 individuals. Apartments.com is the next largest sales force with 520 reps, with CoStar at 475 reps and 225 at the LoopNed team. For Homes.com reps, we are focused on driving productivity and efficiency in 2026. With our other brands, we will be adding reps throughout the remainder of the year, given the significant opportunity that still exists across all our brands. And we expect productivity to ramp as our new sales reps mature over the coming years. Our contract renewal rate has held consistently at 89 percent for the past seven quarters. Customers who have been subscribers for at least five years have an impressive 95 percent renewal rate. Subscription revenue on annual contracts was 73 percent of total revenue for the first quarter of 2026 compared to 71 percent during the fourth quarter of 2025. As a reminder, Domain does not operate using annual subscriptions. net new bookings for the first quarter were $67 million, a 20% increase from the first quarter of 2025. In 2025, we completed our first share repurchase program, buying back $500 million worth of stock or 7.1 million shares. We subsequently announced a $1.5 billion buyback program in January of this year. Throughout the first quarter, we repurchased 11.4 million shares for $505 million, the majority of which was purchased through an accelerated share repurchase plan. We expect to repurchase an additional $195 million worth of shares during the remaining nine months of the year, bringing our total cash outlay for share buybacks in 2026 to $700 million. For the second quarter of 2026, we expect revenue to range from $922 million to $932 million. This range represents an 18% to 19% increase over the second quarter of 2025, or a 10% organic growth rate at the midpoint. Commercial revenue is expected to grow between 7% and 9%, to a range of $479 to $484 million. We expect residential revenue of $443 to $448 million, an increase of 32% to 34% year-over-year, or 12% to 14% organically. Adjusted EBITDA is expected to range between $160 and $180 million, representing a margin of 17% to 19%, or roughly 700 basis points higher than Q2 2025. Commercial adjusted EBITDA is expected to be between $160 and $170 million, a margin of 34% to 35%. Residential adjusted EBITDA is anticipated to be positive in Q2 2026, ranging between breakeven and $10 million. Our adjusted EPS guidance for Q2-2026 calls for a range of 27 to 30 cents per share on 409 million weighted average shares outstanding. For full year 2026, we are reaffirming our previous revenue guidance range of $3.78 to $3.82 billion, a 16 to 18 percent annual growth rate. Commercial revenue remains at a range of $1.955 to $1.975 billion, and the residential revenue range remains at $1.825 to $1.845 billion. Based on the strength of the first quarter and the expectation of continued personal expense efficiencies, we now expect adjusted EBITDA to range from $780 to $820 million. This is an increase of $30 million at its midpoint and a full percentage point increase in margin. Our adjusted EPS range is also increasing for the full year. The accelerated share purchase program in the first quarter retired more shares than we had forecast, and the previously mentioned expense reduction initiatives are primarily driving our guidance increase to adjusted EPS. Our new adjusted EPS guidance range is $1.32 to $1.39, an increase of $0.09 at the midpoint. I will now turn the call back over to the operator for questions.
Operator
Thank you. As a reminder, to ask a question, please press star one one on your telephone and wait for your name to be announced. To withdraw your question, please press star one one again. Please limit yourself to one question. And our first question comes from Ryan Tomasello with KBW. You may proceed.
Thanks, everyone. Two part question on bookings. First, was the $67 million of net new in line with generally what you were expecting for the quarter? And then second, there seems to be some variation in how we find investors are translating bookings into revenue growth expectations, given how bookings don't underpin 100% of the company's revenue base. So Chris was hoping you could walk us through how you think about the appropriate math there around the percentage of bookings-driven revenue and how that translates to the level of bookings needed to achieve your low-to-mid-teens revenue growth targets embedded in your financial framework. Yeah, thanks, Ryan.
So a couple of comments there. First, as you heard from our comments, we reaffirmed our guidance range for revenue and increased our EBITDA guidance. so broadly in line with what we're looking for from a net new perspective and from a revenue development perspective. And your second question is a detailed question, so let me sort of think about it. Let me try to break it down this way. Today, around 15 percent of our revenue is non-subscription. Then that increased as a result of the domain and Matterport acquisition last year. We are currently, if you look at our guidance, currently expecting revenue to grow around $550 million at the midpoint of our range, and around 40% of this increase is from acquisitions or non-subscription revenue growth. Therefore, the remaining growth is around $330-ish million, which is the revenue driven by NetNew. So that is what 26 represents it, but I think then you're rolling forward to sort of 27 and 28, and I think a couple building blocks there to think about. If you assume the non-subscription revenue growth is sort of in the low double digits, that results in subscription revenue needing to grow by around a billion dollars in total between 27 and 28. I think what's important to note is during that period we're expecting you know meaningful significant growth out of homes.com you know meaningfully faster than our other brands with our other subscription businesses also growing the low double digit range along with the other group which is consistent with our historic growth. Remember timing has a big impact here, obviously, when these bookings happened and how that rolls into revenue. So I think those are sort of the building blocks. I also think, most importantly, is we are committed to delivering on the adjusted EBITDA targets we set out for 2028 and 2030. And this can occur in a number ways. We can deliver it through our 15% revenue CAGR, which we're very committed to. We can overachieve our revenue targets and invest in additional growth opportunities, which would you know, continue to promote additional longer term growth. Or finally, we can rationalize costs if revenue growth is less than 15%. Importantly, as Andy mentioned on his call, we are fully committed to our stated homes.com net investment number. We're well on track to hit that number this year, and we gave you guidance through 2030, and we will hit those numbers. Our primary focus at CoStar today is to drive revenue, to drive EBITDA growth, and margin expansion through 2030 and beyond. But I think that, Ryan, gives you the building blocks to start thinking about your question. Thanks, Chris.
Appreciate the detailed color.
Operator
Thank you. Our next question comes from Pete Christensen with Citi. You may proceed.
Good evening. Thanks for the question. Really good script this quarter, guys. Lots to like, and appreciate the transparency on a number of fronts. That said, I want to dig into bookings again a little bit here, and particularly apartments pricing. You showed some really good rooftop growth last quarter, and we know that you've been winning back some share there, and some of that share has been lower-priced opportunities. But we're also thinking about the competitive dynamic, how that's changed, and maybe that's shifted the mix shift on tiering of ads there. Just wondering if you could give us a sense of what has been generally the pricing impact and maybe how that might be impacting overall bookings production. Thank you.
I would comment on one thing that I think I'd comment on last quarter. I would comment on one point that I think I'd comment on last quarter. um there we picked up a lot of rooftops from um rent.com so as they as that whole thing uh went the way it went there was an opportunity to do that that became a primary focus for our sales force to go after those rooftops when they were in transition and so they put a lot of effort into that that's a once you know in a decade opportunity to try to do a share shift um and the nice thing is we weren't buying those from anyone. We were just winning them in the organic market. Um, now those, those advertisers, uh, had been with apartment guide rent.com through a bankruptcy and through, uh, a degration of a business over several different years, several years. So I tend to lean towards lower ARPU, uh, rooftops, um, you know, often lower rental rates, smaller unit counts, that kind of stuff. That has driven for several quarters our rooftop revenue, our poo, whatever, down somewhat. I'm not seeing, unless Chris has got a different view on it, I'm not seeing a major shift in levels or depth advertising. The thing that really struck me was these folks coming out of rent.com or lower-end customers, very important customers. They just happen to have more budget properties.
Operator
Thank you. Our next question comes from George Thun with Goldman Sachs. You may proceed.
Hi, thanks. Good afternoon. Speaking with apartments.com, the revenue growth moderated sequentially to 10% year over year. What would need to change to drive a reacceleration from here? Or do you think this is the right long-term run rate growth for the platform?
I think the thing that re-accelerates revenue growth is our target continued growth in the sales force. We have, as the revenue gets bigger and bigger, you need to have more salespeople to deal with the revenue opportunity. There's clearly plenty of open opportunity out there. We are still relatively early in penetrating the opportunity. I think homes.com presents an important strategic opportunity that it can grow more traffic. It's already our biggest syndication partner into apartments.com. It allows us to strengthen our single family presence there and draw renters in from multiple angles and multiple perspectives. So, you know, I think that I think we can continue to improve on the current growth rate and I think we still remain significantly competitively advantaged you want to anything to that Chris oh it's great very helpful thank you mm-hmm thank you our next question comes from Alexi Gokula with JP Morgan you may proceed hi everyone hello Alexi hi great to hear from you both you and Chris mentioned the sales productivity ramp.
So with the headcount additions across the sales organization, what are you seeing in terms of ramp times or quota attainment, maybe some productivity by cohort, and how does that inform your hiring pace for the rest of the year?
It would vary by brand. So I think we're seeing CoStar accelerating productivity per rep. And I thought it was interesting to see that the broker sales, tenant sales are up in CoStar. That's generally an indication of improving commercial real estate market conditions and more robust selling opportunities. On apartments.com, as your revenues have grown and you need to keep growing the sales force to match, They're handling even a 99% monthly renewal rate. They're handling a larger absolute cancellation level, so you need to keep growing that sales force and it actually grows productivity as you grow the sales force. On LoopNet, we definitely want to continue to grow that sales force. The asset-based pricing will increase productivity for sure, But you have a relatively large base of revenue compared to the size of the sales force. And then, and again, ROI across all those sales forces is very solid. I would say with homes.com, you are still dealing with a very rookie sales force. I mean, it's unprecedented to have that many salespeople with that little tenure, given the fact that we really just launched that group a year or so ago. So I am spending myself a bit of time, more time now that I've got a little more free time on my hands with our Salesforce and feel like we're making some good headwind in improving Salesforce productivity, headway improving Salesforce productivity. It feels good to be back in there working on Salesforce productivity, and I see a lot of opportunity to improve Salesforce productivity. With a group like the Homes.com group, we are going to be continuing to grow our Salesforce in the field because we're seeing higher productivity in the field salespeople than we do in the centralized Salesforce. We're also seeing high sales productivity with our new homes advertising salespeople at homes.com. And then, but I am also optimistic that we're going to see productivity improvements with our inside sales team with homes.com. So the growth in that group is really field and new home sales where the numbers are pretty good. And then I am working on bringing up the core inside group, and I think we're having some success there.
Andy, the only thing I'd add is that it's important to realize that we really started on this journey to increase our sales force roughly about this time last year. And so there's been pretty significant increases in sales force across all of our brands, and they all came in at different times. For instance, LoopNet recently added a lot of salespeople to get to the number I talked about. And so we do an incredible job tracking the cohorts. We look at their evolution. We track them on a six-month, 12-month, 18-month cohort basis. So we see the development that we want to see. But it is important to note that really we started on this journey basically about a year ago and accelerated through last year. And we feel good about that productivity and cohort development. But this does take time to get them up to full productivity.
I believe the number for apartments.com is at year five. They're twice as productive as they were at the end of year one. So that is something where it is like a multi-year scale-up. And some people enter at a really high level. Some people scale up through a couple of years.
Thank you very much, Andy. Thank you, Chris.
Operator
Thank you. Our next question goes from Stephen Sheldon with William Blair. You may proceed.
Hey, thanks for taking my question. Just wanted to follow up on the sales kind of capacity and productivity topic. You know, I guess high level, what has changed, if anything, in terms of where you'll deploy incremental sales resources over the rest of the year and into next? You know, are there certain areas of strength where either by segment or geography where you're maybe pushing the pedal more? Are there any areas where productivity maybe isn't progressing the way you'd expect, where it could make sense to cut back or potentially shift into other areas. So I guess from here, what's changed in terms of your plans for incremental sales capacity investments?
Sure, and I hope I give you a good brain dump of all the things we're thinking about there. Again, I'm seeing – and I'll run through a couple different parts there. I am seeing really good results with our new home salespeople, The folks are going out and dealing with major home builders and giving them enhanced exposure on homes.com. Those folks are very productive. We will grow that at a measured pace because you don't want to slam too many people into a segment at once. we are seeing uh we are going to invest in in adding uh 50 more folks or so into our field sales for homes.com because those field sales folks who can actually have one-on-one meetings show up at open houses show up at brokers offices are are are more productive than the people in the inside sales org. We are going to do that in batches of five cities at a time. So we might hire up eight people in Washington, Dallas, three other markets, stabilize it, have an RD in each market, do the next round. We would likely prioritize our marketing spend SEM investment around those markets. We're building that field sales team up. We've always felt that the field sales team through time would be the most productive for homes.com. And then, uh, I'm actually enjoying working a little bit more with the inside sales team, making sure that they've got the right value propositions and proving their pitch. And, and we, uh, we believe that we've got the right number, but we want to, uh, tighten the pitch, the, uh, uh, the service and the pricing, frankly. I think the product is currently underpriced. When I look at the kind of benefit these folks are getting when they get the marketing benefit of homes.com, we're not charging enough, and we need to be bolder about that pricing because we're delivering enormous value. On the apartments.com group, I would like to see our field sales team continue to grow at a measurable pace. The field sales team with apartments.com is consistently the most productive. And then with loopnet.com, I'd like to see that field sales team keep growing at an incremental measured pace because, again, their headcount is too close. It is not quite adequate as a ratio relative to their growing revenue base. And I think with Ben focusing on the asset-based pricing effectively now, I think that there's a lot of opportunity there. We are growing the Matterport sales team. Again, we're doing that in measured batches of probably 20 at a quarter or something like that. So we're holding our productivity up. But it is nice to be back in the game and spending more time on sales than on other things.
Yeah, and the Matterport comment was a great one because it's such a huge opportunity given the limited sales force we had when we acquired the company. So we've really put in place go-to-market, TAM strategies, et cetera, and we're expecting great things out of Matterport's sales force over the coming years.
Operator
Thank you. Our next question comes from Jeff Mueller with, Baird, you may proceed.
Yeah, thanks. Can you just help put the sequential trends in net bookings the last few quarters in context? This is the third straight quarter of sequential decline in the net bookings number. And if you started picking up the pace of hiring a year ago, I would think that productivity would be building over the last year. And I get it, Q2 25 is a good quarter, but this quarter is still quite a bit below what it was in like Q1 of 23 before you launched homes and when you had a much smaller sales So I know you're getting a million questions on sales productivity. I think we're struggling to understand it.
Yeah, I'm not sure the angle. I understand, obviously, we started putting out the quarterly total bookings. We thought that was important for people just to see the trends. Obviously, there's variability. As you said, last year we had a very interesting situation right in the first quarter. It was deemed weak. The second quarter was great. So, you know, there's some variability, but I think we feel really good about the opportunity set, the underlying productivity we're seeing out of the sales force and should really start to the flywheel should really start in the second half of next year. And so I think we feel really good about the productivity. I think the hiring was a meaningful amount across our branch, and that creates a little bit of lag effect. But I think we feel good about the direction.
And I think we have the same conversation every first quarter. It's like Groundhog Day. So our first quarter tends to be a little lighter. Our second quarter always tends to be our stronger. So when you talk about three quarters down, well, second quarter is our strongest. just remember, as I mentioned, the Apartmentalize. That's a huge bookings opportunity for the residential segment. And we enter that this year with incredibly strong product, with Apartments AI, Homes being a major contributor. Our product teams have been pushing aggressively to make sure that we have a bunch of new rental features in homes.com. and we'll enter that in a strong place. But you're still dealing with, again, you don't have very many folks with more than a year of experience at homes.com, so it's still a relatively junior sales force. It won't be a junior sales force in two, three quarters. It will start to move into post-rookie status.
Operator
Okay, thank you. Thank you. Our next question comes from Curtis Nagel with Bank of America. You may proceed.
Okay, great. Thanks very much. Yes, so just in the press release, you decided some pretty strong numbers in terms of engagement. Member agents coming on from homes.com right now, kind of near term, how is this translating into revenue momentum within the segment? Could you comment on that?
Sure. Sure. So I would say the most important thing when you look at translating into revenue momentum is now that we have about a year or so with this, and I guess we had 10,000 users in the Q1, Q2 of 25. Now we're up to $35,000. We have a lot more information on how the product is impacting their earnings, and the results are phenomenal. So that gives me comfort that we can actually begin to bring the ARPU up pretty materially and that we'll have growing productivity with that group, and you've got good synergies with Apartments.com and their productivity. So all of that is why we have the confidence that we are building revenue momentum.
Okay. Not to belabor a point, but it's obviously top of mind. Would you be willing to provide bookings guidance for 2Q just at a minimum, you know, so we don't continue to see such a mismatch between internal expectations and investor expectations?
So bookings is a number we've never guided to. There's only, I think, two or three of you actually put out a bookings number. I think if you look at it back historically, you see variability in quarters. Last year, Q1 2025 was 18% of bookings for the full year. So, you know, you look at these in different elements, but we provided booking numbers for homes.com because we wanted to increase transparency. We wanted people to understand the investment, what's going on. But, you know, getting into guidance around bookings is not something we're going to do.
And again, remember, bookings are up 20% quarter over quarter, year over year, year over year.
Operator
Thank you. Our next question goes on Surrender Thin with Jeffries. You may proceed.
Thank you. Andy, can you maybe just talk about the decision or the pricing strategy in homes.com at this point and the idea of raising pricing for new members on May 1st, just why not maybe wait a year? Obviously, the metrics are very supportive of that pricing action, but just maybe to build the user base further or help us understand the timing there.
Well, I think we can do both. I And capture more of the value. So particularly in the folks who are earning under $250,000 a year, in agents earning under $250,000 a year, there are many, many of those agents. I'm looking at the close rates for the folks who are well-trained, who have the upper half of Homes.com salespeople, and the close rates are extremely high. It feels like they're north of 50%. And once you get to that high a close rate, you start to feel that you need to bring the price up. I think that there is room to recognize more value and at the same time continue to keep the same growth and possibly accelerate the growth in the number of members. Um, there are a couple of places, uh, in, in looking at the different cohorts of agents and profile of agents, there are a couple of areas limited that will probably bring the pricing down a touch, but in the biggest, uh, bulk of, uh, cohorts of agents, um, you know, we're leaving too much on the table. Uh, we're providing a lot of value and I think we can, um, uh, push price and keep head count growing and keep a member count growing. And, you know, we'll play with it in each of the cohorts to optimize it, but I feel pretty good about that right now. Thank you.
Operator
Thank you. Our next question comes from Brett Huck with Stevens. You may proceed.
Thanks for taking the question, and good evening, guys. Thanks for the ROI stats on homes.com. That's super helpful and something we've been focused on. My question is on Matterport. we've been feeling that that's a really big underlying structural kind of piece of the business that's underappreciated can you talk a little bit about you gave us some great stats on lingering on the site and things like that can you and so it's clearly just a great enhancer to all of the you know the products that you have but can you talk balancing that and how you price it and distribute it just to improve the product generally and then also talk a little bit about Matterport as a function or a module of data that's going to help you differentiate and remain sort of on the edge of proprietary data? Because I kind of heard both of those themes, and I'm wondering if there's a pricing, given trying to maybe do both of those, how do you think about pricing and distribution of that? Thank you.
Okay, so in pricing and distribution, I mean, there are a lot of elements there. Um, so, um, in pricing, uh, first of all, if I go from the last question backwards, uh, uh, part of my thinking around, uh, bringing the price up a bit in the homes.com is a core value proposition. There is the matter ports and the exterior three D's we build, and then the floor plans we build that delivers a lot of value. Uh, I believe there's, And you heard the conversion stats when people have a Matterport, they're getting 30x the views, they're getting 54, apartments are getting 54 times the tours. So there's a part of the Matterport pricing that's actually embedded in a monthly subscription fee or a monthly advertising fee for either apartments or for land or for LoopNet or for homes.com. So you can recognize a little bit of pricing value there with Matterport. With Domain, it's a little bit different. There we are using Matterport to get people to upgrade to higher depth level advertising. And so you're getting price appreciation, but you're actually giving them value. So effectively, you're selling a Matterport when you do that. And there's a lot of that going on, and we're getting a very favorable response to that in Australia. A big change with Matterport is when we acquired Matterport, they were very focused on a mass subscription of low-end accounts using the iPhone as the capture device. We actually feel that the professional user of Matterport, the real estate agent, the leasing company, the architectural engineering construction company is the biggest part of the market and they want speed of capture, quality of capture. So we are refocusing folks towards a more aggressive price point on the Matterport Pro 3 camera and then a higher SaaS subscription price for regular users. So we're pulling the hardware down and focusing more on the SaaS subscription side and sort of a razor and razor blade strategy. We are working aggressively on the Matterport Pro 4 camera. I know there's an engineering team meeting right now in Mountain View on reviewing the final specs on that. So there it's, you know, you're going to have more SaaS revenue, slightly higher price points, lower hardware revenue. And then the pricing is reflected across the board in the subscription rates or advertising rates with lube net apartments, homes, and land. In terms of competitive differentiation, very excited about that. I mean, I described the x-ray function. It doesn't do it justice. The ability to do what our team is, our brilliant team is doing, which is produce these Gaussian splats that make an exterior model that allows you to see the neighborhood fly around the house. And then as you approach the house, the walls disappear and you move into the house. Or as you approach that, as you fly a synthetic drone, a virtual drone towards the house, the ability to take off the roof and look into the second floor, pull it up and look into the first floor. The ability to do the side-by-side comparisons in AEC. We have a very robust product roadmap right now that will continue to differentiate us. And we don't feel that there's anyone really keeping up with our innovation pace or development pace. And the earnings call sounded a little bit like a Matterport earnings call because it sort of came up in every other thing I said. But to the credit of the development team and the leadership team at Matterport, they're leaning into facilitating success in all of our products with that differentiating technology. It's good stuff. Great. I appreciate it.
Operator
Thank you. I would now like to turn the call back over to Andy Florence for any closing remarks.
Well, I'd like to thank everyone for joining us on this first quarter earnings call, and I look forward to reporting our progress in the second quarter earnings call. Thank you very much for joining us.
Operator
Thank you. This concludes the conference. Thank you for your participation. You may now disconnect.